cornerstone hydro electric concepts (chec) hydro electric concepts (chec) combined conservation and...
TRANSCRIPT


Cornerstone Hydro Electric Concepts (CHEC)
Combined Conservation and Demand Management Annual Report 2014
EB-2010-0215
Collaboration for Conservation
September 30, 2015
Cornerstone Hydro Electric Concepts Association Inc.
Page | 1
Executive Summary: This report represents the 2014 annual reporting as required by the CDM Code for 13 of the 15 CHEC Association LDCs. The results and comments provided in this overview section are based on the combined experience of the CHEC LDCs.
The report format contains an overview section relating the combined experience of CHEC LDCs and thirteen addendums containing the individual LDC Annual CDM Reports. The overview section provides a summary of the overall target achieved, conditions impacting strategy progress and tracking of the CDM Strategy.
In the fourth year of the program the residential portfolio performed better than in previous years on an incremental level. The residential program experienced improved kW performance over the previous year. Three programs contributed to the demand which included: Coupons, HVAC and the peaksaverPLUS® Initiative which showed a marked improvement. Energy contribution to target on an incremental basis was much improved in the final year. The coupon initiative experienced significant growth contributing approximately a third of the total energy savings from coupons in 2014. The HVAC initiative continued to show good performance remaining fairly consistent across the framework period. The Low Income Initiative performed below expectations. The ability to engage eligible customers has been difficult in this program.
The Demand Response (DR) Initiative contribution to the targets was finalized in the last year of the framework. A number of LDCs had customers enrol in DR but then exit prior to the end of the framework. Any future DR initiative, if offered, will require designs which maintain the customer’s interest and provides customer benefit over the longer term.
The Commercial and Institutional program continues to be a significant contributor to targets achieved. This portfolio accounts for 43% of the kWh achieved to the end of 2014. The retrofit initiative along with the Direct Installed Lighting Initiative continues to provide savings and continues to be of interest to the customers. The Direct Installed Lighting Initiative, which is focused primarily on lighting, is approaching market saturation and will need some renewal to maintain traction in the sector. The Retrofit Initiative continues to experience good participation and is well established in the conservation industry. It is anticipated that the Retrofit Initiative will continue to achieve energy and demand savings if offered in the future.

Cornerstone Hydro Electric Concepts Association Inc.
Page | 2
CHEC maintained the Roving Energy Manager (REM) position throughout 2014. The position has demonstrated value with successful approaches to industry and commercial customers. The REM continues to be instrumental in supporting CHEC LDCs and their commercial customers to identify potential savings and to implement projects. The REM’s ability to work with customers has a direct impact on retrofit and monitoring projects. A number of audit projects have been initiated which are anticipated to provide savings in future frameworks.
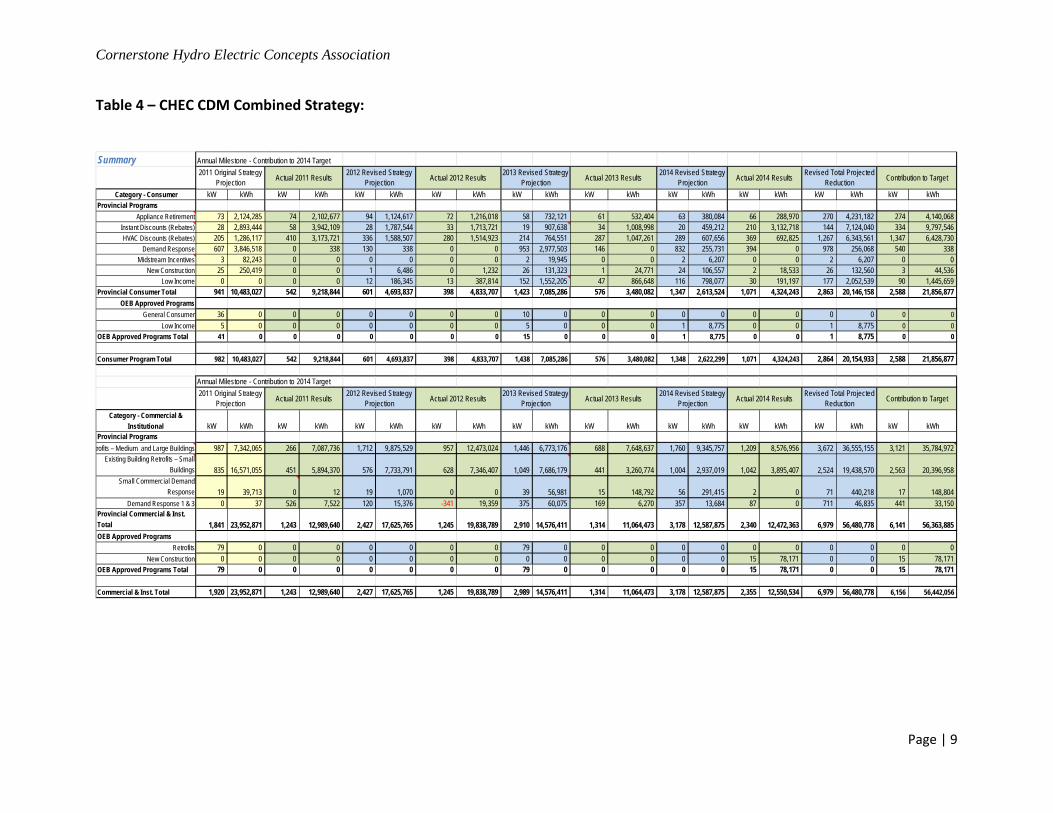
The combined strategy results (Table 4) indicate that the demand reduction is below the 2014 Revised Projection by a couple of percent. The combined achieved demand at 61.1% of target is slightly below the provincial achieved demand reduction of 69.8%. The combined energy reduction is ahead of the 2014 Revised Projection by approximately 20% for a total of 110.7% of target which compares with the provincial achieved energy reduction of 109.2%.

Cornerstone Hydro Electric Concepts Association Inc.
Page | 3
1.0 Introduction:
Cornerstone Hydro Electric Concepts Association (CHEC) is an association of fifteen (15) Local Distribution Companies (LDCs) (in 2014). The CHEC member LDCs have prepared this Conservation and Demand Management (CDM) Annual Report 2014 as required by the Conservation and Demand Management Code for Electricity Distributors. The report is a collaborative initiative of 13 of the CHEC member LDCs. The report is consistent with the combined CDM Strategy filed in November 2010 and includes Orillia Power as of 2012 reporting. 1.1 Distributors Included in CHEC Association CDM Strategy: CHEC LDCs work collaboratively to meet regulatory and operational requirements. The Association facilitates LDCs’ abilities to address initiatives in a cost effective manner, sharing information, expertise and resources. The development of a collaborative CDM Strategy and the subsequent CDM Annual Report is consistent with the CHEC philosophy of working together to meet the needs of the member LDCs and to work effectively for the customers served. The LDCs, all members of CHEC, covered under this CDM Annual Report include:
• Centre Wellington Hydro Ltd. • COLLUS PowerStream (COLLUS Power) • InnPower Corporation (Innisfil Hydro Distribution Systems Limited) • Lakefront Utilities Inc. • Lakeland Power Distribution Ltd. • Midland Power Utility Corporation • Orangeville Hydro Limited • Orillia Power Distribution Corporation • Parry Sound Corporation (Now merged with Lakeland Power) • Rideau St. Lawrence Distribution Inc. • Wasaga Distribution Inc. • Wellington North Power Inc. • West Coast Huron Energy Inc. (Goderich Hydro).
CHEC LDCs have worked collaboratively and as part of the Association since 2000. The CHEC Combined Annual CDM Report includes an overview section and separate addendums for each LDC. The LDC addendum format follows the provincial template.

Cornerstone Hydro Electric Concepts Association
Page | 4
2.0 CDM Targets for Electricity Demand (MW) and Electricity Consumption (GWh): The CDM target for each LDC has been established by the Ontario Energy Board (OEB) utilizing a methodology developed by the Ontario Power Authority (OPA). The targets were later revised and incorporated into the LDC license requirements. Table 1 illustrates the final targets for each LDC. Table 1 – OEB Defined Targets
MW GWH
LDC Revised Target Revised Target Centre Wellington Hydro 1.64 7.81 COLLUS Power 3.14 14.97 Innisfil Hydro 2.5 9.2 Lakefront Utilities 2.77 13.59 Lakeland Power 2.32 10.18 Midland Power 2.39 10.82 Orangeville Hydro 2.78 11.82 Orillia Power 3.07 15.05 Parry Sound Power 0.74 4.16 Rideau St. Lawrence 1.22 5.1 Wasaga Distribution 1.34 4.01 Wellington North Power 0.93 4.52 West Coast Huron Energy 0.88 8.28 Total 25.72 119.51
Cornerstone Hydro Electric Concepts Association
Page | 5
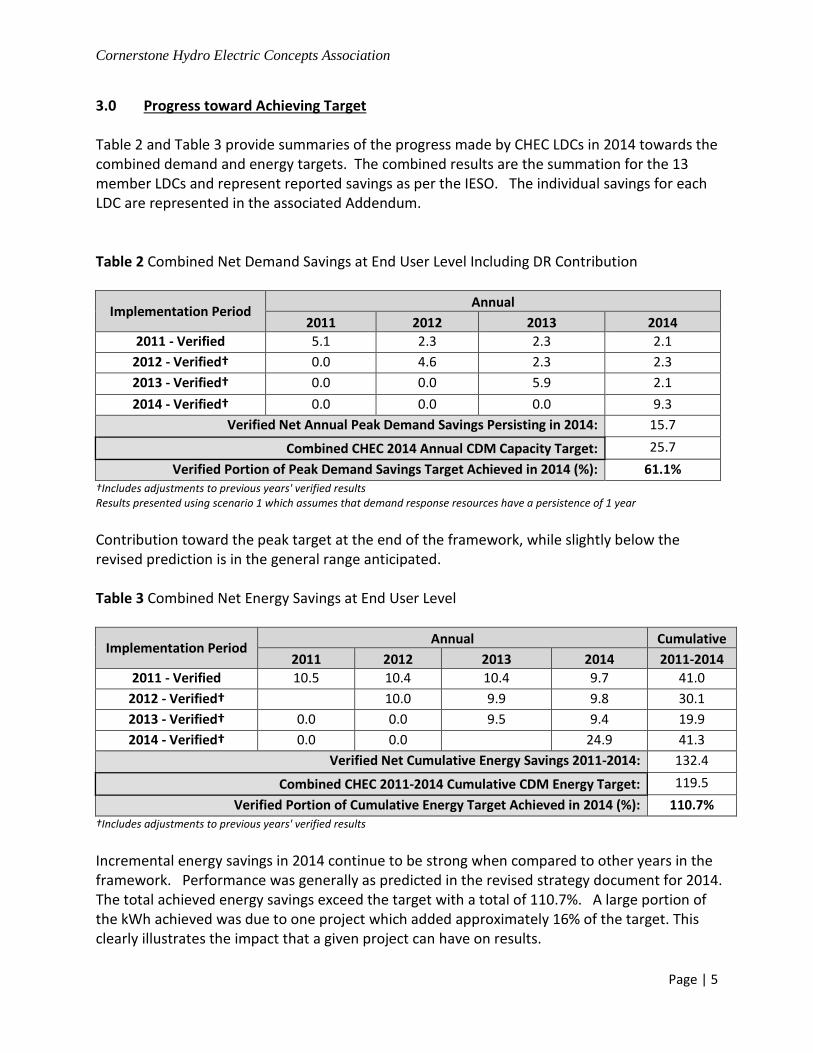
3.0 Progress toward Achieving Target Table 2 and Table 3 provide summaries of the progress made by CHEC LDCs in 2014 towards the combined demand and energy targets. The combined results are the summation for the 13 member LDCs and represent reported savings as per the IESO. The individual savings for each LDC are represented in the associated Addendum. Table 2 Combined Net Demand Savings at End User Level Including DR Contribution
Implementation Period Annual 2011 2012 2013 2014
2011 - Verified 5.1 2.3 2.3 2.1 2012 - Verified† 0.0 4.6 2.3 2.3 2013 - Verified† 0.0 0.0 5.9 2.1 2014 - Verified† 0.0 0.0 0.0 9.3
Verified Net Annual Peak Demand Savings Persisting in 2014: 15.7
Combined CHEC 2014 Annual CDM Capacity Target: 25.7 Verified Portion of Peak Demand Savings Target Achieved in 2014 (%): 61.1%
†Includes adjustments to previous years' verified results Results presented using scenario 1 which assumes that demand response resources have a persistence of 1 year Contribution toward the peak target at the end of the framework, while slightly below the revised prediction is in the general range anticipated. Table 3 Combined Net Energy Savings at End User Level
Implementation Period Annual Cumulative 2011 2012 2013 2014 2011-2014
2011 - Verified 10.5 10.4 10.4 9.7 41.0 2012 - Verified† 10.0 9.9 9.8 30.1 2013 - Verified† 0.0 0.0 9.5 9.4 19.9 2014 - Verified† 0.0 0.0 24.9 41.3
Verified Net Cumulative Energy Savings 2011-2014: 132.4
Combined CHEC 2011-2014 Cumulative CDM Energy Target: 119.5 Verified Portion of Cumulative Energy Target Achieved in 2014 (%): 110.7%
†Includes adjustments to previous years' verified results Incremental energy savings in 2014 continue to be strong when compared to other years in the framework. Performance was generally as predicted in the revised strategy document for 2014. The total achieved energy savings exceed the target with a total of 110.7%. A large portion of the kWh achieved was due to one project which added approximately 16% of the target. This clearly illustrates the impact that a given project can have on results.

Cornerstone Hydro Electric Concepts Association
Page | 6
4.0 General Conditions Impacting Strategy Performance: This section outlines issues which have impacted on the progress of Strategies and some of the general lessons learned over the fourth year of the program. While there have been many successes there remain many challenges within the CDM portfolio and specific challenges in some service territories. These specifics are outlined in the LDC specific reports contained in the addendums. 4.1 Portfolio Reduction and OEB Approved Programs: As stated in previous reports the overall portfolio reduction as a result of midstream and OEB approved programs not being developed has reduced the overall potential to achieve target. The commercial programs aimed at demand, namely DR1 and DR3 were either never in market or withdrawn part way through the framework. The in-market initiatives, which were generally focused on kWh savings, did meet target on a provincial basis. 4.2 Roving Energy Manager: CHEC LDCs collaborative application for a Roving Energy Manager (REM) provided an excellent resource to assist LDCs and their customers in the investigation and implementation of energy savings projects. The REM has been active across the CHEC LDC service territories and truly represents a “roving energy manager”. The REM has consistently met program requirements for target resulting in contract renewal. As noted in previous reports, the delay in funding approval impacted on the initial start of the REM. An earlier start would have seen more projects implemented within the current framework, recognizing that the lead time for commercial and industrial projects can be extensive. The lead time for projects has pushed out the final implementation of many projects beyond December 31, 2014 but the resultant savings will be accounted for in the Conservation First Framework. 4.3 Residential Program Performance: The residential programs performed well over 2014 as compared to other years in the framework and exceeded the projected performance for 2014. The Appliance Retirement Initiative, while being in the market for several years and showing some signs of saturation, did produce results similar to 2013. Perhaps the impending termination of the program produced additional savings with customers taking part in the program prior to the final date. The Coupon Initiative experienced significant growth in 2014 contributing approximately a third of the total energy savings from coupons in the final year. The continued performance of

Cornerstone Hydro Electric Concepts Association
Page | 7
coupons clearly illustrates the value of this customer outreach in the residential sector. Experience over the course of the program has clearly indicated that continued promotion of the coupons, coupons being in market over the course of the year and evaluation of spillover impact has maintained the continued value of the coupon program. The Low Income Initiative did not meet savings expectations in the final year nor did it meet the four year expectation. The challenge to engage eligible customers as well as issues around self-identification presented difficulties with obtaining the required traction for this program. In many instances the ability to obtain deep installs has been challenging. Within the funding envelope provided for conservation programs there was limited opportunity to fund general conservation education programs. While specific marketing of programs was undertaken this does not replace education initiatives. With the focus on target achievement, investment in educational programs where savings may be difficult to quantify was not undertaken. In future frameworks the ability to incorporate educational programs, in a cost effective manner, may be an area for investigation. 4.4 Peaksaver Plus: The Residential Demand Response Initiative (peaksaver PLUS®) has been identified in most strategies as being a key contributor to obtaining significant peak demand target from the residential sector. This program has fallen well below initial performance target achievement expectations. CHEC LDCs released an RFP for a supplier of service and technology in late 2012. Issues with respect to launching the program moved the in-market date later than anticipated including postponement into 2014 awaiting communication capabilities for some LDCs. Further complicating the issue was the need to terminate installation as colder weather approached to avoid completing the initial test installations when the AC would not be operating. The benefits of the “in home devices” as part of this program did not meet expectations as it was determined that there was no statistically valid energy savings from these devices. This finding impacted on the kWh savings which had been planned for in the initial CDM Strategies. 4.5 CDM Awareness: The continued offering of conservation programs has raised the general awareness and readiness to participate among customers. Customer experience within one program appears to foster continued participation as opportunities present themselves. Within the residential portfolio, as programs continue or special offerings are repeated, customers appear to be “looking towards” the program. This should assist with marketing efforts and make the resulting participation easier on a go forward basis. Of course to maintain

Cornerstone Hydro Electric Concepts Association
Page | 8
this interest offerings need to be continually revised to ensure they are meeting both the customer expectations and technology advancements as well as producing savings for LDCs. 4.6 Commercial Programs: The Direct Installed Lighting Initiative has been in market for some time however continued to show good performance in 2014. The ability to achieve results in this program was assisted by the addition of LED lamps and continued out-reach to customers who have not participated. The Retrofit Initiative continues to be a stable and important program delivering approximately 60% of the 2014 energy savings. The program has significant traction within the sector with opportunities being pursued in a variety of technologies. As noted previously the Roving Energy Manager has been active in supporting LDC efforts with their customers and the Retrofit Initiative provides an excellent tool for the REM to use in assisting customers with implementation of energy efficiency projects. 4.8 DR 3 Contribution: Within the strategies filed by CHEC LDCs, DR 3 accounted for approximately 3.4 MW of demand. In evaluating the demand contribution of various programs it is apparent that DR 3 or a similar demand focused program is required to obtain the demand reduction. Early in the framework customers participated in the DR3 program however over the course of the framework a number withdrew from the program. Overall a total of 2.6 MW of demand was obtained through the DR 3 Program. 5.0 Variation from CDM Strategy: The Addendums for each LDC include tracking of the CDM Strategy. A number of the LDCs have modified their strategies based on their results to the end of 2013. The combined strategy for the 13 CHEC LDCs is summarized in Table 4. The final results are slightly below the expected demand savings while energy achieved savings exceed the expected results by about 20%. The impact of one project increased the energy savings by approximately 16%. Without this project included the combined strategy savings is 94.9 approximately 3% above the revised strategy expectation. CHEC LDCs remain committed to CDM and obtaining kW and kWh savings. The experience gained and relationships developed in the 2011-2014 Framework will assist CHEC LDCs within the Conservation First Framework. The specific activities associated with each LDC are outlined in the attached Addendums.
Cornerstone Hydro Electric Concepts Association
Page | 9
Table 4 – CHEC CDM Combined Strategy:
Summary Annual Milestone - Contribution to 2014 Target
Category - Consumer kW kWh kW kWh kW kWh kW kWh kW kWh kW kWh kW kWh kW kWh kW kWh kW kWhProvincial Programs
Appliance Retirement 73 2,124,285 74 2,102,677 94 1,124,617 72 1,216,018 58 732,121 61 532,404 63 380,084 66 288,970 270 4,231,182 274 4,140,068 Instant Discounts (Rebates) 28 2,893,444 58 3,942,109 28 1,787,544 33 1,713,721 19 907,638 34 1,008,998 20 459,212 210 3,132,718 144 7,124,040 334 9,797,546
HVAC Discounts (Rebates) 205 1,286,117 410 3,173,721 336 1,588,507 280 1,514,923 214 764,551 287 1,047,261 289 607,656 369 692,825 1,267 6,343,561 1,347 6,428,730Demand Response 607 3,846,518 0 338 130 338 0 0 953 2,977,503 146 0 832 255,731 394 0 978 256,068 540 338
Midstream Incentives 3 82,243 0 0 0 0 0 0 2 19,945 0 0 2 6,207 0 0 2 6,207 0 0 New Construction 25 250,419 0 0 1 6,486 0 1,232 26 131,323 1 24,771 24 106,557 2 18,533 26 132,560 3 44,536
Low Income 0 0 0 0 12 186,345 13 387,814 152 1,552,205 47 866,648 116 798,077 30 191,197 177 2,052,539 90 1,445,659Provincial Consumer Total 941 10,483,027 542 9,218,844 601 4,693,837 398 4,833,707 1,423 7,085,286 576 3,480,082 1,347 2,613,524 1,071 4,324,243 2,863 20,146,158 2,588 21,856,877
OEB Approved ProgramsGeneral Consumer 36 0 0 0 0 0 0 0 10 0 0 0 0 0 0 0 0 0 0 0
Low Income 5 0 0 0 0 0 0 0 5 0 0 0 1 8,775 0 0 1 8,775 0 0OEB Approved Programs Total 41 0 0 0 0 0 0 0 15 0 0 0 1 8,775 0 0 1 8,775 0 0
Consumer Program Total 982 10,483,027 542 9,218,844 601 4,693,837 398 4,833,707 1,438 7,085,286 576 3,480,082 1,348 2,622,299 1,071 4,324,243 2,864 20,154,933 2,588 21,856,877
Annual Milestone - Contribution to 2014 Target
Category - Commercial & Institutional kW kWh kW kWh kW kWh kW kWh kW kWh kW kWh kW kWh kW kWh kW kWh kW kWh
Provincial Programs trofits – Medium and Large Buildings 987 7,342,065 266 7,087,736 1,712 9,875,529 957 12,473,024 1,446 6,773,176 688 7,648,637 1,760 9,345,757 1,209 8,576,956 3,672 36,555,155 3,121 35,784,972
Existing Building Retrofits – Small Buildings 835 16,571,055 451 5,894,370 576 7,733,791 628 7,346,407 1,049 7,686,179 441 3,260,774 1,004 2,937,019 1,042 3,895,407 2,524 19,438,570 2,563 20,396,958
Small Commercial Demand Response 19 39,713 0 12 19 1,070 0 0 39 56,981 15 148,792 56 291,415 2 0 71 440,218 17 148,804
Demand Response 1 & 3 0 37 526 7,522 120 15,376 -341 19,359 375 60,075 169 6,270 357 13,684 87 0 711 46,835 441 33,150Provincial Commercial & Inst. Total 1,841 23,952,871 1,243 12,989,640 2,427 17,625,765 1,245 19,838,789 2,910 14,576,411 1,314 11,064,473 3,178 12,587,875 2,340 12,472,363 6,979 56,480,778 6,141 56,363,885OEB Approved Programs
Retrofits 79 0 0 0 0 0 0 0 79 0 0 0 0 0 0 0 0 0 0 0New Construction 0 0 0 0 0 0 0 0 0 0 0 0 0 0 15 78,171 0 0 15 78,171
OEB Approved Programs Total 79 0 0 0 0 0 0 0 79 0 0 0 0 0 15 78,171 0 0 15 78,171
Commercial & Inst. Total 1,920 23,952,871 1,243 12,989,640 2,427 17,625,765 1,245 19,838,789 2,989 14,576,411 1,314 11,064,473 3,178 12,587,875 2,355 12,550,534 6,979 56,480,778 6,156 56,442,056
2014 Revised Strategy Projection Actual 2014 Results Revised Total Projected
Reduction Contribution to Target
2014 Revised Strategy Projection Actual 2014 Results Revised Total Projected
Reduction Contribution to Target
2011 Original Strategy Projection Actual 2011 Results 2012 Revised Strategy
Projection Actual 2012 Results 2013 Revised Strategy Projection Actual 2013 Results
2011 Original Strategy Projection Actual 2011 Results 2012 Revised Strategy
Projection Actual 2012 Results 2013 Revised Strategy Projection Actual 2013 Results

Cornerstone Hydro Electric Concepts Association
Page | 10
Annual Milestone - Contribution to 2014 Target
Category - Industrial kW kWh kW kWh kW kWh kW kWh kW kWh kW kWh kW kWh kW kWh kW kWh kW kWhProgram Name
Industrial Accelerator 55 1,284,928 0 0 0 0 0 0 0 0 149 712,800 0 0 -81 5,582 149 712,800 68 718,382Industrial Equipment Replacement 431 10,125,877 53 2,938,736 436 5,576,430 0 0 357 3,098,905 0 0 183 1,026,032 0 0 236 3,964,769 53 2,938,736
Demand Response 1 0 7 0 0 0 0 0 0 0 4 0 0 1 1 0 0 1 1 0 0Demand Response 3 24 524,494 1,549 90,925 21 436,972 66 52,874 410 678 1,111 48,065 75 775 -527 0 2,801 192,638 2,199 191,863
Provincial Industrial Total 511 11,935,306 1,602 3,029,661 457 6,013,402 66 52,874 767 3,099,587 1,260 760,865 259 1,026,809 -608 5,582 3,187 4,870,208 2,320 3,848,981OEB Approved Programs
A 0 0 0 0 0 0 0 0 0 0 0 0 0 0 0 0 0 0 0 0B 0 0 0 0 0 0 0 0 0 0 0 0 0 0 0 0 0 0 0 0
OEB Approved Programs Total 0 0 0 0 0 0 0 0 0 0 0 0 0 0 0 0 0 0 0 0
Industrial Total 511 11,935,306 1,602 3,029,661 457 6,013,402 66 52,874 767 3,099,587 1,260 760,865 259 1,026,809 -608 5,582 3,187 4,870,208 2,320 3,848,981Note: Sums above do not include Orillia Power's projected or actuals as Strategy not itemized by intiatives
CDM Strategy Total kW kWh kW kWh kW kWh kW kWh kW kWh kW kWh kW kWh kW kWh kW kWh kW kWhProgram Total 3,933 48,501,204 4,134 29,589,650 3,975 32,093,004 1,840 28,356,940 5,414 28,881,284 3,478 17,059,738 6,384 20,666,984 3,084 18,334,221 15,860 95,945,920 12,535 93,339,169
2010 Contribution 0 0 577 11,452,775 6 29,450 32 307,683 0 0 0 0 0 0 0 0 439 8,540,239 610 11,760,458Time Of Use Savings 0 0 0 0 0 0 0 0 0 0 0 0 0 0 1,058 0 0 0 1,058 0
Adjustments to Verified Final Results 0 0 0 0 0 0 860 19,411,939 0 0 255 5,383,811 0 0 398 2,455,885 203 5,289,504 1,513 27,251,635Adjusted Total 3,933 48,501,204 4,711 41,042,426 3,981 32,122,454 2,732 48,076,562 5,414 28,881,284 3,733 22,443,549 6,384 20,666,984 4,540 20,790,106 16,501 109,775,662 15,716 132,351,262
25,720 119,510,000
Percentage of Target kW kWh kW kWh kW kWh kW kWh kW kWh kW kWh kW kWh kW kWh kW kWh kW kWh15.3% 40.6% 18.3% 34.3% 15.5% 26.9% 10.6% 40.2% 21.0% 24.2% 14.5% 18.8% 24.8% 17.3% 17.7% 17.4% 64% 91.9% 61.1% 110.7%
Note: Total Projection is formed of 2011, 2012 & 2013 Actuals added with 2014 Revised Strategy Projection
2014 Revised Strategy Projection Actual 2014 Results Revised Total Projected
Reduction Contribution to Target
2014 Revised Strategy Projection Actual 2014 Results Revised Total Projected
Reduction Contribution to Target
Target to Achieve
Actual 2013 Results
2011 Original Strategy Projection Actual 2011 Results 2012 Revised Strategy
Projection Actual 2012 Results 2013 Revised Strategy Projection Actual 2013 Results
2011 Original Strategy Projection Actual 2011 Results 2012 Revised Strategy
Projection Actual 2012 Results 2013 Revised Strategy Projection
2011 Original Strategy Projection Actual 2011 Results 2012 Revised Strategy
Projection Actual 2012 Results 2013 Revised Strategy Projection Actual 2013 Results 2014 Revised Strategy
Projection Actual 2014 Results Revised Total Projected Reduction Contribution to Target

Cornerstone Hydro Electric Concepts Association
Page | 11
6.0 Addendums: Centre Wellington Hydro ................................................................ Addendum 1 COLLUS Power Stream...................................................................... Addendum 2 Innisfil Hydro Distribution Systems.................................................. Addendum 3 Lakefront Utilities............................................................................. Addendum 4 Lakeland Power Distribution….......................................................... Addendum 5 Midland Power Utility...................................................................... Addendum 6 Orangeville Hydro............................................................................ Addendum 7 Orillia Power…………………………………………………………………………………. Addendum 8 Parry Sound Power........................................................................... Addendum 9 Rideau St. Lawrence Distribution..................................................... Addendum 10 Wasaga Distribution Ltd................................................................... Addendum 11 Wellington North Power.................................................................. Addendum 12 West Coast Huron Energy................................................................ Addendum 13
West Coast Huron Energy 2014 CDM Annual Report
WEST COAST HURON ENERGY INC.
Addendum 13 – CHEC Combined Annual Report 2015
Conservation and Demand Management
2014 Annual Report
Submitted to:
Ontario Energy Board
Submitted on September 30, 2015

West Coast Huron Energy 2014 CDM Annual Report
1
TABLE OF CONTENTS TABLE OF CONTENTS ........................................................................................................................................................... 1
EXECUTIVE SUMMARY ......................................................................................................................................................... 3
BACKGROUND ..................................................................................................................................................................... 7
1. CONSERVATION FRAMEWORK .................................................................................................................................... 8
1.1 2011-2014 FRAMEWORK .......................................................................................................................................... 8
1.2 CONSERVATION FIRST FRAMEWORK ......................................................................................................................... 8
2 BOARD-APPROVED CDM PROGRAMS.......................................................................................................................... 9
2.1 INTRODUCTION ........................................................................................................................................................... 9
2.2 TOU PRICING ................................................................................................................................................................. 9
2.2.1 BACKGROUND ................................................................................................................................................................ 9
2.2.2 TOU PROGRAM DESCRIPTION ................................................................................................................................... 9
2.3 WEST COAST HURON ENERGY ’S APPLICATION WITH THE OEB .............................................................................................. 10
2.4 WEST COAST HURON ENERGY ’S APPLICATION WITH THE IESO’S CONSERVATION FUND ............................................................. 10
3 IESO-CONTRACTED PROVINCE-WIDE CDM PROGRAMS ............................................................................................. 12
3.1 INTRODUCTION ............................................................................................................................................................. 12
3.2 PROGRAM DESCRIPTIONS ............................................................................................................................................... 14
3.2.1 RESIDENTIAL PROGRAM....................................................................................................................................... 14
3.2.2 COMMERCIAL AND INSTITUTIONAL PROGRAM ................................................................................................... 20
3.2.3 INDUSTRIAL PROGRAM ........................................................................................................................................ 25
3.2.4 LOW INCOME INITIATIVE (HOME ASSISTANCE PROGRAM) (Schedule E-1) ......................................................... 29
3.2.5 PRE-2011 PROGRAMS .......................................................................................................................................... 29
4 2014 LDC CDM RESULTS .................................................................................................................................................. 30
4.1 PARTICIPATION AND SAVINGS .......................................................................................................................................... 30
4.2 EVALUATION, MEASUREMENT AND VERIFICATION (“EM&V”) FINDINGS ................................................................ 33
4.3 SPENDING .................................................................................................................................................................... 41
4.4 ADDITIONAL COMMENTS ................................................................................................................................................ 43
West Coast Huron Energy 2014 CDM Annual Report
2
5 COMBINED CDM REPORTING ELEMENTS ................................................................................................................... 44
5.2 PROGRESS TOWARDS CDM TARGETS................................................................................................................................ 44
5.1.1 SUMMARY OF TARGET ACHIEVEMENT: ................................................................................................................................... 45
5.3 VARIANCE FROM STRATEGY ............................................................................................................................................. 46
6 CONCLUSION ............................................................................................................................................................. 48
APPENDIX A: INITIATIVE DESCRIPTIONS............................................................................................................................ 49
RESIDENTIAL PROGRAM .................................................................................................................................................... 49
APPLIANCE RETIREMENT INITIATIVE (Exhibit D) ............................................................................................................... 49
APPLIANCE EXCHANGE INITIATIVE (Exhibit E) ................................................................................................................... 49
HVAC INCENTIVES INITIATIVE (Exhibit B) .......................................................................................................................... 50
CONSERVATION INSTANT COUPON INITIATIVE (Exhibit A) ............................................................................................... 50
RETAILER CO-OP ................................................................................................................................................................ 51
C&I PROGRAM ................................................................................................................................................................. 53
INDUSTRIAL PROGRAM ................................................................................................................................................. 56
APPENDIX B: PRE-2011 PROGRAMS .................................................................................................................................. 61

West Coast Huron Energy 2014 CDM Annual Report
3
Executive Summary This annual report is submitted by West Coast Huron Energy in accordance with the filing requirements set out in the Conservation and Demand Management (“CDM”) Code for Electricity Distributors, issued September 16, 2010, Board File No. EB-2010-0215 specifically, the Appendix C Annual Report Template, as a progress report and update to West Coast Huron Energy ’s Strategy filed with the Ontario Energy Board (“Board” or “OEB”) on November 1, 2010. Accordingly, this report outlines West Coast Huron Energy’s CDM activities for the period of January 1, 2014 to December 31, 2014. It includes net peak demand and net energy savings achieved in 2011, 2012, 2013, and 2014, CDM program activities, successes and challenges.
West Coast Huron Energy did not apply for any Board-approved CDM programs during 2014 however, as noted in the Guidelines for Electricity Distributors Conservation and Demand Management (“CDM Guidelines”), released April 26, 2012, the Board has deemed Time-of-Use (“TOU”) pricing to be a province-wide Board-approved CDM program. The Ontario Power Authority (“OPA”), now Independent Electricity System Operator (“IESO”), is to provide measurement and verification on TOU. The TOU savings allocated to West Coast Huron Energy’s 2011 -2014 targets are 36kW and 0 kWh.
In 2011 – 2014, West Coast Huron Energy contracted with the IESO to deliver a portfolio of IESO-contracted province-wide CDM programs (“IESO Programs”) to all customer segments including residential, commercial, institutional, industrial and low income. Most of these programs were rolled-out by the IESO in June 2011. In 2011 program activities were centered on building a foundation for full program execution over the next three years of the program term, including staffing, procurement, and program delivery.
In 2011, West Coast Huron Energy contracted with the Ontario Power Authority (OPA) to deliver a portfolio of OPA-Contracted Province-Wide CDM Programs to all customer segments including residential, commercial, institutional, industrial and low income. These programs were rolled-out by the OPA in June 2011. In 2011 Program activities were centered on building a foundation for full program execution over the next three years of the program term, including staffing, procurement, and program delivery.
In 2012, West Coast Huron Energy continued to place significant emphasis on the programs in market. The delivery of ERII and Direct Install programs continued to be active, there was uptake in the Home Assistance Program and the Peak Saver third-party contractor was approved. To date West Coast Huron Energy has:
• Launched all available OPA Programs following their release by the OPA: • Delivered marketing to inform consumers in all sectors: • Informed industry stakeholders about OPA Programs, the use of online application system, • Partnered with CHEC LDCs to form partnerships and delivery models for the various programs; • In conjunction with other CHEC LDCs engaged the services of a Roving Energy Manager: • Actively participated in Electrical Distribution Association (EDA, LDC and OPA working groups through our own staff or CHEC resources in order to improve and simplify the existing programs and processes; and • Transitioned pre-2011 projects into 2011.

West Coast Huron Energy 2014 CDM Annual Report
4
In 2013, West Coast Huron Energy continued to deliver all in market programs with the associated marketing and customer support. The commercial programs such as ERII and Small Business continued to have generally good traction in the market place and demonstrated industry recognition. While the Peak Saver RFP had been released towards the end of 2012 award of contract, technology selection and system preparedness issues resulted in limited market exposure in 2013. During this period the Roving Energy Manager’s contract was renewed to continue this important collaborative resource for CHEC LDCs. The residential programs continue to struggle to produce significant gains within this sector when compared to the industrial & commercial programs. In 2014, West Coast Huron Energy continued to deliver all in-market programs with the associated marketing and customer support. The commercial programs, specifically the retrofit program continued to have good market awareness and uptake over the year. The Roving Energy Manager position was continued as part of the CHEC collaborative effort and assisted in maintaining focus and performance in this sector.
Peak Saver was in market however continued to generally struggle. The customer engagement in this program did not meet expectations along with the associated demand reduction.
West Coast Huron Energy has achieved 0.3 MW of net incremental peak demand savings and 1.0 GWh of net incremental energy savings in 2014. A summary of the achievements towards the CDM targets is shown below:

West Coast Huron Energy 2014 CDM Annual Report
5
LDC: West Coast Huron Energy Inc.
2014 Incremental 2011-2014
Achievement Against Target
Net Annual Peak Demand Savings (MW) 0.3 0.5 Net Energy Savings (GWh) 1.0 4.0 Unless otherwise noted, results are presented using scenario 1 which assumes that demand response resources have a persistence of 1 year
0 0-5% 9 9 0 05% 5-10% 20 4
10% 10-15% 24 3 15% 15-20% 10 11 20% 20-25% 5 4 25% 25-30% 2 10 30% 30-35% 3 14 35% 35-40% 0 14 40% 40-45% 0 3 45% 45-50% 0 4 50% 50-55% 0 5 55% 55-60% 0 1 60% >60% 4 4
IESO-Contracted Province-Wide CDM Programs: 2011-2014 Final Results Report
Achievement by Sector
Comparison: LDC Achievement vs. LDC Community Achievement (Progress to Target)
Final 2014 Achievement Against Targets
53.8%
% of Target Achieved
48.8%
0
2
4
6
8
10
12
0-5%
10-1
5%
20-2
5%
30-3
5%
40-4
5%
50-5
5%
60-6
5%
70-7
5%
80-8
5%
90-9
5%
>100
%
# of
LDC
s in
Each
Pro
gres
s Buc
ket
% of OEB Target Achieved
% of OEB Peak Demand Savings Target Achieved
# of LDCs LDC Progress
05
1015202530354045
0-5%
10-1
5%
20-2
5%
30-3
5%
40-4
5%
50-5
5%
60-6
5%
70-7
5%
80-8
5%
90-9
5%
>100
%# of
LDC
s in
Each
Pro
gres
s Buc
ket
% of OEB Target Achieved
% of OEB Energy Savings Target Achieved
# of LDCs LDC Progress --- Provincial Progress
15%
72%
0%0% 0% 13%
2014 Incremental Peak Demand Savings (MW)
Consumer Business Industrial HAP ACP Other
16%
83%
0% 1%0% 0%
2014 Incremental Energy Savings (GWh)
--- Provincial Progress

West Coast Huron Energy 2014 CDM Annual Report
6
From the above table, West Coast Huron Energy has achieved 0.5 MW or 53.8 % and 4.0 GWh or 48.8 % towards West Coast Huron Energy ’s 2014 peak demand reduction target and energy consumption reduction targets respectively . The shortfall of peak demand targets was negatively impacted by the late start of programs, cancellation of planned province wide programs including Direct Space Cooling since 2011 and the impact on West Coast Huron Energy Inc.’s infrastructure and customers due to and EF3 Tornado in August 2011. Effectively, a large number of the commercial businesses in the Downtown Square were no longer standing. Insurance claims resulting from the tornado damage covered lighting retrofits, replacement of existing Roof Top Heating/Air Conditioning Units and whole building envelopes. Focus of the businesses and community was to recover from the devastation as quickly as possible impacting on the LDC’s ability to promote “retrofits” at that time.
During this framework period West Coast Huron Energy Inc.’s largest customer was not able to focus on energy conservation due to impacts of the tornado and other business priorities. As such the ability to achieve target without the participation of this potential partner was significantly impacted. It is estimated that this alone reduced the ability to achieve the conservation targets by 50%.
The suite of OPA programs, while supporting kW savings did not see significant demand focused projects implemented at the customer level. While many projects resulted in significant kWh the demand was minimal. West Coast Huron Energy due to the tornado lost their opportunity in the first year which had a cumulative effect on the target over the subsequent years of the framework. West Coast Huron Energy Inc.’s custom electricity conservation program also relied heavily on their commercial (12% of total customer class) and industrial (1% of total customer class) customers to develop their own custom Energy Plans which required capital planning and budgets. From this planning prospective, West Coast Huron Energy Inc. are now experiencing an increase in Retrofit applications which will benefit the 2015-2020 Conservation First Framework Plan and new targets.
In 2015, the Conservation First Framework (CFF) for the period 2015 -2020 will be implemented with CDM Plans prepared by LDCs. To ensure a smooth transition, most 2011- 2014 Programs and Rules were extended into 2015 until the effective implementation of January 1, 2016, under the Conservation First Framework. West Coast Huron Energy Inc. will continue to develop and collaborate on custom/innovative programs to prove to be successful in the 2015-2020 Conservation First Framework Plan.
West Coast Huron Energy 2014 CDM Annual Report
7
Background On March 31, 2010, the Minister of Energy and Infrastructure of Ontario, under the guidance of sections 27.1 and 27.2 of the Ontario Energy Board Act, 1998, directed the OEB to establish Conservation and Demand Management (“CDM”) targets to be met by electricity distributors. Accordingly, on November 12, 2010, the OEB amended the distribution license of LDC to require LDC, as a condition of its license, to achieve 8.28 GWh of energy savings and 0.88 MW of summer peak demand savings, over the period beginning January 1, 2011 through December 31, 2014.
In accordance with the same Minister’s directive, the OEB issued the Conservation and Demand Management Code for Electricity Distributors (the “Code”) on September 16, 2010. The Code sets out the obligations and requirements with which electricity distributors must comply in relation to the CDM targets set out in their licenses. To comply with the Code requirements, West Coast Huron Energy submitted its CDM Strategy on November 1, 2010 which provided a high level of description of how West Coast Huron Energy intended to achieve its CDM targets.
The Code also requires a distributor to file annual reports with the Board. This is the fourth Annual Report by West Coast Huron Energy and has been prepared in accordance with the Code requirements and covers the period from January 1, 2014 to December 31, 2014.
West Coast Huron Energy submitted its 2011 Annual Report on September 30, 2012 which summarized the CDM activities, successes and challenges experienced by West Coast Huron Energy for the January 1, 2011 to December 31, 2011 period. The OEB’s 2011 CDM Results Report identified that the delay in the full suite of CDM programs being made available by the IESO, and the absence of some programs negatively impacted the final 2011 results for the LDCs. This issue was also highlighted in Volumes I and II of the Environmental Commissioner’s Report on Ontario’s Annual Energy Conservation Progress.
On December 21, 2012, the Minister of Energy directed the IESO to fund CDM programs which meet the definition and criteria for IESO-contracted province-wide CDM programs for an additional one-year period from January 1, 2015 to December 31, 2015.
The Ministerial Directive did not amend the timelines for LDCs to achieve their energy savings and demand savings targets. Therefore, the main focus of the LDCs remains the achievement of CDM targets by December 31, 2014.
West Coast Huron Energy submitted its 2013 Annual Report on September 30, 2014 which summarized the CDM activities undertaken by West Coast Huron Energy for the January 1, 2013 to December 31, 2013 period. The OEB’s 2013 CDM Results report identified that the majority of LDCs achieved close to 50% of their net peak demand (MW) target from their 2013 results. However, LDCs generally advised the Board that meeting their peak demand (MW) target is not likely and that a shortfall is expected.
In 2014, LDCs collectively achieved approximately 19.5% of the energy savings (GWh) target, adding to the overall cumulative result of approximately 109% of the net energy target of 6,000 GWh.
West Coast Huron Energy 2014 CDM Annual Report
8
1. Conservation Framework
1.1 2011-2014 Framework
Ontario’s current CDM framework is a key step towards creating a culture of conservation in the Province. The Ontario Government (“Government”) Directive to the OEB to establish CDM targets that would be met by electricity distributors recognizes the importance of CDM for both electricity customers and the electricity system. CDM helps customers manage rising energy costs, supports the provincial integrated supply plan, and addresses local distribution and transmission supply constraints. The past framework was intended to enable customers to benefit from a suite of both Board-approved and IESO province-wide programs and provide a portfolio that would meet both broad and specific customer needs.
The state of Board-approved programs and the current suite of province-wide IESO programs have limited CDM offerings to customers. This has produced limited savings and has restricted the associated opportunity for LDCs to meet their targets. The process to introduce changes to current program initiatives or to pilot new initiatives has been challenging, involving considerable cost and effort, which has resulted in limited benefits to customers and CDM savings.
Challenges faced by LDCs in the 2011-2014framework, such as overbuilt governance and unnecessarily excessive legal requirements and misalignment of control and risks, have been addressed by the new directive. However, there are still many challenges to overcome and the new CDM framework should address other challenges of the current framework and build on its strengths.
1.2 Conservation First Framework
LDCs are supportive of the Government’s renewed commitment for CDM in Ontario. LDCs are committed to working with the Government, IESO, Natural Gas Utilities and other stakeholders to develop programs for the new framework for CDM in the Province.
Long-term commitment for CDM funding and confirmation of the role of LDCs have been provided in the Minister’s directive dated March 31, 2014, allowing LDCs to maintain current program infrastructure, including LDC staff and third party contracts as required.
The commitment also provided LDCs the program extensions required for continuity into the Conservation First Framework which was critical for all customers.
West Coast Huron Energy 2014 CDM Annual Report
9
2 Board-Approved CDM Programs
2.1 Introduction In its Decision and Order dated November 12, 2010 in EB-2010-0215 and EB-2010-0216, the OEB ordered that, to meet its mandatory CDM targets, “Each licensed electricity distributor must, as a condition of its licence, deliver Board-approved CDM programs, IESO-contracted province-wide CDM programs, or a combination of the two”.
At this time, the implementation of TOU pricing is the only Board-approved CDM program that is being offered in West Coast Huron Energy.
2.2 TOU Pricing
2.2.1 Background In its April 26, 2012 CDM Guidelines, the OEB recognizes that a portion of the aggregate electricity demand target was intended to be attributable to savings achieved through the implementation of TOU pricing. The OEB establishes TOU prices and has made the implementation of this pricing mechanism mandatory for distributors. On this basis, the OEB has determined that distributors will not have to file a Board-approved CDM program application regarding TOU pricing. The OEB has deemed the implementation of TOU pricing to be a Board-approved CDM program for the purposes of achieving the CDM targets. The costs associated with the implementation of TOU pricing are recoverable through distribution rates, and not through the Global Adjustment Mechanism (“GAM”).
In accordance with the Ministry directive dated March 31, 2010 by the Minister of Energy and Infrastructure, the OEB is of the view that any evaluation of savings from TOU pricing should be conducted by the IESO for the Province, and then allocated to distributors. West Coast Huron Energy has included the results provided by the IESO in this report.
In 2013, IESO had retained the Brattle Group as the evaluation contractor and has been working with an expert panel convened to provide advice on methodology, data collection, models, savings allocation, etc. The initial evaluations were conducted in 2013 with five LDCs – Hydro One Networks Inc., Toronto Hydro-Electric System Limited, Hydro Ottawa Limited, Thunder Bay Hydro Electricity Distribution Inc. and Newmarket-Tay Power Distribution Ltd. Preliminary results from these five LDCs were issued to the five LDCs involved in the study in August 2013 and are now publically available on the IESO website. Preliminary results demonstrated load shifting behaviours from the residential customer class.
Three additional LDCs were added to the study in 2014 – Cambridge-North Dumphries, PowerStream and Sudbury. Preliminary results from this study are planned to be issued to the eight LDCs in September 2014. The IESO advised that the TOU study will be completed in the summer of 2015 and final verified savings will be available for LDCs to include in the 2014 Annual Report.
The TOU savings as reported by the IESO is included in this report and accounts for 36 kW which represents 4% of the West Coast Huron Energy demand target.
2.2.2 TOU PROGRAM DESCRIPTION
Target Customer Type(s): Residential and small business customers (up to 250,000 kWh per year)
Initiative Frequency: Year-round
West Coast Huron Energy 2014 CDM Annual Report
10
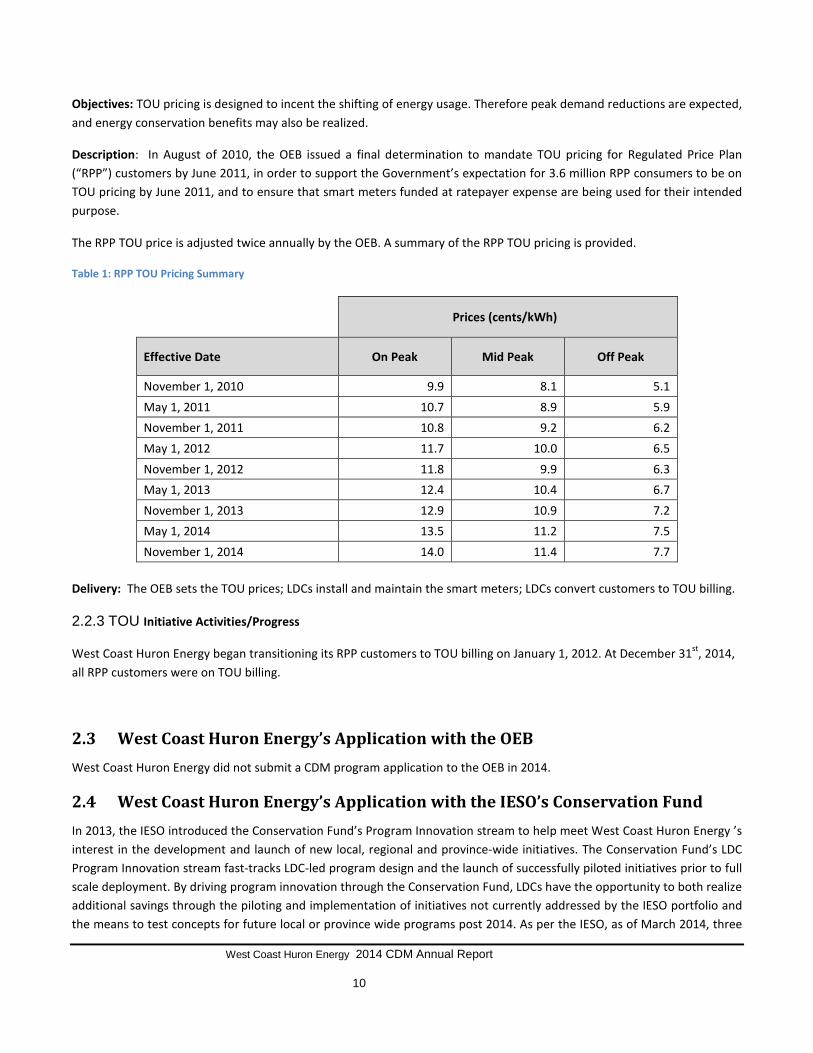
Objectives: TOU pricing is designed to incent the shifting of energy usage. Therefore peak demand reductions are expected, and energy conservation benefits may also be realized.
Description: In August of 2010, the OEB issued a final determination to mandate TOU pricing for Regulated Price Plan (“RPP”) customers by June 2011, in order to support the Government’s expectation for 3.6 million RPP consumers to be on TOU pricing by June 2011, and to ensure that smart meters funded at ratepayer expense are being used for their intended purpose.
The RPP TOU price is adjusted twice annually by the OEB. A summary of the RPP TOU pricing is provided.
Table 1: RPP TOU Pricing Summary
Prices (cents/kWh)
Effective Date On Peak Mid Peak Off Peak
November 1, 2010 9.9 8.1 5.1 May 1, 2011 10.7 8.9 5.9 November 1, 2011 10.8 9.2 6.2 May 1, 2012 11.7 10.0 6.5 November 1, 2012 11.8 9.9 6.3 May 1, 2013 12.4 10.4 6.7 November 1, 2013 12.9 10.9 7.2 May 1, 2014 13.5 11.2 7.5 November 1, 2014 14.0 11.4 7.7
Delivery: The OEB sets the TOU prices; LDCs install and maintain the smart meters; LDCs convert customers to TOU billing.
2.2.3 TOU Initiative Activities/Progress
West Coast Huron Energy began transitioning its RPP customers to TOU billing on January 1, 2012. At December 31st, 2014, all RPP customers were on TOU billing.
2.3 West Coast Huron Energy’s Application with the OEB West Coast Huron Energy did not submit a CDM program application to the OEB in 2014.
2.4 West Coast Huron Energy’s Application with the IESO’s Conservation Fund In 2013, the IESO introduced the Conservation Fund’s Program Innovation stream to help meet West Coast Huron Energy ’s interest in the development and launch of new local, regional and province-wide initiatives. The Conservation Fund’s LDC Program Innovation stream fast-tracks LDC-led program design and the launch of successfully piloted initiatives prior to full scale deployment. By driving program innovation through the Conservation Fund, LDCs have the opportunity to both realize additional savings through the piloting and implementation of initiatives not currently addressed by the IESO portfolio and the means to test concepts for future local or province wide programs post 2014. As per the IESO, as of March 2014, three

West Coast Huron Energy 2014 CDM Annual Report
11
pilots have been contracted and are underway with Toronto Hydro and Niagara Peninsula Energy and ten others are in various stages of the contracting and development process.
In addition, building on LDC interest in social benchmarking services for the residential sector, in 2013 the Conservation Fund in collaboration with Hydro One, Milton Hydro and Horizon Utilities completed the procurement of three social benchmarking pilot projects. Beginning in 2014 these services will be offered to more than 100,000 customers for a one year period, with evaluation reports published shortly thereafter.
West Coast Huron Energy did not submit a CDM program application to the IESO’s Conservation Fund in 2014.

West Coast Huron Energy 2014 CDM Annual Report
12
3 IESO-Contracted Province-Wide CDM Programs
3.1 Introduction Effective March 28, 2011, West Coast Huron Energy entered into an agreement with the IESO to deliver CDM programs extending from January 1, 2011 to December 31, 2014. The programs included under this agreement are listed in Table 2 below. Further program details are included in Appendix A. In addition, results include projects started pre 2011 which were completed in or after 2011:
Table 2: IESO-Contracted Province-Wide CDM Program Initiatives
Initiative Schedule Date schedule posted
West Coast Huron Energy in Market Date
Residential Programs Appliance Retirement Schedule B-1, Exhibit D Jan 26,2011 March 28, 2011
Appliance Exchange Schedule B-1, Exhibit E Jan 26, 2011 March 28, 2011
HVAC Incentives Schedule B-1, Exhibit B Jan 26, 2011 March 28, 2011
Conservation Instant Coupon Booklet Schedule B-1, Exhibit A Jan 26, 2011 March 28, 2011
Bi-Annual Retailer Event Schedule B-1, Exhibit C Jan 26, 2011 March 2011
Retailer Co-op n/a n/a Residential Demand Response Schedule B-3 Aug 22, 2011 June 2013
New Construction Program Schedule B-2 Jan 26, 2011 June 2011
Home Assistance Program Schedule E-1 May 9, 2011 October 2012
Commercial & Institutional Programs Efficiency: Equipment Replacement Schedule C-2 Jan 26, 2011 May 1, 2011
Direct Install Lighting Schedule C-3 Jan 26, 2011 May 1, 2011
Existing Building Commissioning Incentive Schedule C-6 Feb 2011 November 2011
New Construction and Major Renovation Initiative
Schedule C-4 Feb 2011 July 2011
Energy Audit Schedule C-1 Jan 26, 2011 September 2011
Commercial Demand Response Schedule B-3 Jan 26, 2011 June 2013
Industrial Programs
Process & System Upgrades Schedule D-1 May 31, 2011 November 1, 2011
Monitoring & Targeting Schedule D-2 May 31, 2011 September 1, 2011
Energy Manager Schedule D-3 May 31, 2011 September 25, 2011
Key Account Manager (“KAM”) Schedule D-4 May 31,2011 Not in Market
Demand Response 3 Schedule D-6 May 31, 2011 May 1, 2011
In addition, results were realized towards West Coast Huron Energy’s 2011-2014 targets through the following pre-2011 programs:
• Electricity Retrofit Incentive Program • High Performance New Construction • Multifamily Energy Efficiency Rebates

West Coast Huron Energy 2014 CDM Annual Report
13
As per the table below, several program initiatives are no longer available to customer or have not been launched in Table 3.
Table 3: Pre-2011 IESO Programs
Not in Market Objective Status Residential Program Midstream Electronics Encourages retailers to promote and
sell high efficency televisions, and for distributors to distribute high efficiency set top boxes.
Did not launch and removed from Schedule in Q2, 2013.
Midstream Pool Equipment Encourage pool installers to sell and install efficient pool pump equipment in residential in-ground pools.
Did not launch and removed from Schedule in Q2, 2013.
Home Energy Audit Tool This is a provincial online audit tool to engage customers in conservation and help drive customer participation to CDM programs.
Did not launch and removed from Schedule in Q2, 2013.
Commercial & Institutional Program Direct Service Space Cooling Offers free servicing of air conditioning
systems and refrigeration units for the purpose of achieving energy savings and demand reduction.
Did not launch.
Demand Response 1 (“DR1”)
This initiative allows distribution customers to voluntarily reduce electricity demand during certain periods of the year pursuant to the DR 1 contract. The initiative provides DR payment for service for the actual electricity reduction provided during a demand response event.
No customer uptake for this initiative. As a result this Initiative was removed from the Schedule in Q4, 2012.
Industrial Program DR1 As above No customer uptake for this
initiative. Removed in Q4, 2012.
The Master CDM Program Agreement between LDC and the IESO includes a program change management provision in Article 3. Collaboration between the IESO and LDC commenced in 2011, and continued in 2012, 2013 and 2014, as the change management process was implemented to enhance the saveONenergy program suite. The change management process allows for modifications to the Master CDM Program Agreement and initiative Schedules. The program enhancements give LDCs additional tools and greater flexibility to deliver programs in a way that meets the needs of customers and further drives participation in the Initiatives.
West Coast Huron Energy 2014 CDM Annual Report
14
3.2 Program Descriptions Full descriptions of IESO-contracted province-wide CDM programs are available on the IESO’s intranet LDC and additional initiative information can be found on the saveONenergy website at https://saveonenergy.ca. The targeted customer types, objectives, and individual descriptions for each program initiative are detailed in Appendix A. Discussion of LDC’s experience with these programs is provided below.
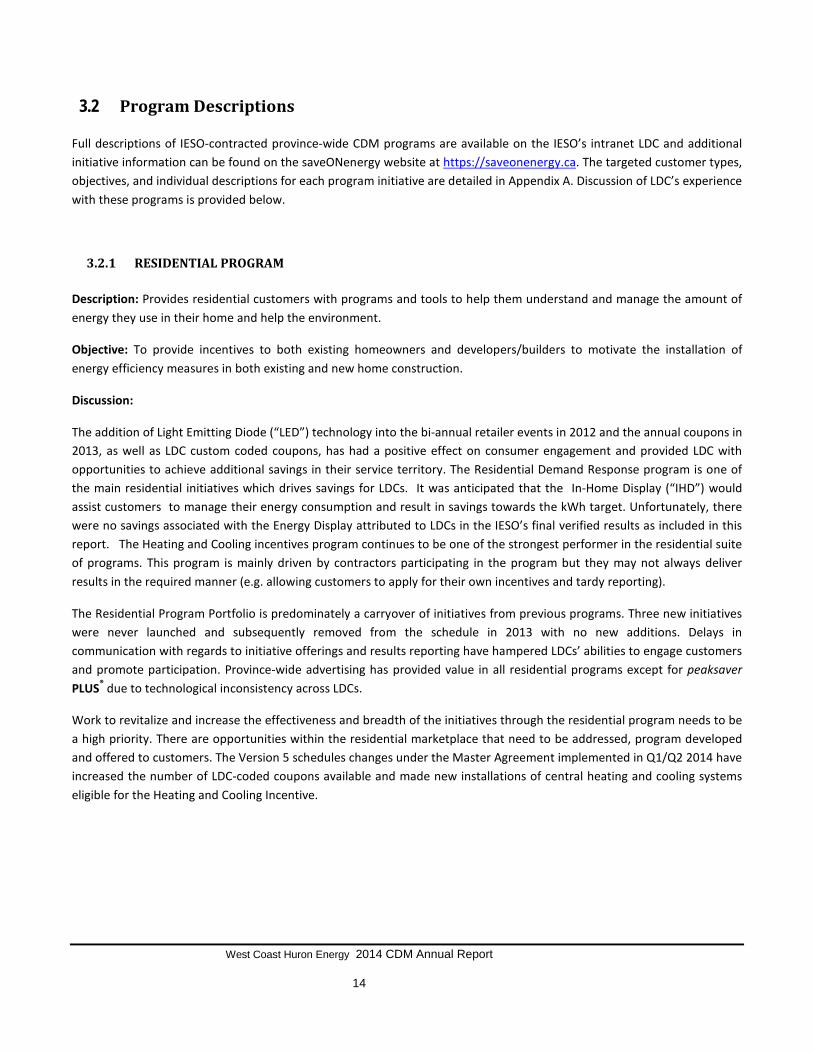
3.2.1 RESIDENTIAL PROGRAM Description: Provides residential customers with programs and tools to help them understand and manage the amount of energy they use in their home and help the environment.
Objective: To provide incentives to both existing homeowners and developers/builders to motivate the installation of energy efficiency measures in both existing and new home construction.
Discussion:
The addition of Light Emitting Diode (“LED”) technology into the bi-annual retailer events in 2012 and the annual coupons in 2013, as well as LDC custom coded coupons, has had a positive effect on consumer engagement and provided LDC with opportunities to achieve additional savings in their service territory. The Residential Demand Response program is one of the main residential initiatives which drives savings for LDCs. It was anticipated that the In-Home Display (“IHD”) would assist customers to manage their energy consumption and result in savings towards the kWh target. Unfortunately, there were no savings associated with the Energy Display attributed to LDCs in the IESO’s final verified results as included in this report. The Heating and Cooling incentives program continues to be one of the strongest performer in the residential suite of programs. This program is mainly driven by contractors participating in the program but they may not always deliver results in the required manner (e.g. allowing customers to apply for their own incentives and tardy reporting).
The Residential Program Portfolio is predominately a carryover of initiatives from previous programs. Three new initiatives were never launched and subsequently removed from the schedule in 2013 with no new additions. Delays in communication with regards to initiative offerings and results reporting have hampered LDCs’ abilities to engage customers and promote participation. Province-wide advertising has provided value in all residential programs except for peaksaver PLUS® due to technological inconsistency across LDCs.
Work to revitalize and increase the effectiveness and breadth of the initiatives through the residential program needs to be a high priority. There are opportunities within the residential marketplace that need to be addressed, program developed and offered to customers. The Version 5 schedules changes under the Master Agreement implemented in Q1/Q2 2014 have increased the number of LDC-coded coupons available and made new installations of central heating and cooling systems eligible for the Heating and Cooling Incentive.

West Coast Huron Energy 2014 CDM Annual Report
15
3.2.1.1 Appliance Retirement Initiative (Exhibit D)
Initiative Activities/Progress: The Appliance Program continues to be promoted through the OPA designed For Home brochures, online For Home ads and fridge thermometer giveaways. Brochures and giveaways are provided for customers at events and front counter displays.
Additional Comments:
• Due to the duration of the program, and the revised appliance eligibility requirements to a minimum age of 20 years old, this initiative appears to have reached market saturation and has been under consideration for removal from the portfolio.
• IESOs results are very responsive to province-wide advertising, IESO provincial marketing should continue to play a key role.
• Better relationships with retailers may play a role in increasing participation in this initiative. Retailers can provide opportunities to capture replacement appliances and have them decommissioned after a sale has been committed.
• In an effort to capture additional savings in the perceived last year of the initiative, the eligibility requirement for refrigerators was revised from 20 years old to 15 years old in Q2 2014, prior to the conclusion of this program by December 31, 2014.
• Due to the announcement by the IESO that the Appliance Retirement program was going to cease at the end of 2014, many LDCs lowered (or removed) their marketing support for the program.
• The end of 2014 saw several events that caused disruption in the Appliance Retirement program. ARCA Canada Inc., the provincial administrator and pick-up agent of appliances, had lowered internal staffing requirements.
3.2.1.2 Appliance Exchange Initiative (Exhibit E)
Initiative Activities/Progress: All residential programs were advertised through an online For Home and that link to the For Home section of the saveONenergy website in 2014. However, retailers in West Coast Huron Energy’s service area were again not active in this initiative. West Coast Huron Energy continues to rely on results from exchange events held in other centers – which required our customers to travel, in order to participate in this initiative.
Additional Comments:
• The design of the initiatives, including eligible measures and incentives amounts are developed through the Residential Working Group. Retail partner(s) are contracted by the IESO to deliver the initiatives province-wide. Individual LDCs have the opportunity to stage in-store events to drive the distribution of LDC coded coupons and promotion of other programs in the portfolio
• This initiative, eligible measures and incentive amounts are influenced by the retail partner with very limited involvement from the LDCs. The restrictive, limited and sometimes non-participation of local stores can diminish the savings potential for this initiative.

West Coast Huron Energy 2014 CDM Annual Report
16
• To date there has only been one retailer participant in the Appliance Exchange Initiative.
• Evaluation, Measurement, and Verification (“EM&V”) results indicated that the value of savings for retired room air conditioners (“AC”) has dropped resulting in the retail participant not accepting window ACs during the Spring 2013 event.
• Notification to LDCs regarding retailer participation and eligible measures continues to be delayed. Improved communications will aid in appropriate resource allocation and marketing of the initiative.
• This initiative may benefit from the disengagement of the retailer and allowing LDCs to conduct these events, possibly as part of a larger community engagement effort, with the backing of the IESO’s contractor for appliance removal.
• The initiative appears to require more promotion from retailers and LDCs.
3.2.1.3 HVAC Incentives Initiative (Exhibit B)
Initiative Activities/Progress: The HVAC Program continues to be promoted through the OPA designed For Home brochures and online For Home ads. Most activity to date has been generated by channel partners and advertising done by the OPA.
Additional Comments:
• Incentive levels appear to be insufficient to prompt participants to upgrade HVAC equipment prior to end of useful life. An Air Miles incentive was introduced in 2013 to try and encourage early replacement.
• This initiative is contractor driven with LDCs responsible for marketing efforts to customers. More engagement with the HVAC contractor channel should be undertaken to drive a higher proportion of furnace and central air conditioner sales to eligible units.
• There are cases where non-participating contractors are offering their own incentives (by discounting their installations to match the value of the IESO incentive) to make the sale. As this occurs outside of the initiative, savings are not credited to LDCs. IESO should consider this in future program impact evaluation studies.
• Changes to the schedules in 2014 to allow for incentives for new installations, rather than strictly replacement units, may prove to be effective in providing greater results, increasing provincial participation by 20% over 2013.
3.2.1.4 Conservation Instant Coupon Initiative (Exhibit A)
Initiative Activities/Progress: West Coast Huron Energy promoted the annual coupons with an E-blast advertisement to Goderich’s BIA and Chamber of Commerce. The E-blast listed the local participating retailers. The Annual Coupons also continue to be promoted through the OPA designed For Home brochures, online For Home ads and printed LED coupons at the Front Counter CDM program information display.
Additional Comments:

West Coast Huron Energy 2014 CDM Annual Report
17
• The timeframe for retailer submission of redeemed coupons vary from retailer to retailer, and in some cases has been lengthy. The delays and incomplete results reporting limits the ability to react and respond to initiative performance or changes in consumer behaviour.
• The product list could be distinctive from the Bi-Annual Retailer Event Initiative in order to gain more consumer interest and uptake.
• Program evolution, including new products and review of incentive pricing for the coupon initiatives, should be a regular activity to ensure continued consumer interest.
• All coupons have been provided with LDC custom coding in 2014 which allows LDCs to promote coupons based on local preferences. However, LDCs were not provided with customer coded coupon results until early 2015 and thus, had no indication of their redemption rates.
• Consumer experience varies amongst retailers offering coupon discounts which can limit redemptions. For example, a particular high volume ‘participating retailer’ does not accept coupons and have their own procedure. In addition, some retailers have static lists of eligible products and will not discount eligible products unless the product on the list.
• The saveONenergy programs would benefit from specific end cap displays, aisle product stands and product-specific areas. Having products throughout a retail environment weakens the impact.
3.2.1.5 Bi-Annual Retailer Event Initiative (Exhibit C)
Initiative Activities/Progress: West Coast Huron Energy encourages participation in this program through E-blasts to the Town’s BIA and Chamber of Commerce, listing the local participating retailers. OPA event posters are also displayed at the office to remind users of the office and foot traffic on the street, in front of the office, of the coupon event.
Additional Comments:
• This initiative is strongly influenced by the retail participants and has no direct involvement from the LDCs.
• LDCs have the opportunity to stage in-store events to drive the distribution of LDC-coded coupons and promotion of other programs in the portfolio; however, this requires cooperation from the local retailer and LDC staff resources.
• The product list has had minimal changes over the past four years.
• Limited engagement of local retailers can restrict the savings potential for this initiative.
• Program evolution, including new products and review of incentive pricing for the coupon initiatives, must be a regular activity to ensure continued consumer interest.
• The product list could be distinctive from the Conservation Instant Coupon Initiative in order to gain more consumer interest and uptake.

West Coast Huron Energy 2014 CDM Annual Report
18
• A review conducted by the EDA Residential Working Group in 2011 identified three areas of need for initiative evolution: 1) introduction of product focused marketing; 2) enhanced product selection; and 3) improved training for retailers as retail staffs tend not to be knowledgeable regarding the products or promotion.
• This initiative may benefit from a more exclusive relationship with a retailer appropriate to the program. There should be a value proposition for both the retailer and LDC.
• Independently, the Retailer Co-op and Bi-Annual Retailer Event Initiative may not present a value for the investment of LDC resources to support these events and should be backed by a strong residential portfolio.
3.2.1.6 Retailer Co-op
Initiative Activities/Progress: Due to limited staff resources, West Coast Huron Energy did not actively pursue this initiative in 2014.
Additional Comments:
• This is a retailer initiative with no direct benefit to LDCs • Limited engagement of local retailers can restrict the savings potential for this initiative. • The availability of retailer and/or LDC staff with product knowledge and the ability to conduct demonstration in store
during the events would be an asset. This could be a valuable role for LDCs, however many LDCs are limited by available resources and unable to participate.
3.2.1.7 New Construction Program (Schedule B-2)
Initiative Activities/Progress: West Coast Huron Energy’s service territory usually has been very limited in new building construction, limiting the opportunity of this initiative in 2014. However, all residential programs were advertised through an online For Home ad that linked to the For Home section of the saveONenergy website in 2014.
Additional Comments:
• This initiative provides incentives to home builders for incorporating energy efficiency into their buildings. To support this, LDCs need to provide education to consumers regarding the importance of choosing the energy efficient builder upgrade options without an immediate benefit to the consumer.
• In 2012 the application process was streamlined, however continues to be too cumbersome for builders. This, combined with limited return, has resulted in this initiative continuing to under-achieve.
• Administrative requirements, particularly with individual home modeling, must align with perceived stakeholder payback.
• The addition of LED light fixtures, application process improvement, and moving the incentive from the builder to the home-owner may increase participation.

West Coast Huron Energy 2014 CDM Annual Report
19
• This initiative may benefit from collaboration with the natural gas utilities.
3.2.1.8 Residential Demand Response Program (Schedule B-3)
Initiative Activities/Progress: The RFP was released late in 2012 to engage providers and to finalize technology to commence the delivery of the program in 2013. It was anticipated that the initial year would allow any technology issues to be resolved, marketing of the program to begin and initial installations. The bulk of the installations were expected to occur in 2014. Further complicating this initiative in 2014, was the need to terminate installation dates as winter arrived early, hampering our installers ability to install switches.
West Coast Huron Energy took a very aggressive marketing approach in 2014 for the peaksaver PLUS; approximately 166 radio ads were heard during the months of May – July on 104.9 The Beach; and a local printing company was instructed to print and mail approximately 3,520 direct mailers in October.
Additional Comments:
• Energy and demand savings have not been reported for the IHD portion of the program as 2013 EM&V results have determined zero savings associated with the IHD. IESO conducted another study in 2014, expanding its study territory beyond those included in the 2013 study to provincial rather than regional results. Results from the second study have not yet been announced. The demand savings associated with the control device has been included in this report.
• The variable funding associated with installing a load controllable thermostat is not sufficient unless it is combined with an IHD. This might not be possible at all times or when IHD is optional.
• Smart meters installed by most LDCs do not have the capability to communicate directly to an IHD and any mass replacement of newly installed meters with communicating abilities is not fiscally responsible. When proposing technical initiatives that rely on existing LDC infrastructure or technology there should be an extensive consultative process in order to prevent this type of problem in the future.
• Introduction of new technology requires incentives for the development of such technology. Appropriate lead times for LDC analysis and assessment, product procurement, and testing and integration into the smart meter environment are also required. Making seemingly minor changes to provincial technical specifications can create significant issues when all LDCs attempt to implement the solution in their individual environments.
• Given the different LDCs’ smart meter environments and needs, each LDC is positioning the initiative with subtle differences. As such, greater program flexibility is required to address unique LDC needs
West Coast Huron Energy 2014 CDM Annual Report
20
3.2.2 COMMERCIAL AND INSTITUTIONAL PROGRAM
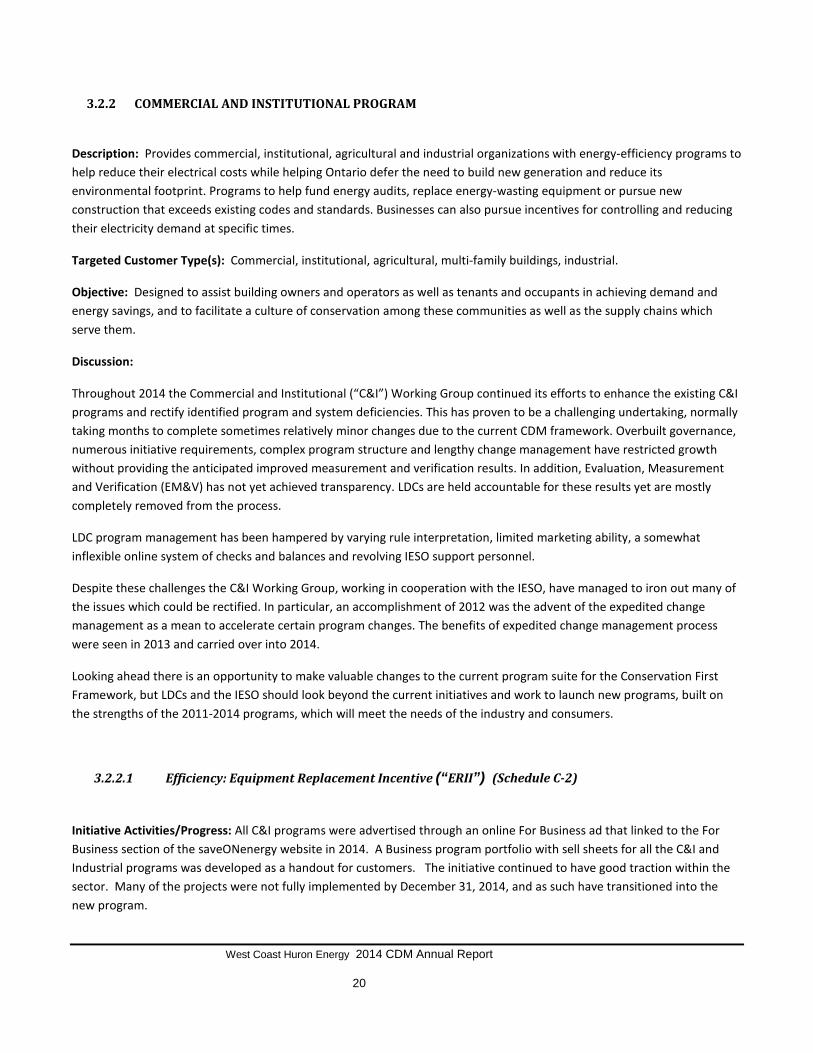
Description: Provides commercial, institutional, agricultural and industrial organizations with energy-efficiency programs to help reduce their electrical costs while helping Ontario defer the need to build new generation and reduce its environmental footprint. Programs to help fund energy audits, replace energy-wasting equipment or pursue new construction that exceeds existing codes and standards. Businesses can also pursue incentives for controlling and reducing their electricity demand at specific times.
Targeted Customer Type(s): Commercial, institutional, agricultural, multi-family buildings, industrial.
Objective: Designed to assist building owners and operators as well as tenants and occupants in achieving demand and energy savings, and to facilitate a culture of conservation among these communities as well as the supply chains which serve them.
Discussion:
Throughout 2014 the Commercial and Institutional (“C&I”) Working Group continued its efforts to enhance the existing C&I programs and rectify identified program and system deficiencies. This has proven to be a challenging undertaking, normally taking months to complete sometimes relatively minor changes due to the current CDM framework. Overbuilt governance, numerous initiative requirements, complex program structure and lengthy change management have restricted growth without providing the anticipated improved measurement and verification results. In addition, Evaluation, Measurement and Verification (EM&V) has not yet achieved transparency. LDCs are held accountable for these results yet are mostly completely removed from the process.
LDC program management has been hampered by varying rule interpretation, limited marketing ability, a somewhat inflexible online system of checks and balances and revolving IESO support personnel.
Despite these challenges the C&I Working Group, working in cooperation with the IESO, have managed to iron out many of the issues which could be rectified. In particular, an accomplishment of 2012 was the advent of the expedited change management as a mean to accelerate certain program changes. The benefits of expedited change management process were seen in 2013 and carried over into 2014.
Looking ahead there is an opportunity to make valuable changes to the current program suite for the Conservation First Framework, but LDCs and the IESO should look beyond the current initiatives and work to launch new programs, built on the strengths of the 2011-2014 programs, which will meet the needs of the industry and consumers.
3.2.2.1 Efficiency: Equipment Replacement Incentive (“ERII”) (Schedule C-2)
Initiative Activities/Progress: All C&I programs were advertised through an online For Business ad that linked to the For Business section of the saveONenergy website in 2014. A Business program portfolio with sell sheets for all the C&I and Industrial programs was developed as a handout for customers. The initiative continued to have good traction within the sector. Many of the projects were not fully implemented by December 31, 2014, and as such have transitioned into the new program.

West Coast Huron Energy 2014 CDM Annual Report
21
Additional Comments:
• A large proportion of LDC savings are attributed to ERII.
• Capability building programs from industrial programs have had very positive contributions to ERII program.
• A number of customer-facing issues in iCon (the IESO’s centralized application system) have been resolved; however, key LDC administrative back office processing issues continue to be a challenge. For example, currently LDCs are unable to record back office information to complete review and approval process using iCon.
• Applicants and applicant representatives continue to express dissatisfaction and difficulty with the online application system. This issue has been addressed by LDCs through application training workshops, Key Account Managers (“KAMs”), channel partner/contractor training and LDC staff acting as customer application representatives. Although this has been an effective method of overcoming these issues and encouraging submissions, it also reflects on the complexity and time consuming nature of the application process. As such, applicant representatives continue to influence the majority of applications submitted. Continued development of channel partners is essential to program success.
• Lighting is still the most popular measure. Other market sectors are not as engaged yet, specifically the mechanical sector. There continues to be significant barriers to program participation from HVAC (Unitary AC) and compressed air channel partners
• Prescriptive and engineered worksheets provide a much needed simplified application process for customers. However, the eligible measures need to be updated and expanded in both technology and incentive amounts to address changing product costs and evolution of the marketplace.
• A focus on demand incentives has limited some energy project opportunities. In particular, night lighting projects have significant savings potential for customers but tend to have incentives of 10% or less of project cost.
• The requirement to have a customer invoice the LDC for their incentive is very burdensome for the customer and results in a negative customer experience and another barrier to participation.
• There is redundancy in the application process as customers may need to complete a worksheet and then enter most of that information over to the online application form. This can be cumbersome.
• Processing head office application became much easier for the lead LDC after schedule changes came into effect in August 2013. The changes implemented allowed the lead LDC to review and approve all facilities in a head office application on behalf of all satellite LDCs under certain circumstances.
• The application process for head office projects remains a significant barrier. Applicants need to manually enter one application per facility associated with the project which can be extremely onerous, often requiring a dedicated resource.
• Streamlining of the settlements systems resulted in significant improvement in the payment process in 2013.
• IESO implemented a cut-off date of July 31, 2014 for approval of 2014 social housing adder (SHA) under ERII program. IESO had instructed that any SHA applications that will be submitted to IESO after July 31, 2014 will not be honored for SHA, however, they failed to mention that it is the timeline to submit the funding request to the IESO by the LDCs and

West Coast Huron Energy 2014 CDM Annual Report
22
not the submission date of the applications to IESO’s ICON system by the Applicant (Customer). As a result there were some confusions and some of the applications that were submitted to IESO’s iCON by July 31, 2014 but LDCs submitted the funding request to IESO at a later date (once LDCs have completed review of the applications) were not honored for SHA. Additionally, the formal letter confirming that the SHA annual allocation has been exceeded was received by conservation officers on July 15, 2014 leaving them only 15 days to inform the customers and this created a negative customer experience.
• The handling of the exterior lighting incentives was a negative customer experience. In the fall of 2014 a new section was introduced in the prescriptive Lighting worksheet. It offered generous incentives for some exterior lighting projects and many municipal customers took advantage of the available incentives. Within 2 weeks of introducing the incentives, several incentives were suddenly removed for approximately 6 weeks until new incentives were created due to $/kWh incentive being too high for some of the measures. This caused a negative customer experience in several ways:
o Some customers were planning on applying for rebates exterior prescriptive lighting measures based on the incentives offered but were suddenly not allowed to apply for prescriptive rebates.
o The length of time from pulling out the exterior prescriptive lighting incentives to offering new incentives was too long. There should have been a temporary incentive level offered to allow LDCs to take in new applications.
o The incentives should have been introduced at an appropriate level the first time. While market conditions can change, the incentives offered should have been researched and approved with the expectation that they would be in place for at least 6-12 months.
• Introduction of several new prescriptive measure worksheets including Plug Loads and Refrigeration were introduced in September 2014 allowed for new opportunities, albeit late in the framework.
• The Ministerial Directive provides continuity of the conservation programs for the participant, with clear direction on LDC administrative funding for 2015, which helps to avoid a gap in program delivery.
3.2.2.2 Direct Install Initiative (“DIL”) (Schedule C-3)
Initiative Activities/Progress: Contractors registered with West Coast Huron Energy’s third party program operator tend to encourage and receive more participation then the e-blasts sent out to the business community (BIA and Chamber of Commerce) by the LDC. West Coast Huron continued to promote the program in 2014 through sell sheets, online ads and e-blasts.
Additional Comments:
• LED lighting was introduced in 2013 as a new measure and has been well received by customers who may not have previously qualified for DIL eligible upgrades. This is an efficient product with a long estimate useful life.
• Cold start high output lighting was removed from the program. This particularly affected the farming customers who now have limited options within the program.

West Coast Huron Energy 2014 CDM Annual Report
23
• Successful execution of the previous version of this initiative has resulted in reduced potential for the 2011-2014 initiative in some LDC’s territories.
• The inclusion of a standard incentive for additional measures increased project size and drove higher energy and demand savings results in some situations. However, LDCs are unable to offer these standard incentives to prior participants. The ability to return to prior participants and offer a standard incentive on the remaining measures has potential to provide additional energy and demand savings.
• Many customers are not taking advantage of any additional measures, which may present an opportunity to for future savings with a new program offering.
3.2.2.3 Existing Building Commissioning Incentive Initiative (Schedule C-6)
Initiative Activities/Progress: General promotion of this initiative with similar programs was utilized. The opportunity for this initiative is limited in West Coast Huron Energy’s service territory.
Additional Comments:
• Initiative name does not properly describe the initiative.
• There was minimal participation for this initiative. It is suspected that the lack of participation in the program is a result of the initiative being limited to space cooling and a limited window of opportunity (cooling season) for participation.
• Participation is mainly channel partner driven, however the particulars of the initiative have presented too much of a significant barrier for many channel partners to participate.
• The customer expectation is that the program be expanded to include a broader range of measures for a more holistic approach to building recommissioning and chilled water systems used for other purposes should be made eligible and considered through change management.
• This initiative should be reviewed for incentive alignment with ERII, as currently a participant will not receive an incentive if the overall payback is less than 2 years.
3.2.2.4 New Construction and Major Renovation Initiative (“HPNC”) (Schedule C-4)
Initiative Activities/Progress:
This program is dependent upon the type of development and renovations proposed in the service territory. Development is monitored to determine projects available for this program.

West Coast Huron Energy 2014 CDM Annual Report
24
Additional Comments
• With the Ministerial Directive issued December 21, 2012, facilities with a completion date near the end of 2014 with some confidence that they will be compensated for choosing efficiency measures.
• Participants have until the end of 2014 to submit their applications for the projects that will be completed in 2015. However savings achieved will be accounted for in the new framework (2015 - 2020).
• The custom application process requires considerable customer support and skilled LDC staff. The effort required to participate through the custom stream exceeds the value of the incentive for many customers.
• There are no custom measure options for items that do not qualify under the prescriptive or engineered track as the custom path does not allow for individual measures, only whole building modelling.
•The requirement to have a customer invoice the LDC for their incentive is very burdensome for the customer and results in a negative customer experience and a potential barrier to participation.
3.2.2.5 Energy Audit Initiative
Initiative Activities/Progress: The audit program has been promoted in site visits and customer information sessions. It is realized the planning window may take some time for customers to implement. In addition, the assistance of the REM may increase the audit applications.
• The introduction of the new audit component for one system (i.e. compressed air), has increased customer participation.
• The energy audit Initiative is considered an ‘enabling’ initiative and ‘feeds into’ other saveONenergy initiatives.
• LDCs are receiving some savings towards their targets from an audit which is mainly attributable to operational savings.
• Audit reports from consultants vary considerably and in some cases, while they adhere to the initiative requirements, do not provide value for the participant. A standard template with specific energy saving calculation requirements should be considered.
• Customers look to the LDCs to recommend audit companies. A centralized prequalified list provided by the IESO may be beneficial.
• Participants are limited to one energy audit which restricts enabling and direction to the other initiatives. This has been revised in 2014 and LDCs are now able to consider additional customer participation when presented with a new scope of work.
• Consideration should be given to allowing a building owner to undertake an audit limited to their lighting system. This way they may receive valuable information from a neutral third party regarding the appropriate lighting solution for their facility instead of what a local supplier would like to sell.
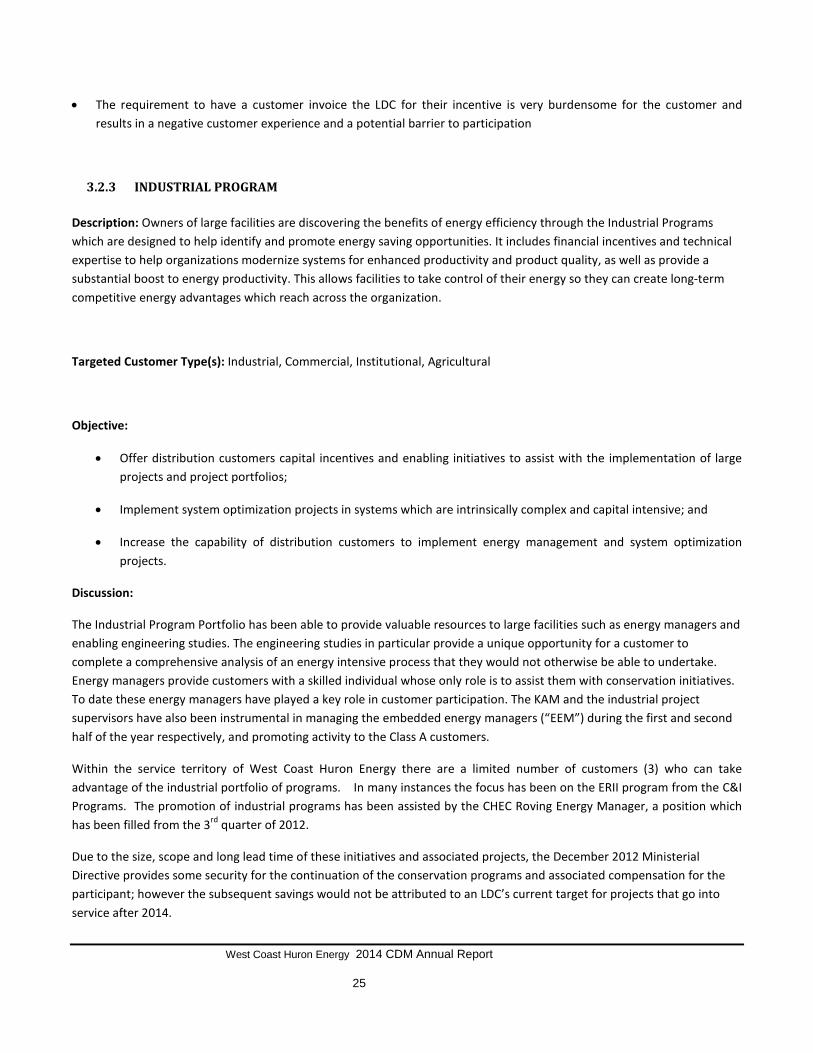
West Coast Huron Energy 2014 CDM Annual Report
25
• The requirement to have a customer invoice the LDC for their incentive is very burdensome for the customer and results in a negative customer experience and a potential barrier to participation
3.2.3 INDUSTRIAL PROGRAM Description: Owners of large facilities are discovering the benefits of energy efficiency through the Industrial Programs which are designed to help identify and promote energy saving opportunities. It includes financial incentives and technical expertise to help organizations modernize systems for enhanced productivity and product quality, as well as provide a substantial boost to energy productivity. This allows facilities to take control of their energy so they can create long-term competitive energy advantages which reach across the organization.
Targeted Customer Type(s): Industrial, Commercial, Institutional, Agricultural
Objective:
• Offer distribution customers capital incentives and enabling initiatives to assist with the implementation of large projects and project portfolios;
• Implement system optimization projects in systems which are intrinsically complex and capital intensive; and
• Increase the capability of distribution customers to implement energy management and system optimization projects.
Discussion:
The Industrial Program Portfolio has been able to provide valuable resources to large facilities such as energy managers and enabling engineering studies. The engineering studies in particular provide a unique opportunity for a customer to complete a comprehensive analysis of an energy intensive process that they would not otherwise be able to undertake. Energy managers provide customers with a skilled individual whose only role is to assist them with conservation initiatives. To date these energy managers have played a key role in customer participation. The KAM and the industrial project supervisors have also been instrumental in managing the embedded energy managers (“EEM”) during the first and second half of the year respectively, and promoting activity to the Class A customers.
Within the service territory of West Coast Huron Energy there are a limited number of customers (3) who can take advantage of the industrial portfolio of programs. In many instances the focus has been on the ERII program from the C&I Programs. The promotion of industrial programs has been assisted by the CHEC Roving Energy Manager, a position which has been filled from the 3rd quarter of 2012.
Due to the size, scope and long lead time of these initiatives and associated projects, the December 2012 Ministerial Directive provides some security for the continuation of the conservation programs and associated compensation for the participant; however the subsequent savings would not be attributed to an LDC’s current target for projects that go into service after 2014.
West Coast Huron Energy 2014 CDM Annual Report
26
Extensive legal documents, complex program structure and lengthy change management have restricted the change and growth of this portfolio. While the expedited change management has benefited the commercial portfolio, the industrial portfolio has not seen the same results due to the narrow scope of the process. For 2013 the change to the threshold for small capital projects and the new small capital project agreement improved the number of projects and savings achieved within Process and Systems Upgrades Initiation (“PSUI”). Likewise, a decision to proceed with applications for natural gas load displacement generation projects also increase uptake, although the limited time to bring new projects into service is a barrier.
3.2.3.1 Process and Systems Upgrades Initiative (“PSUI”) (Schedule D-1)
Initiative Activities/Progress: West Coast Huron Energy has had only a few applications for PSUI to date. It is anticipated that if this initiative is a viable option for our customers, the REM would advise the customer during his site visit.
Additional Comments:
• Numerous energy studies have been submitted and completed. This is a strong indication that there is potential for large projects with corresponding energy savings. Most of these studies have been initiated through Energy Manager and Key Account Manager (“KAM”) resources.
• This initiative is limited by the state of the economy and the ability of a facility to complete large capital upgrades.
• There is typically a long sales cycle for these projects, and a long project development cycle. As such, limited results are expected to be generated in 2014. The majority of the results are expected in 2015 with a much reduced benefit to cumulative energy savings targets.
• Delays with processing funding payments have caused delayed payments to participants beyond contract requirements. In some cases, LDCs have developed a separate side agreement between the LDC and participant acknowledging that the participant cannot be paid until the funds are received.
• Given the size of the projects involved, the contract required for PSUI is a lengthy and complicated document. A key to making PSUI successful is the new agreement for ‘small’ projects with simplified and less onerous conditions for the customer.
• To partially address this, changes were made to the ERII program which allowed smaller projects to be directed to the commercial stream. Most industrial projects to-date has been submitted as ERII projects due to less onerous contract and M&V requirements. Therefore, PSUI engineering studies and LDC’s industrial resources (e.g., Energy managers, KAMs) contribute significant savings to other programs such as ERII.
• A business case was submitted by the Industrial Working Group in July 2012 which changed the limit for a small project from 700 MWh to 1 million dollars in incentives. This would allow more projects to be eligible for the new small capital project agreement and increase participant uptake, while still protecting the ratepayer. This small capital project agreement was finalized through change management in September 2013.
• With the considerable customer interest in on-site load displacement (co-generation) projects, the initiative should be reviewed to ensure that these projects may be accepted as part of the PSUI Initiative. The IESO was reviewing waste heat projects only and all other co-generation projects were on hold prior to June 2013, when a decision was made to allow natural gas load displacement generation projects to proceed under PSUI. It is expected that a number of

West Coast Huron Energy 2014 CDM Annual Report
27
projects may proceed although results may not be counted towards LDC 2011-2014 framework target unless applications are submitted before the end of 2014 and the projects are in service before December 31, 2015.
• The requirement forcustomer invoice to the LDC and provide proof of payment to consultants for their incentive is very burdensome for the customer and results in a negative customer experience and another barrier to participation.
3.2.3.2 Monitoring and Targeting (“M&T”) Initiative (Schedule D-2)
Initiative Activities/Progress: The hiring of a REM for CHEC LDCs assisted with this initiative.
Monitoring and Targeting (M&T) is promoted by the Roving Energy Manager where appropriate.
Additional Comments:
• The M&T initiative is targeted at larger customers with the capacity to review the M&T data. This review requires the customer facility to employ an energy manager, or a person with equivalent qualifications, which has been a barrier for some customers. As such, only five applications has been completed in 2014, province wide.
• The savings target required for this initiative can present a significant challenge for smaller customers.
• Through the change management process in 2013, changes were made to ERII to allow smaller facilities to employ M&T systems.
3.2.3.3 Energy Manager Initiative (Schedule D-3)
Initiative Activities/Progress: The Roving Energy Manager has been actively engaging customers across the CHEC LDCs. Typically the LDC initiates a site visit to introduce the Roving Energy Manager to the company along with the offer of assistance. The Roving Energy Manager has been very successful across the LDCs and provides a significant contribution to the awareness of conservation options and to the evaluation and implementation of programs.
To support the efforts of the Roving Energy Manager, access to the OPA training and other programs has been made available to the REM. This assists in building capacity and will lead to continued good performance in future years.
Additional Comments:
• The Embedded Energy Managers (“EEMs”) have proven to be a popular and useful resource for larger customers. There are approximately 50 EEMs and 22 Roving Energy Managers (“REMs”) being utilized by customers across the province.
• LDCs that are too small to qualify for their own REM are teaming up with other utilities to hire a REM to be shared by the group of utilities.
West Coast Huron Energy 2014 CDM Annual Report
28
• At the beginning, it took longer than expected to set up the energy manager application process and unclear communication resulted in marketing and implementation challenges for many LDCs.
• There have been a number of studies identified by energy managers and they have been able to build capacity and deliver energy savings projects within their respective large commercial/industrial facilities.
• The requirement that 30% of targets must come from non-incented projects is identified as an issue for most EEMs/REMs. The EDA Industrial Working Group has proposed to remove this requirement for REMs only as they are not resident full time at a customer facility to find the non-incented savings.
3.2.3.4 Key Account Manager (Schedule D-4)
Initiative Activities/Progress: The small size of West Coast Huron Energy does not quantify for a Key Account Manager. However, one larger customer may benefit greatly by recruiting a Key Account Manager in the future.
Additional Comments
• Customers appreciate dealing with a single contact to interface with an LDC, a resource that has both the technical and business background who can communicate easily with the customer and the LDC.
• Finding this type of skill set has been difficult. In addition, the short-term contract and associated energy targets discourage some skilled applicants resulting in longer lead times to acquire the right resource.
• This resource has been found by some LDCs to be of limited value due to the part-time nature of the position and limited funding. In addition, the position role has been too narrow in scope to provide assistance to the wider variety of projects with which LDCs may be struggling.

West Coast Huron Energy 2014 CDM Annual Report
29
3.2.3.5 Demand Response 3 (“DR3”) (D-6)
Initiative Activities/Progress: Limited activity in 2014.
Additional Comments:
• Until early 2013, customer data was not provided on an individual customer basis due to contractual requirements with the aggregators. This limited LDCs’ ability to effectively market to prospective participants and confirm savings.
• The Industrial Working Group had a discussion with the IESO and representatives of the Ministry on proposed changes for the DR3 program. No program improvements were made in 2013. However, it was accepted that prior participants who renew their DR3 contract within the 2011-2014 term will contribute to LDC targets.
• As of 2013, aggregators are able to enter into contracts beyond 2014. This has allowed them to offer a more competitive contract price (five years) than the previously limited one- to two-year contracts. However on March 31, 2014 the Minister of Energy issued a directive entitled “Continuance of the IESO’s Demand Response Program under IESO management” which restricts the IESO from granting any more contract schedules to aggregators, as the program is being transitioned from the OPA to the IESO. This decision will prevent the DR3 program from continuing to grow until the IESO is ready to assign DR3 capacity through a new auction process.
• Metering and settlement requirements are complicated and can reduce customer compensation amounts, and present a barrier to some customers.
• Compensation amounts have been reduced from the previous version of this program and subsequently there has been a corresponding decrease in renewal rates.
3.2.4 LOW INCOME INITIATIVE (HOME ASSISTANCE PROGRAM) (Schedule E-1) Initiative Activities/Progress: The program was in market for the entire year. However, our County Housing Authority management team did not like the Terms and Conditions surrounding liability of this initiative, and therefore would not engage in the program.
Additional Comments:
• The process for enrolling in social housing was complicated and time consuming. This was addressed in late 2012 and showed benefits since 2013.
• The financial scope, complexity, and customer privacy requirements of this initiative are challenging for LDCs and most have contracted this program out. This initiative may benefit from an IESO contracted centralized delivery agent.
3.2.5 PRE-2011 PROGRAMS Savings were realized towards LDC’s 2011-2014 target through pre-2011 programs. The targeted customer types, objectives, descriptions, and activities of these programs are detailed in Appendix B

West Coast Huron Energy 2014 CDM Annual Report
30
4 2014 LDC CDM Results
4.1 Participation and Savings Table 1: West Coast Huron Energy Inc. Initiative and Program Level Net Savings by Year
2014 Net Annual Peak Demand Savings (kW)
2011-2014 Net Cumulative Energy
Savings (kWh)2011* 2012* 2013* 2014 2011 2012 2013 2014 2011 2012 2013 2014 2014 2014
Consumer ProgramAppliance Retirement Appliances 60 80 55 62 4 5 4 4 25,947 31,765 22,920 26,452 16 271,274Appliance Exchange Appliances 7 5 12 13 1 1 2 3 1,299 1,388 4,433 4,803 7 22,827HVAC Incentives Equipment 34 32 29 58 11 8 7 15 22,497 14,586 12,760 28,897 41 188,161Conservation Instant Coupon Booklet Items 331 20 227 680 1 0 0 1 12,172 913 5,035 18,540 3 80,038Bi-Annual Retailer Event Items 622 693 617 3,152 1 1 1 5 19,198 17,496 11,223 80,291 8 232,019Retailer Co-op Items 0 0 0 0 0 0 0 0 0 0 0 0 0 0Residential Demand Response Devices 0 0 0 39 0 0 0 13 0 0 0 0 13 0Residential Demand Response (IHD) Devices 0 0 0 27 0 0 0 0 0 0 0 0 0 0Residential New Construction Homes 0 0 0 0 0 0 0 0 0 0 0 0 0 0
Consumer Program Total 18 15 14 42 81,113 66,148 56,372 158,982 88 794,319
Business ProgramRetrofit Projects 3 6 9 12 6 23 28 138 63,237 79,195 144,013 690,126 196 1,468,683Direct Install Lighting Projects 17 9 16 29 17 10 19 34 42,683 35,734 67,628 124,151 76 527,876Building Commissioning Buildings 0 0 0 0 0 0 0 0 0 0 0 0 0 0New Construction Buildings 0 0 0 0 0 0 0 0 0 0 0 0 0 0Energy Audit Audits 0 0 0 0 0 0 0 0 0 0 0 0 0 0Small Commercial Demand Response Devices 0 0 0 1 0 0 0 1 0 0 0 0 1 0Small Commercial Demand Response (IHD) Devices 0 0 0 0 0 0 0 0 0 0 0 0 0 0Demand Response 3 Facil ities 0 1 1 1 0 25 25 24 0 365 340 0 24 705
Business Program Total 23 58 73 196 105,919 115,294 211,981 814,277 296 1,997,264
Industrial ProgramProcess & System Upgrades Projects 0 0 0 0 0 0 0 0 0 0 0 0 0 0Monitoring & Targeting Projects 0 0 0 0 0 0 0 0 0 0 0 0 0 0Energy Manager Projects 0 0 1 1 0 0 0 0 0 0 0 2,269 0 2,269Retrofit Projects 0 0 0 0 0 0 0 0 0 0 0 0 0 0Demand Response 3 Facil ities 0 0 0 0 0 0 0 0 0 0 0 0 0 0
Industrial Program Total 0 0 0 0 0 0 0 2,269 0 2,269
Home Assistance ProgramHome Assistance Program Homes 0 0 17 4 0 0 0 1 0 0 2,643 4,810 1 10,019
Home Assistance Program Total 0 0 0 1 0 0 2,643 4,810 1 10,019
Aboriginal ProgramHome Assistance Program Homes 0 0 0 0 0 0 0 0 0 0 0 0 0 0
Direct Install Lighting Projects 0 0 0 0 0 0 0 0 0 0 0 0 0 0
Aboriginal Program Total 0 0 0 0 0 0 0 0 0 0
Pre-2011 Programs completed in 2011Electricity Retrofit Incentive Program Projects 3 0 0 0 52 0 0 0 300,753 0 0 0 52 1,203,013
High Performance New Construction Projects 0 0 0 0 0 0 0 0 550 72 0 0 0 2,415
Toronto Comprehensive Projects 0 0 0 0 0 0 0 0 0 0 0 0 0 0
Multifamily Energy Efficiency Rebates Projects 0 0 0 0 0 0 0 0 0 0 0 0 0 0
LDC Custom Programs Projects 0 0 0 0 0 0 0 0 0 0 0 0 0 0
Pre-2011 Programs completed in 2011 Total 52 0 0 0 301,303 72 0 0 52 1,205,428
OtherProgram Enabled Savings Projects 0 0 0 0 0 0 0 0 0 0 0 0 0 0
Time-of-Use Savings Homes 0 0 0 n/a 0 0 0 36 0 0 0 0 36 0
LDC Pilots Projects 0 0 0 0 0 0 0 0 0 0 0 0 0 0
Other Total 0 0 0 36 0 0 0 0 36 0
Adjustments to 2011 Verified Results 0 0 0 733 0 0 0 2,934
Adjustments to 2012 Verified Results 0 0 5 0 0 16
Adjustments to 2013 Verified Results 1 14,482 1 29,016
Energy Efficiency Total 93 48 61 238 488,336 181,149 270,656 980,338 435 4,008,594
Demand Response Total (Scenario 1) 0 25 25 38 0 365 340 0 38 705
Adjustments to Previous Years' Verified Results Total 0 0 0 1 0 733 5 14,482 1 31,966
OPA-Contracted LDC Portfolio Total (inc. Adjustments) 93 72 87 276 488,336 182,247 271,002 994,821 474 4,041,265
880 8,280,000
53.8% 48.8%
*Includes adjustments after Final Reports were issued
Results presented using scenario 1 which assumes that demand response resources have a persistence of 1 year
Program-to-Date Verified Progress to Target (excludes DR)
Initiative Unit
Incremental Activity (new program activity occurring within the specified
reporting period)
Net Incremental Peak Demand Savings (kW) (new peak demand savings from activity within the
specified reporting period)
Net Incremental Energy Savings (kWh)(new energy savings from activity within the specified
reporting period)
% of Full OEB Target Achieved to Date (Scenario 1):
Full OEB Target:Activi ty and savings for Demand Response resources for each year represent the savings from a l l active faci l i ties or devices contracted s ince January 1, 2011 (reported cumulatively).

West Coast Huron Energy 2014 CDM Annual Report
31
Table 4 and 5:
Table 4 and 5 has been removed from the standard report template. Program results can be found in the chart above. Net savings are illustrated in the chart above. Gross figures have not been presented as the measures towards target are the net savings. Standard E&V methods have been applied by the OPA to determine the net figures which are outlined in this report.

West Coast Huron Energy 2014 CDM Annual Report
32
Table 6: Summarized 2014 Program Results
Program
Gross Savings Net Savings Contribution to Targets
Incremental Peak Demand Savings (MW)
Incremental Energy Savings
(GWh)
Incremental Peak Demand Savings (MW)
Incremental Energy Savings
(GWh)
Program-to-Date: Net Annual Peak Demand Savings
(MW) in 2014
Program-to-Date: 2011-2014 Net
Cumulative Energy Savings (GWh)
Consumer Program Total 0.063 0.183 0.042 0.158 0.088 0.794
Business Program Total 0.272 1.152 0.196 0.814 0.296 1.997
Industrial Program Total 0.001 0.003 0.00 0.002 0.00 0.002
Home Assistance Program Total 0.001 0.005 0.001 0.005 0.001 0.010
Pre-2011 Programs completed in 2011 Total 0.00 0.00 0.00 0.000 0.052 1.205
Time Of Use Savings 0.036 0.000 0.036 0.000 0.036 0.000
Other Adjustments to Previous Year’s Verified Results
0.00 0.016 0.010 0.014 0.001 0.032
Total IESO Contracted Province-Wide CDM Programs
0.373 1.358 0.276 0.995 0.474 4.041
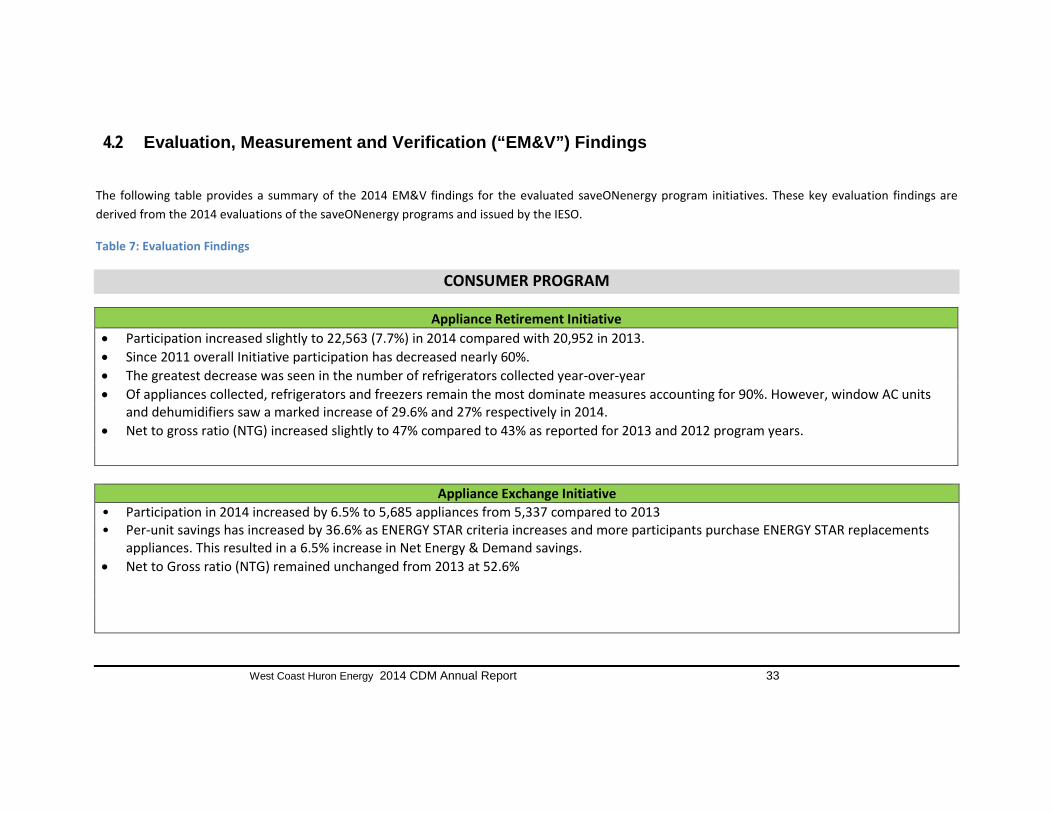
West Coast Huron Energy 2014 CDM Annual Report 33
4.2 Evaluation, Measurement and Verification (“EM&V”) Findings
The following table provides a summary of the 2014 EM&V findings for the evaluated saveONenergy program initiatives. These key evaluation findings are derived from the 2014 evaluations of the saveONenergy programs and issued by the IESO.
Table 7: Evaluation Findings
CONSUMER PROGRAM
Appliance Retirement Initiative • Participation increased slightly to 22,563 (7.7%) in 2014 compared with 20,952 in 2013. • Since 2011 overall Initiative participation has decreased nearly 60%. • The greatest decrease was seen in the number of refrigerators collected year-over-year • Of appliances collected, refrigerators and freezers remain the most dominate measures accounting for 90%. However, window AC units
and dehumidifiers saw a marked increase of 29.6% and 27% respectively in 2014. • Net to gross ratio (NTG) increased slightly to 47% compared to 43% as reported for 2013 and 2012 program years.
Appliance Exchange Initiative
• Participation in 2014 increased by 6.5% to 5,685 appliances from 5,337 compared to 2013 • Per-unit savings has increased by 36.6% as ENERGY STAR criteria increases and more participants purchase ENERGY STAR replacements
appliances. This resulted in a 6.5% increase in Net Energy & Demand savings. • Net to Gross ratio (NTG) remained unchanged from 2013 at 52.6%

West Coast Huron Energy 2014 CDM Annual Report 34
Heating and Cooling Initiative • In 2014 net savings increased by 20% from 2013 and overall participation increased by 17% to 113,002 compared to 2013 • The ECM measure has remained the dominant source of savings since 2011 • Per unit furnace savings increased 12.7% due to a shift in the number of participants who use their furnace fan continuously both before
and after the retrofit. • Per unit energy and demand savings assumptions for central air conditioners decreased by 56% due to reduced run hours • Net to Gross ratio (NTG) remained unchanged from 2013 at 48%
Annual Coupons
• Customers redeemed more than five times as many annual coupons in 2014 as in 2013. In total, approximately 500, 000 Annual Coupons were redeemed in 2014 with 110,000 being LDC Coded Coupons.
• There was a further reduction in savings for lighting measures from changes in the baseline due to the phase out of 72W and 100W incandescent bulbs.
• Despite the significant per unit savings reductions for lighting measure, the Net Annual Savings from Annual Coupons in 2014 was more than six times that in 2013. This is primarily because of higher participation and the inclusion of LED coupons and full year availability of all coupons.
• Measured NTG ratios grew significantly in 2014. The NTG ratio is 53% higher in 2014 than in 2013 due to the inclusion of participant spillover, i.e., purchase of additional coupon initiative measures and general energy efficient measures without the use of a coupon but influenced by the coupon program.
Bi-Annual Coupon Events
• Over 2.5 million coupons were redeemed in 2014 compared with 2013 redemptions • The Bi-Annual Coupon Event saw a substantial increase in the number of coupons redeemed during the Spring and Fall Events in 2014
compared to 2013. The increase can be linked to a substantial increase in LED purchases with event coupons accounting for 84% of all Bi-Annual Coupons redeemed.
• Reductions in per unit savings were overshadowed by the increase in coupon redemptions. Overall savings increased by approximately 85% in 2014 compared with 2013 Demand and Energy Savings.
• Similar to the Annual Coupon Event measured NTG ratios rose by 53% compared to 2013 NTG ratios. The rise is due to the inclusion of participant spillover, i.e., purchase of additional coupon initiative and general energy efficient measures without the use of a coupon but

West Coast Huron Energy 2014 CDM Annual Report 35
influenced by the Bi-Annual Coupon event.
peaksaverPLUS • There were an additional 55,000 CAC load control devices enrolled in the program in 2014 relative to 2013, which increased the capacity
of the residential segment of the program from 129 MW in 2013 to 143 MW in 2014. • Ex-ante impacts on a per device basis were lower than 2013 average. • There were no energy savings in 2014 because there were no system-wide events were called. • Load impact estimates for the average small and medium business and for electric water heaters among residential customers remain
consistent with prior year’s analysis • IHD’s yielded no statistically significant energy savings.
Residential New Construction
• The most significant growth in the initiative has been participation in the prescriptive track. MW savings in the prescriptive track increased from zero summer peak MW savings in 2011 to 352 summer peak kW savings in 2014.
• The custom track saw participation for the first time in 2014. One custom project of 55 homes contributed 37 kW demand savings and 0.5 GWh of energy savings.
• New deemed savings for performance track homes were developed and implemented, resulting more consistent realization rates for 2014.
• ENERGY STAR New Homes was introduced as an eligible measure within the performance track in 2014. As a result, these ENERGY STAR New Homes provided 1% of peak kW savings and 4% of kWh savings.
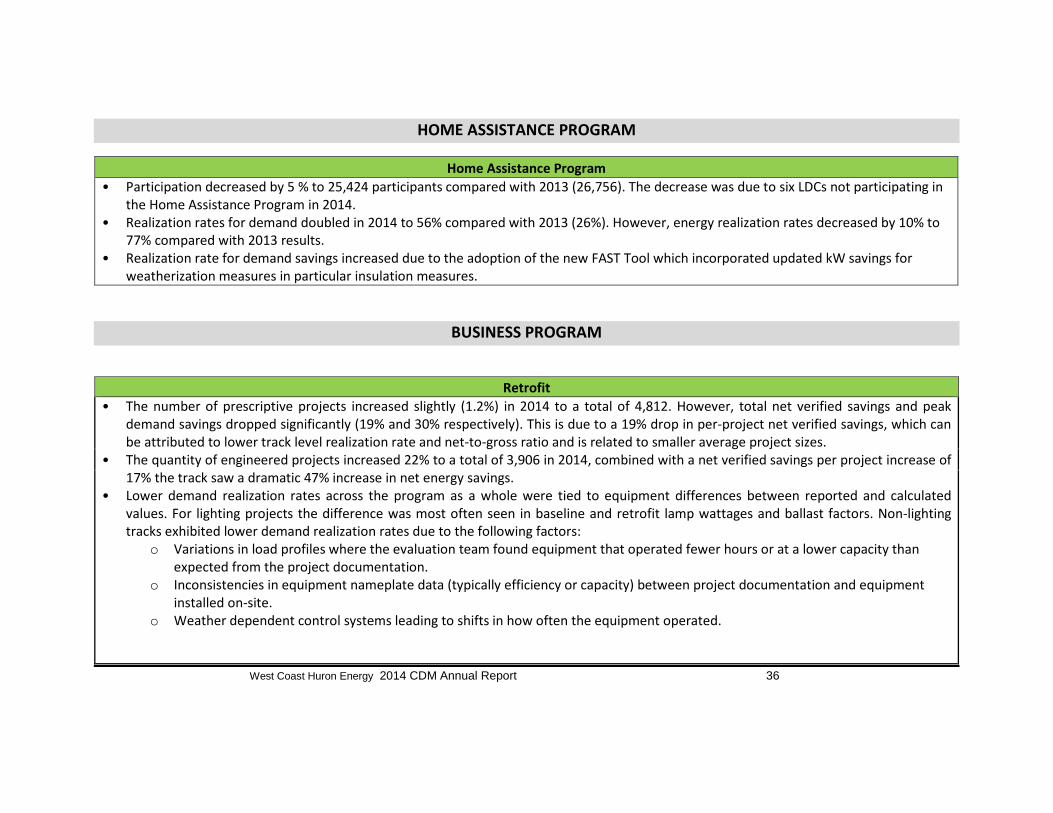
West Coast Huron Energy 2014 CDM Annual Report 36
HOME ASSISTANCE PROGRAM
Home Assistance Program • Participation decreased by 5 % to 25,424 participants compared with 2013 (26,756). The decrease was due to six LDCs not participating in
the Home Assistance Program in 2014. • Realization rates for demand doubled in 2014 to 56% compared with 2013 (26%). However, energy realization rates decreased by 10% to
77% compared with 2013 results. • Realization rate for demand savings increased due to the adoption of the new FAST Tool which incorporated updated kW savings for
weatherization measures in particular insulation measures.
BUSINESS PROGRAM
Retrofit
• The number of prescriptive projects increased slightly (1.2%) in 2014 to a total of 4,812. However, total net verified savings and peak demand savings dropped significantly (19% and 30% respectively). This is due to a 19% drop in per-project net verified savings, which can be attributed to lower track level realization rate and net-to-gross ratio and is related to smaller average project sizes.
• The quantity of engineered projects increased 22% to a total of 3,906 in 2014, combined with a net verified savings per project increase of 17% the track saw a dramatic 47% increase in net energy savings.
• Lower demand realization rates across the program as a whole were tied to equipment differences between reported and calculated values. For lighting projects the difference was most often seen in baseline and retrofit lamp wattages and ballast factors. Non-lighting tracks exhibited lower demand realization rates due to the following factors:
o Variations in load profiles where the evaluation team found equipment that operated fewer hours or at a lower capacity than expected from the project documentation.
o Inconsistencies in equipment nameplate data (typically efficiency or capacity) between project documentation and equipment installed on-site.
o Weather dependent control systems leading to shifts in how often the equipment operated.

West Coast Huron Energy 2014 CDM Annual Report 37
Small Business Lighting
• 23,784 projects were completed in 2014 (34% increase from 2013) • The category of ‘Other’ business type projects increased 71% when compared to 2013. Agribusinesses make up 74% of the ‘Other’
business type category. While growth in the number of projects is good, agribusinesses projects, in particular, have a realization rate of only 58.5%. This is primarily due to the verified annual operating hours being approximately 45% less than the assumed annual operating hours.
• In 2014 LED measures provide the most net savings of any other SBL measure making up 59% of net energy savings in 2014. Their long effective useful life and retention of a larger amount of savings after the baseline adjustment allow LED measures to also contribute substantially more lifetime savings than CFLs and linear fluorescents.
• Overall energy and demand realization rates decreased by 1.8 and 3.1 %, respectively, from 2013. o Sampled rural projects have lower energy realization rather than urban projects (63.8% compared to 83.5%) across the 2011 –
2014 sample o Sampled rural projects have even lower demand realization rather than urban projects (49.7% compared to 74.1%) across the
2011 – 2014 sample o The annual proportion of net energy savings from rural projects has increased from 30% in 2011 to 41% in 2014
Audit Funding
• The number of audits carried out in 2014 decreased by 20% when compared to 2013. • The average per audit net energy savings attributable to the Audit Funding Initiative was estimated to be 65 MWh and 13 kW of summer
peak demands savings. • Time series analysis quantified additional savings from measures implemented after initial program year. It was found that an additional
7.2%, 5.0% and 0.1% can be added to all previously reported projects in 2011, 2012 and 2013 projects, respectively.

West Coast Huron Energy 2014 CDM Annual Report 38
Existing Building Commissioning • 5 projects completed the Hand-off stage in 2014. • Energy realization rate was estimated at 116% and demand realization rate at 202%. • About 31 participants are still in the scoping stage or implementation stage.
High Performance New Construction
• Savings have increased every year of the initiative with an increased participation of 50% from 2013 • In 2014, most savings came from the custom track providing 71% of demand savings. • Participation from HVAC measures occurred for the first time in 2014 (providing 14% of summer peak kW savings and 5% of kWh savings). • The measures with the greatest impact on low realization rates for prescriptive measures were high volume low speed (HVLS) fans and
variable frequency drives (VFDs). • Province-wide realization rates declined slightly for 2014, as a result of the wider variety of measures being implemented. • Key drivers for participation are: initial project cost, followed by electricity costs and expected energy savings are the key drivers to
participation.
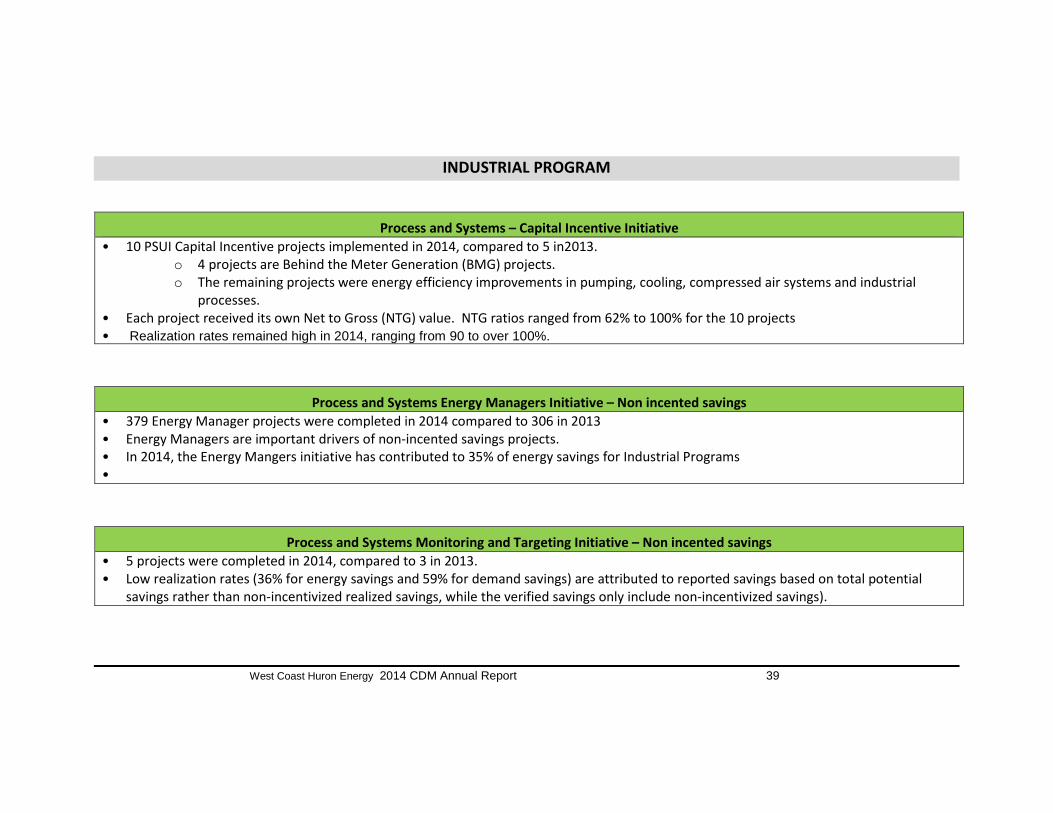
West Coast Huron Energy 2014 CDM Annual Report 39
INDUSTRIAL PROGRAM
Process and Systems – Capital Incentive Initiative • 10 PSUI Capital Incentive projects implemented in 2014, compared to 5 in2013.
o 4 projects are Behind the Meter Generation (BMG) projects. o The remaining projects were energy efficiency improvements in pumping, cooling, compressed air systems and industrial
processes. • Each project received its own Net to Gross (NTG) value. NTG ratios ranged from 62% to 100% for the 10 projects • Realization rates remained high in 2014, ranging from 90 to over 100%.
Process and Systems Energy Managers Initiative – Non incented savings • 379 Energy Manager projects were completed in 2014 compared to 306 in 2013 • Energy Managers are important drivers of non-incented savings projects. • In 2014, the Energy Mangers initiative has contributed to 35% of energy savings for Industrial Programs •
Process and Systems Monitoring and Targeting Initiative – Non incented savings • 5 projects were completed in 2014, compared to 3 in 2013. • Low realization rates (36% for energy savings and 59% for demand savings) are attributed to reported savings based on total potential
savings rather than non-incentivized realized savings, while the verified savings only include non-incentivized savings).

West Coast Huron Energy 2014 CDM Annual Report 40
Demand Response - DR-3
• The largest 25 contributors account for 60% of the contractual demand reduction – that is, less than 4% of contributors account for the majority of the load reductions.
• A multi-year analysis indicates 2012 was the best year for program performance. After 2012, a single large contributor left the program, resulting in a decrease in overall performance in 2013 and 2014. This highlights the risk having a highly concentrated program with a few large contributors representing a large share of the program capacity.
• There were no events called in 2014 and the contracted capacity was similar to 2013.
Note:
The Key Evaluation findings are derived from the 2014 evaluations of the saveONenergy programs. These findings were developed by 3rd party evaluation contractors. Complete findings are detailed in the contractors’ full evaluation reports, which will be available publicly in Q4 2015.

West Coast Huron Energy 2014 CDM Annual Report 41
4.3 Spending Table 8 and Table 9 summarize the total spending by initiative that West Coast Huron Energy has incurred in 2014 and cumulatively since 2011. It is detailed by the Program Administration Budget (PAB), Participant Based Funding (PBF), Participant Incentives (PI) and Capability Building Funding (CBF).
Table 8: 2014 Spending
Initiative PAB PBF PI CBF TOTAL
Consumer Program
Appliance Retirement $1,965.50 $1,965.50 Appliance Exchange $811.17 $811.17 HVAC Incentives $2,035.48 $2,035.48 Conservation Instant Coupon Booklet $4,720.00
$4,720.00
Bi-Annual Retailer Event $1,066.95 $1,066.95 Retailer Co-op Residential Demand Response $25,308.77 $14,895.00 $40,203.77 New Construction Program $1,195.96 $1,195.96 Business Program Efficiency: Equipment Replacement $13,401.75 $38,742.34 $52,144.09 Direct Installed Lighting $13,355.94 $6,220.00 $31,127.00 $50,702.94 Existing Building Commissioning Incentive $56.80 $56.80
New Construction and Major Renovation Initiative $711.60 $711.60
Energy Audit $1,304.59 $1,304.59 Small Commercial Demand Response (part of the Residential program schedule)
Demand Response 3 (part of the Industrial program schedule)
Industrial Program Process & System Upgrades
a) preliminary engineering study
b) detailed engineering study c) program incentive $6,732.51 $6,732.51
Monitoring & Targeting $78.49 $78.49 Energy Manager $1,098.79 $1,098.79 Key Account Manager Efficiency Equipment Replacement Incentive (part of the C&I program schedule)

West Coast Huron Energy 2014 CDM Annual Report 42
Demand Response 3 $1,020.30 $1,020.30 Home Assistance Program Home Assistance Program $3,571.99 $3,400.00 $4,812.00 $11,783.99 TOTAL SPENDING $78,436.59 $24,515.00 $74,681.34 $177,632.93
Table 9: Cumulative Spending (2011-2014)
Initiative PAB PBF PI CBF TOTAL
Consumer Program
Appliance Retirement $13,153.50 $13,153.50 Appliance Exchange $2,293.86 $2,293.86 HVAC Incentives $13,466.45 $13,466.45 Annual Coupons $10,899.05 $10,899.05 Bi-Annual Retailer Event $2,421.58 $2,421.58 Retailer Co-op Residential Demand Response $40,576.64 $14,895 $55,471.64
New Construction Program $4,927.13 $4,927.13
Business Program Equipment Replacement $56,050.95 $83,175.23 $139,226.18
Direct Installed Lighting $26,787.20 $16,930.00
$78,398.25 $122,115.45
Existing Building Commissioning Incentive $732.30 $732.30
New Construction and Major Renovation Initiative
$5,861.46
$5,861.46
Energy Audit $5,203.76 $5,203.76 Small Commercial Demand Response
Demand Response Industrial Program Process & System Upgrades
a) preliminary engineering study $1,741.49 $1,741.49
b) detailed engineering study $775.25 $775.25
c) program incentive $7,507.76 $7,507.76 Monitoring & Targeting $2,005.94 $2,005.94 Energy Manager $8,310.74 $8,310.74 Key Account Manager (“KAM”) $579.83 $579.83
Equipment Replacement
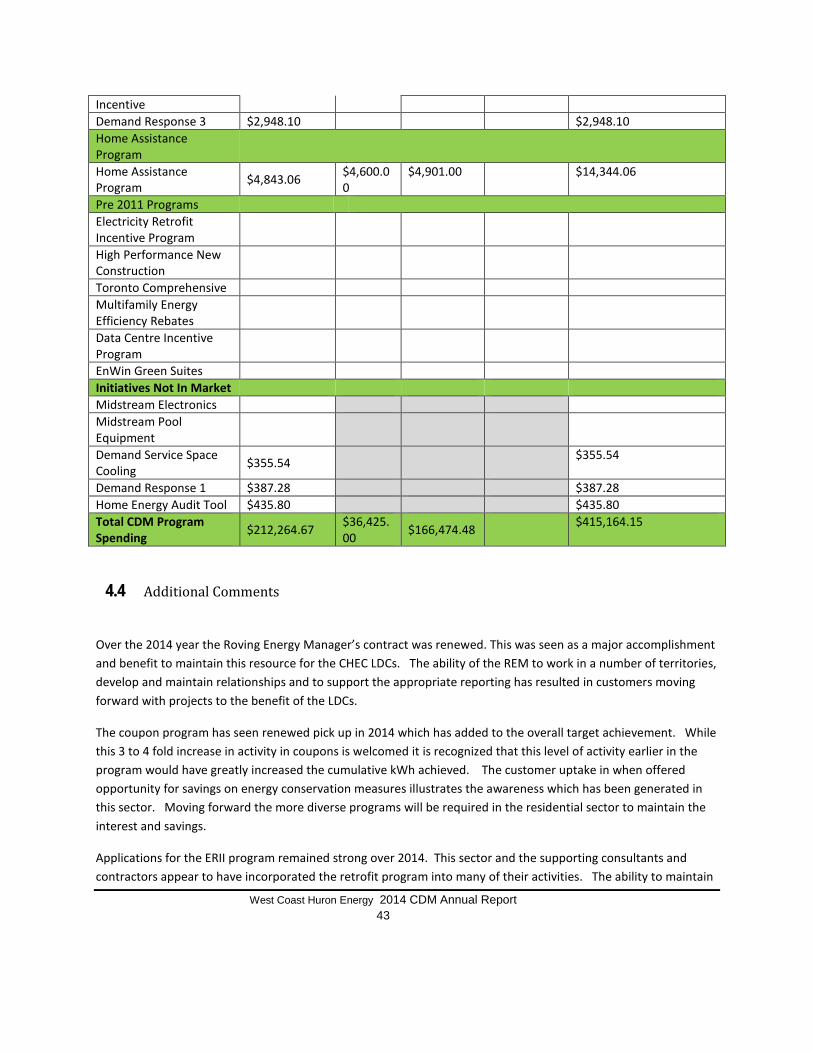
West Coast Huron Energy 2014 CDM Annual Report 43
Incentive Demand Response 3 $2,948.10 $2,948.10 Home Assistance Program
Home Assistance Program $4,843.06 $4,600.0
0 $4,901.00 $14,344.06
Pre 2011 Programs Electricity Retrofit Incentive Program
High Performance New Construction
Toronto Comprehensive Multifamily Energy Efficiency Rebates
Data Centre Incentive Program
EnWin Green Suites Initiatives Not In Market Midstream Electronics Midstream Pool Equipment
Demand Service Space Cooling $355.54 $355.54
Demand Response 1 $387.28 $387.28 Home Energy Audit Tool $435.80 $435.80 Total CDM Program Spending $212,264.67 $36,425.
00 $166,474.48 $415,164.15
4.4 Additional Comments
Over the 2014 year the Roving Energy Manager’s contract was renewed. This was seen as a major accomplishment and benefit to maintain this resource for the CHEC LDCs. The ability of the REM to work in a number of territories, develop and maintain relationships and to support the appropriate reporting has resulted in customers moving forward with projects to the benefit of the LDCs.
The coupon program has seen renewed pick up in 2014 which has added to the overall target achievement. While this 3 to 4 fold increase in activity in coupons is welcomed it is recognized that this level of activity earlier in the program would have greatly increased the cumulative kWh achieved. The customer uptake in when offered opportunity for savings on energy conservation measures illustrates the awareness which has been generated in this sector. Moving forward the more diverse programs will be required in the residential sector to maintain the interest and savings.
Applications for the ERII program remained strong over 2014. This sector and the supporting consultants and contractors appear to have incorporated the retrofit program into many of their activities. The ability to maintain

West Coast Huron Energy 2014 CDM Annual Report 44
a working relationship with customers offering a consistent program has assisted to maintain a profile for the program and interest in the sector.
The Direct Install Lighting has experienced some success over 2014 with the addition of LED lights. In many instances however the impact of the change has been tempered by the number of customers who have previously participated. Where there was early participation by the sector the ability to engage was impacted.
5 Combined CDM Reporting Elements
5.2 Progress Towards CDM Targets The following tables indicate the progress made to achieving the demand and energy target over the 2011 to 2014 time frame. West Coast Huron Energy achieved 53.8% of the demand target and 48.8% of the energy target as noted in the tables.
Table 10: Net Peak Demand Savings at the End User Level (MW)
2011 2012 2013 20142011 - Verified 0.1 0.1 0.1 0.12012 - Verified† 0.0 0.1 0.0 0.02013 - Verified† 0.0 0.0 0.1 0.12014 - Verified† 0.0 0.0 0.0 0.3
0.50.9
53.8%Verified Portion of Peak Demand Savings Target Achieved in 2014 (%): West Coast Huron Energy Inc. 2014 Annual CDM Capacity Target:
Implementation Period Annual
Verified Net Annual Peak Demand Savings Persisting in 2014:
Table 11: Net Energy Savings at the End-User Level (GWh)
Cumulative2011 2012 2013 2014 2011-2014
2011 - Verified 0.5 0.5 0.5 0.5 1.92012 - Verified† 0.0 0.2 0.2 0.2 0.52013 - Verified† 0.0 0.0 0.3 0.3 0.52014 - Verified† 0.0 0.0 0.02 1.0 1.0
4.08.3
48.8%West Coast Huron Energy Inc. 2011-2014 Annual CDM Energy Target:Verified Portion of Cumulative Energy Target Achieved in 2014 (%):
Implementation Period Annual
Verified Net Cumulative Energy Savings 2011-2014:
West Coast Huron Energy 2014 CDM Annual Report 45
5.1.1 Summary of Target Achievement:
West Coast Huron Inc.’s progress towards target was impacted by a number of factors, some of which are specific to the service territory. Factors impacting the achievement of target are outlined as follows:
1. Cumulative Impact of Programs Not in Market: As per the concerns from other LDCs the shortfall of peak demand targets were mainly due to late start of programs, cancellation of planned province wide programs including Direct Space Cooling and the lack of OEB Approved Programs. A larger suite of programs in the marketplace would have broadened the offering, engaged a wider number of customers and provided additional opportunities for demand and energy savings.
2. EF3 Tornado in August 2011: The tornado severely damaged the community infrastructure and devastated the downtown core. The recovery from this tornado, while managed well by the community had significant impact on the LDC’s ability to promote conservation at that time. Major repairs were completed through insurance claims covering whole building envelope repairs, lighting retrofits, and replacement of mechanical systems including Roof Top Heating/Air Conditioning Units. Focus of the businesses and community was to recover from the devastation as quickly as possible with large number of contractors working at any given time. With the focus on recovery the receptiveness to incorporate conservation applications was limited. The renewal early in the framework not only impacted on the ability to implement but impacted on the cumulative effect of those changes. Retrofits early in the framework would have provided significant kWh’s over the framework period.
3. Major Customer Ability to Participate: West Coast Huron Inc.’s largest customer was also impacted by the tornado. Further, at this particular time, the customer was not focused on energy conservation as part of their business strategy and did not respond favourably to approaches by the LDC. The inability to engage the major customer had significant impact on the ability to achieve target. The customer represents in excess of 50% of the energy consumption in the West Coast Huron Inc.’s service territory. This was the major single determinate in setting the target which was applied to West Coast Huron Inc. for the 2011-2014 Framework. Removing the customer load, utilizing a 50% factor, the resulting target levels are estimated at 0.44 MW and 4.14 GWh. Based on these “modified targets” the savings achieved over the period of 0.473 MW and 4.04 GWh represent 107.5% and 97.6% achievement. While it is recognized that the “modified target” is not the measure for performance to be evaluated against, it illustrates the effort made within the general customer base to achieve target.
The impact of the cumulative effect of the early kWh lost was taken into account when evaluating projections within the Strategy. In addition the inability to engage the major customer was noted within projections. While not assisting with the current results it appears the major customer may be interested in pursuing opportunities moving forward.

West Coast Huron Energy 2014 CDM Annual Report 46
5.3 Variance from Strategy West Coast Annual Milestone - Contribution to 2014 Target
Category - Consumer kW kWh kW kWh kW kWh kW kWh kW kWh kW kWh kW kWh kW kWh kW kWh kW kWhProvincial Programs
Appliance Retirement 2 52,981 4 108,680 4 90,972 6 99,458 4 95,000 6 54,707 2 30,000 7 31,255 18 292,845 23 294,100 Instant Discounts (Rebates) 1 100,413 2 125,481 2 125,481 1 55,229 2 65,000 1 32,517 2 40,000 6 98,831 6 253,227 10 312,058
HVAC Discounts (Rebates) 7 45,030 11 89,987 11 89,987 8 43,758 8 50,000 7 25,520 6 30,000 15 28,897 32 189,265 41 188,162Demand Response 10 50,124 0 0 0 0 0 0 10 50,000 0 0 23 300 13 0 23 300 13 0
Midstream Incentives 0 1,057 0 0 0 0 0 0 0 0 0 0 0 0 0 0 0 0 0 0 New Construction 1 7,751 0 0 1 6,486 0 0 0 0 0 0 0 0 0 0 0 0 0 0
Low Income 0 0 0 0 0 0 0 0 25 150,000 0 5,208 1 15,000 1 4,810 1 20,208 1 10,018Provincial Consumer Total 22 257,357 17 324,148 18 312,926 15 198,445 49 410,000 14 117,952 34 115,300 42 163,793 80 755,845 88 804,338
OEB Approved ProgramsGeneral Consumer 0 0 0 0 0 0 0 0 0 0 0 0 0 0 0 0 0 0 0
Low Income 0 0 0 0 0 0 0 0 0 0 0 0 0 0 0 0 0OEB Approved Programs Total 0 0 0 0 0 0 0 0 0 0 0 0 0 0 0 0 0 0 0 0
Consumer Program Total 22 257,357 17 324,148 18 312,926 15 198,445 49 410,000 14 117,952 34 115,300 42 163,793 80 755,845 88 804,338
Annual Milestone - Contribution to 2014 Target
Category - Commercial & Institutional kW kWh kW kWh kW kWh kW kWh kW kWh kW kWh kW kWh kW kWh kW kWh kW kWh
Provincial Programs trofits – Medium and Large Buildings 0 0 6 252,946 34 445,191 23 237,585 20 150,000 28 288,026 100 750,000 138 690,126 157 1,528,557 195 1,468,683
Existing Building Retrofits – Small Buildings 63 1,130,636 13 161,267 79 1,216,911 10 107,202 10 650,000 19 135,256 50 250,000 34 124,151 92 653,725 76 527,876
Small Commercial Demand Response 2 3,388 0 0 0 0 0 0 5 8,412 0 0 0 0 1 0 0 0 1 0
Demand Response 1 & 3 0 0 0 0 0 0 25 365 75 60,000 0 340 25 340 -1 0 50 1,045 24 705Provincial Commercial & Inst. Total 65 1,134,024 19 414,213 113 1,662,102 58 345,152 110 868,412 47 423,622 175 1,000,340 172 814,277 299 2,183,327 296 1,997,264OEB Approved Programs
Retrofits 0 0 0 0New Construction 0 0 0 0
OEB Approved Programs Total 0 0 0 0 0 0 0 0 0 0 0 0 0 0 0 0 0 0 0 0
Commercial & Inst. Total 65 1,134,024 19 414,213 113 1,662,102 58 345,152 110 868,412 47 423,622 175 1,000,340 172 814,277 299 2,183,327 296 1,997,264
2014 Revised Strategy Projection Actual 2014 Results Revised Total
Projected Reduction Contribution to Target
2011 Original Strategy Projection Actual 2011 Results 2012 Revised
Strategy Projection Actual 2012 Results 2013 Revised Strategy Projection Actual 2013 Results
2011 Original Strategy Projection Actual 2011 Results 2012 Revised
Strategy Projection Actual 2012 Results 2013 Revised Strategy Projection Actual 2013 Results
2014 Revised Strategy Projection Actual 2014 Results Revised Total
Projected Reduction Contribution to Target

West Coast Huron Energy 2014 CDM Annual Report 47
Annual Milestone - Contribution to 2014 Target
Category - Industrial kW kWh kW kWh kW kWh kW kWh kW kWh kW kWh kW kWh kW kWh kW kWh kW kWhProgram Name
Industrial Accelerator 0 0 0 0 0 0 0 0 0 0 0 0 0 0 0 2,269 0 0 0 2,269Industrial Equipment Replacement 24 524,476 0 0 11 397,060 0 0 20 250,000 0 0 0 0 0 0 0 0 0 0
Demand Response 1 0 0 0 0Demand Response 3 24 524,476 0 0 11 397,060 0 0 0 0 0 0 0 0 0 0 0 0 0 0
Provincial Industrial Total 49 1,048,951 0 0 22 794,120 0 0 20 250,000 0 0 0 0 0 2,269 0 0 0 2,269OEB Approved Programs
A 0 0 0 0 0 0 0 0 0 0 0 0 0 0 0 0B 0 0 0 0 0 0 0 0 0 0 0 0 0 0 0 0
OEB Approved Programs Total 0 0 0 0 0 0 0 0 0 0 0 0 0 0 0 0 0 0 0 0
Industrial Total 49 1,048,951 0 0 22 794,120 0 0 20 250,000 0 0 0 0 0 2,269 0 0 0 2,269
CDM Strategy Total kW kWh kW kWh kW kWh kW kWh kW kWh kW kWh kW kWh kW kWh kW kWh kW kWhProgram Total 135 2,440,332 37 738,362 153 2,769,148 73 543,596 179 1,528,412 61 541,574 209 1,115,640 214 980,339 379 2,939,172 384 2,803,871
2010 Contribution 52 1,205,214 214 0 0 52 1,205,428 52 1,205,428Time of Use Savings 36 0 36 0
Adjustments to Verified Final Results 0 2,934 0 16 1 29,016 0 2,950 1 31,966Adjusted Total 135 2,440,332 89 1,943,575 153 2,769,148 73 546,745 179 1,528,412 61 541,590 209 1,115,640 251 1,009,355 431 4,147,550 473 4,041,265
880 8,280,000
Percentage of Target kW kWh kW kWh kW kWh kW kWh kW kWh kW kWh kW kWh kW kWh kW kWh kW kWh15.4% 29.5% 10.1% 23.5% 17.4% 33.4% 8.2% 6.6% 20.3% 18.5% 6.9% 6.5% 23.8% 13.5% 28.5% 12.2% 49% 50.1% 53.8% 48.8%
Note: Total Projection is formed of 2011, 2012 & 2013 Actuals added with 2014 Revised Strategy Projection
2011 Original Strategy Projection Actual 2011 Results 2012 Revised
Strategy Projection Actual 2012 Results 2013 Revised Strategy Projection Actual 2013 Results 2014 Revised
Strategy Projection Actual 2014 Results Revised Total Projected Reduction Contribution to Target
2011 Original Strategy Projection Actual 2011 Results 2012 Revised
Strategy Projection Actual 2012 Results 2013 Revised Strategy Projection Actual 2013 Results
2011 Original Strategy Projection Actual 2011 Results 2012 Revised
Strategy Projection Actual 2012 Results 2013 Revised Strategy Projection
2014 Revised Strategy Projection Actual 2014 Results Revised Total
Projected Reduction Contribution to Target
Target to Achieve
Actual 2013 Results 2014 Revised Strategy Projection Actual 2014 Results Revised Total
Projected Reduction Contribution to Target

West Coast Huron Energy 2014 CDM Annual Report 48
6 Conclusion
Over the course of 2014, West Coast Huron Energy has achieved an incremental 0.3 MW in peak demand savings and 1.0 GWh in energy savings, which represents 31% and 12% of West Coast Huron Energy 2014 target, respectively.
The overall results achieved in 2011-2014 are 0.5 MW in peak demand savings and 4.0 GWh in energy savings, which represents 53.8% and 48.8% of West Coast Huron Energy 2014 target, respectively. These results are representative of a considerable effort expended by West Coast Huron Energy, in cooperation with other LDCs, customers, channel partners and stakeholders to overcome many operational and structural issues that limited program effectiveness across all market sectors. This achievement is a success and the relationships built within the 2011-2014 CDM program term will aid results in future CDM programs.
Future reports on Conservation First will be provided by LDCs to the IESO who will report annually to the OEB.
West Coast Huron Energy 2014 CDM Annual Report 49
Appendix A: Initiative Descriptions Residential Program
APPLIANCE RETIREMENT INITIATIVE (Exhibit D) Target Customer Type(s): Residential Customers
Initiative Frequency: Year round
Objectives: Achieve energy and demand savings by permanently decommissioning certain older, inefficient refrigeration appliances.
Description: This is an energy efficiency Initiative that offers individuals and businesses free pick-up and decommissioning of old large refrigerators and freezers. Window air conditioners and portable dehumidifiers will also be picked up if a refrigerator or a freezer is being collected.
Targeted End Uses: Large refrigerators, large freezers, window air conditioners and portable dehumidifiers.
Delivery: IESO centrally contracts for the province-wide marketing, call centre, appliance pick-up and decommissioning process. LDC’s provides local marketing and coordination with municipal pick-up where available.
Additional detail is available:
• Schedule B-1, Exhibit D. Available on IESO’s extranet; • saveONenergy website https://saveonenergy.ca/Consumer/Programs/Appliance-Retirement.aspx.
In Market Date: March 28, 2011
APPLIANCE EXCHANGE INITIATIVE (Exhibit E) Target Customer Type(s): Residential Customers
Initiative Frequency: Spring and Fall
Objective: The objective of this initiative is to remove and permanently decommission older, inefficient window air conditioners and portable dehumidifiers that are in Ontario.
Description: This initiative involves appliance exchange events. Exchange events are held at local retail locations and customers are encouraged to bring in their old room air conditioners (AC) and dehumidifiers in exchange for coupons/discounts towards the purchase of new energy efficient equipment. Window ACs were discontinued from the program in 2013.
Targeted End Uses: Window air conditioners and portable dehumidifiers

West Coast Huron Energy 2014 CDM Annual Report 50
Delivery: IESO contracts with participating retailers for collection of eligible units. LDCs provide local marketing.
Additional detail is available:
• Schedule B-1, Exhibit C. Available on IESO’s extranet; • saveONenergy website https://saveonenergy.ca/Consumer.aspx.
In Market Date: March 28, 2011
HVAC INCENTIVES INITIATIVE (Exhibit B) Target Customer Type(s): Residential Customers
Initiative Frequency: Year round
Objective: The objective of this initiative is to encourage the replacement of existing heating systems with high efficiency furnaces equipped with electronically commutated motors (ECM), and to replace existing central air conditioners with ENERGY STAR qualified systems and products.
Description: This is an energy efficiency initiative that provides rebates for the replacement of old heating or cooling systems with high efficiency furnaces (equipped with ECM) and ENERGY STAR® qualified central air conditioners by approved Heating, Refrigeration, and Air Conditioning Institute (HRAI) qualified contractors.
Targeted End Uses: Central air conditioners and furnaces
Delivery: IESO contracts centrally for delivery of the program. LDCs provide local marketing and encourage local contractors to participate in the initiative.
Additional detail is available:
• Schedule B-1, Exhibit B. Available on IESO’s extranet; • saveONenergy website https://saveonenergy.ca/Consumer.aspx.
In Market Date: March 28, 2011
CONSERVATION INSTANT COUPON INITIATIVE (Exhibit A) Target Customer Type(s): Residential Customers
Initiative Frequency: Year round
Objective: The objective of this initiative is to encourage households to purchase energy efficient products by offering discounts.
Description: This initiative provides customers with year round coupons. The coupons offer instant rebates towards the purchase of a variety of low cost, easy to install energy efficient measures and can be redeemed at

West Coast Huron Energy 2014 CDM Annual Report 51
participating retailers. Booklets were directly mailed to customers and were also available at point-of-purchase. Downloadable coupons were also available at www.saveoneenergy.ca.
Targeted End Uses: ENERGY STAR® qualified Standard Compact Flourescent Lights (“CFLs”),ENERGY STAR® qualified Light Fixtures lighting control products, weather-stripping, hot water pipe wrap, electric water heater blanket, heavy duty plug-in Timers, Advanced power bars, clothesline, baseboard programmable thermostats.
Delivery: The IESO develops the electronic version of the coupons and posts them online for download. Three LDC specific coupons were made available for local marketing and utilization by LDCs. The IESO enters into agreements with retailers to honour the coupons.
Additional detail is available:
• Schedule B-1, Exhibit A. Available on IESO’s extranet; • saveONenergy website https://saveonenergy.ca/Consumer.aspx.
In Market Date: March 28, 2011
BI-ANNUAL RETAILER EVENT INITIATIVE (Exhibit C)
Target Customer Type(s): Residential Customers
Initiative Frequency: Bi-annual events
Objective: The objective of this initiative is to provide instant point of purchase discounts to individuals at participating retailers for a variety of energy efficient products.
Description: Twice a year (Spring and Fall), participating retailers host month-long rebate events. During the months of April and October, customers are encouraged to visit participating retailers where they can find coupons redeemable for instant rebates towards a variety of low cost, easy to install energy efficient measures.
Targeted End Uses: As per the Conservation Instant Coupon Initiative
Delivery: The IESO enters into arrangements with participating retailers to promote the discounted products, and to post and honour related coupons. LDCs also refer retailers to the IESO and market this initiative locally.
Additional detail is available:
• Schedule B-1, Exhibit C. Available on IESO’s extranet; • saveONenergy website https://saveonenergy.ca/Consumer.aspx.
In Market Date: March 2011
RETAILER CO-OP Target Customer Type(s): Residential Customers

West Coast Huron Energy 2014 CDM Annual Report 52
Initiative Frequency: Year Round
Objective: Hold promotional events to encourage customers to purchase energy efficiency measures (and go above-and-beyond the traditional Bi-Annual Coupon Events).
Description: The Retailer Co-op Initiative provides LDCs with the opportunity to work with retailers in their service area by holding special events at retail locations. These events are typically special promotions that encourage customers to purchase energy efficiency measures (and go above-and-beyond the traditional Bi-Annual Coupon Events).
Targeted End Uses: As per the Conservation Instant Coupon Initiative
Delivery: Retailers apply to the IESO for co-op funding to run special promotions that promote energy efficiency to customers in their stores. LDCs can refer retailers to the IESO. The IESO provides each LDC with a list of retailers who have qualified for Co-Op Funding as well as details of the proposed special events.
In Market Date: N/A
NEW CONSTRUCTION PROGRAM (Schedule B-2) Target Customer Type(s): Residential Customers
Initiative Frequency: Year round
Objective: The objective of this initiative is to provide incentives to participants for the purpose of promoting the construction of energy efficient residential homes in the Province of Ontario.
Description: This is an energy efficiency initiative that provides incentives to homebuilders for constructing new homes that are efficient, smart, and integrated (applicable to new single family dwellings). Incentives are provided in two key categories as follows:
o Incentives for homebuilders who install electricity efficiency measures as determined by a prescriptive list or via a custom option.
o Incentives for homebuilders who meet or exceed aggressive efficiency standards using the EnerGuide performance rating system.
Targeted End Uses: All off switch, ECM motors, ENERGY STAR® qualified central a/c, lighting control products, lighting fixtures, EnerGuide 83 whole home, EnerGuide 85 whole homes
Delivery: Local engagement of builders will be the responsibility of the LDC and will be supported by IESO air coverage driving builders to their LDC for additional information.
Additional detail is available:
• Schedule B-1, Exhibit C. Available on IESO’s extranet;

West Coast Huron Energy 2014 CDM Annual Report 53
• saveONenergy website https://saveonenergy.ca/Consumer.aspx.
In Market Date: June 2011
RESIDENTIAL DEMAND RESPONSE PROGRAM (Schedule B-3) Target Customer Type(s): Residential and Small Commercial Customers
Initiative Frequency: Year round
Objective: The objectives of this initiative are to enhance the reliability of the IESO-controlled grid by accessing and aggregating specified residential and small commercial end uses for the purpose of load reduction, increasing consumer awareness of the importance of reducing summer demand and providing consumers their current electricity consumption and associated costs.
Description: In peaksaver PLUS® participants are eligible to receive a free programmable thermostat or switch, including installation. Participants also receive access to price and real-time consumption information on an In Home Display (IHD).
Targeted End Uses: central air conditioning, electric hot water heaters and pool pumps
Delivery: LDC’s recruit customers and procure technology
Additional detail is available:
• Schedule B-1, Exhibit C. Available on IESO’s extranet; • saveONenergy website https://saveonenergy.ca/Consumer.aspx.
In Market Date: June 2013
C&I Program EFFICIENCY: EQUIPMENT REPLACEMENT INCENTIVE (ERII) (Schedule C-2) Target Customer Type(s): Commercial, Institutional, Agricultural and Industrial Customers
Initiative Frequency: Year round
Objective: The objective of this Initiative is to offer incentives to non-residential distribution customers to achieve reductions in electricity demand and consumption by upgrading to more energy efficient equipment for lighting, space cooling, ventilation and other measures.
Description: The Equipment Replacement Incentive Initiative (ERII) offers financial incentives to customers for the upgrade of existing equipment to energy efficient equipment. Upgrade projects can be classified into either: 1) prescriptive projects where prescribed measures replace associated required base case equipment; 2) engineered
West Coast Huron Energy 2014 CDM Annual Report 54
projects where energy and demand savings and incentives are calculated for associated measures; or 3) custom projects for other energy efficiency upgrades.
Targeted End Uses: lighting, space cooling, ventilation and other measures
Delivery: LDC delivered.
Additional detail is available:
• Schedule C-2. Available on IESO’s extranet; • saveONenergy website https://saveonenergy.ca/Business/Program-Overviews/Retrofit-for-
Commercial.aspx.
In Market Date: May 1, 2011
Lessons Learned:
DIRECT INSTALL INITIATIVE (DIL) (Schedule C-3) Target Customer Type(s): Small Commercial, Institutional, Agricultural facilities and multi-family buildings
Initiative Frequency: Year round
Objective: The objective of this Initiative is to offer a free installation of eligible lighting and water heating measures of up to $1,500 to eligible owners and tenants of small commercial, institutional and agricultural facilities and multi-family buildings, for the purpose of achieving electricity and peak demand savings.
Description: The Direct Installed Lighting Initiative targets customers in the General Service <50kW account category. This Initiative offers turnkey lighting and electric hot water heater measures with a value up to $1,500 at no cost to qualifying small businesses. In addition, standard prescriptive incentives are available for eligible equipment beyond the initial $1,500 limit.
Target End Uses: Lighting and electric water heating measures
Delivery: Participants can enroll directly with the LDC, or would be contacted by the LDC/LDC-designated representative.
Additional detail is available:
• Schedule C-3. Available on IESO’s extranet; • saveONenergy website https://saveonenergy.ca/Business.aspx.
In Market Date: May 1, 2011
EXISTING BUILDING COMMISSIONING INCENTIVE INITIATIVE (Schedule C-6)

West Coast Huron Energy 2014 CDM Annual Report 55
Target Customer Type(s): Commercial, Institutional, and Agricultural Customers
Initiative Frequency: Year round
Objective: The objective of this initiative is to offer incentives for optimizing (but not replacing) existing chilled water systems for space cooling in non-residential facilities for the purpose of achieving implementation phase energy savings, implementation phase demand savings, or both.
Description: This Initiative offers Participants incentives for the following:
• scoping study phase • investigation phase • implementation phase • hand off/completion phase
Targeted End Uses: Chilled water systems for space cooling
Delivery: LDC delivered.
Additional detail is available:
• Schedule C-6. Available on IESO’s extranet; • saveONenergy website https://saveonenergy.ca/Business/Program-Overviews/Existing-Building-
Commissioning.aspx.
In Market Date: November 2011
NEW CONSTRUCTION AND MAJOR RENOVATION INITIATIVE (HPNC) (Schedule C-4) Target Customer Type(s): Commercial, Institutional, Agricultural and Industrial Customers
Initiative Frequency: Year round
Objective: The objective of this initiative is to encourage builders/major renovators of commercial, institutional, and industrial buildings (including multi-family buildings and agricultural facilities) to reduce electricity demand and/or consumption by designing and building new buildings with more energy-efficient equipment and systems for lighting, space cooling, ventilation and other Measures.
Description: The New Construction initiative provides incentives for new buildings to exceed existing codes and standards for energy efficiency. The initiative uses both a prescriptive and custom approach.
Targeted End Uses: New building construction, building modeling, lighting, space cooling, ventilation and other Measures
Delivery: LDC delivers to customers and design decision makers.
Additional detail is available:

West Coast Huron Energy 2014 CDM Annual Report 56
• Schedule C-4. Available on IESO’s extranet; • saveONenergy website https://saveonenergy.ca/Business/Program-Overviews/New-Construction.aspx.
In Market Date: July 2011
ENERGY AUDIT INITIATIVE (Schedule C-1) Target Customer Type(s): Commercial, Institutional, Agricultural and Industrial Customers
Initiative Frequency: Year round
Objective: The objective of this initiative is to offer incentives to owners and lessees of commercial, institutional, multi-family buildings and agricultural facilities for the purpose of undertaking assessments to identify all possible opportunities to reduce electricity demand and consumption within their buildings or premises.
Description: This initiative provides participants incentives for the completion of energy audits of electricity consuming equipment located in the facility. Energy audits include development of energy baselines, use assessments and performance monitoring and reporting.
Targeted End Uses: Various
Delivery: LDC delivered.
Additional detail is available:
• Schedule C-1. Available on IESO’s extranet; • saveONenergy website https://saveonenergy.ca/Business/Program-Overviews/Audit-Funding.aspx.
In Market Date: September 2011
Industrial Program
PROCESS & SYSTEMS UPGRADES INITIATIVE (PSUI) (Schedule D-1) Target Customer Type(s): Industrial, Commercial, Institutional and Agricultural Customers
Initiative Frequency: Year round
Objectives: The objectives of this initiative are to:
• Offer distribution customers capital incentives and enabling initiatives to assist with the implementation of large projects and project portfolios;
• Implement system optimization project in systems which are intrinsically complex and capital intensive; and

West Coast Huron Energy 2014 CDM Annual Report 57
• Increase the capability of distribution customers to implement energy management and system optimization projects.
Description: PSUI is an energy management initiative that includes three initiatives: (preliminary engineering study, detailed engineering study, and project incentive Initiative). The incentives are available to large distribution connected customers with projects or portfolio projects that are expected to generate at least 350 MWh of annualized electricity savings or, in the case of Micro-Projects, 100 MWh of annualized electricity savings. The capital incentive for this Initiative is the lowest of:
a) $200/MWh of annualized electricity savings
b) 70% of projects cost
c) A one year pay back
Targeted End Uses: Process and systems
Delivery: LDC delivered with Key Account Management support, in some cases.
Additional detail is available:
• Schedule D-1. Available on IESO’s extranet; • saveONenergy website https://saveonenergy.ca/Business.aspx.
In Market Date: November 1, 2011
MONITORING & TARGETING INITIATIVE (Schedule D-2) Target Customer Type(s): Industrial, Commercial, Institutional and Agricultural Customers
Initiative Frequency: Year round
Objective: This initiative offers access to funding for the installation of Monitoring and Targeting (“M&T”) systems in order to deliver a minimum savings target at the end of 24 months and sustained for the term of the M&T Agreement.
Description: This initiative offers customers funding for the installation of a M&T system to help them understand how their energy consumption might be reduced. A facility energy manager, who regularly oversees energy usage, will now be able to use historical energy consumption performance to analyze and set targets.
Targeted End Uses: Process and systems
Delivery: LDC delivered with Key Account Management support, in some cases.
Additional detail is available:
• Schedule D-2. Available on IESO’s extranet;

West Coast Huron Energy 2014 CDM Annual Report 58
• saveONenergy website https://saveonenergy.ca/Business.aspx.
In Market Date: September 1, 2011
ENERGY MANAGER INITIATIVE (Schedule D-3) Target Customer Type(s): Industrial, Commercial, Institutional and Agricultural Customers
Initiative Frequency: Year round
Objective: The objective of this initiative is to provide customers and LDCs the opportunity to access funding for the engagement of energy managers in order to deliver a minimum annual savings target.
Description: This initiative provides customers the opportunity to access funding to engage an on-site, full time embedded energy manager, or an off-site roving energy manager who is engaged by the LDC. The role of the energy manager is to take control of the facility’s energy use by monitoring performance, leading awareness programs, and identifying opportunities for energy consumption improvement, and spearheading projects. Participants are funded 80% of the embedded energy manager’s salary up to $100,000 plus 80% of the energy manager’s actual reasonable expenses incurred up to $8,000 per year. Each embedded energy manager has a target of 300 kW/year of energy savings from one or more facilities. LDCs receive funding of up to $120,000 for a Roving Energy Manager plus $8,000 for expenses.
Targeted End Uses: Process and systems
Delivery: LDC delivered with Key Account Management support, in some cases.
Additional detail is available:
• Schedule D-3. Available on IESO’s extranet; • saveONenergy website https://saveonenergy.ca/Business.aspx.
In Market Date: September 25, 2011
KEY ACCOUNT MANAGER (KAM) (Schedule D-4) Target Customer Type(s): Industrial, Commercial, Institutional and Agricultural Customers
Initiative Frequency: Year round
Objective: This initiative offers LDCs the opportunity to access funding for the employment of a KAM in order to support them in fulfilling their obligations related to the PSUI.
Description: This initiative provides LDCs the opportunity to utilize a KAM to assist their customers. The KAM is considered to be a key element in assisting the consumer in overcoming traditional barriers related to energy management and help them achieve savings since the KAM can build relationships and become a significant resource of knowledge to the customer.
West Coast Huron Energy 2014 CDM Annual Report 59
Targeted End Uses: Process and systems
Delivery: LDC delivered
Additional detail is available:
• ScheduleD-4. Available on IESO’s extranet.
In Market Date: Not in Market
DEMAND RESPONSE 3 (Schedule D-6) Target Customer Type(s): Industrial, Commercial, Institutional and Agricultural Customers
Initiative Frequency: Year round
Objective: This initiative provides for Demand Response (“DR”) payments to contracted participants to compensate them for reducing their electricity consumption by a pre-defined amount during a DR event.
Description: Demand Response 3 (“DR3”) is a demand response initiative for commercial and industrial customers, of 50 kW or greater to reduce the amount of power being used during certain periods of the year. The DR3 Initiative is a contractual resource that is an economic alternative to procurement of new generation capacity. DR3 comes with specific contractual obligations requiring participants to reduce their use of electricity relative to a baseline when called upon. This Initiative makes payments for participants to be on standby and payments for the actual electricity reduction provided during a demand response event. Participants are scheduled to be on standby approximately 1,600 hours per calendar year for possible dispatch of up to 100 hours or 200 hours within that year depending on the contract.
Targeted End Uses: Commercial and Industrial Operations
Delivery: DR3 is delivered by Demand Response Providers (“DRPs”), under contract to the IESO. The IESO administers contracts with all DRPs and Direct Participants (who provide in excess of 5 MW of demand response capacity). IESO provides administration including settlement, measurement and verification, and dispatch. LDCs are responsible for local customer outreach and marketing efforts.
Additional detail is available:
• Schedule D-6. Available on IESO’s extranet; • saveONenergy website https://saveonenergy.ca/Business.aspx
In Market Date: January 2011
It is noted that while the schedule for this initiative was not posted until May 2011, the Aggregators reported that they were able to enroll customers as of January, 2011.
LOW INCOME INITIATIVE (HOME ASSISTANCE PROGRAM) (Schedule E-1)

West Coast Huron Energy 2014 CDM Annual Report 60
Target Customer Type(s): Income Qualified Residential Customers
Initiative Frequency: Year Round
Objective: The objective of this initiative is to offer free installation of energy efficiency measures to income qualified households for the purpose of achieving electricity and peak demand savings.
Description: This is a turnkey initiative for income qualified customers. It offers residents the opportunity to take advantage of free installation of energy efficient measures that improve the comfort of their home, increase efficiency, and help them save money. All eligible customers receive a Basic and Extended Measures Audit, while customers with electric heat also receive a Weatherization Audit. The Initiative is designed to coordinate efforts with gas utilities.
Targeted End Uses: End use measures based on results of audit (i.e., CFL bulbs)
Delivery: LDC delivered.
Additional detail is available:
• Schedule E. Available on IESO’s extranet.
In Market Date: October 2012

West Coast Huron Energy 2014 CDM Annual Report 61
Appendix B: Pre-2011 Programs
ELECTRICITY RETROFIT INCENTIVE PROGRAM
Target Customer Type(s): Commercial, Institutional, and Agricultural Customers
Initiative Frequency: Year Round
Objective: The objective of this initiative is to offer incentives to non-residential distribution customers to achieve reductions in electricity demand and consumption by upgrading to more energy efficient equipment for lighting, space cooling, ventilation and other measures.
Description: The Equipment Replacement Incentive Program (ERIP) offered financial incentives to customers for the upgrade of existing equipment to energy efficient equipment. This program was available in 2010 and allowed customers up to 11 months following Pre-Approval to complete their projects. As a result, a number of projects Pre-Approved in 2010 were not completed and in-service until 2011. The electricity savings associated with these projects are attributed to 2011.
Targeted End Uses: Electricity savings measures
Delivery: LDC Delivered
HIGH PERFORMANCE NEW CONSTRUCTION
Target Customer Type(s): Commercial, Institutional, and Agricultural Customers
Initiative Frequency: Year round
Objective: The High Performance New Construction Initiative provided incentives for new buildings to exceed existing codes and standards for energy efficiency. The Initiative uses both a prescriptive and custom approach and was delivered by Enbridge Gas under contract with the IESO (and subcontracted to Union Gas), which ran until December 2010.
Description: The objective of this initiative is to encourage builders of commercial, institutional, and industrial buildings (including multi-family buildings and agricultural facilities) to reduce electricity demand and/or consumption by designing and building new buildings with more energy-efficient equipment and systems for lighting, space cooling, ventilation and other Measures.
Targeted End Uses: New building construction, building modeling, lighting, space cooling, ventilation and other measures
Delivery: Through Enbridge Gas (and subcontracted to Union Gas)

West Coast Huron Energy 2014 CDM Annual Report 62
MULTIFAMILY ENERGY EFFICIENCY REBATES
Target Customer Type(s): Residential Multi-unit buildings
Initiative Frequency: Year round
Objective: Improve energy efficiency of Multi-unit building
Description: IESO’s Multifamily Energy Efficiency Rebates (MEER) Initiative applies to multifamily buildings of six units or more, including rental buildings, condominiums, and assisted social housing. The IESO contracted with GreenSaver to deliver the MEER Initiative outside of the Toronto Hydro service territory. Activities delivered in Toronto were contracted with the City of Toronto.
Similar to ERII and ERIP, MEER provides financial incentives for prescriptive and custom measures, but also funds resident education. Unlike ERII, where incentives are paid by the LDC, all incentives through MEER are paid through the contracted partner (i.e. GreenSaver).
Targeted End Uses: Electricity saving measures
Delivery: IESO contracted with Greensaver