cornell minesweeper spring 2007 report spring... · cornell minesweeper, spring 2007: ... this...
TRANSCRIPT

Cornell MineSweeper
Spring 2007 Technical Report
Cornell MineSweeper, Spring 2007: Overview
1
Abstract—Cornell MineSweeper is a student-found, student-led
team developing an autonomous solution for humanitarian
demining. The team has currently completed its frame design and
has finalized most of the power and control systems along with
the sensors for obstacle and lane detection. This overview report
briefly summarizes the work accomplished in Spring 2007 and
also describes the team’s future direction.
I. INTRODUCTION
ORNELL MINESWEEPER was founded in Fall 2006 to
develop autonomous robots for landmine detection. The
team started with 42 members and is currently 33 members
strong. It was initially structured under 5 sub-groups – Frame
Design, Power and Controls, Sensors, Computing and
Business.
The primary goals for this semester were as follows:
• Complete design of the frame, drivetrain and
suspension
• Fabricate and Test RF control
• Decide on Power source and management
• Shortlist potential landmine detection technologies
• Set up SIMBAD robot simulator
• Complete Website and Sponsorship Pamphlet
II. SPECIFICATIONS
The specifications for the robot were taken from the
requirements of the Intelligent Ground Vehicle Competition
and from literary research regarding landmine detection. It was
decided that an all-terrain robot with on-board image
processing, GPS and IMU powered by a battery would be a
very adaptable solution. Specs for each of the components
were drawn up by the respective groups except for the GPS
which was bought from U-blox and the IMU which was
donated by Kionix. Also, the competition required that each
robot have an emergency stop button on the robot along with a
wireless E-stop. Thus, the primary tasks were that of designing
the frame, power solution and wireless E-stop on the hardware
side and image processing on the software side.
Two frames were designed with different batteries, suspension
and drivetrain and the overall concept is described in the
following sections.
III. ROBOT CONCEPT V1.0
The first concept is the low cost solution which uses a lead
acid battery and two motors to propel the robot. It has a six
wheeled all-wheel drivetrain which provides it good traction
on all terrain conditions. The two motors transmit equal torque
to all wheels via a belt-pulley drive and the robot is steered via
skid steer with the each motor controlling three wheels. The
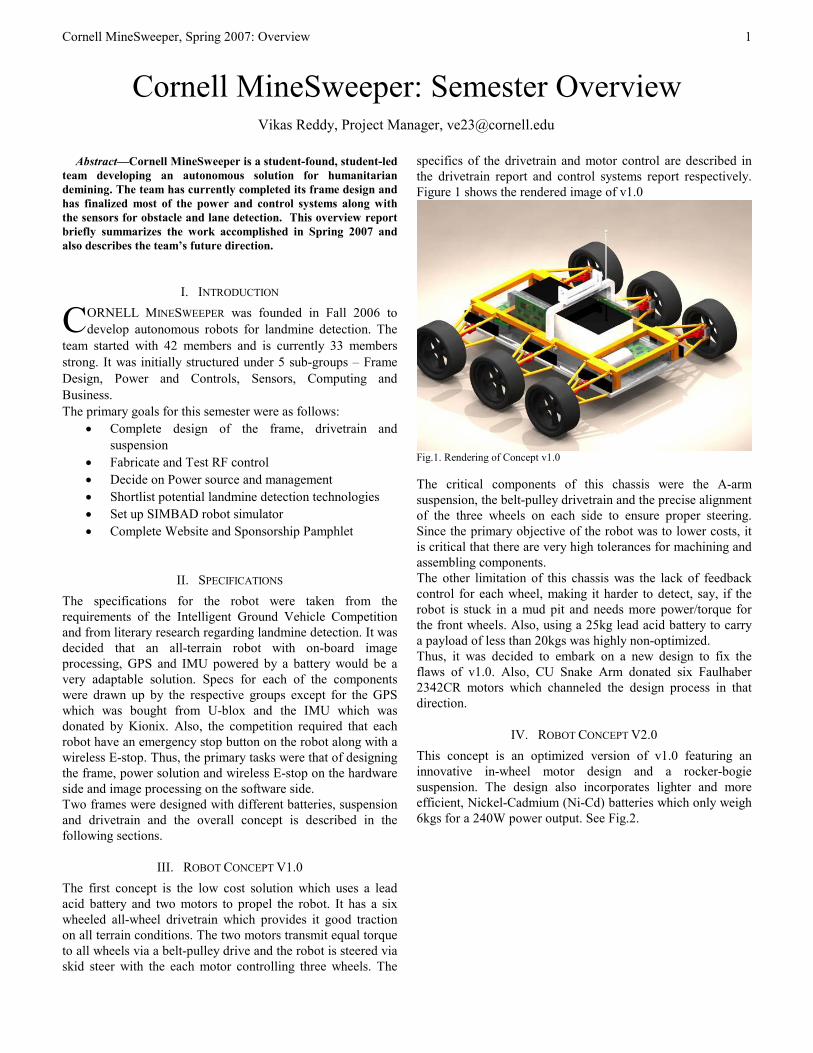
specifics of the drivetrain and motor control are described in
the drivetrain report and control systems report respectively.
Figure 1 shows the rendered image of v1.0
Fig.1. Rendering of Concept v1.0
The critical components of this chassis were the A-arm
suspension, the belt-pulley drivetrain and the precise alignment
of the three wheels on each side to ensure proper steering.
Since the primary objective of the robot was to lower costs, it
is critical that there are very high tolerances for machining and
assembling components.
The other limitation of this chassis was the lack of feedback
control for each wheel, making it harder to detect, say, if the
robot is stuck in a mud pit and needs more power/torque for
the front wheels. Also, using a 25kg lead acid battery to carry
a payload of less than 20kgs was highly non-optimized.
Thus, it was decided to embark on a new design to fix the
flaws of v1.0. Also, CU Snake Arm donated six Faulhaber
2342CR motors which channeled the design process in that
direction.
IV. ROBOT CONCEPT V2.0
This concept is an optimized version of v1.0 featuring an
innovative in-wheel motor design and a rocker-bogie
suspension. The design also incorporates lighter and more
efficient, Nickel-Cadmium (Ni-Cd) batteries which only weigh
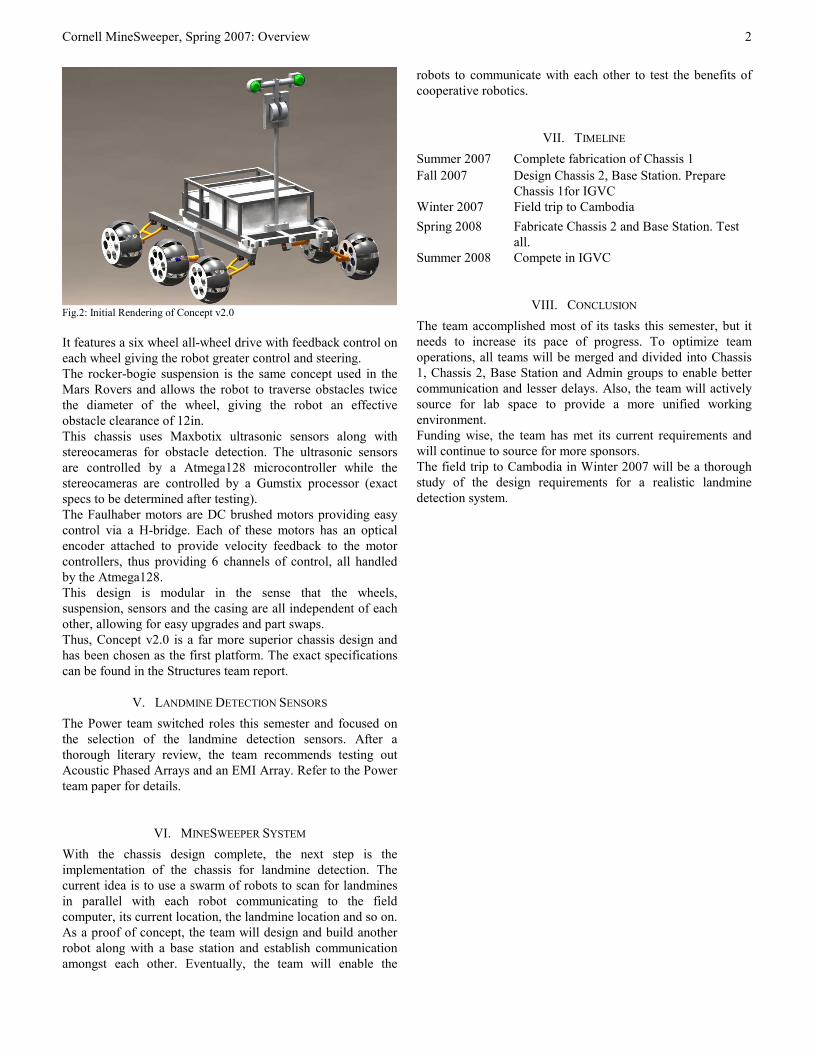
6kgs for a 240W power output. See Fig.2.
Cornell MineSweeper: Semester Overview Vikas Reddy, Project Manager, [email protected]
C
Cornell MineSweeper, Spring 2007: Overview
2
Fig.2: Initial Rendering of Concept v2.0
It features a six wheel all-wheel drive with feedback control on
each wheel giving the robot greater control and steering.
The rocker-bogie suspension is the same concept used in the
Mars Rovers and allows the robot to traverse obstacles twice
the diameter of the wheel, giving the robot an effective
obstacle clearance of 12in.
This chassis uses Maxbotix ultrasonic sensors along with
stereocameras for obstacle detection. The ultrasonic sensors
are controlled by a Atmega128 microcontroller while the
stereocameras are controlled by a Gumstix processor (exact
specs to be determined after testing).
The Faulhaber motors are DC brushed motors providing easy
control via a H-bridge. Each of these motors has an optical
encoder attached to provide velocity feedback to the motor
controllers, thus providing 6 channels of control, all handled
by the Atmega128.
This design is modular in the sense that the wheels,
suspension, sensors and the casing are all independent of each
other, allowing for easy upgrades and part swaps.
Thus, Concept v2.0 is a far more superior chassis design and
has been chosen as the first platform. The exact specifications
can be found in the Structures team report.
V. LANDMINE DETECTION SENSORS
The Power team switched roles this semester and focused on
the selection of the landmine detection sensors. After a
thorough literary review, the team recommends testing out
Acoustic Phased Arrays and an EMI Array. Refer to the Power
team paper for details.
VI. MINESWEEPER SYSTEM
With the chassis design complete, the next step is the
implementation of the chassis for landmine detection. The
current idea is to use a swarm of robots to scan for landmines
in parallel with each robot communicating to the field
computer, its current location, the landmine location and so on.
As a proof of concept, the team will design and build another
robot along with a base station and establish communication
amongst each other. Eventually, the team will enable the
robots to communicate with each other to test the benefits of
cooperative robotics.
VII. TIMELINE
Summer 2007 Complete fabrication of Chassis 1
Fall 2007 Design Chassis 2, Base Station. Prepare
Chassis 1for IGVC
Winter 2007 Field trip to Cambodia
Spring 2008 Fabricate Chassis 2 and Base Station. Test
all.
Summer 2008 Compete in IGVC
VIII. CONCLUSION
The team accomplished most of its tasks this semester, but it
needs to increase its pace of progress. To optimize team
operations, all teams will be merged and divided into Chassis
1, Chassis 2, Base Station and Admin groups to enable better
communication and lesser delays. Also, the team will actively
source for lab space to provide a more unified working
environment.
Funding wise, the team has met its current requirements and
will continue to source for more sponsors.
The field trip to Cambodia in Winter 2007 will be a thorough
study of the design requirements for a realistic landmine
detection system.

Cornell MineSweeper, Spring 2007: Computing
1
Abstract— The Cornell University Minesweeper Computer Science team was formed to develop and oversee the artificial
intelligence of the minesweeper robot. Currently, the team’s goals
are to develop and simulate a navigation algorithm and to obtain
the appropriate computing hardware. This report illustrates the
team’s progress and its future plans.
I. INTRODUCTION
HE computing team worked in two different phases: from
the beginning of the year up to the BOOM presentation
the entire team focused on developing a simulation of our path
finding algorithm in Simbad. Following the demonstration the
team was divided into two sections. One group focused on
developing the navigation algorithm as well as the simulator,
while the other researched a computing hardware setup for the
Minesweeper robot.
II. PATH FINDING
One of the major focuses of this semester was selecting
and implementing an efficient path finding algorithm. The
requirements for the IVGC competition stated that our robot
must be able to follow a path and avoid any obstacles in the
path. A* is an efficient and robust search algorithm capable of
calculating the shortest path to a known goal given an accurate
description of the terrain.
The main requirement for any path finding algorithm is an
accurate graph of the surrounding area containing all possible
nodes and edges. A* computes a path given a starting point
and destination. At each iteration, A* will look at the adjacent
nodes that is estimated to be part of the shortest path to the
destination. The estimation is found by summing the shortest
known path to the current node and a heuristically calculated
distance from the current node to the destination.
III. A*
Our current implementation of A* relies on a matrix
representing the current environment, where the nodes are
represented as cells in the matrix, and edges are implicitly
assumed to be between adjacent cells with weights being a
weighted average between two cells. The edge weights are the
product of the Euclidian distance between the two nodes and
the next node’s weight. Node weights signify expected
difficulty in traveling through the node, where high weights
indicate harder traversal and are avoided. This decision was
made to account for anticipate errors in sensor data and its
interpretation.
It is common in implementations of the A* algorithm to
use two lists to keep track of the portion of the map already
analyzed. The first list is called the “open” list, which stores
the nodes that may potentially be the active node. Our
implementation used a priority queue, ordered by the estimated
shortest path to the destination from the start position,
containing the given node. For each iteration, the active node
is selected by removing the node with the shortest estimated
path, since that node will have the greatest potential for being
on the shortest path. The second list is the “closed” list, which
stores all nodes that have been active. Our implementation of
the closed list used a matrix of equal dimensions to the map.
The elements of the list are initially all null, and when a node
is added to the list, its corresponding location in the matrix is
filled.
The current heuristic used to estimate the distance to the
destination from a given node is simply the Euclidean distance.
Since this gives the distance assuming a best case scenario, it
is always an underestimation. For the purposes of testing, an
underestimation was preferred because this guarantees that the
shortest path is found. However, for practical reasons, the
heuristic should overestimate the distance to the destination,
because this is significantly more efficient and the path found
will still be close to optimal.
Each iteration of A* is centered around an active node.
The first active node is always the start location. Subsequent
active nodes are found by removing the node with greatest
priority on the open list. Once the active node is selected, it is
moved to the closed list, and all adjacent nodes that are not
already on the closed list are added to the open list. Every time
a node is added to the open list, it stores the node from which
it came. If an adjacent node is already on the open list, and its
Cornell MineSweeper: Computing Justin Besant, Griffin Dorman, Nolan Leung, Stephen Milhone, Daniel Zuo
T
Fig. 1: An example of a completed path calculated
with A*.
Cornell MineSweeper, Spring 2007: Computing
2
current estimated shortest path is longer than its estimated
shortest path including the current node, the pointer its to
preceding node is updated. When the active node is the
destination, the algorithm halts and traces backwards to find
the path. In a binary implementation of A* (where nodes are
marked purely as passable or impassable), it is possible that no
feasible paths exist, which is indicated by the open list being
empty. However, our current implementation does not allow a
node to be marked as strictly impassable, only highly
undesirable.
To anticipate the limited information available about the
environment, our algorithm assumes that only data pertaining
to the area around the current location is given. Hence the
algorithm only analyzes at a small fraction of the entire map,
and views the rest of the environment as highly undesirable
until it actually receives data. If the destination is not located
within the area for which information is available, a temporary
goal will be found via a heuristic. The algorithm will attempt
to head towards that goal and in the process move the robot
towards the final goal. New data will then be available
afterwards, and based on the new information, a new heuristic
goal will be selected and a new partial path will be found. This
repeats until the information about the destination is found, at
which point the algorithm will find the path to the destination.
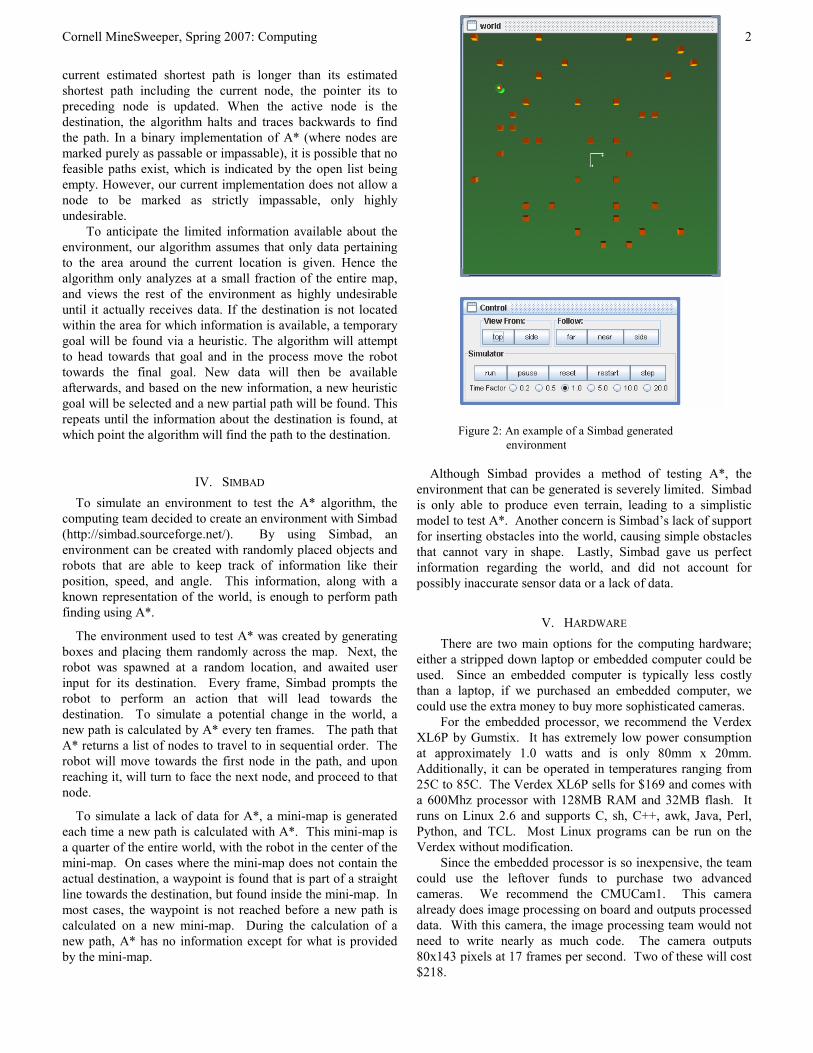
IV. SIMBAD
To simulate an environment to test the A* algorithm, the
computing team decided to create an environment with Simbad
(http://simbad.sourceforge.net/). By using Simbad, an
environment can be created with randomly placed objects and
robots that are able to keep track of information like their
position, speed, and angle. This information, along with a
known representation of the world, is enough to perform path
finding using A*.
The environment used to test A* was created by generating
boxes and placing them randomly across the map. Next, the
robot was spawned at a random location, and awaited user
input for its destination. Every frame, Simbad prompts the
robot to perform an action that will lead towards the
destination. To simulate a potential change in the world, a
new path is calculated by A* every ten frames. The path that
A* returns a list of nodes to travel to in sequential order. The
robot will move towards the first node in the path, and upon
reaching it, will turn to face the next node, and proceed to that
node.
To simulate a lack of data for A*, a mini-map is generated
each time a new path is calculated with A*. This mini-map is
a quarter of the entire world, with the robot in the center of the
mini-map. On cases where the mini-map does not contain the
actual destination, a waypoint is found that is part of a straight
line towards the destination, but found inside the mini-map. In
most cases, the waypoint is not reached before a new path is
calculated on a new mini-map. During the calculation of a
new path, A* has no information except for what is provided
by the mini-map.
Although Simbad provides a method of testing A*, the
environment that can be generated is severely limited. Simbad
is only able to produce even terrain, leading to a simplistic
model to test A*. Another concern is Simbad’s lack of support
for inserting obstacles into the world, causing simple obstacles
that cannot vary in shape. Lastly, Simbad gave us perfect
information regarding the world, and did not account for
possibly inaccurate sensor data or a lack of data.
V. HARDWARE
There are two main options for the computing hardware;
either a stripped down laptop or embedded computer could be
used. Since an embedded computer is typically less costly
than a laptop, if we purchased an embedded computer, we
could use the extra money to buy more sophisticated cameras.
For the embedded processor, we recommend the Verdex
XL6P by Gumstix. It has extremely low power consumption
at approximately 1.0 watts and is only 80mm x 20mm.
Additionally, it can be operated in temperatures ranging from
25C to 85C. The Verdex XL6P sells for $169 and comes with
a 600Mhz processor with 128MB RAM and 32MB flash. It
runs on Linux 2.6 and supports C, sh, C++, awk, Java, Perl,
Python, and TCL. Most Linux programs can be run on the
Verdex without modification.
Since the embedded processor is so inexpensive, the team
could use the leftover funds to purchase two advanced
cameras. We recommend the CMUCam1. This camera
already does image processing on board and outputs processed
data. With this camera, the image processing team would not
need to write nearly as much code. The camera outputs
80x143 pixels at 17 frames per second. Two of these will cost
$218.
Figure 2: An example of a Simbad generated
environment

Cornell MineSweeper, Spring 2007: Computing
3
Unfortunately, an embedded processor will require a
steeper learning curve than a traditional laptop processor.
Some Linux programs may not necessarily work and the
Computing team will need to modify code. For this reason, we
alternatively recommend a low-end laptop. The lowest priced
laptops generally cost about $500 and will carry a processor
similar to a 1.5Ghz Celeron M with 512 MB RAM. Although
it will be easier to implement the robot with a stripped-down
laptop, we will be buying more components than we will need,
and the laptop will consume approximately 35 to 45 watts.
VI. FUTURE GOALS
The following are the goals for the Computing Team
during Fall 2007:
- Write our navigation algorithms in C
- Test our navigation algorithms with sensor input
- Perform field testing with conditions similar to IVGC
competition
- Continue research on navigation
VII. CONCLUSION
During Spring 2007, the Computing Team focused on the
implementation of A*, simulation using Simbad, and hardware
research. Although the team did not perform field tests with
our navigation algorithms, the team is ready to begin testing
and enhancing path finding algorithms with sensor input.

Cornell MineSweeper, Spring 2007: Vision
1
Abstract—The Minesweeper Image Processing Team is
responsible for the development of line detection for the purpose
of the IGVC competition and also the development of an obstacle
matrix. In Spring 2007, much of the emphasis was to develop a
system for line detection, and it was done using the Hough feature
extraction method
I. INTRODUCTION
HE overall scheme developed to detect lines has some
other general components that will be desired for any
image processing applications. The image form the camera is
first calibrated to reduce distortion, then red saturated to
remove problems occurring due to uneven lighting and
shadows, after which the image is passed through an edge
detector, in this case a canny edge detector. This processed,
edge detected image is then processed with a Hough transform
to detect prominent features such as lines.
II. THE HOUGH TRANSFORM
A. Line Detection
The Hough transform is a mapping from the spatial image
space to a parameter space corresponding to a feature that one
wishes to extract. By observing which points of the parameter
space have high density, one can determine where the desired
feature is located in the original image. Thus, we can extract
features such as straight lines using this idea.
A straight-line Hough transform finds the most probable
lines that appear in an image. In this case, the most intuitive
parameter space uses variables m and c, representing the slope
and y-intercept of a line respectively. It is important to note
that a line can be uniquely represented by a pair of m and c
values. Thus, a line in the xy space is equivalent to a point in
the parameter space, as shown in Fig. 1. Rewriting the
equation for a line as (1), we see that a point in xy space maps
to a line in mc space.
c = –xm + y (1)
There are several limitations of this parameter space,
namely the points become unbounded if the slope is very large.
Thus, a vertical line, which is a possible in the spatial domain,
becomes intractable in the mc space. A solution is to consider
Manuscript received May 19, 2007.
T. Ivanov, Siddharth Gauba are undergraduates with the Electrical
Engineering Department, Cornell University, Ithaca NY 14850 USA, (email:
[email protected] [email protected]).
another parameter space based on the polar coordinates of the
point defined as the intersection of the line in question and its
perpendicular counterpart that passes through the origin. The
parameter space is now ρθ. Again, a line in xy maps to a point
in the parameter space as shown in Fig. 2. In this case, a point
from xy space maps to a parabola-like curve in ρθ space. The
closed for expression is shown below in (2).
(2)
An example is shown in Fig. 3.
Fig. 1. Mapping from image space to parameter space. A line in xy space
maps to a point in mc space.
Fig. 2. Mapping from image space to parameter space. A line in xy space
maps to a point in ρθ space.
Fig. 3. Mapping from image space to parameter space. A point in xy space
maps to a curve in ρθ space.
Given a specific feature such as straight lines, the transform
can serve as a method of compression by reducing the image
to a small set of parameters. If only a point is given, then the
Hough transform serves as an estimator of which features
Tonislav Ivanov, Siddharth Gauba
Cornell MineSweeper: Image Processing
T

Cornell MineSweeper, Spring 2007: Vision
2
would contain this point. This is very useful in navigating a
robot through to fallow a straight line drawn on the floor. In
particular, we can use this technique in the design for the
visual system for the IGVC competition.
B. Implementation
The principles of a Hough transform can be applied to find
straight lines in an image. We use an edge detector on an
arbitrary picture, such as the live feed from a camera, to create
a binary image. A Hough transform is applied on every pixel
to form curves such as those in Fig. 3. An accumulator matrix
with cells corresponding to the grid of the ρθ space is created
and every time a curve is draw, a count is added in the matrix
to the cells corresponding to its pixels. This way one can track
the number of times, or “votes,” that a particular point in ρθ
space is a possible line in the image.
Fig. 4. The intersection of the three parabolas in ρθ space correspond to
the line that passes through the three points in the xy space.
Upon scanning the entire image, the points in the feature
space that receive the most votes indicate the most likely lines
in the image. In Fig. 4, all three curves corresponding to the
given three pixels pass through a single intersection point.
That point will receive a count of 3 and will correspond
exactly to the line that passes through all three points.
In creating this estimator, one must consider the resolution of
the accumulator matrix. A matrix with very fine resolution
more accurately estimates the straight lines in the image.
Although this produces a very accurate answer, the system will
be very sensitive to noise since an offset from an ideal line will
make it impossible for all the curves to intersect at the same
point as illustrated in Fig. 5.
Fig. 5. The left picture shows three points that are approximately in a
straight line in the image. As one zooms closer in the parameter space, it is
seen that the intersection of the corresponding curves is not perfect and the
result may be unstable.
This drawback can be fixed several ways. First, one could
reduce the resolution of the accumulator matrix. This will
create fewer possible positions to consider and increase the
probability of intersection. Second, one could apply a 2-
dimensional averaging filter on the accumulator matrix, which
will smooth out the matrix and include the consideration of
neighboring votes. It is important to note, however, that this
phenomenon occurs only when there are relatively few points.
In an image with many points, the problem rarely arises
because enough lines will intersect to produce a correct
response. Moreover, experimentation shows that recognition
can be achieved even in the presence of noise and occlusion.
For example, processing the images in Fig.6 , which have
uneven lighting and other lines etc that could be confounding,
the pre-processing and the relative robustness of the Hough
transform result in a neat result as illustrated by the green lines
in Fig.6.
Fig. 6: Raw images and line detection processing result
Cornell MineSweeper, Spring 2007: Vision
3
C. Limitations
There are several limitations of using this method. First, it is
rather brute force and therefore is computationally expensive.
The algorithm is on the order of O(nmst), where n×m are the
dimensions of the input image and s×t are the dimensions of
the accumulator matrix. Thus, for a real-time application we
need some tweaks. Past research has led to several
enhancements to reduce computation time by intelligently
assigning votes. Also, this algorithm becomes unstable as the
number of variables in the parameter space increase. However,
for lines we only need two variables; thus, the application is
feasible. Finally, the Hough transform is really only successful
if the input image is relatively accurate. While it is effective in
a presence of random outliers and even extraneous objects, it
has trouble dealing with very noisy images. In our case the
assumption of high accuracy holds true, so we can apply to
transform reliably. Overall, this implementation is simple and
works for its purposes.
III. CONCLUSION
The above procedure shows an efficient process for line
detection. Looking to the future, the aim will be to develop a
fast and computationally less expensive method to detect the
possible metric space of motion from the current spot using
depth data from stereo vision. As a result, a delth map could be
created which can be used by the navigation system to
determine the path to follow.
REFERENCES
[1] M. Sonka, V. Hlavac and R. Boyle, Image Processing, Analysis and
Machine Vision, 2nd ed., Pacific Grove, CA: Brooks/Cole Publishing ,
1999.
[2] Wikipedia contributors. Hough transform [Internet]. Wikipedia, The
Free Encyclopedia; 2007 Mar 13, 06:01 UTC [cited 2007 Mar 13].
Available from: http://en.wikipedia.org/w/index.php?title=
Hough_transform&oldid=114738751.
[3] A. Reeves. 2006. ECE 547 Lecture 14: The Hough Transforms. Cornell
University.

Cornell MineSweeper, Spring 07: Control
1
Abstract—This document is a discussion of the ECE team’s
accomplishments over the Spring 2007 semester. These were
comprised of the design of a remote controlled vehicle with
customized remote control functionality, emergency stop ability,
and a dual control mechanism to switch between manual (remote)
and automated (on-board) control.
I. INTRODUCTION
HE semester goals for the ECE team for the Spring
semester were to move from the design phase to actual
procurement of parts, building, testing and integration of all
the systems. The end product is a robot that can be controlled
either manually or through an on-board guidance system as is
being developed by a different group in the project. The entire
remote control protocol is implemented in software, making it
possible to augment the functionality as and when needed by
simply upgrading the firmware on the requisite
microcontrollers. Another feature is the asynchronous
emergency stop system, that may be used to satisfy fault-
tolerance as it operates on a totally different frequency and is
electrically independent of the rest of the circuitry both on the
remote side and the robot side, ensuring the ability to bring the
robot to halt even if all systems fail, as long as the radio
frequency receiver is receiving power from the battery. These
functionalities were developed with an eye towards the IGVC
competition as well as the practical requirements of such a
robot operating in real-time situations, often used by unskilled
or semi-skilled personnel.
II. PCB DESIGN
A. Board Layout
The minesweeper will use two microcontrollers, the Atmel
ATMega32 and the Atmel ATMega128. Each of these chips
will sit on a custom designed circuit board. The Mega32
board connects the microcontroller to the power source and the
RF receivers for the emergency stop. The same board also
holds the digital logic chips to implement the emergency stop.
See Figure 1.
The Mega128 microcontrollers will control the motors.
They will sit on the same circuit board as the motor-driving
circuits, separated by optical isolators.
B. Design and Fabrication
The Mega32 board was completed and fabricated this
semester, while the Mega128 board is not yet finalized due to
insufficient implementation details about any sensors needing
to be interfaced or the protocol for the on-board navigation
system. The boards were designed using the Orcad software
library, drawn first as circuits alone in Orcad Capture, then
exported to the circuit board design in Orcad Layout. Once
the layout was finalized, the design was compiled in the
industry-standard Gerber 274x format and sent to PCBEX
(http://www.pcbex.com) for fabrication.
C. Finalization
Once the Mega32 boards arrived from PCBEX, we
purchased the required resistors, capacitors and digital logic
chips from Digikey (http://www.digikey.com) and soldered
them to the board. We purchased five circuit boards, as that
was the minimum quantity allowed and to allow for human
error, but have only installed the components on one since the
minesweeper will only need one remote control.
III. EMERGENCY STOP AND REMOTE CONTROL
After designing the logic for the remote control and the E-Stop
last semester, this semester saw the implementation and testing
of the logic and the radio transmitter and receiver, as well as
the ordering of the remote control that was customized in order
to control the Minesweeper robot.
The logic of the controller and emergency stop was laid out
and implemented onto a printed circuit board. The controller
logic sends its signals to a Radiotronix 433 MHz transmitter,
while the emergency stop transmits its signals over a
Cornell Minesweeper: Control Systems
Siddharth Gauba, Steve Gilson, Shreya Reddy, Robert Yu
T
Fig 1. Final design of Mega32 board.

Cornell MineSweeper, Spring 07: Control
2
Radiotronix 315 MHz transmitter. There were two encoding
schemes that were tried.
A. Flip flop pattern
In this method, flip flops were arranged to give particular
pattern of output when the E-stop button is pressed. Though
theoretically sound, clock jitters and overlaps renders this
design unreliable based on testing results.
B. Direct Transmission
This is a much simpler technique, in which a 1 is transmitted
if the E-stop button is pressed, and a 0 otherwise. The receiver
then gives a 33% or 66% duty cycle signal to indicate a low or
high level respectively. This is easily fed to the input of a
properly sized (balanced) CMOS inverter to give a 0 if the E-
stop button is pressed. This output is fed to the motors as
supply voltage. As a result, whenever the E-stop is on, 0V is
supplied to the motors, shutting them off. Otherwise, the
output is Vdd and the motors can operate properly.
C. Antenna Design
The remote control has two wire antennas, one for each
operating frequency. The length for each antenna is λ/4. Thus,
For 433 MHz, length= 1/(4*433*10-6) = 9.18 cm
For 315 MHz, length= 1/(4*315*10-6) = 12.6 cm
D. Remote Testing
Fig 3: Sky-Hawk radio controller
A Sky-Hawk 3-channel radio controller was ordered and
subsequently dismantled in order to test its parts. The radio
controller accepts eight 1.5 V AA batteries, making a total 12
V drop across the radio controller.
The left/right and forward/backward controls are used in the
final complete controller design, as well as the chassis. The
internal circuitry that came with the controller will be
discarded in favor of the customized controller logic designed
for the Minesweeper robot.
To test the left/right and forward/backward controls, a 12 V
power source was hooked up to the entire radio controller to
simulate the eight 1.5 V AA batteries that will be powering it,
and a multimeter was used to measure the voltage drop across
each control, which is 5.12 V.
A left/right or forward/backward control consists of a stick that
can be pushed forward and backward or left and right, along
with a variable voltage controller to the side.
A 5.12 V source was then hooked up to the Vcc and ground of
the forward/backward control, and then a multimeter was used
to measure the amount of voltage from the analog Vout pin as
the stick was pushed all the way forward and backward.
It seems that there is a general difference of ~.5 V between the
resting and forward positions’ voltages at all the control
settings, and a ~.6 V difference between resting and backward.
Using this information, an Analog-to-Digital converter can be
used to determine if the control is being pushed forward,
backward, or resting, and send the corresponding signal to the
controller logic. To facilitate this, the control will be left in the
high power setting so as to output the most voltage so the A-
to-D converter will have less trouble converting the signals.
TABLE I
VARIABLE POWER CONTROL AT MIDDLE SETTING
Direction Voltage
Middle (Resting) 2.37 V
Forward 2.919 V
Backward 1.758 V
TABLE II
VARIABLE POWER CONTROL AT HIGH SETTING
Direction Voltage
Middle (Resting) 2.501 V
Forward 3.07 V
Backward 1.878 V
TABLE III
VARIABLE POWER CONTROL AT LOW SETTING
Direction Voltage
Middle (Resting) 2.228 V
Forward 2.776 V
Backward 1.633 V

Cornell MineSweeper, Spring 07: Control
3
IV. REMOTE CONTROL PROTOCOL
A. Design
The Radio Frequency Protocol was implemented to be a
robust and effective method of conveying commands from the
remote to the robot. This was done by sending data packets
containing a summary of all guidance variables (direction of
motion, turning info, speed info). This payload is couched in
pre-determined start and end bytes. This is done to validate the
reception of a valid packet and to eliminate effects of noise
and possible interference by other signals operating at the
same frequency as they will be discarded as void packets. The
hardware for this communication is identical to the emergency
stop setup, except that the chips communicate at 433 MHz
B. Sending a Packet
To optimize communication, a new packet is sent every time a
variable value is updated to something different from its
current value. This provides a much more elegant and safer
technique than just mechanical thoughtless spitting of a packet
at regular intervals of time. When this occurs, a flag value is
set that calls a transmit function. This function synthesizes the
packet from the payload and then transmits the data to the
transmitter using the UDR(Universal Data Register) port.
C. Receiving a packet
The MCU receives packets through the digital DATA output
of the transmitter from the UDR (Universal Data Register)
input port. After a packet of desired length has been received,
the interrupt is flagged. After this, an iterator is used to get all
the bytes in the packet stored into an array. At this stage,
validation checks are done by comparison of start and end
bytes. Payload bytes are then read and used to update system
variable values.
Fig 2: Pinout diagram for the RF receiver
D. Automated control
There are two possible setups in the case that a functioning
navigation system is on-board. The remote control capability
can be completely disregarded, and the remote thus used only
for emergency stopping. However, for most applications it
may be useful to have a switch on the remote control itself that
can be used to disable the onboard system. When the
automatic system is enabled, any RF packets received are
disregarded and the variables are all set by decoding the
packet received from the system computer instead, a process
effectively identical to that of decoding an RF transmitted
packet. When the automatic system is disabled, the remote
uniquely decided the motion parameters.
V. MOTOR CONTROL
A. Overview
The motor control algorithm is implemented on a Mega128L
chip in C. The implementation is for a 4 phase stepper with a
cycle such as the following table:
TABLE IV
STEPPER MOTOR PHASES
This implementation is specifically designed for the Shinano
Kenshi SS58D stepper motors provided with the ER1 test
robot, but can be generalized for any stepper motor.
B. Implementation Details - Hardware
The design hierarchy is the following: The MCU outputs 4
signals, one corresponding to each of the signals in Table IV
(Steps 1 and 5 are duplicate). Due to the nature of motor
operation, there are inherent inductive spikes and noise that
can damage the MCU. Thus, each motor input is isolated from
the MCU using a photodiode pakage such as 4N35. This
effectively isolates the MCU and the motor electrically.
Fig 3: Optoisolator IC
As the motor can draw a fair bit of current, a second stage was
added in the form of a power nMOS transistor, that can handle
upto a maximum of 30W, 30V of VGS and 17Amps of drain
current. Such a transistor was placed to make the design
extremely robust as the transistor can easily withstand the 12V
Cornell MineSweeper, Spring 07: Control
4
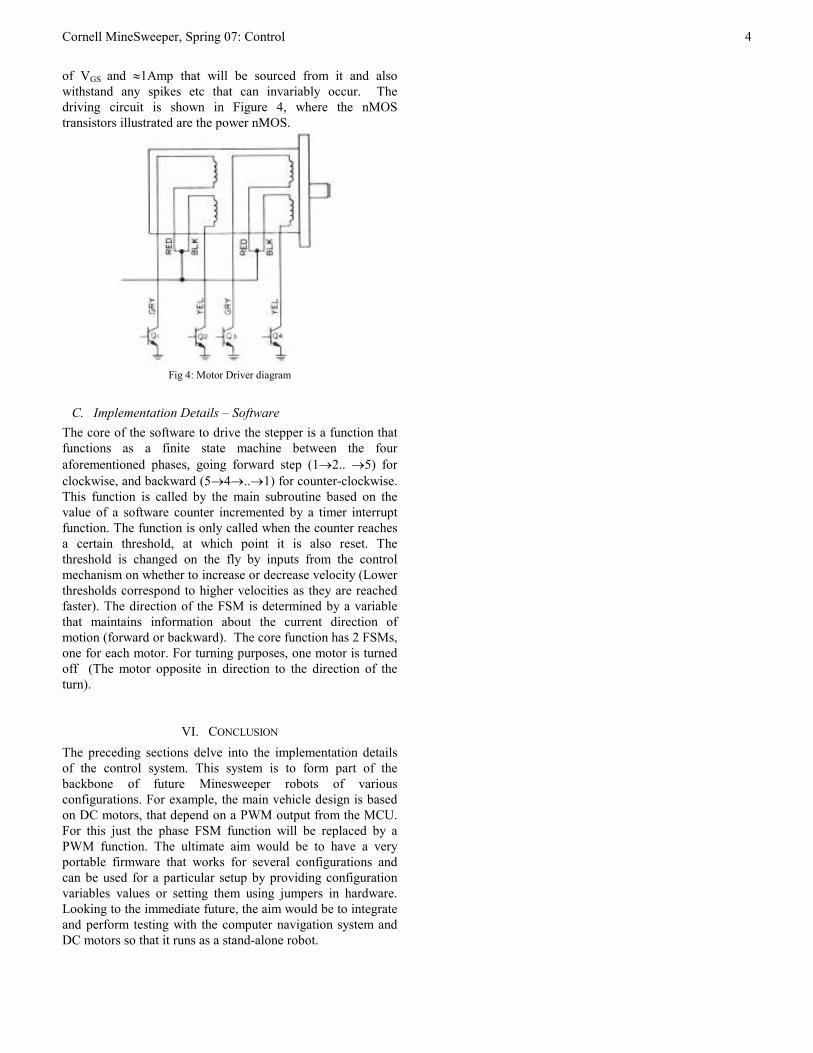
of VGS and ≈1Amp that will be sourced from it and also
withstand any spikes etc that can invariably occur. The
driving circuit is shown in Figure 4, where the nMOS
transistors illustrated are the power nMOS.
Fig 4: Motor Driver diagram
C. Implementation Details – Software
The core of the software to drive the stepper is a function that
functions as a finite state machine between the four
aforementioned phases, going forward step (1→2.. →5) for
clockwise, and backward (5→4→..→1) for counter-clockwise.
This function is called by the main subroutine based on the
value of a software counter incremented by a timer interrupt
function. The function is only called when the counter reaches
a certain threshold, at which point it is also reset. The
threshold is changed on the fly by inputs from the control
mechanism on whether to increase or decrease velocity (Lower
thresholds correspond to higher velocities as they are reached
faster). The direction of the FSM is determined by a variable
that maintains information about the current direction of
motion (forward or backward). The core function has 2 FSMs,
one for each motor. For turning purposes, one motor is turned
off (The motor opposite in direction to the direction of the
turn).
VI. CONCLUSION
The preceding sections delve into the implementation details
of the control system. This system is to form part of the
backbone of future Minesweeper robots of various
configurations. For example, the main vehicle design is based
on DC motors, that depend on a PWM output from the MCU.
For this just the phase FSM function will be replaced by a
PWM function. The ultimate aim would be to have a very
portable firmware that works for several configurations and
can be used for a particular setup by providing configuration
variables values or setting them using jumpers in hardware.
Looking to the immediate future, the aim would be to integrate
and perform testing with the computer navigation system and
DC motors so that it runs as a stand-alone robot.
Cornell MineSweeper, Spring 2007: Power and Mine Detection
1
I. INTRODUCTION
HE power team spent the majority of last semester
researching and designing the power distribution.
However, since the design of the vehicle continues to change,
so does the power requirements. This semester, the battery
selection was finalized for the most probably final mechanical
vehicle design.
Afterwards, the team switched focus onto landmine
detection research. There are many proven and theoretical
methods which were evaluated both in design feasibility and
cost. While it would be great to somehow integrate as many
into our vehicle as possible, methods such as canine-assisted
detection and the use of biological systems are just not feasible
for our goals. The goal was to research all proposed method
and chose those that are most feasible for a moving vehicle to
implement.
II. BATTERIES
A. Introduction
The objective is to choose a battery that has a suitable
lifetime, weight, cost and actual runtime that is comfortable for
research and commercial purposes. The structure of this
section will revolve around defining the needs of our research /
commercial and then the racing. This will followed by a
detailed overview of our options, and then a market available
product.
B. Requirements
Research would require small one hour session ‘bursts’ of
power usage for their respective test runs on equipment. A
single high power, long cycle life battery that is also light
weight would be highly desirable. A fast charge time would
also be desirable. Commercial use, though, would require a
low maintenance, low cost, and high power solution with
decent cycle life. The autonomous robot should be expected to
make a run of almost 5 hours per day.
Racing would have similar requirements, but needs to
have a higher discharge rate since it doesn’t need to process
the presence of mines, but rather just to accomplish the
obstacle course as fast as possible. A run time of 50 minutes
with a fast charge time would be desirable. Also it should be
low cost, so we may afford a second for competition back up.
C. Overview of Battery Types
For cheap production and high durability purposes, standard
lead acid batteries are the obvious choice. They are large and
heavy but considerably cheaper and can easily meet the
vehicle's power demands.
For high performance with a small form factor and
mass, the Li-Ion or Li-Polymer batteries provide a near ideal
solution. The original drawback was that each 12 volt battery
can only supply up to 10-15 amps of current, and to meet our
old peak current requirement of over 60 amps, at least four
packs must be places in parallel. In addition, due to the
delicacies of the batteries at high power outputs, protection
circuits costing about $30-40 per battery are required. The
estimated cost for four batteries including protection circuitry
was $600. Due to changes in motor selection that dropped the
current requirement to a maximum of 14 amps, Lithium Ion
batteries are now an option, but cost is still a considerable
issue.
Although it is several times the weight and twice the volume
as the Lithium based batteries, NiMH batteries provide the
best performing alternative. These batteries satisfy the spike
current requirement and supply the next best energy density
without requiring protection circuitry.
Because the end production vehicle will most likely be
powered by lead acid batteries, the vehicle must be designed
with at least 9000 cm3 of dedicated battery space. Once the
battery is chosen, recharging circuitry will be designed or
purchase to allow for convenient and fast battery recharging. It
is expected that the recharging circuit can be carried on-board
so recharging becomes as simple as plugging the vehicle into
an electrical source. TABLE I A. BATTERY SPECIFICATIONS
Battery Type Ni-Cd NiMH Lead-
Acid
Li-ion/
Polymer
W/kg 150 150 180 1800
Wh/kg 45-80 60-120 30-50 150-190
Lifetime (months) 15 18-24 16 12-16
Cycle Life 1500-
2000
300-800 500-800 300-500
Charge time (h) 1 2-4 8-16 1.5-3
Self Discharge/
month
20% 30% 5% <10%
Operating
Temperature
(Celsius)
-40 to 60 -20 to 60 -20 to 60 -20 to 60
Maintenance 30 to 60
days
60 to 90
days
3 to 6
months
None
For our research and racing, the use of NiCd would be
suitable. It provides a good lifetime, highest cycle life, fastest
Cornell MineSweeper: Power and Mine
Detection
Hamzah Sikander, Michael Hsu, Mathew Meister, Timothy Russell
T

Cornell MineSweeper, Spring 2007: Power and Mine Detection
2
charge time and very high discharge current. It is also light and
cost effective.
D. Options
Both batteries are described in table I b., and both will
apply a Nominal Voltage of 12 V with an maximum load of
235W.
For the Lead Acid Battery, the suggested battery available
in the market is the TG-75 by Tempest Batteries. It comprises
of a special chemistry that allows a small size (for Lead Acid),
longer life and low cost. A Sub-Colloid Electrolyte makes the
same specific gravity in every part of battery, thus preventing
more effectively dropping out of activated substances. Special
details on TG-75:
� Chemistry: Primarily Lead Acid; sub-colloid gel battery
specifically designed for high discharge rate and long
service life of 8-10 years. Sealed Construction: No
electrolyte leakage from the terminals or the case;
efficient operation in any orientation.
� High Energy Density: Large current discharge
performance.
� Special Lead Calcium Alloy: Corrosion resistance and
high recovery capacity.
TABLE I B.
BATTERY SPECS
Battery Type TG-75 Custom NiCd
Rated Capacity 75Ah 20Ah
Watt-Hour ~900 Wh 240W
Expected Runtime 4.5 h 50 min.
Weight (Approx.) 52.90 lbs 12 lbs
Cost $140 ≈$350
Since our current consumption is 235 W (based on new
motors donation), one should expect the total run time to be
approximately 4.5 hours. This takes in account for the fact that
the minesweeper’s load will concentrate more on processing /
detection, which requires far less power.
The second option is a custom NiCd Solution, which is just
a conventional construction of taking NiCd batteries, and
assembling them to our needs. This solution works better
because it is flexible, and we are easily able to raise current
and power if necessary. And although we will consume the
battery withing 50 minutes, its recharge time is approximately
1 hour, whereas the TG-75 would require atleast 5 hours.
Furthermore the NiCd is 12 lbs, which is easy to transport for
our research purposes.
As a closing statement, I would like to commend that both
options are economically viable, and both should be purchased
for their respective purposes.
III. LANDMINE DETECTION
A. Introduction
Mine Detection Sensors are the most integral and difficult
components for implementing an autonomous mine sweeping
robot. Manual prodders who risk their lives would benefit first
from better mine detection methods followed by having an
autonomous/remote controlled robot. The methods we are
researching are chemical methods, electromagnetic methods
and a variety of seismic methods.
B. Chemical Methods
Chemical methods have the highest accuracy, precision and
sensitivity among all detection methods. The search is
particularly for the explosive package versus the non-volatile
components of the mine, and although this method makes
some mines immune due to terrain, weather and container
design, it would be desirable to have such accuracy. The
methods researched by CUMS were Fluorescent,
Electrochemical, and NQR. Although NQR is does not
exactly a chemical method, this was the most fitting category.
The basic principle relies upon waving the device above a
suspected area, and as the fluorescent polymer films are
exposed to air passing through, the explosive particles cling to
the polymer causing a change in the brightness and wavelength
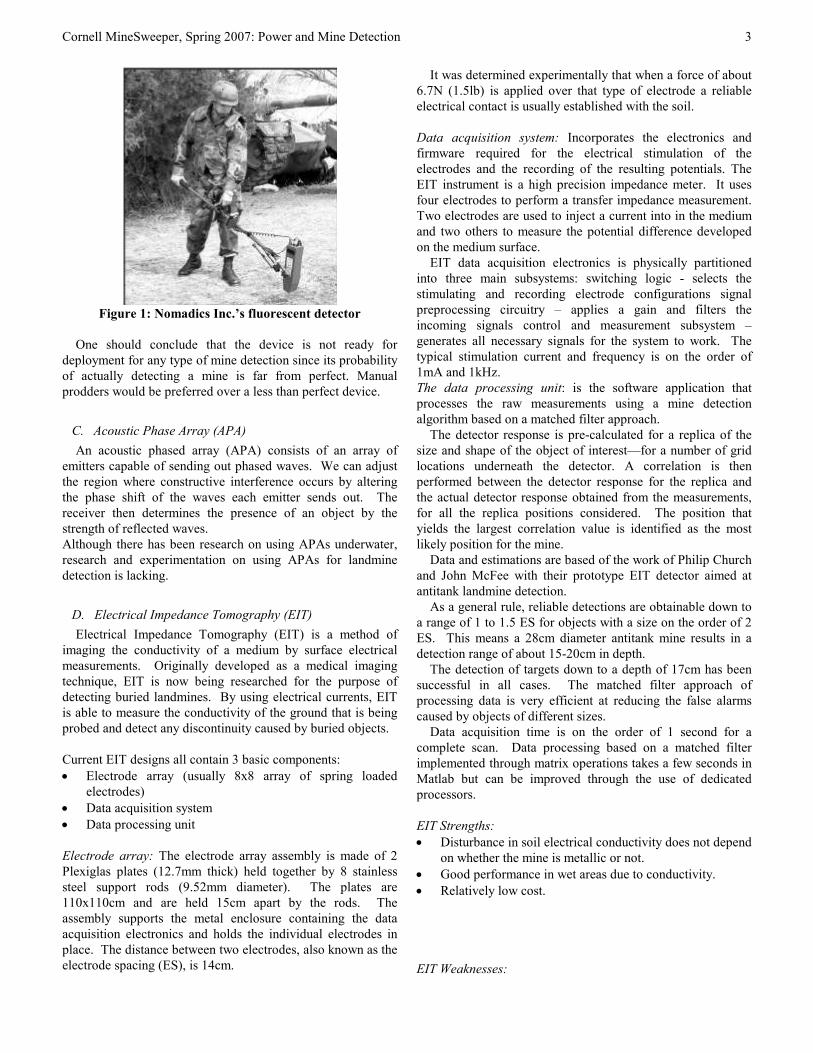
of light emitted. The device is currently being tested by
Nomadics Inc., who has accomplished, but is testing, a military
grade, hand-held detection device. (See figure 1).
Strengths:
� Device can detect explosives from 10-15 g/ml, and future
research will lower this threshold concentration.
� Easy to engineer to a hand held size.
� Since it is a vapor detection method, accuracy will not be
stunted by physical features of a mine, which vary
significantly.
Weaknesses:
� Is rendered useless against dry terrains, and due to its
extremely high sensitivity, it will trigger many false
alarms.
� Mines with their explosive package encased in metal will
not be detected.
� Fluorescents may react with other unknown chemicals in
the environment and trigger a false alarm.
� The technology is immature.
Cornell MineSweeper, Spring 2007: Power and Mine Detection
3
Figure 1: Nomadics Inc.’s fluorescent detector
One should conclude that the device is not ready for
deployment for any type of mine detection since its probability
of actually detecting a mine is far from perfect. Manual
prodders would be preferred over a less than perfect device.
C. Acoustic Phase Array (APA)
An acoustic phased array (APA) consists of an array of
emitters capable of sending out phased waves. We can adjust
the region where constructive interference occurs by altering
the phase shift of the waves each emitter sends out. The
receiver then determines the presence of an object by the
strength of reflected waves.
Although there has been research on using APAs underwater,
research and experimentation on using APAs for landmine
detection is lacking.
D. Electrical Impedance Tomography (EIT)
Electrical Impedance Tomography (EIT) is a method of
imaging the conductivity of a medium by surface electrical
measurements. Originally developed as a medical imaging
technique, EIT is now being researched for the purpose of
detecting buried landmines. By using electrical currents, EIT
is able to measure the conductivity of the ground that is being
probed and detect any discontinuity caused by buried objects.
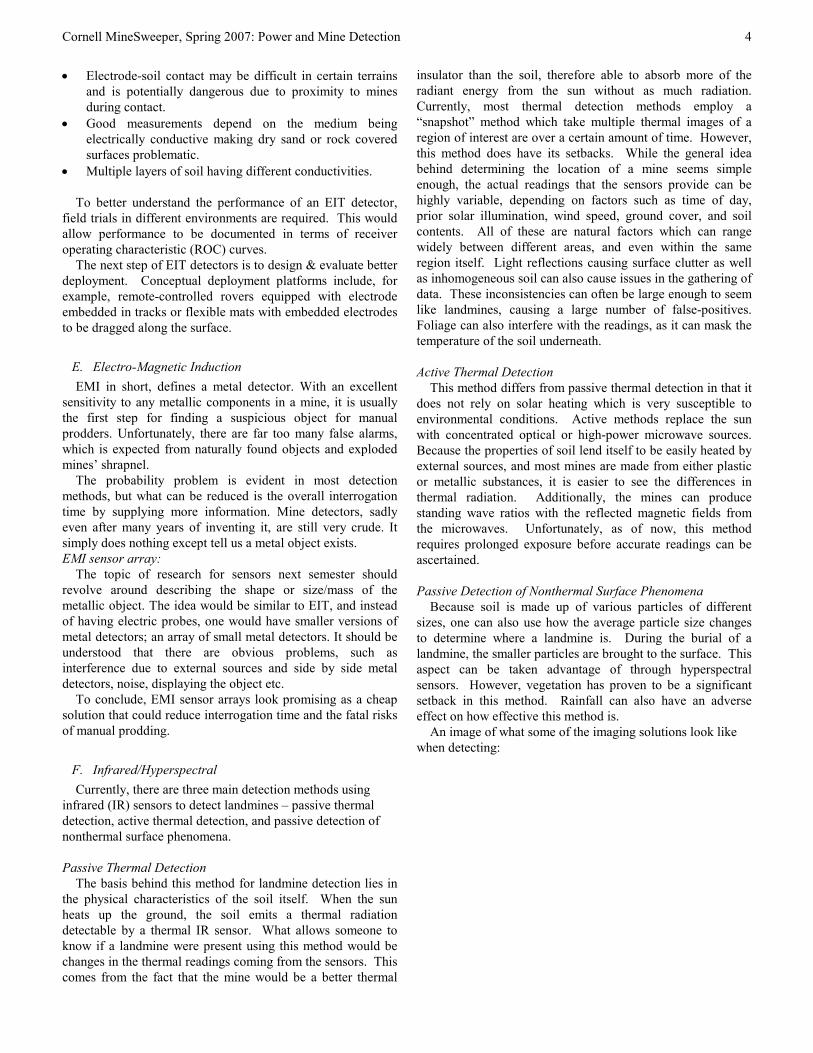
Current EIT designs all contain 3 basic components:
• Electrode array (usually 8x8 array of spring loaded
electrodes)
• Data acquisition system
• Data processing unit
Electrode array: The electrode array assembly is made of 2
Plexiglas plates (12.7mm thick) held together by 8 stainless
steel support rods (9.52mm diameter). The plates are
110x110cm and are held 15cm apart by the rods. The
assembly supports the metal enclosure containing the data
acquisition electronics and holds the individual electrodes in
place. The distance between two electrodes, also known as the
electrode spacing (ES), is 14cm.
It was determined experimentally that when a force of about
6.7N (1.5lb) is applied over that type of electrode a reliable
electrical contact is usually established with the soil.
Data acquisition system: Incorporates the electronics and
firmware required for the electrical stimulation of the
electrodes and the recording of the resulting potentials. The
EIT instrument is a high precision impedance meter. It uses
four electrodes to perform a transfer impedance measurement.
Two electrodes are used to inject a current into in the medium
and two others to measure the potential difference developed
on the medium surface.
EIT data acquisition electronics is physically partitioned
into three main subsystems: switching logic - selects the
stimulating and recording electrode configurations signal
preprocessing circuitry – applies a gain and filters the
incoming signals control and measurement subsystem –
generates all necessary signals for the system to work. The
typical stimulation current and frequency is on the order of
1mA and 1kHz.
The data processing unit: is the software application that
processes the raw measurements using a mine detection
algorithm based on a matched filter approach.
The detector response is pre-calculated for a replica of the
size and shape of the object of interest—for a number of grid
locations underneath the detector. A correlation is then
performed between the detector response for the replica and
the actual detector response obtained from the measurements,
for all the replica positions considered. The position that
yields the largest correlation value is identified as the most
likely position for the mine.
Data and estimations are based of the work of Philip Church
and John McFee with their prototype EIT detector aimed at
antitank landmine detection.
As a general rule, reliable detections are obtainable down to
a range of 1 to 1.5 ES for objects with a size on the order of 2
ES. This means a 28cm diameter antitank mine results in a
detection range of about 15-20cm in depth.
The detection of targets down to a depth of 17cm has been
successful in all cases. The matched filter approach of
processing data is very efficient at reducing the false alarms
caused by objects of different sizes.
Data acquisition time is on the order of 1 second for a
complete scan. Data processing based on a matched filter
implemented through matrix operations takes a few seconds in
Matlab but can be improved through the use of dedicated
processors.
EIT Strengths:
• Disturbance in soil electrical conductivity does not depend
on whether the mine is metallic or not.
• Good performance in wet areas due to conductivity.
• Relatively low cost.
EIT Weaknesses:
Cornell MineSweeper, Spring 2007: Power and Mine Detection
4
• Electrode-soil contact may be difficult in certain terrains
and is potentially dangerous due to proximity to mines
during contact.
• Good measurements depend on the medium being
electrically conductive making dry sand or rock covered
surfaces problematic.
• Multiple layers of soil having different conductivities.
To better understand the performance of an EIT detector,
field trials in different environments are required. This would
allow performance to be documented in terms of receiver
operating characteristic (ROC) curves.
The next step of EIT detectors is to design & evaluate better
deployment. Conceptual deployment platforms include, for
example, remote-controlled rovers equipped with electrode
embedded in tracks or flexible mats with embedded electrodes
to be dragged along the surface.
E. Electro-Magnetic Induction
EMI in short, defines a metal detector. With an excellent
sensitivity to any metallic components in a mine, it is usually
the first step for finding a suspicious object for manual
prodders. Unfortunately, there are far too many false alarms,
which is expected from naturally found objects and exploded
mines’ shrapnel.
The probability problem is evident in most detection
methods, but what can be reduced is the overall interrogation
time by supplying more information. Mine detectors, sadly
even after many years of inventing it, are still very crude. It
simply does nothing except tell us a metal object exists.
EMI sensor array:
The topic of research for sensors next semester should
revolve around describing the shape or size/mass of the
metallic object. The idea would be similar to EIT, and instead
of having electric probes, one would have smaller versions of
metal detectors; an array of small metal detectors. It should be
understood that there are obvious problems, such as
interference due to external sources and side by side metal
detectors, noise, displaying the object etc.
To conclude, EMI sensor arrays look promising as a cheap
solution that could reduce interrogation time and the fatal risks
of manual prodding.
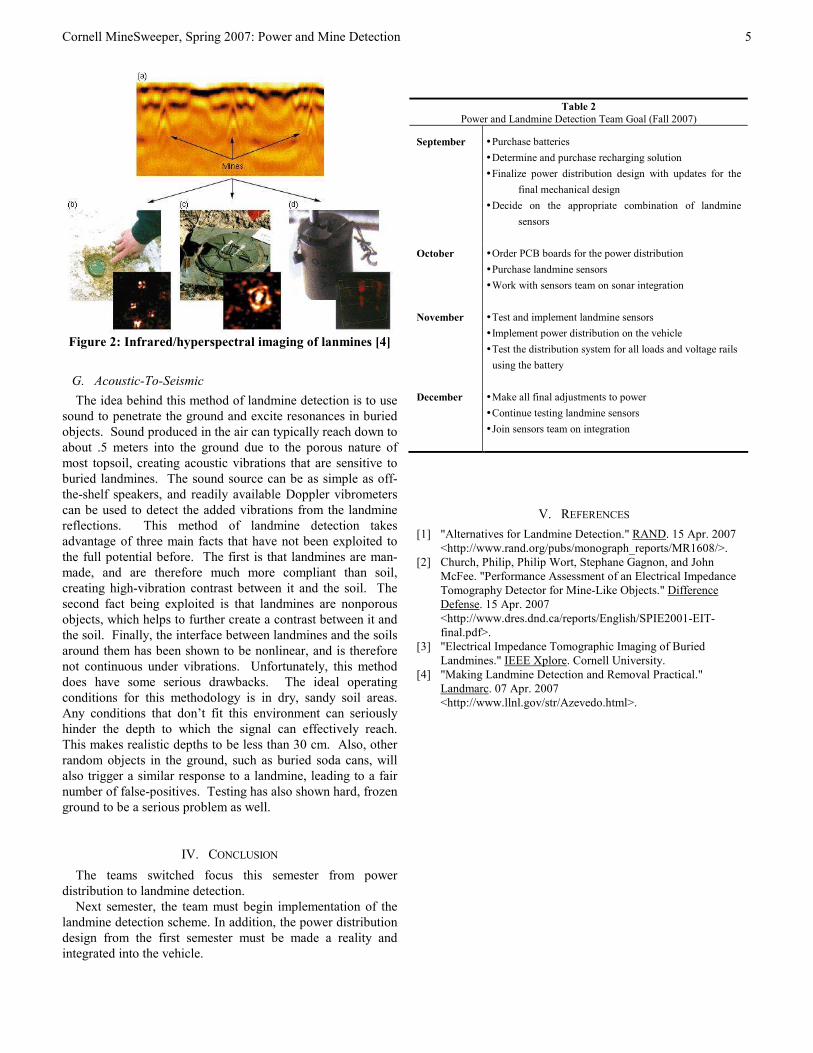
F. Infrared/Hyperspectral
Currently, there are three main detection methods using
infrared (IR) sensors to detect landmines – passive thermal
detection, active thermal detection, and passive detection of
nonthermal surface phenomena.
Passive Thermal Detection
The basis behind this method for landmine detection lies in
the physical characteristics of the soil itself. When the sun
heats up the ground, the soil emits a thermal radiation
detectable by a thermal IR sensor. What allows someone to
know if a landmine were present using this method would be
changes in the thermal readings coming from the sensors. This
comes from the fact that the mine would be a better thermal
insulator than the soil, therefore able to absorb more of the
radiant energy from the sun without as much radiation.
Currently, most thermal detection methods employ a
“snapshot” method which take multiple thermal images of a
region of interest are over a certain amount of time. However,
this method does have its setbacks. While the general idea
behind determining the location of a mine seems simple
enough, the actual readings that the sensors provide can be
highly variable, depending on factors such as time of day,
prior solar illumination, wind speed, ground cover, and soil
contents. All of these are natural factors which can range
widely between different areas, and even within the same
region itself. Light reflections causing surface clutter as well
as inhomogeneous soil can also cause issues in the gathering of
data. These inconsistencies can often be large enough to seem
like landmines, causing a large number of false-positives.
Foliage can also interfere with the readings, as it can mask the
temperature of the soil underneath.
Active Thermal Detection
This method differs from passive thermal detection in that it
does not rely on solar heating which is very susceptible to
environmental conditions. Active methods replace the sun
with concentrated optical or high-power microwave sources.
Because the properties of soil lend itself to be easily heated by
external sources, and most mines are made from either plastic
or metallic substances, it is easier to see the differences in
thermal radiation. Additionally, the mines can produce
standing wave ratios with the reflected magnetic fields from
the microwaves. Unfortunately, as of now, this method
requires prolonged exposure before accurate readings can be
ascertained.
Passive Detection of Nonthermal Surface Phenomena
Because soil is made up of various particles of different
sizes, one can also use how the average particle size changes
to determine where a landmine is. During the burial of a
landmine, the smaller particles are brought to the surface. This
aspect can be taken advantage of through hyperspectral
sensors. However, vegetation has proven to be a significant
setback in this method. Rainfall can also have an adverse
effect on how effective this method is.
An image of what some of the imaging solutions look like
when detecting:
Cornell MineSweeper, Spring 2007: Power and Mine Detection
5
Figure 2: Infrared/hyperspectral imaging of lanmines [4]
G. Acoustic-To-Seismic
The idea behind this method of landmine detection is to use
sound to penetrate the ground and excite resonances in buried
objects. Sound produced in the air can typically reach down to
about .5 meters into the ground due to the porous nature of
most topsoil, creating acoustic vibrations that are sensitive to
buried landmines. The sound source can be as simple as off-
the-shelf speakers, and readily available Doppler vibrometers
can be used to detect the added vibrations from the landmine
reflections. This method of landmine detection takes
advantage of three main facts that have not been exploited to
the full potential before. The first is that landmines are man-
made, and are therefore much more compliant than soil,
creating high-vibration contrast between it and the soil. The
second fact being exploited is that landmines are nonporous
objects, which helps to further create a contrast between it and
the soil. Finally, the interface between landmines and the soils
around them has been shown to be nonlinear, and is therefore
not continuous under vibrations. Unfortunately, this method
does have some serious drawbacks. The ideal operating
conditions for this methodology is in dry, sandy soil areas.
Any conditions that don’t fit this environment can seriously
hinder the depth to which the signal can effectively reach.
This makes realistic depths to be less than 30 cm. Also, other
random objects in the ground, such as buried soda cans, will
also trigger a similar response to a landmine, leading to a fair
number of false-positives. Testing has also shown hard, frozen
ground to be a serious problem as well.
IV. CONCLUSION
The teams switched focus this semester from power
distribution to landmine detection.
Next semester, the team must begin implementation of the
landmine detection scheme. In addition, the power distribution
design from the first semester must be made a reality and
integrated into the vehicle.
Table 2
Power and Landmine Detection Team Goal (Fall 2007)
September
� Purchase batteries
� Determine and purchase recharging solution
� Finalize power distribution design with updates for the
final mechanical design
� Decide on the appropriate combination of landmine
sensors
October � Order PCB boards for the power distribution
� Purchase landmine sensors
� Work with sensors team on sonar integration
November � Test and implement landmine sensors
� Implement power distribution on the vehicle
� Test the distribution system for all loads and voltage rails
using the battery
December � Make all final adjustments to power
� Continue testing landmine sensors
� Join sensors team on integration
V. REFERENCES
[1] "Alternatives for Landmine Detection." RAND. 15 Apr. 2007
<http://www.rand.org/pubs/monograph_reports/MR1608/>.
[2] Church, Philip, Philip Wort, Stephane Gagnon, and John
McFee. "Performance Assessment of an Electrical Impedance
Tomography Detector for Mine-Like Objects." Difference
Defense. 15 Apr. 2007
<http://www.dres.dnd.ca/reports/English/SPIE2001-EIT-
final.pdf>.
[3] "Electrical Impedance Tomographic Imaging of Buried
Landmines." IEEE Xplore. Cornell University.
[4] "Making Landmine Detection and Removal Practical."
Landmarc. 07 Apr. 2007
<http://www.llnl.gov/str/Azevedo.html>.

Cornell MineSweeper, Spring 2007: Sensors
1
Abstract — The aim of Cornell University’s Minesweeper
project is to create a cost effective autonomous robot which will
detect landmines more accurately than current de-mining devices.
One of the Minesweeper’s features is an obstacle detection and
navigation system to minimize the need for constant human
supervision. The objective of the sensors team is to develop such an
avoidance system by using strategically placed sonar sensors to
measure the distance of the vehicle from any object in its path. The
vehicle can then plan how to maneuver itself around the obstacle
accordingly. In addition to sonar, the sensors team is also
responsible for the integration of a Global Positioning System and
Inertial Measurement Unit for determining the positioning and
acceleration of the vehicle. This report describes the key
developments which the sensors team has made this semester along
with a plan for future action.
I. INTRODUCTION
hroughout the semester, the sensors team has been
working with sonar obstacle detection units. Research
and testing of the units has been performed. The optimal
configuration with respect to reliability and efficiency has been
determined for use in an automated vehicle.
The GPS and IMU units both have been integrated and tested
in a linux environment. Engineering trade-offs must be
considered before integration onto the vehicle.
II. SONAR RESEARCH
Preliminary research began last semester. Initially, devices
were researched which could be used to detect any obstacle
around the vehicle. The range of such a device needed to be
between 0.22 meters (0.73 ft) to 10 meters (32.8 ft), so that the
vehicle can navigate around the obstacle. Six potential
productes were found which matched specifications.
Ultimately, the MaxBotix EZ-1 sonar unit was chosen because it
was inexpensive, reliable, and easy to handle. The sensor
chosen has the following properties:
• 2.5V to 5.0V operation
• 2mA current draw
• Serial data output
• Analog voltage output (voltage ~ distance)
• Range of 6 inches to 200 inches (~15cm to 500cm)
• Continuous measurements (can be triggered externally)
• Fast measurements (max. of 50ms per reading)
• $25 per unit
The MaxBotix EZ-1 Sonar Range Finder is very small and
therefore will not take up much space on the vehicle. The
dimensions of the sensor are shown in Figure 1 below:
Figure 1. The above diagram shows the dimensions of the sensor. Since the
unit is very small, putting many sensors onto the vehicle will be
simple and will not cause any cluttering.
III. TESTING OF THE SONAR PROTOTYPE
After the prototype arrived, it was tested by following the
possible patterns of the sonar sensor. The detailed testing of the
sonar sensor was carried out by observing the precision of the
measured distance versus the actual distance from an object.
From the test results, the data specifications provided by the
manufacturer were adjusted, since the actual range of vision had
some discrepancies. It was decided to use the sensors to detect
obstacles at a range their peak accuracy within a 30 by 100 inch
area, 50 inches in front of the sensor, as seen in Figure 2. The
measurements appearing in Table 1 show the maximum lateral
distance from the sensor for which the data output still gives a
continuously accurate reading. All the data collected in this
experiment was taken using the analog output of the unit, which
outputs ~9.8mV per inch distance between the sensor and the
object being detected.
Cornell MineSweeper: Sensors
Nana Wu, Jehhal Liu, Chin-Hung Chen, Timothy Russell
T

Cornell MineSweeper, Spring 2007: Sensors
2
Figure 2. Sonar pattern plotted from the data collected, each point
representing the distance from the central axis. The vision of the
sonar starts narrow and is the widest at around 110 inches from the
sensor. As distance increases the width of the vision tapers off.
Sensor is located at the origin of the graph.
IV. LAYOUT OF THE SONAR SENSORS
Taking the limitations of the sonar into consideration, various
possible layout schemes were considered for the placement of
the sensors on the Minesweeper vehicle.
The original design for the layout was laid out so that the front
of the vehicle had the widest range of vision. Placing the
sensors solely perpendicular to the sides of the vehicle would
leave large blind spots in the corners, which could cause
problems when the vehicle makes turns. Therefore, the
preliminary design was to place three sensors on the front of the
vehicle, one on each side facing out to the right and left, and two
on the top which are directed out by 45 degrees to point towards
the direction that the robot was turning. The design can be seen
in Figure 3 below. This design was later altered to place more
sensors on the sides, to ensure that the vehicle has optimal
vision around the perimeter in order to avoid any structural
damage.
Figure 3. The original idea for the placement of the sensors around the
vehicle. Three sensors were placed in front to ensure avoidance of
all obstacles directly ahead. Sensors on top were added to catch
any obstacles while turning.
The final configuration minimizes the blind spot of the
vehicle and provides the widest and most useful field of
detection. The sensors on the front of the vehicle were
positioned such that two sensors were placed higher on the sides
than the middle sensor which was placed closer to the ground.
Same layout applies to the two sides of the robot but shifted
more toward the front edge of the vehicle. Figure 4 shows the
layout from two different views.
Figure 4. The sensors will be arranged around the vehicle as described above.
The top figure shows a birds-eye view of the vehicle, showing how
the sensors will be arranged around the perimeter. The bottom
figure shows a head-on view, showing that the middle sensor on
each side will be set lower than the other two sensors.
Another limitation that was taken into consideration is the fact
that these sensors use sound waves. These waves could
potentially interfere when two or more units are in use
simultaneously. For instance, one sensor could pick up a sound
wave that was emitted from a different sensor at an earlier time,
thus changing the outcome of the distance reading. Also, when
two sensors emit their sound waves at the same time, the two
waves could return completely out of phase, in which case the
waves would be cancelled out, causing the sensor to miss the
obstacle completely. In order to avoid this problem, the sensors
will need to be carefully operated, taking into account any
detrimental physical effects that could occur during usage. One
Table 1
Data collected from prototype testing (inches)
Distance
from
sensor
Distance
Left of the
axis
Distance
from
sensor
Distance
Right of the
axis
25.5 -48 46 11.5
32 -62 60 15.5
46 -19 67 16
66.5 -27 79 25.25
76 -39 88 25.5
89.5 -40 97 30
92.5 -36 99 23
110 -40 117 30
117 -38 119 22.5
117.5 -47 125 18
138 -32 137 15.5
139 -35.5 144 20
157 -25 149 13.5
170 -11 161 0
162 -20

Cornell MineSweeper, Spring 2007: Sensors
3
possibility is to ensure that sensors used simultaneously within a
50ms span be pointed in completely different directions.
V. SERIAL PORT CONNECTION
Initially, simultaneous control of multiple sensors using a
RS-232 serial port was attempted. After soldering one sensor
onto the port, range detection was successfully performed with a
single sonar sensor. However, the difficulty arose when several
sensors were connected to the same serial port. The unit could
not be controlled and the data could not be read using just one
port. Since each of the nine pins on a RS-232 port has a specific
function, the sonar units cannot be individually connected to
independent pins/ . At first, we thought only a few of the nine
pins were needed to serve as power supply, ground, input signal
and output signal. Though power, ground and input pins could
be implemented easily for multiple sensors, collecting and
converting the obtained output readings from our sensors to a
serial format was unsuccessful. Therefore, it was concluded
that in order for all nine of our proposed sensors to work at the
same time, nine serial ports would be necessary. Since this
option is not feasible, other methods for simultaneous multiple
sensor operation was considered.
VI. LINKING MULTIPLE UNITS IN SERIES
The next step was to try linking multiple units in series, based
on a diagram given on the manufacturer’s website. Using one
resistor, and one diode per unit, the manufacturer suggested that
it was possible to obtain data from multiple sensors by
measuring the pulse width of their output. After linking two
units together, it was found that the detection of the pulse widths
was impractical and perhaps too difficult to be performed
correctly and accurately. Furthermore, it was later found out that
the manufacturer had stopped recommending this layout
because noise affected the output greatly. Because of the
multiple I/O ports available on a microcontroller, it is an ideal
solution for collecting data from the sonars and then sending
them serially to the computer for processing. The
microcontroller can send out commands to each sonar to take a
reading. When the microcontroller has received all
measurements, they can be strung together and separated by a
character. A packet is then sent serially to the computer while
the next set of measurements is taken. The specifics of such an
operation will be determined next semester.
Figure 5. The layout suggested by the manufacturer. One diode is needed for
each sensor and one resistor for the entire set up. PW is the output
collected as the pulse width of the output represents the range
detected.
VII. SONAR ENCLOSURE
An enclosure is necessary for the sensors to properly operate
outdoors. Since the sensor itself is designed to be used in an
indoor environment, a protective covering is necessary. While
most of the enclosure could be made of anything that satisfies
the conditions, the front of the enclosure must be permeable to
sonar and not affect the readings of the sensors. After trying out
various materials, including glass, wire mesh, plastic, elastic
material and fabric, abrasive foam was decided upon. This
material would be able to protect the sensor while still being
permeable to sound so that the sensor could still make accurate
readings.
VIII. SONAR FUTURE OBJECTIVES
After testing various methods of operation, the original
design was decided against. A microcontroller will be used to
collect the output of the sensors and relay the data to the main
computer.
After successful communication between the computer and
the sensors is obtained, cooperation with the mechanical team is
necessary to construct the final layout of the nine sensors
distributed throughout the vehicle. After mounting the sensors
onto the vehicle, the final design can be tested to see if the
vehicle can maneuver while avoiding any obstacles in its path.
Upon the completion of the sonar system, research and
implementation of short range sensors will be considered.
These are used to detect any objects within six inches or less of
the vehicle. They are essential because the sonar sensors cannot
operate reliably in such a short range. These short range sensors
will be used as a backup system to ensure that no objects come
close enough to the vehicle to damage the unit.
IX. GPS IMPLEMENTATION
The GPS purchased is the uBlox AEK-4T timing kit. It
includes a processing unit, antennae, and USB connection. All
power is derived from the USB port. The GPS unit includes a
Windows driver with accompanying software. However, the
on-board computer on the vehicle is specified to be operating in
a Linux environment most likely with a Debian flavour. Thus,
the goal for GPS implementation is to find a solution for
integrating the GPS unit into a Linux environment and test its
accuracy.
Fortunately, typical GPS unit operate by communication
using National Marine Electronics Association standard
sentences. These sentences are begun by a word which
determines how the remainder of the packet should be
interpreted. Because the unit uses the NMEA standard, a
daemon can simply run on the computer interpreting this stream
of sentences.
A daemon named GPSD is capable of interpreting all NMEA
sentences. This open-source solution operating on the Linux
kernel permits easy parsing of the sentences. A simple perl
script was written to connect to gpsd and parse the output for
latitudinal, longitudinal, altitude, and speed information. This
information can be passed onto other programs and scripts
running on the vehicle computer.

Cornell MineSweeper, Spring 2007: Sensors
4
To view the GPS output, a program called XGPS was run
which displays satellite positions and all relevant data according
to the GPSD parsed NMEA sentences.
Figure 1: XGPS output using the uBlox GPS unit
To test the unit, a perl script was run which outputs the
longitudinal and latitudinal position every second. The GPS
unit was moved a set distance of 10 meters due south. This is
movement in the latitudinal direction.
The plotted results show noise in the longitudinal direction
but a convincing change in latitude. This change is about
0.0001 degree change in latitude. Taking into account the
latitude and curvature of the earth, this difference corresponds
to a change in distance of 11.108 meters. Thus, the GPS is
relatively accurate. Over a range of 10 tests, the average
difference in distance was 15.3%. This corresponds to
reasonable results. This is too high for any reliable speed
calculations but appropriate for relative positioning.
X. IMU IMPLEMENTATION
An inertial measurement unit is typically used to detect
altitude, location, and motion. These units are typically
composed of accelerometers, angular rate sensors, and a
processing unit to make calculations as a result of the sensor
outputs. Change from initial positions is calculated from the
current acceleration and rate of change in altitude.
The unit received for testing is the Kionix KXM52-DEV-V1.
It is in actuality just an accerometer board and not a true IMU
because it lacks both the gyroscopes and processing unit. As a
result, it is not just a plug and play solution.
The unit is again packaged with just Windows software and a
Linux solution must be created. The on-board MCU performs
the analog to digital conversion and is programmed to respond
to commands on an RS232 serial port. The byte commands are
as follows:
Code Description
X Send X acceleration
Y Send Y acceleration
Z Send Z acceleration
A Send X,Y, and Z Accelerations
T Send T (Echo Command)
Although, a Linux driver is unavailable, raw serial
communication can be used. This again just requires a script to
communicate with the on-board microcontroller.
The steps required to obtain an acceleration in units of g are:
1. Configure serial port (Baud rate, parity settings, data rate,
etc.)
2. Open the serial port and send the echo command to ensure the
microcontroller is on and operational
3. Send the ‘A’ command
4. Receive X, then Y, then Z accelerations in serial
5. Divide all three by the analog to digital ratio of 1241.2121
6. Subtract the offset of the accelerometer of 1.650
7. Divide by the sensitivity of the accelerometers
This process is written in a simple perl script.
The most difficult portion of using the board is that the
velocity and distances must be calculated. Current velocity can
be predicted from a reference velocity plus the acceleration
times time. Knowing the time between acceleration values, the
change in velocity can easily be calculated. This is added to the
previous period’s velocity to determine the current. The
distance travelled then can be estimated using the average of the
current calculated velocity and the previously calculated
velocity multiplied by the change in time between the two
values.
Angle of tilt can also be roughly estimated by taking the
arcsin on the Z axis.
Noise on acceleration propogates through all of the
calculations and is additive from the original known reference
velocity. This is one area where the GPS can come in handy.
Close to a known velocity such as a stopped position, the
accelerometer based velocity and position will be accurate and
can be used to calibrate the GPS. Later as noise propogates
through the system, the GPS can be used to check the sanity of
these values.
The accelerometer board is a useful tool for the autonomous
vehicle. If possible however, a full IMU solution is
recommended for accuracy and to reduce the processing strain
on the on-board computer. The current solution will suffice if
necessary and is easily integrated into a Linux environment.
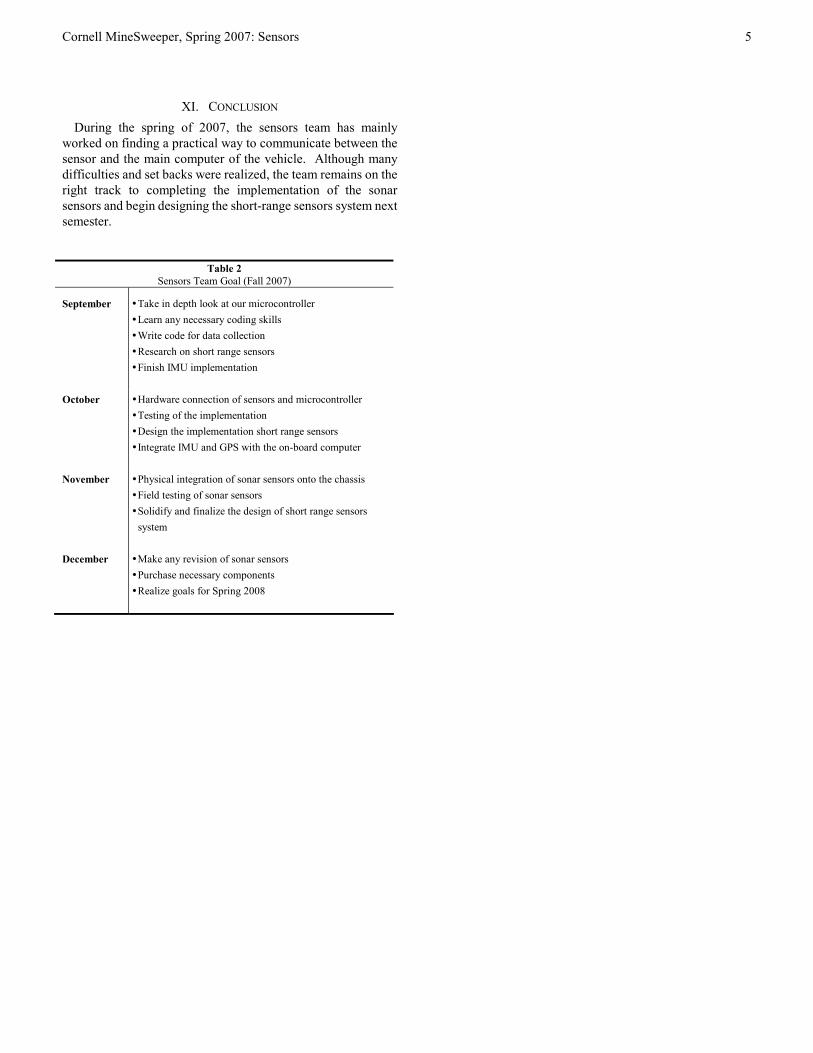
Cornell MineSweeper, Spring 2007: Sensors
5
XI. CONCLUSION
During the spring of 2007, the sensors team has mainly
worked on finding a practical way to communicate between the
sensor and the main computer of the vehicle. Although many
difficulties and set backs were realized, the team remains on the
right track to completing the implementation of the sonar
sensors and begin designing the short-range sensors system next
semester.
Table 2
Sensors Team Goal (Fall 2007)
September
� Take in depth look at our microcontroller
� Learn any necessary coding skills
� Write code for data collection
� Research on short range sensors
� Finish IMU implementation
October � Hardware connection of sensors and microcontroller
� Testing of the implementation
� Design the implementation short range sensors
� Integrate IMU and GPS with the on-board computer
November � Physical integration of sonar sensors onto the chassis
� Field testing of sonar sensors
� Solidify and finalize the design of short range sensors
system
December � Make any revision of sonar sensors
� Purchase necessary components
� Realize goals for Spring 2008
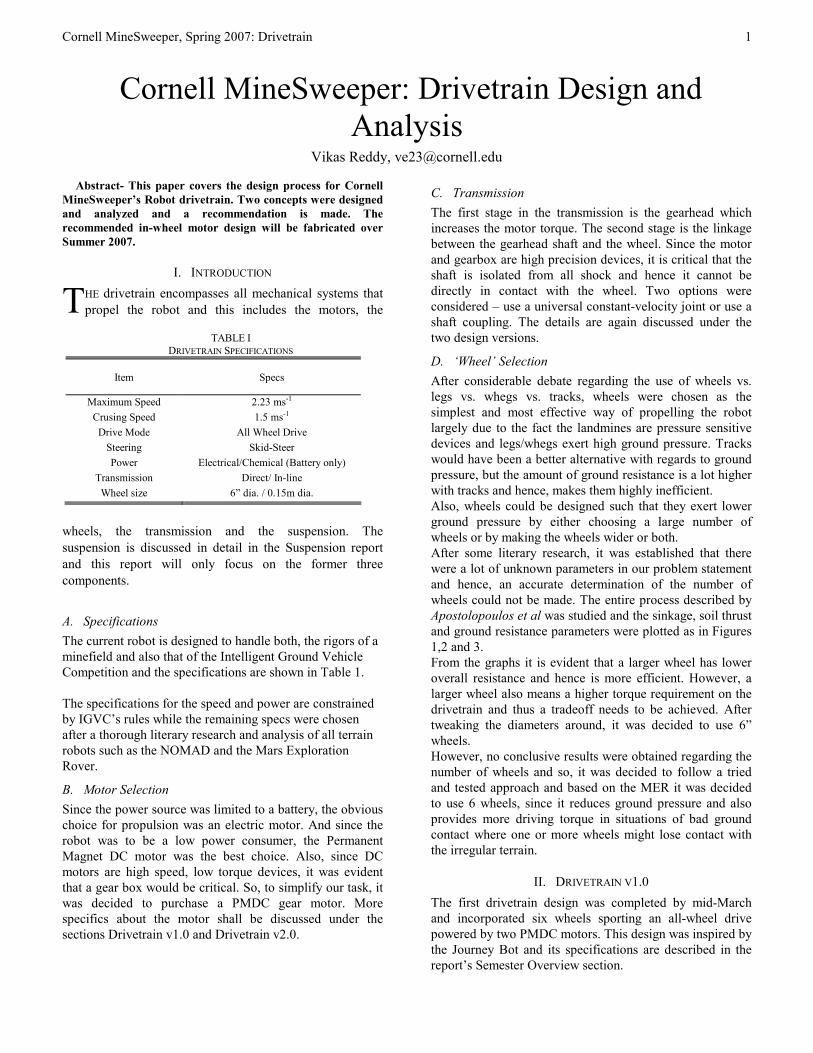
Cornell MineSweeper, Spring 2007: Drivetrain
1
Abstract- This paper covers the design process for Cornell
MineSweeper’s Robot drivetrain. Two concepts were designed
and analyzed and a recommendation is made. The
recommended in-wheel motor design will be fabricated over
Summer 2007.
I. INTRODUCTION
HE drivetrain encompasses all mechanical systems that
propel the robot and this includes the motors, the
wheels, the transmission and the suspension. The
suspension is discussed in detail in the Suspension report
and this report will only focus on the former three
components.
A. Specifications
The current robot is designed to handle both, the rigors of a
minefield and also that of the Intelligent Ground Vehicle
Competition and the specifications are shown in Table 1.
The specifications for the speed and power are constrained
by IGVC’s rules while the remaining specs were chosen
after a thorough literary research and analysis of all terrain
robots such as the NOMAD and the Mars Exploration
Rover.
B. Motor Selection
Since the power source was limited to a battery, the obvious
choice for propulsion was an electric motor. And since the
robot was to be a low power consumer, the Permanent
Magnet DC motor was the best choice. Also, since DC
motors are high speed, low torque devices, it was evident
that a gear box would be critical. So, to simplify our task, it
was decided to purchase a PMDC gear motor. More
specifics about the motor shall be discussed under the
sections Drivetrain v1.0 and Drivetrain v2.0.
C. Transmission
The first stage in the transmission is the gearhead which
increases the motor torque. The second stage is the linkage
between the gearhead shaft and the wheel. Since the motor
and gearbox are high precision devices, it is critical that the
shaft is isolated from all shock and hence it cannot be
directly in contact with the wheel. Two options were
considered – use a universal constant-velocity joint or use a
shaft coupling. The details are again discussed under the
two design versions.
D. ‘Wheel’ Selection
After considerable debate regarding the use of wheels vs.
legs vs. whegs vs. tracks, wheels were chosen as the
simplest and most effective way of propelling the robot
largely due to the fact the landmines are pressure sensitive
devices and legs/whegs exert high ground pressure. Tracks
would have been a better alternative with regards to ground
pressure, but the amount of ground resistance is a lot higher
with tracks and hence, makes them highly inefficient.
Also, wheels could be designed such that they exert lower
ground pressure by either choosing a large number of
wheels or by making the wheels wider or both.
After some literary research, it was established that there
were a lot of unknown parameters in our problem statement
and hence, an accurate determination of the number of
wheels could not be made. The entire process described by
Apostolopoulos et al was studied and the sinkage, soil thrust
and ground resistance parameters were plotted as in Figures
1,2 and 3.
From the graphs it is evident that a larger wheel has lower
overall resistance and hence is more efficient. However, a
larger wheel also means a higher torque requirement on the
drivetrain and thus a tradeoff needs to be achieved. After
tweaking the diameters around, it was decided to use 6”
wheels.
However, no conclusive results were obtained regarding the
number of wheels and so, it was decided to follow a tried
and tested approach and based on the MER it was decided
to use 6 wheels, since it reduces ground pressure and also
provides more driving torque in situations of bad ground
contact where one or more wheels might lose contact with
the irregular terrain.
II. DRIVETRAIN V1.0
The first drivetrain design was completed by mid-March
and incorporated six wheels sporting an all-wheel drive
powered by two PMDC motors. This design was inspired by
the Journey Bot and its specifications are described in the
report’s Semester Overview section.
Cornell MineSweeper: Drivetrain Design and
Analysis Vikas Reddy, [email protected]
T TABLE I
DRIVETRAIN SPECIFICATIONS
Item Specs
Maximum Speed 2.23 ms-1
Crusing Speed 1.5 ms-1
Drive Mode All Wheel Drive
Steering Skid-Steer
Power Electrical/Chemical (Battery only)
Transmission Direct/ In-line
Wheel size 6” dia. / 0.15m dia.
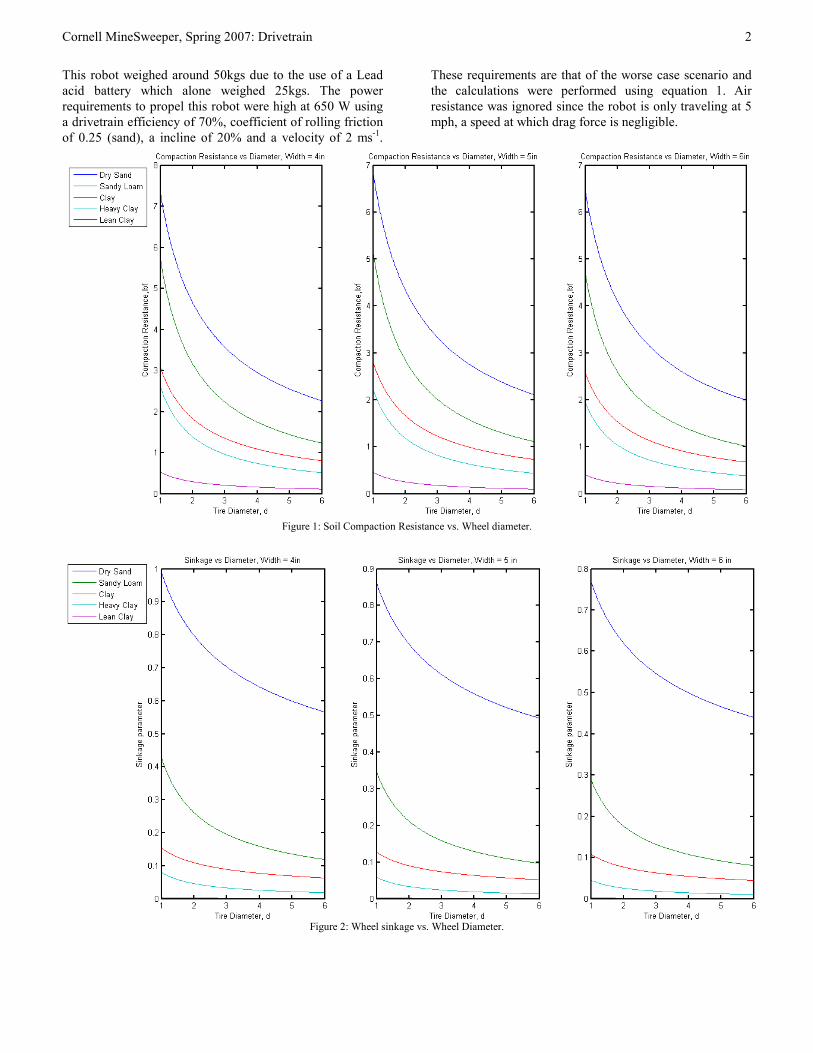
Cornell MineSweeper, Spring 2007: Drivetrain
2
This robot weighed around 50kgs due to the use of a Lead
acid battery which alone weighed 25kgs. The power
requirements to propel this robot were high at 650 W using
a drivetrain efficiency of 70%, coefficient of rolling friction
of 0.25 (sand), a incline of 20% and a velocity of 2 ms-1.
These requirements are that of the worse case scenario and
the calculations were performed using equation 1. Air
resistance was ignored since the robot is only traveling at 5
mph, a speed at which drag force is negligible.
Figure 1: Soil Compaction Resistance vs. Wheel diameter.
Figure 2: Wheel sinkage vs. Wheel Diameter.
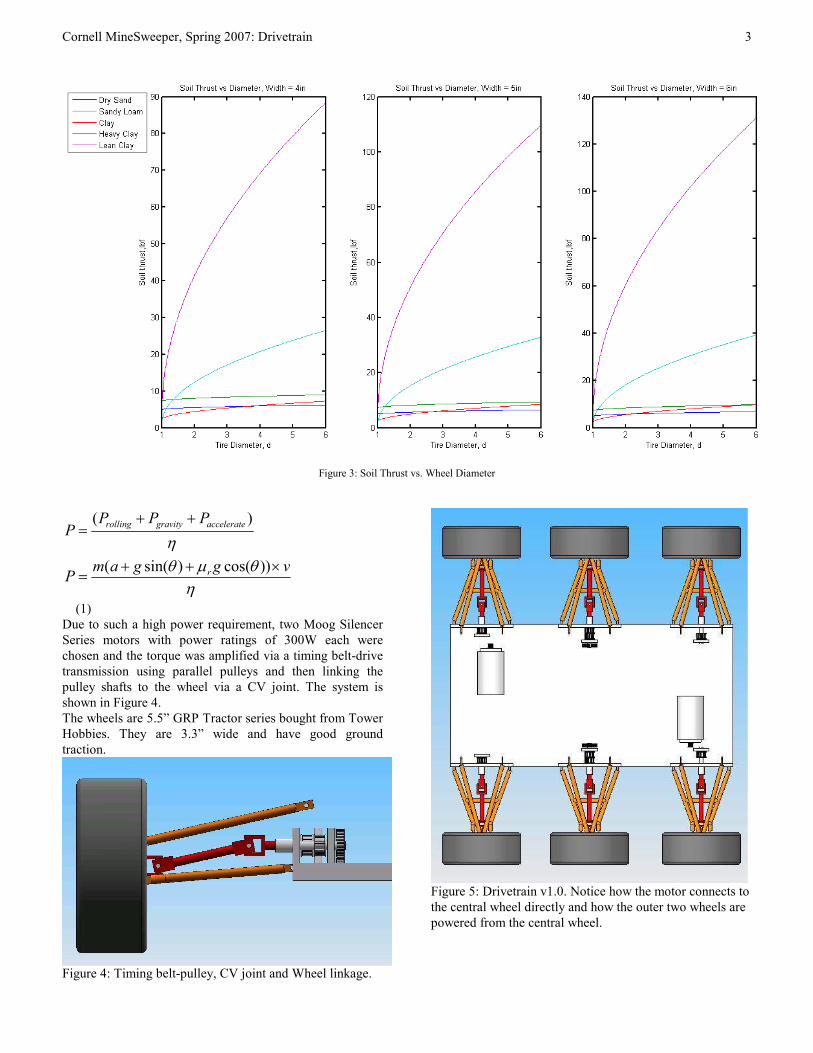
Cornell MineSweeper, Spring 2007: Drivetrain
3
Figure 3: Soil Thrust vs. Wheel Diameter
( )
( sin( ) cos( ))
rolling gravity accelerate
r
P P PP
m a g g vP
η
θ µ θ
η
+ +=
+ + ×=
(1)
Due to such a high power requirement, two Moog Silencer
Series motors with power ratings of 300W each were
chosen and the torque was amplified via a timing belt-drive
transmission using parallel pulleys and then linking the
pulley shafts to the wheel via a CV joint. The system is
shown in Figure 4.
The wheels are 5.5” GRP Tractor series bought from Tower
Hobbies. They are 3.3” wide and have good ground
traction.
Figure 4: Timing belt-pulley, CV joint and Wheel linkage.
Figure 5: Drivetrain v1.0. Notice how the motor connects to
the central wheel directly and how the outer two wheels are
powered from the central wheel.

Cornell MineSweeper, Spring 2007: Drivetrain
4
A. Pros
• Robust with high tolerance for misalignment
amongst shafts.
• Inbuilt damping due to the use of timing belts
• Two motors simplify control system
• System is self-regulating with respect to torque. If
one wheel loses contact with the ground, the other
wheels have a higher stall torque.
B. Cons
• CV joints and belt-pulleys are highly inefficient.
• Too many moving parts and linkages in series. If
one timing belt fails, atleast two wheels lose
power.
• Motors weigh 5kg each, with the CV joints and
pulleys weighing an additional 1 kg for each
wheel.
III. DRIVETRAIN V2.0
The team received a donation of 6 Faulhaber motors with
gearheads from CU Snake Arm. The motors were Faulhaber
2342CR 24V with 23/1 gearheads having 43:1 (four) and
66:1 (two) reduction ratios as shown in Appendix A.. These
motors have a high power/torque density and cost an
average of $200 a piece. They provide continuous working
torque of 0.7 N-m and 1.0 N-m respectively at 19W each
and they weigh 0.170 kg each.
Since these better motors were available immediately, the
team redesigned the drive train to incorporate the new
motors and strived to achieve a much lighter and efficient
drivetrain.
Equation 1 was used to tweak the robot’s velocity and with
the available 114W of power, the robot weighing 25 kgs can
travel at 1m/s on a sand incline of 20% accelerating at
0.2m/s2. Under nominal conditions, the robot has a speed of
2.1 m/s.
The new drivetrain incorporates an innovative in-wheel
motor design where each wheel is a fully contained modular
propulsion unit requiring only power and control signals
from the main body.
Since all the motors don’t have the same torque, the two
motors with the higher torque will be placed in the middle
two wheels since there is a higher likelihood that these two
wheels will always remain in contact with the ground when
compared against the leading and trailing wheel.
The wheels itself are custom designed with two 6” Al-6061
discs of ¼” thickness with sheet metal flats serving as tires
as shown in Figure 3. This design exerts lower ground
pressure since the ground contact is always over a wide flat
area and also, these wheels have a lower moment of inertia
compared to conventional tires such the of the same
diameter.
Since the motor is in the wheel, it is more susceptible to
shock and thus, the shaft needs to be isolated.
A shaft coupling was considering initially, but they are
expensive, bulky and heavy. Instead, a nylon tube with ¼”
ID and ½” OD will be used to connect the wheel shaft to the
motor. The effectiveness of this design can only be
established after thorough testing.
Figure 6: Rendering of the in-wheel motor assembly. The
curved tire sections were discarded later since they did not
help reduce ground pressure.
Figure 7: Redesigned wheel mount with 16 sheet metal flats
for tires.
A. Pros
• Highly fault tolerant with 6 actuators
• Precise motion control
• Lightweight and energy efficient

Cornell MineSweeper, Spring 2007: Drivetrain
5
B. Cons
• Complex control system with 6 feedback systems
• Custom wheel fabrication
IV. FUTURE RECOMMENDATIONS
The current drivetrain is self-contained is ready for
fabrication for the current robot. However, the following
considerations need to be made for drivetrain designs.
1. Establish thorough study parameters so that all
aspects of the drivetrain can be modeled as in
Apostolopoulos et al.
2. Integrate the suspension into the drivetrain, so that
the wheel is fully contained system requiring a
simple bolting linkage to the main robot body. This
provides greater symmetry and repeatability in the
fab process.
3. Account for all terrain conditions when choosing
motors. Also, incorporate a more robust shaft linkage
solution and model using MATLAB/Simulink.
REFERENCES
[1] Dimitrios S. Apostolopoulos. Analytical Configuration of Wheeled
Robotic Locomotion
[2] MER Mission Overview. www.marsinstitute.info
[3] David P. Anderson and Mike Hamilton. Journey Robot.
www.geology.smu.edu/~dpa-www/robo/jbot/
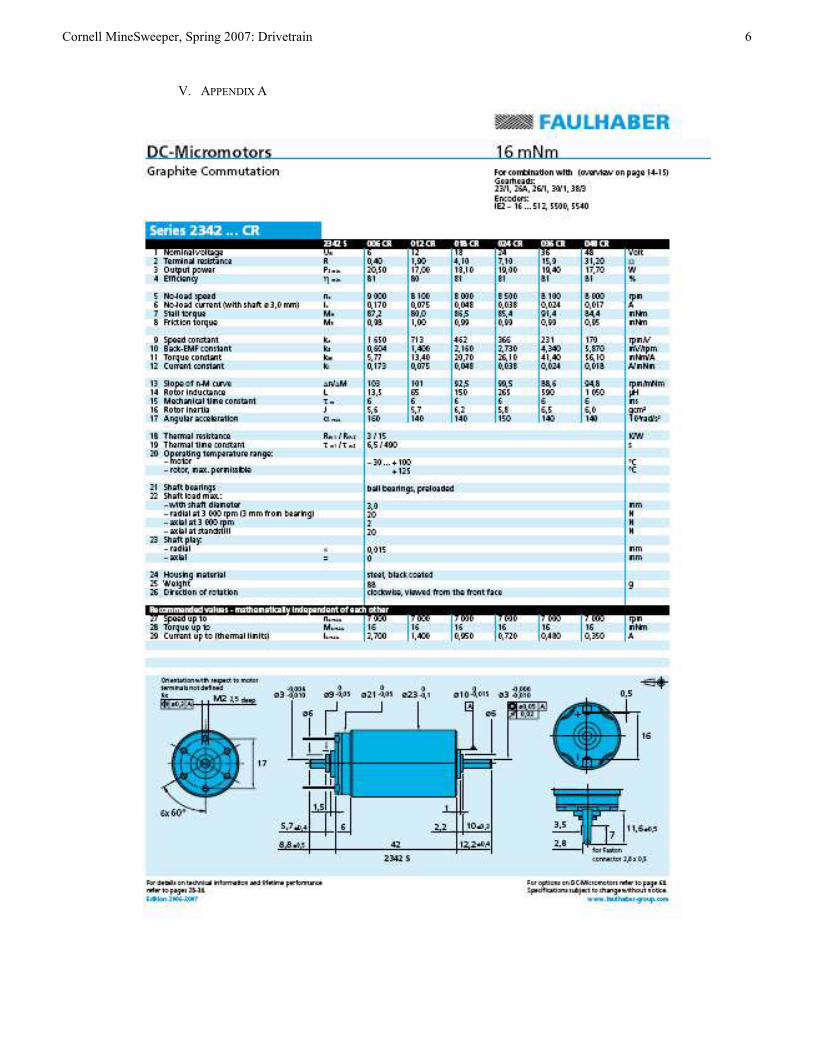
Cornell MineSweeper, Spring 2007: Drivetrain
6
V. APPENDIX A

Cornell MineSweeper, Spring 2007: Drivetrain
7
VI. APPENDIX B
Plots of Robot Speed and Torque vs Inclination using 6 Faulhaber 2342 Motors (19W each) for various rolling friction
coefficients. Wheel radius = 3”.

Cornell MineSweeper, Spring 2007: Drivetrain
8
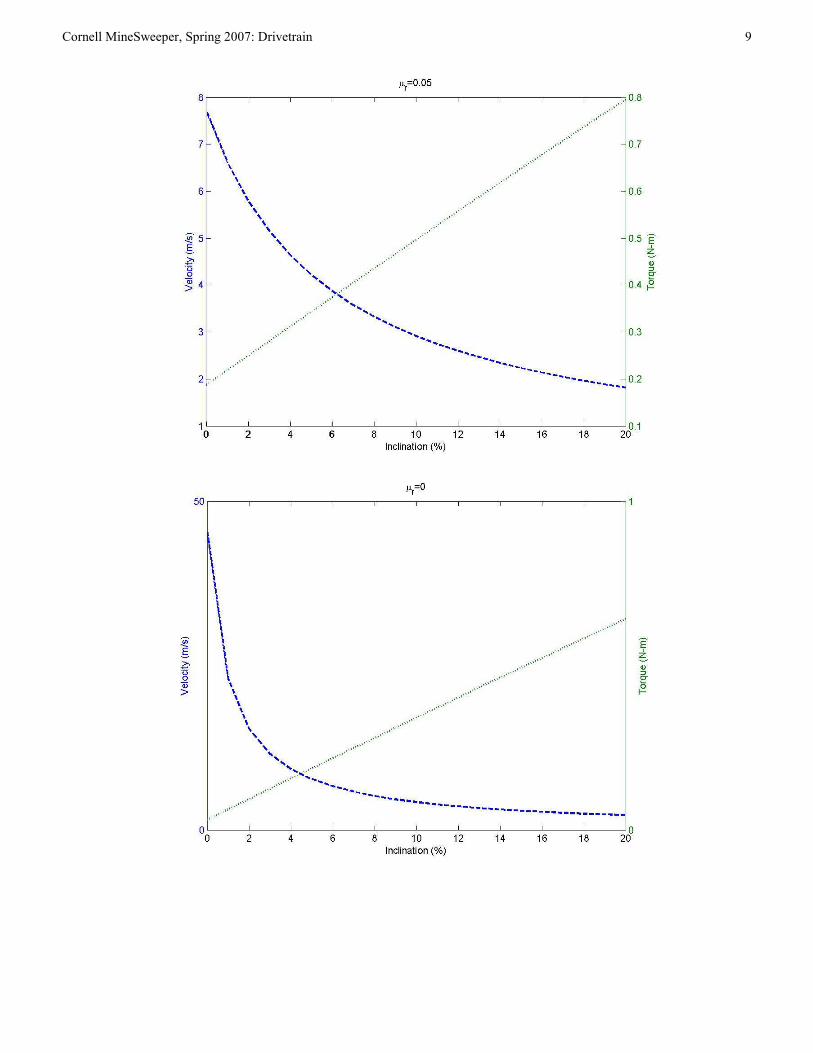
Cornell MineSweeper, Spring 2007: Drivetrain
9
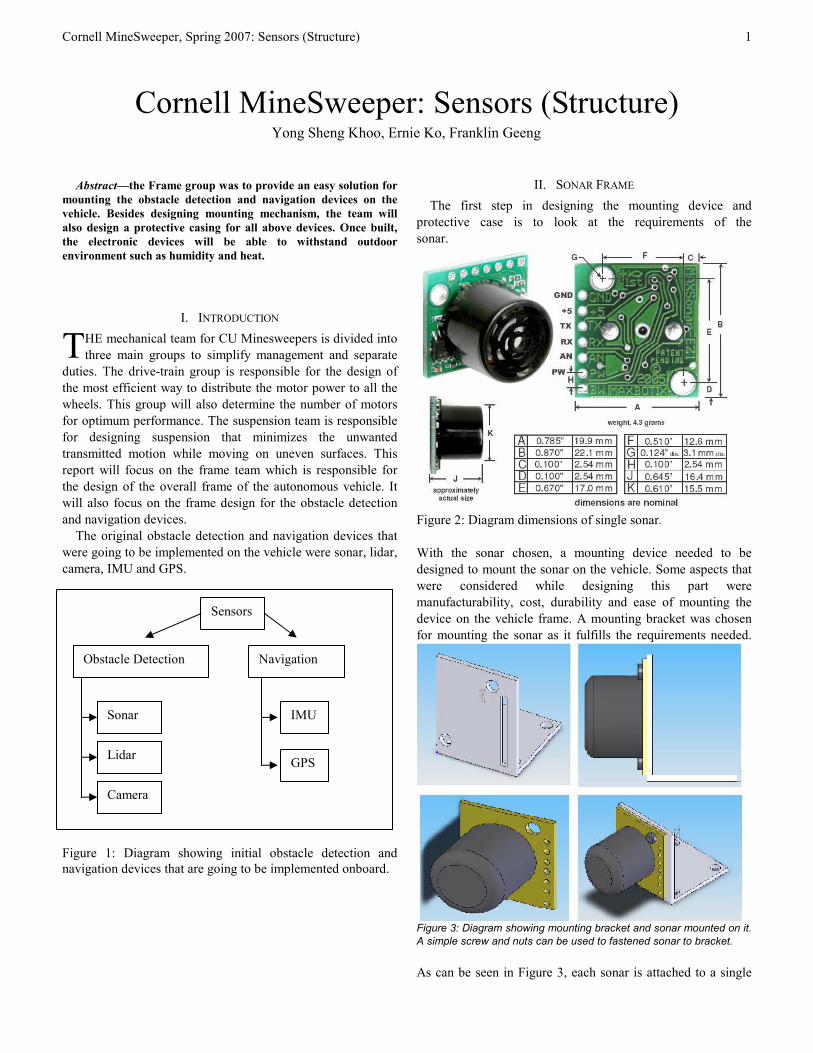
Cornell MineSweeper, Spring 2007: Sensors (Structure)
1
Abstract—the Frame group was to provide an easy solution for
mounting the obstacle detection and navigation devices on the
vehicle. Besides designing mounting mechanism, the team will
also design a protective casing for all above devices. Once built,
the electronic devices will be able to withstand outdoor
environment such as humidity and heat.
I. INTRODUCTION
HE mechanical team for CU Minesweepers is divided into
three main groups to simplify management and separate
duties. The drive-train group is responsible for the design of
the most efficient way to distribute the motor power to all the
wheels. This group will also determine the number of motors
for optimum performance. The suspension team is responsible
for designing suspension that minimizes the unwanted
transmitted motion while moving on uneven surfaces. This
report will focus on the frame team which is responsible for
the design of the overall frame of the autonomous vehicle. It
will also focus on the frame design for the obstacle detection
and navigation devices.
The original obstacle detection and navigation devices that
were going to be implemented on the vehicle were sonar, lidar,
camera, IMU and GPS.
Figure 1: Diagram showing initial obstacle detection and
navigation devices that are going to be implemented onboard.
II. SONAR FRAME
The first step in designing the mounting device and
protective case is to look at the requirements of the
sonar.
Figure 2: Diagram dimensions of single sonar.
With the sonar chosen, a mounting device needed to be
designed to mount the sonar on the vehicle. Some aspects that
were considered while designing this part were
manufacturability, cost, durability and ease of mounting the
device on the vehicle frame. A mounting bracket was chosen
for mounting the sonar as it fulfills the requirements needed.
Figure 3: Diagram showing mounting bracket and sonar mounted on it.
A simple screw and nuts can be used to fastened sonar to bracket.
As can be seen in Figure 3, each sonar is attached to a single
Yong Sheng Khoo, Ernie Ko, Franklin Geeng
Cornell MineSweeper: Sensors (Structure)
T
Sensors
Obstacle Detection Navigation
Sonar
Lidar
Camera
IMU
GPS

Cornell MineSweeper, Spring 2007: Sensors (Structure)
2
mounting bracket, which would make sonar arrangements
easier. A protective case also must prevent moisture from
entering and damaging the electronics on sonar. Since any
solid material will block the sonar signal, there must be a hole
on the protective case to let the sonar signal pass through.
After some testing with the sonar group, it is decided that
porous material such as a sponge could be used to cover up the
hole to prevent the moisture from entering the protective case
and not obstructing the sensing range of the sonar.
Figure 4: Sonar with protective case
As times passes, the sponge will absorb the moisture until the
point that the sonar detecting range is affected. Hence, a
clipped on protective case will be used for easy replacement of
the sponge. After the wiring at the back is sealed, the sonar
will be completely isolated from the outside environment.
III. CAMERA MOUNT
The use of cameras as an additional obstacle detection
instrument necessitated the design of a corresponding mount
that would allow the cameras to maintain a line of sight at a
user-adjustable angle with the horizontal axis. To meet these
requirements without using motors and the extra current and
processing that they would require, the following design was
devised.
As Figure 5 shows, the mount assembly consists of a
hollow aluminum mast connecting a base, fixed to the top of
the robot, and a frame housing a pin about which the actual
mount would pivot. The mount would be entirely gravity
operated, swinging like a pendulum.
The design of the mount uses attached weights to drive the
mount so that it is always normal to the horizontal plane even
when the vehicle is moving on an inclined surface. The bolt
shown in the figure locks the bar that holds the cameras in
place. The user can loosen the bolt to change to a desired
angle of the cameras. The rotary damper shown in Figure 6
will be attached to the side of the mount.
Ideally, the mount would pivot about its center of mass,
making periodic oscillations from gravity impossible, but
friction, tension from any camera cables, and rotary dampers
needed to eliminate vibrations during motion require that the
mount’s center of mass be offset below the pivot point to allow
for a driving force at the center of mass.
Figure 5: Design of the Figure 6: Another view of
camera mount assembly the camera mount showing
(front and isometric views) the rotary dampers
To allow the mount to accommodate cameras of different
weights while still remaining critically damped, the weights
were designed to be easily removable and interchangeable
via a simple screw connection. Considering the Microsoft
webcams depicted in the above figures, dual rotary dampers
from mcmaster.com, and the assumption that the initial
positions are zero but the initial velocities are non-zero, the
following range of critically damped motion was simulated
with Matlab.
Sponge
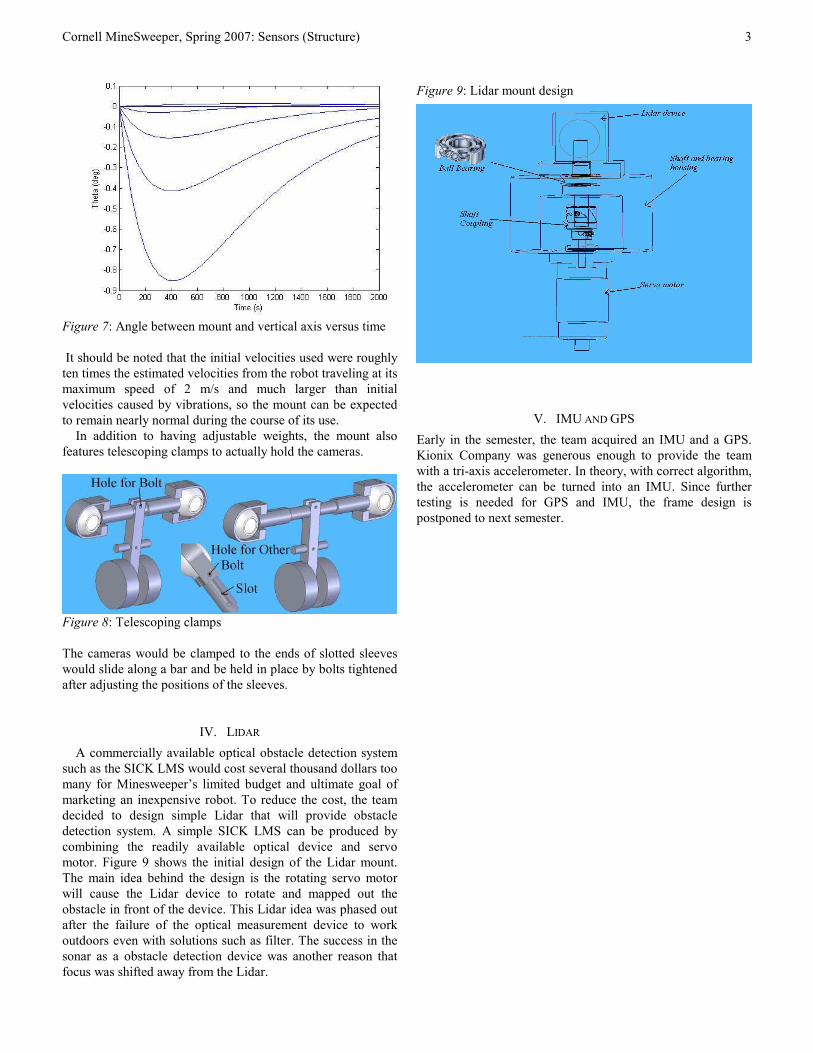
Cornell MineSweeper, Spring 2007: Sensors (Structure)
3
Figure 7: Angle between mount and vertical axis versus time
It should be noted that the initial velocities used were roughly
ten times the estimated velocities from the robot traveling at its
maximum speed of 2 m/s and much larger than initial
velocities caused by vibrations, so the mount can be expected
to remain nearly normal during the course of its use.
In addition to having adjustable weights, the mount also
features telescoping clamps to actually hold the cameras.
Figure 8: Telescoping clamps
The cameras would be clamped to the ends of slotted sleeves
would slide along a bar and be held in place by bolts tightened
after adjusting the positions of the sleeves.
IV. LIDAR
A commercially available optical obstacle detection system
such as the SICK LMS would cost several thousand dollars too
many for Minesweeper’s limited budget and ultimate goal of
marketing an inexpensive robot. To reduce the cost, the team
decided to design simple Lidar that will provide obstacle
detection system. A simple SICK LMS can be produced by
combining the readily available optical device and servo
motor. Figure 9 shows the initial design of the Lidar mount.
The main idea behind the design is the rotating servo motor
will cause the Lidar device to rotate and mapped out the
obstacle in front of the device. This Lidar idea was phased out
after the failure of the optical measurement device to work
outdoors even with solutions such as filter. The success in the
sonar as a obstacle detection device was another reason that
focus was shifted away from the Lidar.
Figure 9: Lidar mount design
V. IMU AND GPS
Early in the semester, the team acquired an IMU and a GPS.
Kionix Company was generous enough to provide the team
with a tri-axis accelerometer. In theory, with correct algorithm,
the accelerometer can be turned into an IMU. Since further
testing is needed for GPS and IMU, the frame design is
postponed to next semester.

Cornell MineSweeper, Spring 2007: Suspension
1
I. SUSPENSION DESIGN
A. Introduction
The Mechanical Team had several considerations when
designing the suspension for the Cornell Minesweeper. The
first role of the suspension is to absorb vibrations which
become particularly important with the amount of sensing
done by the Cornell Minesweeper. The suspension should also
enable the robot to navigate diverse terrains. Mines reside in
very harsh terrains so the minesweeper should be able to
handle these harsh conditions. Lastly the suspension is one of
the most vulnerable components of the robot, so it should be
easily reparable or replaceable.
The first minesweeper design had six wheel independent
suspension. Inspired by the mars rover, the design was
updated this semester to include a rocker bogie system. This
system might be the most prominent visual feature of the
Cornell Minesweeper and greatly increases the range of
different terrains that the robot will be able to navigate.
B. Rocker Bogie System
The Rocker Bogie system contains three wheels per side.
There are two sections as can be seen in figure 1. The front
section contains one wheel and the connections to the chassis.
Attaching the chassis to a single section greatly simplifies the
connections and also helps with the clearance of the rear
wheels. This front section is attached at a single hinge point to
the rear section holds two wheels.
Fig. 1. Rendering of the chassis and drive systems of the Cornell
Minesweeper robot.
A modular configuration was also chosen for the
minesweeper. Each three wheel system is attached at two
points to the robot chassis. This modular design isolates the
drive system and allows easy replacement or repair of
components in the case of failure due to mine detonation. The
modularity also allows for flexibility in the terrain that the
robot will be able to navigate. Since the drive system is
simply screwed at two points and all electrical connections will
be made at a single clip. This means that different drive
designs can be manufactured and simply switched in or out to
navigate different terrains.
The rocker bogie configuration adds about two pounds per
side but allows excellent terrain handling. As can bee seen in
figures 2 and 3 each rocker bogie will allow the robot toe
conform to terrain and will maximize the power that the
wheels deliver.
Fig. 2. Example of how the suspension configuration can conform to
different terrains. Here the rocker bogie is could be going over a hill-like
obstacle.
Fig. 3. Here the suspension could conform to a valley-like obstacle.
The design includes three contact points per side at each of
the three wheels. Any of these three forces could be producing
independent vibrations. To effectively damp these vibrations
the robot must have at leas three degrees of freedom. One
rotational degree of freedom at the hinge point is inherent in
the design. The front and rear wheels are independently
suspended in order to allow for the additional degrees of
freedom. Linear spring damper systems will be placed on the
front and rear wheels and a torsional spring damper will be
placed on the hinge.
C. Linkage
Each wheel must be restrained in all three rotational and
linear directions. The middle wheel will simply be rigidly
Cornell MineSweeper: Suspension Carlos Aguilar, [email protected]
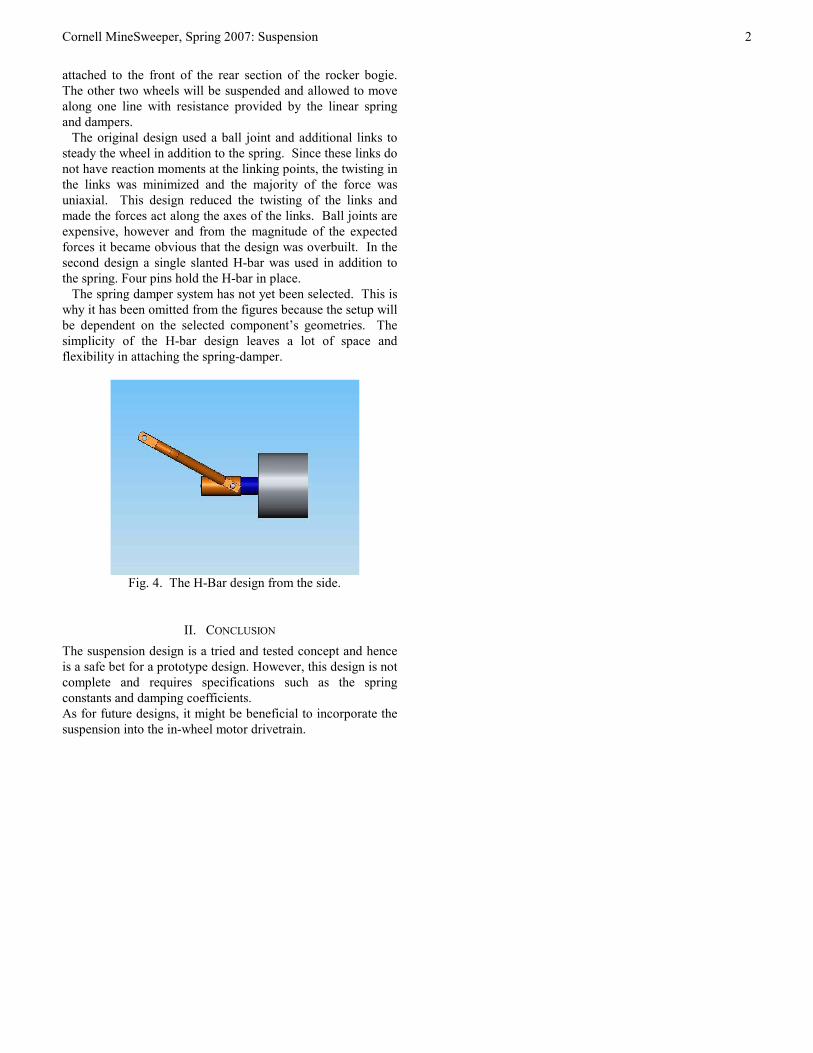
Cornell MineSweeper, Spring 2007: Suspension
2
attached to the front of the rear section of the rocker bogie.
The other two wheels will be suspended and allowed to move
along one line with resistance provided by the linear spring
and dampers.
The original design used a ball joint and additional links to
steady the wheel in addition to the spring. Since these links do
not have reaction moments at the linking points, the twisting in
the links was minimized and the majority of the force was
uniaxial. This design reduced the twisting of the links and
made the forces act along the axes of the links. Ball joints are
expensive, however and from the magnitude of the expected
forces it became obvious that the design was overbuilt. In the
second design a single slanted H-bar was used in addition to
the spring. Four pins hold the H-bar in place.
The spring damper system has not yet been selected. This is
why it has been omitted from the figures because the setup will
be dependent on the selected component’s geometries. The
simplicity of the H-bar design leaves a lot of space and
flexibility in attaching the spring-damper.
Fig. 4. The H-Bar design from the side.
II. CONCLUSION
The suspension design is a tried and tested concept and hence
is a safe bet for a prototype design. However, this design is not
complete and requires specifications such as the spring
constants and damping coefficients.
As for future designs, it might be beneficial to incorporate the
suspension into the in-wheel motor drivetrain.

Cornell MineSweeper, Spring 2007: Frame
As senior leader of the Structures team, I was in charge of
delegating tasks and managing the overall goals of the
team. I was in charge of representing the team at group
meetings and presentations as well as making sure people
stayed on task. I also handled the majority of the
communications between teams. While I had left the
general frame design to Mike, I made sure to take the
management lead and maintain a steady flow of information
between the group members.
Time line Building off of our time line from last semester,
our main goals for this semester were to have a finalized
drive train and suspension system. Other minor goals
included begin design a “black box” system to house all
internal components, plan and organize sensor mounting
positions, and create individual housing cases for each
board. We achieved our main goals for the drive train and
suspension systems which Mike combined into a frame.
We experienced some success with our minor goals. We
have sensor positions for all sonar sensors and a design for
the camera mount. Sadly, other teams have not finalized
electronic boards so designs for the housing units and the
black box were unable to continue. Initial design planning
has begun for both. This summer fabrication of parts for
the suspension, frame, and drive train will begin and
continue into the fall. The goal for next semester is to have
an assembled frame ready for testing by Thanksgiving.
Design Objectives
The design objectives have been updated from last
semester. We are no longer designing two frames but one
frame that will fulfill both design requirements. Thus the
objectives have been merged and updated as follows:
- All terrain ability – can travel over all different forms
of terrain possible to encounter
o Currently unsure of what types of terrain mine
fields are located in – same assumption that the
terrain is not perfectly flat – more research needed
here but currently will plan to deal with all forms
of terrain
- Housing of internal components protects them from
environment (i.e. light rain, dirt, moisture, etc.)
- Currently unsure of the weather and physical
environment conditions of the mine fields – users will
probably expect the robot to function in light rain or
moist situations (such as after heavy rain) – will lose
clout and respectability if it can only work in perfect
weather conditions
- Easy access to the internal components for repairs,
removals, and replacements
o ECE team will probably want easy access to their
components – mechanical team should make this
as smooth as possible
- Structurally sound – can support weight of all
components and payload without failing
o There is an additional payload for the competition
– our structure must be able to handle the weight
of itself, the components, and the payload – will
need stress tests and identify areas of high stress
- Minimize weight and cost
o Meant to be used in field operations and to be
affordable for those with minefields – must keep
costs and weight to a minimum
o Desire for this to be inexpensive so it will be used
– also needs to be easy to replace in event of
accident – high chance of accident when working
with mines
- It has a low center of gravity to maintain stability
o Since the terrain will not be flat, the robot must not
tip over – complete failure will occur if it tips over
– low center of gravity will prevent this possibility
- Marks mine location – physical and electronic (GPS)
marking systems
o GPS location of mine will be useful to removal
team but physical mark will be helpful to anyone
who might be near mine before removal team
arrives – possible marks: paint, flag?
- Survivability - In the event of failure (tips over,
structure fails), internal components are salvageable
with minimum damage to the components
o Use of “black box” to protect all internal
components in event of failure – more about black
box design considerations in next section
- Ability to be located in the event of an accident
o In event of accident, robot should be easy to locate
so as to salvage as much as possible from robot –
Cornell MineSweeper: Structures (Managerial
Overview)
John Andersen

Cornell MineSweeper, Spring 2007: Frame
methods: homing beacon using GPS, audio device,
distress message sent to radio?
- Able to deal with a variety of mines – different sizes,
trigger types, etc.
o Several different times of triggering devices for
mines – need to design and plan for as many
different types as possible – research needed to
identify all types of triggers
- Self navigating – sensor positions?
o Sensor team has worked with Structure team this
semester to identify sensor locations for sonar and
cameras
o Sensor team is doing further research into any
other possible sensor needs and best ways to
protect sensors
- Simple to use – nothing unnecessarily complex in its
operation
o Retrieval of the data will require an understanding
of computing and GPS but operating the robot
should not – any soldier or peace keeper should be
able to activate, deactivate, recharge/replace
battery, etc.
Black Box Design Criteria
As per Prof Garcia’s recommendation, we will be
researching military specs for black box designs currently
in use. This is a top priority next semester but we have
down a preliminary criteria list.
Black Box
- Survivability – contains all the vital and expensive
electronics of our robot
o In the event of catastrophic failure, this must be
the one thing to survive
o Possible use of composite materials to protect
against shrapnel and heat from exploding mine
- Water proof
o Since this houses all electronic components, it
must be completed water proof
o Considering use of plastics to cover the walls
- Heat/Temperature Control and Regulation
o The running electronics will generate heat that can
damage them if the heat builds up
o Environment can also cause internal components
to heat up
o Must have some sort of temperature regulator that
will keep electronics cool and prevent overheating
– possibly a fan
- Accessibility
o Must be able to open black box and replace
damaged or burnt out boards
o Accessibility can not allow water to enter black
box or other environmental hazards such as dust
and dirt
This is only a preliminary criteria list I have generated
for the black box. Once more research is completed next
semester, we can use and compare the design criteria used
by the military for a similar device. The other electronics
consideration we made this semester was planning the
design for the housing of the boards. We felt the best
choice was to make one generic housing design that would
be used on all boards. This would make fabrication simpler
and simplify the design for the black box. It would also
allow for easier replacing and exchanging of boards if such
an situation would arise.
Conclusion
The structure team is on course and on time in
designing the frame. We are reaching a point that we need
more information and communication with other teams.
Having finalized the drive train and suspension, the
remaining design work to be done is dependent on
information from other teams. I found it difficult to get
information from any other teams which limited our
achievements this semester. In order for this project to
remain as successful as it has been, there needs to be more
communication between the different teams.

Cornell MineSweeper, Spring 2007: Frame
At the beginning of the semester, I was again tasked with
the responsibility of designing the frame for the mechanical
team. To start designing this frame, I based the initial
parameters off of the work done last semester on the
temporary frame. This involved utilizing the morphological
charts, dimensions, and material selection processes.
For expense and ease of use, I chose 1 inch square
aluminum 6061-T6 tubing as the main structural component
of the frame. This would be light and cheap, while the
additional time over the summer and next semester would
allow for the necessary time to properly assemble the
components into the design.
Since all of the primary components of the minesweeper
frame were designed independently, the initial design of the
frame was a simple rectangular prism as shown in Figure
1.1.
Figure 1.1: Initial Frame Design
As a rough design, the frame depicted is not designed for
manufacturability; however, small modifications were made
to incorporate it with the initial suspension. Pieces were
expanded to provide attachment points for the independent
wheel suspension. Additionally, the electronics were
placed in a rack designed around the batteries and motors in
located within the interior cavity of the frame.
Once a rough model of the robot was designed with all
the components created by individuals brought into one
design, we performed a design review that looked at the
interaction of all the systems and what components could
be made better, more efficient, lighter, and which parts
needed to be redesigned completely. Looking at the
suspension design, I realized I could increase the ground
clearance of the robot while making the frame lighter and
redistributing the forces applied in the frame. Additionally,
more members were brought into the mechanical team to
help design the sensor attachments, electronics mounting,
and several other details allowing me to focus on the
primary structure of the robot.
When redesigning the frame for the robot, I tried to
increase the maximum ground clearance possible in the
middle of the robot. I also focused on making a design that
distributed the forces due to static loading into the box
aluminum as bending stresses in order to utilize the
stiffness benefits of the material selected. The results are
shown in Figure 1.2, which shows the frame structure as
well as connection points for the lower contact of the
individual suspensions for the 6 wheels of the robot. While
the model is incomplete, it weighed over 13 pounds and
still needed more work to properly attach the bottom
supports to the top part of the frame. The design process
was stopped before the finishing touches could be added
which accounts for the fact that the interior of some of the
aluminum tubing is visible.
Figure 1.2: Preliminary Redesign of Frame
Work on the frame had to stop and restart because
suspension was redesigned during this process. It went
from 6 individually suspended wheels to the bar supported
suspension discussed in this report. My work on the frame
needed to be changed because this new suspension had very
different methods of connecting to the frame.
To accommodate the change in suspension, I kept
the basic design of the frame the same: a one layer
rectangle composed 1 inch box aluminum. The frame
length was reduced to align with the suspension
dimensions, allowing the wheels to perform optimally
without interference of the frame on the terrain being
traversed. In order to reduce the stress concentrations in the
Cornell MineSweeper: Frame
Mike Nagele, Member, FDIC

Cornell MineSweeper, Spring 2007: Frame
frame, small brackets made from a solid aluminum block
were made to attach the frame to the suspension. These
brackets apply distributed loads on the frame rather than
point loading.
The remodeled system both increases the center
clearance height of the robot, but also reduces the weight of
the frame. With the bar suspension system, there was more
rigidity in the suspension subsystem itself eliminating some
of the rigidity requirements of the frame. After a lengthy
redesign process, the frame created is shown in Figure 1.3.
Figure 1.3: Multiple Views of Frame Design
This new frame design increases the benefits of the
earlier design from Figure 1.2. The weight of the frame
was reduced to 6.438 pounds, and the ground clearance in
the center of the robot was increased to 8 inches. I then
took this model and imported it into ANSYS to look at how
the frame would react to the static loading, which is the
primary function of the frame. Loading conditions were
modeled as a 14 pound load applied to the back of the
frame representing the weight of the batteries. An
additional 150 pounds were applied to the sides of the
frame to model the weight of payload and the rest of the
robot. This weight of the robot will most likely be spread
throughout the frame more uniformly, but by modeling the
weight in this manner, the worst case scenario is analyzed.
The bottoms of the suspension mounting brackets were
fixed in space to represent the support of the suspension and
wheels.
Figure 1.4: Displacement Results of ANSYS Analysis
Results from this analysis are highlighted in
Figures 1.4 and 1.5. Static loading created a maximum
deflection of X.XX inches in the center of the sides, which
is what was expected. The maximum and minimum Von
Mises stresses are 477 psi and -585 psi respectively.
Comparing this to an elastic limit of 27 ksi for 6061-T6
aluminum, and the designed frame is well within the safety
range, safety factor of 46. More components can be added
to the frame to add rigidity or attachment points for other
components of the robot; however, any additions to the
frame do not need to be structural.
Figure 1.5: Von Mises Stress Distribution