core content coaching grade 6 motion & speed 14-15
TRANSCRIPT
Science Grade 6: Speed & Motion and Speed
Core Content Coaching
PurposeTo provide support for grade-level, unit content planning
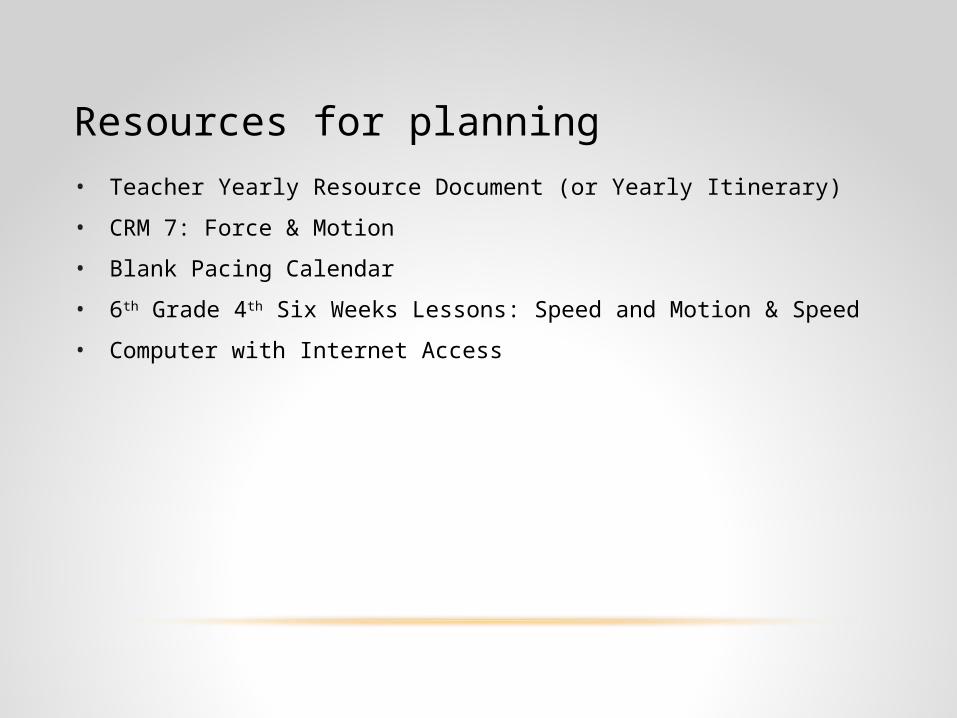
Resources for planning• Teacher Yearly Resource Document (or Yearly Itinerary)
• CRM 7: Force & Motion
• Blank Pacing Calendar
• 6th Grade 4th Six Weeks Lessons: Speed and Motion & Speed
• Computer with Internet Access

Teacher yearly resource document
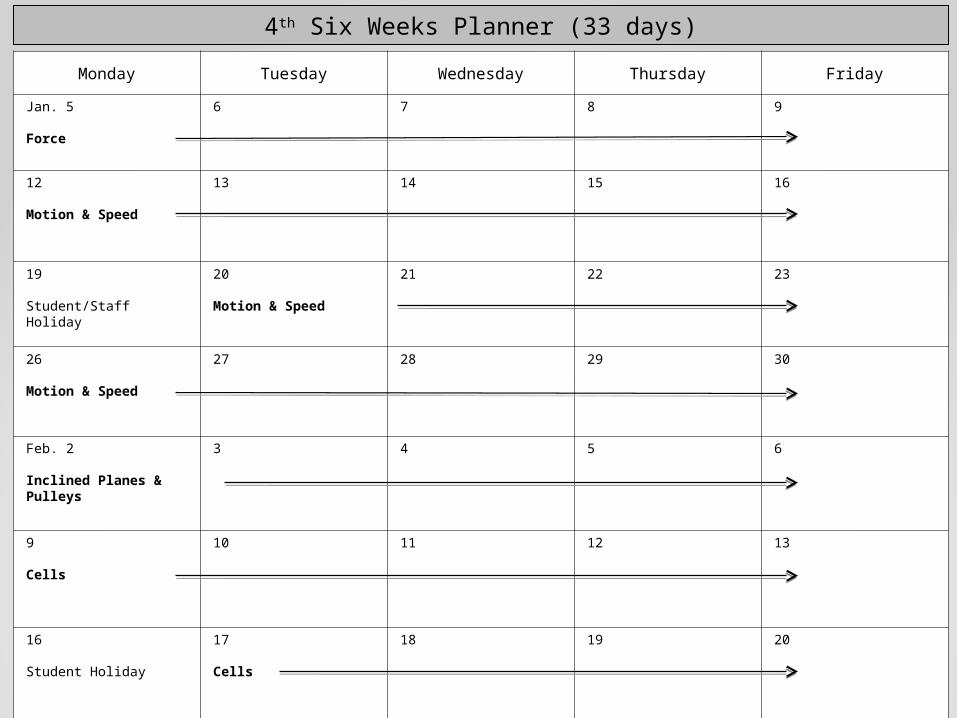
Monday Tuesday Wednesday Thursday Friday
Jan. 5
Force
6 7 8 9
12
Motion & Speed
13 14 15 16
19
Student/Staff Holiday
20
Motion & Speed
21 22 23
26
Motion & Speed
27 28 29 30
Feb. 2
Inclined Planes & Pulleys
3 4 5 6
9
Cells
10 11 12 13
16
Student Holiday
17
Cells
18 19 20
4th Six Weeks Planner (33 days)

6.1A-B, 6.2A & C-E, 6.4A 6.8: Force, motion, & energy. The student knows force & motion are related to potential & kinetic energy. The student is expected to:
•6.8C: calculate average speed using distance & time measurements.
•6.8D: measure & graph changes in motion.
TEKS & Student expectations
Content TEKS Skills TEKS
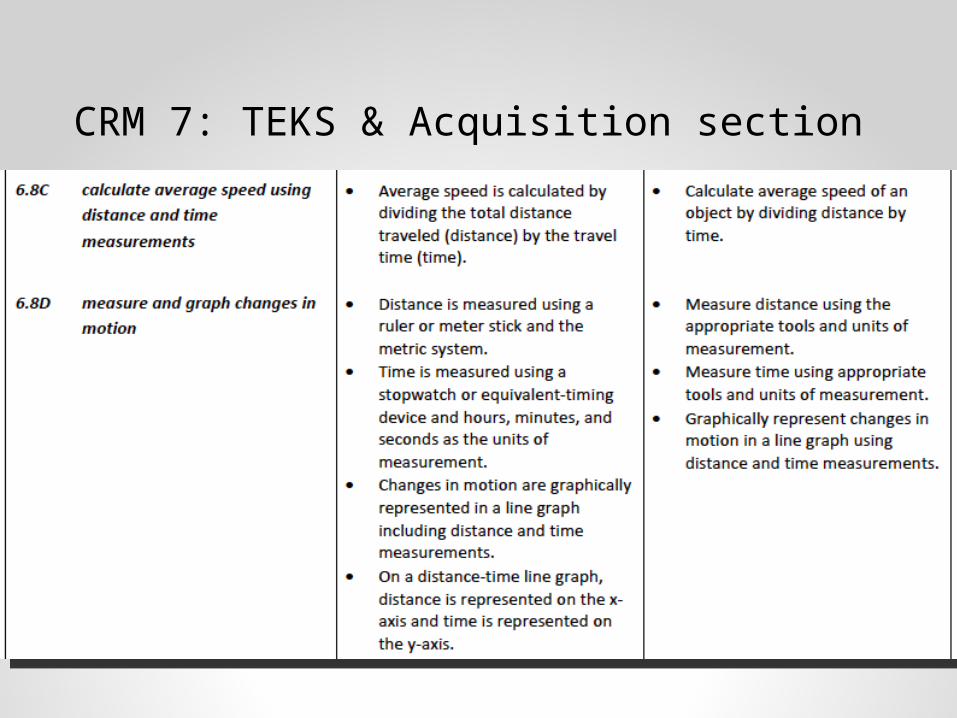
CRM 7: TEKS & Acquisition section

Teacher Content support
School for Champions: Relative Motion, Speed, Velocity, and Accelerationhttp://www.school-for-champions.com/science/motion.htm
The Physics Classroom: Average vs. Instantaneous Speedhttp://www.physicsclassroom.com/mmedia/kinema/trip.cfm
NSTA Leaning Center- http://learningcenter.nsta.org/
Search Resources & Opportunities: force, motion
ScienceFusion Grade 6 Teacher Edition: Content Refresher: p. 239

Vertical alignment5TH GRADE
•Design an experiment that tests the effect of force on an object.
6TH GRADE
6.8C: calculate average speed using distance & time measurements.
6.8D: measure & graph changes in motion.
8th GRADE
•8.6B: differentiate between speed, velocity, & acceleration.

• An unbalanced force occurs when one force on an object is greater than other forces on the same object.
• If opposing forces acting on an object cancel each other out, the force is considered balanced and there is no change in position, direction, or speed.
• Unbalanced forces can cause an object to speed up or slow down.
• Unbalanced forces can cause an object to change direction.
• Unbalanced forces can cause an object to change position.
PRIOR LEARNING
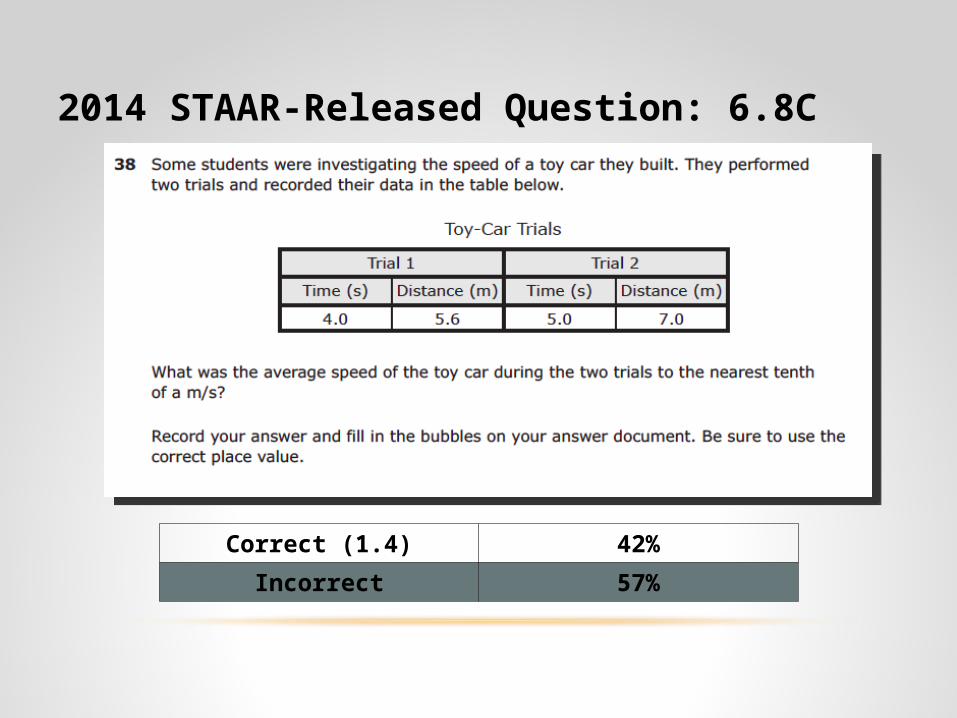
Correct (1.4) 42%
Incorrect 57%
2014 STAAR-Released Question: 6.8C
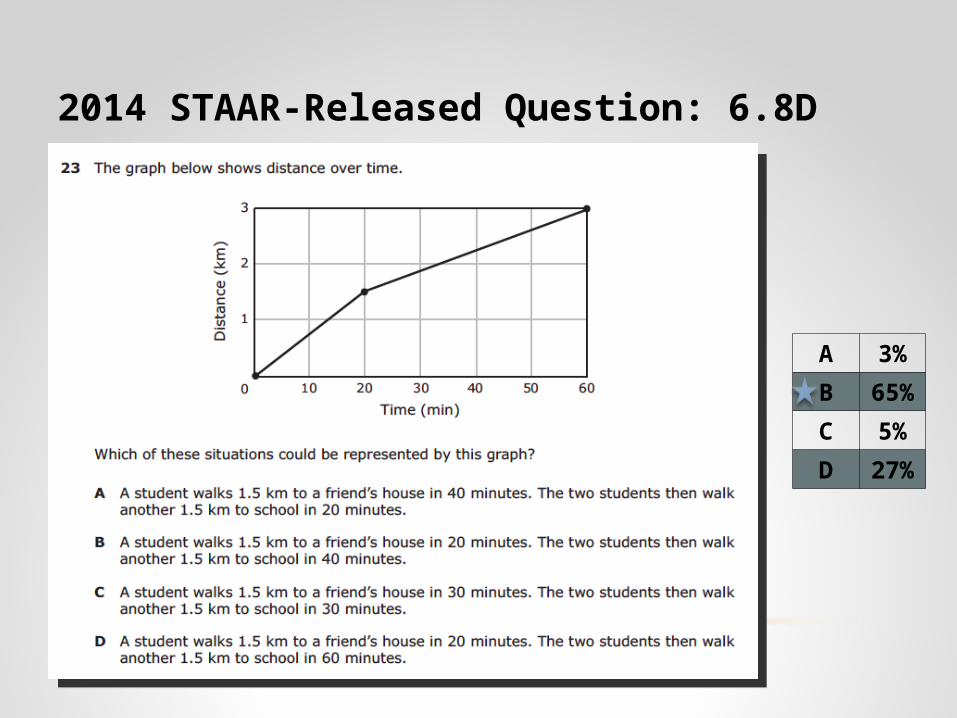
A 3%
B 65%
C 5%
D 27%
2014 STAAR-Released Question: 6.8D
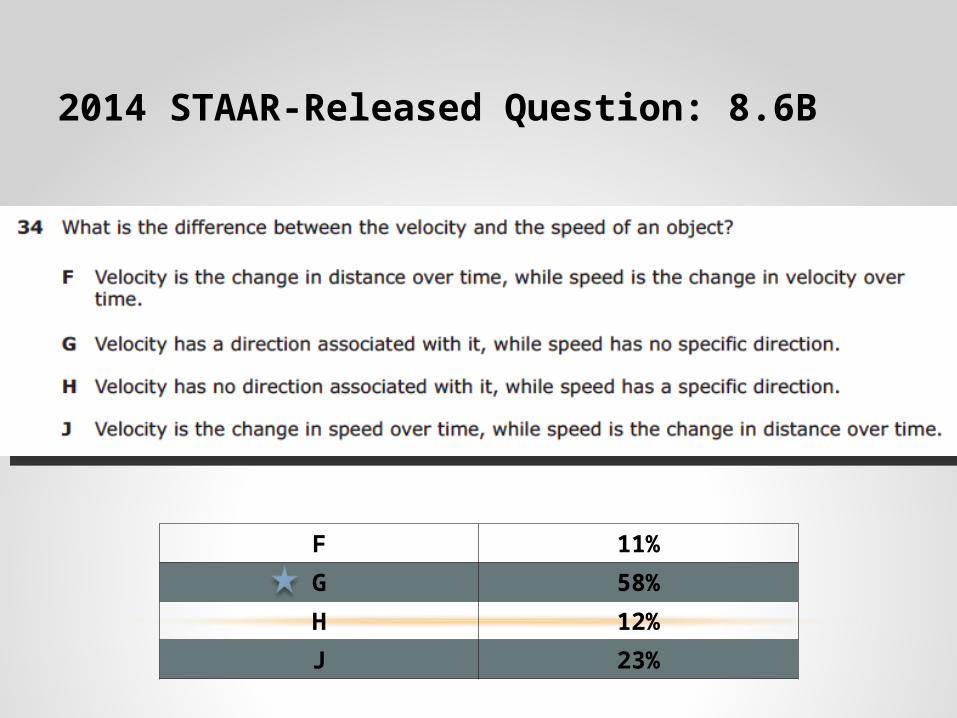
F 11%
G 58%
H 12%
J 23%
2014 STAAR-Released Question: 8.6B

Based on the data and distractors, what key points should teachers emphasize during lessons?
• Average Speed = Distance / Time
• Speed involves only distance and time.Activities to emphasize this
point included in the curriculum:
1.Frayer Model: Speed2.Describing Motion-Speed Investigation3.Calculating Average Speed Video & Journal Entry4.Take a Walk Lab5.STEMScopes Guided Practice6.Performance Assessment: School Zone Speed Trap
Activities to emphasize this point included in the
curriculum:
1.Frayer Model: Speed2.Describing Motion-Speed Investigation3.Calculating Average Speed Video & Journal Entry4.Take a Walk Lab5.STEMScopes Guided Practice6.Performance Assessment: School Zone Speed Trap
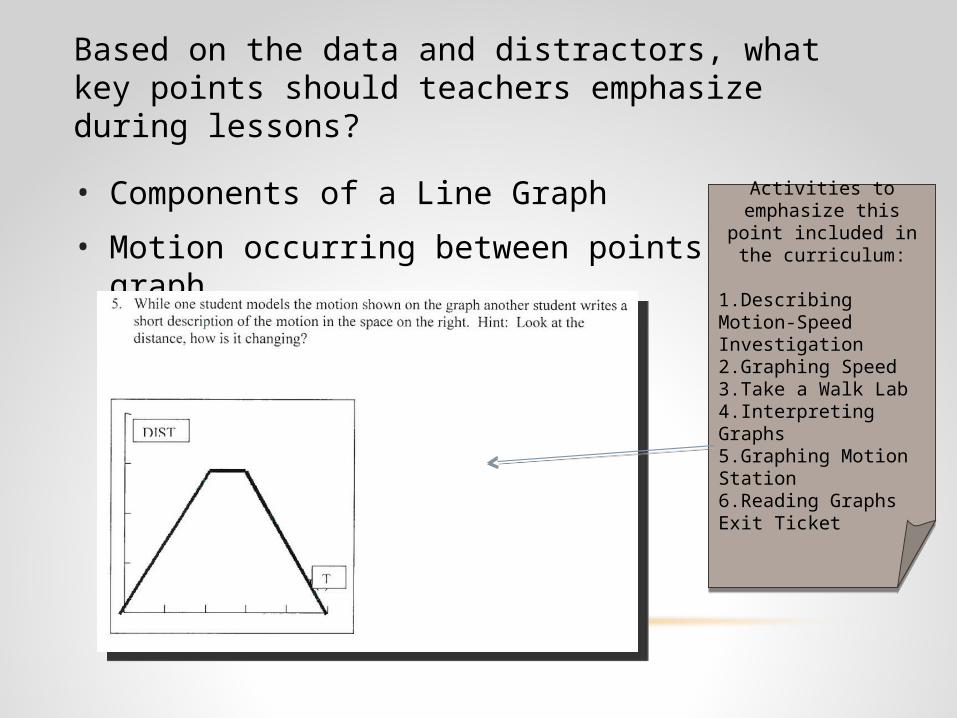
Based on the data and distractors, what key points should teachers emphasize during lessons?
• Components of a Line Graph
• Motion occurring between points on a graph Activities to emphasize this point included in the
curriculum:
1.Describing Motion-Speed Investigation2.Graphing Speed3.Take a Walk Lab4.Interpreting Graphs5.Graphing Motion Station6.Reading Graphs Exit Ticket
Activities to emphasize this point included in the
curriculum:
1.Describing Motion-Speed Investigation2.Graphing Speed3.Take a Walk Lab4.Interpreting Graphs5.Graphing Motion Station6.Reading Graphs Exit Ticket

Components of a good lesson plan1. Engage Student Interest
2. Review/Scaffold to TEKS
3. Student-Centered Activities directly relating to the depth and complexity of the TEKS
• Labs, Activities, Videos
4. Organize and Practice Vocabulary
5. Reading & Comprehension Strategies
6. Writing Opportunities & Scaffolds
7. Daily Listening & Speaking Opportunities
8. Differentiation
9. Formative Assessment & Reteach

Embedded in lessons: Engage Student Interest• Speed Lessons
• STEMScopes Demonstration Presentation: Changes in Force & Motion• Exploring Position• Class Discussion: Where is speed measuring in everyday life?
• Motion & Speed Lessons
• Journal Entry: Imagine you are the manufacturer of skateboards. What must you consider when designing and testing your product?

Embedded in lessons:Review / Scaffold to TEKS
• ScienceFusion Unit 4, Lesson 3: Motion & Speed Digital Lesson & Virtual Lab

Embedded in lessons: Student-Centered Activities directly relating to the depth and complexity of the TEKS (Labs, Activities, Videos)
• Speed Lessons
• Describing Motion-Speed
• Discovery Education Video: Calculating Average Speed
• Graphing Speed
• Take a Walk Lab
• Interpreting Graphs
• Motion & Speed Lessons
• STEMScopes Guided Practice
• Graphing Motion Stations
• STEMScopes PBL Science!

Embedded in lessons:Organize and Practice Vocabulary
• Speed Lessons
• Frayer Model: Speed
• Discovery Education Video Journal Entry
• Cloz-ing in on Science: Cloze 3
• Motion & Speed Lessons
• STEMScopes Guided Practice Concept Map
• Journal Entry: How can you design an investigation that compares the distance and speed a toy car travels on different surfaces?

Embedded in lessons:Reading & Comprehension Strategies
• ScienceFusion: Motion & Speed p. 220-230
• Reader/Writer/Speaker Response Triads Students form groups of three. One student reads the text aloud; one writes the group’s reactions or responses to questions about the text, a third reports the answers to the group. After reporting to the group, the students switch roles.
• Embedded Active Reading Strategies & Visualize It!

Embedded in lessons:Writing Opportunities & Scaffolds• Journal Entries
• Where can you find the formula to calculate speed? What is the formula for calculating speed?
• How do you calculate speed?
• What is speed?
• What are the main components of an accurate graph? Set up and label a generic line graph.
• How could your investigation be improved? What steps could you take to make sure your data is accurate while conducting your experiment? What other questions do you still have about speed? How could you research or test those questions?
• What would a graph of how you got to school look like?
• A soccer ball takes 30 seconds to roll 15 meters. Calculate the average speed of the ball.
• Imagine you are the manufacturer of skateboards. What must you consider when designing and testing your product?
• How can you design an investigation that compares the distance and speed a toy car travels on different surfaces?
• Exit Tickets
• Describing Motion-Speed Conclusion
• Take a Walk Conclusion
• STEMScopes PBL Science!
• Scaffolds: Sentence Frames, Word Bank, Think/Share/Write, Write/Share/Revise

Embedded in lessons:Daily Listening & Speaking Opportunities
An investigation comparing distance
and speed on different surfaces would
include…
A distance and speed investigation would need….
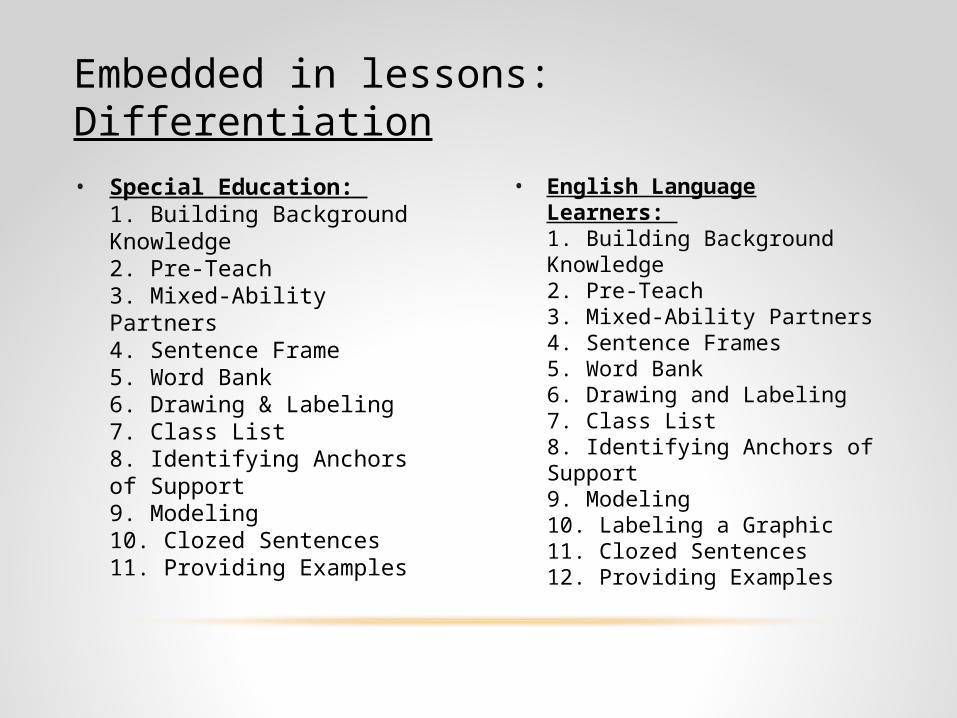
• Special Education: 1. Building Background Knowledge2. Pre-Teach3. Mixed-Ability Partners4. Sentence Frame5. Word Bank6. Drawing & Labeling7. Class List8. Identifying Anchors of Support9. Modeling10. Clozed Sentences11. Providing Examples
• English Language Learners: 1. Building Background Knowledge2. Pre-Teach3. Mixed-Ability Partners4. Sentence Frames5. Word Bank6. Drawing and Labeling7. Class List8. Identifying Anchors of Support9. Modeling10. Labeling a Graphic11. Clozed Sentences12. Providing Examples
Embedded in lessons:Differentiation

• ScienceFusion Unit 4, Lesson 3: Motion & Speed Digital Lesson & Virtual Lab
• Journal Entries
• Exit Ticket
• Graphing Speed
• Investigation Conclusions
• Performance Assessment: School Zone Speed Trap
• STEMScopes PBL Science!
Embedded in lessons:Formative Assessment & Reteach
Formative Assessment Reteach Opportunities
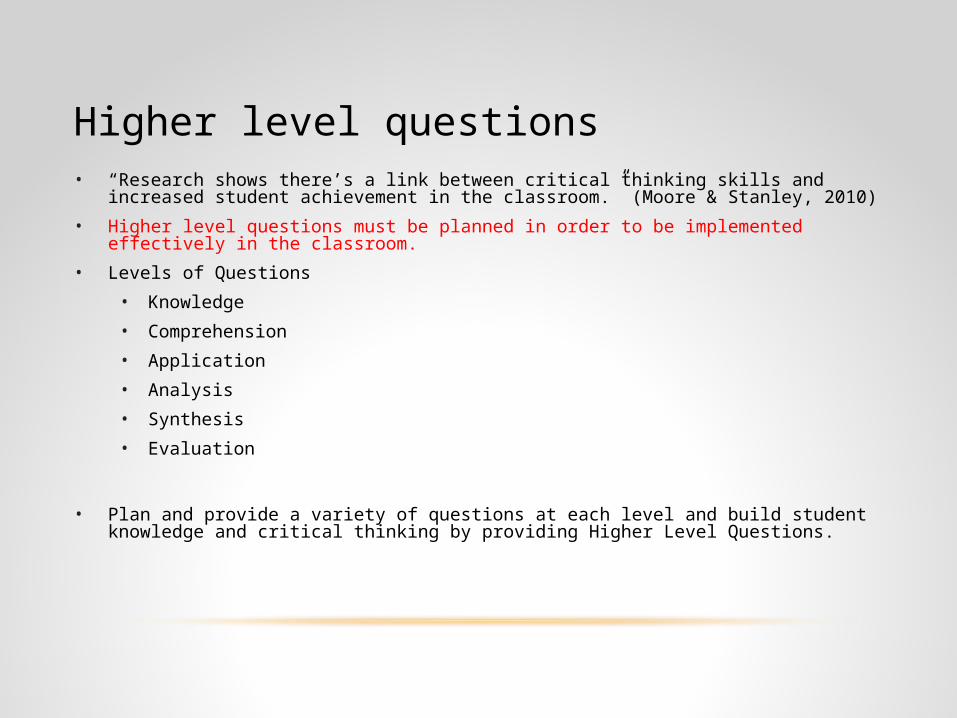
Higher level questions• “Research shows there’s a link between critical thinking skills and increased student achievement in the
classroom.” (Moore & Stanley, 2010)
• Higher level questions must be planned in order to be implemented effectively in the classroom.
• Levels of Questions
• Knowledge
• Comprehension
• Application
• Analysis
• Synthesis
• Evaluation
• Plan and provide a variety of questions at each level and build student knowledge and critical thinking by providing Higher Level Questions.

Lower Levels of questions

Higher Levels of questions
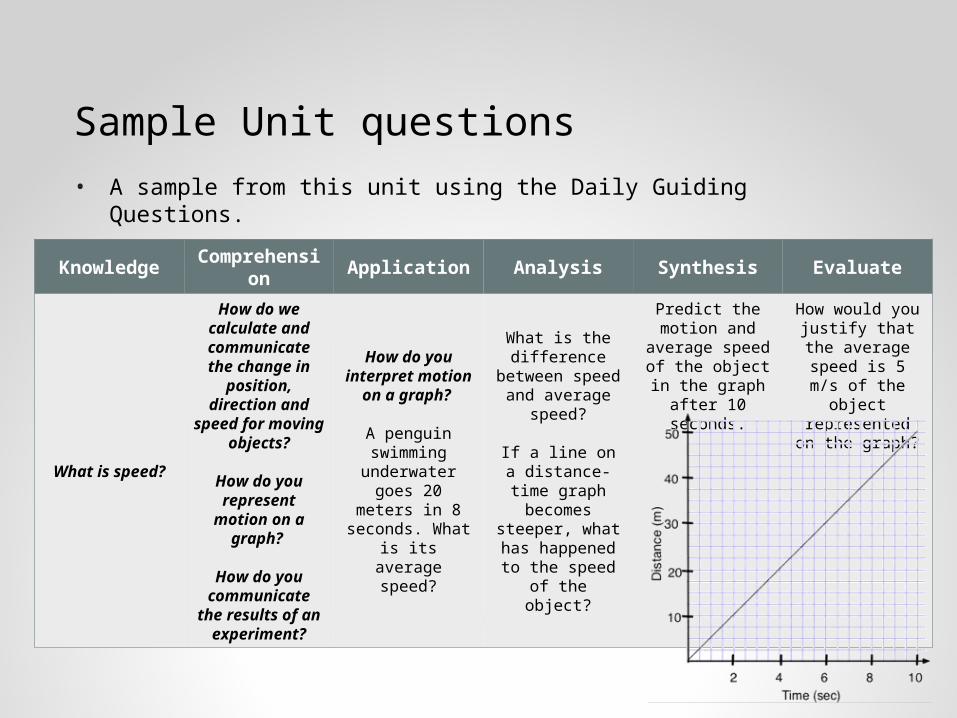
Sample Unit questions• A sample from this unit using the Daily Guiding Questions.
Knowledge Comprehension Application Analysis Synthesis Evaluate
What is speed?
How do we calculate and communicate
the change in position, direction
and speed for moving objects?
How do you represent motion on
a graph?
How do you communicate the
results of an experiment?
How do you interpret motion on
a graph?
A penguin swimming underwater goes 20 meters in 8 seconds. What is its average
speed?
What is the difference between speed and
average speed?
If a line on a distance-time graph becomes
steeper, what has happened to the
speed of the object?
Predict the motion and average speed of the object in the graph
after 10 seconds.
How would you justify that the average
speed is 5 m/s of the object represented on
the graph?

Recommended Anchors of Support• STEMScopes Guided Practice Concept Map
• Frayer Model: Speed
• Calculating Average Speed Video Journal Entry
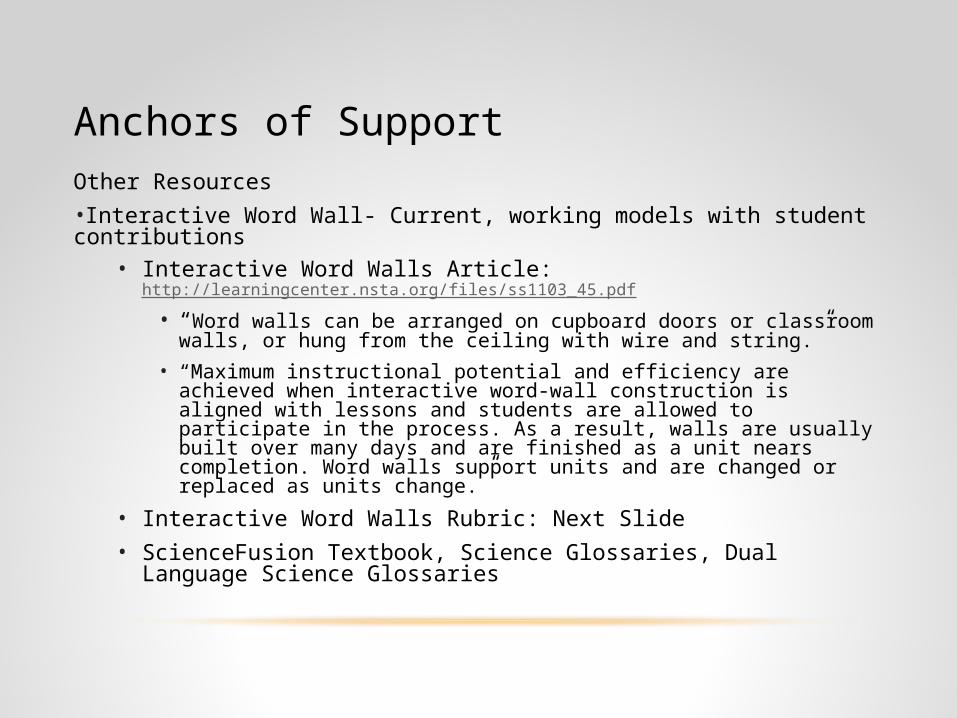
Anchors of SupportOther Resources•Interactive Word Wall- Current, working models with student contributions
• Interactive Word Walls Article: http://learningcenter.nsta.org/files/ss1103_45.pdf
• “Word walls can be arranged on cupboard doors or classroom walls, or hung from the ceiling with wire and string.”
• “Maximum instructional potential and efficiency are achieved when interactive word-wall construction is aligned with lessons and students are allowed to participate in the process. As a result, walls are usually built over many days and are finished as a unit nears completion. Word walls support units and are changed or replaced as units change.”
• Interactive Word Walls Rubric: Next Slide• ScienceFusion Textbook, Science Glossaries, Dual Language Science
Glossaries

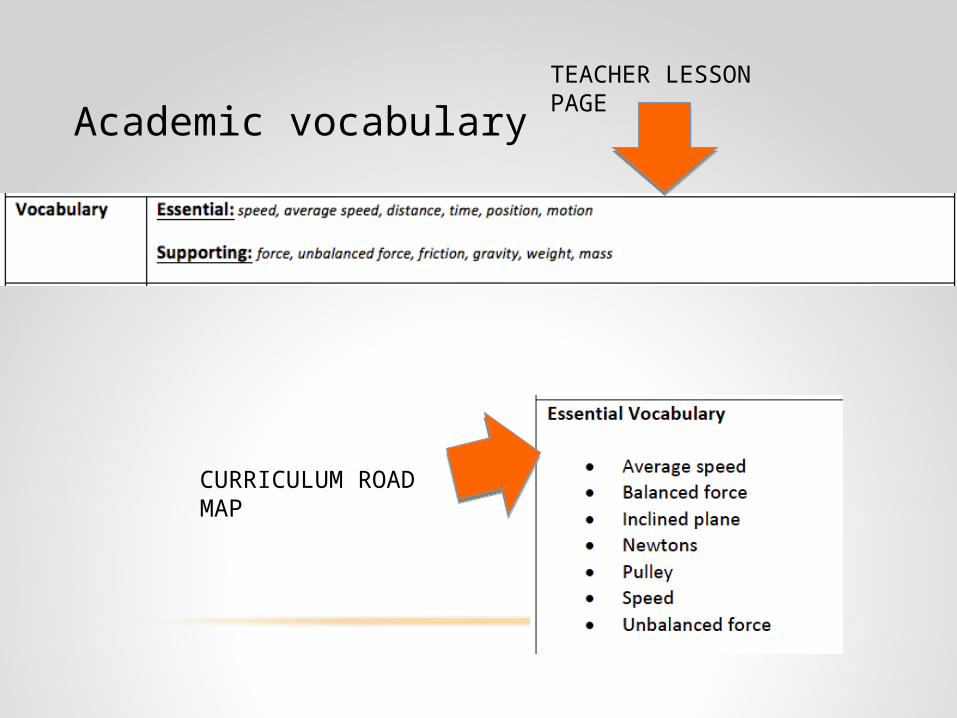
Academic vocabularyTEACHER LESSON PAGE
CURRICULUM ROAD MAP