coral reef evaluation report 2012.pdf · preventing coral recruitment to the area not related to...
TRANSCRIPT
2012
Reef Check Bahamas Team Members:
Lakeshia Anderson, Frederick Arnett,
Ancilleno Davis, Jared Dillet, Lindy Knowles
and Krista Sherman
February 3, 2012
CORAL REEF EVALUATION REPORT
1
Executive Summary Two Reef Check Surveys were conducted at Mike’s Reef, New Providence, Bahamas on
February 1, 2012. The team consisted of Lakeshia Anderson (BNT), Frederick Arnett (DMR),
Ancilleno Davis (TNC), Jared Dillet (DMR), Lindy Knowles (BNT) and Krista Sherman (BNT).
The team was divided into pairs to complete fish, invertebrate and substrate surveys. This team
used the Reef Check EcoDiver protocol to collect data (www.reefcheck.org). Mike’s Reef is
within the proposed South West Marine Managed Area. Both survey sites are a part of a
contiguous reef system. Fish surveys showed that commercially important species (groupers,
snappers and grunts) were in lower abundances when compared to non-target fish species
(parrotfish and butterflyfish). When comparing the two invertebrate and impact assessment
surveys, the only noticeable difference was the gorgonian counts which could be related to “edge
effects”. Anthropogenic impacts were low on both transects. Even though 76% of the surveyed
portion of Mike’s Reef consisted of non-living components, the low macroalgal coverage (due to
grazing pressure by high parrotfish densities) could mean that there is suitable area for coral
recruitment. However, live hard corals cover was 10% suggesting that there may be other factors
preventing coral recruitment to the area not related to substrate type e.g. “edge effects”. This
was the first complete Reef Check survey to be conducted within the proposed boundaries of the
South West Marine Managed Area in New Providence, Bahamas. The data represented in this
report provide baseline information on the status of coral reef health in the area surveyed on
Mike’s Reef. Additional surveys are required to document changes in the area and obtain a more
detailed understanding of coral reef health.

2
Table of Contents Executive Summary ........................................................................................................................ 1
Table of Figures .............................................................................................................................. 3
Introduction ..................................................................................................................................... 4
Methods........................................................................................................................................... 4
Site Description ........................................................................................................................... 4
Fish belt transect.......................................................................................................................... 4
Invertebrate belt transect ............................................................................................................. 5
Substrate line transect.................................................................................................................. 6
Results ............................................................................................................................................. 6
Site Description ........................................................................................................................... 6
Fish Abundance ........................................................................................................................... 7
Invertebrates & Impacts .............................................................................................................. 8
Benthic Coverage ...................................................................................................................... 10
Discussion & Conclusion .............................................................................................................. 13
Fish Abundance ......................................................................................................................... 13
Invertebrates and Impacts.......................................................................................................... 13
Benthic Coverage ...................................................................................................................... 14
Acknowledgements ....................................................................................................................... 14
References ..................................................................................................................................... 14
3
Table of Figures
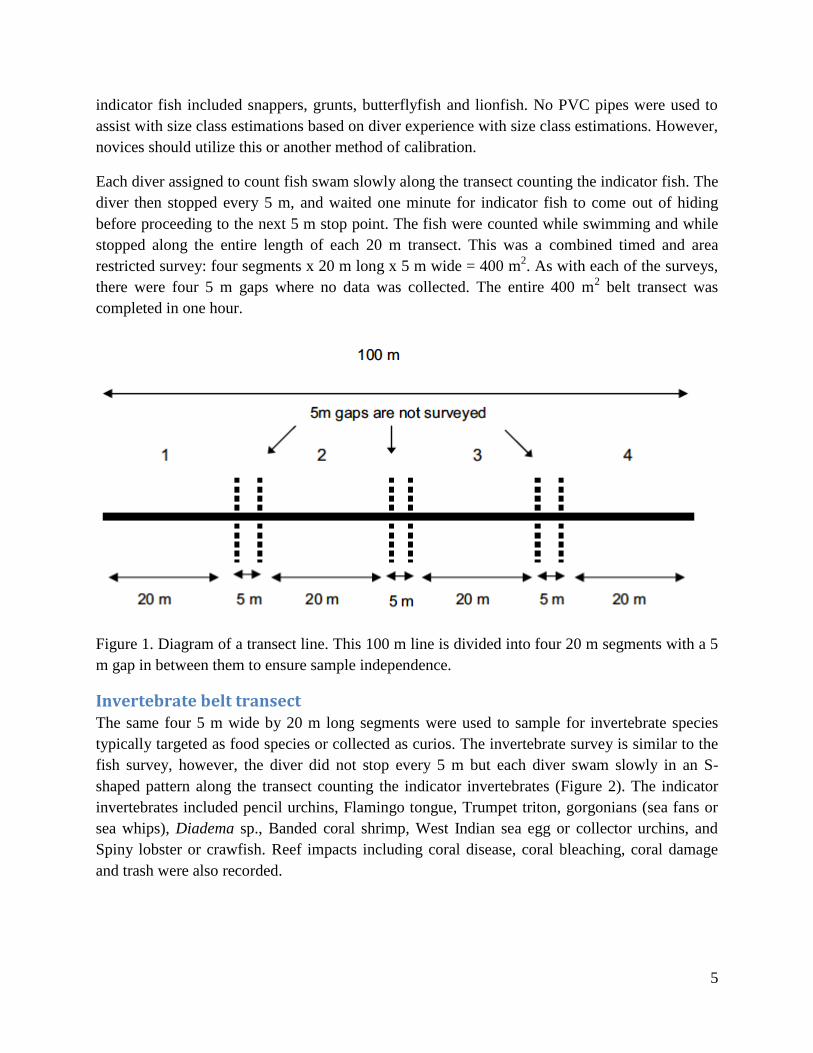
Figure 1. Diagram of a transect line. This 100 m line is divided into four 20 m segments with a 5
m gap in between them to ensure sample independence. ............................................................... 5
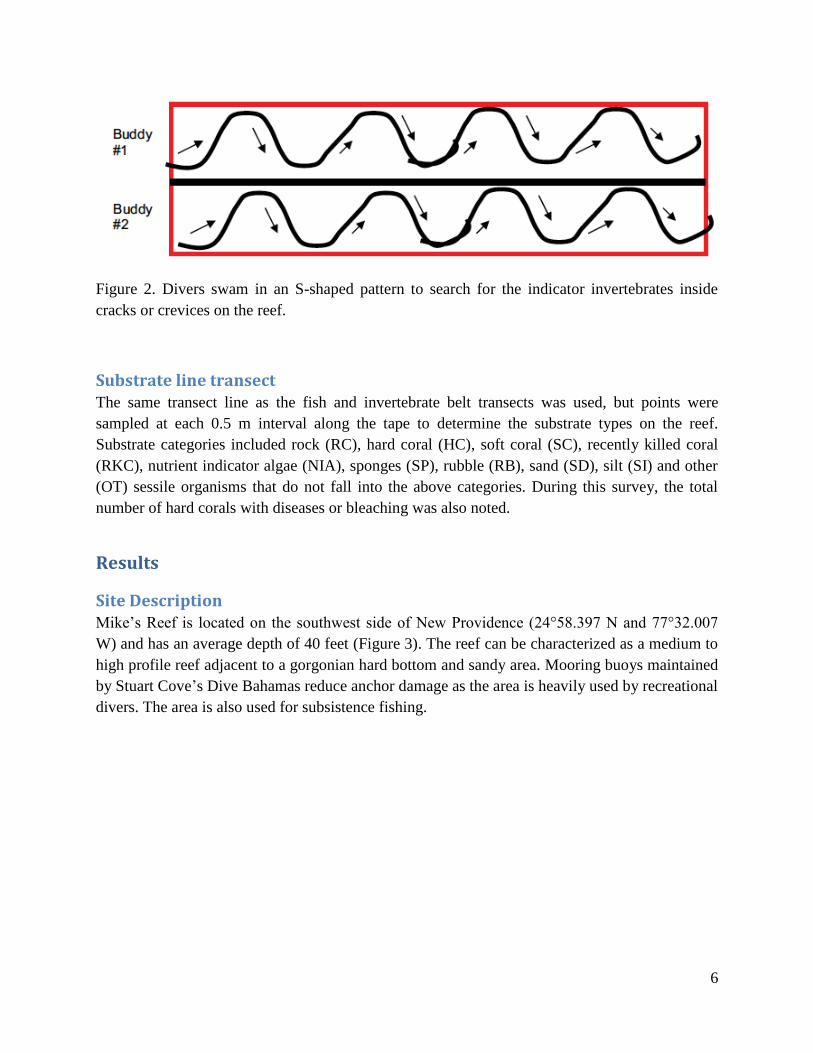
Figure 2. Divers swam in an S-shaped pattern to search for the indicator invertebrates inside
cracks or crevices on the reef. ......................................................................................................... 6
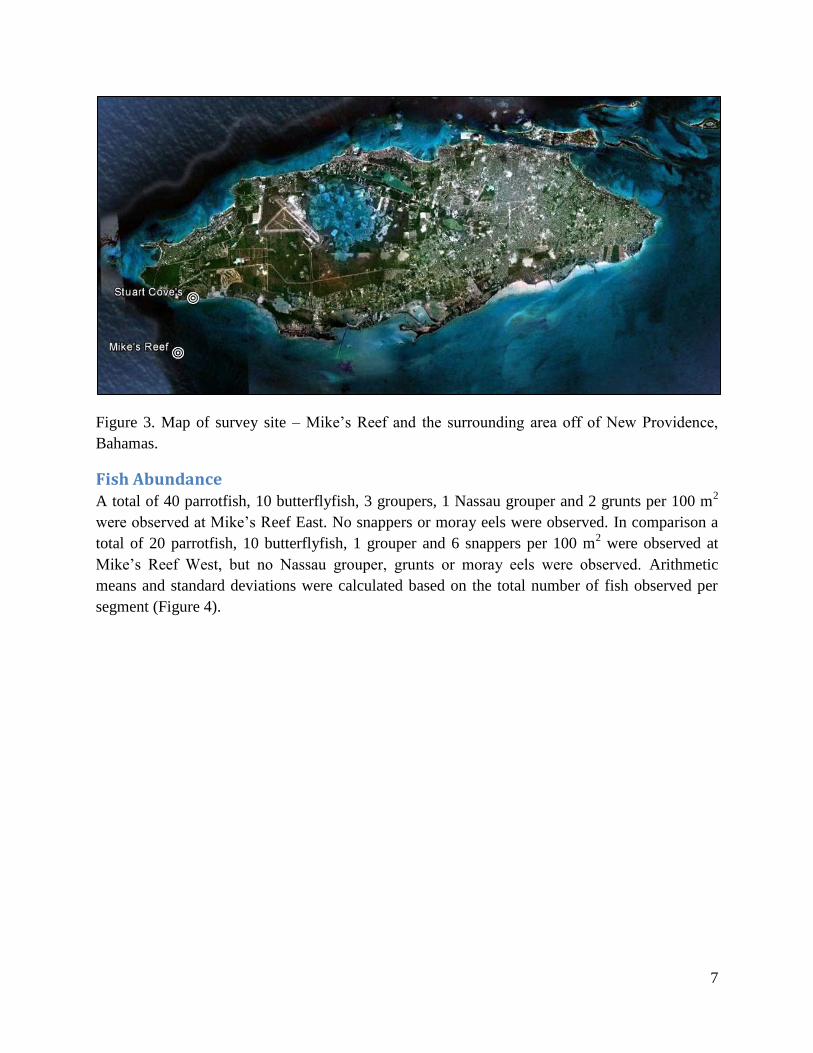
Figure 3. Map of survey site – Mike’s Reef and the surrounding area off of New Providence,
Bahamas. ......................................................................................................................................... 7
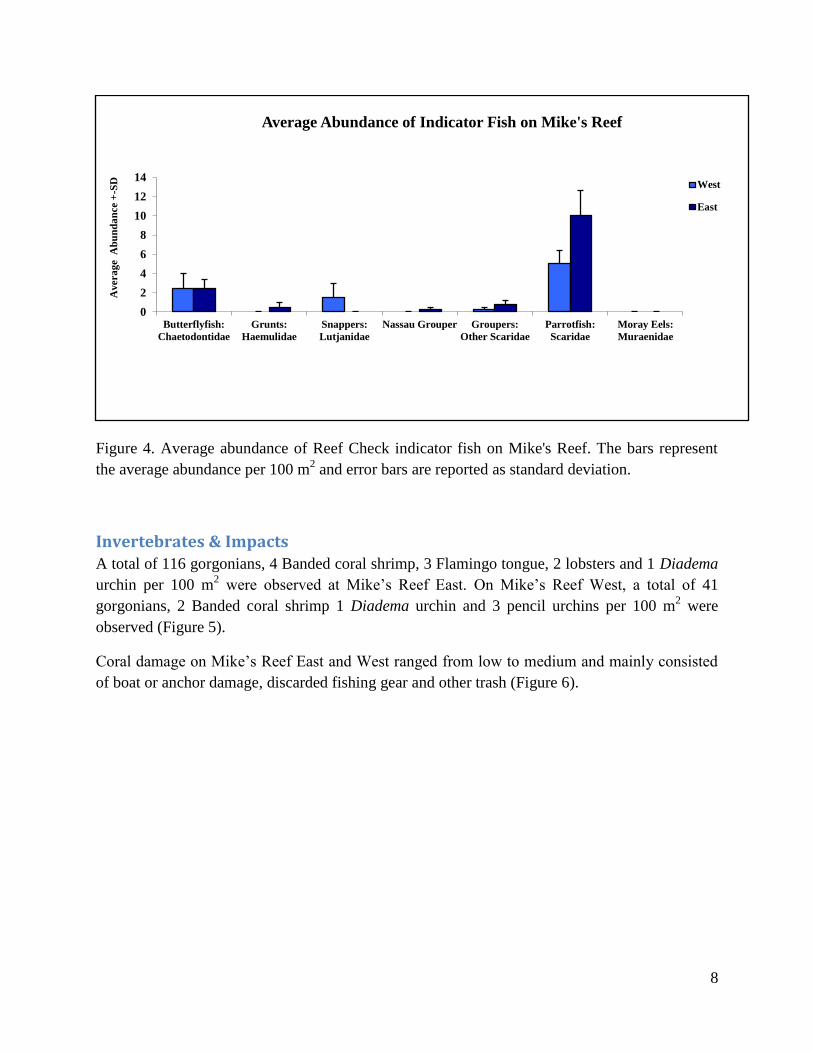
Figure 4. Average abundance of Reef Check indicator fish on Mike's Reef. The bars represent
the average abundance per 100 m2 and error bars are reported as standard deviation. .................. 8
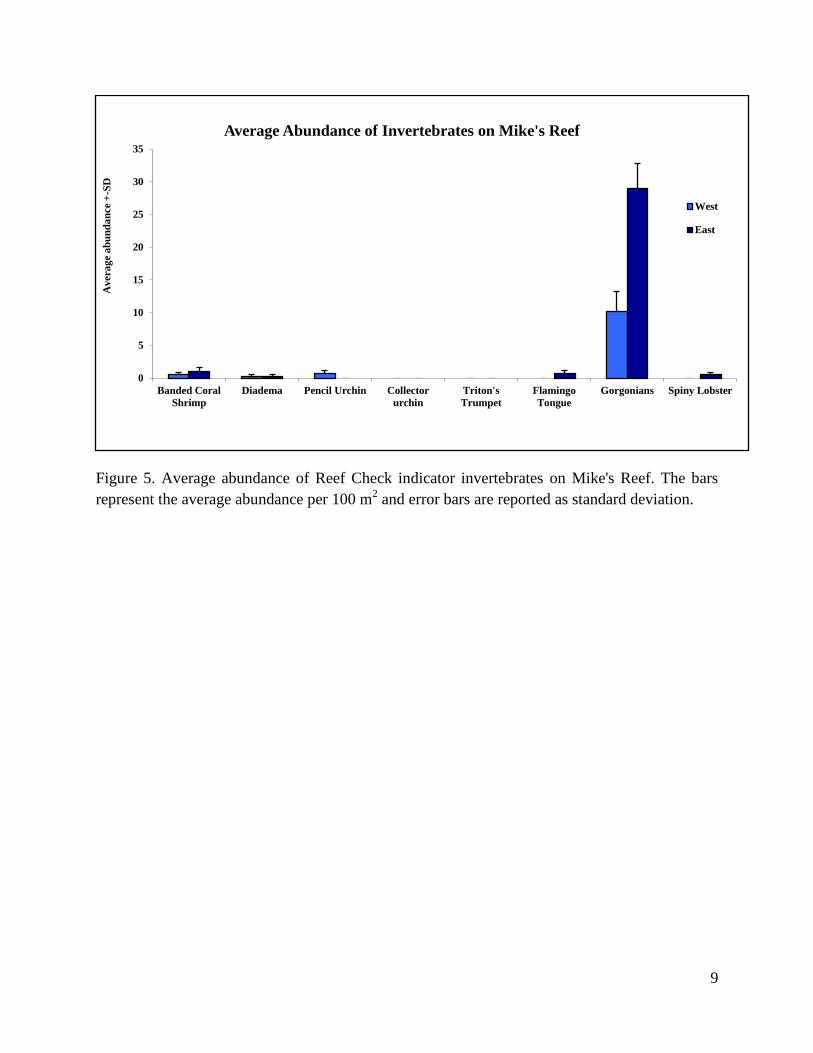
Figure 5. Average abundance of Reef Check indicator invertebrates on Mike's Reef. The bars
represent the average abundance per 100 m2 and error bars are reported as standard deviation. ... 9
Figure 6. The bars represent the level of perceived impacts ranked on a scale from 0-3. Error bars
are reported as standard deviation. ................................................................................................ 10
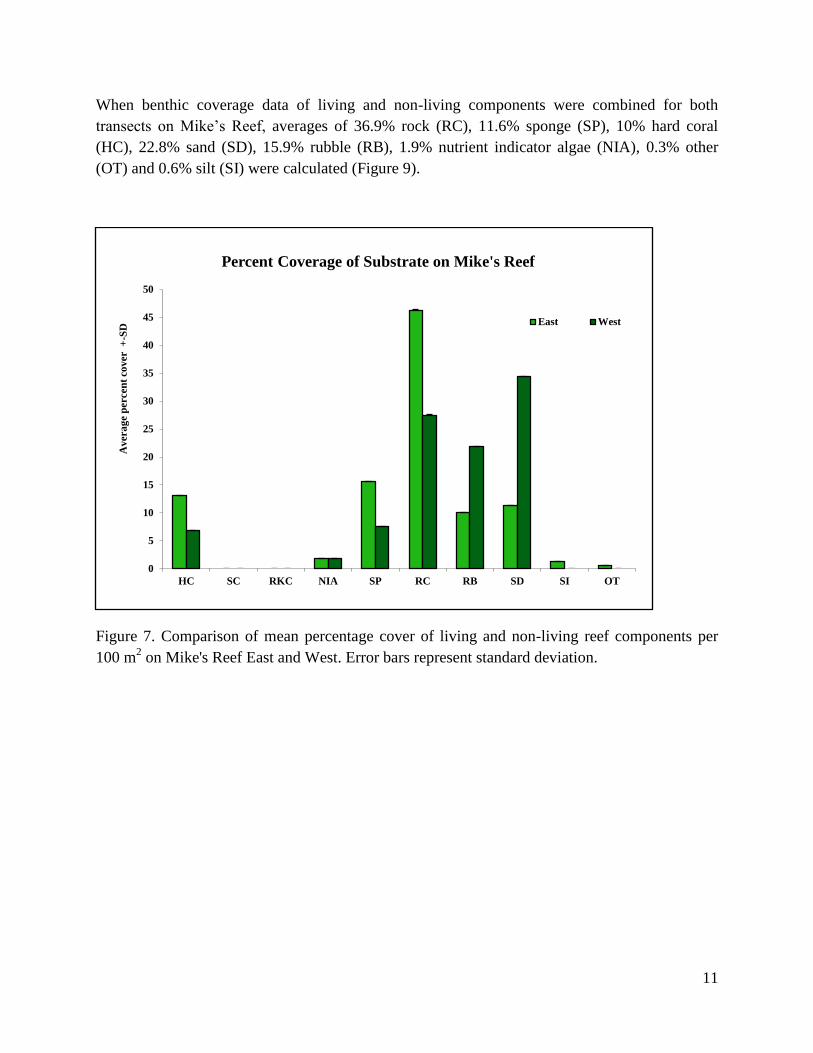
Figure 7. Comparison of mean percentage cover of living and non-living reef components per
100 m2 on Mike's Reef East and West. Error bars represent standard deviation. ......................... 11
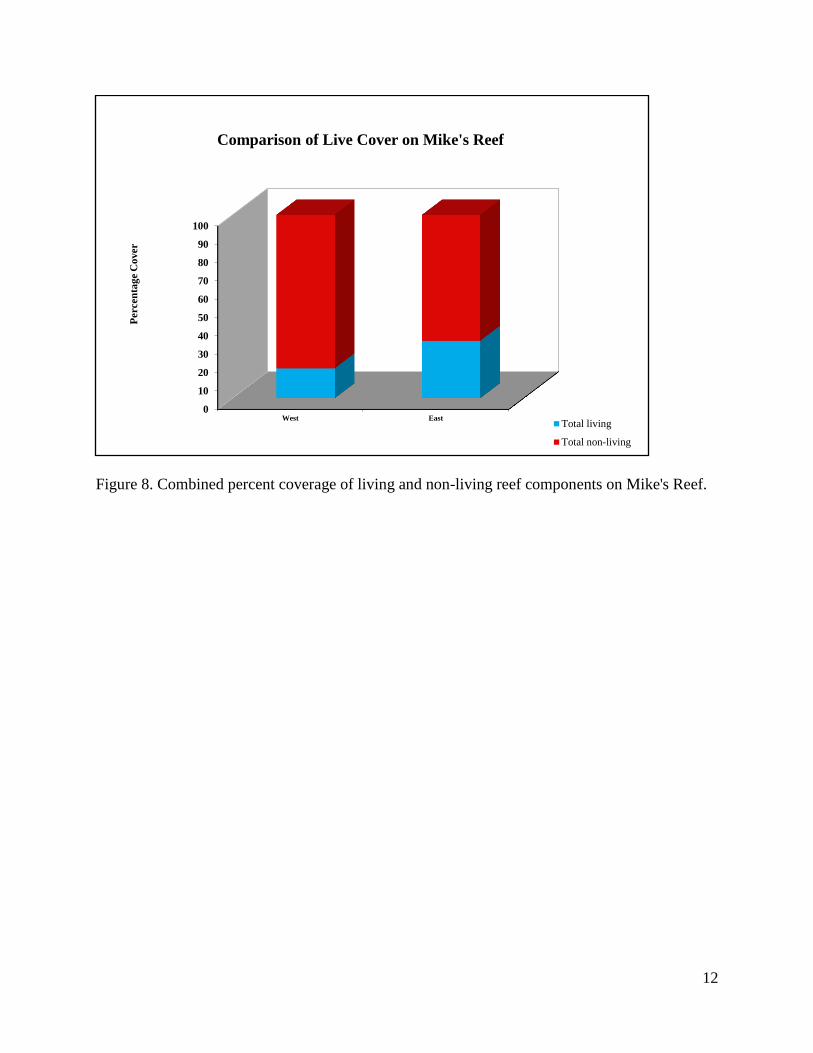
Figure 8. Combined percent coverage of living and non-living reef components on Mike's Reef.
....................................................................................................................................................... 12
Figure 9. Combined mean percentage cover of living and non-living reef components per 100 m2
on Mike's Reef East and West. Error bars represent standard deviation. ..................................... 13
4
Introduction On Wednesday, 1
st February, 2012 a group of marine scientists from The Nature Conservancy,
The Bahamas National Trust and The Bahamas Department of Marine Resources performed the
first of what is hoped to be a series of Reef Check survey dives on Mike’s Reef off southwestern
New Providence. The survey group members were Frederick Arnett and Jared Dillet of DMR,
Ancilleno Davis of TNC, and Lakeshia Anderson, Lindy Knowles and Krista Sherman of BNT.
With the exception of Mr. Knowles, the group had been previously trained in Reef Check
methodologies and was participating in a Training of the Trainers workshop. Upon completion
of the workshop, Mr. Knowles will be trained by one of his aforementioned peers to become a
Reef Check Eco Diver.
Mike’s Reef is located 3.2 km off the southwestern coast of New Providence (Figure 3). The reef
was chosen because it is a popular, well used site for recreational divers and receives daily
visitors almost year-round. The site is also used for recreational and small scale commercial
fishing. Mike’s Reef is located within the proposed Western New Providence Managed Marine
Area and is an ideal site for comparison to other, less used reefs (e.g. marine reserves) within
The Bahamas. Two surveys were completed using the Reef Check methodology and the findings
are presented below.
Methods Two Reef Check Surveys were conducted at Mike’s Reef, New Providence, Bahamas on
February 1, 2012. The team consisted of Lakeshia Anderson, Frederick Arnett, Ancilleno Davis,
Jared Dillet, Lindy Knowles and Krista Sherman. The team was further divided into pairs to
complete fish, invertebrate and substrate surveys. Two transects were laid in a N-S orientation at
35 feet depth more than 5 m apart.
Site Description Anecdotal, observational, historical, location (using a hand-held GPS) and other socioeconomic
data were recorded on the Reef Check Site Description Form.
Fish belt transect Four 5 m wide (centered on the transect line) by 20 m long segments were sampled for fish
species typically targeted by fishermen, aquarium collectors and others. Fish seen up to 5 m
above the line was included (Figure 1). The indicator fish have been selected because they are,
ecologically important species, typically shot out of reefs by spearfishing and caught using hand-
lines. Size minimums have been placed on two families of food fish (> 30 cm for Grouper, > 20
cm for Parrotfish). Grouper and parrotfish smaller than these limits were not counted. Other
5
indicator fish included snappers, grunts, butterflyfish and lionfish. No PVC pipes were used to
assist with size class estimations based on diver experience with size class estimations. However,
novices should utilize this or another method of calibration.
Each diver assigned to count fish swam slowly along the transect counting the indicator fish. The
diver then stopped every 5 m, and waited one minute for indicator fish to come out of hiding
before proceeding to the next 5 m stop point. The fish were counted while swimming and while
stopped along the entire length of each 20 m transect. This was a combined timed and area
restricted survey: four segments x 20 m long x 5 m wide = 400 m2. As with each of the surveys,
there were four 5 m gaps where no data was collected. The entire 400 m2 belt transect was
completed in one hour.
Figure 1. Diagram of a transect line. This 100 m line is divided into four 20 m segments with a 5
m gap in between them to ensure sample independence.
Invertebrate belt transect The same four 5 m wide by 20 m long segments were used to sample for invertebrate species
typically targeted as food species or collected as curios. The invertebrate survey is similar to the
fish survey, however, the diver did not stop every 5 m but each diver swam slowly in an S-
shaped pattern along the transect counting the indicator invertebrates (Figure 2). The indicator
invertebrates included pencil urchins, Flamingo tongue, Trumpet triton, gorgonians (sea fans or
sea whips), Diadema sp., Banded coral shrimp, West Indian sea egg or collector urchins, and
Spiny lobster or crawfish. Reef impacts including coral disease, coral bleaching, coral damage
and trash were also recorded.
6
Figure 2. Divers swam in an S-shaped pattern to search for the indicator invertebrates inside
cracks or crevices on the reef.
Substrate line transect The same transect line as the fish and invertebrate belt transects was used, but points were
sampled at each 0.5 m interval along the tape to determine the substrate types on the reef.
Substrate categories included rock (RC), hard coral (HC), soft coral (SC), recently killed coral
(RKC), nutrient indicator algae (NIA), sponges (SP), rubble (RB), sand (SD), silt (SI) and other
(OT) sessile organisms that do not fall into the above categories. During this survey, the total
number of hard corals with diseases or bleaching was also noted.
Results
Site Description Mike’s Reef is located on the southwest side of New Providence (24°58.397 N and 77°32.007
W) and has an average depth of 40 feet (Figure 3). The reef can be characterized as a medium to
high profile reef adjacent to a gorgonian hard bottom and sandy area. Mooring buoys maintained
by Stuart Cove’s Dive Bahamas reduce anchor damage as the area is heavily used by recreational
divers. The area is also used for subsistence fishing.
7
Figure 3. Map of survey site – Mike’s Reef and the surrounding area off of New Providence,
Bahamas.
Fish Abundance A total of 40 parrotfish, 10 butterflyfish, 3 groupers, 1 Nassau grouper and 2 grunts per 100 m
2
were observed at Mike’s Reef East. No snappers or moray eels were observed. In comparison a
total of 20 parrotfish, 10 butterflyfish, 1 grouper and 6 snappers per 100 m2 were observed at
Mike’s Reef West, but no Nassau grouper, grunts or moray eels were observed. Arithmetic
means and standard deviations were calculated based on the total number of fish observed per
segment (Figure 4).
8
Figure 4. Average abundance of Reef Check indicator fish on Mike's Reef. The bars represent
the average abundance per 100 m2 and error bars are reported as standard deviation.
Invertebrates & Impacts
A total of 116 gorgonians, 4 Banded coral shrimp, 3 Flamingo tongue, 2 lobsters and 1 Diadema
urchin per 100 m2 were observed at Mike’s Reef East. On Mike’s Reef West, a total of 41
gorgonians, 2 Banded coral shrimp 1 Diadema urchin and 3 pencil urchins per 100 m2 were
observed (Figure 5).
Coral damage on Mike’s Reef East and West ranged from low to medium and mainly consisted
of boat or anchor damage, discarded fishing gear and other trash (Figure 6).
0
2
4
6
8
10
12
14
Butterflyfish:
Chaetodontidae
Grunts:
Haemulidae
Snappers:
Lutjanidae
Nassau Grouper Groupers:
Other Scaridae
Parrotfish:
Scaridae
Moray Eels:
Muraenidae
Avera
ge A
bu
nd
an
ce +
-SD
Average Abundance of Indicator Fish on Mike's Reef
West
East
9
Figure 5. Average abundance of Reef Check indicator invertebrates on Mike's Reef. The bars
represent the average abundance per 100 m2 and error bars are reported as standard deviation.
0
5
10
15
20
25
30
35
Banded Coral
Shrimp
Diadema Pencil Urchin Collector
urchin
Triton's
Trumpet
Flamingo
Tongue
Gorgonians Spiny Lobster
Avera
ge a
bu
nd
an
ce +
-SD
Average Abundance of Invertebrates on Mike's Reef
West
East

10
Figure 6. The bars represent the level of perceived impacts ranked on a scale from 0-3. Error bars
are reported as standard deviation.
Benthic Coverage At Mike’s Reef East an average of 40% rock (RC), 16% sponge (SP), 13% hard coral (HC), 11%
sand (SD), 10% rubble (RB), 2% nutrient indicator algae (NIA), 1% other (OT) and 1% silt (SI)
were counted. Comparatively, Mike’s Reef West had an average coverage of 28% rock (RC), 8%
sponge (SP), 7% hard coral (HC), 34% sand (SD), 22% rubble (RB) and 2% nutrient indicator
algae (NIA). No soft corals (SC) or recently killed corals (RKC) were observed under the survey
points at either Mike’s Reef East or West. No silt (SI) or other (OT) substrate reported for
Mike’s Reef West (Figure 7).
Benthic living and non-living components comprised 31.25% and 68.75% cover respectively of
Mike’s Reef East. Benthic living and non-living components comprised 16.25% and 83.75%
cover respectively of Mike’s Reef West (Figure 8).
0
0.2
0.4
0.6
0.8
1
1.2
1.4
1.6
1.8
Damage:Boat or Anchor Damage:Dynamite Damage: Other Trash: fishing gear Trash: general
Lvel
of
Perceiv
ed
Co
ra
l Im
pa
cts
+-S
D
Frequency of Coral Impacts on Mike's Reef
West East
11
When benthic coverage data of living and non-living components were combined for both
transects on Mike’s Reef, averages of 36.9% rock (RC), 11.6% sponge (SP), 10% hard coral
(HC), 22.8% sand (SD), 15.9% rubble (RB), 1.9% nutrient indicator algae (NIA), 0.3% other
(OT) and 0.6% silt (SI) were calculated (Figure 9).
Figure 7. Comparison of mean percentage cover of living and non-living reef components per
100 m2 on Mike's Reef East and West. Error bars represent standard deviation.
0
5
10
15
20
25
30
35
40
45
50
HC SC RKC NIA SP RC RB SD SI OT
Avera
ge p
ercen
t co
ver +
-SD
Percent Coverage of Substrate on Mike's Reef
East West
12
Figure 8. Combined percent coverage of living and non-living reef components on Mike's Reef.
0
10
20
30
40
50
60
70
80
90
100
West East
Percen
tag
e C
over
Comparison of Live Cover on Mike's Reef
Total living
Total non-living

13
Figure 9. Combined mean percentage cover of living and non-living reef components per 100 m2
on Mike's Reef East and West. Error bars represent standard deviation.
Discussion & Conclusion
Fish Abundance Results from the combined fish surveys indicated that targeted fisheries species like groupers,
snappers and grunts are in lower abundance than non-targeted species such as parrotfish and
butterflyfish. Moray eels are typically found in low abundance. These results are consistent with
the current protection level of this area, which is non-existent. These are preliminary results
from a single study and additional surveys on other portions of Mike’s Reef across larger time
scales are needed to make recommendations.
Invertebrates and Impacts Gorgonians were the most abundant Reef Check indicator invertebrate observed at Mike’s Reef
along the transects. This may be due to high water flow-through in the area and the location of
the transects on Mike’s Reef. Mean gorgonian abundance on Mike’s Reef West was lower on
Mike’s Reef East and this may be due to the distance between the transects and the reef edge.
Mike’s Reef East was closer to the reef edge. Assuming the transect areas are representative of
the entire reef; lobster abundance could be low due to subsistence or recreational fishing
0.0
5.0
10.0
15.0
20.0
25.0
30.0
35.0
40.0
HC SC RKC NIA SP RC RB SD SI OT
Avera
ge P
ercen
t C
over +
-SE
Combined Percent Cover of Substrate from Mike's
Reef East and West

14
pressure. The low Diadema abundance observed during this study is typical of the region
following the 1980s epidemic from which only shallow areas are beginning to recover. The other
Reef Check indicator species are currently not of economic importance.
Impacts related to coral bleaching and disease were low (<5%). Anthropogenic impacts were
also low (<1 on the 0-3 perceived impact scale) despite the fact that the area is heavily used by
recreational divers. This may be indicative of local dive tour operator management (e.g. active
trash removal and mooring buoys) of the area.
Benthic Coverage Even though 76% of the surveyed portion of Mike’s Reef consisted of non-living components,
the low macroalgal coverage (due to grazing pressure by high parrotfish densities) could mean
that there is suitable area for coral recruitment. However, live hard corals cover was 10%
suggesting that there may be other factors preventing coral recruitment to the area not related to
substrate type e.g. “edge effects”.
This was the first complete Reef Check survey to be conducted within the proposed boundaries
of the South West Marine Managed Area in New Providence, Bahamas. The data represented in
this report provide baseline information on the status of coral reef health in the area surveyed on
Mike’s Reef. Additional surveys are required to document changes in the area and obtain a more
detailed understanding of coral reef health.
Acknowledgements We would like to thank Dr. Ruben Torres (Reef Check Dominican Republic) for invigilating the
Training of Trainer’s Workshop for The Bahamas. This workshop was funded through the
GEF/UNEP (Global Environment Facility/United Nations Environment Programme) Full Size
Project (FSP) through the National Executing Agency – the Bahamas Environment Science and
Technology (BEST) Commission and supporting National Implementation Support Programme
(NISP) agencies. These agencies include the Bahamas National Trust, The Nature Conservancy,
the Department of Marine Resources and the BEST Commission. Thanks to Stuart Cove’s Dive
Bahamas for providing field logistical support.
References
www.reefcheck.org