copyright © memrb iri, 2005. confidential and proprietary. fmcg categories evolution within the...
TRANSCRIPT
Copyright © MEMRB IRI, 2005. Confidential and proprietary.
FMCG Categories Evolutionwithin theOff-Premise Channel
YTD 2004- YTD 2005(January-June)
September 13, 2005
2Copyright © MEMRB IRI, 2005. Confidential and proprietary.
OUTLET TYPES
SUPERMARKET
LARGE GROCERY
SMALL GROCERY
FOODSTORE
GENERAL STORE
KIOSK
COSMETIC SHOP
CHEMICAL SHOP
PHARMACY
3Copyright © MEMRB IRI, 2005. Confidential and proprietary.
FOOD CATEGORIES
FATS BUTTER MARGARINE EDIBLE OIL
DAIRY SANA & KEFIR SOUR CREAM PROCESSED CHEESE CREAM CHEESE DAIRY DESSERTS DAIRY SNACKS YOGHURT (PLAIN & FRUITS) SOUR MILK
DRESSINGS MAYONNAISE KETCHUP MUSTARD TOMATO PASTE
CULINARY PRODUCTS SEASONINGS DEHYDRATED SOUPS BOUILLON
OTHER FOOD BREAKFAST CEREALS CHOCOLATE WAFERS PET FOOD CANNED FOOD
SALTED SNACKS PEANUTS SEEDS PASTA COFFEE CREAMERS
4Copyright © MEMRB IRI, 2005. Confidential and proprietary.
NON-FOOD CATEGORIES
DETERGENTS DETERGENTS DISHWASHING PRODUCTS FABRIC SOFTENERS
COSMETICS/PERSONAL CARE FEMININE PROTECTION FACIAL SKIN CARE FRAGRANCES (including AFTER SHAVE) TOILET SOAPS BATH FOAMS & SHOWER GELS DEODORANTS SHAMPOOS HAIR CONDITIONERS HANDS & BODY CARE HAIR COLORANTS TOOTHPASTE
OTHER NON-FOOD BABY DIAPERS AIR CARE INSECTICIDES TOILET CARE FURNITURE CARE

5Copyright © MEMRB IRI, 2005. Confidential and proprietary.
BEVERAGES
ALCOHOLIC BEVERAGES BEER BRANDY WINE CHAMPAIGN VERMOUTH BITTER VODKA GIN
NON-ALCOHOLIC BEVERAGES ALCOHOL FREE BEER COFFEE MINERAL WATER JUICES ICE TEA COCOA
6Copyright © MEMRB IRI, 2005. Confidential and proprietary.
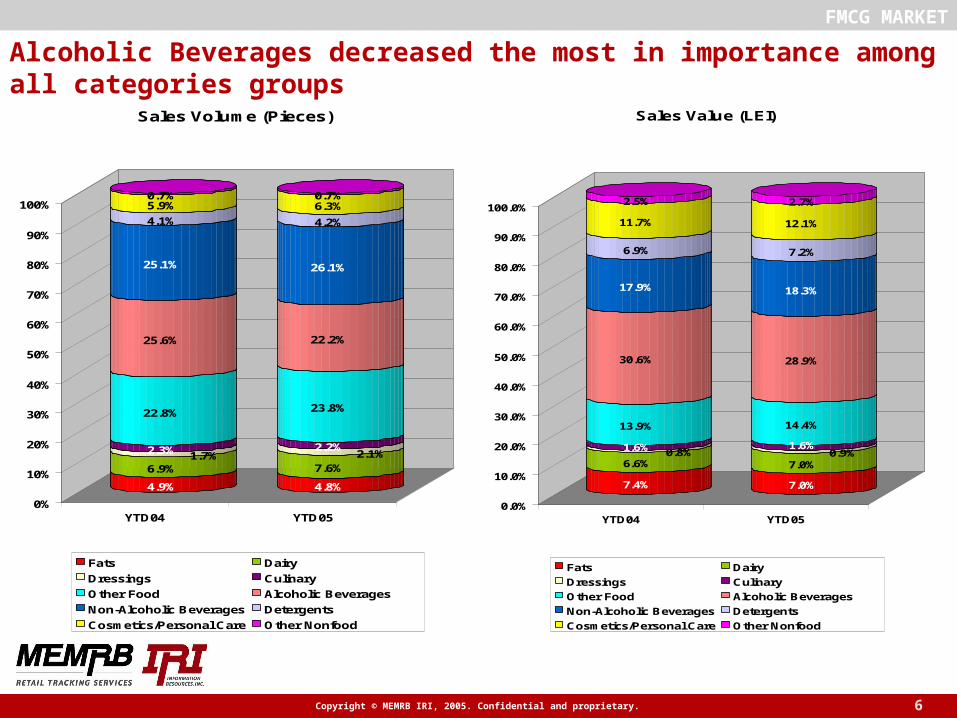
Alcoholic Beverages decreased the most in importance among all categories groups
FMCG MARKET
4.9%
6.9%1.7%2.3%
22.8%
25.6%
25.1%
4.1%
5.9%0.7%
4.8%
7.6%2.1%
2.2%
23.8%
22.2%
26.1%
4.2%
6.3%0.7%
0%
10%
20%
30%
40%
50%
60%
70%
80%
90%
100%
YTD04 YTD05
Sales Volume (Pieces)
Fats Dairy
Dressings Culinary
Other Food Alcoholic Beverages
Non-Alcoholic Beverages Detergents
Cosmetics/Personal Care Other Nonfood
7.4%
6.6%0.8%1.6%
13.9%
30.6%
17.9%
6.9%
11.7%
2.5%
7.0%
7.0%0.9%
1.6%
14.4%
28.9%
18.3%
7.2%
12.1%
2.7%
0.0%
10.0%
20.0%
30.0%
40.0%
50.0%
60.0%
70.0%
80.0%
90.0%
100.0%
YTD04 YTD05
Sales Value (LEI)
Fats Dairy
Dressings Culinary
Other Food Alcoholic Beverages
Non-Alcoholic Beverages Detergents
Cosmetics/Personal Care Other Nonfood
7Copyright © MEMRB IRI, 2005. Confidential and proprietary.
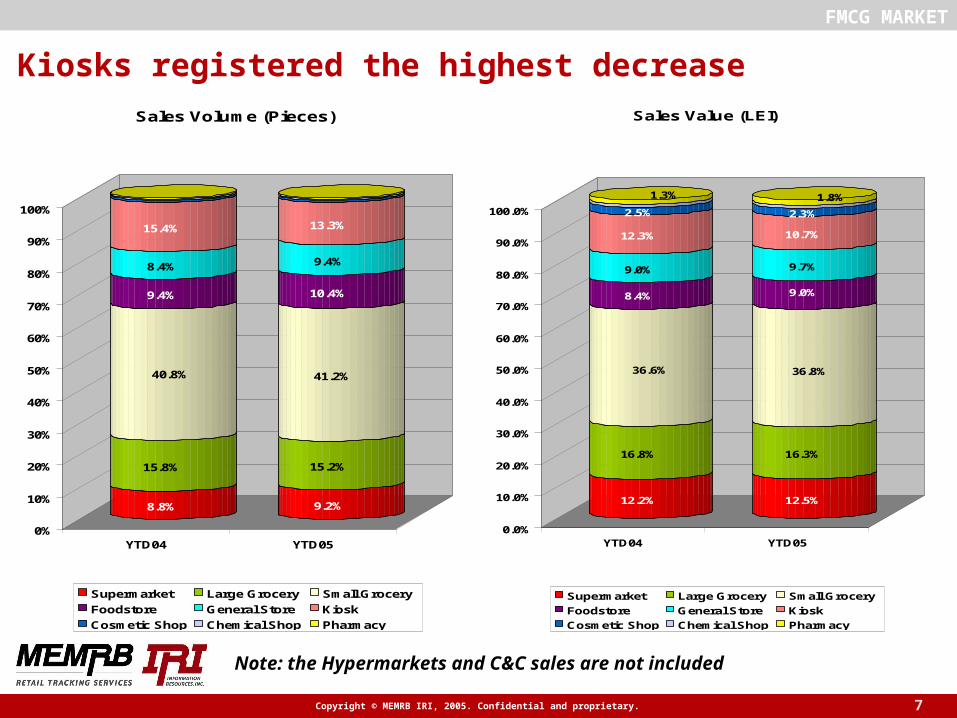
Kiosks registered the highest decrease
FMCG MARKET
8.8%
15.8%
40.8%
9.4%
8.4%
15.4%
9.2%
15.2%
41.2%
10.4%
9.4%
13.3%
0%
10%
20%
30%
40%
50%
60%
70%
80%
90%
100%
YTD04 YTD05
Sales Volume (Pieces)
Supermarket Large Grocery Small Grocery
Foodstore General Store Kiosk
Cosmetic Shop Chemical Shop Pharmacy
12.2%
16.8%
36.6%
8.4%
9.0%
12.3%
2.5%
1.3%
12.5%
16.3%
36.8%
9.0%
9.7%
10.7%
2.3%
1.8%
0.0%
10.0%
20.0%
30.0%
40.0%
50.0%
60.0%
70.0%
80.0%
90.0%
100.0%
YTD04 YTD05
Sales Value (LEI)
Supermarket Large Grocery Small Grocery
Foodstore General Store Kiosk
Cosmetic Shop Chemical Shop Pharmacy
Note: the Hypermarkets and C&C sales are not included
8Copyright © MEMRB IRI, 2005. Confidential and proprietary.
HIGHLIGHTS (I)
FMCG MARKET
•The FMCG market (including Food, Beverages and Non-Food categories) increased by 10.2% in volume terms (sold pieces) in the first six months of the year 2005 compared to the same period of the previous year. All three markets increased. Food and Non-Food markets increased almost at the same rate (15%) in absolute sold pieces whilst the Beverages market increased at a 5% rate.• With regards to the sales value in LEI, the FMCG market increased at a higher rate (+26.7%) compared to the increase in volume. The Non-Food market showed the highest increase rate (+32%) whilst the Food market also increased at a higher rate compared to the FMCG market (+29%). The Beverages market increased by 23%. • Both Food and Non-Food markets increased their importance within the FMCG market at the expense of the Beverages market in the first six months of the year 2005 compared to the same period in the previous year. The trend applies for both volume (sold pieces) and value.• The Non-Alcoholic Beverages group of categories became the most important one (in volume terms) within the FMCG market and is ranked second in value terms. The Alcoholic Beverages group of categories lost the leading position in volume in the first six months of the year 2004 and went down to the third place in 2005, following the Non-Alcoholic Beverages and the Other Food groups of categories. However, they are still ranked first in terms of value, even though their importance slightly declined from last year.
9Copyright © MEMRB IRI, 2005. Confidential and proprietary.
HIGHLIGHTS (II)
FMCG MARKET
• The highest increase of the FMCG market in absolute value in the first six months of the year 2005 compared to the same period of the previous year was noticed within Pharmacies, a channel counting for almost 2% within the FMCG market’s value this year. The market increased in both volume and value terms within all channels apart of slight decreases in volume within Kiosks (due to Food and Beverages markets trends) and Chemical Shops (due to the Non-Food market trend).
• The Small Groceries are still the most important outlet type for the FMCG market, counting for 41.2% of the sold pieces and 36.8% of the LEI amount in the first six months of the year 2005 (slightly increasing compared to the same period in the year 2004).
• The Large Groceries are ranked second as importance whilst Kiosks are following on the third place in volume terms. The Kiosks registered the highest decrease among all channels within the FMCG market in both volume and value terms. Their importance in value terms is higher within the Beverages market (15.8%) and Food market (8.2%) compared to the Non-Food market (3.4%) in the year 2005.
• The Supermarket channel increased its importance within both volume and value terms and reached the third position in value, following Small Groceries and Large Groceries. This does not include the international retail chains sales.