copyright by tyler jordan adams 2015
TRANSCRIPT

Copyright
by
Tyler Jordan Adams
2015
The Thesis Committee for Tyler Jordan Adams
Certifies that this is the approved version of the following thesis:
A Comprehensive Review of Wellbore Breathing
APPROVED BY
SUPERVISING COMMITTEE:
Kenneth E. Gray
Angelica Lasso-Lucero
Supervisor:
A Comprehensive Review of Wellbore Breathing
by
Tyler Jordan Adams, B.S.C.E
Thesis
Presented to the Faculty of the Graduate School of
The University of Texas at Austin
in Partial Fulfillment
of the Requirements
for the Degree of
Master of Science in Engineering
The University of Texas at Austin
December, 2015

Dedication
This thesis is dedicated to my wife, Rebecca, as well as to my parents, Kevin and
Gayle. I would also like to dedicate this work to the rest of my family, my friends, and the
colleagues who encouraged me to pursue graduate school, both in industry and academia.
v
Acknowledgements
I would like to first express my upmost appreciation to the petroleum engineering
department at the University of Texas at Austin for the opportunity to pursue graduate
studies here. My experiences here have been enlightening and rewarding, both in terms of
course work and research, and these experiences will extremely useful going forward in
my career.
I would also like to convey my sincere gratitude to my supervisor, Dr. Kenneth E.
Gray, for his guidance, encouragement, and support throughout this thesis work as well as
providing the opportunity to work in the Wider Windows research group. His assistance
was extremely beneficial and this work would not have been possible without it.
I would like to thank the sponsoring companies of the Wider Windows Industry
Affiliate Program – BHP Billiton; British Petroleum; Chevron; ConocoPhillips; Marathon
Oil Company; National Oilwell Varco; Occidental Oil and Gas; and Shell. Their
contributions provided funding for my graduate studies and this research. Furthermore, I
would also like to thank these same sponsor companies, and specifically their
representatives, for the tremendous insight and guidance they provided regarding my
project during our Program Review meetings and other group gatherings.

vi
Abstract
A Comprehensive Review of Wellbore Breathing
Tyler Jordan Adams, M.S.E
The University of Texas at Austin, 2015
Supervisor: Kenneth E. Gray
Wellbore breathing is a common occurrence during drilling operations, but the
downhole mechanism and how it manifests itself in surface and subsurface processes, is
not well understood. Wellbore breathing events often result in a drilling fluid gain at
surface and are misidentified as a kick, resulting in unneeded shut in periods and associated
non-productive time (NPT). Further, misidentification of wellbore breathing as
underbalance often results in increases in mud weight, which only exacerbates the problem
and may cause lost circulation.
This work focuses on characterization of the wellbore breathing phenomenon in
practical contexts of the pressure, volume, temperature, and time behavior of the
components involved in the surface and subsurface system. This was accomplished through
the examination of case studies published in literature to develop a comprehensive review
of common experiences and incidents, as well as the operational responses to these.
Methods for identification, differentiation from kicks and underbalance, mitigation and
prevention of wellbore breathing are proposed, in addition to operational procedures for
safe continuance of drilling operations. The coupled nature of pressure, temperate, and

vii
volume, as they pertain to wellbore breathing, are analyzed in detail in order to quantify
their effects and how they can inhibit identification of wellbore breathing.
This research also proposes adaptation of the hydraulic fracturing pump-in
flowback test interpretation developed by Plahn, Nolte, and Miska (1997) for the
interpretation of wellbore breathing events and estimation of the minimum horizontal
stress. This work presents estimates of the minimum horizontal stress for fractured zones
in five wells using PWD data recorded during wellbore breathing events, which was
obtained from literature. These estimates were verified qualitatively, when possible, by
comparing across multiple connections and with available LOT data.
viii
Table of Contents
List of Tables ....................................................................................................... xiii
List of Figures ...................................................................................................... xiv
Chapter 1 Introduction ............................................................................................1
1.1 Motivation .................................................................................................1
1.2 Thesis Organization ..................................................................................3
Chapter 2 Literature Review ...................................................................................4
2.1 Wellbore Breathing Past and Present Understandings..............................4
2.1.1 Plastic Deformation of Shales .......................................................4
2.1.2 Pressure-Density-Temperature Behavior of Drilling Fluid ..........6
2.1.3 Opening and Closing of Induced Fractures due to Thermal Effects
................................................................................................................6
2.1.4 Opening and Closing of Fractures Due to ECD............................7
2.2 Definition of Terms and Nomenclature ....................................................9
2.2.1 Formation Integrity Tests ..............................................................9
2.2.1.1 Leak Off Test ..................................................................10
2.2.1.2 Extended Leak Off Test ..................................................11
2.2.1.3 Pump-in Flow-back Test .................................................13
2.2.1.4 Formation Integrity Test .................................................14
2.2.2 Wellbore Integrity Test Nomenclature .......................................14
2.2.2.1 Limit Pressure .................................................................14
2.2.2.2 Fracture Initiation Pressure .............................................15
2.2.2.3 Uncontrolled Fracture Pressure.......................................15
2.2.2.4 Fracture Propagation Pressure ........................................16
2.2.2.5 Instantaneous Shut-in Pressure .......................................17
2.2.2.6 Fracture Closure Pressure ...............................................18
2.2.2.7 Fluid Leak Off.................................................................19
2.2.3 Geologic and Geomechanic Terminology ..................................20
2.2.3.1 Principal Stresses ............................................................20

ix
2.2.3.2 Far Field Stresses ............................................................21
2.2.3.3 Stress Regimes ................................................................22
2.2.3.4 Pore Pressure ...................................................................23
2.2.3.5 Fracture Gradient ............................................................24
2.2.3.6 Collapse Pressure ............................................................25
2.2.3.7 Drilling Window .............................................................25
2.2.3.8 Rubble Zone ....................................................................28
2.2.3.9 Hoop Stress .....................................................................29
2.2.4 Drilling Fluids Terminology and Nomenclature ........................31
2.2.4.1 Equivalent Static Density ................................................31
2.2.4.2 Equivalent Mud Weight ..................................................32
2.2.4.3 Equivalent Circulating Density .......................................32
2.2.4.4 Mud Cake ........................................................................32
2.2.4.5 Cuttings Loading .............................................................33
2.2.4.6 Barite Sag ........................................................................33
2.2.5 Lost Circulation Nomenclature ...................................................34
2.2.5.1 Uncontrolled Fracture Growth ........................................34
2.2.5.2 Fracture Bridging ............................................................35
2.2.5.3 Wellbore Strengthening ..................................................35
2.2.5.4 Lost Circulation Material ................................................38
2.2.5.5 Fracture Healing..............................................................39
2.2.5.6 Surge Pressures ...............................................................40
2.2.6 Formation Fluid Returns at Surface and Well Control ...............41
2.2.6.1 Drill Gas ..........................................................................41
2.2.6.2 Connection Gas ...............................................................43
2.2.6.3 Trip Gas ..........................................................................45
2.2.6.4 Formation Fluid Influx ....................................................46
2.2.6.5 Hydrocarbon Swap Out ...................................................47
2.2.6.6 Flowback and Flowback Fingerprinting .........................47
2.2.6.7 Shut-in Drill Pipe Pressure (SIDPP) and Shut-in Casing
Pressure (SICP) ..................................................................49
x
2.2.6.8 Flow Check .....................................................................51
2.2.6.9 Swab Pressures................................................................52
2.2.6.10 Trapped Pressure ...........................................................53
2.2.6.11 Pressure Bleed Off ........................................................53
2.2.6.12 Blow Out .......................................................................54
2.2.6.13 Kick Tolerance ..............................................................55
2.2.6.14 Slow Circulating Rate Pressures ...................................56
2.2.7 Conventional Drilling .................................................................56
2.2.8 Unconventional Drilling Methods ..............................................57
2.2.8.1 Managed Pressure Drilling .............................................57
2.2.8.2 Pressurized Mud Cap Drilling ........................................58
2.2.8.3 Dual Gradient Drilling ....................................................59
2.2.8.4 Continuous Flow System Drilling ..................................61
2.2.8.5 Casing or Liner Drilling ..................................................62
Chapter 3 Wellbore Breathing Case Studies .........................................................63
3.1 Case Studies from Literature ..................................................................63
3.1.1 Timore Sea, Offshore Australia ..................................................63
3.1.1.1 Bard-1 .............................................................................64
3.1.1.2 Jura-1...............................................................................71
3.1.2 Well ESS-107, Atlantic Ocean, Offshore Brazil ........................73
3.1.3 Well 22/30 C-10, North Sea, Offshore Scotland ........................80
Chapter 4 Identification, Mitigation, and Prevention of Wellbore Breathing ......87
4.1 Identification of Wellbore Breathing ......................................................87
4.1.1 Flowback Fingerprinting .............................................................87
4.1.2 Pressure While Drilling Measurements ......................................90
4.1.3 Logging While Drilling Measurements ......................................93
4.1.4 Time and Temperature Dependent Variables .............................96
4.1.4.1 Thermally Induced Stress Changes due to Drilling Fluid
Temperatures......................................................................97
4.1.4.2 Downhole Pressure Variations ........................................99
xi
4.1.5 Differentiation Between Underbalnce and Breathing ...............102
4.1.5.1 SIDPP and SICP Behavior ............................................102
4.1.5.2 Pressure Bleed Off Volumes .........................................109
4.1.5.3 Connection Gas and Mud Weight Correlation..............110
4.1.5.4 PWD Measurements .....................................................111
4.2 Mitigation of Wellbore Breathing .........................................................112
4.2.1 ECD Management .....................................................................112
4.2.2 Fracture Bridging/Plugging ......................................................115
4.3 Prevention of Wellbore Breathing ........................................................116
4.3.1 Accurate Kill Mud Weight Calculations ...................................117
4.3.2 Drilling Fluid Temperature Management .................................119
4.3.3 Managed Pressure Drilling .......................................................121
4.3.4 Continuous Circulation System ................................................121
Chapter 5 Estimation of the Minimum Horizontal Stress ...................................123
5.1 Hydraulic Fracturing Background and Theory .....................................123
5.1.1 Pump-in Flowback Tests in Hydraulic Fracturing ....................123
5.1.2 Pump-in Flowback Tests in Drilling Operations ......................125
5.1.3 Pump-in Flowback Test Applicability to Wellbore Breathing .128
5.1.4 Previously Proposed Methods...................................................131
5.2 Results for Estimation of Minimum Horizontal Stress Using PWD
Measurements ....................................................................................133
5.2.1 Gulf of Mexico, Well 1 .............................................................133
5.2.2 Gulf of Mexico, Well 2 .............................................................136
5.2.3 Gulf of Mexico, Well 3 .............................................................137
5.2.4 Gulf of Mexico, Well 4 .............................................................138
5.2.5 Offshore Nova Scotia Well .......................................................140
5.3 Application of Minimum Horizontal Stress Estimations .............141
Chapter 6 Conclusions and Recommendations ...................................................143
6.1 Case Studies .................................................................................143
6.2 Identification, Mitigation, and Prevention ...................................144

xii
6.3 Estimation of Minimum Horizontal Stress Using PWD ..............145
6.4 Future Work .................................................................................146
List of Acronyms .................................................................................................147
References ............................................................................................................149

xiii
List of Tables
Table 2.1: Differences between wellbore strengthening hypotheses (Modified after
van Oort et al., 2009) ........................................................................37
xiv
List of Figures
Figure 2.1: (left) shale deformation at static conditions, (right) increased shale
deformation while circulating (Drill bit and collars graphics from
drillingformulas.com) .........................................................................5
Figure 2.2: Graphic depicting the idealized fracture opening and closing process
(Bit and drill collar graphics from drillingformulas.com) ..................8
Figure 2.3: LOT plot (Modified after van Oort and Vargo, 2007) ......................11
Figure 2.4: XLOT Plot (Modified after van Oort and Vargo, 2007) ...................12
Figure 2.5: Pump-in Flow-back Test Plot (Modified after van Oort and Vargo,
2007) .................................................................................................13
Figure 2.6: Typical LOT profiles (Edwards et al., 1998) ....................................16
Figure 2.7: XLOT example plot with the FPP identified ....................................17
Figure 2.8: XLOT example plot with the ISIP identified ....................................18
Figure 2.9: Stress tensor definition and transformation (Zoback, 2007; left graphic
originally developed by Engelder and Leftwich, 1997) ....................21
Figure 2.10: Stress regime classification scheme (Zoback, 2007) ........................22
Figure 2.11: Pore pressure visualization (Zoback, 2007) ......................................23
Figure 2.12: Estimated overburden, pore pressure, fracture, and minimum horizontal
stress gradients (ppg) with proposed mud weight and LOT/FIT data
(modified after Gradishar et al., 2013)..............................................27
Figure 2.13: Drilling through salt tongue intrusion, salt dome with potential structural
traps highlighted in gray (Modified after Dussealt et al., 2004) .......28
Figure 2.14: Stresses around a cylindrical opening within a bi-axial stress field
(Kirsch, 1898) ...................................................................................29

xv
Figure 2.15: Differing hypotheses for lost circulation mitigation. From left to right,
stress cage effect (Alberty and McLean, 2004), fracture-closure stress
(Dupriest, 2005), and fracture-propagation resistance (van Oort et al.
2011). ................................................................................................36
Figure 2.16: Interaction between WBM and OBM or SBM with a water-wet rock
during fracture closure (Ziegler and Jones, 2014) ............................40
Figure 2.17: Typical mud circulation system with gas separation and
measurement devices highlighted in red (Modified after Alberty and
Fink, 2014) ........................................................................................42
Figure 2.18: Flowback profile monitoring from GOM well (Tarab et al., 2014) ..49
Figure 2.19: Graphic depicting well control situation with a shut-in well. ...........50
Figure 2.20: Diagram of a typical MPD system layout (Driedger et al., 2013) ....58
Figure 2.21: DGD system and the differences in mud hydrostatic gradient compared
to a conventional drilling system (Stave, 2014)................................61
Figure 3.1: Map of the Jurassic Plover-Plover petroleum system within the
Bonaparte Basin (Earl, 2004) ............................................................64
Figure 3.2: Predicted section and pore pressure for Bard-1 (Modified after Ashley,
2000) .................................................................................................65
Figure 3.3: Pressures during Bard-1 well control incident (Data from Ashley, 2000)
...........................................................................................................66
Figure 3.4: Percent of returns, oil and gas (Data from Ashley, 2000) ................69
Figure 3.5: 1-ESS-107 well location offshore Brazil (Lage et al., 2002) ............74
Figure 3.6: Pressures during first well control event (Data from Lage et al., 2002)
...........................................................................................................75
xvi
Figure 3.7: Mud weight and gas cuts after kick at 15,834 ft. (Data from Lage et al.,
2002) .................................................................................................79
Figure 3.8: Gas cut and mud weight increases (Data from Maury and Idelovici,
1995). ................................................................................................82
Figure 3.9: Log of events during short trips prior to pulling out of the hole (Data
from Maury and Idelovici, 1995). .....................................................83
Figure 4.1: Flowback monitoring system (Modified after Tarab et al., 2013) ....88
Figure 4.2: Smart Flowback System plot (Tarab et al., 2013) ............................89
Figure 4.3: (a.) Pressure behavior during conventional connection. (b.)
Pressure behavior during connection with breathing. (Ward and Clark,
1998) .................................................................................................91
Figure 4.4: Resistivity plot revealing shallow mud filled fracture (Bratton et al.,
2001) .................................................................................................94
Figure 4.5: Time-lapsed resistivity plot showing fracture closure (Bratton et al.,
2001) .................................................................................................95
Figure 4.6: Various temperatures in a well during drilling (Karstad, 1998). ......97
Figure 4.7: Initiation of wellbore breathing (Modified after Edwards, Bratton, and
Standifird, 2002) .............................................................................100
Figure 4.8: SIDPP and SICP behavior for underbalanced scenario (Pm < Pp). 103
Figure 4.9: SIDPP and SICP behavior for swabbed influx scenario (Pm > Pp).105
Figure 4.10: SIDPP and SICP behavior for a wellbore breathing scenario
(Pm > Pp). ......................................................................................106
Figure 4.11: Procedure for attaining SIDPP with float valve in drill string (Lake,
2006). ..............................................................................................119
xvii
Figure 5.1: Simulation results for flowback portion of pump-in flowback tests
(Plahn, Nolte, and Miska, 1997). ....................................................124
Figure 5.2: Fracture closure process ..................................................................126
Figure 5.3: Pump-in Flowback test data from North Sea well (Raaen et al. 2001)
.........................................................................................................127
Figure 5.4: Minimum horizontal stress estimation for first connection on GOM well
1 (Data from Ward and Clark, 1998) ..............................................134
Figure 5.5: Minimum horizontal stress estimation for subsequent connection on
GOM well 1 (Data from Ward and Clark, 1998) ............................135
Figure 5.6: Minimum horizontal stress estimation for third connection on GOM well
1 (Data from Ward and Clark, 1998) ..............................................135
Figure 5.7: Minimum horizontal stress estimation for connection on GOM well 2
(Data from Edwards, Bratton, and Standifird, 1998) ......................137
Figure 5.8: Minimum horizontal stress estimation for connection on GOM well 3
(Data from Edwards, Bratton, and Standifird, 1998) ......................138
Figure 5.9: Minimum horizontal stress estimation for first connection on GOM well
4 (Data from Nagy et al., 2013). .....................................................139
Figure 5.10: Connection with wellbore breathing (Data from Nagy et al., 2013)
.........................................................................................................140
Figure 5.11: Minimum horizontal stress estimation for Nova Scotia well (Data from
Marland et al., 2007) .......................................................................141
1
Chapter 1: Introduction
1.1 Motivation
During conventional drilling operations, the density of the drilling fluid must be
maintained at a high enough level to provide a greater hydrostatic pressure than both the
pore pressure and collapse pressure of the formation being drilled. If the wellbore pressure
falls below this threshold, a formation fluid influx, known as a kick, will occur and result
in a well control event. Kicks are relatively routine and if recognized quickly, can be safely
circulated out of the well in accordance with well control procedures. However, if a kick
is not recognized, it can lead to a blowout and endanger the lives of everyone at the well
site. Because of this danger, well control is of the upmost importance and takes precedent
over all other well site activity.
Conversely, there is also an upper limit to the mud weight that can be employed
while drilling, which is known as the fracture pressure. If the downhole pressure exceeds
the fracture pressure, fractures will be initiated in the wellbore wall resulting in drilling
fluid losses. This process is known as lost circulation. Lost circulation has been a leading
cause of non-productive time (NPT) in the deepwater Gulf of Mexico over the last decade
(van Oort, 2011). In deepwater settings where the spread rates on rigs often exceed one
million dollars per day, NPT due to lost circulation can become extremely costly.
Additionally, the drilling fluid systems in use today are highly engineered and losses of
large fluid volumes adds incremental costs.
The difference between the formation pore pressure and fracture pressure is known
as the mud weight window and a primary goal of the drilling operation is to maintain the

2
mud weight within this range throughout the course of a well. One challenge in maintaining
the mud weight within the drilling window, is the difference in the effective mud weight
between circulating conditions and static conditions. During circulating conditions,
frictional losses in the annulus lead to an increase in the effective mud weight of 0.1 to 0.5
pound per gallon (ppg) compared to the static conditions. During conventional drilling
operations, the well is circulated while drilling ahead and the pumps are shut off to make
each connection. Therefore, this fluctuation occurs every 90 or 120 feet, depending on the
rig design, throughout the course of a well. This has commonly resulted in wellbore
pressures that exceed the fracture pressure while drilling and are below the fracture
pressure while making connections. The effective result of this, known as wellbore
breathing, is fluid losses while drilling as mud flows into the opening fractures and fluid
gains during connections as the fractures close and force mud back into the wellbore.
Wellbore breathing presents significant operational problems primarily because of
the fluid flow into the wellbore during connections. This will register as a pit gain at surface
and is often misidentified as a kick. The typical response to a kick is to raise the mud
weight, but in the case of wellbore breathing, an increase in mud weight will only
exacerbate the problem. The increased mud weight will cause the fractures to be
propagated further, either worsening the breathing affect or breaking down the formation
and causing large fluid losses. This scenario has played out numerous times during
deepwater drilling operations, resulting in significant non-productive time and even
complete loss of the well in extreme cases (Ashley, 2000). While there have been several
wellbore breathing case studies published; the complex, highly coupled, and time
3
dependent processes responsible and how these processes manifest themselves both
downhole and at the surface, have not been examined together and in detail.
The primary objective of this thesis is to provide a comprehensive review of
wellbore breathing, the mechanisms responsible for it, and how it can be identified through
both surface and subsurface processes, or “signals”. This work focuses on explaining and
detailing commonly encountered wellbore breathing scenarios in contexts of the pressure,
volume, temperature, and time behavior of the involved surface and subsurface system.
Additionally, there is significant ambiguity surrounding the terms, acronyms, and
nomenclature pertaining to drilling operations and wellbore breathing specifically. This
thesis work also defines and explains much of this terminology in both a technical and
operational sense as it will be beneficial to the industry and academia alike.
1.2 Thesis Organization
This thesis consists of six chapters. Chapter 1 is composed of the introduction.
Chapter 2 consists of a literature review of the past and present understandings of wellbore
breathing and a review of the nomenclature, terms, and acronyms pertaining to wellbore
breathing and drilling operations in general. Chapter 3 focuses on wellbore breathing case
studies published in literature. Chapter 4 details methods for identification, mitigation, and
prevention of wellbore breathing in addition to in addition to recommendations for safely
continuing operations for wells experiencing wellbore breathing. Chapter 5 covers methods
for inferring the in-situ minimum horizontal stress during breathing events and the
theoretical background these methods are based on. Finally, Chapter 6 states the
conclusions and recommendations for this thesis.

4
Chapter 2: Literature Review
2.1 Wellbore Breathing Past and Present Understandings
Wellbore breathing is a phenomenon that has been experienced from time to time
on the drill floor over the decades and has been the subject of much debate as to the actual
mechanism occurring downhole. Wellbore breathing was initially explained to be plastic
deformation of wet shales or “shale charging” (Gill, 1986), later proposed to be caused by
pressure, density, temperature behavior of drilling fluids downhole (Babu, 1993, 1997),
and later hypothesized as the opening and closing of induced downhole fractures due to
thermal affects (Maury and Idelovici, 1995). The hypothesis that opening and closing of
downhole fractures, both induced and natural, due to pressure fluctuations between
circulating and static conditions was then proposed (Tare et al., 2001) and has become
widely accepted within the industry as the primary mechanism behind wellbore breathing.
2.1.1 Plastic Deformation of Shales
Wellbore breathing was initially termed wellbore ballooning when published and
explained as the expansion of the wellbore, like a balloon, caused by long sections of wet
plastic shales deforming plastically under the increased annular pressure during circulation
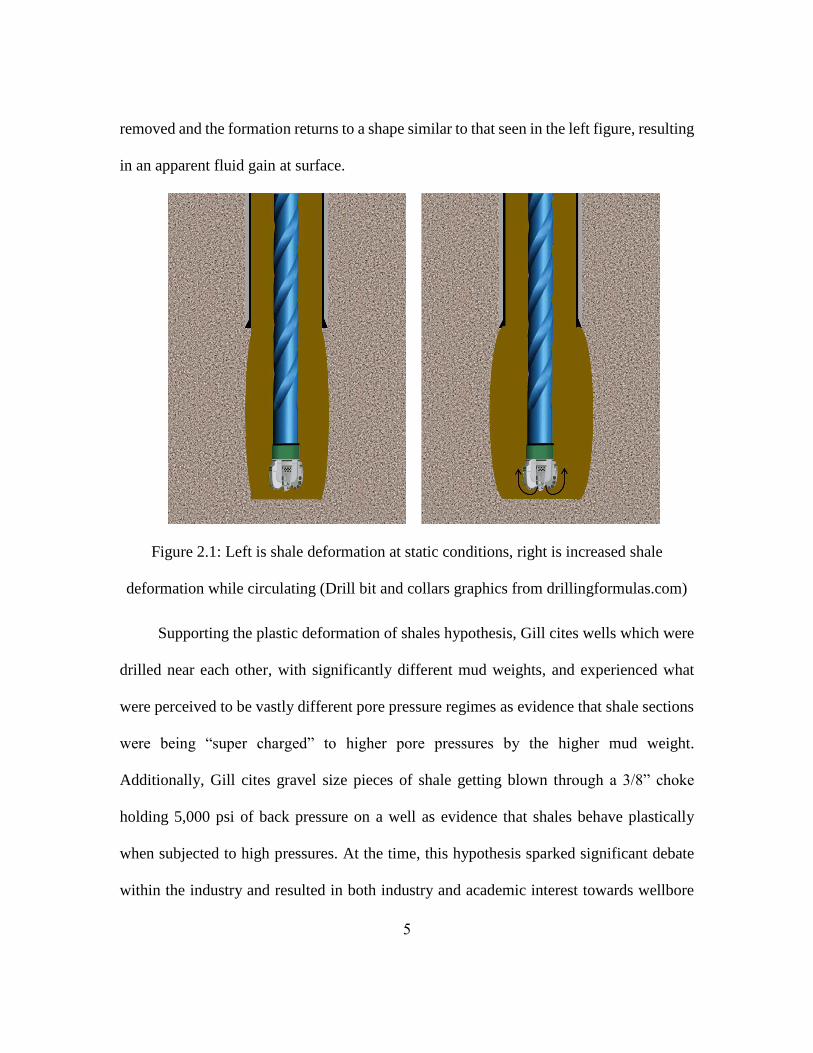
(Gill, 1986). The graphic in Figure 2.1 below, is representative of the downhole process
described by Gill. On the left side of the figure, the shale formation is plastically deformed
due to a wellbore pressure significantly higher than the pore pressure when the well is in
static conditions. On the right side of the figure, ECD due to circulation increases the
amount of overbalance and deforms the shale hole section further resulting in an apparent
fluid loss at surface. When circulation is stopped, the excess overbalance due to ECD is
5
removed and the formation returns to a shape similar to that seen in the left figure, resulting
in an apparent fluid gain at surface.
Figure 2.1: Left is shale deformation at static conditions, right is increased shale
deformation while circulating (Drill bit and collars graphics from drillingformulas.com)
Supporting the plastic deformation of shales hypothesis, Gill cites wells which were
drilled near each other, with significantly different mud weights, and experienced what
were perceived to be vastly different pore pressure regimes as evidence that shale sections
were being “super charged” to higher pore pressures by the higher mud weight.
Additionally, Gill cites gravel size pieces of shale getting blown through a 3/8” choke
holding 5,000 psi of back pressure on a well as evidence that shales behave plastically
when subjected to high pressures. At the time, this hypothesis sparked significant debate
within the industry and resulted in both industry and academic interest towards wellbore

6
breathing and identification of the underlying mechanism causing it. . The hypothesis that
shales were behaving plastically downhole has been disproven due to a lack of shale rocks
exhibiting this behavior in experiments. Additionally, finite element modeling and analysis
has shown that elastic deformation of the borehole, due to the increased pressure caused
by the ECD, would contribute a volume change of only 1.5 barrels for extremely soft rocks,
with a Young’s modulus of 58,000 psi (Helstrup et al., 2001). While elastic deformation
of the wellbore may be a contributing factor to wellbore breathing events, these gains and
losses are often tens to hundreds of barrels in size, indicating that elastic wellbore
deformation is not the primary mechanism.
2.1.2 Pressure-Density-Temperature Behavior of Drilling Fluid
Pressure, density, temperature behavior of muds was also proposed as an
explanation for wellbore breathing events. Babu (1997) determined that after circulation is
stopped, the drilling fluid in the wellbore will expand, between 11.1 and 35 bbls for a
17,500 ft well, as it warms to the geothermal gradient along its depth. While this expansion
is realistic, warming of the mud to cause the expansion is a slow and gradual process that
takes between 4 and 9 hours for half the expansion to occur (Babu, 1997). Because
breathing events typically occur over the course of minutes rather than hours, the
temperature change of a mud column after circulation has stopped can be ruled out as a
cause of wellbore breathing.
2.1.3 Opening and Closing of Induced Fractures due to Thermal Effects
Maury and Idelovici (1995) published the first work attributing wellbore breathing
to the opening and closing of induced fractures downhole. The work consisted of a

7
relatively unique North Sea case study where a heat exchanger was used at surface to cool
the oil based mud (OBM) in order to keep it below the flash point. This case study will be
examined in detail later, but throughout the case study, wellbore breathing was experienced
and subsequent increases in mud weight resulted in increased flow during flow checks and
increased gas cuts at surface. Maury and Idelovici (1995) attributed this to:
Fracture initiation caused by cooling of the formation during circulation and a
subsequent reduction in its strength.
Further fracture propagation due to continued cooling while circulating coupled
with increased mud weights.
Instantaneous mechanical decompression of the well and fractures partially closing
when circulation is stopped due to loss of ECD, but this was thought to occur too
quickly to be recorded during flow checks.
Flow back during flow checks and trips caused by thermally induced fracture
closure as the mud system and surrounding formation warmed and the effective
fracture gradient increased.
The explanation of wellbore breathing as a thermally driven phenomenon is particular to
the unique set of circumstances on this well, but poses important questions about the role
of the thermal regimes and induced fractures in wellbore breathing.
2.1.4 Opening and Closing of Fractures, Induced and Natural
Present day understanding of wellbore breathing is that it is caused by fractures
opening and closing due to downhole pressure fluctuations between static conditions and
8
circulating conditions. While this had been proposed in response to Gill’s hypothesis
(Bowman, 1989) and (Holbrook, 1989), implementation of pressure-while-drilling (PWD)
tools in the late 1990’s provided downhole pressure measurements that supported opening
and closing of fractures as the primary mechanism responsible for breathing (Ward and
Clark, 1998). Tare, Whitfill, and Mody (2001) explained that wellbore breathing was
primarily due to opening and closing of fractures, both induced and natural, and stated that
the geologic setting, well trajectory, and operational parameters contributed to the process.
Their work cited two Gulf of Mexico wells that experienced wellbore breathing and the
borehole analysis results from those wells which indicated that fractures were responsible
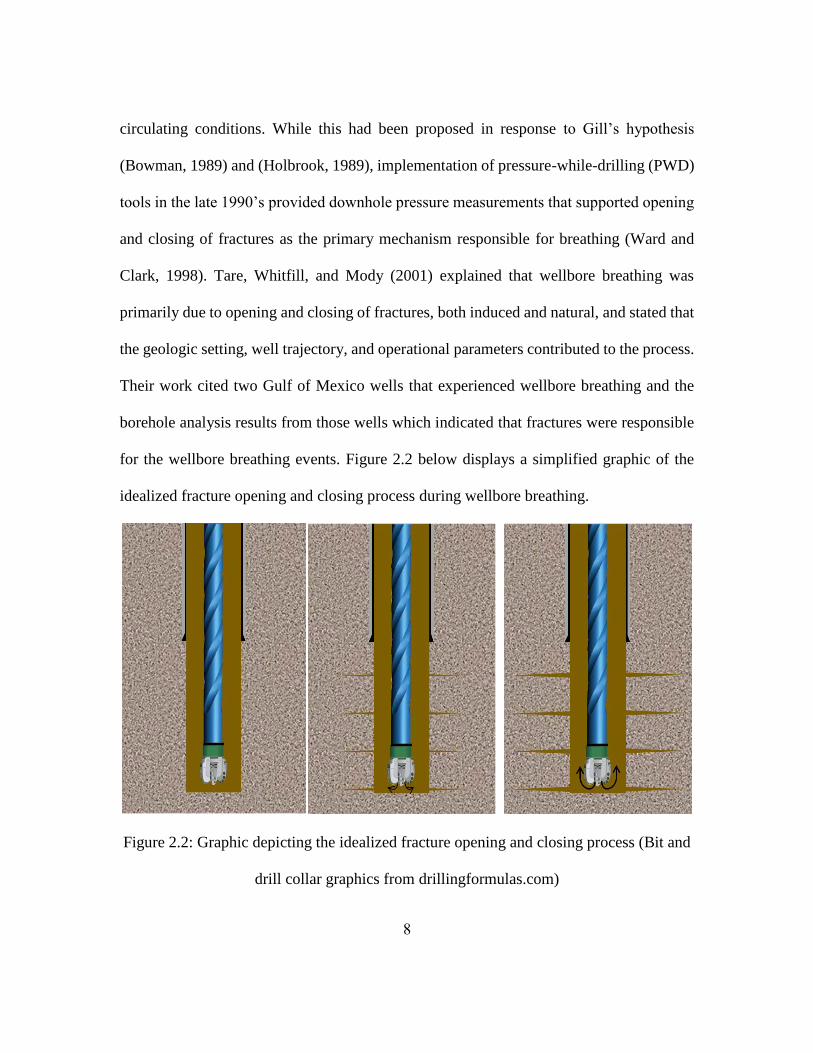
for the wellbore breathing events. Figure 2.2 below displays a simplified graphic of the
idealized fracture opening and closing process during wellbore breathing.
Figure 2.2: Graphic depicting the idealized fracture opening and closing process (Bit and
drill collar graphics from drillingformulas.com)
9
On the left, the well is in static conditions and there are either no fractures in the
wellbore walls, or they are all closed. In the center, the pumps are being staged up to the
circulating rate, raising the wellbore pressure above the fracture pressure and either
initiating fractures, or opening already present fractures. On the right, the pumps are at the
full circulating rate and drilling has commenced resulting in a higher wellbore pressure and
pushing more fluid into the fractures, possibly propagating them. In the time sequence this
occurs in drilling operations, from left to right, the result is a net loss in the pits at surface.
Once the stand is drilled down, the order of these events is reversed as drilling stops and
the pumps are shut down for a connection. The wellbore pressure is reduced and the
fractures close, forcing fluid back into the wellbore and causing an apparent pit gain at
surface.
2.2 Definition of Terms and Nomenclature
This section will delve into some of the terms, acronyms, and nomenclature
typically used in relation to processes that occur in and around the wellbore during drilling
operations. It will focus on both technical and operational definitions of these terms and
how these are interrelated.
2.2.1 Wellbore Integrity Tests
Wellbore integrity tests are used during the course of drilling operations to
determine the strength of a formation and to verify pressure integrity of the previous casing
string and cement job. The typical operational events immediately preceding a formation
integrity test are: complete drilling of a hole-section, set and cement casing string, drill out
casing shoe and 10-20 feet of new formation (Zoback, 2007), and close the BOP. Wellbore
10
integrity test results are extremely important and will be used to make decisions concerning
mud weight, kick tolerance, and well design during the subsequent hole section (van Oort
and Vargo, 2007). There are multiple variations of formation integrity tests including LOT,
LT, XLOT, and pump-in flowback tests, all of which will be detailed here
2.2.1.1 Leak Off Test
A typical pressure versus time and volume plot during a leak off test (LOT) is
shown in Figure 2.3. As drilling fluid is initially pumped into the wellbore, the pressure
typically displays a linear relationship with the volume of fluid pumped. At point 2, known
as the fracture initiation pressure (FIP), the pressure begins to depart from its linear
relationship with the volume pumped. Fluid continues to be pumped into the wellbore and
pressure increases until point 3, when the mud pumps are shut down and fluid is no longer
being pumped into the wellbore. The Pump-stop Pressure (PSP), point 3 in figure 2.3, is
the maximum pressure recorded in a LOT. The pressure immediately drops to point 4, the
Instantaneous Shut-in Pressure (ISIP). The pressure then decreases as drilling fluid leaks
off into the formation or the pressure is bled off at the BOP. Additionally, a LOT is
occasionally stopped prior to reaching the FIP. This is known as a Formation Integrity Test
(FIT) and the pumps are stopped at point 1, the limit pressure (LP), while the pressure is
still displaying a linear relationship with the volume pumped.

11
Figure 2.3: LOT plot (Modified after van Oort and Vargo, 2007)
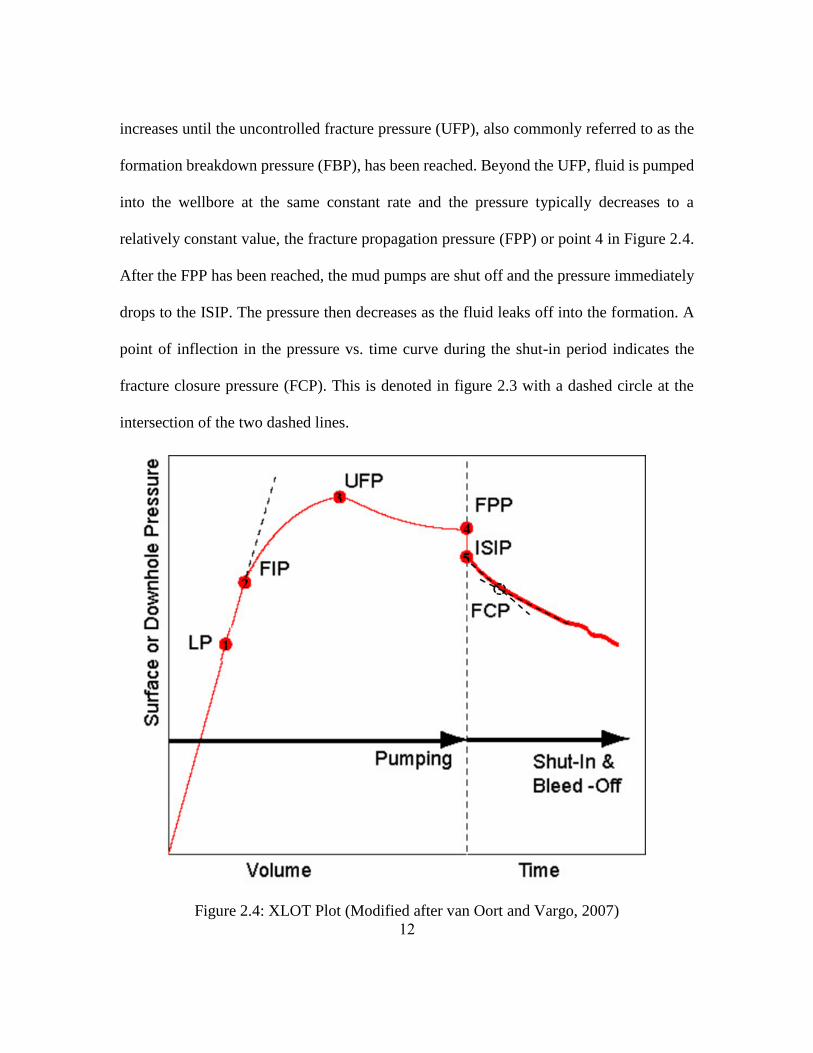
2.2.1.2 Extended Leak Off Test
An example of a pressure versus time plot during an extended leak off test (XLOT)
is shown in Figure 2.4. A XLOT is similar to a LOT, but fluid is pumped into the wellbore
for an extended period rather than shutting the pumps down directly after the FIP has been
reached. As fluid is pumped into the wellbore beyond the FIP, the pressure typically
12
increases until the uncontrolled fracture pressure (UFP), also commonly referred to as the
formation breakdown pressure (FBP), has been reached. Beyond the UFP, fluid is pumped
into the wellbore at the same constant rate and the pressure typically decreases to a
relatively constant value, the fracture propagation pressure (FPP) or point 4 in Figure 2.4.
After the FPP has been reached, the mud pumps are shut off and the pressure immediately
drops to the ISIP. The pressure then decreases as the fluid leaks off into the formation. A
point of inflection in the pressure vs. time curve during the shut-in period indicates the
fracture closure pressure (FCP). This is denoted in figure 2.3 with a dashed circle at the
intersection of the two dashed lines.
Figure 2.4: XLOT Plot (Modified after van Oort and Vargo, 2007)
13
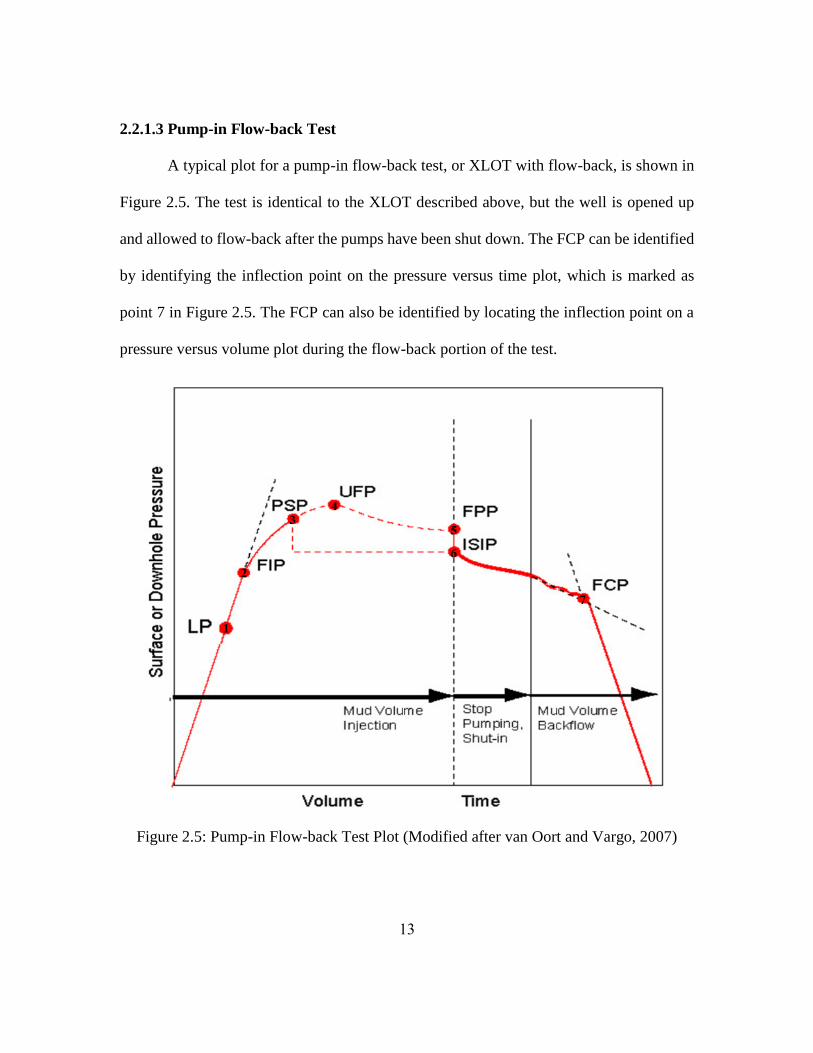
2.2.1.3 Pump-in Flow-back Test
A typical plot for a pump-in flow-back test, or XLOT with flow-back, is shown in
Figure 2.5. The test is identical to the XLOT described above, but the well is opened up
and allowed to flow-back after the pumps have been shut down. The FCP can be identified
by identifying the inflection point on the pressure versus time plot, which is marked as
point 7 in Figure 2.5. The FCP can also be identified by locating the inflection point on a
pressure versus volume plot during the flow-back portion of the test.
Figure 2.5: Pump-in Flow-back Test Plot (Modified after van Oort and Vargo, 2007)
14
2.2.1.4 Formation Integrity Test
A formation integrity test (FIT) is similar to a LOT, but the test is stopped prior to
the pressure volume relationship departing from linearity. Limit tests are designed to test
the cement strength in the shoe and are typically stopped at a pressure believed to provide
a large enough drilling window to reach the next casing point. They are typically run in
areas where past wells have been drilled and the minimum horizontal stress is relatively
well understood. The reasoning for stopping the test early, in comparison with a LOT, is
the desire to limit the damage to wellbore integrity that occurs when the pressure exceeds
the FIP and the formation is fractured. FIT’s are also commonly called Jug Tests.
2.2.2 Wellbore Integrity Test Nomenclature
This section focuses on describing the physical process or processes behind the
terms used in describing the pressure versus time and volume behavior during formation
integrity tests.
2.2.2.1 Limit Pressure
The limit pressure is the highest pressure achieved during a limit test and occurs on
the linear portion of the pressure versus volume LOT plot (van Oort and Vargo, 2007). The
limit pressure is a predetermined pressure set by the drilling engineer and is not indicative
of the actual fracture gradient other than to provide a minimum value. There are typically
two different scenarios where a LOT is stopped at the LP rather than continuing to the FIP.
First, if a well is being drilled in a mature field with a well understood fracture gradient;
the LP will be set below the expected FIP to avoid fracturing the formation. Second, in a
problematic well which has used contingency strings uphole, the LP may be set to a value

15
that is believed to provide enough kick tolerance to reach the next casing point. Similar to
the first, the desire is to stop the LOT before the fracture gradient has been reached.
Initiating a fracture could narrow the mud weight window enough to require the casing
string be set short of its desired depth and potentially inhibit the well from reaching total
depth.
2.2.2.2 Fracture Initiation Pressure
The fracture initiation pressure (FIP) is defined as the point where the pressure
versus volume plot departs from linearity. The exact physical process causing this
departure from linearity has been disputed in literature, but is believed to generally be
related to the initiation of fractures in the formation (Edwards et al., 2002). The FIP is also
commonly known as the leak off point (LOP).
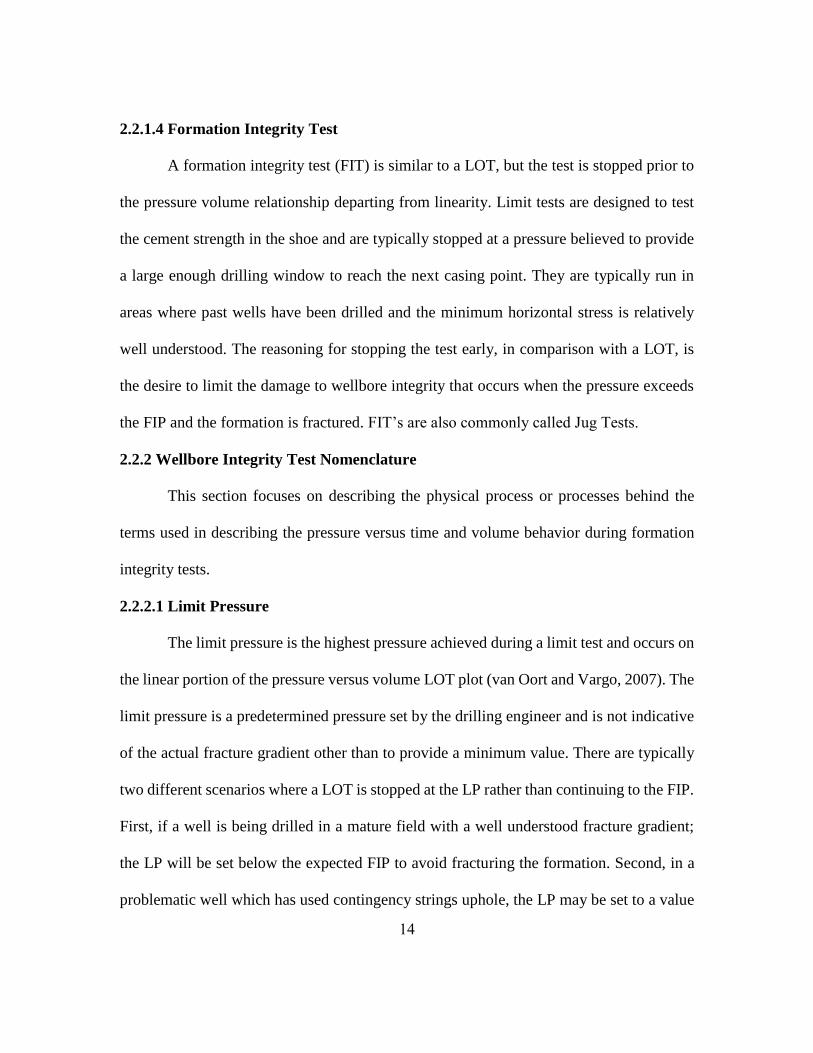
2.2.2.3 Uncontrolled Fracture Pressure
The uncontrolled fracture pressure (UFP), commonly known as the fracture
breakdown pressure (FBP), is the point on a XLOT plot when the pressure begins to
decrease. The UFP is understood to be the point at which the energy stored within the
fracture becomes large enough to overcome the hoop stress at the wellbore wall and the
pressure loss along the length of the fracture and transmit enough pressure to the fracture
tip to cause propagation out into the far field (van Oort and Vargo, 2007). The UFP can
occur at the same point as the FIP, shown as (a) in Figure 2.6, or at a higher pressure than
the FIP, shown as (b) in Figure 2.6.
16
Figure 2.6: Typical LOT profiles (Edwards et al., 1998)
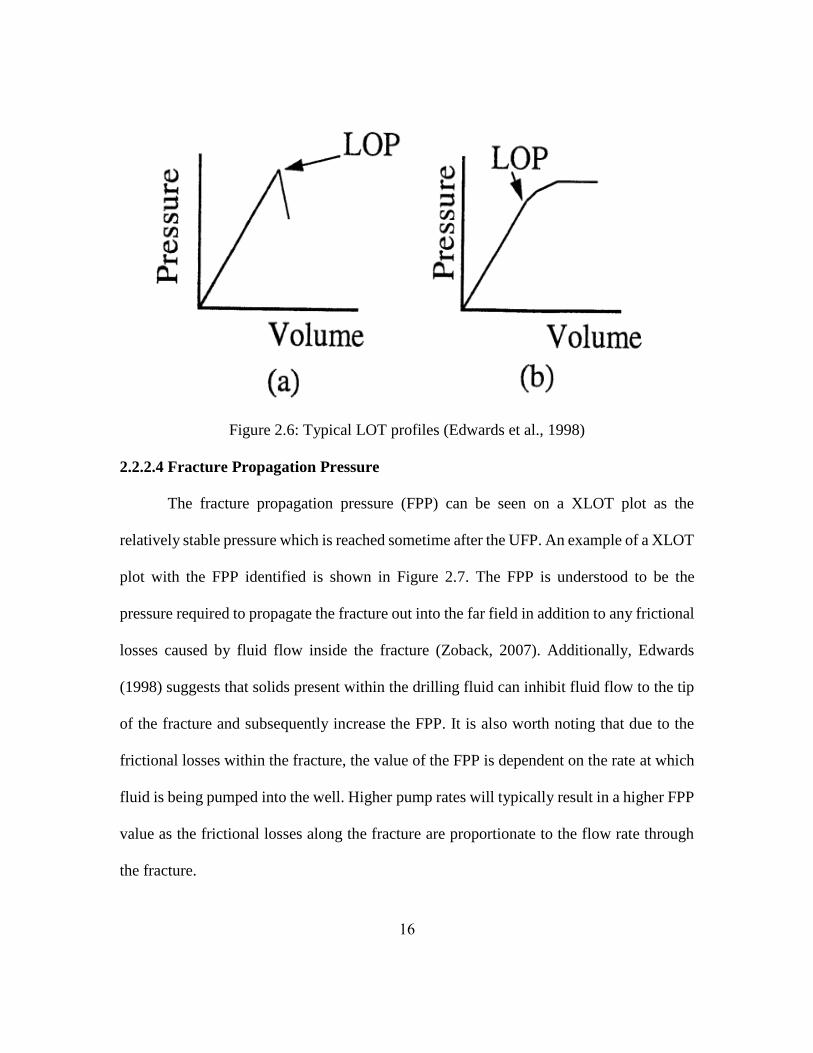
2.2.2.4 Fracture Propagation Pressure
The fracture propagation pressure (FPP) can be seen on a XLOT plot as the
relatively stable pressure which is reached sometime after the UFP. An example of a XLOT
plot with the FPP identified is shown in Figure 2.7. The FPP is understood to be the
pressure required to propagate the fracture out into the far field in addition to any frictional
losses caused by fluid flow inside the fracture (Zoback, 2007). Additionally, Edwards
(1998) suggests that solids present within the drilling fluid can inhibit fluid flow to the tip
of the fracture and subsequently increase the FPP. It is also worth noting that due to the
frictional losses within the fracture, the value of the FPP is dependent on the rate at which
fluid is being pumped into the well. Higher pump rates will typically result in a higher FPP
value as the frictional losses along the fracture are proportionate to the flow rate through
the fracture.

17
Figure 2.7: XLOT example plot with the FPP identified
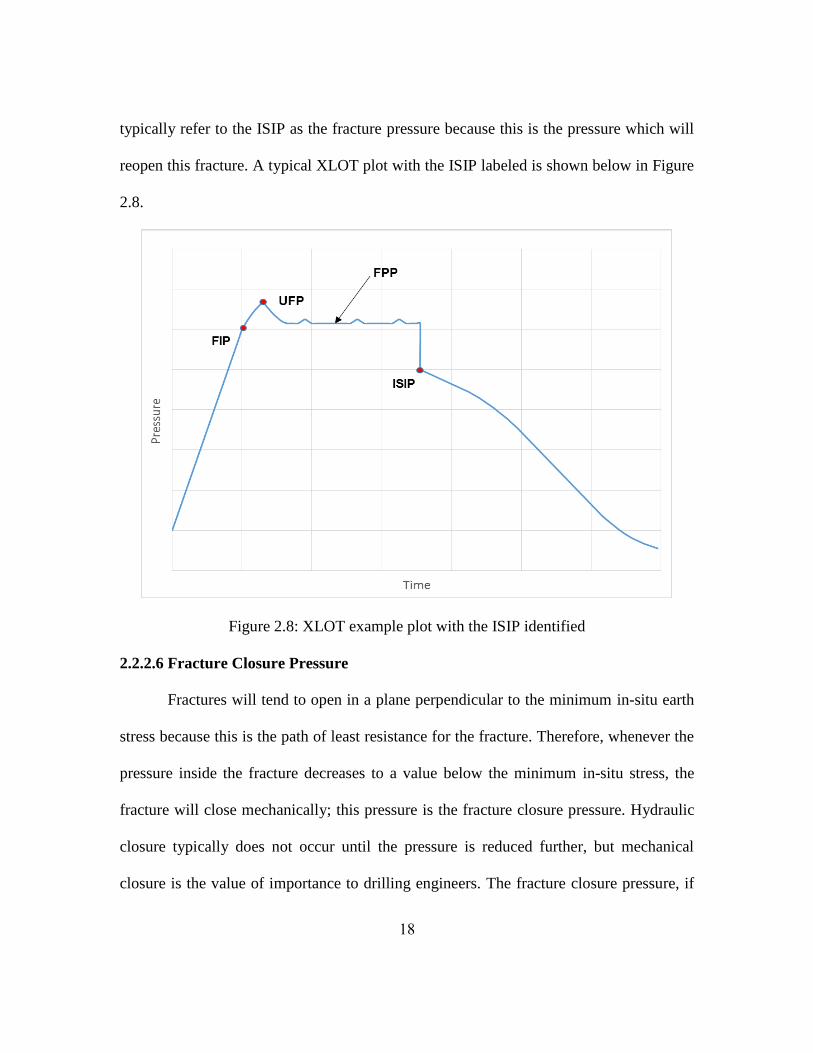
2.2.2.5 Instantaneous Shut-in Pressure
The instantaneous shut-in pressure (ISIP) occurs during a wellbore integrity test
after the fracture has been propagated and the pumps are shut down prior to the shut-in
period. When the pumps are shut down, the pressure immediately drops to a lower value
known as the ISIP. The drop in pressure is due to the loss of frictional effects in the fracture,
wellbore, and mud pumps when the fluid flow is stopped. Since there is no longer pressure
lost to friction along the fracture, there is a gradient within the fracture from a higher
pressure near the wellbore to a lower pressure at the fracture tip. As this pressure gradient
equalizes, the pressure at the fracture tip will actually rise and could potentially cause
further fracture growth even though the pumps have been stopped. Completion engineers
18
typically refer to the ISIP as the fracture pressure because this is the pressure which will
reopen this fracture. A typical XLOT plot with the ISIP labeled is shown below in Figure
2.8.
Figure 2.8: XLOT example plot with the ISIP identified
2.2.2.6 Fracture Closure Pressure
Fractures will tend to open in a plane perpendicular to the minimum in-situ earth
stress because this is the path of least resistance for the fracture. Therefore, whenever the
pressure inside the fracture decreases to a value below the minimum in-situ stress, the
fracture will close mechanically; this pressure is the fracture closure pressure. Hydraulic
closure typically does not occur until the pressure is reduced further, but mechanical
closure is the value of importance to drilling engineers. The fracture closure pressure, if
19
correctly interpreted through a wellbore integrity test, should provide an accurate estimate
of the minimum horizontal stress. There are numerous methods for estimating the fracture
closure pressure which will be covered in detail in later chapters. From an operational
standpoint, the minimum horizontal stress is important because it governs the maximum
mud weight that can be used while drilling a section. Because of this, accurate estimations
of the fracture closure pressure and subsequently the minimum horizontal stress can be
extremely valuable going forward in a drilling program.
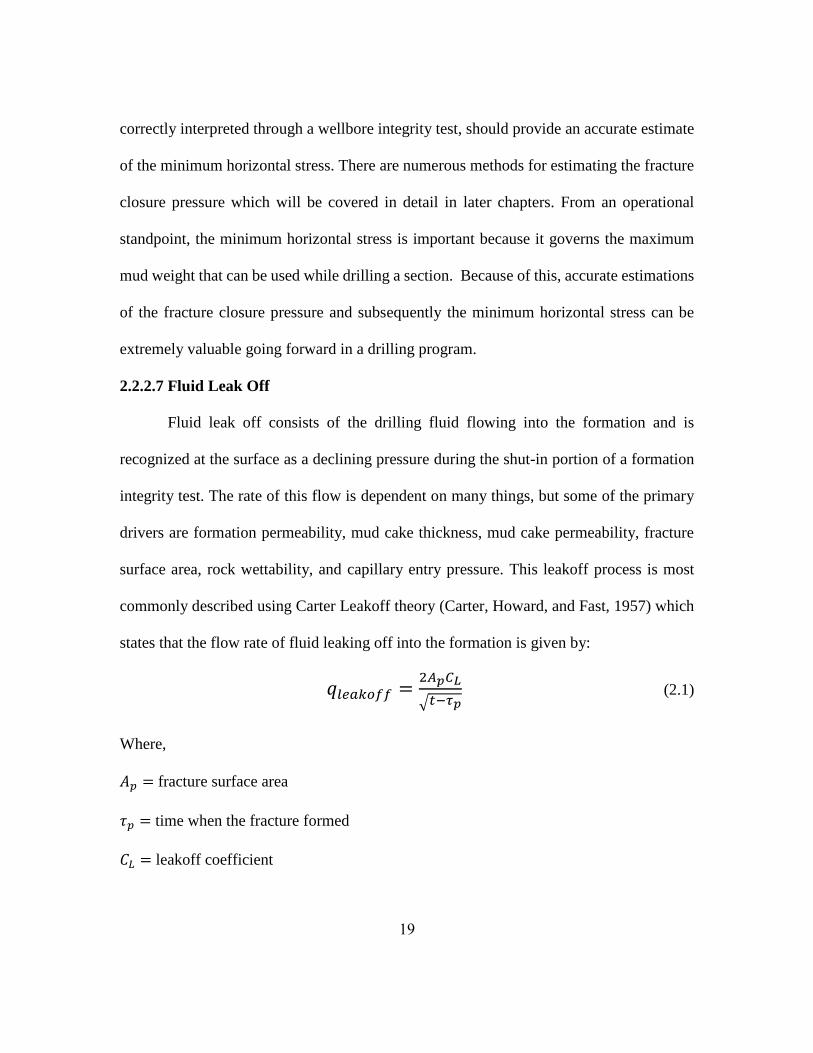
2.2.2.7 Fluid Leak Off
Fluid leak off consists of the drilling fluid flowing into the formation and is
recognized at the surface as a declining pressure during the shut-in portion of a formation
integrity test. The rate of this flow is dependent on many things, but some of the primary
drivers are formation permeability, mud cake thickness, mud cake permeability, fracture
surface area, rock wettability, and capillary entry pressure. This leakoff process is most
commonly described using Carter Leakoff theory (Carter, Howard, and Fast, 1957) which
states that the flow rate of fluid leaking off into the formation is given by:
𝑞𝑙𝑒𝑎𝑘𝑜𝑓𝑓 =2𝐴𝑝𝐶𝐿
√𝑡−𝜏𝑝 (2.1)
Where,
𝐴𝑝 = fracture surface area
𝜏𝑝 = time when the fracture formed
𝐶𝐿 = leakoff coefficient

20
During a typical LOT, the pressure decline due to fluid leak off during the shut-in
period exhibits a square root of time relationship, as shown in equation 2.1. The pressure
can be plotted against the square root of time and the inflection point used to estimate the
minimum horizontal stress.
2.2.3 Geologic and Geomechanic Terminology
This section will focus on some of the terms typically used during drilling
operations that pertain to geomechanical processes downhole.
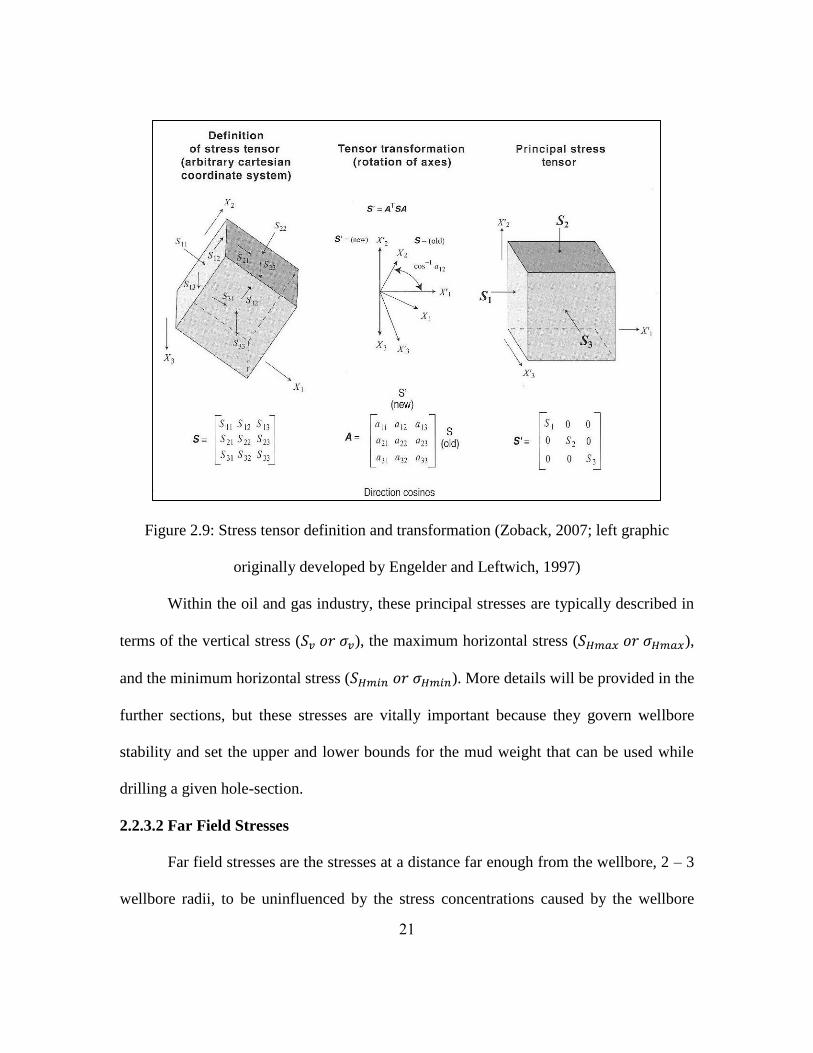
2.2.3.1 Principal Stresses
Compressive stresses are present throughout the earth and their magnitudes depend
on depth, pore pressure, and any active geological process that acting in the area (Zoback,
2007). Additionally, using tensor transformation, these in situ stresses can be expressed in
a principal coordinate system with three principal stresses as shown in Figure 2.9.
21
Figure 2.9: Stress tensor definition and transformation (Zoback, 2007; left graphic
originally developed by Engelder and Leftwich, 1997)
Within the oil and gas industry, these principal stresses are typically described in
terms of the vertical stress (𝑆𝑣 𝑜𝑟 𝜎𝑣), the maximum horizontal stress (𝑆𝐻𝑚𝑎𝑥 𝑜𝑟 𝜎𝐻𝑚𝑎𝑥),
and the minimum horizontal stress (𝑆𝐻𝑚𝑖𝑛 𝑜𝑟 𝜎𝐻𝑚𝑖𝑛). More details will be provided in the
further sections, but these stresses are vitally important because they govern wellbore
stability and set the upper and lower bounds for the mud weight that can be used while
drilling a given hole-section.
2.2.3.2 Far Field Stresses
Far field stresses are the stresses at a distance far enough from the wellbore, 2 – 3
wellbore radii, to be uninfluenced by the stress concentrations caused by the wellbore
22
(Zoback, 2007). In effect, these are the in-situ stresses within the formation and therefore
are of much interest to petroleum engineers. The minimum horizontal stress is the primary
stress of interest for drilling engineers as it governs the pressure required to open and
propagate a fracture away from the wellbore. Because of this, determination of the
minimum horizontal stress is a key aspect in drilling operations since it effectively sets the
upper limit to the mud weight window.
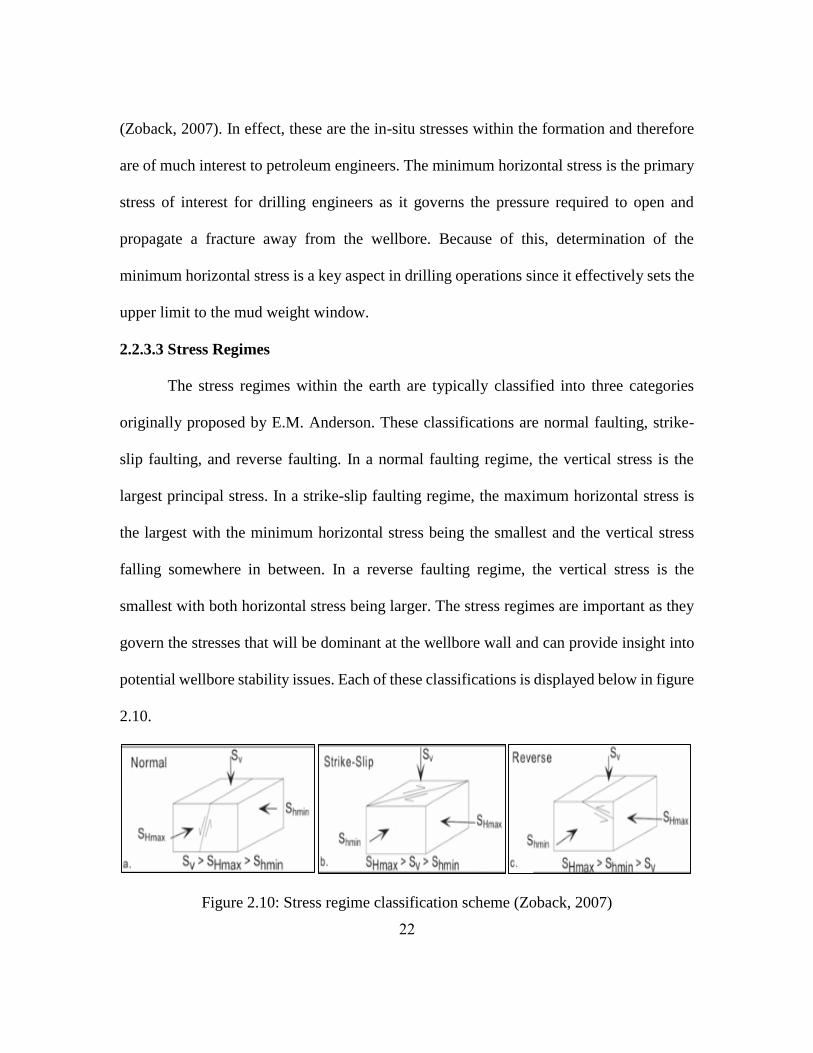
2.2.3.3 Stress Regimes
The stress regimes within the earth are typically classified into three categories
originally proposed by E.M. Anderson. These classifications are normal faulting, strike-
slip faulting, and reverse faulting. In a normal faulting regime, the vertical stress is the
largest principal stress. In a strike-slip faulting regime, the maximum horizontal stress is
the largest with the minimum horizontal stress being the smallest and the vertical stress
falling somewhere in between. In a reverse faulting regime, the vertical stress is the
smallest with both horizontal stress being larger. The stress regimes are important as they
govern the stresses that will be dominant at the wellbore wall and can provide insight into
potential wellbore stability issues. Each of these classifications is displayed below in figure
2.10.
Figure 2.10: Stress regime classification scheme (Zoback, 2007)
23
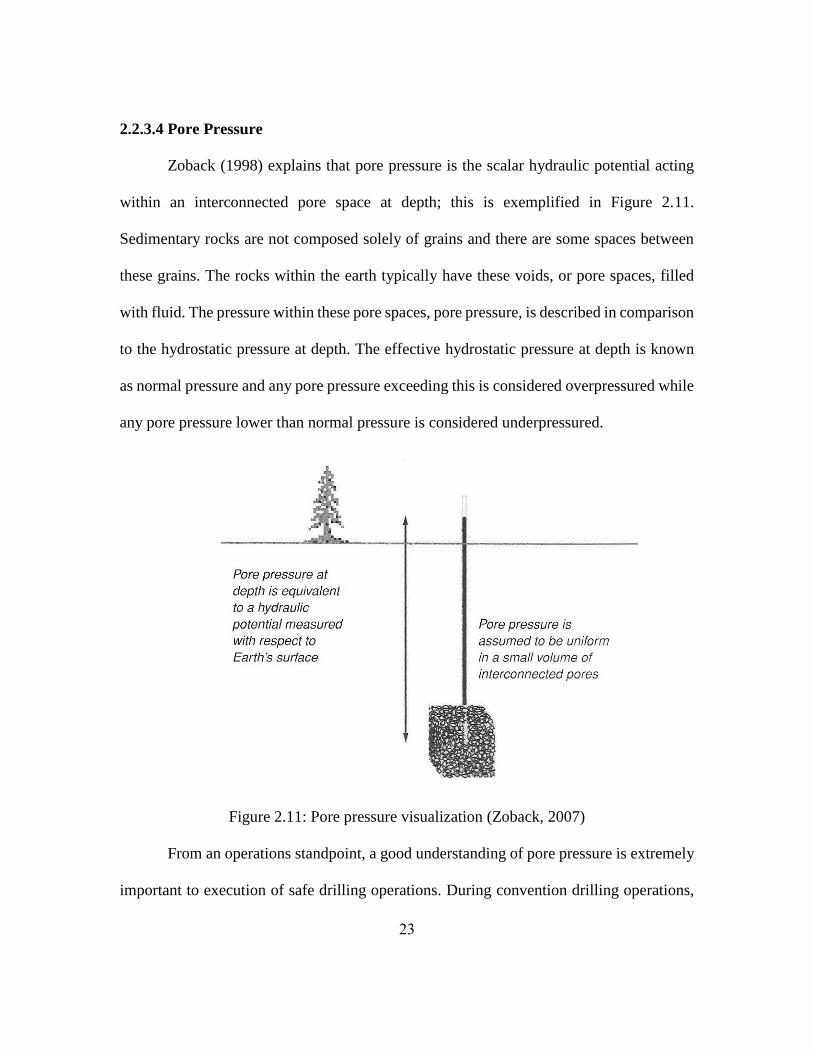
2.2.3.4 Pore Pressure
Zoback (1998) explains that pore pressure is the scalar hydraulic potential acting
within an interconnected pore space at depth; this is exemplified in Figure 2.11.
Sedimentary rocks are not composed solely of grains and there are some spaces between
these grains. The rocks within the earth typically have these voids, or pore spaces, filled
with fluid. The pressure within these pore spaces, pore pressure, is described in comparison
to the hydrostatic pressure at depth. The effective hydrostatic pressure at depth is known
as normal pressure and any pore pressure exceeding this is considered overpressured while
any pore pressure lower than normal pressure is considered underpressured.
Figure 2.11: Pore pressure visualization (Zoback, 2007)
From an operations standpoint, a good understanding of pore pressure is extremely
important to execution of safe drilling operations. During convention drilling operations,
24
the primary method of well control is application of a downhole pressure greater than the
pore pressure via a hydrostatic fluid column of ample density; this state is known as
“overbalanced”. If the pressure within the wellbore is allowed to fall below the pore
pressure, an influx of formation fluids into the wellbore known as a “kick”, can occur if
the formation’s permeability is high enough to allow flow; this state is called
“underbalanced”. In order to proactively increase the density of the drilling fluid prior to
encountering higher pressure zones, accurate predrill pore pressure predictions are vital.
Pore pressure predictions can be obtained via a seismic velocity to pore pressure transform
(Sayers et al. 2006) and via data analog well data if available (Ziegler and Jones, 2014).
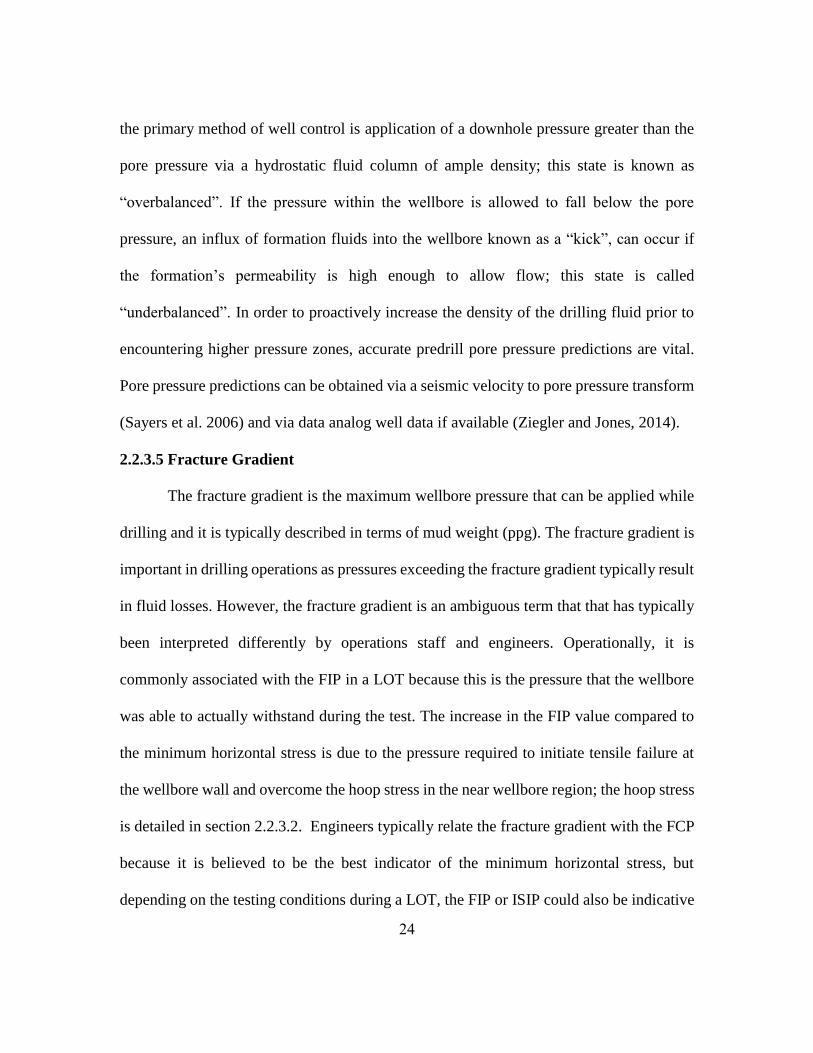
2.2.3.5 Fracture Gradient
The fracture gradient is the maximum wellbore pressure that can be applied while
drilling and it is typically described in terms of mud weight (ppg). The fracture gradient is
important in drilling operations as pressures exceeding the fracture gradient typically result
in fluid losses. However, the fracture gradient is an ambiguous term that that has typically
been interpreted differently by operations staff and engineers. Operationally, it is
commonly associated with the FIP in a LOT because this is the pressure that the wellbore
was able to actually withstand during the test. The increase in the FIP value compared to
the minimum horizontal stress is due to the pressure required to initiate tensile failure at
the wellbore wall and overcome the hoop stress in the near wellbore region; the hoop stress
is detailed in section 2.2.3.2. Engineers typically relate the fracture gradient with the FCP
because it is believed to be the best indicator of the minimum horizontal stress, but
depending on the testing conditions during a LOT, the FIP or ISIP could also be indicative
25
of the fracture gradient (Zoback, 2007). For the purposes of this paper, the term fracture
gradient indicates the wellbore pressure which will initiate tensile failure in the near
wellbore region and overcome the hoop stress, resulting in drilling fluid losses.
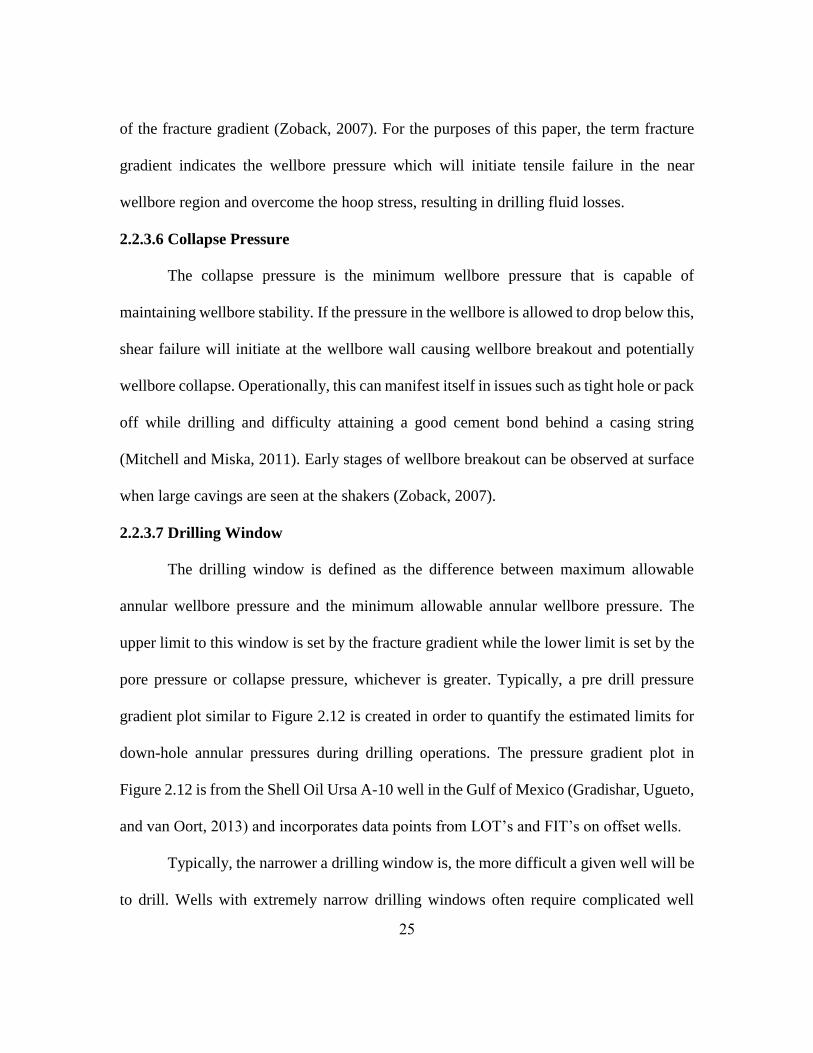
2.2.3.6 Collapse Pressure
The collapse pressure is the minimum wellbore pressure that is capable of
maintaining wellbore stability. If the pressure in the wellbore is allowed to drop below this,
shear failure will initiate at the wellbore wall causing wellbore breakout and potentially
wellbore collapse. Operationally, this can manifest itself in issues such as tight hole or pack
off while drilling and difficulty attaining a good cement bond behind a casing string
(Mitchell and Miska, 2011). Early stages of wellbore breakout can be observed at surface
when large cavings are seen at the shakers (Zoback, 2007).
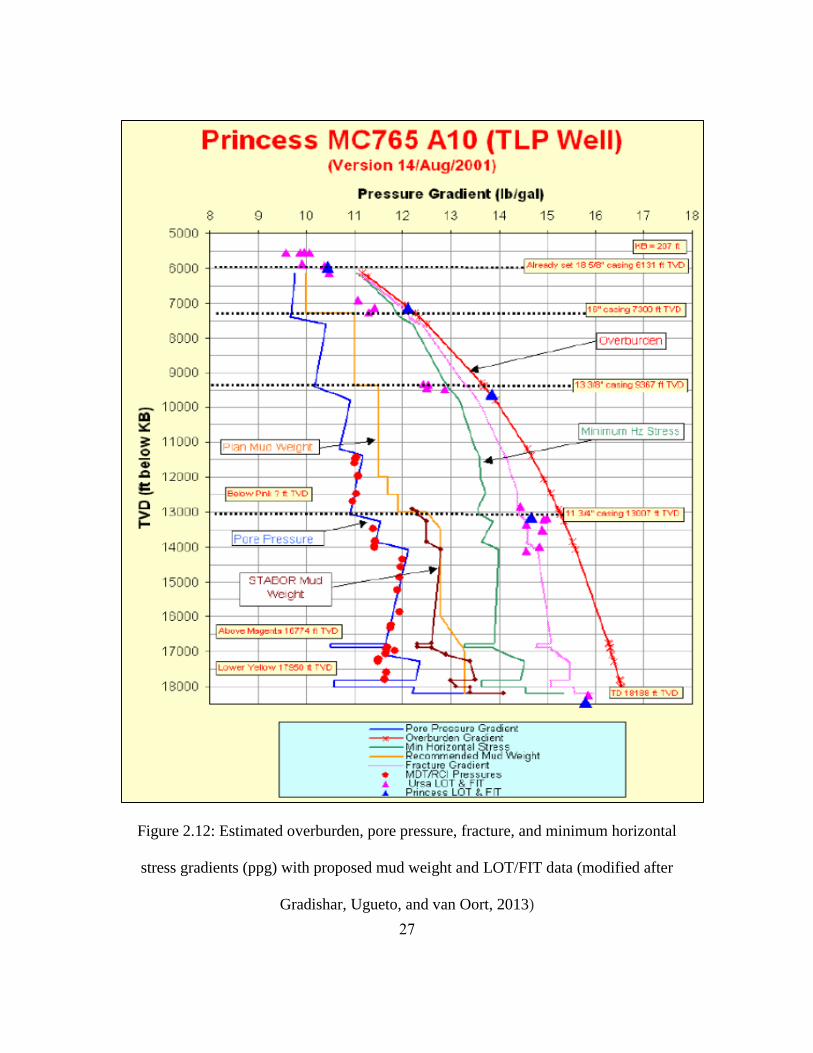
2.2.3.7 Drilling Window
The drilling window is defined as the difference between maximum allowable
annular wellbore pressure and the minimum allowable annular wellbore pressure. The
upper limit to this window is set by the fracture gradient while the lower limit is set by the
pore pressure or collapse pressure, whichever is greater. Typically, a pre drill pressure
gradient plot similar to Figure 2.12 is created in order to quantify the estimated limits for
down-hole annular pressures during drilling operations. The pressure gradient plot in
Figure 2.12 is from the Shell Oil Ursa A-10 well in the Gulf of Mexico (Gradishar, Ugueto,
and van Oort, 2013) and incorporates data points from LOT’s and FIT’s on offset wells.
Typically, the narrower a drilling window is, the more difficult a given well will be
to drill. Wells with extremely narrow drilling windows often require complicated well

26
designs, which incorporate many casing and liner strings, or unconventional drilling
applications such as managed pressure drilling.
27
Figure 2.12: Estimated overburden, pore pressure, fracture, and minimum horizontal
stress gradients (ppg) with proposed mud weight and LOT/FIT data (modified after
Gradishar, Ugueto, and van Oort, 2013)
28
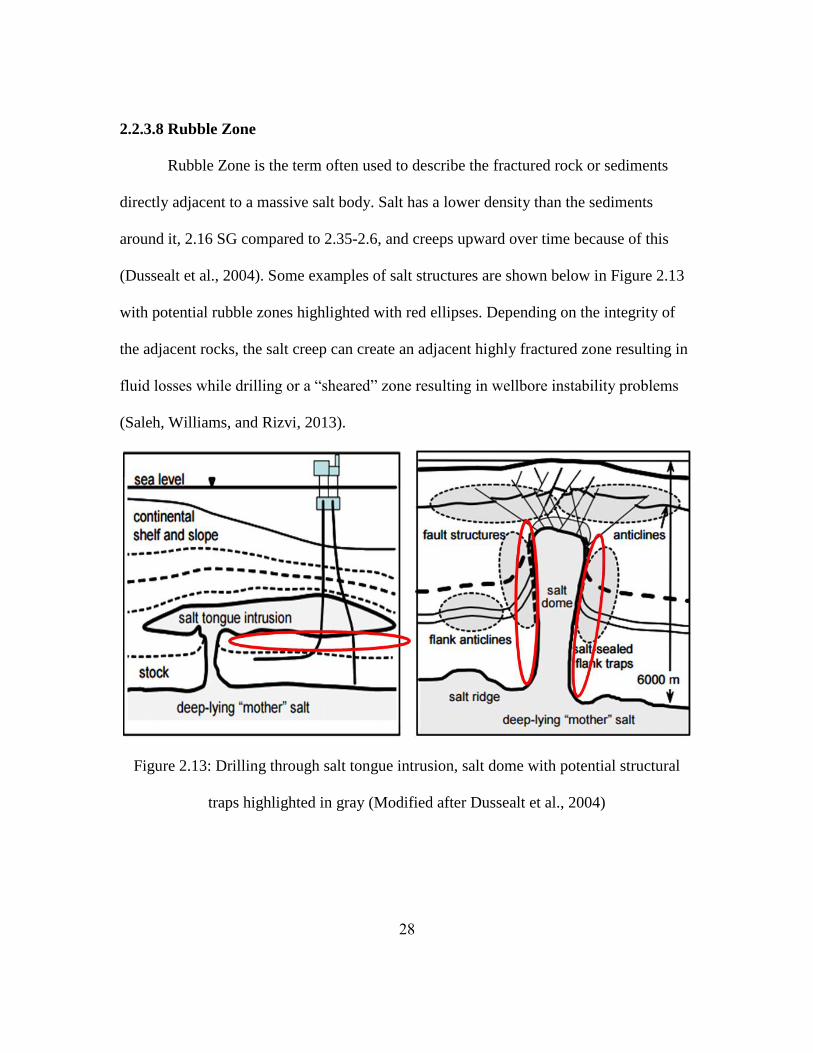
2.2.3.8 Rubble Zone
Rubble Zone is the term often used to describe the fractured rock or sediments
directly adjacent to a massive salt body. Salt has a lower density than the sediments
around it, 2.16 SG compared to 2.35-2.6, and creeps upward over time because of this
(Dussealt et al., 2004). Some examples of salt structures are shown below in Figure 2.13
with potential rubble zones highlighted with red ellipses. Depending on the integrity of
the adjacent rocks, the salt creep can create an adjacent highly fractured zone resulting in
fluid losses while drilling or a “sheared” zone resulting in wellbore instability problems
(Saleh, Williams, and Rizvi, 2013).
Figure 2.13: Drilling through salt tongue intrusion, salt dome with potential structural
traps highlighted in gray (Modified after Dussealt et al., 2004)
29
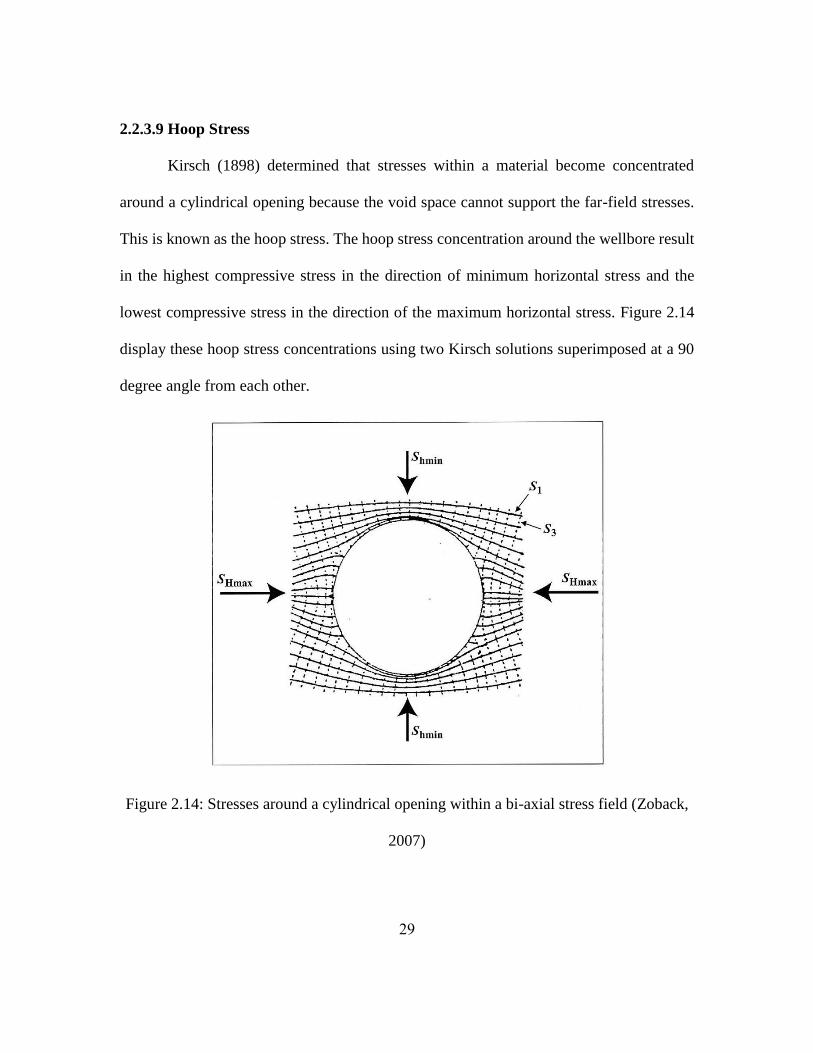
2.2.3.9 Hoop Stress
Kirsch (1898) determined that stresses within a material become concentrated
around a cylindrical opening because the void space cannot support the far-field stresses.
This is known as the hoop stress. The hoop stress concentration around the wellbore result
in the highest compressive stress in the direction of minimum horizontal stress and the
lowest compressive stress in the direction of the maximum horizontal stress. Figure 2.14
display these hoop stress concentrations using two Kirsch solutions superimposed at a 90
degree angle from each other.
Figure 2.14: Stresses around a cylindrical opening within a bi-axial stress field (Zoback,
2007)
30
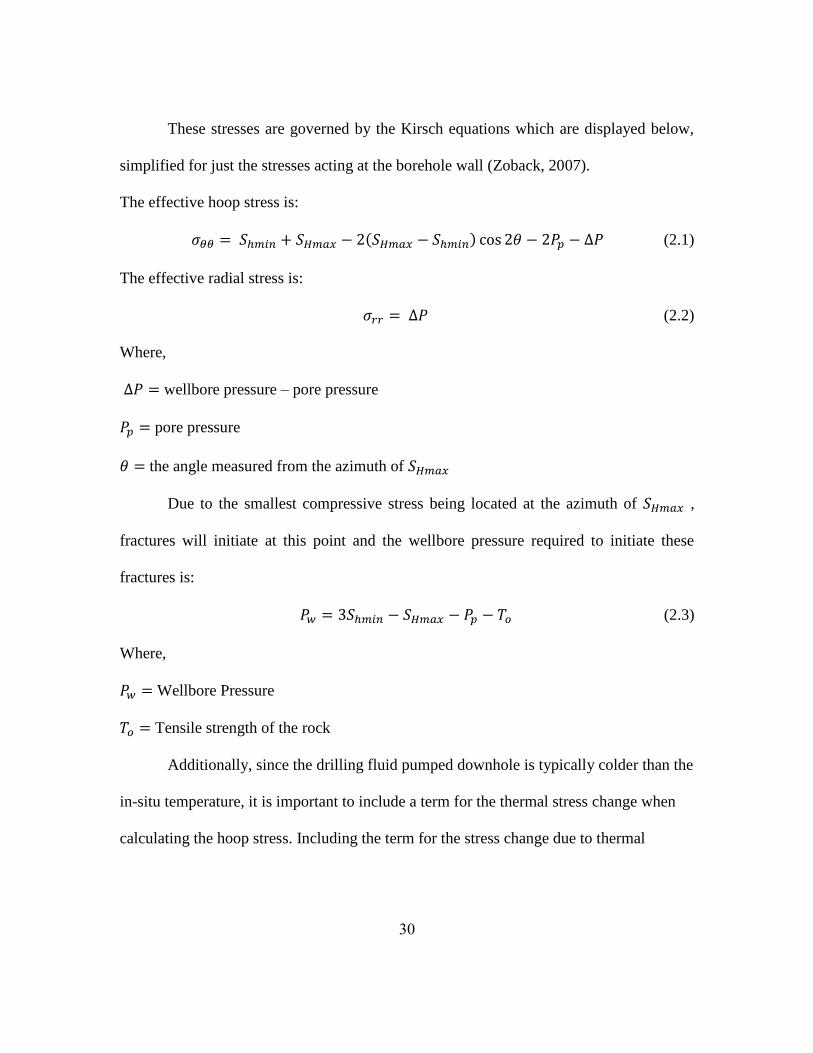
These stresses are governed by the Kirsch equations which are displayed below,
simplified for just the stresses acting at the borehole wall (Zoback, 2007).
The effective hoop stress is:
𝜎𝜃𝜃 = 𝑆ℎ𝑚𝑖𝑛 + 𝑆𝐻𝑚𝑎𝑥 − 2(𝑆𝐻𝑚𝑎𝑥 − 𝑆ℎ𝑚𝑖𝑛) cos 2𝜃 − 2𝑃𝑝 − Δ𝑃 (2.1)
The effective radial stress is:
𝜎𝑟𝑟 = Δ𝑃 (2.2)
Where,
Δ𝑃 = wellbore pressure – pore pressure
𝑃𝑝 = pore pressure
𝜃 = the angle measured from the azimuth of 𝑆𝐻𝑚𝑎𝑥
Due to the smallest compressive stress being located at the azimuth of 𝑆𝐻𝑚𝑎𝑥 ,
fractures will initiate at this point and the wellbore pressure required to initiate these
fractures is:
𝑃𝑤 = 3𝑆ℎ𝑚𝑖𝑛 − 𝑆𝐻𝑚𝑎𝑥 − 𝑃𝑝 − 𝑇𝑜 (2.3)
Where,
𝑃𝑤 = Wellbore Pressure
𝑇𝑜 = Tensile strength of the rock
Additionally, since the drilling fluid pumped downhole is typically colder than the
in-situ temperature, it is important to include a term for the thermal stress change when
calculating the hoop stress. Including the term for the stress change due to thermal
31
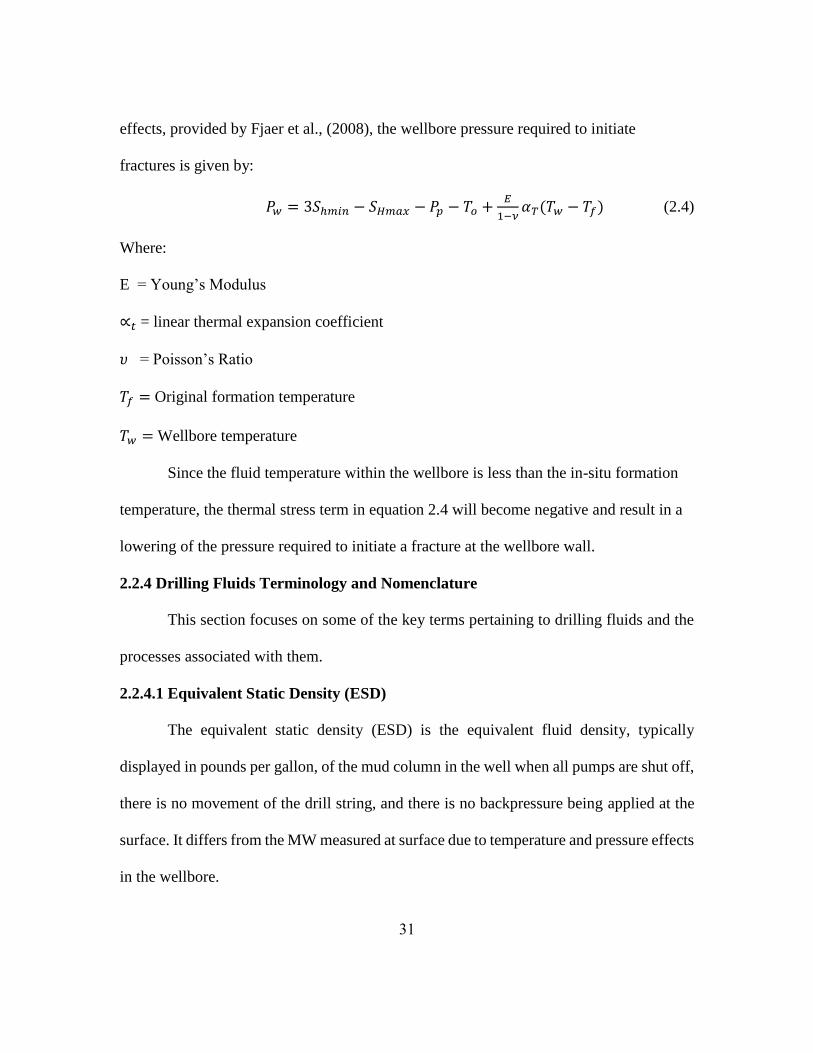
effects, provided by Fjaer et al., (2008), the wellbore pressure required to initiate
fractures is given by:
𝑃𝑤 = 3𝑆ℎ𝑚𝑖𝑛 − 𝑆𝐻𝑚𝑎𝑥 − 𝑃𝑝 − 𝑇𝑜 +𝐸
1−𝜈𝛼𝑇(𝑇𝑤 − 𝑇𝑓) (2.4)
Where:
E = Young’s Modulus
∝𝑡 = linear thermal expansion coefficient
𝜐 = Poisson’s Ratio
𝑇𝑓 = Original formation temperature
𝑇𝑤 = Wellbore temperature
Since the fluid temperature within the wellbore is less than the in-situ formation
temperature, the thermal stress term in equation 2.4 will become negative and result in a
lowering of the pressure required to initiate a fracture at the wellbore wall.
2.2.4 Drilling Fluids Terminology and Nomenclature
This section focuses on some of the key terms pertaining to drilling fluids and the
processes associated with them.
2.2.4.1 Equivalent Static Density (ESD)
The equivalent static density (ESD) is the equivalent fluid density, typically
displayed in pounds per gallon, of the mud column in the well when all pumps are shut off,
there is no movement of the drill string, and there is no backpressure being applied at the
surface. It differs from the MW measured at surface due to temperature and pressure effects
in the wellbore.
32
2.2.4.2 Equivalent Mud Weight
The equivalent mud weight (EMW) is the fluid density that would be required to
provide an equivalent hydrostatic head to equal the bottom hole pressure being applied.
During LOT’s, the well is shut-in and fluid is pumped into the well to increase the annular
pressure. The goal of a LOT is to test the cement job and determine the strength of the
formation. Operationally, the results of these tests are typically expressed in pounds per
gallon and referenced as the EMW, because the value is the highest mud weight that can
be used while drilling the subsequent hole section without fracturing the well.
2.2.4.3 Equivalent Circulating Density
During drilling operations, circulating fluid causes frictional losses in the annulus
which cause an increase in the pressure downhole. In addition to the pressure increase
caused by frictional losses, large amounts of heavy rock cuttings suspended in the drilling
fluid, rotation of the drill string, and vertical movement of the drill string can increase the
pressure down hole. The equivalent circulating density (ECD) is the fluid density that
would be required to provide an equivalent hydrostatic head equal to the bottom hole
pressure being applied during the aforementioned operations including but not limited to
circulating.
2.2.4.4 Mud Cake
During the course of drilling, particles within the drilling fluid create a thin low
permeability layer along the wellbore wall called a mud cake (Mitchell and Miska, 2011).
As some of the drilling fluid flows into the formation, it drives fines and other suspended
particles onto the rock face. Because fluid flow into the rock is the primary driver, mud

33
cake formation requires a permeable rock and some minimum of overbalance pressure
(Jiao and Sharma, 1993).
Formation of a mud cake is beneficial for prevention of large fluid losses into
permeable formations while drilling. Additionally, once the hydrocarbon reservoir has
been reached, a filter cake can prevent drilling fluid infiltration of the reservoir and
subsequent formation damage.
2.2.4.5 Cuttings Loading
As the wellbore is deepened through drilling, the rock cuttings are carried up
through the annulus by the drillings fluid. Cuttings loading is the increase in the equivalent
density of the mud column due to the heavier pieces of rock suspended in the drilling fluid.
In scenarios with a narrow drilling window, cuttings loading can potentially increase the
ECD above the minimum horizontal stress and cause lost circulation. In scenarios like this,
operators often attempt to limit the amount of cuttings suspended in the annulus by drilling
at a controlled rate or drilling short sections and pausing to circulate.
2.2.4.6 Barite Sag
During drilling operations, weighting agents, with barite being the most typical, are
introduced into the drilling fluid in order to increase its density. Barite sag is the
fluctuations in mud weight that occur due to downhole settling of the barite (Bern et al.,
2000). Barite sag can occur both while the fluid column is static and in circulation. Barite
sag in a static fluid column occurs due to poor gel strength of the drilling fluid while sag
during circulation occurs due to low drilling fluid rheology (Gradishar, Ugueto, and van
Oort, 2013). Barite sag can result in an uneven mud profile in the well and result in an
34
influx if the heavier fluid falls below a high pressure zone. Additionally, if a large slug of
higher density fluid has accumulated and is pumped up the hole, it may fracture the
formation and cause lost circulation.
2.2.5 Lost Circulation Nomenclature
This section pertains to the terms and nomenclature commonly used to describe
drilling fluid losses into permeable or hydraulically fractured formations during drilling
operations. This process is commonly referred to as lost circulation. The term itself
originated because drilling fluid returns to surface are reduced during these situations.
2.2.5.1 Uncontrolled Fracture Growth
Uncontrolled fracture growth occurs when the pressure in the wellbore rises to a
point where it propagates fractures into the far field. This occurs as a result of the wellbore
pressure exceeding the minimum horizontal stress, the hoop stress at the wellbore wall, and
any pressure drop along the length of the fracture due to frictional effects. It is recognized
at surface by significant fluid losses, on the order of tens to hundreds of barrels per hour,
and typically requires changes in the current operating conditions to reduce or eliminate
the losses. Some of these operational methods will be discussed in later sections, but the
primary objective is to either reduce the wellbore pressure or plug the fracture. In some
cases, the operator may continue to drill ahead even if losses have not been stopped because
this is believed to be the best approach for reaching the next casing point. Due to the
significant cost of oil based or synthetic based muds, the proposition of losing thousands
of barrels of mud is an expensive endeavor.
35
2.2.5.2 Fracture Bridging
Fracture bridging is the process of plugging off a downhole fracture using some
form of material introduced to the mud system at surface. The desired result is to inhibit
further fracture growth and stop or at least reduce fluid losses. Depending on the size of
the lost circulation material (LCM) added to the system and aperture of the fracture, this
may occur at the fracture tip, somewhere along the fractures length, or in the opening of
the fracture at the wellbore wall. There are several competing hypotheses as to the exact
physics pertaining to fracture bridging and its ability to mitigate lost circulation events
which will be discussed in further detail in the in later chapters.
2.2.5.3 Wellbore Strengthening
Wellbore strengthening is the process of increasing the upper bound of the mud
weight window by creating and then plugging fractures in the formation being drilled.
Wellbore strengthening has been a focus in recent years as deep water basins with narrow
mud weight windows, such as the Gulf of Mexico, have been targeted. These narrow
drilling windows have led to a significant number of lost circulation events resulting in
large amounts of non-productive time (NPT) and its associated cost (van Oort et Al., 2009).
As mentioned previously, there are several competing hypotheses as to the exact physics
pertaining to wellbore strengthening. Graphics depicting each of these are shown below in
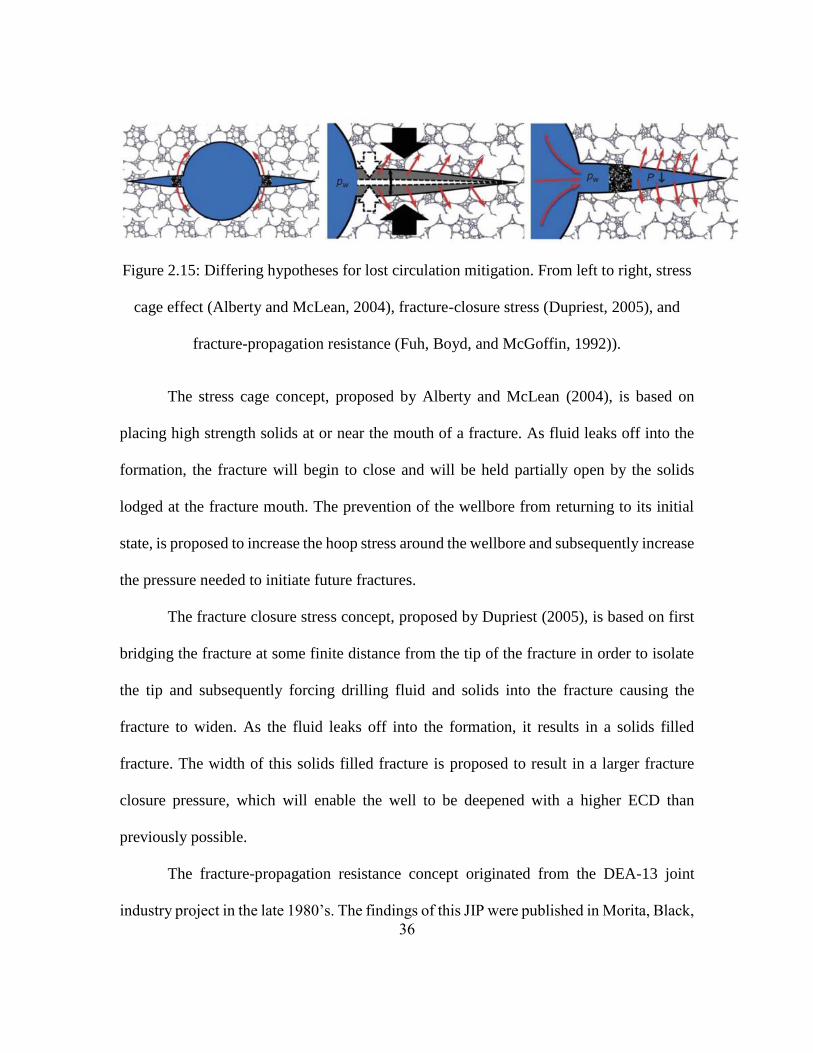
Figure 2.15 and explained further in the following paragraph.
36
Figure 2.15: Differing hypotheses for lost circulation mitigation. From left to right, stress
cage effect (Alberty and McLean, 2004), fracture-closure stress (Dupriest, 2005), and
fracture-propagation resistance (Fuh, Boyd, and McGoffin, 1992)).
The stress cage concept, proposed by Alberty and McLean (2004), is based on
placing high strength solids at or near the mouth of a fracture. As fluid leaks off into the
formation, the fracture will begin to close and will be held partially open by the solids
lodged at the fracture mouth. The prevention of the wellbore from returning to its initial
state, is proposed to increase the hoop stress around the wellbore and subsequently increase
the pressure needed to initiate future fractures.
The fracture closure stress concept, proposed by Dupriest (2005), is based on first
bridging the fracture at some finite distance from the tip of the fracture in order to isolate
the tip and subsequently forcing drilling fluid and solids into the fracture causing the
fracture to widen. As the fluid leaks off into the formation, it results in a solids filled
fracture. The width of this solids filled fracture is proposed to result in a larger fracture
closure pressure, which will enable the well to be deepened with a higher ECD than
previously possible.
The fracture-propagation resistance concept originated from the DEA-13 joint
industry project in the late 1980’s. The findings of this JIP were published in Morita, Black,
37
and Fuh (1990), which proposed the theory of lost circulation pressure and the variables
influencing this pressure. Fuh, Boyd, and McGoffin (1992) then proposed use of narrowly
sized granular material as a means to isolate the fracture tip from the wellbore pressure,
known as fracture-propagation resistance. This results in an increase in the wellbore
pressure required to propagate the fracture, which allows the well to be deepened with a
mud weight higher than would have otherwise been possible. Fuh, Boyd, and McGoffin
(1992) presented two field cases where this theory was successfully applied and resulted
in significantly higher fracture propagation pressures. Based on this fracture-propagation
resistance concept, Van Oort et al. (2009) later proposed constant application of
specifically sized particles while drilling as a means to constantly strengthen boreholes
while drilling and presented field evidence supporting the effectiveness of this application.
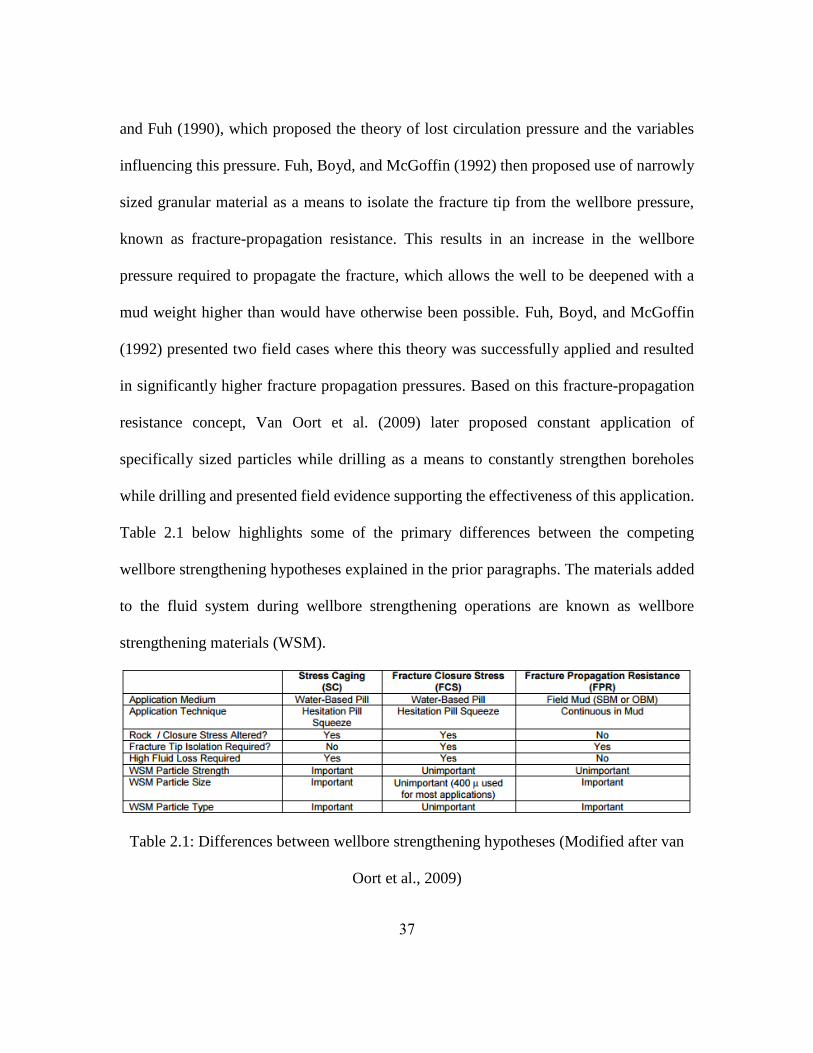
Table 2.1 below highlights some of the primary differences between the competing
wellbore strengthening hypotheses explained in the prior paragraphs. The materials added
to the fluid system during wellbore strengthening operations are known as wellbore
strengthening materials (WSM).
Table 2.1: Differences between wellbore strengthening hypotheses (Modified after van
Oort et al., 2009)
38
2.2.5.4 Lost Circulation Material
Lost circulation material (LCM) consists of fibrous, flaky, or granular materials
which are pumped downhole when fluid losses are occurring in an effort to bridge fractures
and stop or decrease losses. Depending on the mechanism believed to be responsible for
the fluid losses, differing types and sizes of LCM’s may be used. In years past, LCM
designations had often been unspecific and resulted in a multitude of different materials
being pumped downhole that were available at the wellsite. Through work performed by a
joint industry project in the mid 1980’s, Drilling Engineering Association 13, it was
determined that a large and uniform particle size could bridge fractures and inhibit further
fracture propagation (Fuh et al. 1992). Later work identified particle size, particle size
distribution, concentration, and shape as key attributes affecting material’s suitability as a
LCM and identified a combination of graphite and calcium carbonate specifically as a
suggested LCM (Friedheim, Sanders, and Roberts, 2008). Further work also identified
chemical gel systems as suitable for LCM and suggested use of a combination of base oil,
gelling agent, initiator, reaction retarder, oil-wetting agent, and viscosifier to achieve this
(Scorsone, Sanders, and Patel, 2009).
As shown by the references above, different combinations of materials and gel
systems are capable of mitigating lost circulation events and can all be classified as LCM’s.
Furthermore, depending on the formation being drilled and other downhole variables, each
of these has a proper application and is currently used by industry to combat lost circulation
issues.
39
2.2.5.5 Fracture Healing
Fracture healing is a phenomenon occurring with water based muds (WBM) where
repeat LOT’s will result in the same FIP while repeat LOT’s using oil based mud (OBM)
or synthetic-oil based mud (SBM) typically result in a lower FIP value compared to the
initial test. This phenomenon is believed to be a result of the inability of OBM and SBM
to leak-off into the water-wet shales where casing shoes are typically set and LOT’s are
subsequently performed. Fluid leak-off for non-aqueous fluids is limited by interfacial
tension and capillary entry pressures in water-wet rocks (Peters, 2012). Because of this, the
non-aqueous fluid will remain in the fracture, preventing complete fracture closure, while
a WBM will be able to leak off into the formation, allowing complete fracture closure
(Ziegler and Jones, 2014). This manifests itself in LOT pressure responses because
subsequent pressure increases will immediately be felt on the fracture face for non-aqueous
fluids resulting in a lower FIP value than the original, which had to initiate or open the
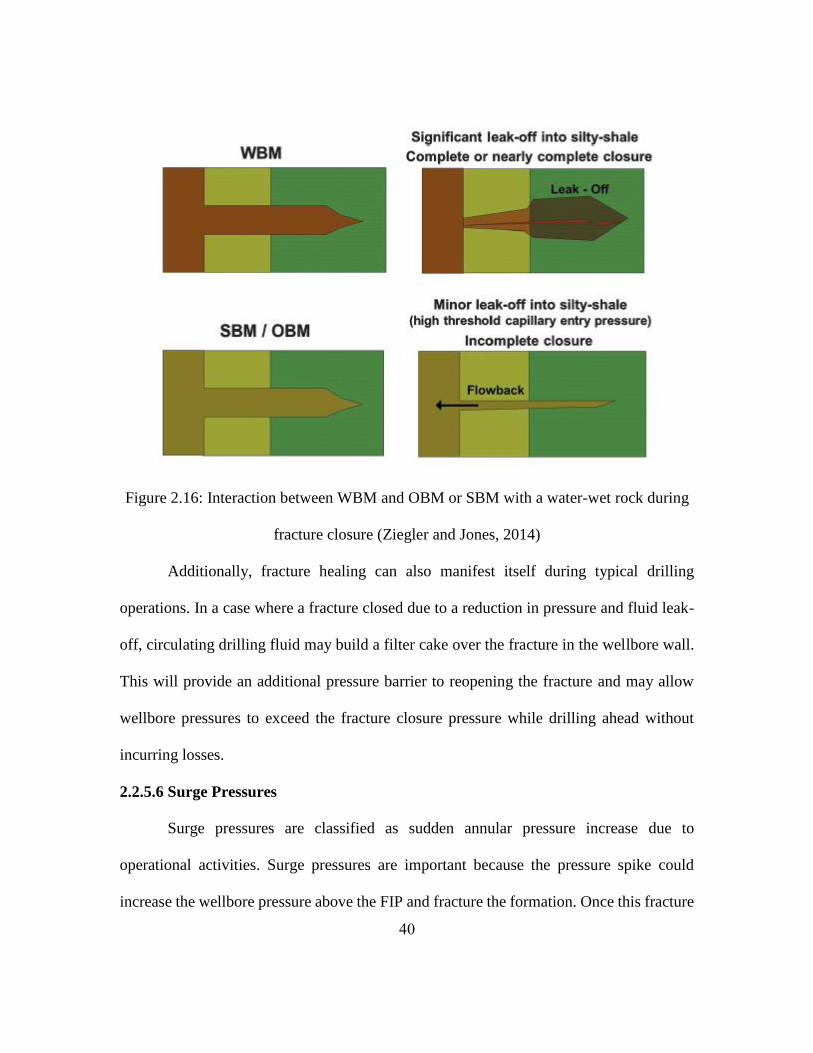
fracture. Figure 2.16 below shows a depiction of the differences in leak-off behavior and
fracture closure with WBM and OBM or SBM.
40
Figure 2.16: Interaction between WBM and OBM or SBM with a water-wet rock during
fracture closure (Ziegler and Jones, 2014)
Additionally, fracture healing can also manifest itself during typical drilling
operations. In a case where a fracture closed due to a reduction in pressure and fluid leak-
off, circulating drilling fluid may build a filter cake over the fracture in the wellbore wall.
This will provide an additional pressure barrier to reopening the fracture and may allow
wellbore pressures to exceed the fracture closure pressure while drilling ahead without
incurring losses.
2.2.5.6 Surge Pressures
Surge pressures are classified as sudden annular pressure increase due to
operational activities. Surge pressures are important because the pressure spike could
increase the wellbore pressure above the FIP and fracture the formation. Once this fracture
41
has been initiated, the wellbore integrity has been compromised and will likely be weaker
than it was prior. In a hole-section where the FIP exceeds the FPP, a pressure surge induced
fracture may lead to fluid losses at a mud weight that had previously been used with no
associated losses. Typical operational activities that may exert surge pressures if performed
improperly include tripping drill pipe into the hole, running a casing or liner string, and
wireline activities.
2.2.6 Formation Fluid Returns at Surface and Well Control Terminology
This section focuses on the terms and nomenclature surrounding formation fluid
returns at surface and well control. It is extremely important content in the scope of this
thesis because wellbore breathing is a type of well control event. In order to better
understand and characterize the subsurface processes during a breathing event, it is
important to understand how these processes manifest themselves through returns at
surface. Last, in order to understand and avoid potential pitfalls and miscalculations related
to wellbore breathing and well control, it is necessary to have a solid understanding of the
fundamental well control processes which will be explained in this section.
2.2.6.1 Drill Gas
During the course of drilling operations, gas measurements will be taken at surface
to monitor the amount of gas present in the drilling mud when it returns to surface. These
gas measurements are displayed on the driller’s screen in the doghouse and have been
commonly used over the years as a qualitative assessment of whether the well is in a state
of overbalance, underbalance, or near-underbalanced (Alberty and Fink, 2014). Formations
will be encountered which have hydrocarbons in their pore spaces and as the drill bit cuts
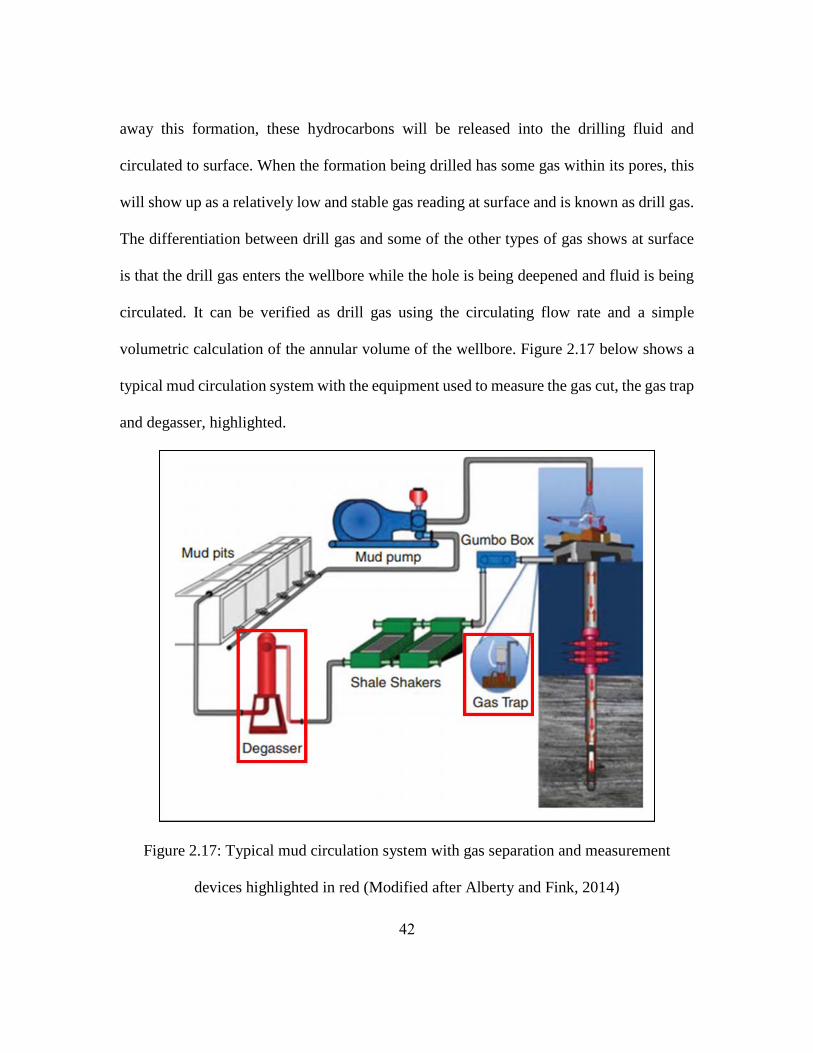
42
away this formation, these hydrocarbons will be released into the drilling fluid and
circulated to surface. When the formation being drilled has some gas within its pores, this
will show up as a relatively low and stable gas reading at surface and is known as drill gas.
The differentiation between drill gas and some of the other types of gas shows at surface
is that the drill gas enters the wellbore while the hole is being deepened and fluid is being
circulated. It can be verified as drill gas using the circulating flow rate and a simple
volumetric calculation of the annular volume of the wellbore. Figure 2.17 below shows a
typical mud circulation system with the equipment used to measure the gas cut, the gas trap
and degasser, highlighted.
Figure 2.17: Typical mud circulation system with gas separation and measurement
devices highlighted in red (Modified after Alberty and Fink, 2014)
43
Operationally, low and constant levels of drill gas is very common and has little
significance other than to indicate that the formation being drilled contains some
hydrocarbons. It does not require raising of the mud weight as the associated hydrocarbons
would still enter the wellbore when the rock containing them is crushed and cut away.
Situations where there are sudden increases in the drill gas cut should be approached with
caution and would typically require a flow check to ensure that well is in still in an
overbalance condition and not flowing. Drill gas measurements in this type of scenario
serve as a second line of defense to identify influxes when a pit gain either did not occur
or was missed. Last, these measurements are extremely useful when drilling with an OBM
or SBM as gas is soluble in these. This is dangerous because a gas influx that occurs at a
pressure above the mixture’s bubble point may not register as a significant pit gain at
surface.
2.2.6.2 Connection Gas
During conventional drilling operations, a stand of drill pipe (typically three, thirty
foot joints depending on the rig) is typically used to continuously drill ninety feet prior to
pausing to disconnect the top drive and add another stand of pipe to the drill string. During
these connections, the mud pumps are shut down resulting in a static annular mud column
and loss of ECD. Connection gas is the gas registered at surface when the volume of mud
sitting in the open hole during the connection returns to surface once circulation has
resumed. It is important to differentiate between connection gas and drill gas because the
loss of ECD during connections reduces the bottom hole pressure (BHP) and can provide
valuable insight regarding the formation’s pore pressure. Differentiation between drill gas
44
and connection gas can be easily achieved by accounting for the annular volume and the
volumetric flow rate of drilling fluid into the well.
Most connection gas is a result of one or a combination of these three different
mechanisms:
1. The aforementioned liberation of gas present in the drilled rock
2. Formation-fluid flow into the wellbore as a result of an underbalance state
(Alberty and Fink, 2014)
3. Gas diffusion into OBM or SBM (Bradley et al., 2002).
Since the gas present in the drilled rock volume should not change significantly
within a formation section, any increase in connection gas readings over pre and post
connection drill gas readings is an indication that either mechanism 2 or 3 is taking place.
In the case of mechanism 2, an underbalance situation, the gas cut would be concentrated
and register a significant spike at surface as the formation fluid influx entered the wellbore
all at once. However, in a situation with an over pressured low permeability formation, the
influx volume may be small and therefore difficult to differentiate from drill gas. One
additional downhole phenomena which could appear as connection gas at surface is the
hydrocarbon swap-out mechanism that has been observed in some wellbore breathing
incidents (Ashley, 2000). The swap out mechanism will be explained in detail later in this
section, but is mentioned here because of its potential contribution to connection gas.
Hydrocarbon swap-out will typically exhibit long drawn out gas peaks as the hydrocarbons
flow into the wellbore in combination with drilling fluid over the entire course of the
connection.

45
It is important to understand each of these mechanisms in order to properly identify
them at surface and make proper decisions to combat them. For instance, the best course
of action for an underbalance condition during connections would be to raise the mud
weight, while this same action for a well experiencing hydrocarbon swap out could
exacerbate the problem.
2.2.6.3 Trip Gas
Trip gas is essentially the same phenomenon as connection gas, but the mud column
is in a static state for significantly longer. Trip gas is the gas registered at surface when the
mud that was in the open section while tripping in and out of the hole is circulated to
surface. Depending on the purpose of the trip and the depth of the well, tripping in and out
of the hole, along with any actions taken with equipment at surface, could take anywhere
from a few hours to multiple days. Because of the significantly longer time frame, gas
diffusion into an OBM or SBM has the potential to significantly increase the gas cut of the
mud when it returns to surface. The process of gas diffusion into the mud is driven by the
low partial pressure of the gas within the drilling fluid in comparison with the partial
pressure of the formation gas and insignificantly influenced by higher wellbore pressures
(Bradley et al., 2002).
Additionally, because of the drill string being pulled out of the hole during tripping
operations, there will certainly be temporary reductions in the BHP during the process
which could lead to formation fluid influxes. If this were to take place, there would likely
be significant gas peaks registered when the fluids are circulated back to surface as this
volume would have entered the wellbore all together. However, this could be combatted

46
by circulating the well full of a higher mud weight drilling fluid prior to tripping out of the
hole in order to ensure a more significant level of overbalance at static conditions. This
increase in mud weight is known as a trip margin.
2.2.6.4 Formation Fluid Influx
A formation fluid influx, known as a “kick”, is the process of formation fluids
flowing into the wellbore due to the pressure in the wellbore being lower than the pressure
in the formation. The influx may be composed of brine, oil, gas, or a combination of any
of the three. It is referred to as a well control incident and should always be taken extremely
seriously as it poses a threat to the safety of all crew members on board if handled
improperly. An improperly handled kick can result in losing control of the well and a
blowout.
Typically, the key identifier for a kick is a mud gain in the pits as this indicates
fluid has likely been added to the system via an influx. It is the responsibility of the driller
and mud loggers to identify such pit gains, determine if a kick has been taken, and, if so,
shut the well in using the blow out preventer (BOP). Once the well has been shut-in, the
influx must be circulated up the annulus and out of the well using the choke manifold at
surface. Precaution should be taken with any form of a pit gain because the formation fluids
are often of a lower density than the drilling fluid. Therefore, any volume of formation
fluids that enter the well will reduce the hydrostatic head of the column, increasing the
degree of underbalance and potentially exacerbating the well control event. There are
several other methods of kick detection which will be discussed later, but pit gains are the
47
primary method. Since wellbore breathing also results in pit gains, differentiation between
the two can be difficult.
2.2.6.5 Hydrocarbon Swap Out
Hydrocarbon swap out is a phenomenon that can occur during wellbore breathing
events in a fractured hydrocarbon bearing zone. During circulation, the increased annular
pressure forces opens the fracture or fractures forcing fluid out into the formation and
results in mixing of drilling fluid and hydrocarbons. Once circulation is stopped, the drop
in wellbore pressure allows the fractures to close and force fluid back into the wellbore. In
the case of a hydrocarbon swap out, some drilling fluid is left out in the formation or
fracture system and some hydrocarbons are brought back into the wellbore. The effective
result is a kick being taken without any net gain of fluid in the system. This renders it
extremely difficult to identify at surface and therefore very dangerous as the driller may
unknowingly circulate the kick up the annulus. The difficulty in identifying influxes from
hydrocarbon swap out makes this phenomenon dangerous because the influx may be
unknowingly circulated up the annulus and to surface. This can result in large gas volumes
exiting the mud system at surface, potentially overloading gas separation equipment and
posing a safety risk due to the potential for ignition of the gas.
2.2.6.6 Flowback and Flowback Finger Printing
When the mud pumps are shut down and circulation is stopped, a volume of drilling
fluid, in the range of 20 to 50 barrel flows back to the mud pits and is known as flowback
(Ali et al., 2013). Part of this flow can be attributed to gravity as the mud circulating system
is typically located below the rig floor, so fluid in this system will drain to the pits. In
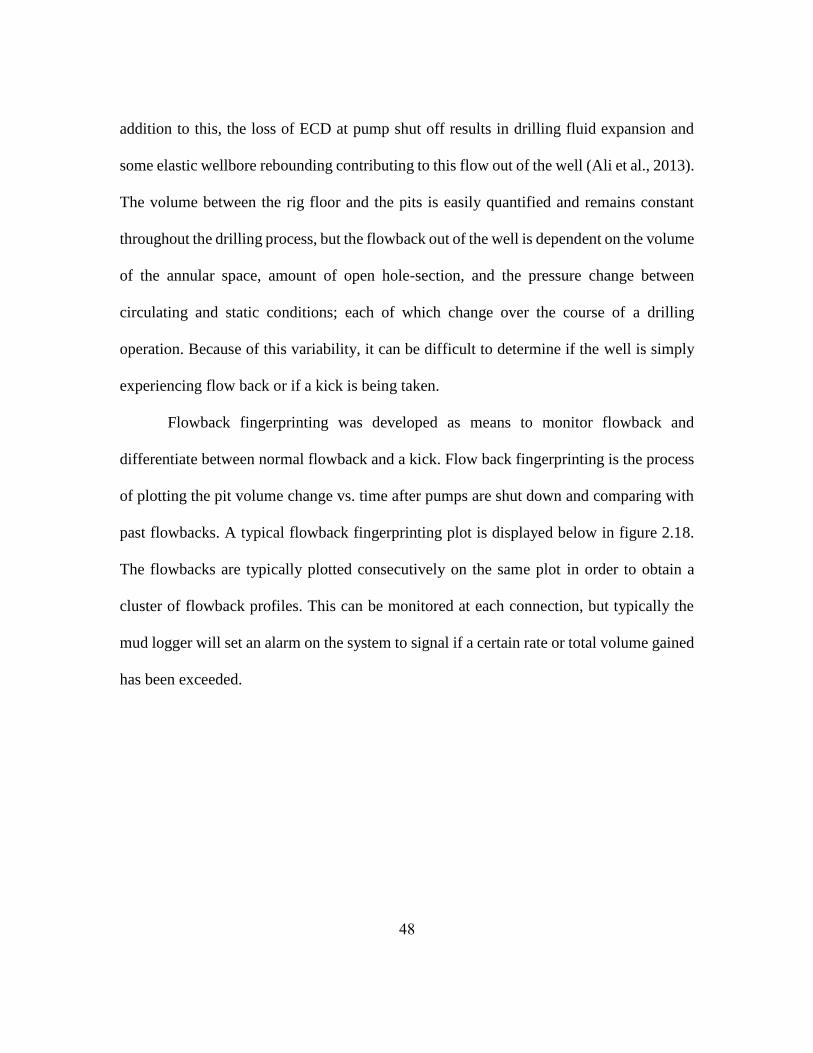
48
addition to this, the loss of ECD at pump shut off results in drilling fluid expansion and
some elastic wellbore rebounding contributing to this flow out of the well (Ali et al., 2013).
The volume between the rig floor and the pits is easily quantified and remains constant
throughout the drilling process, but the flowback out of the well is dependent on the volume
of the annular space, amount of open hole-section, and the pressure change between
circulating and static conditions; each of which change over the course of a drilling
operation. Because of this variability, it can be difficult to determine if the well is simply
experiencing flow back or if a kick is being taken.
Flowback fingerprinting was developed as means to monitor flowback and
differentiate between normal flowback and a kick. Flow back fingerprinting is the process
of plotting the pit volume change vs. time after pumps are shut down and comparing with
past flowbacks. A typical flowback fingerprinting plot is displayed below in figure 2.18.
The flowbacks are typically plotted consecutively on the same plot in order to obtain a
cluster of flowback profiles. This can be monitored at each connection, but typically the
mud logger will set an alarm on the system to signal if a certain rate or total volume gained
has been exceeded.
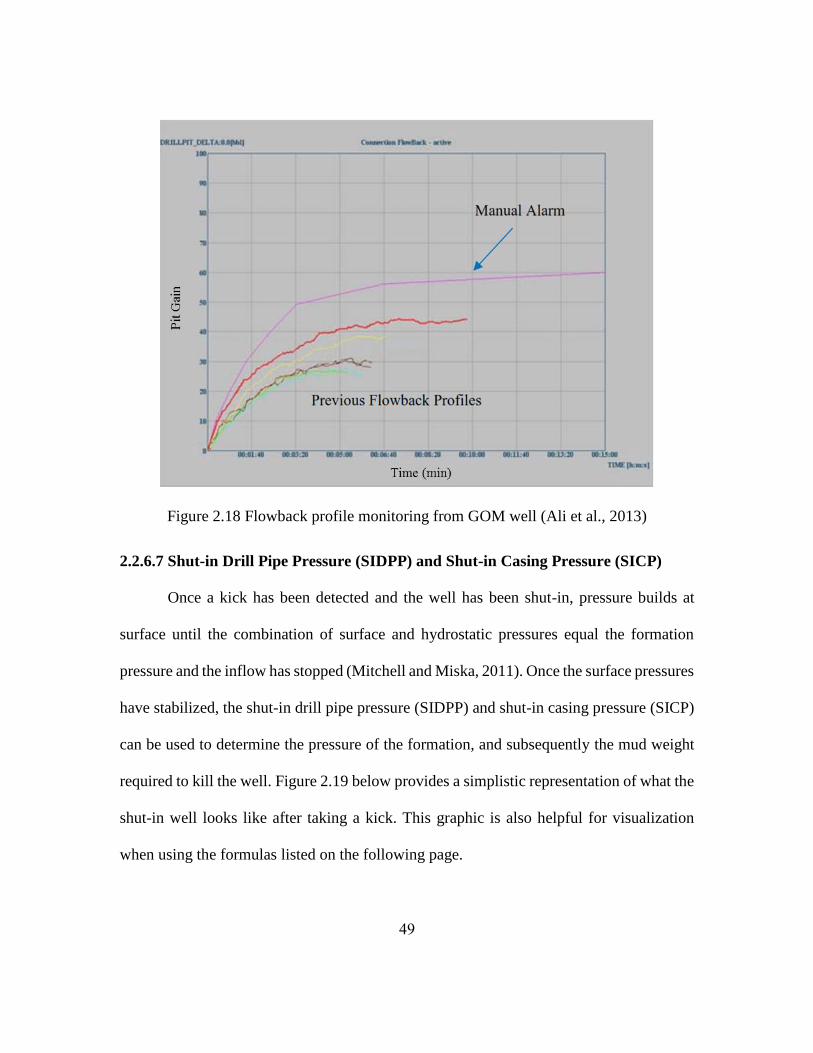
49
Figure 2.18 Flowback profile monitoring from GOM well (Ali et al., 2013)
2.2.6.7 Shut-in Drill Pipe Pressure (SIDPP) and Shut-in Casing Pressure (SICP)
Once a kick has been detected and the well has been shut-in, pressure builds at
surface until the combination of surface and hydrostatic pressures equal the formation
pressure and the inflow has stopped (Mitchell and Miska, 2011). Once the surface pressures
have stabilized, the shut-in drill pipe pressure (SIDPP) and shut-in casing pressure (SICP)
can be used to determine the pressure of the formation, and subsequently the mud weight
required to kill the well. Figure 2.19 below provides a simplistic representation of what the
shut-in well looks like after taking a kick. This graphic is also helpful for visualization
when using the formulas listed on the following page.
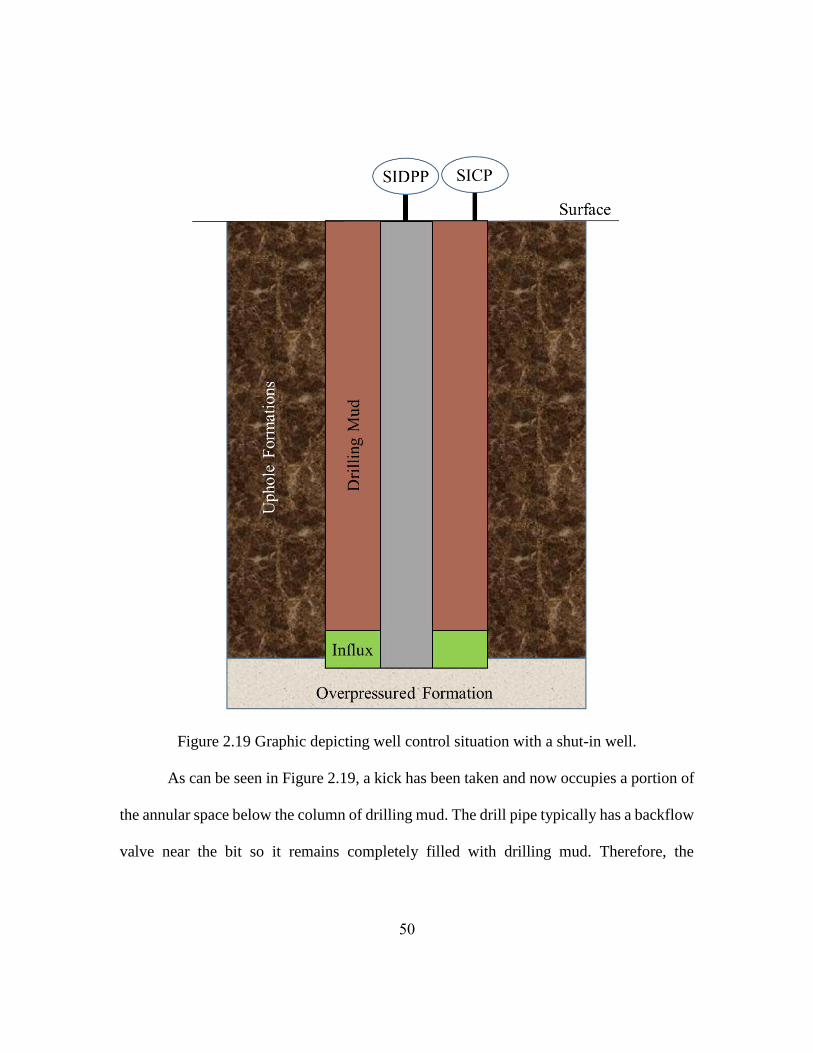
50
Figure 2.19 Graphic depicting well control situation with a shut-in well.
As can be seen in Figure 2.19, a kick has been taken and now occupies a portion of
the annular space below the column of drilling mud. The drill pipe typically has a backflow
valve near the bit so it remains completely filled with drilling mud. Therefore, the
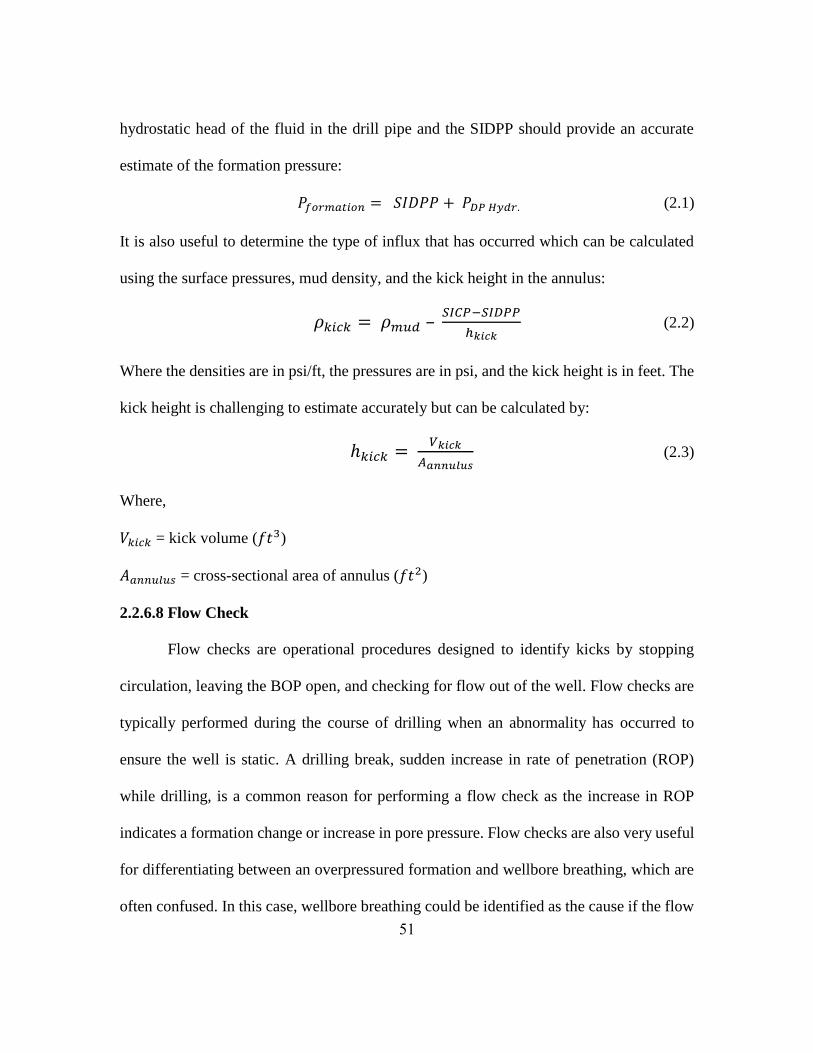
51
hydrostatic head of the fluid in the drill pipe and the SIDPP should provide an accurate
estimate of the formation pressure:
𝑃𝑓𝑜𝑟𝑚𝑎𝑡𝑖𝑜𝑛 = 𝑆𝐼𝐷𝑃𝑃 + 𝑃𝐷𝑃 𝐻𝑦𝑑𝑟. (2.1)
It is also useful to determine the type of influx that has occurred which can be calculated
using the surface pressures, mud density, and the kick height in the annulus:
𝜌𝑘𝑖𝑐𝑘 = 𝜌𝑚𝑢𝑑 – 𝑆𝐼𝐶𝑃−𝑆𝐼𝐷𝑃𝑃
ℎ𝑘𝑖𝑐𝑘 (2.2)
Where the densities are in psi/ft, the pressures are in psi, and the kick height is in feet. The
kick height is challenging to estimate accurately but can be calculated by:
ℎ𝑘𝑖𝑐𝑘 = 𝑉𝑘𝑖𝑐𝑘
𝐴𝑎𝑛𝑛𝑢𝑙𝑢𝑠 (2.3)
Where,
𝑉𝑘𝑖𝑐𝑘 = kick volume (𝑓𝑡3)
𝐴𝑎𝑛𝑛𝑢𝑙𝑢𝑠 = cross-sectional area of annulus (𝑓𝑡2)
2.2.6.8 Flow Check
Flow checks are operational procedures designed to identify kicks by stopping
circulation, leaving the BOP open, and checking for flow out of the well. Flow checks are
typically performed during the course of drilling when an abnormality has occurred to
ensure the well is static. A drilling break, sudden increase in rate of penetration (ROP)
while drilling, is a common reason for performing a flow check as the increase in ROP
indicates a formation change or increase in pore pressure. Flow checks are also very useful
for differentiating between an overpressured formation and wellbore breathing, which are
often confused. In this case, wellbore breathing could be identified as the cause if the flow

52
out of the well dissipated over time and eventually stopped. Whereas, for an overpressured
formation, the flow would not dissipate and may actually increase due to the displacement
of the heavier drilling fluid. This differentiation becomes increasingly difficult in situations
where there is a small differential between the formation and wellbore pressures or the
formation has very low permeability. The rate of fluid flow into the well is directly related
to these variables and it may take a very long flow check, 45 – 60 minutes, to determine
the subsurface process occurring.
2.2.6.9 Swab Pressures
Swab pressures are a temporary reduction in the bottom hole pressure due to the
swabbing effects of pulling drill pipe or a tool out of the hole. The primary danger in these
situations, is that the swab pressure temporarily places the wellbore into an underbalance
condition where an influx may occur. Two common situations where swab pressures may
be induced are during tripping operations and wireline operations where the tool is pulled
to surface too quickly. There are, however, multiple software packages provided by service
companies designed to calculate swab pressures and determine a maximum allowable rate
for pulling out of the hole with a given tool and hole size. As with any procedure, it is only
effective if followed, so effective communication to the company man and well site crews
is crucial.
An additional swab pressure can occur when the bit, reamer, or stabilisers have
balled up or even packed off resulting in a significantly larger diameter for the effected
downhole equipment. Tripping out of the hole in these cases would result in extreme swab
pressures and would significantly reduce the bottom hole pressure, potentially facilitating
53
large fluid influxes. Large volume swabbing can be identified while tripping by the fluid
level in the annulus not dropping the proper amount or even rising in extreme cases.
Potential solutions would be to trip out of the hole wet or turn the pumps on while pulling
each stand in extreme cases.
2.2.6.10 Trapped Pressure
Trapped pressure is any artificial increase to the SICP and SIDPP above the surface
pressure required to balance the pore pressure of downhole formations. In instances when
a kick is believed to have occurred while circulating, shutting in the well prior to the pumps
shutting off can result in trapped pressure. If trapped pressure is not properly identified, it
can result in the calculation of inaccurate and unnecessarily high kill mud weight. While a
higher kill mud weight will effectively kill the well, the unneeded increase in mud weight
would subject the wellbore to increased pressures while drilling ahead and may lead to
lower rates of penetration and lost circulation issues.
2.2.6.11 Pressure Bleed Off
Pressure bleed off is the process of opening the choke up for short periods after the
well has been shut in to remove any excess fluid or pressure in the system above what is
required to balance the pore pressure of the downhole formation. This is an important step
for the reasons mentioned above in section 2.2.6.10, but it is also important to minimize
the pressure bled off in excess of the trapped pressures. Mitchell and Miska (2011)
provided some suggestions for bleed off procedures including:
Focus on the SIDPP as it indicates the bottom hole pressure and bleed small
volumes (~ ½ bbl) of fluid at a time, close choke and monitor SIDPP
54
Continue prior step until the SIDPP stops decreasing, if SIDPP reduces to zero
continue bleeding small volumes off until the SICP stops decreasing.
It is important to stop bleed off when the SIDPP no longer decreases because
pressure bled off in excess of the trapped pressure will allow more formation fluid to enter
the wellbore as this pressure is needed to balance the formation pore pressure. The resulting
larger influx volumes can make a kick more difficult to handle at surface depending on the
capacity of the mud-gas separator. Also, larger influx volumes will result in higher
wellbore pressures due to gas expansion when circulating the kick out of the wellbore. It
is important to keep these pressures to a minimum because fracturing the formation while
circulating a kick out of the well can lead to an underground blow out.
2.2.6.12 Blow Out
A blowout is an uncontrolled flow and release of reservoir fluids at the surface
driven by the reservoir pressure. A blowout is the worst-case scenario for a drilling
operation and indicates that there has been a failure in one or some combination of the well
control barriers, equipment, and procedures. As evidenced by the Macondo blowout, which
occurred in the Gulf of Mexico in 2010, a deepwater blowout can result in the loss of
human life, environmental damage, a significantly diminished company reputation, and
massive financial costs for damages, fines, and liabilities (Carter, van Oort, and
Barendrecht, 2014).
In addition to the more common surface blowout, there is another type of blowout
called an underground blowout. An underground blowout consists of uncontrolled flow of
55
reservoir fluids out of the reservoir and into some lower pressured up-hole formation which
was fractured due to the excessive pressure in the wellbore. The primary situation in which
this can occur involves the circulation of a gas kick up the annulus. As the gas moves up
the annulus, it begins to expand, reducing the hydrostatic head of the mud column and
requiring higher surface pressures to maintain the required BHP. If the gas volume has not
made it inside the casing, the formation above and to the base of the gas volume will be
subjected to increased pressures. Because of this, the maximum pressure that the wellbore
can handle without inducing a fracture, the maximum allowable annular surface pressure
(MAASP), is calculated in well control situations; Operational decisions are then made to
keep annular pressures below the MAASP and avoid potential underground blowouts
(Santos et al., 2011).
2.2.6.13 Kick Tolerance
Kick tolerance is a key concept in well design and drilling operations which is
related to a wellbore’s ability to withstand pressures during a well control situation without
fracturing. Typically expressed in barrels, the kick tolerance is the largest gas influx
volume at the highest expected pore pressure that can be taken without exceeding the
MAASP while circulating the kick out of the hole. Therefore, kick tolerance is a function
of the cross-sectional area of the annular space, mud weight, and true vertical depth (TVD).
Santos, Catak, and Valluri (2011) explained that the kick tolerance dictates the number and
setting depth of casing strings in a well plan, is used to determine whether drilling ahead is
a safe proposition, and indicates whether a given kick can be circulated up the annulus or
requires bull heading back into the formation.

56
In situations where a kick has already been taken, the pore pressure of the formation
will be known and can be incorporated into the calculation for kick tolerance before
deciding whether to circulate the kick up the annulus. Additionally, in this case it would
also be beneficial to use the SICP for determination of the type and density of the influx
which has occurred. These two steps will yield a more accurate value for kick tolerance
and prove beneficial when determining the best way forward.
2.2.6.14 Slow Circulating Rate Pressures
Slow circulating rate pressures are the increase in BHP caused by frictional losses
when pumping through the choke or kill line while the well is shut-in. They are typically
recorded on deepwater wells because the choke and kill lines may be several thousand feet
long and impart significant frictional pressures. The slow circulating rates are usually
recorded during BOP tests and measured at different circulating rates that may be used
during a well control incident. These circulating rates are recorded in strokes per minute
(SPM) and at a range of rates (30, 45, and 60 SPM for example). Slow circulating pressures
are important during well control operations as they will increase the bottom hole pressures
while circulating out a kick and must be incorporated in kick tolerance calculations to avoid
fracturing the wellbore.
2.2.7 Conventional Drilling
Conventional drilling is the standard and most common method for drilling an oil
or gas well. It uses drill pipe to transmit torque from the top drive to the bit while circulating
fluid down the drill pipe and up the annulus. The mud column is open to the atmosphere at
surface and outflow from the annulus is directed to the cuttings handling system for
57
removal of solids prior to going back into the active mud system. Once a stand of pipe has
been drilled down, the pumps are shut off to make a connection. Therefore, ECD is lost at
connections and there is a reduction in bottom hole pressure compared to circulating
conditions. The approach for conventional drilling operations is to maintain a high enough
mud weight to maintain overbalance at all times, which results in an ECD significantly
above the pore pressure. In wells with narrow drilling windows, it may be impossible to
maintain a bottomhole pressure above the pore pressure during static conditions and below
the fracture gradient during circulating conditions. For these narrow drilling window wells,
conventional drilling systems may not be capable of reaching the target depth.
2.2.8 Unconventional Drilling Methods
Unconventional drilling methods incorporate specialized equipment and have been
developed as a means to combat lost circulation and wellbore breathing, in addition to
enabling drilling of wells with extremely narrow drillings windows, that would be
impossible with conventional techniques.
2.2.8.1 Managed Pressure Drilling
Managed pressure drilling (MPD) is a form of drilling which employs a closed fluid
system, which can be pressurized in order to manage the bottomhole pressure during
drilling operations. It allows more precise and instantaneous control of the downhole
pressures than would be possible using mud weight and flow rate adjustments alone. To
create the isolated fluid system, a device called a rotating control device (RCD) is installed
to create a seal in the annulus and divert flow to a MPD choke manifold where backpressure
can be applied as needed while circulating (Driedger et al., 2013). During connections and
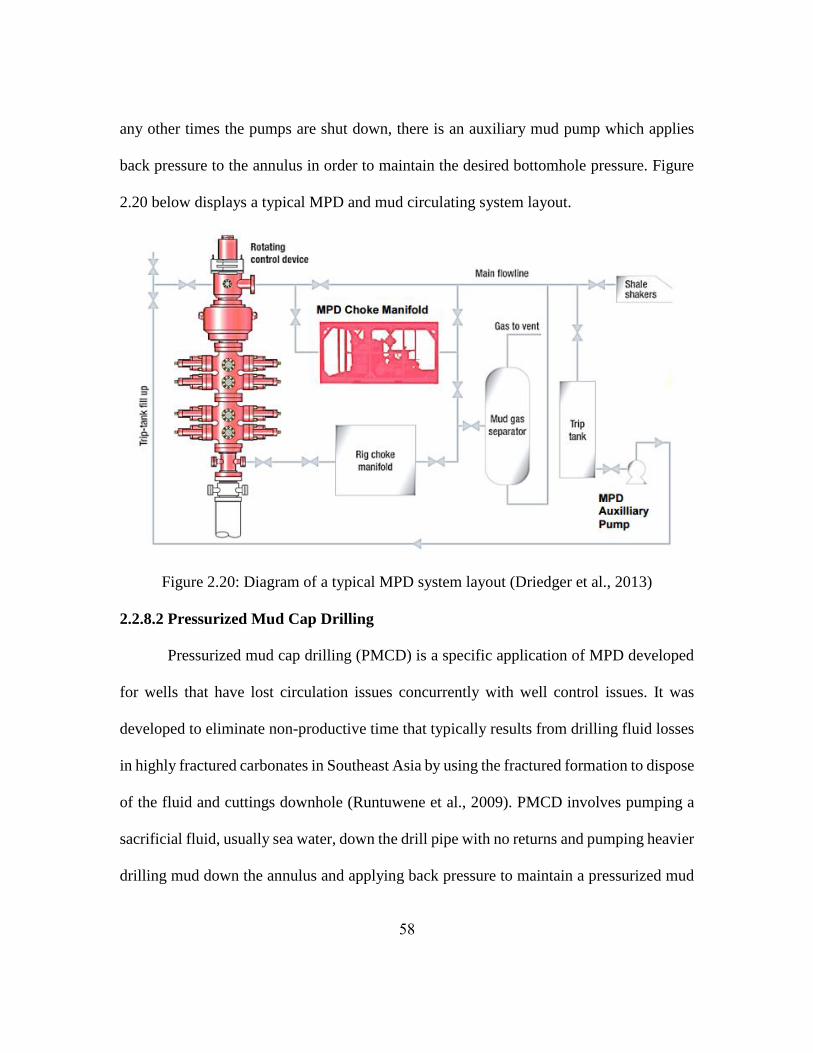
58
any other times the pumps are shut down, there is an auxiliary mud pump which applies
back pressure to the annulus in order to maintain the desired bottomhole pressure. Figure
2.20 below displays a typical MPD and mud circulating system layout.
Figure 2.20: Diagram of a typical MPD system layout (Driedger et al., 2013)
2.2.8.2 Pressurized Mud Cap Drilling
Pressurized mud cap drilling (PMCD) is a specific application of MPD developed
for wells that have lost circulation issues concurrently with well control issues. It was
developed to eliminate non-productive time that typically results from drilling fluid losses
in highly fractured carbonates in Southeast Asia by using the fractured formation to dispose
of the fluid and cuttings downhole (Runtuwene et al., 2009). PMCD involves pumping a
sacrificial fluid, usually sea water, down the drill pipe with no returns and pumping heavier
drilling mud down the annulus and applying back pressure to maintain a pressurized mud
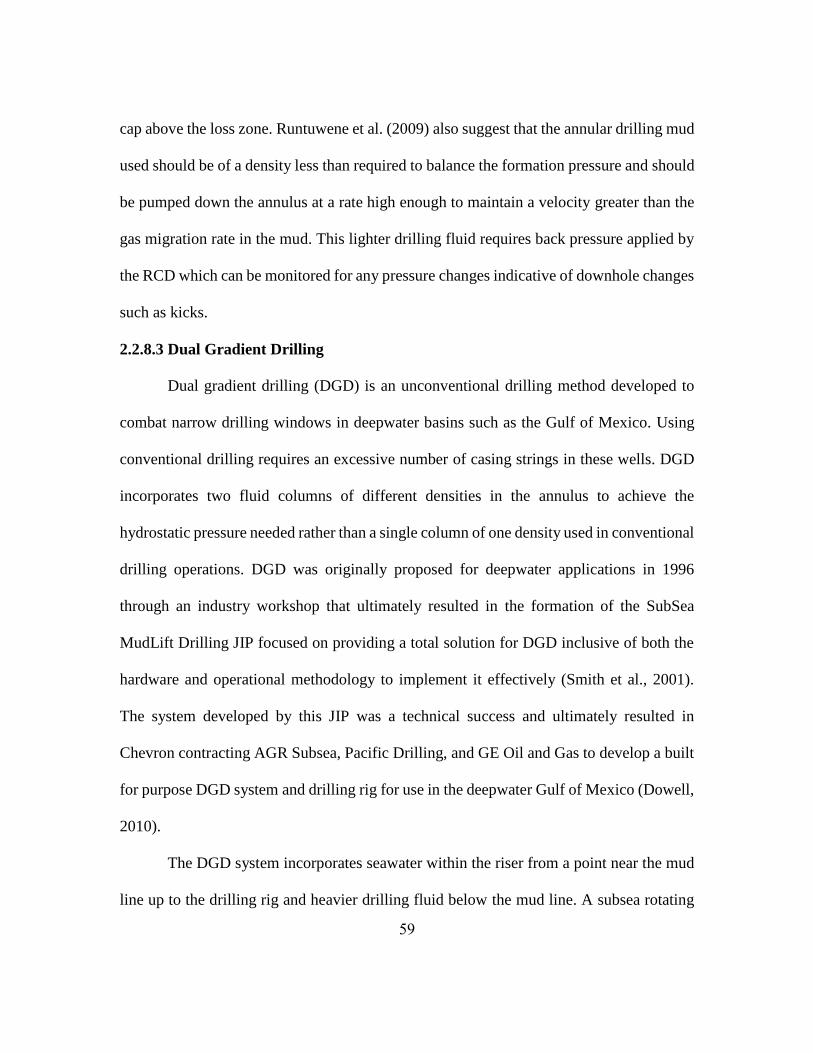
59
cap above the loss zone. Runtuwene et al. (2009) also suggest that the annular drilling mud
used should be of a density less than required to balance the formation pressure and should
be pumped down the annulus at a rate high enough to maintain a velocity greater than the
gas migration rate in the mud. This lighter drilling fluid requires back pressure applied by
the RCD which can be monitored for any pressure changes indicative of downhole changes
such as kicks.
2.2.8.3 Dual Gradient Drilling
Dual gradient drilling (DGD) is an unconventional drilling method developed to
combat narrow drilling windows in deepwater basins such as the Gulf of Mexico. Using
conventional drilling requires an excessive number of casing strings in these wells. DGD
incorporates two fluid columns of different densities in the annulus to achieve the
hydrostatic pressure needed rather than a single column of one density used in conventional
drilling operations. DGD was originally proposed for deepwater applications in 1996
through an industry workshop that ultimately resulted in the formation of the SubSea
MudLift Drilling JIP focused on providing a total solution for DGD inclusive of both the
hardware and operational methodology to implement it effectively (Smith et al., 2001).
The system developed by this JIP was a technical success and ultimately resulted in
Chevron contracting AGR Subsea, Pacific Drilling, and GE Oil and Gas to develop a built
for purpose DGD system and drilling rig for use in the deepwater Gulf of Mexico (Dowell,
2010).
The DGD system incorporates seawater within the riser from a point near the mud
line up to the drilling rig and heavier drilling fluid below the mud line. A subsea rotating
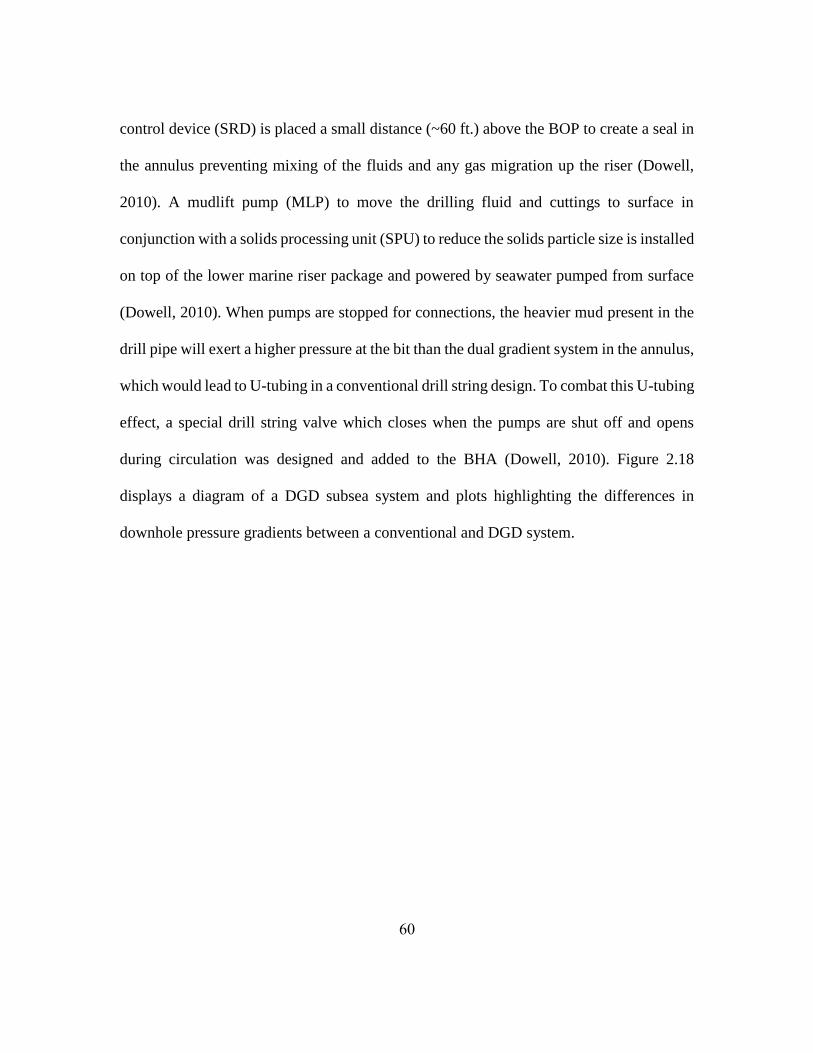
60
control device (SRD) is placed a small distance (~60 ft.) above the BOP to create a seal in
the annulus preventing mixing of the fluids and any gas migration up the riser (Dowell,
2010). A mudlift pump (MLP) to move the drilling fluid and cuttings to surface in
conjunction with a solids processing unit (SPU) to reduce the solids particle size is installed
on top of the lower marine riser package and powered by seawater pumped from surface
(Dowell, 2010). When pumps are stopped for connections, the heavier mud present in the
drill pipe will exert a higher pressure at the bit than the dual gradient system in the annulus,
which would lead to U-tubing in a conventional drill string design. To combat this U-tubing
effect, a special drill string valve which closes when the pumps are shut off and opens
during circulation was designed and added to the BHA (Dowell, 2010). Figure 2.18
displays a diagram of a DGD subsea system and plots highlighting the differences in
downhole pressure gradients between a conventional and DGD system.
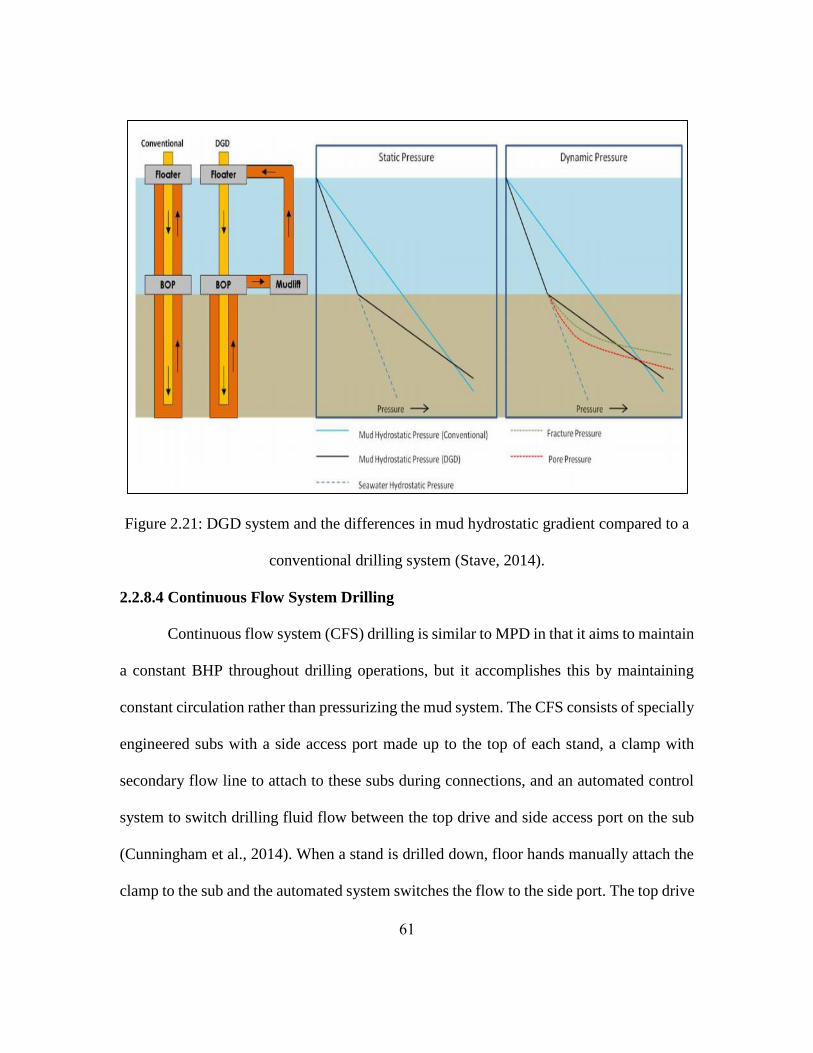
61
Figure 2.21: DGD system and the differences in mud hydrostatic gradient compared to a
conventional drilling system (Stave, 2014).
2.2.8.4 Continuous Flow System Drilling
Continuous flow system (CFS) drilling is similar to MPD in that it aims to maintain
a constant BHP throughout drilling operations, but it accomplishes this by maintaining
constant circulation rather than pressurizing the mud system. The CFS consists of specially
engineered subs with a side access port made up to the top of each stand, a clamp with
secondary flow line to attach to these subs during connections, and an automated control
system to switch drilling fluid flow between the top drive and side access port on the sub
(Cunningham et al., 2014). When a stand is drilled down, floor hands manually attach the
clamp to the sub and the automated system switches the flow to the side port. The top drive
62
can then be disconnected, pull another stand of pipe out of the derrick, and make this stand
up to the drill string. At this point, the automated system would switch flow back to the top
drive and drilling could begin.
Additional advantages of CFS are uninterrupted data from downhole tools since
they require circulation to transmit mud pulses to surface and improved hole cleaning due
to the lack of static conditions when cuttings would settle (Cunningham et al. 2014). One
negative with a CFS is that mud pump failure would result in an immediate reduction in
annular pressure, which could put the well in an underbalance condition and cause an
influx. However, a MPD system employed in combination with CFS could maintain
wellbore pressures in the event of a pump breakdown.
2.2.8.5 Casing or Liner Drilling
Casing drilling is an unconventional drilling technique in which casing is used, with
a specialized bit, to drill a hole section and is subsequently cemented in place once its
setting depth has been reached. In some circumstances casing drilling can provide a
significant cost benefit for a drilling program by eliminating the trip out with drill pipe and
back in to the hole with casing that are required in conventional drilling operations.
Additionally, and of more importance to this thesis, casing drilling has proven an effective
approach to combat lost circulation issues as well as wellbore breathing (Rosenberg and
Gala, 2011). The exact underlying mechanism causing this isn’t well understood, but is
thought to be related to the small annular space between the formation and casing that the
mud and cuttings must be circulated through. This belief has led to the process being
commonly referred to as the “casing smear effect”.
63
Chapter 3 Wellbore Breathing Case Studies
3.1 Case Studies from Literature
Several case studies have been published in literature which will be examined in
detail in this section. Each of these wells encountered wellbore breathing although the
amount of details and data published varies significantly between them.
3.1.1 Timor Sea, Offshore Australia
Ashley (2000) published a case study detailing two wells drilled in the Bonaparte
Basin of the Timor Sea off the northwest coast of Australia and operated by Woodside
Energy. The first well, the Bard-1, was spudded in October 1998 and was ultimately
plugged and abandoned short of target depth (TD) due to severe wellbore breathing coupled
with hydrocarbon swap-out. The Jura-1 was subsequently spudded in July 1999 targeting
the same structure, but about 28 miles away. The Jura-1 also encountered wellbore
breathing events but without any associated hydrocarbon swap-out and was able to
successfully reach TD. Figure 3.1 below displays a map of the Jurassic Plover-Plover
petroleum system within the Bonaparte Basin showing discoveries in the area, water
depths, and well locations including the Bard-1 and Juna-1 towards the top left of the
figure.

64
Figure 3.1: Map of the Jurassic Plover-Plover petroleum system within the Bonaparte
Basin (Earl, 2004)
3.1.1.1 Bard-1
Ashley (2000) describes the exploration well plan, which can be seen in Figure 3.2,
as targeting the Plover formation with a simple two string design and an 8 ½” hole to TD
using a water based mud system. Furthermore, a FIT to 11.75 ppg was planned at the 9
5/8” shoe and a 10.92 ppg mud weight was chosen to drill the overpressured Jamieson
Formation with a plan to gradually reduce this mud weight to a minimum of 9.8 ppg prior
to entering the Darwin formation.

65
Figure 3.2: Predicted section and pore pressure for Bard-1 (Modified after Ashley, 2000)
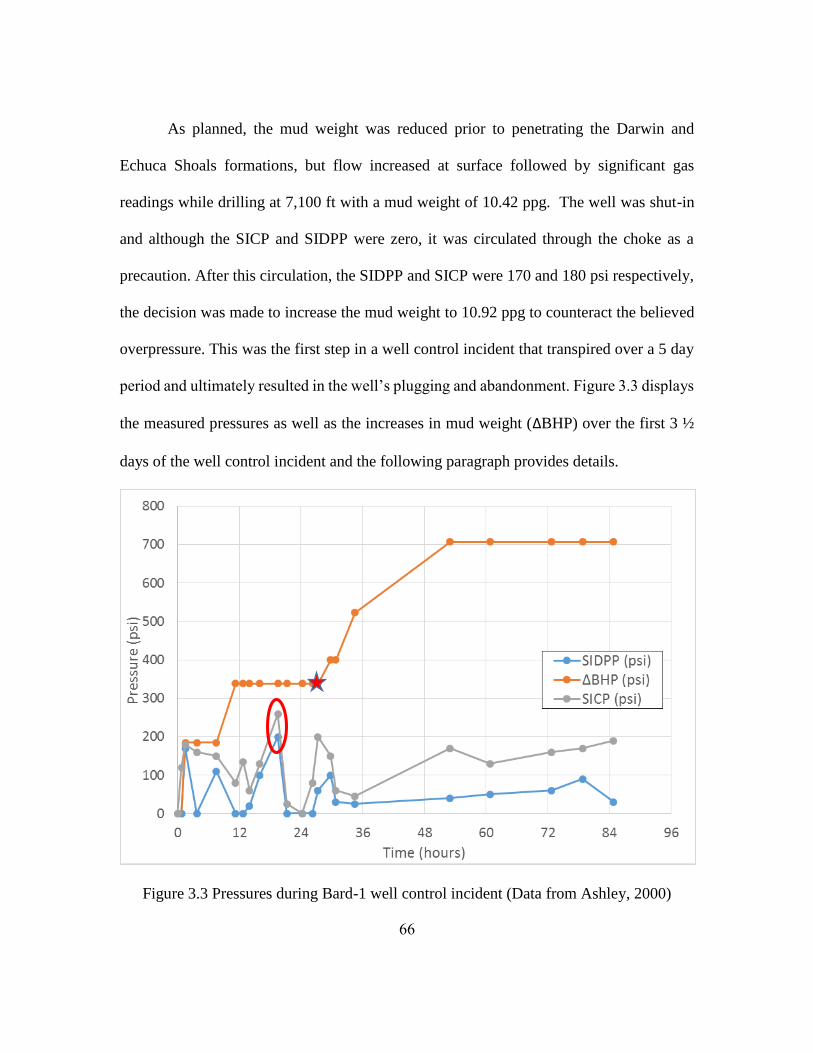
66
As planned, the mud weight was reduced prior to penetrating the Darwin and
Echuca Shoals formations, but flow increased at surface followed by significant gas
readings while drilling at 7,100 ft with a mud weight of 10.42 ppg. The well was shut-in
and although the SICP and SIDPP were zero, it was circulated through the choke as a
precaution. After this circulation, the SIDPP and SICP were 170 and 180 psi respectively,
the decision was made to increase the mud weight to 10.92 ppg to counteract the believed
overpressure. This was the first step in a well control incident that transpired over a 5 day
period and ultimately resulted in the well’s plugging and abandonment. Figure 3.3 displays
the measured pressures as well as the increases in mud weight (ΔBHP) over the first 3 ½
days of the well control incident and the following paragraph provides details.
Figure 3.3 Pressures during Bard-1 well control incident (Data from Ashley, 2000)
67
In Figure 3.3, the orange points indicate the increases in BHP caused by raising the
mud weight in comparison to the initial mud weight of 10.42 ppg. The mud weight was
raised first to 10.92 ppg at 1.5 hours, then to 11.33 ppg at 11.25 hours, and kept at this
density until the 27 hour point which is marked with a star. Numerous circulations, bleed
offs, and flow checks to static conditions were recorded over the course of this initial 27
hour period. During the course of these operations, there were hydrocarbon returns to
surface throughout and bleed off volumes were significantly larger than expected for
trapped pressure, but there were no pit gains and the SIDPP was reduced to zero several
times (Ashley, 2000).
At this point, the downhole mechanism was diagnosed as a high pressured low
permeability zone and the decision was made to increase the mud weight further to 11.83
ppg and then 12.33. This only exacerbated the problem resulting in higher pressures, higher
gas cuts, and fluid losses. Ultimately, the crew was unable stop these losses and
hydrocarbon returns persisted so the decision was made to set cement plugs and abandon
the well.
In the post well review, Ashley (2000) suggests that the mechanism responsible for
the anomalous pressure data and hydrocarbon returns was wellbore breathing coupled with
hydrocarbon swap-out and cited eight reasons:
The formations below the Jamieson shale were thought to have a fractured
lithology, which if filled with hydrocarbons would lend itself to this mechanism.
The SIDPP was reduced to zero several times during the well control event and the
well was static when opened, indicating overbalance on bottom-hole pressure.
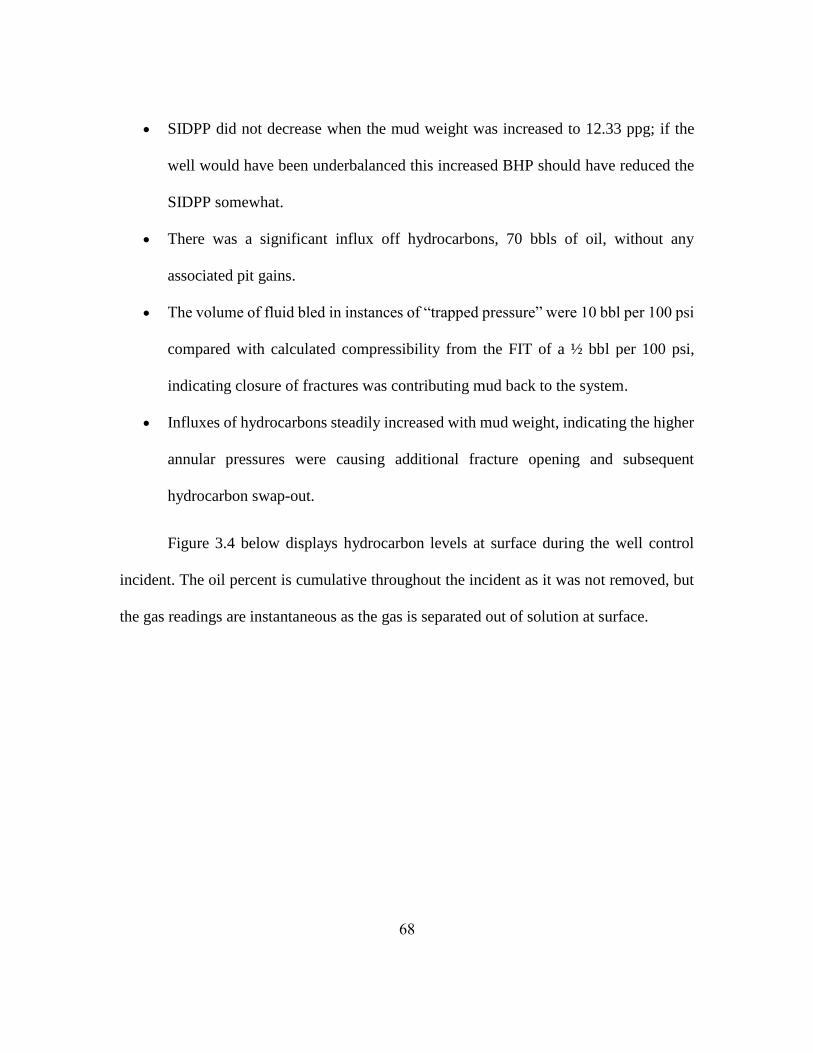
68
SIDPP did not decrease when the mud weight was increased to 12.33 ppg; if the
well would have been underbalanced this increased BHP should have reduced the
SIDPP somewhat.
There was a significant influx off hydrocarbons, 70 bbls of oil, without any
associated pit gains.
The volume of fluid bled in instances of “trapped pressure” were 10 bbl per 100 psi
compared with calculated compressibility from the FIT of a ½ bbl per 100 psi,
indicating closure of fractures was contributing mud back to the system.
Influxes of hydrocarbons steadily increased with mud weight, indicating the higher
annular pressures were causing additional fracture opening and subsequent
hydrocarbon swap-out.
Figure 3.4 below displays hydrocarbon levels at surface during the well control
incident. The oil percent is cumulative throughout the incident as it was not removed, but
the gas readings are instantaneous as the gas is separated out of solution at surface.

69
Figure 3.4: Percent of returns, oil and gas (Data from Ashley, 2000)
In addition to the reasons listed by Ashley, which were primarily during the latter
portion of the well control event, there is additional evidence within the first 27 hours of
the well control incident that support wellbore breathing coupled with hydrocarbon swap-
out as the influx mechanism. It is important to note that the first 27 hours composed the
critical time period for this well. The data gathered during this period was all that was
available when the mechanism was mischaracterized as a low permeability high pressure
zone.
First, the mud weight was increased first by 0.5 ppg and then by an additional 0.4
ppg for a total increase of 0.9 ppg, but there was no associated reduction in the SIDPP. On
the contrary, the SIDPP was actually higher after each mud weight increase. If the well was
70
in a state of underbalance, this 350 psi increase in wellbore pressure should have resulted
in some reduction in SIDPP.
Second, in Figure 3.3, the SICP and SIDPP at the 19 hour mark are circled in red
as these were the highest shut in pressures observed throughout the incident. These
pressures were recorded after a circulation of 1.25 times the wellbore volume with 10.92
ppg while holding an additional 100 psi of back pressure on the well at the choke. The
additional 100 psi of back pressure is equivalent to a 0.3 ppg increase in mud weight
without taking into account any additional back pressure added by frictional effects of flow
through the choke line. If the downhole mechanism was a high pressure low permeability
zone, the shut-in pressures should have been lower after this circulation compared to
previous shut-in pressures. Furthermore, these high shut-in pressures suggest that the
increased annular pressures during circulation actually made the problem worse. This is
consistent with our understanding of wellbore breathing, in which higher annular pressures
result in increased fracture opening and higher surface pressures if the fluids are not
allowed to flow back into the well prior to shut-in.
Last, there were two sequences in the first 27 hours in which the well was circulated
conventionally rather than through the choke manifold with the well shut-in. During each
of these two circulations, flow significantly increased from the well when 65 to 70 percent
of the annulus volume had been displaced, followed by significant gas readings at surface.
This behavior is consistent with a volume of oil entering the wellbore when the pumps
were off, this volume being circulated up the annulus, and the gas rapidly breaking out of
solution when volume reaches a depth where the annular pressure drops below the bubble
71
point. This once again suggests that wellbore breathing coupled with hydrocarbon swap-
out was the mechanism because this would have resulted in an oil influx when circulation
was stopped, with no associated pit gain. It would be difficult for a high pressure low
permeability zone to cause similar behavior as the volume of influx would be limited by
the formation’s permeability in the short time that the well was static prior to each
circulation and a pit gain would be associated with the influx. Assuming the influx occurred
at or near bottom-hole, the annular pressure was between 1,200 psi and 1,400 psi at the
depth where the gas is believed to have broken out. These pressures are within the range
of bubble points expected for hydrocarbon oils, confirming the plausibility of the increased
flow being due to gas breaking out of solution.
3.1.1.2 Jura-1
The Jura-1 was spudded roughly 8 months after the Bard-1 with the objective of
evaluating the Plover Formation on the same structure that the Bard-1 had been drilled.
Ashley (2000) explains that due to the experiences on Bard-1, several new operational
procedure were implemented prior to spudding the Jura-1 including:
Reduced circulating rates in order to reduce the ECD.
Staging pump start up and shut down over five minute periods in order to allow
any fluid swap-out encountered to occur gradually.
Implementation of a PWD tool in the BHA to monitor downhole pressures.
Flow through both the choke and kill lines when circulating with the well shut-in
to reduce frictional pressures.
Use flowback fingerprinting to distinguish between wellbore breathing and a kick.
72
If hydrocarbon swap-out was encountered, circulate bottoms up after each
connection prior to drilling ahead.
Similar to the Bard-1, wellbore breathing was encountered in the interval of the
Darwin and Echuca Shoals Formations. However, no hydrocarbon swap-out was
encountered in conjunction with the wellbore breathing. In accordance with the new
operational procedures, the well was shut-in and circulated bottoms up after the first two
connections when wellbore breathing occurred. In each instance, the well was static after
pressure bleed off and no hydrocarbons were returned to surface so the decision was made
to drill ahead while monitoring flowback fingerprints at connections. Following this
procedure, no influxes occurred and the well was successfully drilled to TD.
It is worth noting that the Jura-1 was drilled with the same semi-submersible
drilling rig and the same crew as the Bard-1 with the only major equipment or tool change
being the incorporation of a PWD tool in the drill string. This demonstrates that a well-
trained and well-educated operations team is a necessity in situations where wellbore
breathing is encountered and can be the difference between abandonment of a well and
reaching TD. In addition, while the PWD tool did prove beneficial in monitoring downhole
pressures due to ECD, there were no other significant changes regarding the equipment
and tools used to drill the well. Identification of the back flow at connections, verification
that this back flow was due to wellbore breathing, and verification that no hydrocarbons
were entering the wellbore so it was safe to drill ahead were all rooted in the operational
procedures implemented prior to spudding the well. This stresses the effectiveness that well
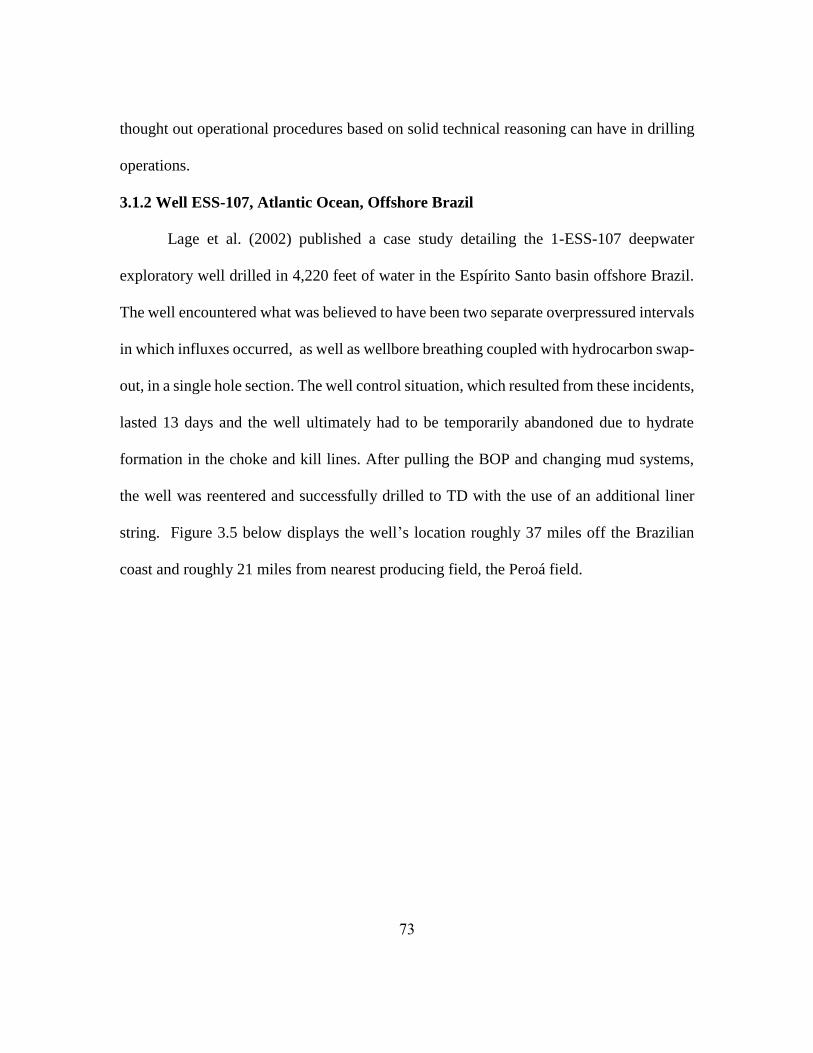
73
thought out operational procedures based on solid technical reasoning can have in drilling
operations.
3.1.2 Well ESS-107, Atlantic Ocean, Offshore Brazil
Lage et al. (2002) published a case study detailing the 1-ESS-107 deepwater
exploratory well drilled in 4,220 feet of water in the Espírito Santo basin offshore Brazil.
The well encountered what was believed to have been two separate overpressured intervals
in which influxes occurred, as well as wellbore breathing coupled with hydrocarbon swap-
out, in a single hole section. The well control situation, which resulted from these incidents,
lasted 13 days and the well ultimately had to be temporarily abandoned due to hydrate
formation in the choke and kill lines. After pulling the BOP and changing mud systems,
the well was reentered and successfully drilled to TD with the use of an additional liner
string. Figure 3.5 below displays the well’s location roughly 37 miles off the Brazilian
coast and roughly 21 miles from nearest producing field, the Peroá field.
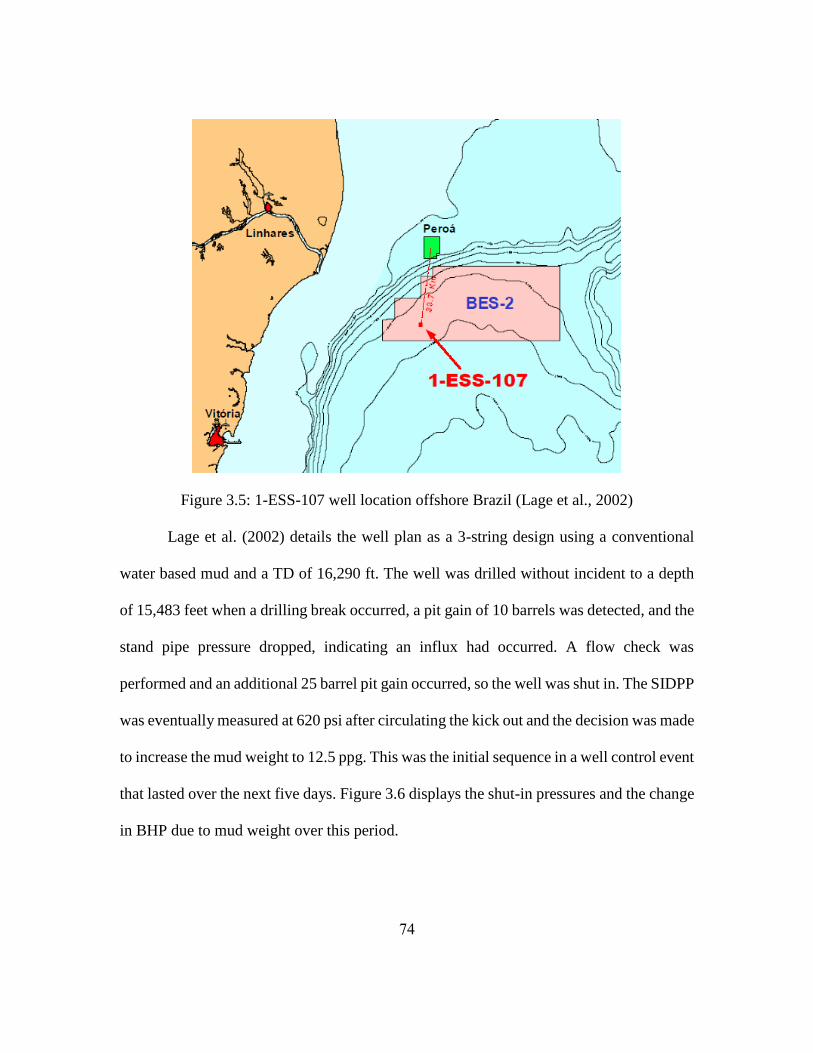
74
Figure 3.5: 1-ESS-107 well location offshore Brazil (Lage et al., 2002)
Lage et al. (2002) details the well plan as a 3-string design using a conventional
water based mud and a TD of 16,290 ft. The well was drilled without incident to a depth
of 15,483 feet when a drilling break occurred, a pit gain of 10 barrels was detected, and the
stand pipe pressure dropped, indicating an influx had occurred. A flow check was
performed and an additional 25 barrel pit gain occurred, so the well was shut in. The SIDPP
was eventually measured at 620 psi after circulating the kick out and the decision was made
to increase the mud weight to 12.5 ppg. This was the initial sequence in a well control event
that lasted over the next five days. Figure 3.6 displays the shut-in pressures and the change
in BHP due to mud weight over this period.
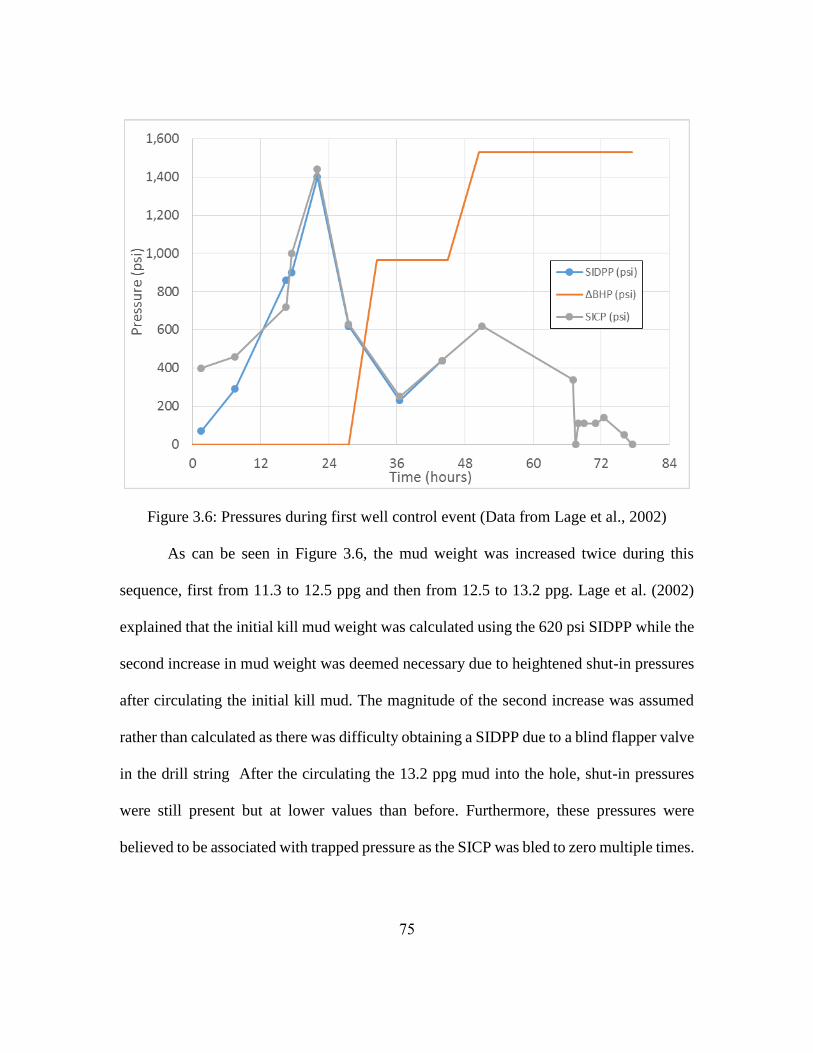
75
Figure 3.6: Pressures during first well control event (Data from Lage et al., 2002)
As can be seen in Figure 3.6, the mud weight was increased twice during this
sequence, first from 11.3 to 12.5 ppg and then from 12.5 to 13.2 ppg. Lage et al. (2002)
explained that the initial kill mud weight was calculated using the 620 psi SIDPP while the
second increase in mud weight was deemed necessary due to heightened shut-in pressures
after circulating the initial kill mud. The magnitude of the second increase was assumed
rather than calculated as there was difficulty obtaining a SIDPP due to a blind flapper valve
in the drill string After the circulating the 13.2 ppg mud into the hole, shut-in pressures
were still present but at lower values than before. Furthermore, these pressures were
believed to be associated with trapped pressure as the SICP was bled to zero multiple times.
76
Lage et al. (2002) states that drilling was resumed and the well was deepened from
15,483 to 15,834 feet over the next two days. Throughout this hole-section, while no net
pit gains occurred, heavy gas cuts (up to 30 %) were recorded and each was associated with
the bottoms up time for a connection. A flow check after the first gas cut at surface showed
a static well, but a flow check after the fourth gas cut at surface registered a 10 barrel gain
over 75 minutes. The mud weight was subsequently increased to 13.5 ppg, but heavy gas
cuts associated with bottoms up from static conditions continued, so the mud weight was
increased further to 13.7 ppg. Gas cuts continued with this mud weight, but several flow
checks indicated the well was static and therefore overbalanced. After tripping the string
out of the hole to the BOP at a controlled pace to avoid swabbing, several influxes occurred
totaling 128 barrels and the well was shut-in. Preparation for the static volumetric method
was in progress when the kill line and subsequently the choke line became plugged with
what was believed to be hydrates caused by free gas and low temperatures at the BOP
(Lage et al., 2002). Cement was then bullheaded down the casing string to temporarily
abandon the well and the BOP was pulled to clear the choke and kill lines. The BOP was
then run again and the well was reentered and successfully drilled to TD with the use of a
SBM and the setting an additional 7” liner string.
In review of the well, Lage et al. (2002), discussed a low permeability
overpressured reservoir or wellbore breathing coupled with hydrocarbon swap-out as the
two potential mechanisms behind the influxes and concluded that it was likely a
combination of the two. Lage et al. suggested that overpressure was present based on:
77
Increased rate of penetration (ROP) indicated an increase in formation pore
pressure at 15,483 feet, the depth of the first kick
Increased ROP indicated an increase in formation pore pressure between 15,716
feet and 15,834 feet, the depth of the second kick
Sandstone cuttings impregnated with oil were identified at surface when bottoms
up occurred for the 15,716-15,834 interval indicating a sandstone reservoir was
present.
Lage et al. suggested that wellbore breathing coupled with hydrocarbon swap-out was also
present based on:
The volumes of fluid returns during bleed off were significantly larger than mud
compressibility data indicated should be returned (3.3 bbl/100 psi vs. 1 bbl/100 psi),
which indicates that the elastic closure of fractures was contributing volume to the
system
After the mud weight was raised following the first kick, SIDPP and SICP were
bled to zero multiple times indicating overbalance. However, gas shows continued
at surface indicating hydrocarbons were still entering the wellbore
For the drilled interval, bottoms up for each connection consistently had associated
gas peaks at surface indicating that gas entered the wellbore when pumps were
stopped.
Significant volumes of gas were recorded at surface, but there were no associated
pit gains detected.
78
Losses during drilling were not explicitly mentioned by the authors, but the above
bullet points and the assessment that hydrocarbon swap out is present are consistent
with the wellbore breathing mechanism in which fluid flows into fractures during
drilling and back into the wellbore during connections. Losses may not have been
noticed at surface and recorded in the daily operational report if they occurred
slowly over the course of drilling a stand of pipe. This could potentially explain the
lack of fluid losses being mentioned in the paper.
In addition to the reasons mentioned above, there are several other data points
indicating that the wellbore breathing was present in this case study. First, shortly after the
initial mud weight increase following the first influx at 15,483 feet, the SIDPP and SICP
were measured at 440 psi. In light of this, the decision was made to raise the mud weight
further and to circulate the well with the current 12.5 ppg mud while the heavier mud was
prepared. During this 5 ½ hour time period the well was circulated through the choke line
while holding an additional 230 psi of back pressure at the choke. The SIDPP couldn’t be
measured due to the blind flapper valve but the SICP was measured as 620 psi, a 180 psi
increase over the prior measurement. If the well were underbalanced, the additional
pressure by the choke would have resulted in either the same or slightly lower SICP. The
increased shut in pressure indicates that the increased bottom-hole pressure during
circulation likely exacerbated the problem, indicating wellbore breathing was likely
responsible. A pressure bleed off sequence combined with a flow check at this point, prior
to weighting up to 13.2 ppg mud, could have been useful in identifying the mechanism.
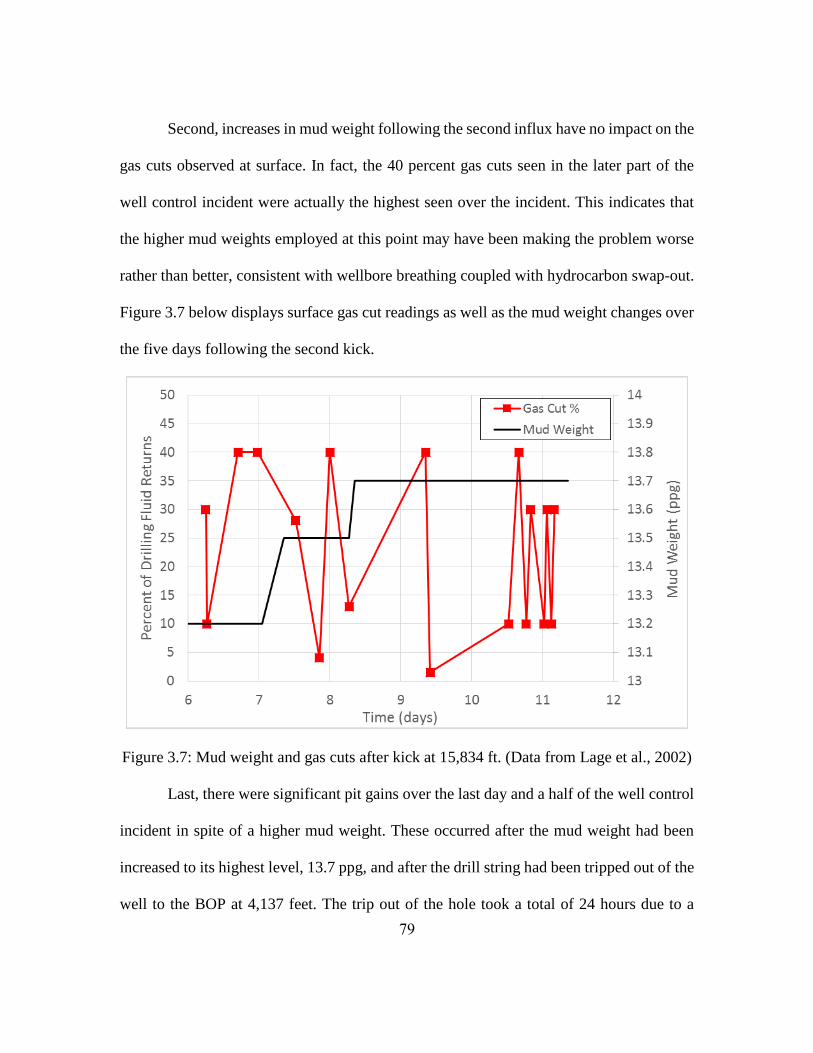
79
Second, increases in mud weight following the second influx have no impact on the
gas cuts observed at surface. In fact, the 40 percent gas cuts seen in the later part of the
well control incident were actually the highest seen over the incident. This indicates that
the higher mud weights employed at this point may have been making the problem worse
rather than better, consistent with wellbore breathing coupled with hydrocarbon swap-out.
Figure 3.7 below displays surface gas cut readings as well as the mud weight changes over
the five days following the second kick.
Figure 3.7: Mud weight and gas cuts after kick at 15,834 ft. (Data from Lage et al., 2002)
Last, there were significant pit gains over the last day and a half of the well control
incident in spite of a higher mud weight. These occurred after the mud weight had been
increased to its highest level, 13.7 ppg, and after the drill string had been tripped out of the
well to the BOP at 4,137 feet. The trip out of the hole took a total of 24 hours due to a
80
controlled trip velocity to avoid swabbing and a complete BOP test. Over this time period,
the well was in static conditions or near static conditions as no circulation occurred.
Because of this, any downhole fractures responsible for the earlier wellbore breathing
events would have been filled with drilling fluid as static pressures were now similar to
circulating pressures earlier in the well control event. As the mud in the lower part of the
well was no longer being replaced with mud from surface, the formation in contact with
the mud would have been warming back to in-situ conditions throughout this period. The
warming would increase the effective fracture gradient and result in some fracture closure,
forcing drilling fluid into the wellbore and resulting in a gain at surface. An overpressured
low permeability zone could cause slow pit gains like these, but similar gains would have
been expected to occur throughout the static period rather than only at the end.
Furthermore, if the well was still underbalanced with 13.7 ppg mud, fluid gains should
have been experienced earlier in the well control sequence when lighter muds were in the
hole. Therefore, taking all the available data into account, the fluid gains during static
conditions late in the well control event were likely driven by thermal effects as the
formation warmed back to in-situ conditions, increasing the effective fracture gradient of
the downhole formation and closing fluid filled fractures.
3.1.3 Well 22/30 C-10, North Sea, Offshore Scotland
Maury and Idelovici (1995) published a case study detailing the 22/30 C-10 well
targeting the Elgin Field located in the North Sea, 143 miles east of Aberdeen, Scotland.
The well is unique in that it was drilling in HPHT conditions and was using a heat
exchanger to keep the OBM below the flash-point at surface for safety reasons. This
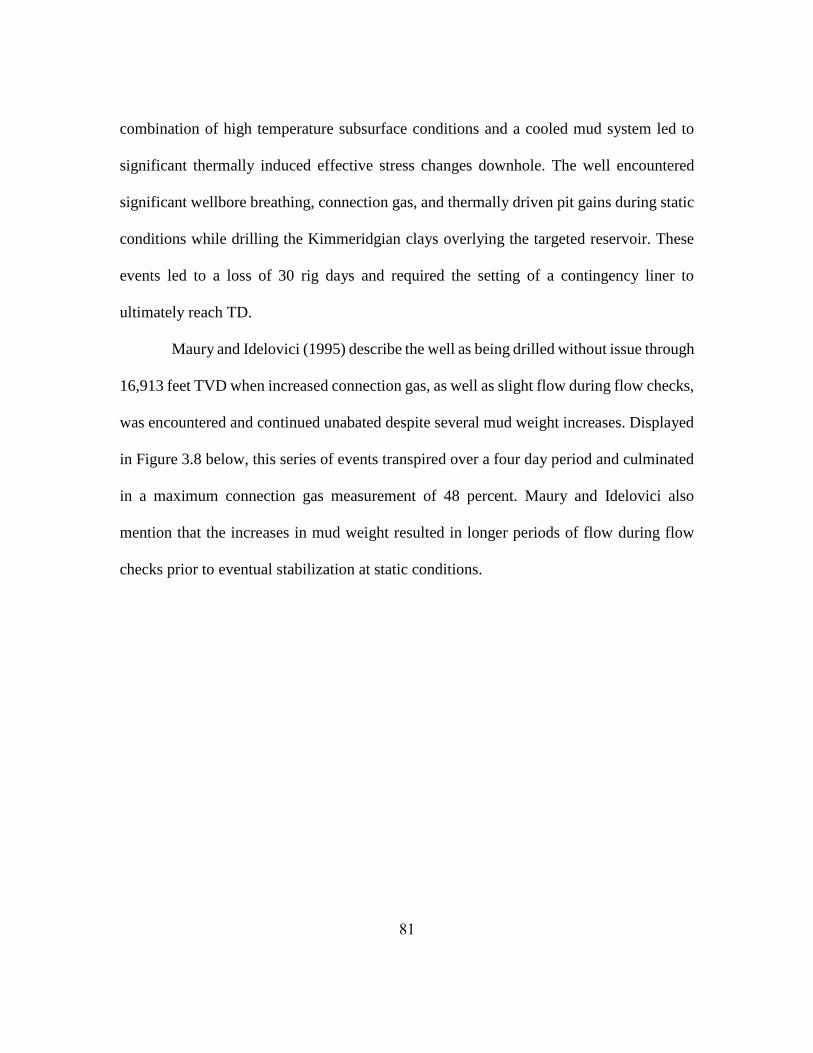
81
combination of high temperature subsurface conditions and a cooled mud system led to
significant thermally induced effective stress changes downhole. The well encountered
significant wellbore breathing, connection gas, and thermally driven pit gains during static
conditions while drilling the Kimmeridgian clays overlying the targeted reservoir. These
events led to a loss of 30 rig days and required the setting of a contingency liner to
ultimately reach TD.
Maury and Idelovici (1995) describe the well as being drilled without issue through
16,913 feet TVD when increased connection gas, as well as slight flow during flow checks,
was encountered and continued unabated despite several mud weight increases. Displayed
in Figure 3.8 below, this series of events transpired over a four day period and culminated
in a maximum connection gas measurement of 48 percent. Maury and Idelovici also
mention that the increases in mud weight resulted in longer periods of flow during flow
checks prior to eventual stabilization at static conditions.
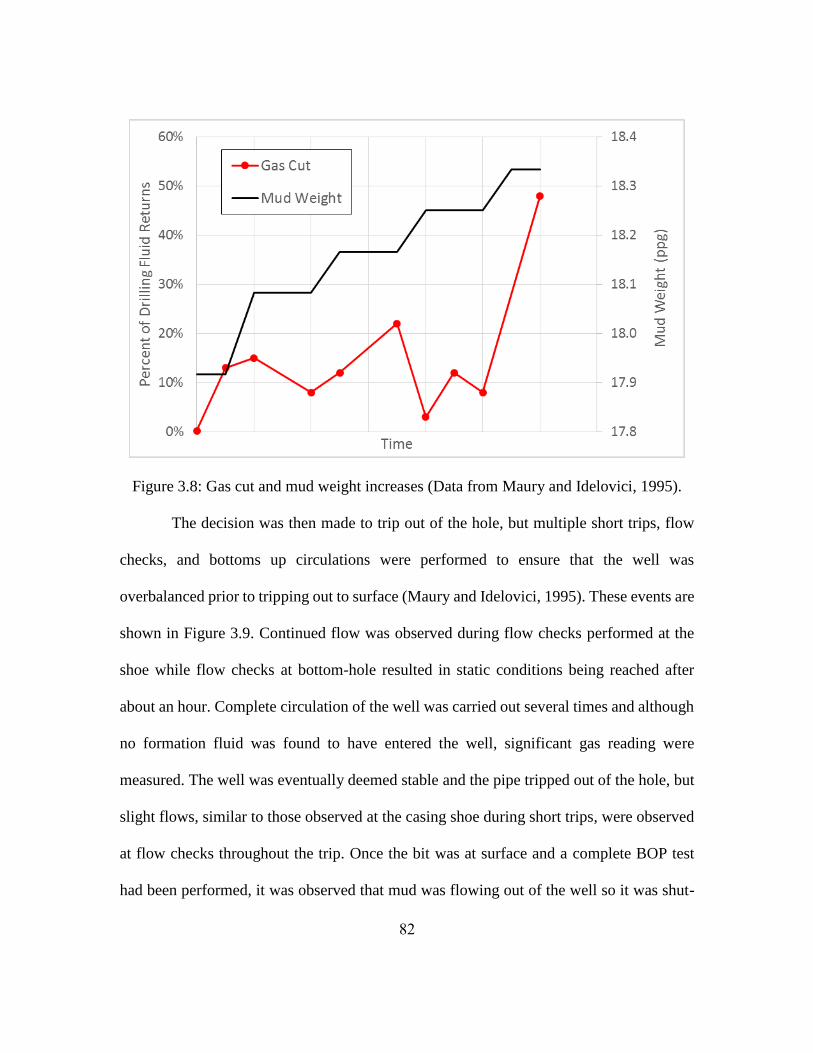
82
Figure 3.8: Gas cut and mud weight increases (Data from Maury and Idelovici, 1995).
The decision was then made to trip out of the hole, but multiple short trips, flow
checks, and bottoms up circulations were performed to ensure that the well was
overbalanced prior to tripping out to surface (Maury and Idelovici, 1995). These events are
shown in Figure 3.9. Continued flow was observed during flow checks performed at the
shoe while flow checks at bottom-hole resulted in static conditions being reached after
about an hour. Complete circulation of the well was carried out several times and although
no formation fluid was found to have entered the well, significant gas reading were
measured. The well was eventually deemed stable and the pipe tripped out of the hole, but
slight flows, similar to those observed at the casing shoe during short trips, were observed
at flow checks throughout the trip. Once the bit was at surface and a complete BOP test
had been performed, it was observed that mud was flowing out of the well so it was shut-
83
in with an initial SIDPP of 400 psi increasing to 600 psi over four hours. The well was
eventually reentered, determined to be overbalanced, and drilled to TD after setting an
additional liner.
Figure 3.9: Log of events during short trips prior to pulling out of the hole (Data from
Maury and Idelovici, 1995).
In review of the well, Maury and Idelovici (1995) incorporated numerical modeling
to evaluate the borehole stresses stress changes due to thermal effects and suggested that
the mechanism involved was fracture initiation and propagation due to cooling and
subsequent mud weight increases followed by fracture closure as the formation returned to
thermal equilibrium. Additionally, Maury and Idelovici (1995) attributed the increased gas
cuts experienced during the initial sequence to near wellbore vertical fractures, caused by
84
both cooling and subsequent mud weight increases, forming around the circumference of
the wellbore and enabling some gas to enter the OBM.
While the fluid gains that occurred while tripping and the shut-in pressures recorded
at surface were likely driven by thermal effects as the downhole formation returned to
thermal equilibrium, the connection gas and fluid gains during flow checks early in the
well control sequence were likely not caused by the same mechanism. While the increased
gas cuts were likely related to fractures, the assertion by Maury and Idelovici that the gas
cuts were caused by fractures around the circumference of the wellbore is incorrect. The
models prediction of fractures around the circumference of the wellbore is rooted in the
incorrect assumption of isotropic horizontal stresses. This region of the North Sea has
anisotropic horizontal stresses based on observed wellbore tensile fractures and wellbore
breakouts (Zoback, 2007) and (Heidbach et al., 2008).
The underlying mechanism causing the fluid gains and gas cuts during the early
sequence shown in Figure 3.8 was likely wellbore breathing in which gas was diffusing
into the OBM within the fractures while circulating and then being brought back into the
wellbore with the drilling fluid when circulation was stopped. The fluid gains and gas cuts
experienced during the short trips and trip out to surface were likely caused by a
combination of the above mechanism and closure of fractures due to thermal effects as the
formation returned to thermal equilibrium during static conditions. The reasoning for these
conclusions are explained in the following paragraphs.
Flow check behavior early in the sequence differed significantly from late in the
sequence: early flow checks resulted in flow immediately after pumps were shut off and
85
then became static after 25-45 minutes while flow checks at the casing shoe during the
short trips, during the trip out to surface, and once the bit was at surface resulted in
continued flow over long periods of time. During the short trip sequence, flow checks
performed at bottom-hole eventually went to static conditions while flow checks performed
at the casing shoe did not. This can be explained because each flow check at bottom-hole
during the short trips and during the initial well control sequence occurred immediately
following circulation. Circulation would have charged the fractures with cold mud from
surface and when the pumps were shut off for the flow check, the reduction in wellbore
pressure would have caused some fracture closure and some mud to flow back into the
wellbore. Thermal effects likely would not have time to take effect during the subsequent
25-45 minute flow check because cold mud had just been forced into the fractures and the
heat diffusion required to warm the fluid and the surrounding formation is a slow process.
The flow checks performed at the casing shoe during the short trip sequence were each
performed after the well had been static for between 1-3 hours (each occurred after a
bottom-hole flow check and the string had to be tripped 800 feet to the shoe). This time lag
would have provided some time for heat diffusion and the associated thermal effects to
initiate and would explain the continuous small flow volumes observed at the casing shoe.
Furthermore, the continuous small flow volumes were also seen during flow checks while
tripping out to surface and the pressure build up at surface was gradual and occurred over
a four hour period. This is consistent with thermal effects as it would be a slow process
which would continue until the formation surrounding the fractures returned to thermal
equilibrium.

86
The fact that the connection gas observed during the initial well control sequence
was not lessened and increased with higher mud weights indicates that it was caused by
wellbore breathing coupled with gas diffusion into the OBM. During circulation, some
OBM would have been forced out into the fracture system and exposed to the gas bearing
formation where gas diffusion could take place. When circulation was stopped, this OBM
as well as the dissolved gas entrained in it, would flow back to the wellbore and be
circulated up the annulus when pumps were started again. Furthermore, this effect would
be exacerbated by mud weight increases because this would propagate the fracture and
allow a larger volume of the OBM to come into contact with the gas bearing formation.
Also, the gas diffusion process is driven by the high partial pressure of the formation gas
compared to the low partial pressure of gas in the OBM so while increased overbalance
caused by mud weight increases would influence diffusion, it would not be significant
(Bradley et al., 2002).

87
Chapter 4: Identification, Mitigation, and Prevention of Wellbore
Breathing
4.1 Identification of Wellbore Breathing
This section will discuss identification of wellbore breathing, differentiation
between breathing and kicks, and time dependent variables which tend to inhibit
identification at surface. In addition, the section also details methods for drilling ahead
once wellbore breathing has been identified.
4.1.1 Flowback Fingerprinting
Flowback fingerprinting involves recording the mud returns to the pits following
pump shut offs at connections and using these to develop a flowback “fingerprint” or
“signature” which can be used to identify any abnormalities in flowback going forward.
The primary abnormality being monitored for is an increase in either the rate of flowback
or the total volume of flowback as this would indicate an influx or wellbore breathing had
occurred. The typical method for this involves the mud logger plotting the flowback rate
or cumulative pit gain versus time for each connection as can be seen in Figure 4.1. The
mud logger then uses these plots to characterize the flowbacks, estimates the threshold of
an abnormal flowback based on past experience, and manually sets an alarm at this
threshold (Ali et al., 2013). While this has been successfully implemented to identify
influxes in the past (Weisinger et al., 2000), it introduces the potential for human error in
the quantification of an abnormal flowback. For example, on the Gulf of Mexico well
displayed in Figure 4.1, the alarm was set at too high of a level which resulted in completely
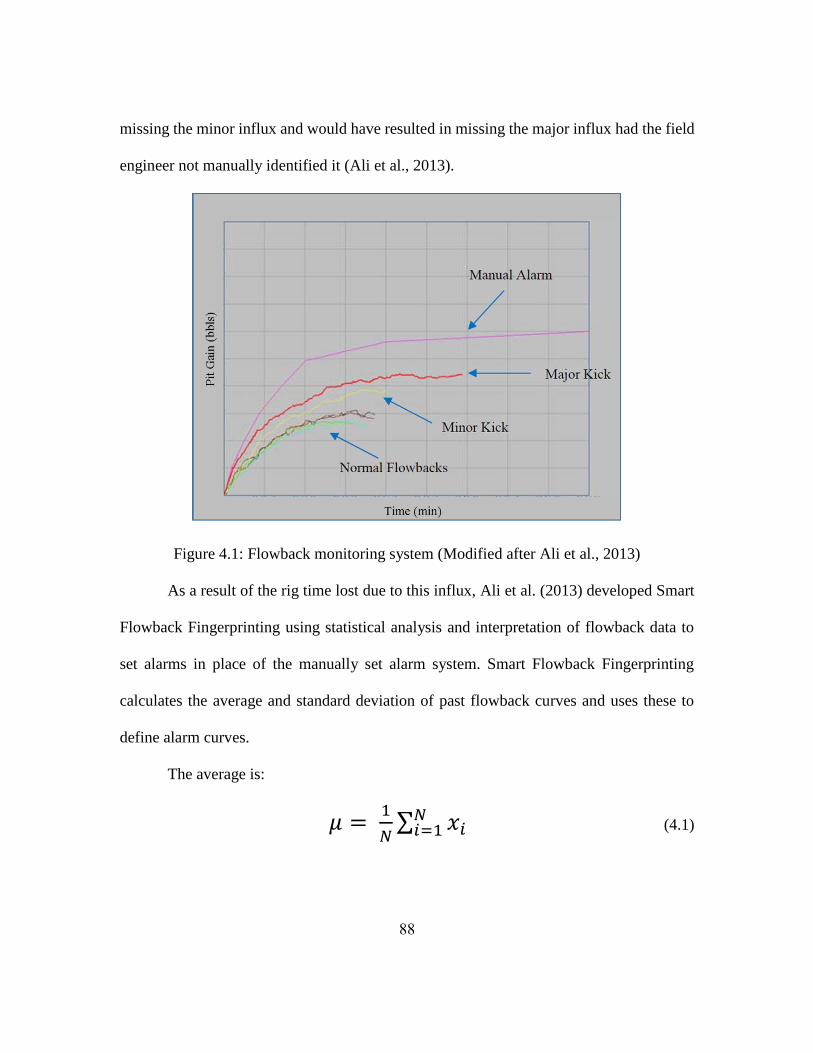
88
missing the minor influx and would have resulted in missing the major influx had the field
engineer not manually identified it (Ali et al., 2013).
Figure 4.1: Flowback monitoring system (Modified after Ali et al., 2013)
As a result of the rig time lost due to this influx, Ali et al. (2013) developed Smart
Flowback Fingerprinting using statistical analysis and interpretation of flowback data to
set alarms in place of the manually set alarm system. Smart Flowback Fingerprinting
calculates the average and standard deviation of past flowback curves and uses these to
define alarm curves.
The average is:
𝜇 = 1
𝑁∑ 𝑥𝑖
𝑁𝑖=1 (4.1)

89
And the standard deviation is:
𝜎 = √1
𝑁∑ (𝑥𝑖 − 𝜇)2𝑁
𝑖=1 (4.2)
Where,
𝑥1, 𝑥2 … . . 𝑥𝑁 = the last N flowbacks
The alarm can then be set at whichever multiple of the standard deviation is desired.
Ali et al. (2013) states that 95 % of all previous flowbacks fell within two standard
deviations of the mean for the well examined and the system would have caught the minor
kick within 70 seconds and the major kick immediately as shown in Figure 4.2.
Figure 4.2: Smart Flowback System plot (Ali et al., 2013)
90
While this Smart Flowback Fingerprinting system was developed primarily for
identification of kicks, it would also identify the initiation of wellbore breathing as
flowback volumes would increase. On the initial increased flowback, it would be difficult
to determine whether an influx or breathing had occurred so a flow check would likely be
required. Following the identification of wellbore breathing, flowback fingerprinting could
also be useful. In this case, the wellbore breathing flowback would be characterized and
the Smart Flowback Fingerprinting system could identify increased flowback indicating a
kick had occurred or a decreased flowback indicating that lost circulation had been
initiated.
4.1.2 Pressure While Drilling Measurements
Ward and Clark (1998) first introduced the pressure while drilling (PWD) tool as a
means to differentiate between wellbore breathing and an influx occurring. Data from
connections on a Gulf of Mexico well, which can be seen below in Figure 4.3, was
presented to show the downhole pressure behavior in time during wellbore breathing. The
left side of Figure 4.3 shows the downhole pressure behavior of a well during a typical
connection. When the pumps are shut off, the pressure immediately drops from the ECD
of 16.26 ppg to the ESD of 15.92 ppg. When the pumps are brought back on after making
the connection, the pressure immediately returns the ECD of 16.26 ppg. The right side of
Figure 4.3 shows the downhole pressure response of the same well during a connection
once wellbore breathing has started. When the pumps are shut off, there is a gradual
decrease in pressure from the ECD to the ESD rather than the immediate drop seen on the
conventional connection. The gradual pressure decline is due to mud flowing out of the

91
fractures and back into the wellbore, preventing the rapid decrease seen without breathing
(Ward and Clark, 1998). When the pumps are started back up, there is a gradual increase
back to the ECD due to fluid flowing back into the fractures. As can be seen, the pressure
profile for the connection without breathing is square shaped whereas the pressure profile
with breathing exhibits more of an irregular rounded shape. These pressure profiles make
for easy identification of breathing and the rounded pressure profile is often call a “shark
fin” profile due to its obvious resemblance.
Figure 4.3: (a.) Pressure behavior during conventional connection. (b.) Pressure behavior
during connection with breathing. (Ward and Clark, 1998)
The primary issue with the application of PWD for identification of wellbore
breathing while drilling, is the inability to get real-time data to surface. Currently, the
92
widely used technology for transmitting downhole data to surface is mud pulse telemetry
(MPT), which creates pressure pulses as mud flows through the drill string to transmit the
data. The primary drawbacks to this system include: no data transmission when pumps are
off, difficulty in transmitting data in extremely deep wells, and limited bandwidth
(McCartney et al., 2009). Due to these drawbacks, large amounts of data must be stored in
memory downhole and downloaded whenever the BHA is brought back to surface. As a
result, the analyzation method described by Ward and Clark (1998) cannot be performed
until the data is downloaded at surface. Therefore, while useful in the characterization of
the wellbore breathing mechanism, this method is not suitable for real-time differentiation
of kicks and breathing events using the current industry standard MPT system.
One additional method for identification of wellbore breathing would be to
perform step rate changes in fluid circulation rates while monitoring PWD measurements.
A step down in flow rate would decrease the ECD similarly but to less of an extent than at
connections and data could still be transmitted to surface through the flowing mud stream.
If breathing were occurring, the reduction in ECD would allow some fluid to flow back
into the wellbore and the downhole pressure should exhibit a rounded profile as it
transitions to a lower pressure. Conversely, if no breathing were occurring, the transition
should be more of an abrupt drop to the lower pressure. The primary issue with this
approach would be the minimum flow rate required to transmit data to surface in a MPT
system. If the circulation rate being used during drilling was not significantly higher than
the minimum rate, the step down in pressure would be small and likely inhibit
differentiation between a square or rounded transition profile.
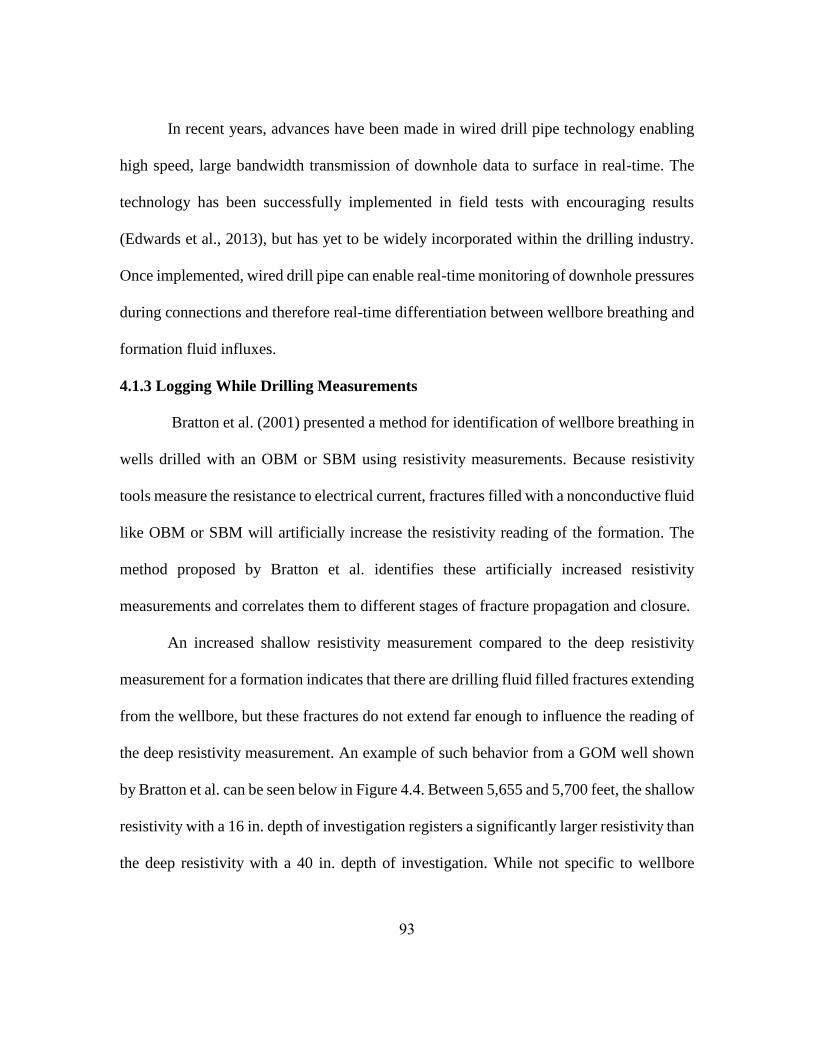
93
In recent years, advances have been made in wired drill pipe technology enabling
high speed, large bandwidth transmission of downhole data to surface in real-time. The
technology has been successfully implemented in field tests with encouraging results
(Edwards et al., 2013), but has yet to be widely incorporated within the drilling industry.
Once implemented, wired drill pipe can enable real-time monitoring of downhole pressures
during connections and therefore real-time differentiation between wellbore breathing and
formation fluid influxes.
4.1.3 Logging While Drilling Measurements
Bratton et al. (2001) presented a method for identification of wellbore breathing in
wells drilled with an OBM or SBM using resistivity measurements. Because resistivity
tools measure the resistance to electrical current, fractures filled with a nonconductive fluid
like OBM or SBM will artificially increase the resistivity reading of the formation. The
method proposed by Bratton et al. identifies these artificially increased resistivity
measurements and correlates them to different stages of fracture propagation and closure.
An increased shallow resistivity measurement compared to the deep resistivity
measurement for a formation indicates that there are drilling fluid filled fractures extending
from the wellbore, but these fractures do not extend far enough to influence the reading of
the deep resistivity measurement. An example of such behavior from a GOM well shown
by Bratton et al. can be seen below in Figure 4.4. Between 5,655 and 5,700 feet, the shallow
resistivity with a 16 in. depth of investigation registers a significantly larger resistivity than
the deep resistivity with a 40 in. depth of investigation. While not specific to wellbore
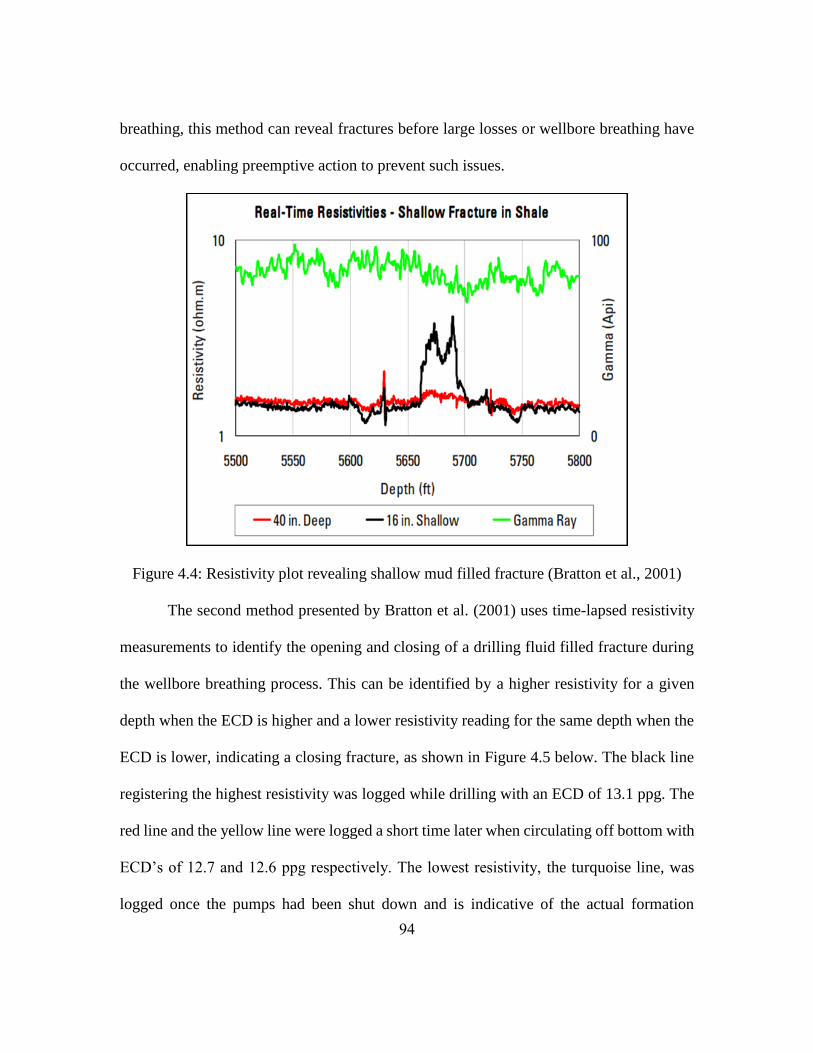
94
breathing, this method can reveal fractures before large losses or wellbore breathing have
occurred, enabling preemptive action to prevent such issues.
Figure 4.4: Resistivity plot revealing shallow mud filled fracture (Bratton et al., 2001)
The second method presented by Bratton et al. (2001) uses time-lapsed resistivity
measurements to identify the opening and closing of a drilling fluid filled fracture during
the wellbore breathing process. This can be identified by a higher resistivity for a given
depth when the ECD is higher and a lower resistivity reading for the same depth when the
ECD is lower, indicating a closing fracture, as shown in Figure 4.5 below. The black line
registering the highest resistivity was logged while drilling with an ECD of 13.1 ppg. The
red line and the yellow line were logged a short time later when circulating off bottom with
ECD’s of 12.7 and 12.6 ppg respectively. The lowest resistivity, the turquoise line, was
logged once the pumps had been shut down and is indicative of the actual formation
95
resistivity. The graphic at the bottom of the figure depicts the fracture closing as the
wellbore pressure is reduced and is color coded to correspond with the respective resistivity
measurement for each stage of fracture closure.
Figure 4.5: Time-lapsed resistivity plot showing fracture closure (Bratton et al., 2001)
While using resistivity measurements to identify wellbore breathing and shallow
wellbore fractures can be effective in some cases, there are a few limitations worth
mentioning. Similar to the PWD tool, LWD tools also rely on mud pulse telemetry to
transmit data so real-time resistivity logs would only be available at surface when
circulating. Additionally, it may be difficult to identify the closure of a fracture if it has
been propagated a significant distance away from the wellbore and outside the depth of
investigation for the resistivity tool. In this case, some fracture closure could occur near
96
the fracture tip but this would likely have little effect on a resistivity measurement taken
closer to the wellbore. Last, unless LWD is being employed specifically to identify and
locate wellbore breathing, sections of the wellbore are not typically logged multiple times
with different ECD’s.
4.1.4 Time and Temperature Dependent Variables
Time and temperature dependent effects are often unaccounted for or neglected
during drilling operations and can lead to misidentification of the downhole mechanism
responsible for processes observed at surface. This section details these variables and
provides examples from published case studies to demonstrate the effects these variables
can have in regards to wellbore breathing.
4.1.4.1 Thermally Induced Stress Changes due to Drilling Fluid Temperatures
Thermal effects on stresses around the wellbore can have a significant effect on the
effective fracture gradients of formations. These thermal effects are extremely important
in HPHT wells, especially when the conditions at surface are cold. This is because the cold
mud from surface will result in a significant reduction in the formation temperature and
hoop stress, as shown in equation 2.4. Alaska and North Sea wells often exhibit these
conditions and care should be taken to monitor drilling fluid temperatures in such
environments. When drilling a hole-section, the mud circulated into the well from surface
is significantly cooler than the in-situ temperature of the formation. This results in cooling
of the formation in the lower portion of the well near the bit and warming of the formation
higher up in the wellbore (Karstad, 1998) as shown in Figure 4.6.
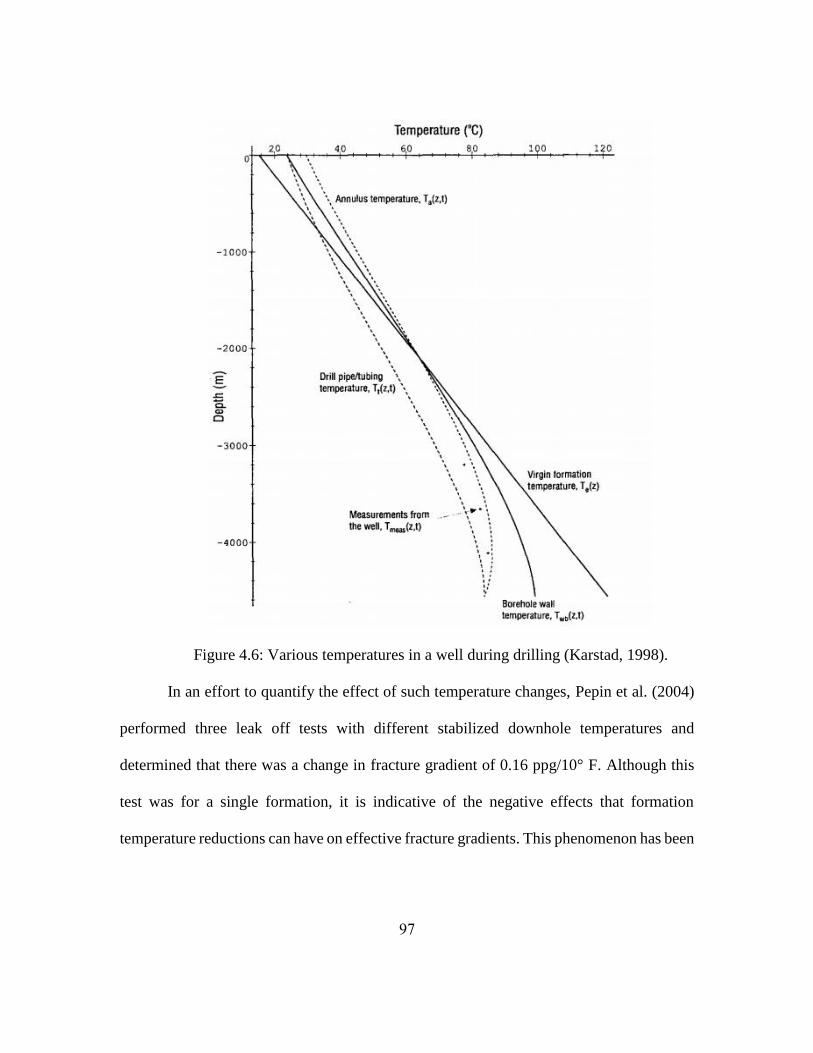
97
Figure 4.6: Various temperatures in a well during drilling (Karstad, 1998).
In an effort to quantify the effect of such temperature changes, Pepin et al. (2004)
performed three leak off tests with different stabilized downhole temperatures and
determined that there was a change in fracture gradient of 0.16 ppg/10° F. Although this
test was for a single formation, it is indicative of the negative effects that formation
temperature reductions can have on effective fracture gradients. This phenomenon has been
98
well documented in literature (Schmidt et al. 1999) and can be approximated for a given
formation using a linear elastic model (Fjaer et al., 2008).
Δ𝜎𝑡 =𝐸 ∝𝑡(𝑇−𝑇𝑓)
1−𝜐 (4.3)
where,
E = Young’s Modulus
∝𝑡 = linear thermal expansion coefficient
𝜐 = Poisson’s Ratio
𝑇𝑓 = original formation temperature
While most literature pertaining to reductions in fracture gradients due to thermal
effects have focused on lost circulation events, thermal effects can also contribute to
wellbore breathing. The North Sea case study detailed earlier in this work by Maury and
Idelovici (1995) discussed a wellbore breathing event believed to be entirely driven by
thermal stress changes. In this case, the mud losses were likely very hard to identify
because cooling of additional extents of the formation would be required each time the
fracture propagated, making it a slow and gradual process. Also, the formation would
need to warm back up in order for the fracture gradient to increase and cause mud
backflows. This delays the gains significantly from the losses, making identification of
the thermal mechanism responsible extremely difficult.
In cases where the fracture gradient is initially higher than the wellbore pressure
until it has been sufficiently cooled by drilling fluid, the fracture would initiate up-hole
from the bit. This is because the portion of the wellbore wall cooled most by the drilling
99
fluid occurs uphole of the bit, as shown in Figure 4.6. This will make identification of the
loss zone difficult as it would likely be diagnosed as occurring in the formation closest to
the bit. This can lead to difficulties in remediation as LCM and cross-linked pills
typically need to be placed across the loss interval to be effective.
Last, the casing shoe is usually identified as the weakest point in the open-hole
section as the minimum horizontal stress is related to the overburden and typically
increases with depth (Zoback, 2007). Therefore, the maximum pressure from the FIT or
LOT performed at the casing shoe defines the upper limit of mud weight that can be used
in the hole-section. However, this does not take into account thermal effects which may
alter the strength of the formation at the casing shoe either during the LOT or afterwards,
as the hole is being deepened. As shown by Karstad in Figure 4.6, the borehole wall’s
temperature actually increases in the upper part of the well during drilling as mud that
was warmed near the bottom hole is circulated up the annulus. Depending on the length
of a given hole-section, the casing shoe may see an increase in temperature which would
raise its effective fracture gradient. This would likely invalidate the assumption that the
casing shoe is the weakest point in the wellbore and could increase or decrease the
effective fracture gradient for the wellbore, depending on rock properties and thermal
effects elsewhere in the hole-section.
4.1.4.2 Downhole Pressure Variations
Another variable, which is often unaccounted for, are increases in annular
pressure which periodically occur during drilling operations. Typical causes for such
pressure increases include increased cuttings loading, barite sag, or restrictions in the
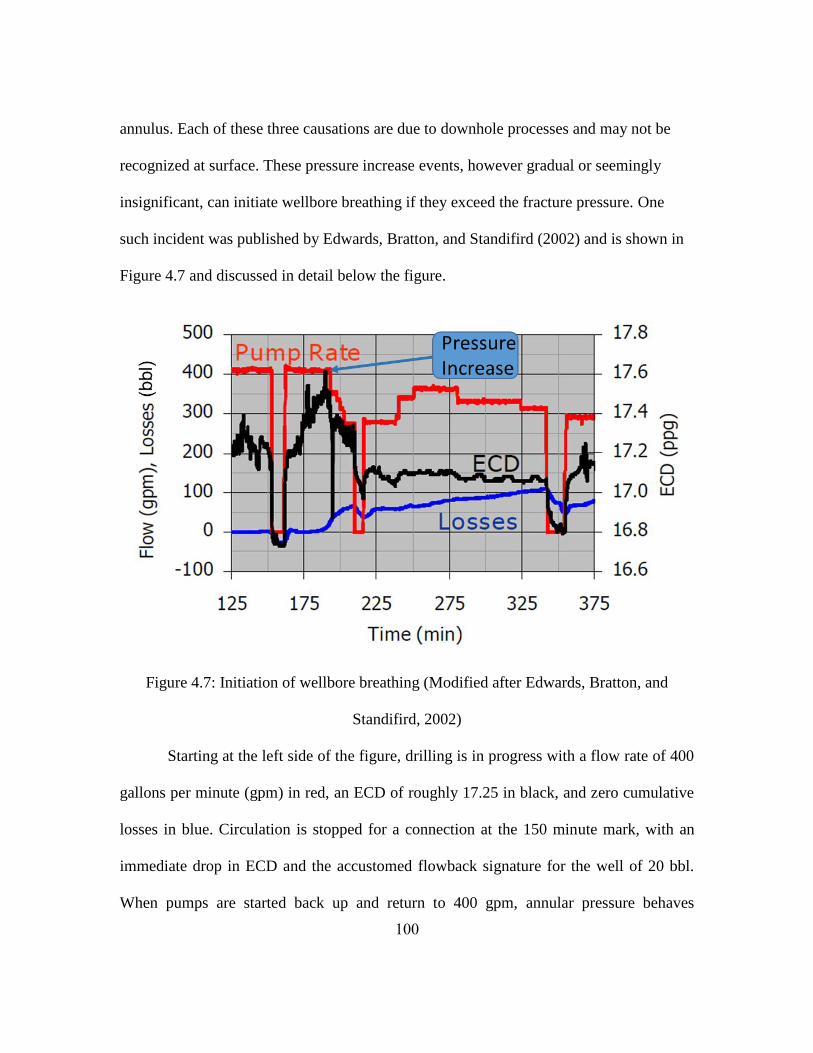
100
annulus. Each of these three causations are due to downhole processes and may not be
recognized at surface. These pressure increase events, however gradual or seemingly
insignificant, can initiate wellbore breathing if they exceed the fracture pressure. One
such incident was published by Edwards, Bratton, and Standifird (2002) and is shown in
Figure 4.7 and discussed in detail below the figure.
Figure 4.7: Initiation of wellbore breathing (Modified after Edwards, Bratton, and
Standifird, 2002)
Starting at the left side of the figure, drilling is in progress with a flow rate of 400
gallons per minute (gpm) in red, an ECD of roughly 17.25 in black, and zero cumulative
losses in blue. Circulation is stopped for a connection at the 150 minute mark, with an
immediate drop in ECD and the accustomed flowback signature for the well of 20 bbl.
When pumps are started back up and return to 400 gpm, annular pressure behaves
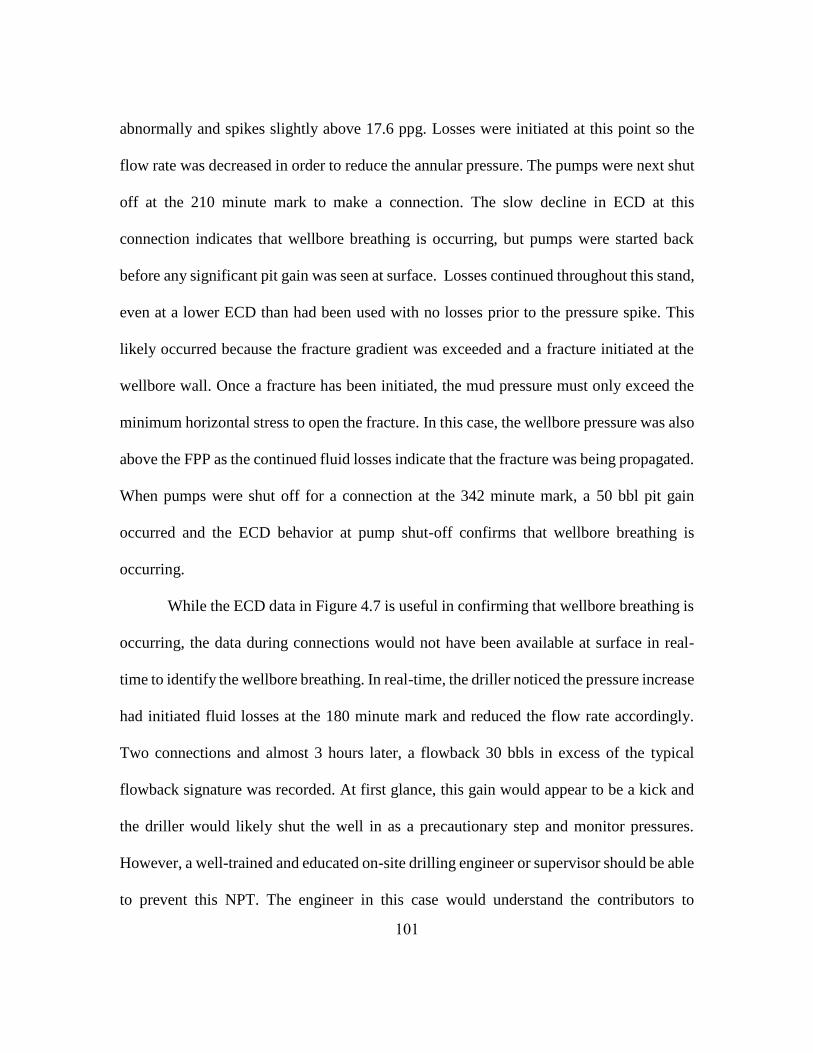
101
abnormally and spikes slightly above 17.6 ppg. Losses were initiated at this point so the
flow rate was decreased in order to reduce the annular pressure. The pumps were next shut
off at the 210 minute mark to make a connection. The slow decline in ECD at this
connection indicates that wellbore breathing is occurring, but pumps were started back
before any significant pit gain was seen at surface. Losses continued throughout this stand,
even at a lower ECD than had been used with no losses prior to the pressure spike. This
likely occurred because the fracture gradient was exceeded and a fracture initiated at the
wellbore wall. Once a fracture has been initiated, the mud pressure must only exceed the
minimum horizontal stress to open the fracture. In this case, the wellbore pressure was also
above the FPP as the continued fluid losses indicate that the fracture was being propagated.
When pumps were shut off for a connection at the 342 minute mark, a 50 bbl pit gain
occurred and the ECD behavior at pump shut-off confirms that wellbore breathing is
occurring.
While the ECD data in Figure 4.7 is useful in confirming that wellbore breathing is
occurring, the data during connections would not have been available at surface in real-
time to identify the wellbore breathing. In real-time, the driller noticed the pressure increase
had initiated fluid losses at the 180 minute mark and reduced the flow rate accordingly.
Two connections and almost 3 hours later, a flowback 30 bbls in excess of the typical
flowback signature was recorded. At first glance, this gain would appear to be a kick and
the driller would likely shut the well in as a precautionary step and monitor pressures.
However, a well-trained and educated on-site drilling engineer or supervisor should be able
to prevent this NPT. The engineer in this case would understand the contributors to

102
wellbore breathing, anticipate that it is a possibility in this situation, and institute a method
for quick differentiation between a kick and breathing prior to the fluid gain.
4.1.5 Differentiation between Underbalance and Breathing
The most challenging aspect of dealing with wellbore breathing in drilling
operations is that it exhibits characteristics very similar to those exhibited in an
underbalanced or near balanced well. These similarities include pit gains, significant
pressure build ups when shut in, gas cuts corresponding to connections, and hydrocarbon
influxes in some cases. Key identifiers for differentiation between wellbore breathing and
underbalance conditions will be discussed in this section.
4.1.5.1 SIDPP and SICP Behavior
Once a pit gain or excess flow from the well has been detected, shutting in the well
via the BOP is often the next step. Once the SIDPP and SICP have stabilized, it is necessary
to verify that these shut-in pressures are not being artificially increased due to trapped
pressure. Artificially increased shut in pressures would result in an erroneous kill mud
weight calculation. In addition to monitoring the SIDPP for the pressure response while
performing bleed offs as mentioned in 2.6.11, the SICP should be monitored as well. Since
the SIDPP is a direct measure of formation pressure, a reduction in SIDPP to zero during
bleed off indicates that the well is not in an underbalanced state. This is the key indicator
that underbalance is not the influx mechanism and should be a “red flag” that some other
process is be taking place downhole. Three different potential shut-in scenarios are
examined in detail here to enable better understanding of the SIDPP and SICP behavior
they exhibit:
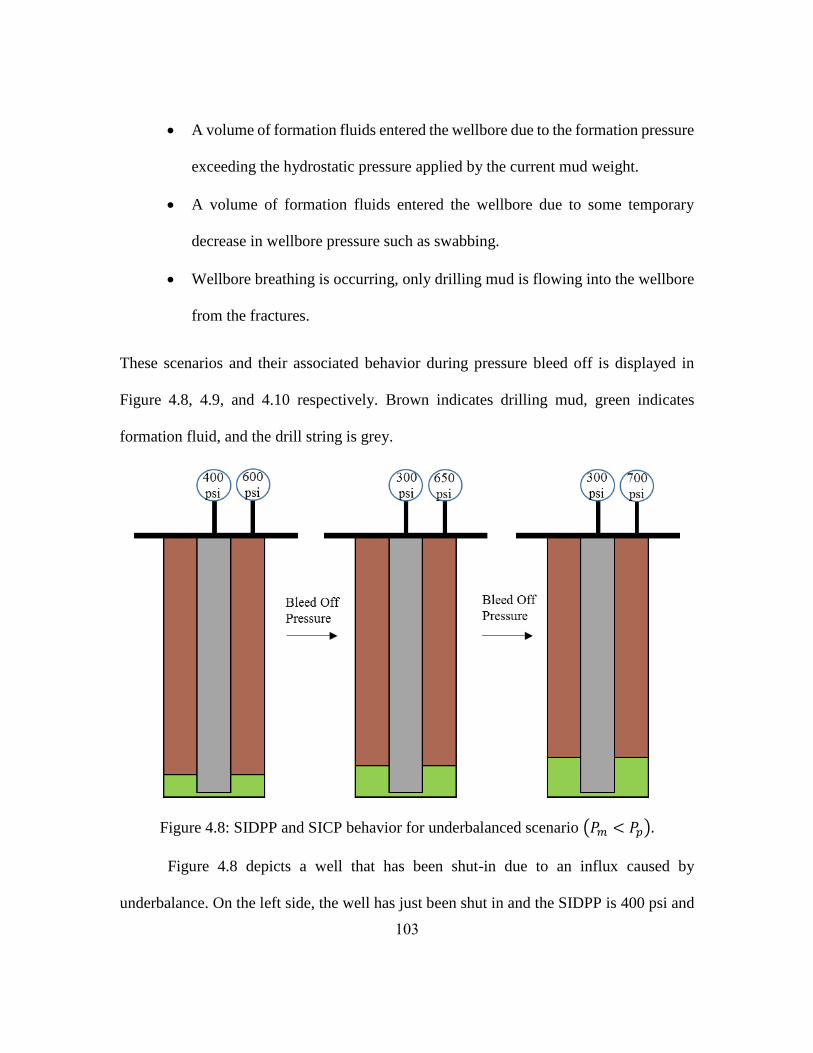
103
A volume of formation fluids entered the wellbore due to the formation pressure
exceeding the hydrostatic pressure applied by the current mud weight.
A volume of formation fluids entered the wellbore due to some temporary
decrease in wellbore pressure such as swabbing.
Wellbore breathing is occurring, only drilling mud is flowing into the wellbore
from the fractures.
These scenarios and their associated behavior during pressure bleed off is displayed in
Figure 4.8, 4.9, and 4.10 respectively. Brown indicates drilling mud, green indicates
formation fluid, and the drill string is grey.
Figure 4.8: SIDPP and SICP behavior for underbalanced scenario (𝑃𝑚 < 𝑃𝑝).
Figure 4.8 depicts a well that has been shut-in due to an influx caused by
underbalance. On the left side, the well has just been shut in and the SIDPP is 400 psi and
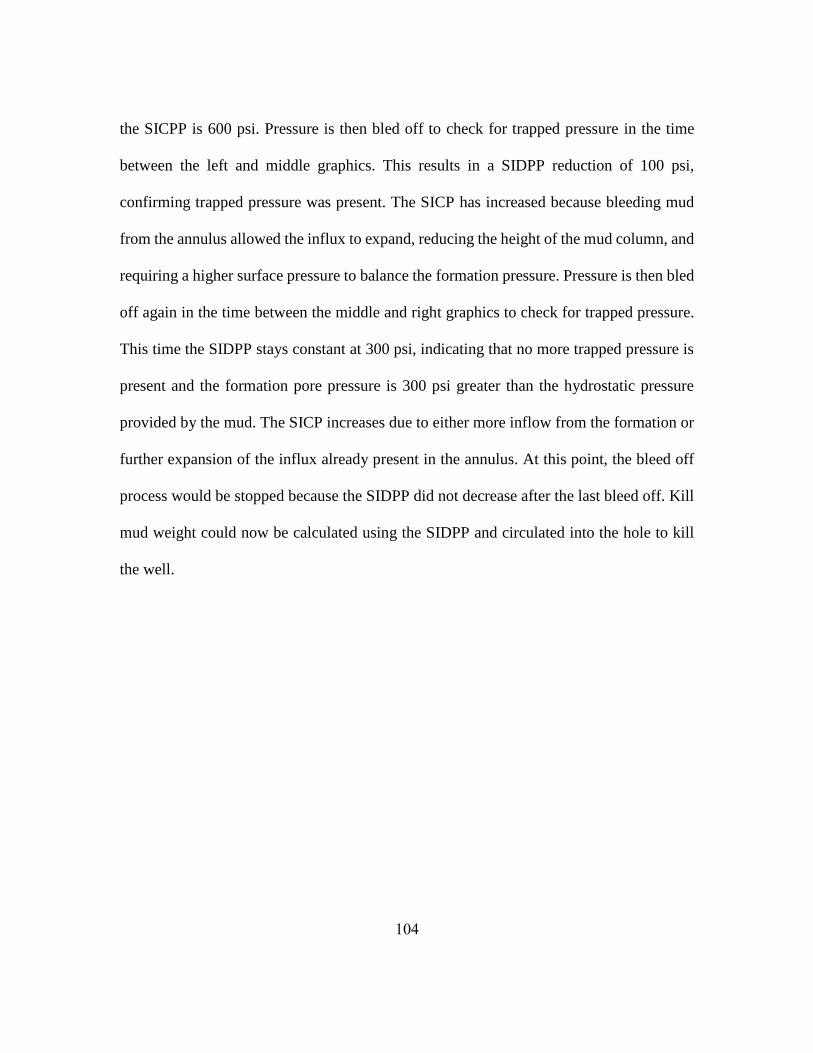
104
the SICPP is 600 psi. Pressure is then bled off to check for trapped pressure in the time
between the left and middle graphics. This results in a SIDPP reduction of 100 psi,
confirming trapped pressure was present. The SICP has increased because bleeding mud
from the annulus allowed the influx to expand, reducing the height of the mud column, and
requiring a higher surface pressure to balance the formation pressure. Pressure is then bled
off again in the time between the middle and right graphics to check for trapped pressure.
This time the SIDPP stays constant at 300 psi, indicating that no more trapped pressure is
present and the formation pore pressure is 300 psi greater than the hydrostatic pressure
provided by the mud. The SICP increases due to either more inflow from the formation or
further expansion of the influx already present in the annulus. At this point, the bleed off
process would be stopped because the SIDPP did not decrease after the last bleed off. Kill
mud weight could now be calculated using the SIDPP and circulated into the hole to kill
the well.
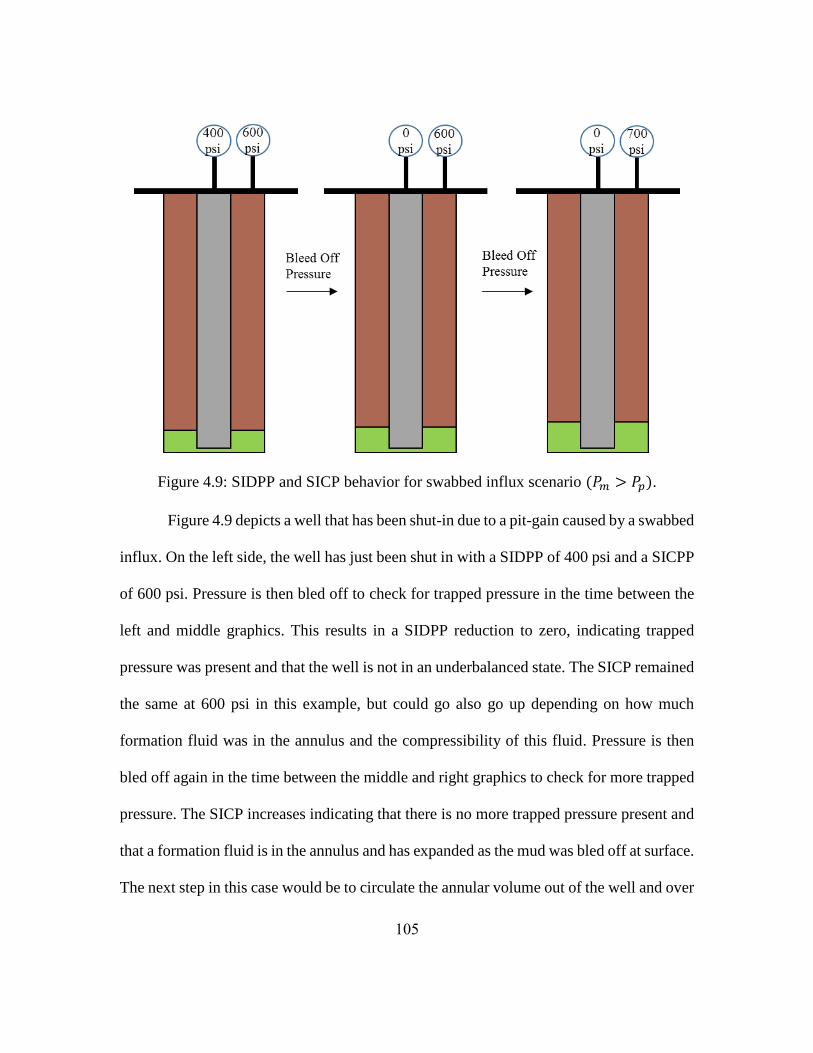
105
Figure 4.9: SIDPP and SICP behavior for swabbed influx scenario (𝑃𝑚 > 𝑃𝑝).
Figure 4.9 depicts a well that has been shut-in due to a pit-gain caused by a swabbed
influx. On the left side, the well has just been shut in with a SIDPP of 400 psi and a SICPP
of 600 psi. Pressure is then bled off to check for trapped pressure in the time between the
left and middle graphics. This results in a SIDPP reduction to zero, indicating trapped
pressure was present and that the well is not in an underbalanced state. The SICP remained
the same at 600 psi in this example, but could go also go up depending on how much
formation fluid was in the annulus and the compressibility of this fluid. Pressure is then
bled off again in the time between the middle and right graphics to check for more trapped
pressure. The SICP increases indicating that there is no more trapped pressure present and
that a formation fluid is in the annulus and has expanded as the mud was bled off at surface.
The next step in this case would be to circulate the annular volume out of the well and over
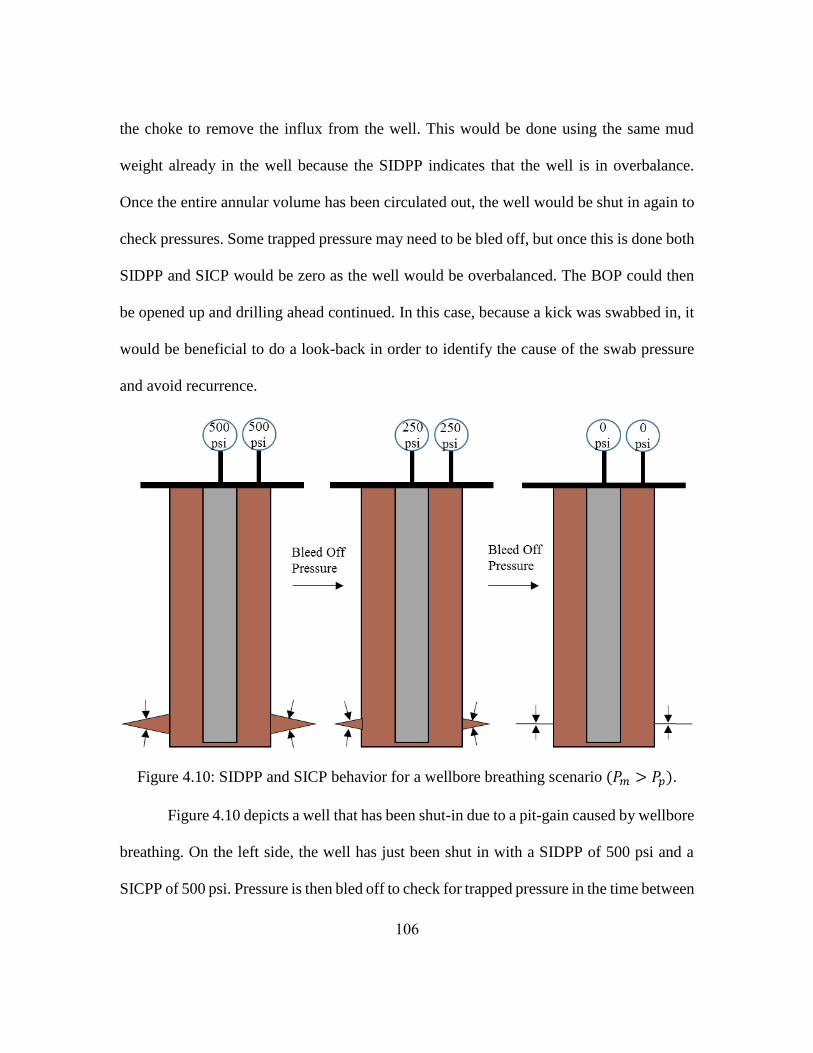
106
the choke to remove the influx from the well. This would be done using the same mud
weight already in the well because the SIDPP indicates that the well is in overbalance.
Once the entire annular volume has been circulated out, the well would be shut in again to
check pressures. Some trapped pressure may need to be bled off, but once this is done both
SIDPP and SICP would be zero as the well would be overbalanced. The BOP could then
be opened up and drilling ahead continued. In this case, because a kick was swabbed in, it
would be beneficial to do a look-back in order to identify the cause of the swab pressure
and avoid recurrence.
Figure 4.10: SIDPP and SICP behavior for a wellbore breathing scenario (𝑃𝑚 > 𝑃𝑝).
Figure 4.10 depicts a well that has been shut-in due to a pit-gain caused by wellbore
breathing. On the left side, the well has just been shut in with a SIDPP of 500 psi and a
SICPP of 500 psi. Pressure is then bled off to check for trapped pressure in the time between
107
the left and middle graphics. The SIDPP is reduced to 250 psi through bleed off indicating
that trapped pressure was present. In this case, the reduction in pressure is due to the
fractures closing somewhat. The implicit assumption here, is that the rock behaves in a
linear elastic manner: When fluid flows out of the fracture, the rock becomes less deformed,
and therefore applies a lower stress (or pressure) at the fracture interface between the rock
and drilling fluid. The SICP is also reduced to 250 psi during bleed off. Pressure bleed off
is then continued in the time between the middle and right graphics. The SIDPP is reduced
to zero indicating that the well is not underbalanced. The SICP is also reduced to zero. This
indicates that the annular fluid column is also of sufficient density to balance downhole
pressures, suggesting the column is composed completely of mud and no formation fluid
entered the wellbore. In this scenario, losses should have also been recorded during drilling
prior to shut-in and this can be used as another means to verify that wellbore breathing is
occurring.
At this point, the well is static so drilling ahead could continue. However, since
there was a pit gain at surface, the well would often be circulated bottoms up as a safety
precaution to confirm that no influx occurred. Regardless of which approach was taken,
some fluid losses would occur while circulating and another pit gain would occur whenever
the pumps were shut off. If the losses were noticed while circulating, the following gain
would be further evidence indicating wellbore breathing was taking place. The well may
also be shut in again when the pit gain occurs. In this case, a similar bleed off process to
the one described in the last paragraph would be observed indicating that wellbore
breathing is occurring. Going forward, the mud weight or flow rate could be lowered, if
108
possible, or the wellbore breathing connections flow backs could be fingerprinted similar
to the process described in section 4.1.1.
In the case where hydrocarbon swap out occurred coupled with wellbore breathing,
interpretation of shut-in pressures could prove to be more difficult. In this instance, an
iterative approach would be required to identify the wellbore breathing coupled with
hydrocarbon swap out mechanism. The shut-in pressure behavior during bleed off would
be similar to the swabbed kick scenario shown in Figure 4.9, but the shut-in pressures after
circulation of the influx out of the well would not be zero. In this case, another influx would
enter the well via the hydrocarbon swap out mechanism when the pumps are shut off and
the shut-in pressure behavior during bleed off similar to that shown in Figure 4.9 would
occur again. Therefore, repetitive shut-in pressure bleed off scenarios where the SIDPP
pressure is reduced to zero and the SICP is non zero, would indicate that wellbore breathing
coupled with hydrocarbon swap out is occurring. A reduction in mud weight could then be
used to verify if this is indeed the mechanism responsible; a reduced mud weight should
lessen or eliminate the wellbore breathing and hydrocarbon swap out mechanism.
It is important to note that the three step diagrams used in this section are simplified
for ease of presentation in this format. The process of bleeding off shut-in pressures at
surface is a slow methodical process. It involves letting small fluid volumes out of the well
and then monitoring the pressure build up once the flow is stopped. If the SIDPP pressure
decreases and does not rise back to its previous value, the process is repeated. In the case
of a breathing wellbore as depicted in Figure 4.10, all the drilling fluid in the fracture would
need to flow back into the wellbore during the bleed off process. When each bleed off
109
sequence only allows a barrel or two out of the wellbore, the process will take a significant
amount of time. Also, if only a barrel or two of fluid is flowing out of the fracture in each
of these sequences, the reduction in pressure associated with the fracture closing would be
relatively small and therefore difficult to notice in surface pressures. This is a possible
explanation for some of the difficulty in differentiating between wellbore breathing and
kicks when shut in.
4.1.5.2 Pressure Bleed Off Volumes
The volumes required to bleed off trapped pressure after shutting in the well can be
key in differentiating between wellbore breathing and a kick. These volumes are typically
expressed in terms of the volume of mud flowed from the well in order to cause a 100 psi
drop in the shut-in pressure or (bbl 100 psi)⁄ . Field experience has shown that the bleed off
volumes for wells experiencing wellbore breathing are significantly larger than the
compressibility data from up-hole LOT’s would suggest: Ashley (2000) experienced bleed
off volumes of 10 (bbl 100 psi)⁄ in comparison to the expected 0.5 (bbl 100 psi)⁄ and Lage
et al. (2002) experienced bleed off volumes of 3.25 (bbl 100 psi)⁄ in comparison to the
expected 0.4125 (bbl 100 psi)⁄ .
This significant difference between bleed back volumes is due to the increased size
of the system that is being decompressed in a breathing wellbore. In a conventional well
control situation, the system that would be decompressed in the bleed off process includes
the fluid in the wellbore, the casing strings and cement behind them, and the formation
itself in the open hole-section. Whereas in the case of wellbore breathing, the system
includes the fluid in the wellbore, the casing strings and cement behind them, the formation
110
itself in the open hole-section, the fluid that is in the fractures, and the portion of the
formation which has been compressed due to the aperture of the fracture.
4.1.5.3 Connection Gas and Mud Weight Correlation
During drilling, increased connection gas is associated with the static wellbore
pressure being at or below the formation pore pressure, which allows some formation fluids
to enter the wellbore (Alberty and Fink, 2014). The appropriate response is to raise the mud
weight because this would place the well back into overbalance at connections when pumps
are off. Once the mud weight has been increased, inflow from the formation during
connections should stop and therefore the associated connection gas reduced. If however,
the connection gas continues unabated or increases with increased mud weight, this should
be a “red flag” that wellbore breathing is taking place.
There are two mechanisms, when coupled with wellbore breathing, which exhibit
these characteristics: hydrocarbon swap-out and gas diffusion into the drilling fluid while
in the fractures. Hydrocarbon swap-out can occur with WBM, OBM, or SBM and has no
temperature or pressure constraints. Gas diffusion on the other hand, will occur only when
drilling with an OBM or SBM system and is more likely to occur in high pressure and high
temperature (HPHT) conditions. In a WBM, gas diffusion will not occur quickly enough
to cause connection gas as gas solubility in water is very small (Bradley et al., 2002). Along
the same lines, gas diffusion related connection gas can be significant in HPHT wells
drilled with OBM or SBM systems because methane is infinitely soluble in these conditions
and substantial amounts of gas can be dissolved into the mud (Bradley et al., 2002).
Regardless of which of these specific mechanisms is coupled with wellbore breathing, the

111
appropriate response is to reduce the mud weight because this will reduce the wellbore
breathing effect. A reduction in the wellbore breathing effect will reduce the amount of
fluid in the fracture system and therefore reduce the effects of either hydrocarbon swap-
out or gas diffusion, whichever is occurring.
4.1.5.4 PWD Measurements
The best solution to reduce the effects of wellbore breathing, a reduction in mud
weight, is often not possible due to high pore pressures. In these cases, drilling ahead is
continued with the current mud weight, resulting in losses while drilling and large pit gains
at connections. These large pit gains, anywhere from 25 to 350 barrels (Tare, Whitfill, and
Mody, 2001), can easily mask a kick occurring during a connection. However, a PWD tool
could be used to detect these kicks by monitoring for any changes in circulating density.
Once pumps are started up after a connection, the ECD measured by the PWD tool
can be used to infer whether an influx has taken place as long as circulating conditions are
the same as before the connection. In this case, the ECD returning and stabilizing at the
same pre-connection value would indicate that no influx has occurred. However, if the
ECD were to stabilize at some value lower than the pre-connection ECD, this would
indicate an influx has occurred. This behavior is due to the fluid density in the annulus. If
a formation fluid influx were to occur during a connection, the density of the fluid column
would be lessened. If the fluid gain at the connection was mud flowing back into the well,
as occurs during wellbore breathing, the density of the fluid column would be unchanged.
112
4.2 Mitigation of Wellbore Breathing
This section focuses on methods for mitigation of wellbore breathing and its effects
while drilling. These approaches typically fall into two categories: (1) limitation of the
pressure fluctuations which cause fracture opening and closing or (2) mechanical limitation
or elimination of the underlying fracture opening and closing mechanism itself.
4.2.1 ECD Management
ECD management involves limiting the fluctuation between downhole pressures
during static conditions and during circulating conditions as well as the rate at which those
fluctuation occur. ECD management pertains primarily to operating procedures which can
be changed in real-time, but also includes changes in the well plan both while drilling and
pre-spud, if wellbore breathing is expected. A large driver of ECD is frictional losses in
the annulus so reduction in these frictional effects are a key aspect of ECD management.
These frictional losses are a function of fluid velocity, fluid density, and the flow area as
shown by Mitchell and Miska (2011):
∆𝑃𝑓𝑟𝑖𝑐𝑡𝑖𝑜𝑛 = 2 𝑓𝜌𝑣2
𝑑𝑎𝑛𝑛.−𝑑𝑑𝑝 (4.4)
Where,
f = Fanning friction factor
𝑑𝑎𝑛𝑛 = Diameter of annulus
𝑑𝑑𝑝 = Outer diameter of drill pipe
v = Fluid velocity
ρ = Fluid density
113
First, limiting the fluid velocity in the annulus will reduce frictional losses and can
be achieved by using reduced circulating rates. There are however limiting factors
pertaining to the magnitude of circulating rate reductions. Circulating rates need to be
maintained at a high enough rate to adequately clean the hole and move drill cuttings up
the annulus. Further, circulation rates also need to be maintained at a high enough level to
adequately cool the bit while drilling. Inadequate cooling of the bit can result in early bit
failure, which could prove costly over the course of a well due to both bit costs and
associated NPT. Last, circulating rates must be maintained at a high enough level to enable
downhole tools to transmit data to surface using mud pulse telemetry or they will be
effectively drilling blind.
Second, increasing the diameter of the annulus will increase its cross sectional area
and decrease frictional losses. Additionally, an increased annular cross section will
decrease the annular fluid velocity for a given flow rate, and therefore decrease frictional
losses. An increased flow area can be achieved during the pre-spud stage if breathing is
expected by designing the well with larger hole sizes and larger casing diameters. However,
increasing casing diameters can significantly increase the well cost and wellbore breathing
is often not expected until encountered while drilling. In real-time, once wellbore breathing
is encountered, the bit diameter size that can be used for a given hole-section is limited by
the diameter of the casing string set up-hole. However, a hydraulically activated reamer
could be run in the BHA above the bit, enabling a larger hole size to be drilled below the
limiting casing string. Hydraulically activated reamers consist of sets of rock cutting blades
and cutters similar to those found on the bit, which extend out from the BHA once a certain

114
flow rate has been exceeded. These extended blades cut away at the wellbore wall to create
a larger hole-section than the bit diameter alone could create.
In addition to altering the magnitude of the pressure fluctuations caused by ECD,
the rate at which those fluctuations occur can also be reduced. This can be done by staging
pump start up and shut down over a period of time, rather than bringing pumps to and from
circulating rates instantaneously. In this case, the fluid gains and losses at surface would
be more gradual. This is beneficial because it makes the gains easier to monitor at surface
and also dilutes the fluid exiting the fracture downhole. Dilution of this outflow is
advantageous because of the potential for hydrocarbons to be present in this flow. With a
staged pump shut down, these hydrocarbons would reach surface over a long period of time
rather than all at once.
Another method for ECD management is minimizing the increased fluid density
during drilling caused by cuttings suspended in the fluid. This can be accomplished by
control drilling to keep the rate of penetration below a designated threshold. This will
decrease the amount of drill cuttings in the annulus at a given time and therefore reduce
the density of the fluid column. Another potential approach would be to pause periodically
while drilling and circulate fluid to remove some of the cuttings laden drilling mud from
the annulus. This could be accomplished by circulating for periods before and after
connections and would work hand in hand with the staged pump start up and shut down
procedure mentioned earlier in this section. Both management of ROP and circulation for
periods around connections will increase the total drilling time for a section, increasing
costs.

115
4.2.2 Fracture Bridging/Plugging
While typically discussed as a response to severe lost circulation events, the
underlying fracture mechanism is similar and can be mitigated using similar approaches.
As it pertains to wellbore breathing, the goal is to isolate the fracture from the wellbore so
that fluid cannot flow into and out of the fracture or propagate the fracture. Some of the
typical products and techniques used include adding fibrous, flaky, or granular lost
circulation material (LCM) to the drilling fluid, placement of a cross-linked polymer and
fibrous material blend across the loss zone, and in extreme cases pumping a cement plug
into the wellbore in the area where losses are occurring.
An advantage to the approach of adding LCM to the drilling fluid is that the LCM
will contact the entire annulus. It can therefore be successful in the plugging of fractures
without exact identification of the loss zone. However, shear degradation of the LCM
particles during circulation and removal of the LCM particles from the mud by the solids
control equipment can limit the effectiveness of this approach (van Oort et al., 2009).
An advantage to using the cross-linked polymer mixture is the speed with which it
can be applied. The polymer and fibrous material can be pre-mixed and stored at surface
so that only the cross-linker needs to be added and it can be pumped downhole after 5
minutes of mixing (Caughron et al., 2002). This is useful because it could be applied
whenever wellbore breathing is first identified and therefore limit the extent to which the
fracture is propagated. In the case of wellbore breathing, it would likely be necessary to
bullhead the cross linked mixture into the fractures because fluid is not flowing into the
fractures at static conditions, like in a lost circulation situation. Bullheading is the process
116
of shutting in the well and pumping fluid down the drill pipe to force fluid, or bullhead,
into the formation. The primary disadvantage with the cross-linked polymer mixture is that
it is a spot treatment. Therefore, the exact zone where wellbore breathing is occurring needs
to be properly identified to enable a successful treatment.
In extreme wellbore breathing and lost circulation cases where one or both of the
aforementioned approaches fail, a cement plug can be pumped into the fractured zone and
allowed to set. The cement will penetrate into the fractures filling and sealing off the system
and once set, the plug left in the wellbore is drilled out (Low, Daccord, and Bedel, 2003).
While pumping cement can be an effective approach to eliminate wellbore breathing, it can
be very expensive due to the volume of cement required to pump as well as the rig time
spent waiting on the cement to set. Additionally, care must be taken when drilling through
the cement plug. If the cement is harder than the formation itself, this can lead to
inadvertently side tracking the well and exposing the wellbore to the same wellbore
breathing or loss zone.
4.3 Prevention of Wellbore Breathing
There are typically two lines of approach for the prevention of wellbore breathing:
prevention of the initiation of fractures and elimination of the ECD induced pressure
fluctuations between circulating and static conditions. The former focuses on managing
downhole pressures and temperatures to maintain wellbore integrity while the latter focuses
on the development and implementation of specialized equipment at surface.
117
4.3.1 Accurate Kill Mud Weight Calculations
Often times, kill mud weights are calculated in a conservative manner to ensure
overbalance, which subjects the wellbore to unnecessarily high pressures. These
unnecessary pressures can exceed the fracture gradient and result in fracture initiation.
Furthermore, initiation of these fractures can lead to wellbore breathing occurring directly
after a well control event. As shown by the earlier case study from offshore Brazil (Lage
et al., 2002), a wellbore breathing event directly following a well control incident can mask
the wellbore breathing mechanism and make identification difficult. Also, since kicks often
take place in hydrocarbon bearing zones, wellbore breathing in these situations may be
coupled with hydrocarbon swap-out or gas diffusion. This can make identification more
difficult and cause safety issues due to hydrocarbon returns at surface.
The accuracy of kill mud weight calculations is directly related to the accuracy of
the SIDPP in its measurement of the BHP. In order to achieve an accurate BHP
measurement via the SIDPP, all trapped pressure must be bled off and the float valve within
the drill string must be open. Details regarding pressure bleed off procedures have already
been detailed in 2.6.11 so they will not be repeated here, but issues with attaining SIDPP
due to float valves have not yet been discussed. Float valves are typically run in drill strings
as a means to prevent formation fluids from travelling up the drill string during well control
events. While preventing flow up the drill string is necessary, closure of the float valve in
these situations prevents pressure communication from below the valve and prevents
measurement of the BHP via the SIDPP. Bradley (1987) detailed a procedure for attaining
the SIDPP with a closed float valve in the drill string:
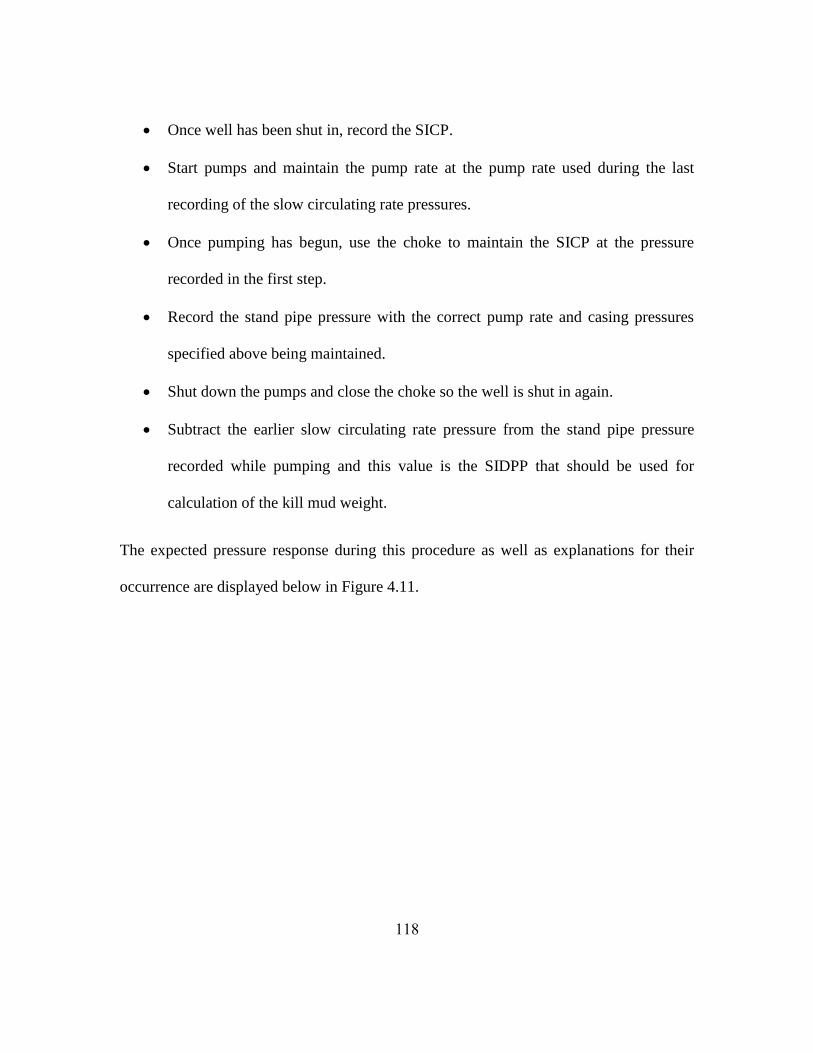
118
Once well has been shut in, record the SICP.
Start pumps and maintain the pump rate at the pump rate used during the last
recording of the slow circulating rate pressures.
Once pumping has begun, use the choke to maintain the SICP at the pressure
recorded in the first step.
Record the stand pipe pressure with the correct pump rate and casing pressures
specified above being maintained.
Shut down the pumps and close the choke so the well is shut in again.
Subtract the earlier slow circulating rate pressure from the stand pipe pressure
recorded while pumping and this value is the SIDPP that should be used for
calculation of the kill mud weight.
The expected pressure response during this procedure as well as explanations for their
occurrence are displayed below in Figure 4.11.

119
Figure 4.11: Procedure to attain SIDPP with a float valve in drill string (Bradley, 1987).
4.3.2 Drilling Fluid Temperature Management
Fluid temperatures, as detailed in 4.2.4.1, can induce thermal stress changes in
downhole formations resulting in a reduction in the effective fracture gradient if the
formation is cooled sufficiently. Because of this, fluid system temperatures should be
managed to ensure that thermal stress changes are not allowed to decrease the effective
fracture gradient to the point where fractures are induced. In order to do this, accurate
temperature measurements of the mud within the pit system is necessary as well as real-
time downhole temperature measurements using MWD.
Using downhole temperature measurements, a minimum threshold can be set for
the downhole temperature. Since the bottom hole temperature decreases during circulation

120
and increases during static periods (Karstad, 1998), this may require periodic pauses in
drilling to allow the formation to warm whenever the minimum temperature threshold is
approached. Additional care must be taken in artic or cold weather environments where
temperatures are low and can cause significant drilling fluid temperature reductions at
surface. In these situations, the pit system at surface should be insulated or a heat exchanger
used to keep the drilling fluid warmed.
An additional point of emphasis should be placed on kill mud temperatures prior to
circulating the mud into the well during well control situations. Regardless of whether the
Driller’s Method or Wait-and Weight Method is used, mud from the active pit system
should be weighted up to the specified kill mud weight rather than using mud from outside
the active pit system. The mud within the active system will be at a higher temperature
because it has been continuously circulated downhole and warmed by the earth’s thermal
gradient. Using colder mud from the inactive pit system will create an unnecessary
reduction in the effective fracture gradient.
Last, a heat exchanger could be incorporated at surface to warm the drilling fluids.
This would maximize the drilling window on a given well by minimizing reductions in the
formation’s effective fracture gradient due to thermal effects. Incorporation of the heat
exchanger would likely incur significant costs due to the needed rig modifications, but
would could be cost competitive in situations where the downhole temperatures were being
actively managed; pausing drilling activities to allow the downhole formation to warm
would prove timely and likely cost prohibitive due to the high price of rig day rates. One
121
limitation to this approach would be use with OBM’s as maintaining these muds at higher
temperatures would result in gases being released at surface.
4.3.3 Managed Pressure Drilling
Managed pressure drilling (MPD) is a suitable system for prevention of wellbore
breathing because it maintains a constant bottom hole pressure throughout the drilling
process. This eliminates the pressure fluctuation between circulating and static conditions,
which drive the wellbore breathing phenomenon. Maintaining a constant bottom hole
pressure allows wells with extremely small mud weight windows to be drilled, which
would be either impossible or very costly to drill conventionally. Furthermore, since the
downhole pressure is maintained by backpressure at surface in addition to the fluid column,
changes can be made instantaneously by adjusting the backpressure applied at surface. This
is extremely useful in response to events such as lost circulation or a kick. The primary
limitations to MPD implementation are the initial cost and time required to install the
system, as well as some drilling engineer’s and operations staff’s unfamiliarity with the
system. However, Saponja, Adeleye, and Hucik (2006) suggest that the system’s
advantages far outweigh the additional up front cost and can actually save money due to
reductions in NPT and increased ROP due to less overbalance while drilling.
4.3.4 Continuous Circulation System
Continuous circulation systems aim to maintain a constant bottom hole pressure by
maintaining ECD throughout the drilling process. This will effectively eliminate wellbore
breathing as there will no longer be downhole pressure fluctuations due to shutting pumps
off. However, the continuous circulation system does require installation of a secondary
122
flow line on the rig floor and operational procedures at connections must be altered to allow
connection of this flow line to the side port sub in the drill string prior to disconnecting the
top drive. Additionally, reliance on ECD to maintain overbalance can result in influxes if
pump failure is experienced and annular pressures decrease. A distinct advantage of the
constant circulation system would be constant availability of downhole data via mud pulse
telemetry since the pumps are not shut-off.
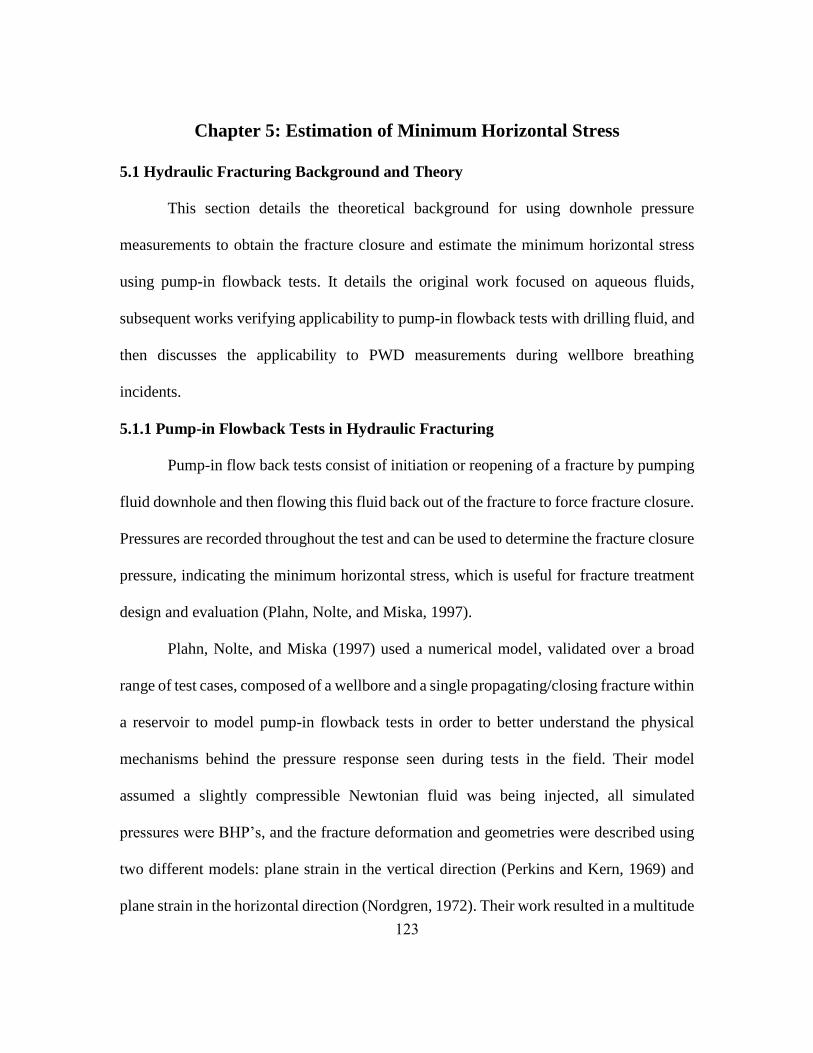
123
Chapter 5: Estimation of Minimum Horizontal Stress
5.1 Hydraulic Fracturing Background and Theory
This section details the theoretical background for using downhole pressure
measurements to obtain the fracture closure and estimate the minimum horizontal stress
using pump-in flowback tests. It details the original work focused on aqueous fluids,
subsequent works verifying applicability to pump-in flowback tests with drilling fluid, and
then discusses the applicability to PWD measurements during wellbore breathing
incidents.
5.1.1 Pump-in Flowback Tests in Hydraulic Fracturing
Pump-in flow back tests consist of initiation or reopening of a fracture by pumping
fluid downhole and then flowing this fluid back out of the fracture to force fracture closure.
Pressures are recorded throughout the test and can be used to determine the fracture closure
pressure, indicating the minimum horizontal stress, which is useful for fracture treatment
design and evaluation (Plahn, Nolte, and Miska, 1997).
Plahn, Nolte, and Miska (1997) used a numerical model, validated over a broad
range of test cases, composed of a wellbore and a single propagating/closing fracture within
a reservoir to model pump-in flowback tests in order to better understand the physical
mechanisms behind the pressure response seen during tests in the field. Their model
assumed a slightly compressible Newtonian fluid was being injected, all simulated
pressures were BHP’s, and the fracture deformation and geometries were described using
two different models: plane strain in the vertical direction (Perkins and Kern, 1969) and
plane strain in the horizontal direction (Nordgren, 1972). Their work resulted in a multitude
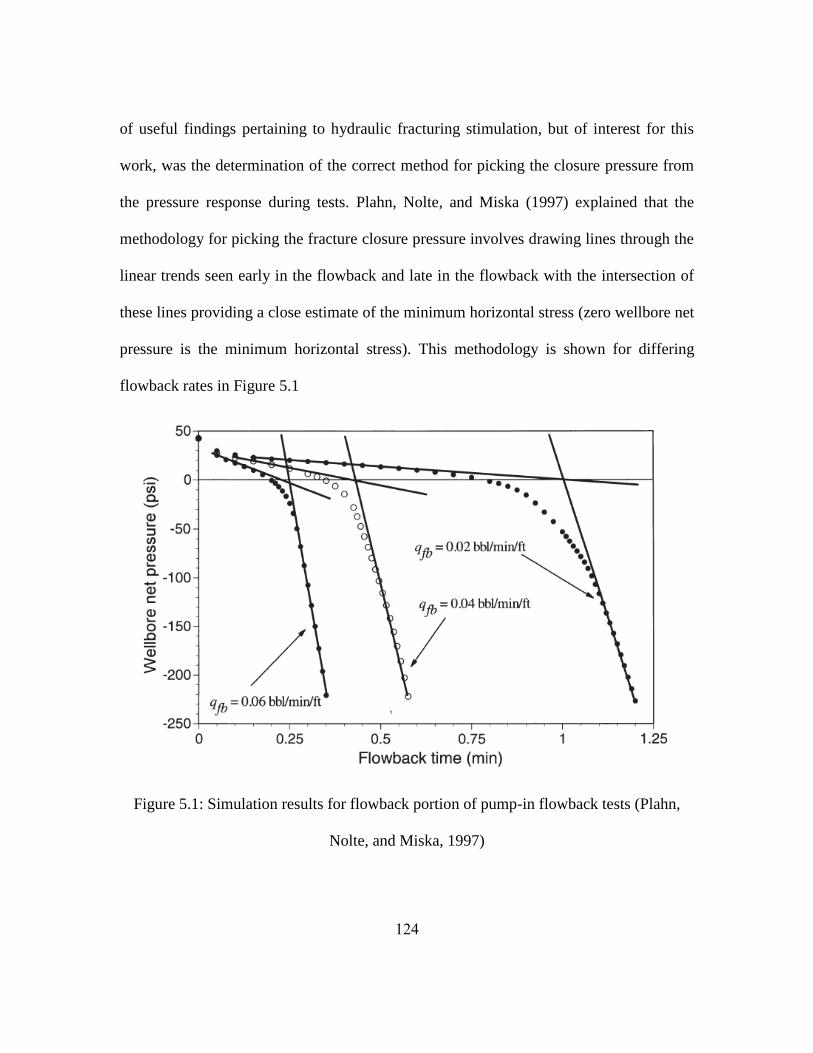
124
of useful findings pertaining to hydraulic fracturing stimulation, but of interest for this
work, was the determination of the correct method for picking the closure pressure from
the pressure response during tests. Plahn, Nolte, and Miska (1997) explained that the
methodology for picking the fracture closure pressure involves drawing lines through the
linear trends seen early in the flowback and late in the flowback with the intersection of
these lines providing a close estimate of the minimum horizontal stress (zero wellbore net
pressure is the minimum horizontal stress). This methodology is shown for differing
flowback rates in Figure 5.1
Figure 5.1: Simulation results for flowback portion of pump-in flowback tests (Plahn,
Nolte, and Miska, 1997)
125
5.1.2 Pump-in Flowback Tests in Drilling Operations
Pump-in Flowback tests are also employed during drilling operations in order to
estimate the minimum horizontal stress at the casing shoe prior to drilling ahead, although
LOT’s are far more common. However, the drilling fluids used to perform these tests are
typically non-aqueous and laden with solid material such as barite, which differs
significantly from the slightly compressible Newtonian fluid used in the Plahn, Nolte, and
Miska (1997) model. Additionally, the pressures simulated in the Plahn, Nolte, and Miska
(1997) model were all downhole pressures, whereas pressures are typically recorded at
surface for pump-in flowback tests performed during drilling operations.
Raaen et al., (2001) used an analytical model composed of a fluid filled well, an
ellipsoidal vertical fracture, fluid leak off into the formation, and fluid flowback at surface
to describe the pump-in flowback test. Raaen et al. described the model behavior in terms
of the system stiffness:
𝑆 =𝑑𝑝
𝑑𝑉 (5.1)
Where,
S = system stiffness
p = pressure
V = volume
And the two primary contributors to system stiffness are:
Hydrostatic compression/decompression of fluid volume in well (well stiffness)
The elasticity of the fracture (fracture stiffness)
126
The fracture closure was considered to be a two stage closure as described by
Hayashi and Haimson (1991) in which the fracture initially closes in a “hinge like” manner
followed by closure at the fracture tip as displayed in Figure 5.2.
Figure 5.2: Fracture closure process
Raaen et al. (2001) proposed that during a pump-in flowback test, the system
stiffness would initially be constant as it composed both the fracture stiffness and well
stiffness, followed by a transitionary period as the fracture initially closes at the tip and
then approaches full closure, and ending with the constant well stiffness as the fracture has
completely closed. Raaen et al. (2001) proposed that the initial deviation from constant
slope, when the fracture tip closes, indicates the minimum horizontal stress. Using this

127
simple model, Raaen et al. (2001) were able to interpret pump-in flowback tests from two
different field tests which showed good qualitative agreement over several tests and with
the authors’ understanding of stresses in the area. A plot of pressure versus volume, the
system stiffness, from one of the field tests is shown below in Figure 5.3 with an
interpretation of 75 MPA as the minimum horizontal stress. A plot of pressure versus time
can also be used and yielded similar results in the work by Raaen et al. (2001).
Figure 5.3: Pump-in Flowback test data from North Sea well (Raaen et al. 2001).
Additional work by Gederaas and Raaen (2009) confirmed the system stiffness
approach for determination of the minimum horizontal stress through three additional field
tests using OBM in impermeable formations at casing shoes. Gederaas and Raaen (2009)
also proposed using a square root of pressure versus time plot rather than the volume versus
time plot, because flowback volume data tends to be noisy, and showed that its results were
128
in agreement. The square root of pressure relationship arises because the flow rate through
the choke during flowback is proportional to the square root of the pressure drop across the
choke.
While Raaen et al. (2001) and Gederaas and Raaen (2009) demonstrated the ability
of pump-in flowback tests with drilling mud to estimate the minimum horizontal stress, the
simplistic model used to interpret the tests provides a qualitative estimate of the minimum
horizontal stress rather than a quantitative. Raaen et al. (2001) acknowledged that the
fracture closure process is very complex, stated that the minimum horizontal stress within
the fracture closure transition period is difficult to distinguish, and states that authors’
interpretation of the closure process indicates the minimum horizontal stress is associated
with the deviation from the initial linear stiffness slope. This interpretation of pump-in
flowback tests was originally proposed by Nolte and Smith (1981) using a similar
simplistic analytical model to describe the fracture behavior. However, as shown in 5.1.1,
later work by Plahn, Nolte, and Miska (1997) showed that this interpretation was actually
incorrect and resulted in an overestimation of the minimum horizontal stress.
5.1.3 Pump-in Flowback Test Applicability to Wellbore Breathing
The downhole process which occurs during wellbore breathing events is very
similar to a pump-in flowback test and should enable interpretation of PWD measurements
during breathing events in a similar manner. The similarities between wellbore breathing
and a pump-in flowback test include:
Increased wellbore pressure forces fracture opening and forces fluid into the
fracture causing propagation.
129
Wellbore pressure then decreases, allowing fractures to close and forcing fluid back
into the wellbore.
The dissimilarities between wellbore breathing and a pump-in flowback test include:
There is an uncontrolled flowback rate during wellbore breathing events while
pump-in flowback tests typically incorporate a constant flowback rate or use a
choke to restrict flowback at surface.
Wellbore breathing often takes place within a large open hole-section while pump-
in flowback tests are typically performed in a confined hole-section or short rat hole
below a casing shoe.
Pump-in flowback tests start with a pressure below the minimum horizontal stress,
create and propagate a fracture, and then end with a pressure below the minimum
horizontal stress. In wellbore breathing this may or may not be the case.
Plahn, Nolte, and Miska (1997) showed that rate of flowback does not have an
effect on the ability of their interpretation method to determine the minimum horizontal
stress, but increased flowback rate does shorten the linear portions of the pressure versus
time plot. Therefore, in wellbore breathing cases where the flowback rate is high and
fracture closure occurs quickly, it may be difficult to identify the linear behavior required
to estimate the minimum horizontal stress.
Wellbore breathing events which take place within a large open hole-section may
also make interpretation difficult. This opens up the potential for multiple fractures within
different formations. This scenario would make interpretation difficult, if not impossible,

130
because the pressure responses would be occurring simultaneously and the in-situ stresses
would likely be different. Additionally, the fracture in wellbore breathing may or may not
be at the same depth as the PWD device recording the pressures. Because of this, the
interpretation of downhole pressure measurements and expression of results should use a
pressure gradient rather than actual pressure values. If the specific wellbore breathing zone
can be identified via LWD tool or some other means, these gradients can easily be
converted to actual pressure and stress values for that given depth.
Last, wellbore breathing can occur in circumstances where the static wellbore
pressure is at or above the minimum horizontal stress. In these cases, interpretation of the
PWD data would not yield an estimate for the minimum horizontal stress because fracture
closure would not occur. In this case, the static wellbore pressure could be taken as the
upper bound for the minimum horizontal stress.
A potential advantage of using wellbore breathing events for estimation of the
minimum horizontal stress is the repetitive nature of wellbore breathing compared to
pump-in flowback tests or LOT’s, which are typically performed only once at the casing
shoe. This repetition will provide a larger data set and reduces the risk of an incorrect
estimation of the minimum horizontal stress as any outliers can be identified and excluded.
If the volume lost and gained during a breathing event is large, in the tens to
hundreds of barrels, the fracture will likely reach more than several wellbore radii into the
formation, depending on the fracture height. Therefore, the fracture closure pressure will
be indicative of the far field minimum horizontal stress and will not be altered due to stress
concentrations around the wellbore. During LOT’s, the fracture is typically not propagated
131
into the far field as this would reduce wellbore strength. Because of this, fracture closure
pressures obtained using LOT, if obtained at all, may be influenced by near wellbore stress
concentrations and result in an inaccurate estimate of the minimum horizontal stress.
5.1.4 Previously Proposed Methods
Use of downhole pressure measurements during wellbore breathing events for
estimation of the minimum horizontal stress was first proposed by Ward and Clark (1998)
and subsequently by Edwards, Bratton, and Standifird (2002). Ward and Clark (1998)
proposed that the early departure of pressure from linearity with time during flowback
could be interpreted as the minimum horizontal stress similar to the method in LOT’s, but
referenced no theoretical background for this assertion. Edwards, Bratton, and Standifird
(2002) proposed using two different methods to estimate the minimum horizontal stress:
(1) early departure of pressure from linearity with time during flowback could be
interpreted as the minimum horizontal stress, (2) plotting the square root of pressure versus
time results in the intersection of the lines drawn through the two linear portions indicating
the minimum horizontal stress.
Using the early departure from linearity in a pressure versus time graph, proposed
by both Ward and Clark (1998) and Edwards, Bratton, and Standifird (2002) is the same
method originally proposed by Nolte and Smith (1981) for interpretation of pump-in
flowback tests. However, as mentioned in section 5.1.2, later work by Plahn, Nolte, and
Miska (1997) showed that this method was incorrect and overestimates the minimum
horizontal stress.
132
The second method proposed by Edwards, Bratton, and Standifird (2002) originates
from shut in tests used during hydraulic fracturing to estimate the fracture closure pressure.
These shut in tests rely on fluid leakoff into the formation to allow fracture closure. While
this test will not be detailed here, the square root of time relationship used to estimate the
fracture closure pressure originates from Carter Leakoff theory (Howard, Fast, and Carter,
1957) which states that the flow rate of fluid leaking off into the formation is:
𝑞𝑙𝑒𝑎𝑘𝑜𝑓𝑓 =2𝐴𝑝𝐶𝐿
√𝑡−𝜏𝑝 (5.2)
Where,
𝐴𝑝 = fracture surface area
𝜏𝑝 = time when the fracture formed
𝐶𝐿 = leakoff coefficient
While this square root of time relationship is useful for shut-in test, fluid flow out
of the fracture during wellbore breathing is dominated by flow back into the wellbore rather
than flow into the formation via leakoff. Because of this, there will not be a square root of
time relationship for wellbore breathing and the second method proposed by Edwards,
Bratton, and Standifird (2002) will yield inaccurate estimates of the minimum horizontal
stress.
While Ward and Clark (1998) and Edwards, Bratton, and Standifird (2002) each
proposed estimating the minimum horizontal stress using PWD measurements during
wellbore breathing, to the best of the author’s knowledge, this is the first proposal to use
the pump-in flowback interpretation proposed and verified by Plahn, Nolte, and Miska
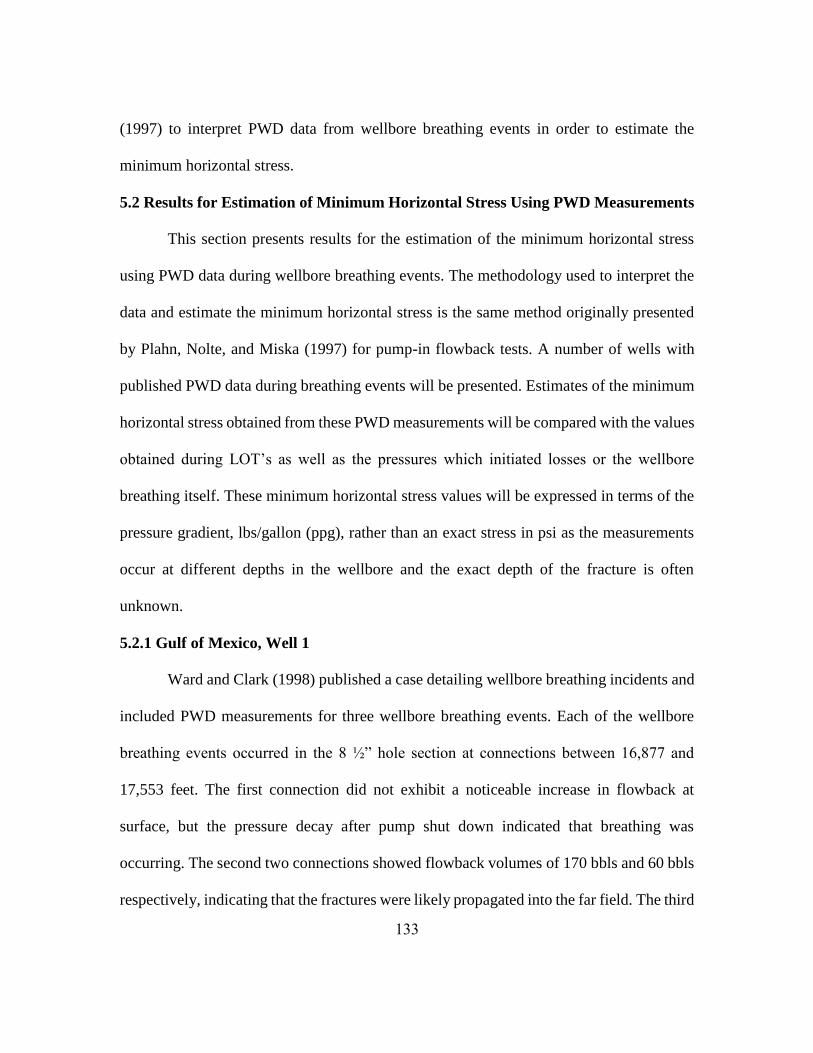
133
(1997) to interpret PWD data from wellbore breathing events in order to estimate the
minimum horizontal stress.
5.2 Results for Estimation of Minimum Horizontal Stress Using PWD Measurements
This section presents results for the estimation of the minimum horizontal stress
using PWD data during wellbore breathing events. The methodology used to interpret the
data and estimate the minimum horizontal stress is the same method originally presented
by Plahn, Nolte, and Miska (1997) for pump-in flowback tests. A number of wells with
published PWD data during breathing events will be presented. Estimates of the minimum
horizontal stress obtained from these PWD measurements will be compared with the values
obtained during LOT’s as well as the pressures which initiated losses or the wellbore
breathing itself. These minimum horizontal stress values will be expressed in terms of the
pressure gradient, lbs/gallon (ppg), rather than an exact stress in psi as the measurements
occur at different depths in the wellbore and the exact depth of the fracture is often
unknown.
5.2.1 Gulf of Mexico, Well 1
Ward and Clark (1998) published a case detailing wellbore breathing incidents and
included PWD measurements for three wellbore breathing events. Each of the wellbore
breathing events occurred in the 8 ½” hole section at connections between 16,877 and
17,553 feet. The first connection did not exhibit a noticeable increase in flowback at
surface, but the pressure decay after pump shut down indicated that breathing was
occurring. The second two connections showed flowback volumes of 170 bbls and 60 bbls
respectively, indicating that the fractures were likely propagated into the far field. The third

134
connection was performed quickly and the pumps were turned back on prior to the static
mud weight being reached. For reference, a LOT was performed near the casing shoe,
15,616 feet, and indicated a fracture pressure of 16.45 ppg. Also, the drilling fluid in use
was an OBM. The PWD data from each of the connections is plotted below with lines
drawn through the linear behavior and the intersection of these lines indicating the
minimum horizontal stress.
Figure 5.4: Minimum horizontal stress estimation for first connection on GOM well 1
(Data from Ward and Clark, 1998)
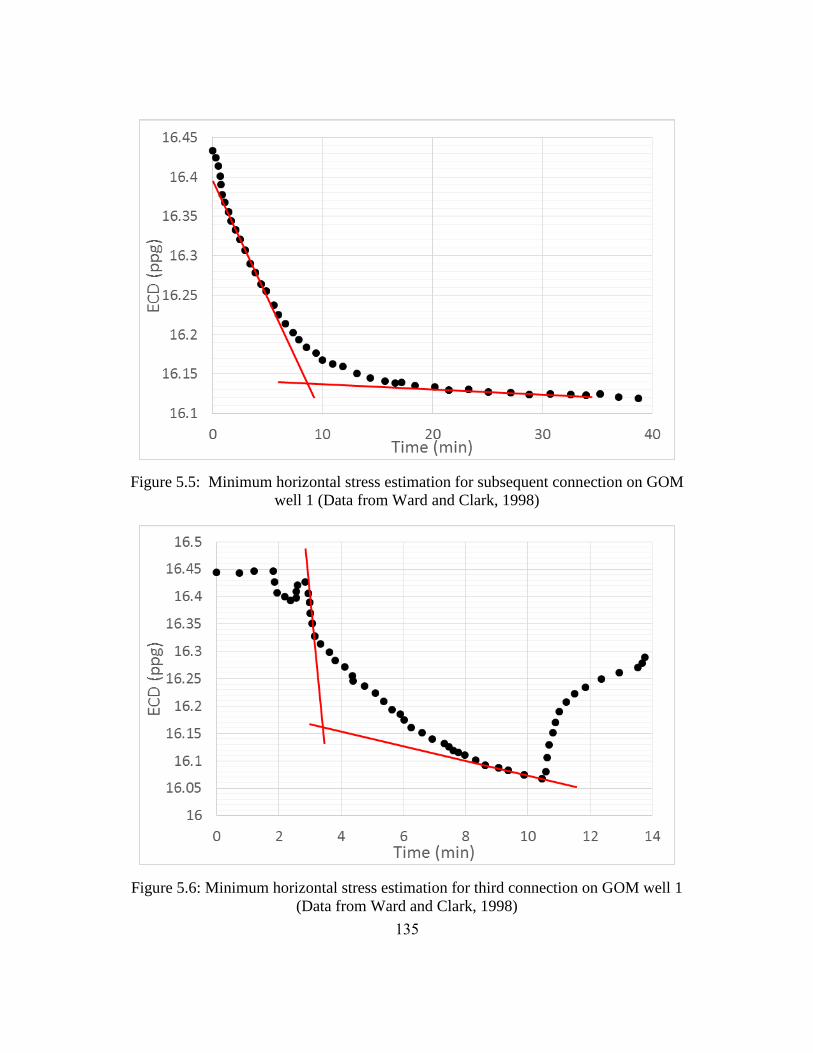
135
Figure 5.5: Minimum horizontal stress estimation for subsequent connection on GOM
well 1 (Data from Ward and Clark, 1998)
Figure 5.6: Minimum horizontal stress estimation for third connection on GOM well 1
(Data from Ward and Clark, 1998)
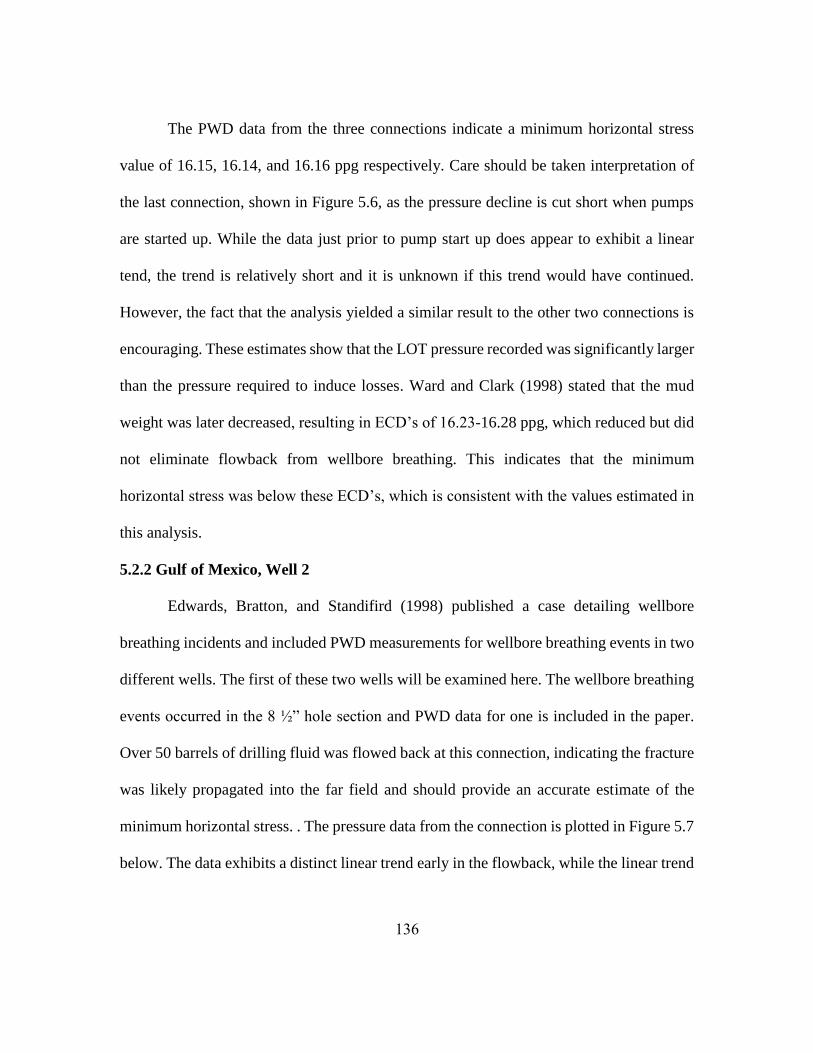
136
The PWD data from the three connections indicate a minimum horizontal stress
value of 16.15, 16.14, and 16.16 ppg respectively. Care should be taken interpretation of
the last connection, shown in Figure 5.6, as the pressure decline is cut short when pumps
are started up. While the data just prior to pump start up does appear to exhibit a linear
tend, the trend is relatively short and it is unknown if this trend would have continued.
However, the fact that the analysis yielded a similar result to the other two connections is
encouraging. These estimates show that the LOT pressure recorded was significantly larger
than the pressure required to induce losses. Ward and Clark (1998) stated that the mud
weight was later decreased, resulting in ECD’s of 16.23-16.28 ppg, which reduced but did
not eliminate flowback from wellbore breathing. This indicates that the minimum
horizontal stress was below these ECD’s, which is consistent with the values estimated in
this analysis.
5.2.2 Gulf of Mexico, Well 2
Edwards, Bratton, and Standifird (1998) published a case detailing wellbore
breathing incidents and included PWD measurements for wellbore breathing events in two
different wells. The first of these two wells will be examined here. The wellbore breathing
events occurred in the 8 ½” hole section and PWD data for one is included in the paper.
Over 50 barrels of drilling fluid was flowed back at this connection, indicating the fracture
was likely propagated into the far field and should provide an accurate estimate of the
minimum horizontal stress. . The pressure data from the connection is plotted in Figure 5.7
below. The data exhibits a distinct linear trend early in the flowback, while the linear trend
137
in later part of flowback is more difficult to identify. The minimum horizontal stress is
estimated as 16.87 ppg, but it is difficult to gauge the accuracy of this without more data.
Figure 5.7: Minimum horizontal stress estimation for connection on GOM well 2 (Data
from Edwards, Bratton, and Standifird, 1998)
5.2.3 Gulf of Mexico, Well 3
The second well Edwards, Bratton, and Standifird (1998) included in their paper is
included here. LWD data presented in the paper shows that the fracture responsible for this
wellbore breathing event was in a sandstone bounded by shale intervals. The fracture height
was roughly 75 feet. . The pressure data from the connection is plotted in Figure 5.7 below.
The data exhibits a distinct linear trend early in the flowback, while the linear trend in later
part of flowback is more difficult to identify. This is likely due to the pumps being turned
back on at the 8 minute mark, which would have stopped fluid flow out of the fracture. The
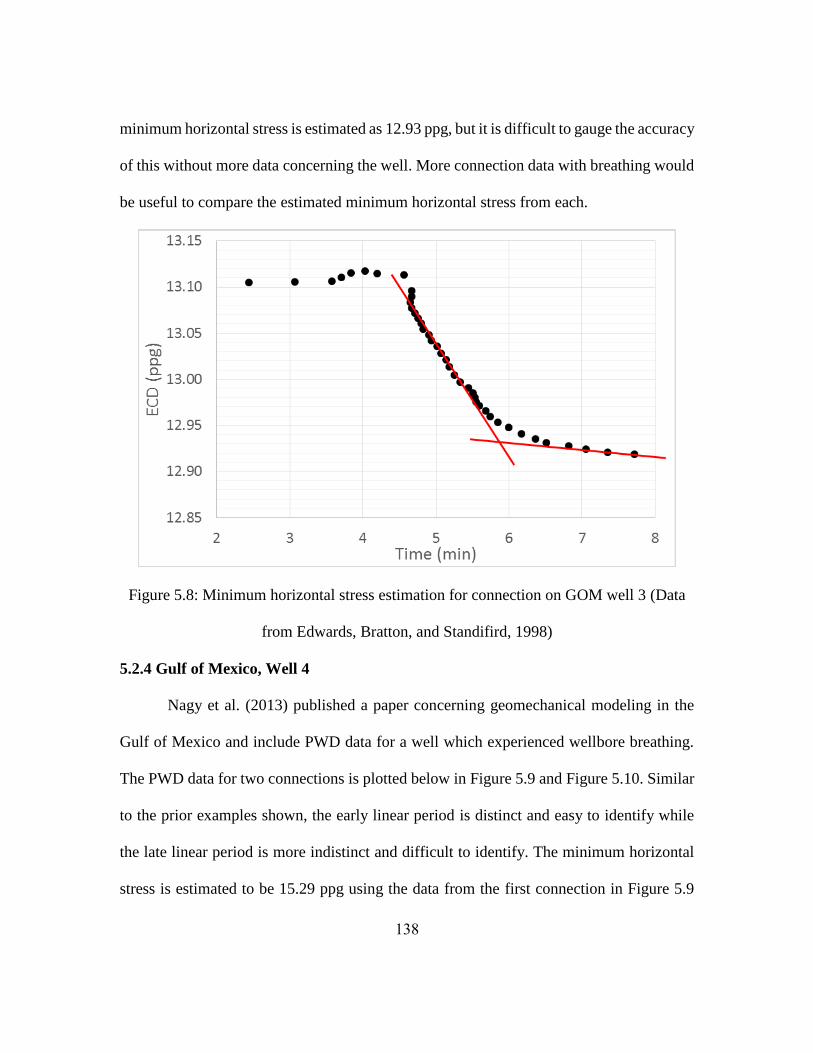
138
minimum horizontal stress is estimated as 12.93 ppg, but it is difficult to gauge the accuracy
of this without more data concerning the well. More connection data with breathing would
be useful to compare the estimated minimum horizontal stress from each.
Figure 5.8: Minimum horizontal stress estimation for connection on GOM well 3 (Data
from Edwards, Bratton, and Standifird, 1998)
5.2.4 Gulf of Mexico, Well 4
Nagy et al. (2013) published a paper concerning geomechanical modeling in the
Gulf of Mexico and include PWD data for a well which experienced wellbore breathing.
The PWD data for two connections is plotted below in Figure 5.9 and Figure 5.10. Similar
to the prior examples shown, the early linear period is distinct and easy to identify while
the late linear period is more indistinct and difficult to identify. The minimum horizontal
stress is estimated to be 15.29 ppg using the data from the first connection in Figure 5.9
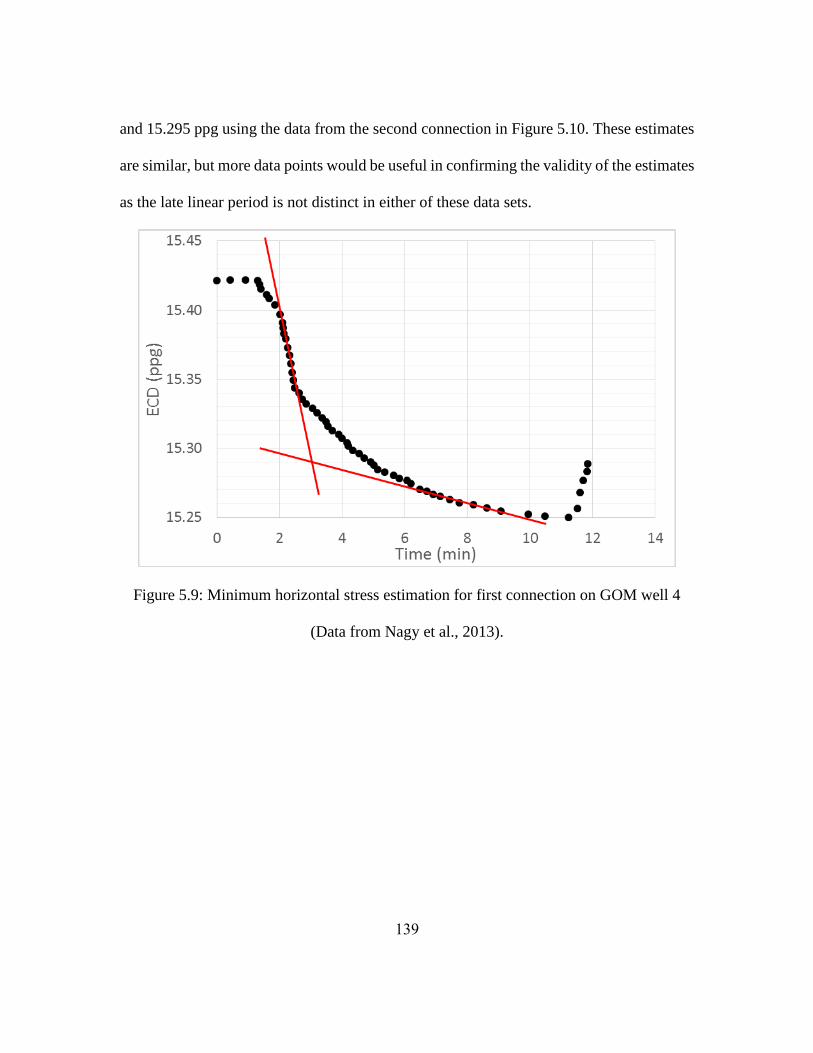
139
and 15.295 ppg using the data from the second connection in Figure 5.10. These estimates
are similar, but more data points would be useful in confirming the validity of the estimates
as the late linear period is not distinct in either of these data sets.
Figure 5.9: Minimum horizontal stress estimation for first connection on GOM well 4
(Data from Nagy et al., 2013).
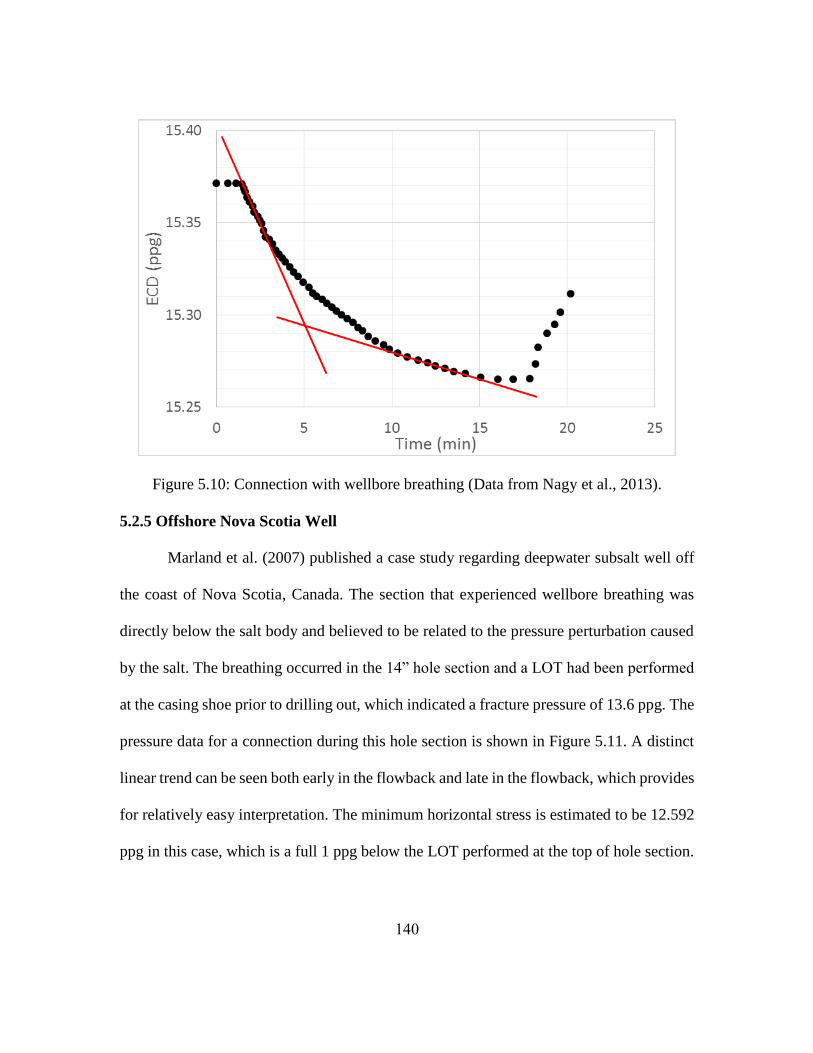
140
Figure 5.10: Connection with wellbore breathing (Data from Nagy et al., 2013).
5.2.5 Offshore Nova Scotia Well
Marland et al. (2007) published a case study regarding deepwater subsalt well off
the coast of Nova Scotia, Canada. The section that experienced wellbore breathing was
directly below the salt body and believed to be related to the pressure perturbation caused
by the salt. The breathing occurred in the 14” hole section and a LOT had been performed
at the casing shoe prior to drilling out, which indicated a fracture pressure of 13.6 ppg. The
pressure data for a connection during this hole section is shown in Figure 5.11. A distinct
linear trend can be seen both early in the flowback and late in the flowback, which provides
for relatively easy interpretation. The minimum horizontal stress is estimated to be 12.592
ppg in this case, which is a full 1 ppg below the LOT performed at the top of hole section.
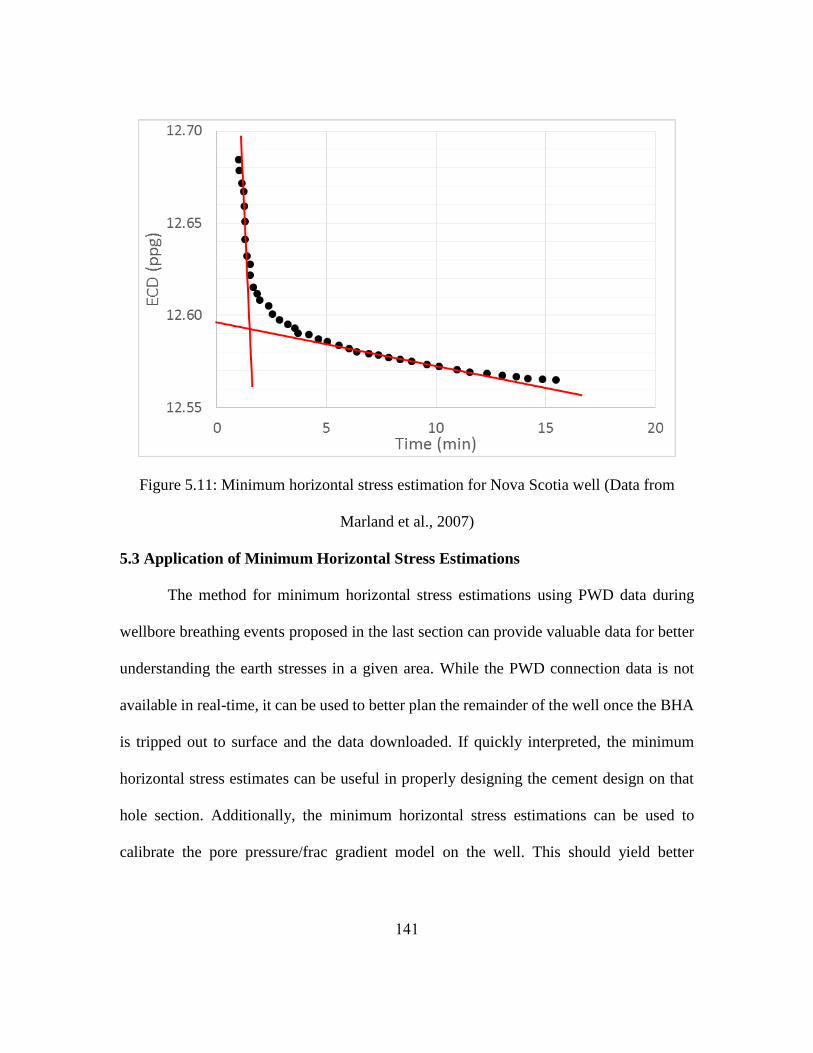
141
Figure 5.11: Minimum horizontal stress estimation for Nova Scotia well (Data from
Marland et al., 2007)
5.3 Application of Minimum Horizontal Stress Estimations
The method for minimum horizontal stress estimations using PWD data during
wellbore breathing events proposed in the last section can provide valuable data for better
understanding the earth stresses in a given area. While the PWD connection data is not
available in real-time, it can be used to better plan the remainder of the well once the BHA
is tripped out to surface and the data downloaded. If quickly interpreted, the minimum
horizontal stress estimates can be useful in properly designing the cement design on that
hole section. Additionally, the minimum horizontal stress estimations can be used to
calibrate the pore pressure/frac gradient model on the well. This should yield better

142
estimates of the fracture gradient for the next hole section. In the case that this new data
alters the well design in some way, this also provides extra lead time for contingency plans.
The minimum horizontal stress estimation are most useful for calibrating
geomechanical models to better predict the stresses in the region. Typically, the values
obtained in LOT’s are used in these geomechanical models for calibration. However,
LOT’s are often difficult to interpret and can provide poor stress estimates, while pump-in
flowback tests are easy to interpret and have been shown to provide more accurate stress
estimates (Økland et al., 2002). Since wellbore breathing events are essentially the same
process as a pump-in flowback test, they should also provide better stress estimates if
interpreted correctly. Better calibrated geomechanical models can be extremely useful for
future wells as it will enable better well planning, casing design, and well placement.
143
Chapter 6: Conclusions and Recommendations
6.1 Case Studies
The three case studies presented in this work provide useful context to wellbore
breathing scenarios that may be encountered in the field, how these mechanisms can
present themselves at surface, and some potential pitfalls to avoid when wellbore breathing
is encountered. The Jura-1 case study was especially useful in exemplifying the dangers
present when wellbore breathing is coupled with hydrocarbon swap-out. Furthermore, this
case study stressed the importance of proper interpretation of shut in pressures during well
control situations as misinterpretation of the pressures ultimately resulted in the loss of this
well. Last, the successful drilling of the subsequent Bard-1 well showcased the
effectiveness of a well-trained and educated crew in combination with sound operational
procedures in handling wellbore breathing during drilling operations.
The ESS-107 case study was useful in representing the difficulty in identifying
overpressure and wellbore breathing when they are encountered consecutively within the
same hole section. Additionally, this case study illustrated the need to use correctly
calculated kill mud weights as using a higher mud weight to be safe can result in exceeding
the minimum horizontal stress. Last, this case study was useful in showing the effects
thermal stress changes can have in a well control situation as the fluid gains during static
conditions late in the well control sequence were likely caused by the warming of the
formation forcing drilling fluid out of the fractures.
The 22/30-C-10 case study shows the significant impacts that the often neglected
thermal regime can have on wellbore integrity. The initiation of wellbore fractures was
144
caused by a reduction in the effective fracture gradient due to cooling and these fractures
were then propagated with subsequent increases in mud weight. This case study also
exhibited the coupled relation of wellbore breathing with both pressures and temperatures.
Some of the wellbore breathing was driven by pressure fluctuations between static and
circulating conditions, but other instances of drilling fluid flowback from the fractures were
driven by thermal stress changes as the formation warmed and closed the fractures.
6.2 Identification, Mitigation, and Prevention
As far as real-time identification while drilling, the best current method is likely
flowback finger printing but this method can only identify an increase in connection
flowback volumes and cannot differentiate between a kick and wellbore breathing, just
identify that one is occurring. PWD measurements offer the best potential for real-time
identification of wellbore breathing as well as differentiation between breathing and kicks,
but current downhole data transmission technologies limit it to use in post well analysis.
Eventual implementation of wired pipe technology would eliminate the data transmission
limitation and allow PWD to be used for true real-time identification of wellbore breathing
and differentiation between breathing and kicks. The identification section also provided
examples of SIDPP and SICP behavior for several different scenarios and explained how
these pressures can be interpreted to differentiate between wellbore breathing and a kick.
In terms of mitigation, ECD management is the best method to reduce the effects
of wellbore breathing during drilling operations. ECD management can be used to lessen
the magnitude of fluid gains and losses from breathing and to decrease the rate at which
these gains and losses occur. Bridging or plugging the fracture can also be deployed as a

145
mitigation technique, but this can be time consuming, expensive, and sometimes
ineffective.
For prevention, in conventional drilling, focus must be on keeping wellbore
pressures to a minimum and monitoring fluid and bottom-hole temperatures to ensure that
the formation is not weakened significantly by cooling. In effect, the goal for conventional
drilling operations should be to maximize the available fracture gradient through prudent
operational procedures. Both managed pressure drilling and continuous circulation systems
provide the prospect of eliminating downhole pressure fluctuations and therefore the
wellbore breathing mechanism associated with those fluctuations. However, each require
some incremental cost to install and operate. This has limited the implementation of these
systems in areas where they are not absolutely needed. For instance, MPD is widely used
in the Asia Pacific region, but this is only because narrow drilling margins make
conventional drilling of many reservoirs impossible.
6.3 Estimation of Minimum Horizontal Stress Using PWD
This work details the theoretical background pertaining to the interpretation of
pump-in flowback tests in hydraulic fracturing developed by Plahn, Nolte, and Miska
(1997). Using this interpretation, minimum horizontal stress estimations were made using
PWD measurements from wellbore breathing published in literature. The estimations
obtained for each of these wellbore breathing events was validated qualitatively, when
possible, by comparing across multiple connections and comparing with LOT data. These
estimations of minimum horizontal stress can provide value to industry by enabling
calibration of geomechanical models to better predict the earth stresses within this area.
146
This will allow better well design and well placement and can potentially provide value for
production operations and reservoir engineering if the wellbore breathing events occur near
or in a hydrocarbon reservoir.
6.4 Future Work
While the method proposed for estimation of the minimum horizontal stress using
PWD measurements during wellbore breathing events was validated qualitatively, it
requires further validation across a larger data set. Furthermore, comparison against a more
common method for minimum horizontal stress estimation would be useful. Last,
development of a full model of the wellbore breathing mechanism would be a useful
endeavor. This could provide details about the mechanism itself and could be used to
evaluate the accuracy of the proposed method in its estimation of the minimum horizontal
stress.

147
List of Acronyms
BHA: Bottomhole assembly
BHP: Bottomhole pressure
BOP: Blowout preventer
CFS: Continuous flow system
DGD: Dual gradient drilling
ECD: Equivalent circulating density
EMW: Equivalent mud weight
FCP: Fracture closure pressure
FIP: Fracture initiation pressure
FIP: Fracture initiation pressure
FIT: Formation integrity test
FPP: Fracture propagation pressure
GOM: Gulf of Mexico
HPHT: High pressure high temperature
ISIP: Instantaneous shut-in pressure
JIP: Joint industry project
LCM: Lost circulation material
LOT: Leak off test
LP: Limit pressure
LT: Limit test
LWD: Logging while drilling
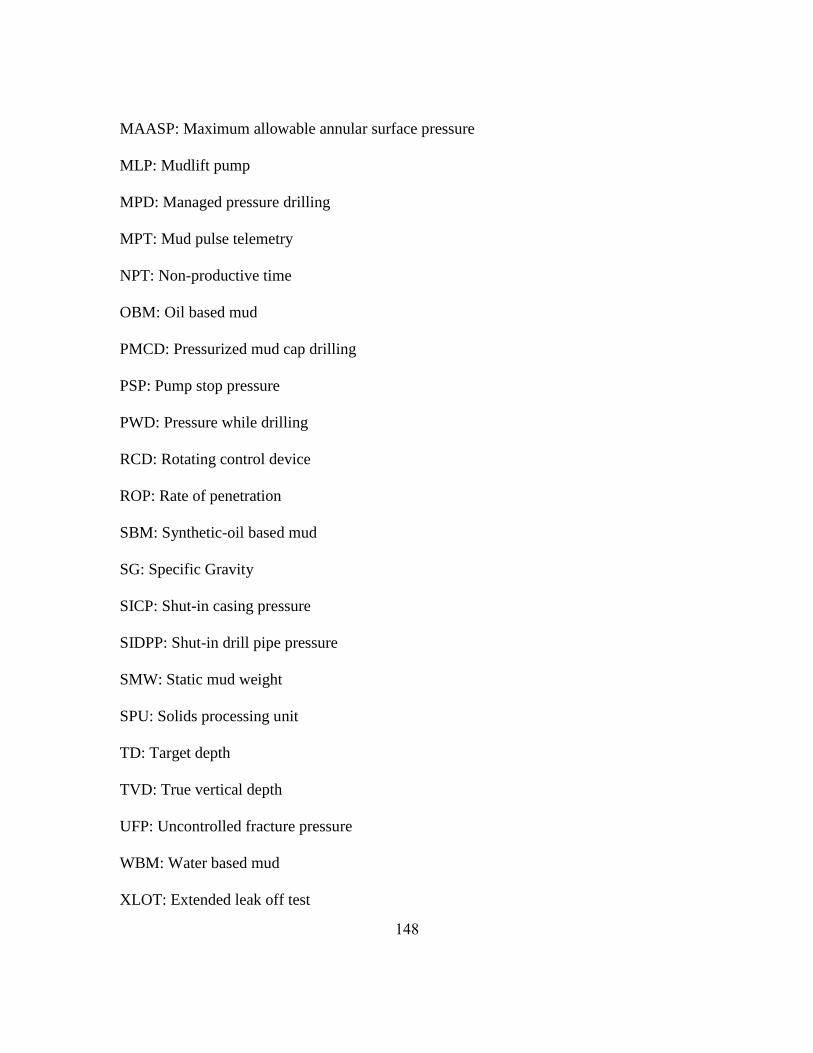
148
MAASP: Maximum allowable annular surface pressure
MLP: Mudlift pump
MPD: Managed pressure drilling
MPT: Mud pulse telemetry
NPT: Non-productive time
OBM: Oil based mud
PMCD: Pressurized mud cap drilling
PSP: Pump stop pressure
PWD: Pressure while drilling
RCD: Rotating control device
ROP: Rate of penetration
SBM: Synthetic-oil based mud
SG: Specific Gravity
SICP: Shut-in casing pressure
SIDPP: Shut-in drill pipe pressure
SMW: Static mud weight
SPU: Solids processing unit
TD: Target depth
TVD: True vertical depth
UFP: Uncontrolled fracture pressure
WBM: Water based mud
XLOT: Extended leak off test
149
References
Alberty, M. W., & Fink, K. (2014, June 1). The Use of Connection and Total Gases
Quantitatively in the Assessment of Shale Pore Pressure. Society of Petroleum
Engineers. doi:10.2118/166188-PA
Alberty, M. W., & McLean, M. R. (2004, January 1). A Physical Model for Stress Cages.
Society of Petroleum Engineers. doi:10.2118/90493-MS
Ali, T. H., Haberer, S. M., Says, I. P., Ubaru, C. C., Laing, M. L., Helgesen, O., Laing,
M. Bjelland, B. (2013, March 5). Automated Alarms for Smart Flowback
Fingerprinting and Early Kick Detection. Society of Petroleum Engineers.
doi:10.2118/163474-MS
Babu, R. (1997). Effect of P-ρ-T behavior of muds on loss/gain during high-temperature
deep-well drilling. Journal of Petroleum Science and Engineering, 20, 49-62.
Babu, D. R. (1996, June 1). Effects of P-p-T Behaviour of Muds on Static Pressures
during Deep Well Drilling - Part 2: Static Pressures. Society of Petroleum
Engineers. doi:10.2118/27419-PA
Bern, P. A., van Oort, E., Neustadt, B., Ebeltoft, H., Zurdo, C., Zamora, M., & Slater, K.
S. (2000, March 1). Barite Sag: Measurement, Modeling, and Management.
Society of Petroleum Engineers. doi:10.2118/62051-PA
Bradley, H. (1987). Petroleum engineering handbook. Richardson, TX, U.S.A.: Society of
Petroleum Engineers.
Bradley, N. D., Low, E., Aas, B., Rommetveit, R., & Larsen, H. F. (2002, January 1). Gas
Diffusion - Its Impact on a Horizontal HPHT Well. Society of Petroleum
Engineers. doi:10.2118/77474-MS
Bratton, T. R., Rezmer-Cooper, I. M., Desroches, J., Gille, Y.-E., Li, Q., & McFayden,
M. (2001, January 1). How to Diagnose Drilling Induced Fractures in Wells
Drilled with Oil-Based Muds with Real-Time Resistivity and Pressure
Measurements. Society of Petroleum Engineers. doi:10.2118/67742-MS
Bowman, G. R. (1989, April 10). Borehole ballooning response to Gill. Oil & Gas
Journal. 43
Carter, K. M., van Oort, E., & Barendrecht, A. (2014, September 10). Improved
Regulatory Oversight using Real-Time Data Monitoring Technologies in the
Wake of Macondo. Society of Petroleum Engineers. doi:10.2118/170323-MS
150
Caughron, D. E., Renfrow, D. K., Bruton, J. R., Ivan, C. D., Broussard, P. N., Bratton, T.
R., & Standifird, W. B. (2002, January 1). Unique Crosslinking Pill in Tandem
With Fracture Prediction Model Cures Circulation Losses in Deepwater Gulf of
Mexico. Society of Petroleum Engineers. doi:10.2118/74518-MS
Cunningham, J., Bansal, R. K., George, G., & De Leon, E. (2014, April 8). Development
of a New Continuous Flow System for Managed Pressure Drilling. Society of
Petroleum Engineers. doi:10.2118/168957-MS
Cunningham, J., Bansal, R. K., George, G., & De Leon, E. (2014, March 4). A New
Continuous Flow System (CFS) for Managed Pressure Drilling. Society of
Petroleum Engineers. doi:10.2118/168030-MS
Dowell, J. D. (2010, January 1). Deploying the World's First Commercial Dual
Gradient Drilling System. Society of Petroleum Engineers. doi:10.2118/137319-
MS
Driedger, D. J., Kelly, S. P., Leggett, C., Thain, J., & Silva, M. (2013, March 10).
Managed Pressure Drilling Technique Applied in a Kurdistan Exploration Well.
Society of Petroleum Engineers. doi:10.2118/164403-MS
Dupriest, F. E. (2005, January 1). Fracture Closure Stress (FCS) and Lost Returns
Practices. Society of Petroleum Engineers. doi:10.2118/92192-MS
Dusseault, M. B., Maury, V., Sanfilippo, F., & Santarelli, F. J. (2004, January 1). Drilling
Around Salt: Risks, Stresses, And Uncertainties. American Rock Mechanics
Association.
Earl, K.L. Bonaparte Basin Petroleum Systems. Geoscience Australia, GEOCAT #61365
Edwards, S. T., Bratton, T. R., & Standifird, W. B. (2002, January 1). Accidental
Geomechanics - Capturing In-situ Stress from Mud Losses Encountered while
Drilling. Society of Petroleum Engineers. doi:10.2118/78205-MS
Edwards, S. T., Meredith, P. G., & Murrell, S. A. F. (1998, January 1). An Investigation
of Leak-off Test Data for Estimating In-situ Stress Magnitudes: Application to a
Basinwide Study in the North Sea. Society of Petroleum Engineers.
doi:10.2118/47272-MS
Edwards, S. T., Coley, C. J., Whitley, N. A., Keck, R. G., Ramnath, V., Foster, T. Honey,
M. (2013, March 5). A Summary Of Wired Drill Pipe (IntelliServ Networked
Drillstring) Field Trials And Deployment In Bp. Society of Petroleum Engineers.
doi:10.2118/163560-MS
151
Engleder, T. and Leftwich, J.T. (1997). A pore-pressure limit in overpressured south
Texas oil and gas fields. Seals, traps and the petroleum sytem: AAPG Memoir 67.
R.C. Surdam. Tulsa, OK, AAPG, 255-267
Fjaer, E., R. M. Holt, P. Horsrud, A. M. Raaen, and R. Risnes. (2008). Petroleum Related
Rock Mechanics. Amsterdam: Elsevier Science Publishing Co. 254.
Friedheim, J., Sanders, M., and Roberts, N. (2008, May 19). Unique Drilling Fluid
Additives for Improved Wellbore Stability and Reduced Losses. SEFLU
Conference, Margarita Island, Venezuela, 19-23 May 2008.
Fuh, G.-F., Morita, N., Boyd, P. A., & McGoffin, S. J. (1992, January 1). A New
Approach to Preventing Lost Circulation While Drilling. Society of Petroleum
Engineers. doi:10.2118/24599-MS
Gederaas, T. B., & Raaen, A. M. (2009, January 1). Precise Minimum Horizontal Stress
Determination From Pump-in/flowback Tests With Drilling Mud. American Rock
Mechanics Association.
Geertsman, J., and de Klerk. (1969, December). Rapid Method for Predicting Width of
Hydraulically Induced Fractures. Journal of Petroleum Technology. 1571
Gill, J. A. (1986, January 1). Charged Shales: Self-Induced Pore Pressures. Society of
Petroleum Engineers. doi:10.2118/14788-MS
Gradishar, J., Ugueto, G., & van Oort, E. (2013, March 5). Setting Free The Bear: The
Challenges And Lessons Of The Ursa A-10 Deepwater ERD Well. Society of
Petroleum Engineers. doi:10.2118/163525-MS
Heidbach, O., Tingay, M., Barth, A., Reinecker, J., Kurfeß, D. and Müller, B., (2008).
The World Stress Map database release 2008 doi:10.1594/GFZ.WSM.Rel2008.
Helstrup, O. A., Rahman, M. K., Hossain, M. M., & Rahman, S. S. (2001, January 1). A
Practical Method for Evaluating Effects of Fracture Charging and/or Ballooning
When Drilling High Pressure, High Temperature (HPHT) Wells. Society of
Petroleum Engineers. doi:10.2118/67780-MS
Holbrook, P. (1989, June 12). Debate on borehole ballooning in response to Gill. Oil &
Gas Journal. 43
Howard, G.C. and Fast, C.R.: (1957). Optimum Fluid Characteristics for Fracture
Extension, Drilling and Production Prac., API 24, 261– 270 ~appendix by E.D.
Carter.
152
Jiao, D., & Sharma, M. M. (1993, January 1). Investigation of Dynamic Mud Cake
Formation: The Concept of Minimum Overbalance Pressure. Society of Petroleum
Engineers. doi:10.2118/26323-MS
Karstad, E. (1998, January 1). Analysis of Ballooning Effects During Drilling of High
Pressure High Temperature Wells. Society of Petroleum Engineers.
doi:10.2118/52066-STU
Kirsch, G. (1898). Die Theorie der Elastizitat und die Bedurfnisses der Festigkeitslehre.
Zietschrift des Verlines Deutscher Ingenieure. 42, 707
Kunze, K. R., & Steiger, R. P. (1992, January 1). Accurate In-Situ Stress Measurements
During Drilling Operations. Society of Petroleum Engineers. doi:10.2118/24593-
MS
Lake, L.W. 2006. Petroleum Engineering Handbook, Vol. II, Drilling Engineering.
Richardson, Texas: SPE.
Lage, A. C. V. M., Silva, P. R. C., Gonçalves, C. J. C., Borges, F. A. T., Mansano, R. B.,
Imanishi, R. M., & Martins, F. S. B. (2002, January 1). Gas-Influx Events in a
Deep Water Exploratory Well: A Field Case History. Society of Petroleum
Engineers. doi:10.2118/74517-MS
Low, N., Daccord, G., & Bedel, J.-P. (2003, January 1). Designing Fibered Cement
Slurries for Lost Circulation Applications: Case Histories. Society of Petroleum
Engineers. doi:10.2118/84617-MS
Marland, C. N., Nicholas, S. M., Cox, W., Flannery, C., & Thistle, B. (2007, September
1). Pressure Prediction and Drilling Challenges in a Deepwater Subsalt Well from
Offshore Nova Scotia, Canada. Society of Petroleum Engineers.
doi:10.2118/98279-PA
Maury, V., & Idelovici, J. L. (1995, January 1). Safe Drilling of HP/HT Wells, The Role
of the Thermal Regime in Loss and Gain Phenomenon. Society of Petroleum
Engineers. doi:10.2118/29428-MS
McCartney, C., Allen, S., Hernandez, M., MacFarlane, D., Baksh, A., & Reeves, M. E.
(2009, January 1). Step-Change Improvements With Wired-Pipe Telemetry.
Society of Petroleum Engineers. doi:10.2118/119570-MS
Mehrabian, A., Jamison, D. E., & Teodorescu, S. G. (2015, March 1). Geomechanics of
Lost-Circulation Events and Wellbore-Strengthening Operations. Society of
Petroleum Engineers. doi:10.2118/174088-PA
153
Mitchell, R. F., & Miska, S.Z. (2011). Fundamentals of Drilling Engineering.
Richardson, TX. Society of Petroleum Engineers.
Morita, N., Black, A. D., & Guh, G.-F. (1990, January 1). Theory of Lost Circulation
Pressure. Society of Petroleum Engineers. doi:10.2118/20409-MS
Nagy, Z. R., Lee, D. W., Sayers, C. M., Zapata, T. R., & Silvestro, J. L. (2013, January
1). Iterative 3D Geomechanical Modeling to Determine Distribution and Impact
of Stresses in Deepwater Gulf of Mexico Subsalt and Near-Salt Environments.
American Rock Mechanics Association.
Nolte, K. G., & Smith, M. B. (1981, September 1). Interpretation of Fracturing Pressures.
Society of Petroleum Engineers. doi:10.2118/8297-PA
Nordgren, R. P., (1972, August). Propagation of a Vertical Hydraulic Fracture. Society of
Petroleum Engineers Journal. 306
Okland, D., Gabrielsen, G. K., Gjerde, J., Koen, S., & Williams, E. L. (2002, January 1).
The Importance of Extended Leak-Off Test Data for Combatting Lost Circulation.
Society of Petroleum Engineers. doi:10.2118/78219-MS
Pepin, G., Gonzalez, M., Bloys, J. B., Lofton, J., Schmidt, J., Naquin, C., & Ellis, S.
(2004, January 1). Effect Of Drilling Fluid Temperature On Fracture Gradient:
Field Measurements And Model Predictions. American Rock Mechanics
Association.
Peters, E. (2012). Advanced petrophysics. Austin, Tex: Live Oak.
Plahn, S. V., Nolte, K. G., & Miska, S. (1997, February 1). A Quantitative Investigation
of the Fracture Pump-In/FIowback Test. Society of Petroleum Engineers.
doi:10.2118/30504-PA
Raaen, A.M., E. Skomedalb, H. Kjørholta, P. Marketed, D. Øklanda. (2001). Stress
determination from hydraulic fracturing tests: the system stiffness approach.
International Journal of Rock Mechanics & Mining Sciences, 521-541.
Runtuwene, M., Suprihono, S., Rizka, D., Prasetia, A. E., Toralde, J. S., & Nas, S. W.
(2009, January 1). Pressurized Mud Cap Drilling Drastically Reduces Non-
Productive Time in Soka Field, South Sumatera. Society of Petroleum Engineers.
doi:10.2118/125311-MS
Saleh, S., Williams, K. E., & Rizvi, A. (2013, September 30). Rubble Zone Below Salt:
Identification and Best Drilling Practices. Society of Petroleum Engineers.
doi:10.2118/166115-MS
154
Sanders, M., Young, S. and Friedheim, J. (2008, April 8). Development and Testing of
Novel Additives for Improved Wellbore Stability and Reduced Losses. AADE
Fluids Conference, Houston, April, 2008.
Santos, H. M., Catak, E., & valluri, S. (2011, January 1). Kick tolerance misconceptions
and consequences to well design. Society of Petroleum Engineers.
doi:10.2118/140113-MS
Saponja, J., Adeleye, A., & Hucik, B. (2006, January 1). Managed-Pressure Drilling
(MPD) Field Trials Demonstrate Technology Value. Society of Petroleum
Engineers. doi:10.2118/98787-MS
Sayers, C. M., den Boer, L. D., Nagy, Z. R., & Hooyman, P. J. (2006, January 1). Well-
constrained Seismic Estimation of Pore Pressure With Uncertainty. Society of
Exploration Geophysicists.
Schmidt, J. H., Friar, W. L., Bill, M. L., & Cooper, G. D. (1999, January 1). Large-Scale
Injection of North Slope Drilling Cuttings. Society of Petroleum Engineers.
doi:10.2118/52738-MS
Scorsone, J. T., Sanders, M. W., & Patel, A. D. (2009, January 1). Development of a
Novel Oil-Based Chemical Gel System for Improved Wellbore Stabilization and
Strengthening. Offshore Mediterranean Conference.
Smith, K. L., Gault, A. D., Witt, D. E., & Weddle, C. E. (2001, January 1). SubSea
MudLift Drilling Joint Industry Project: Delivering Dual Gradient Drilling
Technology to Industry. Society of Petroleum Engineers. doi:10.2118/71357-MS
Stave, R. (2014, May 5). Implementation of Dual Gradient Drilling. Offshore Technology
Conference. doi:10.4043/25222-MS
Tare, U. A., Whitfill, D. L., & Mody, F. K. (2001, January 1). Drilling Fluid Losses and
Gains: Case Histories and Practical Solutions. Society of Petroleum Engineers.
doi:10.2118/71368-MS
Van Oort, E., Friedheim, J. E., Pierce, T., & Lee, J. (2009, January 1). Avoiding Losses
in Depleted and Weak Zones by Constantly Strengthening Wellbores. Society of
Petroleum Engineers. doi:10.2118/125093-MS
Van Oort, E., & Vargo, R. F. (2008, September 1). Improving Formation-Strength Tests
and Their Interpretation. Society of Petroleum Engineers. doi:10.2118/105193-PA
Ward, C., & Clark, R. (1998, April 7). Anatomy of a Ballooning Borehole using PWD
tool. Overpressures in Petroleum Exploration Workshop.
155
Weisinger, D., Bell, W., Baker, B., Power, D., Hight, C., Pruitt, T., (2000, September).
Advanced Techniques Determine Casing Points While Drilling. World Oil. 221,
77-81
Ziegler, F. E., & Jones., J. F., (2014, February 11). Predrill pore-pressure prediction and
pore pressure and fluid loss monitoring during drilling: A case study for a
deepwater subsalt Gulf of Mexico well and discussion on fracture gradient, fluid
losses, and wellbore breathing. Society of Exploration Geophysicists and
American Association of Petroleum Geologists.
Zoback, M. D., & Haimson, B. C. (1982, January 1). Status Of The Hydraulic Fracturing
Method For In-Situ Stress Measurements. American Rock Mechanics Association.
Zoback, M. (2007). Reservoir Geomechanics. Cambridge: Cambridge University Press.