copyright by joseph k. goodman 2007
TRANSCRIPT

Copyright
by
Joseph K. Goodman
2007

The Dissertation Committee for Joseph K. Goodman Certifies that this is the
approved version of the following dissertation:
Consumer and Retailer Strategies when Choosing from Large Assortments
Committee:
Susan Broniarczyk, Supervisor
Julie R. Irwin
Leigh McAlister
Jeffrey Loewenstein
Wayne D. Hoyer

Consumer and Retailer Strategies when Choosing from Large Assortments
by
Joseph K. Goodman, B.B.A.
Dissertation
Presented to the Faculty of the Graduate School of
The University of Texas at Austin
in Partial Fulfillment
of the Requirements
for the Degree of
Doctor of Philosophy
The University of Texas at Austin
May 2007

Dedication
To my namesakes, Joseph Aloysius Kozak and Joseph Goodman. To Professor Dorothy
Taraldsen Kozak. To my Uncle Bobby and Aunt Joanie: You have both proven to the
most amazing family that we really can be whatever we want to be in this world. You are
the bravest man and woman that I know or have known and my greatest personal
achievement pales in comparison. To my family: Ma, Pa, Wiz, Weah, and Pencer, and to
your many aliases, Dorothy Kozak Goodman, Andrew Eliot Goodman, Elizabeth
Goodman Williams, Leah Jane Goodman, and Michael David Spencer Williams. You
have taught me how to write, proofed my papers (you don’t have to proof this one), and
inspired me to truly believe that I can be whatever I want to be: garbageman, shoe-shiner,
wheelbarrow, or doctor.

v
Acknowledgements
I must acknowledge the dedication, patience, hard work, creativity, and guidance from
my truly gracious advisor, Susan Broniarczyk. Susan, you have inspired, advised,
challenged, befriended, and guided me through an amazing ride. I would not be here
today without you. I have grown as a person as well as a scholar and I am forever
indebted and grateful to you. I would also like to acknowledge the hard work and
patience of my entire committee: Julie Irwin, Leigh McAlister, Jeff Loewenstein, and
Wayne Hoyer. You have stood by me, and you have challenged me to do more than I
thought possible. You have gone beyond the call of service. Leigh, thank you for
inspiring me and introducing me to the world of academia. Julie, thank you for giving me
Kahneman and Tversky and questioning my logic, but never my person. You have taught
me how to write and you are an amazing mentor, coauthor, and friend. Thank you to the
Irwin Lab—Rebecca Walker, Michael Luchs, Leonardo Nicolao, and Morgan Ward—
and my steadfast friends H. Matt Linderman, David Lazaroff, and Nita Umashankar.
Thanks to Whitney Mack and Scott Gee for their assistance in gathering and coding data
in Essay 2, and to David for aid in Essay 1. Very special thanks to Jill Griffin and Leigh
McAlister on their significant contributions to the first essay of this dissertation. Lastly,
thank you to my family for supporting and inspiring my life of learning, and for my
inquisitiveness. It probably has something to do with those four questions you always
made me ask, even when I was not the youngest at the table. Dayenu.

vi
Consumer and Retailer Strategies when Choosing from Large Assortments
Publication No._____________
Joseph K. Goodman, Ph.D.
The University of Texas at Austin, 2007
Supervisor: Susan Broniarczyk
Consumers are attracted to large assortments, but they experience negative
consequences when they ultimately must make a choice form these large assortments. In
Essay 1, four experiments examine whether a common retailer strategy—the use of
recommendations such as “best seller” signs—attenuates or exacerbates these negative
consequences. Results show that best seller signs can exacerbate decision difficulty and
regret as consumers engage in a more extensive consideration of options, and these larger
consideration sets are partly due to the increase consideration of non-signed options. The
extent to which consumers have developed preferences is a key moderator of the effect of
best seller signage on choice from large assortments. For consumers possessing more
(less) developed preferences, best seller signage in large assortments increases
(decreases) the size of consumer consideration sets and exacerbates (attenuates) decision
difficulty and regret. The resultant choice outcome is that best seller signage is more

vii
likely to increase the overall quantity purchased when consumers have more compared to
less developed preferences.
Essay 2 investigates consideration set construction strategies consumers use to
narrow down assortments into a more manageable consideration set, particularly when
faced with large assortments. Past research proposes that consumers use two strategies to
narrow down an assortment: include and exclude. Four experiments show that consumers
are more likely to use an include strategy when faced with a large compared to a small
assortment. It is argued that this preference for an include consideration set strategy is
due to the decrease in relative effort required by an include strategy as the number of
options in the set increases. The essay shows that compared to using an exclude strategy,
the use of an include strategy leads consumers to (1) form smaller consideration sets, (2)
express more (less) positive (negative) thoughts, (3) increase (decrease) the weighting of
positive (negative) attributes, and (4) elaborate more on options in the consideration set
and less on options not in the consideration set. The implications of using an include
versus exclude strategy on final choice are explored and directions for future research are
discussed.

viii
Table of Contents
List of Tables ....................................................................................................... xiii
List of Figures ...................................................................................................... xiv
INTRODUCTION 1
ESSAY I: SIMPLIFY OR INTENSIFY? THE EFFECT OF BEST SELLER SIGNAGE ON CONSUMER DECISION-MAKING FROM LARGE PRODUCT ASSORTMENTS 5
I.1: Introduction .......................................................................................................5
I.2: Psychological Consequences of Large Assortments .........................................6
I.3: Best Seller Signage............................................................................................7
I.4: Experiment 1 ...................................................................................................12
Method .........................................................................................................12
Experimental Design............................................................................12
Pretest...................................................................................................12
Procedure .............................................................................................13
Dependent Variables............................................................................13
Model ...................................................................................................14
Results ..........................................................................................................14
Manipulation Checks ...........................................................................14
Choice ..................................................................................................14
Decision Difficulty and Regret ............................................................15
Mediation Analysis ..............................................................................15
I.5: Experiment 2 ...................................................................................................16
Method .........................................................................................................17
Experimental Design............................................................................17
Pretest...................................................................................................17
Procedure .............................................................................................18

ix
Dependent Variables............................................................................18
Model ...................................................................................................19
Results ............................................................................................................9
Manipulation Checks ...........................................................................19
Choice ..................................................................................................20
Decision Difficulty and Consideration Set Size ..................................21
Regret...................................................................................................23
Mediation Analysis ..............................................................................24
I.6: Experiment 3 ...................................................................................................26
Method .........................................................................................................28
Experimental Design............................................................................28
Procedure and Dependent Variables....................................................28
Model ...................................................................................................29
Results ..........................................................................................................30
Manipulation Checks ...........................................................................30
Choice ..................................................................................................30
Decision Difficulty and Consideration Set Size ..................................30
Regret...................................................................................................32
Mediation Analysis ..............................................................................32
I.7: Experiment 4 ...................................................................................................33
Method .........................................................................................................34
Experimental Design............................................................................34
Procedure and Dependent Variables....................................................34
Model ...................................................................................................34
Results ..........................................................................................................35
Best Seller Sign Perceptions ................................................................35
Consideration Set Size and Regret.......................................................36
Choice ..................................................................................................37
I.8: General Discussion..........................................................................................39

x
ESSAY II: THE EFFECT OF INCLUDE VERSUS EXCLUDE STRATEGIES ON CONSIDERATION SET CONSTRUCTION 45
II.1: Introduction ....................................................................................................45
II.2: Theoretical Framework -- Antecedents to Consideration Set ConstructionStrategies .....................................................................................................47
Assortment ....................................................................................................47
Include versus Exclude .................................................................................48
Consideration Set Strategies versus Rules....................................................49
Assortment and Consideration Set Strategies ...............................................51
II.3: Theoretical Framework -- Consequences of Consideration Set ConstructionStrategies on Consideration Sets...................................................................52
Consideration Set Size ..................................................................................53
Attribute Weighting ......................................................................................53
Choice Phase: Decision Difficulty and Decision Regret ..............................55
Maximizers versus Satisficers.......................................................................58
II.4: Experiment Overview ....................................................................................60
II.5: Experiment 1 ..................................................................................................60
Method ..........................................................................................................60
Procedure .............................................................................................60
Dependent Measures............................................................................61
Results...........................................................................................................62
Consideration Set Strategy...................................................................62
Consideration Set Size .........................................................................62
Decision Difficulty and Decision Regret.............................................63
II.6: Experiment 2 ..................................................................................................64
Method ..........................................................................................................64
Procedure .............................................................................................65
Results...........................................................................................................66
Consideration Set Strategy...................................................................67
xi
Consideration Set Size .........................................................................68
Weighting of Thoughts and Attributes ................................................68
Type of Thoughts.................................................................................70
Decision Difficulty and Decision Regret.............................................71
Maximizer versus Satisficer.................................................................72
II.7: Experiment 3 ..................................................................................................76
Method ..........................................................................................................76
Results...........................................................................................................77
Consideration Set Size .........................................................................77
Weighting of Thoughts and Attributes ................................................77
Type of Thoughts.................................................................................78
Decision Difficulty and Decision Regret.............................................79
Maximizer versus Satisficer.................................................................80
II.8: Experiment 4 ..................................................................................................81
Method ..........................................................................................................82
Results...........................................................................................................83
Consideration Set Strategy...................................................................83
Consideration Set Size .........................................................................83
Weighting of Attributes .......................................................................84
Consideration Set Construction Difficulty...........................................84
Decision Regret....................................................................................85
Maximizer versus Satisficer.................................................................86
II.9: General Discussion.........................................................................................86
Future Research ............................................................................................88
Moderators to the use of an Include and Exclude Strategy .................88
Choice Phase........................................................................................91
Other Contextual Factors .....................................................................93
Marketing Implications and Contributions ...................................................93
Conclusion ....................................................................................................96

xii
Figures....................................................................................................................98
Tables...................................................................................................................107
Appendix A Essay I, Experiment 1 Stimuli........................................................118
Appendix B Essay II, Experiment 1 Stimuli.......................................................124
Appendix C Essay II, Experiment 2 Stimuli.......................................................128
Appendix D Essay II, Experiment 2 and 3 Cognitive Response Coding Methodology ..............................................................................................132
Bibliography ........................................................................................................135
Vita .....................................................................................................................151

xiii
List of Tables
Table 1: Essay I: Experiment 2 Regression Coefficients..............................107
Table 2: Essay I: Expeirment 2 Consideration Set Least Squares Means.....108
Table 3: Essay II: Consideration Set Literature Summary............................109
Table 4: Essay II: Include/Exclude Literature Summary..............................111
Table 5: Essay II: Definitions of Noncompensatory Decision Rules and their
Relation to Include/Exclude Strategies...........................................113
Table 6: Essay II: Experiment 2 and 3 Means by Maximizer/Satisficer.......115
Table 7: Essay II: Summary of Means across Experiments..........................116

xiv
List of Figures
Figure 1: Essay I: Experiment 1 .......................................................................98
Figure 2: Essay I: Experiment 2 .......................................................................99
Figure 3: Essay I: Experiment 3 .....................................................................100
Figure 4: Essay I: Experiment 4 .....................................................................101
Figure 5: Essay II: Experiment 1....................................................................102
Figure 6: Essay II: Experiment 2....................................................................103
Figure 7: Essay II: Experiment 2....................................................................104
Figure 8: Essay II: Experiment 2....................................................................105
Figure 9: Essay II: Experiment 4....................................................................106

1
INTRODUCTION
The more choices you have, the more likely it is you'll be able to find a program that suits your specific needs. In other words, one size fits all is not a consumer-friendly program. And I believe in consumers, I believe in trusting people…I did know that there would be some worries about having to choose from 40 different plans, but I thought it was worth it… So how do we handle the 40 different programs? Well, we encouraged all kinds of people to help—AARP is helping; NAACP is helping; sons and daughters are helping; faith-based programs are helping people sort through the programs to design a program that meets their needs. I readily concede some seniors have said, there are so many choices, I don't think I want to participate.
(President George W. Bush referring to the array of choices offered in the recently enacted Medicare Prescription Drug Benefit, 5/9/2006, www.whitehouse.gov).
The “lure of choice” is appealing to consumers (Bown, Read, and Summers 2001;
Iyengar and Lepper 2000) and it is touted by politicians as the essence of freedom. Large
assortments have several benefits for consumers as well. A large assortment of products
increases the probability that the assortment will contain a consumers’ favorite option, or
ideal point (Chernev 2003a), and it allows for more variety seeking in choice (Kahn and
Lehmann 1991; Baumol and Ide 1956). Consumers tend to reward retailers that offer
more assortment: Perceptions of variety drive store sales (Dhar, Hoch, and Kumar 2001;
Godek, Yates, and Auh 2001) and consumers are more likely to shop at stores with larger
assortments (Arnold, Oum and Tigert 1981; Broniarczyk, Hoyer, and McAlister 1998;
Hoch, Bradlow, and Wansink 1999). However, recent research suggests that certain
consumers actually prefer smaller assortments (Briesch, Chintagunta, and Fox 2006),
suggesting that some consumers may acknowledge the burden associated with larger
assortments and more store variety. In fact, when decision focus is increased such that
2
consumers are asked to focus on the difficulty of choosing from a large assortment, the
preference for a large assortment is decreased (Chernev 2006).
Behavioral research has shown that although consumers are attracted to large
assortments (Iyengar and Lepper 2000; Chernev 2003a), they are indeed overburdened
with choice and large assortments can lead to suboptimal choices, heightened decision
difficulty and regret, and even choice deferral (Broniarczyk 2006; Chernev 2003b;
Iyengar and Lepper 2000; Schwartz 2004). Thus, a pressing question for researchers and
retailers is how consumers wade through the large assortments they are faced with and
how to minimize these negative consequences. Simply providing a smaller assortment to
consumers is one solution (Broniarczyk et al. 1998; Boatwright and Nunes 2001, 2004),
but recent research suggests this can have a negative impact on sales for product that are
less frequently purchased (Borle et al. 2005) suggesting other strategies are needed.
Across two essays, this dissertation investigates whether strategies by the retailer (Essay
1) and the consumer (Essay 2) can mitigate the negative consequences of large
assortments on choice and under what circumstances these effects are likely to occur.
One strategy that a retailer may use to aid consumers faced with large assortments
in the choice process is to provide product recommendations. The first essay of this
dissertation shows that providing product recommendations, such as informing
consumers as to a “best seller”, does indeed reduce decision difficulty and regret for
consumers, but only if the consumer has less developed preferences. If the consumer has
experience with making decisions in the category and thus has relatively developed
preferences, product recommendations actually make the decision more difficult and lead
to more regret for these consumers. One important finding from this set of studies is that
the difficulty and regret partly stems from the increased size of the consumer’s
consideration set when faced with product recommendations and large assortments.

3
Essay 1 provides evidence that when faced with product recommendations in a large
assortment, the increased consideration set size is due not only to an increase in the
number of recommended options being considered, but also to an increase in the number
of non-recommended options being considered.
If, as Essay 1 suggests, a change in consideration sets is responsible for the
negative consequences associated with large assortments, consumers might change their
consideration set construction, or “screening”, strategy when faced with a larger
assortment. Essay 2 investigates the type of consideration set strategies consumers use to
help cope with large assortments. Specifically, do consumers change their usual default
consideration set strategy to generate a manageable consideration set when faced with
large assortments? Moreover, does this change in strategy, which seems appropriate
given the context, systematically change the consideration set construction process?
Essay 2 shows that large assortments are more likely to lead consumers to use include
compared to exclude strategy when constructing consideration sets. In four experiments,
Essay 2 demonstrates that consumers do indeed change their consideration set
construction strategy when faced with large assortments. Specifically, consumers were
more likely to use an include (versus exclude) strategy when faced with a large
assortment compared to a small assortment. In addition, the use of an include strategy has
systematic effects on the consideration set construction process. Compared to an exclude
strategy, an include strategy leads consumers to construct larger consideration sets and it
leads them to weigh positive (negative) attributes more (less), have more (less) positive
(negative) thoughts, and deliberate more on options that are in the consideration set and
less on options that are not in the consideration set.
In the next section I present the first essay that addresses the use of one retail
strategy on consumer choice in large assortments—product recommendations. The essay

4
briefly discusses the assortment and product recommendation literature as well. The
second essay follows with a review of the consideration set construction (include vs.
exclude) and screening literatures and how they relate to assortment.

5
ESSAY I: SIMPLIFY OR INTENSIFY? THE EFFECT OF BEST SELLER SIGNAGE ON CONSUMER DECISION-MAKING FROM
LARGE PRODUCT ASSORTMENTS
I.1: Introduction
Retailers are motivated to offer broad product assortments to satisfy a wide range
of consumer preferences. Large assortments provide the consumer with maximal
opportunity to match individual preferences and offer flexibility for variety-seeking
(Kahn and Lehmann 1991; Baumol and Ide 1956). As a result, large assortments have
been shown to result in increased store choice (Arnold et al. 1981; Broniarczyk et al.
1998) and once inside the store, increased attraction to a category’s shelf display (Iyengar
and Lepper 2000). The allure of assortments, though, often ceases when consumers must
select a single product. Iyengar and Lepper (2000) find that large product assortments
increase decision difficulty, resulting in a lower incidence of consumer purchase and
leading to higher regret if a purchase occurs.
To ensure that the negative psychological costs associated with large assortments
do not outweigh the benefits, retailers can provide tools to assist consumers in choosing
from large product assortments. These tools include various forms of recommendations
or decision aids that are intended to help simplify the decision and to mitigate the
negative psychological consequences of choice among large assortments. In this research,
we examine whether one such tool—best seller signage—is beneficial to all consumers
choosing from large assortments. We report four experiments that provide
counterevidence, finding instead that best seller signs increase the size of consumers’
consideration sets and exacerbate decision difficulty and regret when choosing from large

6
assortments. Interestingly, best seller signage is shown to increase consideration set size
by triggering consumers to consider additional non-signed options. However, best seller
signage on large assortments is shown to intensify the decision-making and regret of
consumers only if they possess more developed preferences; for consumers with less
developed preferences, the signage is shown to simplify and reduce regret. The resultant
choice outcome is that consumers with more (less) developed preferences are shown to
purchase a greater (lesser) number of product options when a best seller sign is present
versus absent.
I.2: Psychological Consequences of Large Assortments
In an ingenious field study, Iyengar and Lepper (2000) compared consumers’
reactions to 6 options (small assortment) versus 24 options (large assortment) of gourmet
jam. They showed that consumers were more attracted to a sampling station when it
offered 24 varieties of jam (60% of shoppers sampling) than when it offered 6 varieties of
jam (40% of shoppers sampling). Consumers who sampled the jam were then given a
coupon redeemable if they purchased a jam from the regular shelf display. Purchase
likelihood exhibited a distinctly different pattern: Consumers were less likely to purchase
after sampling from the large (3% purchase rate) than from the small (30% purchase rate)
assortment. That is, although consumers were initially more attracted to large than to
small assortments, they were less inclined to buy from large assortments.
Extant research in marketing has shown that increasing the size of the assortment
increases decision difficulty. Large product assortments result in consumers experiencing
higher information processing loads (Maholtra 1982) and being overwhelmed with the
number of options available (Huffman and Kahn 1998). Consistent with these findings, a

7
follow-up laboratory experiment by Iyengar and Lepper (2000) found that consumers
choosing from large compared to small assortments reported more difficulty, greater
frustration, and higher levels of regret.
I.3: Best Seller Signage
As the complexity of a decision increases, so does the cost of thinking (Shugan
1980). Faced with difficult choices, consumers may look for ways to simplify the
process. One method for retailers to help simplify the decision process is to signify a
recommended option, which assists the consumer by identifying a preferred option from
the product set. One common form of recommendation used by both bricks and mortar
retailers (e.g., Cost Plus World Market) and on-line retailers (e.g., Amazon) is to signify
the most popular products in a category via “best seller” signage.
A robust effect is that point-of-purchase signage and displays positively impact
consumer choice in store settings (e.g., Guadagni and Little 1983; Inman and Winer
1998). The positive effect of signage is attributable to its ability to attract consumer
attention in a cluttered retail environment as well as to convey product information. The
bulk of signage research has examined the effect of promotional or price signage (e.g.,
Inman, Hoyer, and McAlister 1990), and to our knowledge, research has not examined
the effect of in-store best seller recommendation signage. In-store recommendations
inform consumers of popular options or norms of the general public (Kahneman and
Miller 1986; Prelec, Wernerfelt, and Zettelmeyer 1997). This recommendation
information can reduce consumers’ search costs and uncertainty in the decision process
(West and Broniarczyk 1998; Gershoff, Broniarczyk, and West 2001). Product
recommendations have been assumed to be credible and helpful to consumers, especially

8
when consumers face a large number of product options (Ying, Feinberg, and Wedel
2006). Thus, research and retailer intuition suggests that providing recommendations in
the form of best seller signs will help consumers through the decision process by
presenting additional product information and a potential heuristic for choice.
Accordingly, signs would be expected to decrease decision difficulty, to generally make
people feel more secure in their decisions, and to reduce regret.
Recent research suggests, however, that signage may prove disconcerting if a
consumer’s preferred options are not the ones that are recommended. Fitzsimons and
Lehmann (2004) found that consumers experienced initial decision conflict to a
recommendation against a preferred option, perceiving it as an implicit choice restriction.
Their intriguing finding was that consumers ultimately experienced reactance to the
recommendation, choosing the preferred option in greater proportions and with greater
confidence.
We concur with Fitzsimons and Lehmann (2004) that recommendations may
result in the negative consequence of decision difficulty, however, we expect best seller
signage in large assortments to result in consumers experiencing greater regret rather than
greater confidence with their final chosen option. In Fitzsimons and Lehmann (2004),
reactance was primarily driven by a negative recommendation towards a dominant option
in a small (four option) assortment. We expect that consumers will be less likely to
perceive the positive recommendation of a best seller sign as a choice restriction,
especially as assortment size increases. Increasing assortment size increases the number
of attractive options and the similarity between options, thereby reducing the likelihood
of a single dominant option (Lehmann 1998). Lastly, in their studies, consumers
identified their ideal option prior to receiving a recommendation. The authors
acknowledge that their results may not “generalize to situations in which the decision

9
maker receives a recommendation either before or at the same time he or she forms an
attitude toward choice options.” (p.93, Fitzsimons and Lehmann 2004), and they call for
future research on this very topic.
This research addresses this situation proposing that the effect of best seller signs
at the point-of-purchase is dependent on the size of the assortment. The presence of a best
seller sign is posited to increase consideration of the recommended option, particularly
for large assortments. In small assortments, the option set is manageable, and hence most
good options likely receive consideration regardless of signage. However, in a large
assortment, there are likely many good options and a best seller sign is more likely to
bring an unconsidered good option to a person’s attention.
By its nature, best seller signage is most helpful and realistic when it appears on a
limited number of options (e.g., 2 or 3 options). Consequently, best seller signage is
likely to appear on a smaller percentage of the options in a large than small assortment.
For instance, if signs were placed on the two best sellers of Iyengar and Lepper’s (2000)
chocolate experiment, then 33% (two of six) of the chocolates would be designated best
sellers in the small assortment condition whereas only 7% (two of thirty) would be
designated best sellers in the large assortment condition.
For any individual the pure chance that an option marked by a best seller sign is
his/her most preferred option is lower when the assortment size is large compared to
small. Indeed, the main benefit of large assortments is that they provide maximal
opportunity for consumers to find the unique products that best match their specific
preferences (Baumol and Ide 1956). Thus, we expect that when choosing from large
(relative to small) assortments, consumers are likely to face greater decision conflict
between recommended options and non-recommended options.

10
We propose that when consumers are faced with a large assortment, the conflict
between a consumer’s preferences and the signed options is likely to lead consumers to
consider more options and increase decision difficulty. In an attempt to discern which
option to choose, consumers faced with choosing from a large assortment will expand
their consideration set to include the signed options as well as their personally most
preferred options. We expect these larger consideration sets will result in greater decision
difficulty due to higher processing load (Maholtra 1982) and decision anxiety when
choosing from an assortment with both recommended options and non-recommended
options. This conflict will then lead these consumers to another coping strategy, namely
to opt to examine additional alternatives before making a final selection (Anderson
2003). Evidence of this coping strategy would be for consumers to keep their options
open by considering additional non-signed options when choosing from a large
assortment with best seller signage (Bown et al. 2003). Signage will increase the salience
of attributes on the recommended options and stimulate consumers to examine other
options possessing these attributes. Additionally, the decision uncertainty may simply
cause consumers to cast a wider net in their decision process. In sum, best seller signage
on an attractive option in a large assortment is expected to increase the consideration set
size of consumers by two mechanisms: 1) increasing the probability of including the
recommended options and 2) increasing the probability of including additional non-
recommended options.
This strategy inadvertently leads to further negative consequences. The greater
decision difficulty engendered by best seller signage will lead consumers to elaborate
more extensively on foregone options, thereby increasing the level of post-choice
discomfort (Carmon, Wertenbroch, and Zeelenberg 2003). The likelihood of consumer
regret is also expected to increase as the number of foregone options that might have

11
been preferable to the chosen option increases. Thus, we predict that best seller signage
will increase concern for foregone options and lead consumers to experience higher
regret with their product selection when choosing from large compared to small
assortments.
In summary, we hypothesize that best seller signage will increase decision
difficulty for large relative to small assortments as consumers deliberate between the
recommended options and their own product inclinations. This initial decision difficulty
leads consumers to the coping mechanism of considering more non-recommended
options. This further increases the size of their consideration set, feeding back to even
greater decision difficulty. Greater decision difficulty and foregone options means more
elaboration, hence best seller signage in large relative to small assortments is
hypothesized to lead to higher levels of regret for consumers.
Two factors are proposed to moderate the above predictions. First, decision
difficulty is predicated to increase for consumers with established preferences that
conflict with the signage recommendation. Hence, as detailed later, we further predict
that consumer preference development will moderate the effect of best seller signage
when consumers choose in a large assortment. Second, greater regret is predicated on
consumers having the difficult decision of selecting a single option after elaborating on
an enlarged consideration set. When consumers have the opportunity to buy multiple
options, greater consideration fostered by best seller signage is predicted to lead
consumers to purchase a greater overall number of product options.
Four experiments test the predictions. The first experiment examines the effect of
best seller signage on decision difficulty and regret for large compared to small
assortments. The second experiment extends our investigation to also examine the role of
best seller signage on consideration sets as a function of assortment. The third and fourth

12
studies build on these studies and further test the moderating effect of consumer
preference development. To enhance generalizability, experiment 3 examines two new
categories. Experiment 4 extends our findings to an actual purchase situation, examining
the effect of single versus multiple purchase situations.
I.4: Experiment 1
METHOD
Experimental Design
The experiment was a 2(Assortment: Large vs. Small) x 2(Recommendation
Signage: Control vs. Best Seller Sign) between-subjects design. Assortment size was a
between-subject factor that varied whether participants were presented with either a large
(30 options) or a small (6 options) assortment of Godiva chocolates. Signage was a
between-subjects factor manipulating the presence of best seller signs. Participants in the
Control condition saw name cards associated with each chocolate. Participants in the Best
Seller Sign condition saw the same name cards with a red “Best Seller” sign attached to
the name cards of the two chocolates most frequently chosen in the pretest. Note that we
used the same product context, Godiva chocolates, as Iyengar and Lepper (2000).
Pretest
In order to create a small assortment with the same range of options as offered in
the large assortments, 27 undergraduate students were polled regarding their preferences
for chocolates. They were shown a display of thirty Godiva chocolates and were asked to
indicate which four they would be most likely to buy and which four they would be least
likely to buy. A 6 option assortment was constructed by selecting two of the most

13
preferred options, two of the least preferred options, and two mid-preference options in
such a way that all levels of important category attributes (chocolate type, filling, nuts,
etc.) were represented.
Procedure
One hundred forty-three undergraduate students participated in the experiment for
extra credit. Participants were run individually and shown a display of either a large or a
small assortment of chocolates. They selected a chocolate and then answered a
questionnaire containing questions measuring decision difficulty and anticipated regret.
Afterwards, they then entered another room and received their chocolate and completed
measures of perceived selection and category involvement.
Dependent Variables
The dependent variables were measured using 7-point Likert scales (1=Not At All
to 7=Extremely). Decision difficulty was the average of four questions addressing
decision difficulty and the extent to which participants were overwhelmed, frustrated, and
annoyed by the choice (α = 0.75). Anticipated regret is the average of two retrospective
measures (“When you were trying to decide, how concerned were you that other choices
might be better than the one you were considering?” and “When you were trying to
decide, how concerned were you that you might regret your decision?” α = 0.76).
Participants’ level of enduring involvement with the experimental category is the average
of three questions probing importance of category knowledge, category interest, and
frequency of thoughts about the category (adapted from Zaichkowsky 1985, α = .88).
Lastly, as a manipulation check, subjects responded to a 7-point scale that queried their
perception of the selection of chocolates (1=Too few to choose from, 4=Right number of

14
choices to choose from, and 7= Too many to choose from). The actual stimuli used are
presented in Appendix A.
Model
The data were analyzed using an ANCOVA model with independent variables of
Assortment, Sign, Assortment X Sign interaction, and the covariate of Involvement.
RESULTS
Manipulation Checks
The manipulation of assortment was verified with participants perceiving more
selection in the large (M = 5.75) than in the small (M = 3.87) assortment condition [F(1,
139) = 79.78, p < 0.01]. The least squares means for the dependent variables of decision
difficulty and anticipated regret are presented in Figure 1.
Choice
Participants were more likely to choose one of the two best selling chocolates in
the small than large assortment condition [2(1) = 26.41, p < .001]. However, signage did
not affect the choice likelihood of the two best seller options [2 (1) < 1] nor was there an
interaction with assortment [2(1) = 1.52, p = .22, large assortment: MSign= .22 vs.
Mcontrol= .11 and small assortment: MSign= .59 vs. Mcontrol= .63]. If we assume that signs
are a default option, then the fact that signage did not affect choice is somewhat
surprising as one possible coping strategy to deal with large assortments would be to
choose the status quo or default option (Anderson 2003; Luce 1998). Rather than change
the decision outcome, that signage did change the decision process and subjective
outcomes experienced by participants.

15
Decision Difficulty and Regret
Participants experienced greater decision difficulty as the size of the assortment
increased [MLargeAssort= 2.85 vs. MSmallAssort= 2.08, F(1,139) = 26.29, p < .01]. We
hypothesized that best seller signs would not alleviate this decision difficulty for large
assortments but rather exacerbate it. Consistent with this prediction, we observe a
significant Assortment X Sign interaction for decision difficulty [F(1,139) = 4.54, p <
.04]. Best seller signage heightened decision difficulty relative to the control condition
when the assortment was large [Msign= 3.21 vs. Mcontrol= 2.49, F(1,139) = 9.42, p < .01]
but not small [Msign= 2.09 vs. Mcontrol= 2.08, F(1,139) < 1]. Thus, the results support the
prediction that best seller signage does not assist consumers choosing from a large
assortment but rather leads to increased decision difficulty.
We find that participants reported greater anticipated regret when making a choice
from a large compared to a small assortment [MLargeAssort= 3.68 vs. MSmallAssort= 3.15,
F(1,139) = 5.10, p < .05]. We predicted that recommendation signs would exacerbate the
anticipated regret consumers experienced when choosing from a large assortment.
Supporting this prediction, we observe a significant Assortment X Sign interaction
[F(1,139) = 4.29, p < .05] such that best seller signage increased anticipated regret
relative to the control when the assortment was large [Msign= 3.98 vs. Mcontrol= 3.39 ,
F(1,139) = 3.13, p =.08] but not small [Msign= 2.96 vs. Mcontrol= 3.35, F(1,139) = 1.37, p
> .2]. Thus, consumers reported being more concerned about foregone alternatives
especially when recommendation signage was employed in a large assortment.
Mediation Analysis
Following the multi-step process of Baron and Kenney (1986), mediation analysis
was conducted to test whether decision difficulty is a driver of anticipated regret.
Decision difficulty is significantly related to anticipated regret [b = .74, t(142) = 7.85 p <

16
.01] and as mentioned above, the Assortment X Sign interaction significantly impacts
decision difficulty [b = .18, t(139) = 2.13, p < .05]. When decision difficulty is included
in the regression analysis for the effect of Assortment X Sign interaction on anticipated
regret, the effect is reduced from b = .25 [t(139) = 2.01, p < .05] to b = .11 [t(138) = 1.11,
p = .27]. A Sobel (1982) test confirms that decision difficulty is a significant mediator
between Assortment X Sign and anticipated regret (z = 2.04, p = .05). Thus, best seller
signs increase consumers’ anticipated regret by increasing decision difficulty.
In summary, this experiment examined the marketing intervention of best seller
signs designed to simplify consumers’ decisions when choosing from large assortments.
We found, however, that the signage intervention did not simplify participants’ decisions.
Instead, recommendation signs raised the level of decision difficulty and anticipated
regret for consumers in large compared to small assortments without swaying choice.
I.5: Experiment 2
Experiment 2 extends experiment 1 in three meaningful ways. First, we gain
further insight into the process by which signage increased regret in large assortments by
examining consideration sets. Our proposition was that choice deliberations would be
difficult if one were faced with a choice between a recommended option and a non-
recommended option that was more preferred. We postulated that this decision difficulty
would lead consumers to have larger consideration sets. In this experiment, we examine
the size and composition of consumers’ consideration sets as a function of assortment
size and best seller signage. Specifically, we expect that consumers choosing from large
assortments will react to best seller signage by including both a greater number of signed

17
and non-signed options in their consideration sets and that this will result in higher levels
of decision difficulty and regret.
Second, we manipulate the attractiveness of the option designated with signage.
Recall that the majority of experiment 1 large assortment subjects (80%) did not choose
the best seller option, signifying high levels of sign non-compliance. By varying the
attractiveness of the signed option, we can examine the extent to which the higher regret
levels for choosing from a large (vs. small) assortment is the result of mere unease
attributable to recommendation noncompliance or is due to increased consideration of
foregone alternatives. When signage is placed on less attractive options, consumers are
not expected to increase consideration of signed options. Hence, any regret would be due
to sign non-compliance rather than to increased elaboration upon foregone options. On
the other hand, when signage is placed on highly attractive options, we would expect
consumers to seriously consider these options, with higher regret driven by the increase
in appealing foregone alternatives.
Third, the regret measure is extended to include both anticipated and experienced
regret. We expect that the larger consideration sets and greater decision difficulty will
lead participants to report higher levels of experienced regret following consumption of
their chosen chocolate.
METHOD
Experimental Design
The experiment was a 2(Assortment: Large vs. Small) x 3(Recommendation
Signage: Control, Low Attractive, High Attractive) between-subjects design. The
Assortment factor varied whether participants were presented with either a large (30
options) or a small (6 options) assortment of Godiva chocolates. The Signage factor
18
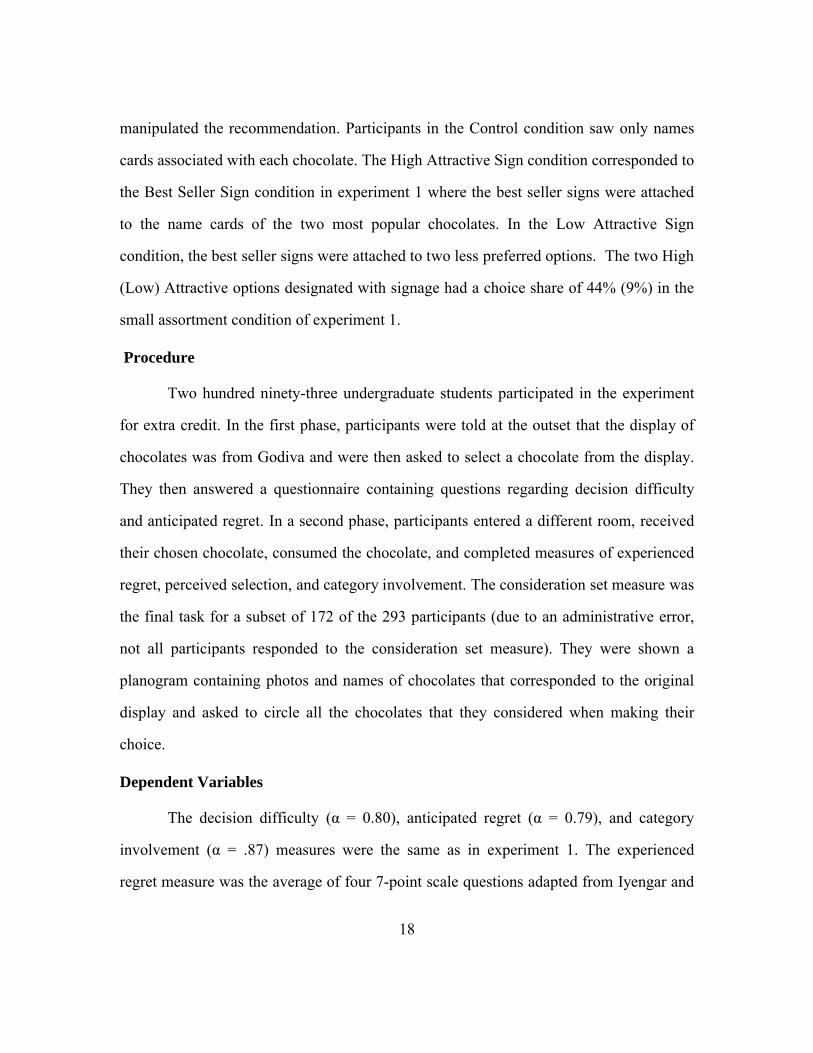
manipulated the recommendation. Participants in the Control condition saw only names
cards associated with each chocolate. The High Attractive Sign condition corresponded to
the Best Seller Sign condition in experiment 1 where the best seller signs were attached
to the name cards of the two most popular chocolates. In the Low Attractive Sign
condition, the best seller signs were attached to two less preferred options. The two High
(Low) Attractive options designated with signage had a choice share of 44% (9%) in the
small assortment condition of experiment 1.
Procedure
Two hundred ninety-three undergraduate students participated in the experiment
for extra credit. In the first phase, participants were told at the outset that the display of
chocolates was from Godiva and were then asked to select a chocolate from the display.
They then answered a questionnaire containing questions regarding decision difficulty
and anticipated regret. In a second phase, participants entered a different room, received
their chosen chocolate, consumed the chocolate, and completed measures of experienced
regret, perceived selection, and category involvement. The consideration set measure was
the final task for a subset of 172 of the 293 participants (due to an administrative error,
not all participants responded to the consideration set measure). They were shown a
planogram containing photos and names of chocolates that corresponded to the original
display and asked to circle all the chocolates that they considered when making their
choice.
Dependent Variables
The decision difficulty (α = 0.80), anticipated regret (α = 0.79), and category
involvement (α = .87) measures were the same as in experiment 1. The experienced
regret measure was the average of four 7-point scale questions adapted from Iyengar and

19
Lepper (2000) and Inman and Zeelenberg (2002): how much regret, are you sorry, should
you have chosen differently, were there better options (α = 0.93). Participants then
completed the experiment 1 manipulation check regarding perception of the selection of
chocolates in the display as well as their perception of the believability of the
recommendation signage (1=Not at all, 7=Extremely). Consideration set size was
measured as the number of chocolates that participants circled as considering on the
planogram. Appendix A presents the actual stimuli used in the experiment.
Model
The data were analyzed using a linear regression model controlling for the effects
of Involvement with the independent variables of Assortment (Large vs. Small), Sign
(High Attractive, Low Attractive, Control), and their higher order interactions. The
analyses used orthogonal contrast codes to partition the sum of squares for the three sign
conditions (Rosenthal, Rosnow, and Rubin 2000). The first contrast code compared the
Low Attractive sign to the Control condition to examine the extent to which sign non-
compliance impacted the results. The second contrast code compares the High Attractive
sign condition to the other two conditions (Low Attractive and Control) to examine the
extent to which increased consideration of options impacted the results. Each model
included terms for involvement, assortment size, the two contrast codes, and the two
interactions between the contrast codes and assortment.
RESULTS
Manipulation Checks
Participants perceived more “selection” in large (M = 5.50) than in small (M =
3.91) assortments [F(1,278) = 104.74, p < .001] validating the manipulation of
assortment. Furthermore, participants found no significant difference in the believability

20
of the recommendation signage in the high (M = 4.25) and low (M =3.85) attractive sign
conditions [F(1,119) = 1.88, p = .17].
The regression coefficients for the complete model are presented in Table 1.
Analyses of the first contrast showed that the low attractive sign condition did not differ
from the control condition as a function of assortment for any of the dependent variables
(all p’s > .20). These results are inconsistent with the notion that mere unease at choosing
against the sign (i.e., sign non-compliance) leads to higher levels of decision difficulty
and regret for large relative to small assortments. The results are consistent with a
decision difficulty and consideration set size explanation of the results.
Below, we report the results of the second contrast comparing the high attractive
sign to the other two conditions (i.e., low attractive sign and control conditions) to
examine the extent to which increased consideration of the signed option leads to higher
regret as a function of assortment. Least squares means for the dependent variables of
consideration set size, decision difficulty, anticipated regret, and experienced regret are
presented in Figure 2.
Choice
As expected, participants were more likely to choose a high attractive (M = .36)
than a less attractive option (M = .06), and more likely to choose high attractive options
in small versus large assortments [χ²(1) = 38.06, p < .001]. However, replicating
experiment 1, signage did not alter choice results as a function of assortment [χ²(1) < 1].1
We report next how signage did affect the decision process as a function of assortment.
1 Experiment 2 choice results for high attractive options were 54% for small assortment [HighAttract= 51%, LowAttract= 54% and Control= 59%] compared to 18% for large assortment [HighAttract= 17%, LowAttract= 15% and Control= 21%]. The choice results for low attractive options were 11% for small assortment [HighAttract= 4%, LowAttract= 15% and Control= 14%] compared to 1% for large assortment [HighAttract= 0%, LowAttract= 2% and Control= 0%].

21
Decision Difficulty and Consideration Set Size
We find that participants experienced greater decision difficulty as the size of the
assortment increased [MLargeAssort= 2.72 vs. MSmallAssort= 2.27, F(1,279) = 13.02 , p < .01].
Consistent with our prediction, we observe a significant Assortment X Sign interaction
for decision difficulty [F(1,279) = 6.67, p = .01]. Specifically, recommendation signage
further heightened decision difficulty for a large assortment in the high attractive sign
condition (MHighAttract= 3.28) compared to the low attractive sign and control conditions
[MLowAttract= 2.42 and MControl= 2.46, F(1,279) = 18.31, p < .01]. As expected,
recommendation signage did not differentially impact decision difficulty for small
assortments [MHighAttract= 2.31 vs. MLowAttract= 2.27 and MControl= 2.24, F(1,279) < 1].
Thus, best seller signs did not alleviate decision difficulty but rather exacerbated it if
placed on high attractive options.
Looking at consideration set sizes we see that the size of the consideration set was
greater for large (M = 4.31) compared to small (M = 2.57) assortment conditions
[F(1,165) = 41.88, p < .01]. Consistent with the hypothesis, we observe a significant
Assortment X Sign interaction on consideration set size [F(1,165) = 6.24, p < .05].
Specifically, in a large assortment, consideration set size was greater in the high attractive
sign condition (MHighAttract= 5.30) than in the low attractive sign and control conditions
[MLowAttract= 3.60 and Mcontrol= 4.02, F(1,165) = 12.80, p < .01]. As expected, signage in
small assortments did not affect consideration set size as the set size was manageable
from the start [MHighAttract= 2.60 vs. MLowAttract= 2.66 and Mcontrol= 2.44, F(1, 165) < 1].
Table 2 reports mean consideration set size and composition as a function of condition.
Next we partition the consideration set size into (a) consideration of the two best-
selling, high attractive options and (b) consideration of the other 28 (4) non-signed
alternatives in the large (small) assortment. Examining whether the number of best-
22
selling (i.e., high attractive) options (range 0-2) in the consideration set differed as a
function of assortment and signage, we observe a significant interaction of Assortment X
Sign [F(1,165) = 4.23, p < .05]. Consistent with predictions, a greater number of high
attractive options were included in a consideration set when signed (MHighAttract= 0.67)
versus when not signed [MLowAttract= .29 and MControl= .38, F(1,165) = 5.09, p < .05] in the
large assortment condition. As expected, in the small assortment condition
recommendation signage did not effect the number of high attractive options included in
consideration sets [MHighAttract= 1.06 vs. MLowAttract= 1.14 and MControl= 1.16, F(1,165) <
1]. Furthermore, signage on the low attractive options did not differentially affect their
likelihood of consideration as a function of assortment [Assortment X Sign F(1,165) < 1].
Thus, best seller signage increased the likelihood that a signed option was included in a
participant’s consideration set only when it was placed on a high attractive option in a
large assortment.
Testing whether the conflict caused by recommendation signage on high attractive
options in large assortments led participants to consider more non-signed options, we
observe an Assortment X Sign interaction for inclusion of other options in the
consideration set [F(1,165) = 3.21, p = .075]. Specifically, participants choosing from
large assortments included a greater number of other options in their consideration sets in
the high attractive best seller condition (MHighAttract= 4.63) relative to the low attractive
sign and control conditions [MLowAttract= 3.31 and Mcontrol= 3.71, F(1,165) = 7.94, p < .01].
As expected, best seller signage did not affect the number of other options included in
consideration sets in the small assortment condition [MHighAttract= 1.53 vs. MLowAttract=
1.51 and Mcontrol= 1.29, F(1,165) < 1]. Thus, best seller signage on a high attractive
option in a large assortment increased the likelihood that subjects considered additional
non-signed options.

23
Regret
We find that participants reported greater anticipated regret [MLargeAssort= 4.00 vs.
MSmallAssort= 3.26, F(1,279) = 14.76, p < .01] and greater experienced regret [MLargeAssort=
2.67 vs. MSmallAssort= 2.14, F(1,262) = 8.80, p < .01] when choosing from a large
compared to small assortments. Supporting the predictions, best seller signage
exacerbated the anticipated regret consumers experienced when choosing from a large
assortment, particularly for signs on high attractive options (Assortment X Sign
interaction, F(1,279) = 2.96, p = .088). Specifically, the results show that
recommendation signage heighted anticipated regret for a large assortment in the high
attractive sign condition (MHighAttract= 4.37) relative to the low attractive sign and control
conditions [MLowAttract= 3.92 and MControl= 3.71, F(1,279) = 3.71, p = .055]. As expected,
recommendation signage did not differentially affect anticipated regret for a small
assortment [MHighAttract= 3.17 vs. MLowAttract= 3.51 and MControl= 3.11, F(1,279) < 1].
Further corroborating predictions, we observe a significant Assortment X Sign
interaction for experienced regret [F(1,279) = 4.46, p < .05] that shows the same pattern
of results as anticipated regret. Consistent with expectations, best seller signage in the
large assortment condition heightened experienced regret more in the high attractive sign
condition (MHighAttract= 2.93) than in the low attractive sign and control conditions
(MLowAttract= 2.58 and MControl= 2.51), though the difference was not reliable [F(1,262) =
2.15, p = .14]. Best seller signage in small assortments exhibited a different pattern of
results with experienced regret higher when on a low attractive option and control
(MLowAttract= 2.54 and MControl= 2.01) compared to the high attractive option [MHighAttract=
24
1.87, F(1,262) = 2.32, p = .129].2 Thus, best seller signage seemed to differentially
affected experienced regret as a function of assortment.
Mediation Analysis
The proposed framework posits that the Assortment X Sign interaction influence
on regret is mediated through decision difficulty and consideration set size. Following the
multi-step process of Baron and Kenny (1986), we find support for the framework.
Testing for decision difficulty mediation, we find that decision difficulty is significantly
related to experienced regret [b = .36, t(266) = 4.73, p < .001], and the Assortment X
Sign interaction significantly influences decision difficulty, as previously noted [b = .13,
t(279) = 2.83, p < .01]. When we include decision difficulty in the regression model of
experienced regret on Assortment X Sign, the slope is reduced from b = .13 [t(262) =
2.11, p < .05] to b = .09 [t(261) = 1.51, p = .13]. A Sobel (1982) test confirms that
decision difficulty is a significant mediator between Assortment X Sign and experienced
regret (z = 2.32, p < .05). Similarly, testing for consideration set size mediation, we find
that consideration set size is significantly related to experienced regret [b = .22, t(156) =
3.79, p < .01], and the Assortment X Sign interaction significantly influences
consideration set size [b = .24, t(165) = 2.50, p < .05]. When we include consideration set
size in the regression model of experienced regret onto Assortment X Sign, the slope is
reduced from b = .20 [t(152) = 2.33, p < .05] to b = .13 [t(151) = 1.53, p = .13]. A Sobel
(1982) test confirms that consideration set size is a significant mediator between
Assortment X Sign and experienced regret (z = 2.11, p < .05).
2 The small assortment condition exhibited the expected equivalent levels of experienced regret for the high attractive sign relative to the control condition [MHighAttract= 1.87 vs. MControl= 2.01, t(84) < 1]. Interestingly, participants who chose from a small assortment exhibited higher levels of experienced regret when the best seller signage was on a low attractive option [MLowAttract= 2.54 vs. MControl= 2.01, t(88) = 1.72, p = .09]. Though this result is marginally significant, it provides some evidence that sign non-compliance may lead to experienced regret for small assortments.

25
In summary, experiment 2 results show that best seller signage in large
assortments led to greater difficulty and consideration set sizes as well as increased
anticipated and experienced regret when the signage was placed on an attractive option.
Mediation analyses show that when consumers chose from a large assortment employing
signage on high attractive options, decision difficulty and consideration set size
increased, thus exacerbating experienced regret. Interestingly, signage on high attractive
options in large assortments increased consideration set size both by increasing the
likelihood that more signed options, as well as more non-signed options, were included in
the consideration set. This result suggests that signage on high attractive options actually
leads participants to reconsider their choice and extend search beyond their norm.
However, when signage was on low attractive options, it is easier for consumers to ignore
the sign in their decision process resulting in no heightening of decision difficulty and no
change in consideration set size.
One potential limitation of experiment 1 and 2 is that we used a single
composition of the small assortment. We intentionally created the small assortment to
contain the breadth in attributes found in the large assortments (milk, white, and dark
chocolate as well as nuts and fruit were all represented) as retailers are able to satisfy
different consumer segments. Another retailer strategy may be to comprise the small
assortment of highest market share options. Thus, we conducted a follow-up experiment
of 114 participants from a similar population to test the robustness of results to small
assortment composition. The experiment was a 2(Small Assortment Composition:
Attribute Breadth vs. High Market Share) x 2(Recommendation Signage: Control vs.
Best Seller Sign) between-subjects design. Results showed that changing the composition
of the small assortment did not have a significant effect on decision difficulty, anticipated
regret, or consideration set size (F’s < 1). Though these null effects should be interpreted

26
with caution, they do suggest that the results appear to be robust to the composition of the
small assortment.
I.6: Experiment 3
The first two experiments have provided evidence that signage in large
assortments signage leads to greater consideration sets and decision difficulty and
heightened feelings of regret. Next we examine if these findings are dependent on the
extent of consumers’ preference development.
Prior research has shown that consumer preference development in the product
category moderates the difficulty of choosing from large assortments. Choosing from an
assortment has been shown to correspond to a hierarchical two-stage process of first
deciding an ideal attribute combination and then locating the product in the assortment
that best matches this ideal (Kahn and Lehmann 1991, Chernev 2003b). Chernev (2003b)
found that consumers with more developed preferences had an easier time choosing from
large assortments as product choice was a single stage process of identifying which
product best matched their established product preference. Conversely, choosing from
large assortments was more difficult for consumers who possess less developed product
preferences. For consumers with less developed preferences, choice was a two-stage
process of first determining their product preferences in the challenging high cognitive
load of a large assortment and then locating the product in the assortment that best
matches this product preference.
In contrast, we expect that signage will hinder the decision-making of consumers
with more developed preferences and help the decision-making of consumers with less
developed preferences. In this research, we propose that the heightened decision

27
difficulty from best seller signage stems from the conflict of consumers deliberating
between the recommended options and their own product inclinations. This proposition is
dependent upon consumers having relatively strong product inclinations in the first place.
Retailers have expanded assortment sizes specifically to accommodate the unique and
diverse preferences of customers with developed preferences. Yet, we predict that
signage will inadvertently be detrimental to this key group of customers, resulting in
greater decision difficulty, consideration set sizes, and regret when consumers with well
developed preferences choose from large assortments. Conversely, if a consumer does
not have well developed preferences, then by definition the sign cannot conflict and it
should help in the decision making process. However, it is important to note that at the
very extreme consumers with one single a priori favorite option will simply choose their
favorite option and ignore any signage. We propose that the moderating effect of
preference development should only hold for consumers that are not extremely brand or
product loyal or for consumers making routine or repeat purchases.
Past research has shown that low knowledge consumers often utilize extrinsic
cues as an indicator of product quality (Rao and Monroe 1988). We therefore expect that
consumers with less developed preferences will be likely to use the best seller sign as a
decision aid or heuristic to assist in choosing from an assortment. Consequently, best
seller signage is predicted to reduce decision difficulty, consideration set size, and regret
when consumers with less developed preferences choose from large assortments. In
experiment 3, we manipulate participants’ preference development and test this
moderating prediction in two new categories, chairs and specialty juices.
28
METHOD
Experimental Design
The experiment was a 2(Recommendation Signage: Control vs. Best Seller
Signage) x 2(Preference Development: Less developed vs. More developed Rating) x
2(Category Replicate: Juices and Chairs, within-subject) x 2(Replicate Order) mixed
design. The Best Seller Signage condition corresponded to experiment 1 and the High
Attractive Sign condition in experiment 2 where a best seller sign was placed on the two
most preferred options. The Preference Development manipulation varied whether
participants rated their preference for each available attribute level prior to viewing the
category options. Category replicate was a within-subject factor with participants making
choices in both the specialty juice and chair categories. All other factors were between-
participants. Only the large assortment condition was examined.
All participants were given information on important attributes in the product
category (e.g., “Juice Type”) and the possible values they can hold (e.g., “Juice Blends,
Nectars, Organic, Vitamin-Fortified”). Consistent with the procedure of Huffman and
Kahn (1998) and Chernev (2003b), preference development was manipulated by whether
or not participants were instructed to think about and express their attribute level
preferences. Participants in the less developed preference condition only received
attribute information. In addition to this information, participants in the more developed
preference condition rated their preferences for each attribute level.
Procedure and Dependent Variables
Ninety seven undergraduate students participated in the experiment for extra
credit. They were given paper-and-pencil booklets in groups of one to thirteen. They
were told that a new store in town was interested in their product opinions in several
29
product categories. To increase the realism of the task, participants were informed that
several participants from the study would be randomly chosen to receive one of the
products chosen in their booklet. For each product category, they first read attribute
information. Those in the More Developed Preference condition then rated their
preferences for each attribute level on a 7-point scale (1=Strongly Dislike to 7=Strongly
Like). In a change from experiment 2, we measured consideration sets before rather than
after choice. Participants first viewed the display of 30 product options offered in the
category in planogram format (5 rows of 6 products) and were asked to provide their
consideration set by circling, “All the options(s) you would consider purchasing.” They
were then subsequently asked to indicate which single product option from those circled
they would be most likely to purchase. Participants then answered questions regarding
decision difficulty and anticipated regret for that category replicate. This process was
repeated for the second category replicate. After completing choices in both category
replicates, category involvement was measured as in prior studies.
The decision difficulty (α = .82 and .86, juices and chairs, respectively),
anticipated regret (α = .75 and .81), and category involvement (α = .85 and .91) in each
product replicate measures were comparable to those in experiments 1 and 2.
Model
The data was analyzed using an MANCOVA model with independent variables of
Recommendation Sign, Preference Development, Replicate Order, all higher-order
interactions, and the juices and chairs category involvement covariates. Product Replicate
was analyzed as a repeated measure. No reliable order or replicate effects were found for
the regret and decision difficulty dependent measures so they were averaged across
product replicates. To minimize the effect of outliers, only participants who were within
two standard deviations of the mean consideration set size (i.e., those with consideration

30
sets smaller than 14) were included in the analyses. Order X Product Replicate effects
were found for the consideration set measures, thus only the first product category was
analyzed.
RESULTS
Manipulation Checks
The manipulation of preference development was verified with participants
expressing more subjective knowledge in the more developed preference (M = 3.76) than
the less developed preference (M = 3.47) condition [F(1,208) = 4.01, p < .05]. Least
squares means for the dependent variables of decision difficulty, anticipated regret, and
consideration set size are presented in Figure 3.
Choice
Consistent with our previous studies, participants in experiment 3 were no more
likely to choose a best seller when the sign was present [χ2(1) < 1] and there was no
interaction with preference development [χ2(1) < 1].
Decision Difficulty and Consideration Sets
Supporting the prediction, we observe a Sign X Preference Development
interaction indicating that the effect of signage on decision difficulty depended on
whether participants had developed their preferences prior to choice [F(1,199) = 6.96, p <
.01]. Participants with less developed preferences experienced less decision difficulty
when a sign was present versus absent [MControl= 2.55 vs. MSign= 2.18, F(1,199) = 1.14, p
= .09]. In contrast, participants with more developed preferences experienced the
opposite pattern of results experiencing greater decision difficulty when a sign was
present [MControl= 2.23 vs. MSign= 2.70, F(1,199) = 4.08, p < .05].

31
Consistent with predictions, we observe a marginal Sign X Preference
Development interaction indicating that the effect of signage on consideration set size
was dependent upon preference development. [F(1,143) = 2.79, p = .097]. Participants
with less developed preferences reported marginally smaller consideration set sizes when
a sign was present versus absent [MControl= 6.64 vs. MSign= 5.53, F(1,143) = 2.69, p =
.10]. In contrast, participants with more developed preferences reported directionally
larger consideration sets when a sign was present, however this result did not attain
significance [MControl= 6.36 vs. MSign= 6.89, F(1,143) < 1].
We further examined how signage affected the likelihood that signed compared to
non-signed options were included in the consideration set. Surprisingly, signage did not
affect the likelihood a best seller was included in the consideration set nor interact with
preference development (p’s >.20). However, corroborating prior results, the likelihood
that non-signed options were included in the consideration set was dependent on signage
and preference development [Sign X Preference Development interaction, F(1,143) =
3.03, p = .069]. Participants with less developed preferences included marginally fewer
non-signed options in their consideration sets when a sign was present versus control
[MControl= 5.57 vs. MSign= 4.54, F(1,143) = 2.43, p = .12]. In contrast, participants with
more developed preferences were directionally more likely to include more non-signed
options in their consideration sets when a sign was present, although this was not reliable
[MControl= 5.29 vs. MSign= 6.00, F < 1]. Thus, when consumers with less developed
compared to more developed preferences were choosing from a large assortment, signage
seemed to be more likely to reduce the size of their consideration sets, having no effect
on the likelihood of considering signed options and reducing the likelihood of
considering non-signed options.
32
Regret
As predicted, we also observe a Sign X Preference Development interaction
indicating that the effect of signage on regret was dependent upon preference
development [F(1,199) = 3.99, p < .05]. Participants with less developed preferences
experienced less regret when a sign was present versus control [MControl= 3.34 vs. MSign=
2.83, F(1,199) = 4.12, p < .05]. In contrast, signage did not affect the regret reported by
participants with more developed preferences [MControl= 2.93 vs. MSign= 3.14, F(1,199) <
1].
Mediation Analysis
We proposed that the Sign X Preference Development interaction influences
regret for large assortments via decision difficulty and consideration set size. We find
partial support for our framework with significant decision difficulty mediation and non-
significant consideration set mediation. Decision difficulty is significantly related to
experienced regret [b = .63, t(209) = 9.83, p < .001], and the Sign X Preference
Development interaction significantly influences decision difficulty, as previously noted
[b = .21, t(199) = 2.64, p < .01]. When we include decision difficulty in the regression
model of experienced regret on Sign X Preference Development, the slope is reduced
from b = .18 [t(199) = 2.00, p < .05] to b = .05 [t(198) < 1]. A Sobel (1982) test confirms
that decision difficulty is a significant mediator between Sign X Preference Development
and regret (z = 2.55, p < .05).
In summary, the results from experiment 3 show that the effects of the best seller
sign are dependent upon preference development. Signs were shown to be helpful to
consumers with less developed preferences leading to a less difficult decision, smaller
consideration sets, and less regret. Conversely, best seller signs did not assist participants
with more developed preferences and instead led to greater decision difficulty.

33
I.7: Experiment 4
Experiment 4 further examines the moderating effect of preference development
on consumer reaction to best seller signage when choosing from a large assortment. In
experiment 3 we found more reliable results for the effect of signage on consumers with
less developed relative to more developed preferences, perhaps because the preference
development manipulation was not completely successful in establishing well developed
preferences for the two unfamiliar categories. Hence, in experiment 4, we return to our
examination of a more familiar category, chocolates, and measure the extent of
preference development via consumers’ subjective knowledge.
Second, experiment 4 explores further the implications of differential
consideration set size as a function of best seller signage and consumer preference
development. Best seller signage was shown to increase (decrease) the decision
difficulty and consideration set size of consumers with more (less) developed
preferences. The difficulty associated with more (less) extensive consideration of options
was shown to lead to more (less) regret when restricted to selecting a single option. We
posit that the extent of option deliberation and consideration will have implications for
purchase quantity. One of the benefits of large assortments is their ability to
accommodate variety-seeking (McAlister 1982). We expect that the more (less) extensive
consideration of options by participants with more (less) developed preferences will
stimulate their desire to purchase a greater (fewer) number of product options. That is,
for subjects with more (less) developed preferences, best seller signage increases
(decreases) option deliberation leading to an increased (decreased) desire to purchase
multiple options and more (less) regret if one is only able to purchase a single option. To

34
test this prediction, experiment 4 manipulates whether participants had to buy one option
or could buy multiple options.
Experiment 4 has two other noteworthy changes. To increase the external validity
of the experiment, participants made real choices using real money. Finally, We also
gathered cognitive responses to better understand participants’ perceptions of best seller
signage.
METHOD
Experimental Design
The experiment was a 2(Recommendation Signage: Control vs. Best Seller Sign)
x 2(Number of Choices: Single vs. Multiple Choice) X Preference Development
(Measured) design. Recommendation Signage was a between-subjects factor manipulated
in the same fashion as experiment 1. In the Single Choice condition participants were
only allowed to purchase one option (as in previous studies). In the Multiple Choice
condition participants were allowed to purchase additional options in exchange for the
money they were given at the beginning of the experiment. Preference Development was
a measured variable assessing a consumer’s subjective knowledge in the category. Only
the large assortment condition was examined.
Procedure and Dependent Variables
A total of 151 undergraduate students participated in the experiment for extra
credit. Participants were greeted by the experimenter individually and given $3 to
simulate a real shopping situation. Participants were told that they had entered a store to
buy chocolate, each chocolate cost $.50 each, and their “task is to purchase (at least) one
chocolate” in the Single (Multiple) Choice condition. After viewing the display and
informing the experimenter of their decision, participants were taken to a computer and

35
answered the same questions regarding decision difficulty, anticipated regret, and
consideration set size. Category involvement and subjective knowledge were then
measured. Five questions measuring subjective knowledge on a 7-point scale (α = .85)
were adapted from Mitchell and Dacin (1996): “…my knowledge of chocolates is:”, “I
know a lot about chocolates.”, “How clear an idea do you have about which
characteristics are important in providing you maximum satisfaction in chocolates?”,
“How frequently do you purchase chocolates?”, and “How frequently do you purchase
Godiva chocolates?” Participants in the signage condition then answered open-ended
questions regarding what they thought the best seller sign meant, how the best seller sign
affected their decision, and rated believability of best seller sign on a 7-point scale.
Model. The data was analyzed using linear regression controlling for the effects of
Involvement with the independent variables of Recommendation Signage, Number of
Choices, the continuous measure of Subjective Knowledge, and their higher order
interactions. All variables were mean centered at zero (Irwin and McClelland 2001). For
expository purposes, the continuous measure of subjective knowledge was plotted at one
standard deviation above and below the mean (Muller, Judd, and Yzerbyt 2005) in the
results reported below. Results are displayed in Figure 4.
RESULTS
Best Seller Sign Perceptions
An analysis of the open-ended questions regarding the best seller signs found that
the vast majority of participants interpreted the signage as intended with 71 of the 75
participants (95%) viewing the signs as designation of the most frequently purchased/sold
option. Only 1 participant questioned whether the signage was a marketing ploy.
Believability did not differ as a function of preference development, the number of

36
choices, or their interaction (F’s < 1.6, p’s > .2). When asked whether the signs affected
their decision, 53 out of the 75 participants (71%) thought that the sign did not affect
their decision with less developed preference participants more likely to express this
response [χ²(1) = 3.68, p = .055]. Eighteen of the 75 participants (24%) reported that the
sign helped their decision and no one indicated that it hurt their decision process.
Preference development did not significantly affect whether participants felt it helped or
hurt the decision process. These results suggest that participants viewed the signage as
intended as an additional input into their decision and did not appear to be aware of its
potential impact on their decision process.
Consideration Sets and Regret
We predicted that the negative effects of signage will be moderated by preference
development. Though we did not find a significant effect of signage on decision difficulty
(p > .20), we did observe a significant Sign X Preference Development interaction for
consideration set size [F(1,142) = 7.56, p < .001]. Supporting our predictions, participants
with more developed preferences had larger consideration set sizes when the signage was
present compared to the control [MControl= 4.25 vs. MSign= 5.01, F(1,142) = 3.39, p = .06].
In contrast, participants with less developed preferences experienced the opposite pattern
of results exhibiting smaller consideration sets when the signage was present [MControl=
4.68 vs. MSign= 3.83, F(1,142) =4.23, p < .05]. The Number of Choices did not moderate
this effect (three-way Sign X Preference Development X Number of Choices interaction,
p > .20).
A closer look at the composition of the consideration set shows that the increase
was due to participants considering other non-signed options. Again, there was not a
significant increase in the consideration of the signed options (p > .20). However, we
found a significant Sign X Preference Development interaction on consideration of non-

37
signed options [F(1,142) = 8.24, p < .001]. Participants with more developed preferences
considered more non-signed options when the signage was present compared to the
control [MControl = 4.25 vs. MSign= 5.01, F(1,142) = 3.68, p = .057]. In contrast,
participants with less developed preferences experienced the opposite pattern of results
considering fewer non-signed options when the signage was present [MControl= 4.68 vs.
MSign= 3.83, F(1,142) = 4.70, p < .05].
Consistent with predictions, we also observe a Sign X Preference Development
interaction on regret [F(1,142) = 3.72, p = .055] indicating that the effect of signage on
regret depended on participants’ knowledge. Participants with more developed
preferences experienced more regret when the signage was present compared to the
control [MControl= 2.06 vs. MSign= 2.67, F(1,142) = 4.30, p < .05]. In contrast, participants
with less developed preferences did not experience more regret when the signage was
present [MControl= 2.67 vs. MSign= 2.49, F(1,142) < 1]. Again, the Number of Choices did
not moderate this effect (three-way Sign X Preference Development X Number of
Choices interaction, p > .20).
Thus, preference development moderated the effect of best seller signage on the
decision process when consumers chose from a large assortment. Best seller signage
increased the size of consideration sets of consumers with more developed preferences,
particularly increasing consideration of non-signed options, and heightened regret.
Conversely, best seller signage decreased the consideration set size of consumers with
less developed preferences, particularly reducing consideration of non-signed options.
Choice
Signage resulted in a Sign X Number of Choices interaction [Prob(buy ≥ 1 signed
option): χ²(1) = 5.19, p < .05] where participants were less likely to purchase a best seller
option in the single [ProbContrrol=.24 vs. ProbSign= .07, χ²(1) = 3.62, p < .05] than multiple

38
choice condition [ProbContrrol=.17 vs. ProbSign= .30, χ²(1) = 1.73, p = .19]. Thus, signage is
more likely to increase choice share when consumers have the option to buy multiple
options. Preference development did not interact with the sign to affect the probability of
buying a signed option (p > .20).
We predicted that the extent of option consideration generated by the best seller
signage would translate into a change in purchase quantities in the multiple choice
condition. Consistent with predictions and the consideration set results, for the
participants that had the opportunity to buy multiple options, Preference Development
interacted with best seller signage to affect the number of options purchased [F(1,71) =
5.51, p < .05]. Specifically, less developed preference participants purchased fewer
options when the sign was present (MSign= 1.68) compared to absent [MControl= 2.59,
F(1,71) = 4.05, p < .05]. Participants possessing more developed preferences exhibited
the directional reverse pattern purchasing more options when the sign was present
(MSign= 3.07) compared to absent (MControl= 2.46), although this difference was not
reliable [F(1,71) = 1.78, p = .19].
Mediation analysis showed that the size of the consideration set mediated the
number of options purchased for the multiple choice condition. In the multiple choice
condition, preference development interacted with best seller signage to affect the size of
the consideration set [b = .29, t(143) = 1.69, p = .093]. Consideration set size was also
related to the number of options purchased [b = .55, t(146) = 15.03, p < .001]. As
previously mentioned, preference development also interacted with best seller signage to
affect the number of options purchased and this effect decreases from b = .31 [t(142) =
3.32, p < .01] to b = .21 [t(141) = 2.76, p < .01] when consideration set size is added to
the model. A Sobel (1982) test confirms that this change is marginally significant (z =
1.66, p = .097).

39
In summary, experiment 4 finds evidence for two moderators of the effect of best
seller signage on large assortments: consumer preference development and purchase
quantity flexibility. We again find that best seller signage led participants with more
(less) developed preferences to create larger (smaller) consideration sets, primarily due to
greater consideration of non-signed options. If limited to a single choice from a large
assortment, the number of options considered was related to regret, with participants with
more versus less developed preferences more likely to experience regret when a best
seller sign was present. However, if free to act on their consideration, participants with
more versus less developed preferences were more likely to buy multiple options when a
best seller sign was present in a large assortment. It was noteworthy that participants
cognitive responses showed minimal awareness of the effect of best seller signage on
their decision process.
I.8: General Discussion
The results of four experiments show that best seller signage does not assist all
consumers choosing from large assortments. Best seller signs intensify decision-making
for consumers possessing more developed preferences but simplify decision-making for
consumers possessing less developed preferences when making a choice from a large
assortment. Experiment 1 results demonstrated that signage on attractive options
increased consumers’ decision difficulty, creating decision conflict between the signed
options versus many of the other attractive options, and resulting in higher levels of
anticipated regret. Experiment 2 showed that the difficulty created by best seller signage
in large assortments was associated with consumers increasing their consideration set
sizes, making them more inclined to include the signed options as well as additional non-

40
signed options. The larger consideration sets and greater decision difficulty resulting
from best seller signage led to higher experienced regret for consumers choosing from a
large assortment.
Experiment 3 and 4 results found that the direction of signage effects were
dependent upon consumer preference development. Experiment 3 manipulated preference
development and found that participants with more developed preferences reported
experiencing greater decision difficulty when choosing from a large assortment when a
sign was present versus absent. On the other hand, participants with less developed
preferences exhibited the opposite pattern of results and showed that signs reduced
difficulty, regret, and the size of the consideration set. Experiment 4 measured preference
development via subjective knowledge and found that best seller signage resulted in
participants with more developed preferences having larger consideration set sizes and
experiencing more regret, whereas those with less knowledge did not. In experiments 3
and 4, best seller signage was shown to increase consideration set size primarily by
increasing consideration of non-signed options.
The benefit of large assortments is that they offer a range of good options. For
consumers with more developed preferences, large assortments increase the likelihood of
finding an option that closely matches their ideal product. However, the probability that
recommendation signage corresponds with a consumer’s favorite is reduced as the
assortment size increases. The differential results for sign attractiveness in experiment 2
provide insight into the mechanism by which best seller signage affects regret.
Specifically, in large assortments, best seller signage needs to be placed on viable,
attractive options for it to affect consumer’s decision processes. Regret when choosing
from a large product assortment is thus not due to mere non-compliance with the sign;

41
rather, it is generated by increased consideration of foregone alternatives when a sign is
present on highly attractive options.
Best seller signage increased consideration set sizes by triggering participants
with more developed preferences to consider additional non-signed options. Participants
showed minimal awareness of the effect of best seller signage in intensifying
(simplifying) decision-making when making a choice from a large assortment for
consumers with more (less) developed preferences.
Experiment 4 showed that the implication of this increased consideration set size
provoked by best seller signage is dependent on the choice situation. The extent of
consideration and deliberation was positively related to the negative psychological
outcome of regret and to the positive sales outcome of greater purchase quantity. That is,
best seller signage stimulated increased consideration of options by consumers with more
developed preferences, resulting in greater regret if limited to a single choice and a
greater number of total options purchased if unconstrained. Conversely, best seller
signage dampened the consideration set sizes of consumers with less developed
preferences, resulting in reduced regret if limited to a single choice and a fewer number
of total options purchased if unconstrained.
Signage was shown to have limited impact on consumer decision-making when
choosing from small assortments. Specifically, signage in small assortments affected
neither consideration set size nor decision difficulty. This finding is not surprising as
smaller option sets are manageable for consumers, and the most viable options already
receive consideration. Moreover, in small relative to large assortments, the likelihood that
a best seller sign corresponds to a consumer’s favorite increases.
There are several interesting avenues for future research. The results concur with
Fitzsimons and Lehmann (2004) that signage can be disconcerting to consumers
42
possessing more developed preferences if their preferred options are not the ones that are
recommended. However, the results show that best seller signage received at the time of
exposure to the choice set leads participants with more developed preferences to increase
the size of the consideration sets and to experience higher product regret if their preferred
options are not designated as best sellers. On the other hand, Fitzsimons and Lehmann
(2004) found that when consumers had pre-committed to a choice option and
subsequently received negative expert information regarding this option, they exhibited
reactance against the negative recommendation, ultimately choosing their initial product
option in higher propensity and with greater confidence. Future research should further
examine these differential outcomes and potential moderating factors such as option
commitment, recommendation valence, and assortment size.
Another avenue for research is to explore the relationship between the
consideration set and the regret set. To what extent do options considered before choice
correspond to options remembered as foregone after the choice? Regret is likely driven
by the extent of serious deliberation over foregone options. Consequently, regret may be
greater for extensive consideration of a single foregone option than minor deliberation of
multiple foregone options. The size of the assortment may affect the process by which
consumers construct their consideration sets. Prior work in small choice sets has
suggested that option exclusion is the default strategy for consideration set formation
(e.g., Ordóñez, Benson, and Beach 1998). As the number of options in a choice set
increases, consumers may be more likely to use the less effortful inclusion strategy to
select options for consideration. The focus on positive features in an inclusion versus
exclusion decision strategy in binary choice (Meloy and Russo 2004) and consideration
set construction (see Essay 2) may result in higher levels of regret for foregone options.

43
We examined choice scenarios where participants were required to make at least
one choice or had the opportunity to make multiple choices. Further research should
examine the best seller sign implications of option deliberation and consideration for
other choice scenarios. For instance, if the choice situation included a no-choice option,
the increased difficulty generated by best seller signage may increase the likelihood that
participants will defer purchase (Anderson 2003). It would also be interesting to examine
choices longitudinally to see if the increased option consideration of consumers with
more developed preferences leads to greater variety seeking or makes consumers more
likely to repeat category purchase and increase category volume.
Future research might explore if other forms of signage such as manager’s pick,
experts’ ratings, or other forms of recommendations such as decision agents produce
similar effects as best seller signage. Best seller recommendations are aggregate
recommendations that are simple for retailers to implement based on category market
share data. In contrast, Internet recommendation systems that customize a
recommendation based on an individual consumer’s preferences and prior purchases
require individual-level data and sophisticated analyses (Ying et al. 2006). Such
personalized recommendation agents have been shown to decrease the size of
consideration sets under certain conditions (see Haubl and Trifts 2000), such as when
search costs are high (Diehl 2005).
Other retailer tools intended to be helpful may have similar unintended
consequences as best seller signage, intensifying rather than simplifying consumer choice
in a large assortment. For instance, providing consumers with descriptions of product
options to help determine the product that best meets their needs is likely to further
contribute to cognitive overload. Moreover, product descriptions will result in consumers
possessing greater information on foregone alternatives, thereby likely leading to higher

44
regret (Carmon et al. 2003). The effort to aid consumers choosing from an ever
increasing array of product options is a challenging and complex quest that merits
continued research.

45
ESSAY II: THE EFFECT OF INCLUDE VERSUS EXCLUDE STRATEGIES ON CONSIDERATION SET CONSTRUCTION
II.1: Introduction
Imagine that you are making a visit to the Armani store for the obligatory tie
purchase for father’s day, or similar occasion. There are eight ties to choose from, five of
which you exclude from consideration because they are the wrong color or just not your
father’s style. After much deliberation and forethought on the remaining three ties, you
choose one to purchase (your father deserves Armani, right?). Now imagine that you are
at the local department store. You will quickly notice that there are between 300 (if you
went to Nordstrom) and 1300 (if you went to Dillard’s) ties. What do you do? You could
toss to the side all the ties that you do not like. If the salesperson does not call security,
you might finish your exclude strategy before closing. Another option is to scan for
acceptable options and include them into a smaller, more manageable consideration set
from which you can make your decision. As the size of the assortment changed from the
Armani store to Dillard’s, so did your consideration set construction strategy.
The first essay in this dissertation demonstrates the importance of the
consideration set in the decision making process, especially when consumers are faced
with large assortments. A logical next question is whether the assortment size itself leads
consumers to use a different consideration set (CS) construction or screening strategy to
narrow down the set of options to a manageable consideration set. Could consumers be
using a different CS strategy in large assortments that influences what attributes are
considered, and ultimately changes choice and consumer regret with choice relative to

46
small assortments? This essay answers these questions to contribute to the consideration
set construction literature.
The goal of consideration set construction is to simplify the more difficult final
choice task (Chakravarti and Janiszewski 2003). Thus, CS construction strategies are
particularly important for assortment research because consideration sets are more likely
to be used as assortment and choice difficulty increase. Lussier and Olshavsky (1979)
found that consumers were more likely to form a consideration set as the assortment
increased from 3 to either 6 or 12 options. If consumers proceed directly to the choice
phase, and forego the creation of a consideration set, all options must be considered in the
final choice stage and they all have some non-zero probability of being chosen. However,
if a consideration set is constructed, then only those options included in a consideration
set are considered in the final choice stage and those not in the consideration set have a
zero probability of being chosen. What CS strategies consumers use and how they affect
which options enter the consideration set is essential to understanding the effects of
assortment in consumer decision making.
Decision making research shows that there are two ways to narrow down a set of
options—an include and an exclude strategy—and that they can have systematic
consequences on CS construction and choice. Little attention, however, has been given to
whether assortment size may affect which strategy is used. In this essay, I provide a
framework for how assortment affects the use of an include versus exclude strategy in
consideration set construction and its consequences on consideration sets and final
choice. I show that contrary to previous research, an exclude strategy is not always the
“default” strategy, and that consumers are less likely to use an exclude strategy,
particularly as the assortment size increases. Compared to satisficers, maximizers are
especially likely to show a difference in strategy in large compared to small assortments.

47
In addition, I demonstrate that, compared to an exclude strategy, an include strategy leads
consumers to focus more (less) on positive (negative) attributes, express more (fewer)
positive (negative) thoughts in the consideration set construction process, compose
smaller consideration sets, and focus more (less) of their thoughts on options (not) in the
consideration set. Lastly, I investigate how the use of an include versus exclude strategy
affects consumers feelings in the final choice phase of the decision.
II.2: Theoretical Framework -- Antecedents to Consideration SetConstruction Strategies
ASSORTMENT
Large assortments can overburden decision makers by overloading them with
information. Though consumers are attracted to large assortments (Iyengar and Lepper
2000) because they facilitate variety-seeking (Kahn and Lehmann 1991; Baumol and Ide
1956) and are more likely to contain a consumer’s ideal point (Chernev 2003a), large
assortments can lead to more decision difficulty, regret, and choice deferral if a consumer
does not have well defined preferences (Broniarczyk 2006; Chernev 2003b; also see
Essay 1; Iyengar and Lepper 2000; Schwartz 2004). In fact, when consumers are asked to
focus on the decision task before choosing an assortment, the preference for large
assortments is reduced (Chernev 2006).
As the size of an assortment increases, decision making and search strategies
change to accommodate the increase in information and decision difficulty (e.g.,
Broniarczyk 2006; Chernev 2003a; Iyengar and Lepper 2000; Payne 1976; Payne et al.
1993). In particular, Essay 1 found evidence of this change as the number of options in
the consideration set increased dramatically when consumers were faced with a large

48
assortment. As consumers face the additional information in large assortments, they can
either keep the same strategy and put forth more effort or they can change the strategy
and minimize their effort. Since consumers will want to minimize effort in exchange for
accuracy (Payne et al. 1993), a consumer’s CS construction strategy will likely change
when faced with more effort-demanding larger assortments. Thus, I posit that a
fundamental shift in consideration set construction will occur from an exclude strategy to
an include strategy.
INCLUDE VERSUS EXCLUDE
A consideration set is a subset of options from the universal set of available
options (Shocker et al. 1991). A consideration set is loosely defined as “those goal-
satisfying alternatives salient or accessible on a particular occasion” (Shocker et al. 1991,
p. 183), or the set of options that has survived the screening process (Häubl and Trifts
2000; Gilbride and Allenby 2004, see Table 3 for a full review). Consideration set
construction, also called screening, is the process of admitting options into the
consideration set (Beach 1993). For stimulus-based consideration sets, the options in the
set are provided for the consumer and entrance into consideration is dependent on the
number of options meeting some predetermined screening criteria (Beach 1993). For
memory-based consideration sets, admittance to the consideration set is more dynamic in
nature and is a function of the accessibility and familiarity of options (Desai and Hoyer
2000; Nedungadi 1990; Mitra and Lynch 1995). Once a consideration set is constructed,
a consumer constructs a smaller choice set (Shocker et al. 1991).
What is an include or exclude strategy? An include strategy is one in which a
consumer seeks out alternatives to include in the consideration set. This include process
can be done by-alternative or by-attribute, but either method results in the inclusion of
entire alternatives. On the other hand, an exclude strategy is one in which a consumer

49
seeks out alternatives to exclude from the consideration set.3 Excluded options are placed
into what the consideration set literature defines as the inept set (Narayana and Markin
1975).
The include versus exclude distinction has several aliases and generally refers to
the creation of a consideration set (e.g., Heller, Levin, and Goransson 2002; Levin,
Huneke, and Jasper 2000; Levin, Prosansky, and Brunick 2001). Related research has
used the terms accept, select, choose, or retain versus reject or eliminate, but generally
these terms are used to refer to a choice between two (or three) options and not to the
consideration set construction process of reducing a universal set to a consideration set
(e.g., Ganzach 1995; Meloy and Russo 2004; Shafir 1993; Wedell 1997; but see Ordóñez
et al. 1999 for an exception in terminology). Therefore, I adopt the terminology of the
consideration set literature and use the terms include versus exclude.
CONSIDERATION SET CONSTRUCTION STRATEGIES VERSUS RULES
A consideration set strategy refers to either an include or exclude process and is
orthogonal to the specific decision rule. A decision rule refers to the specific criteria used
in the consideration set construction or choice process. For instance, Tversky’s (1972)
elimination-by-aspects (EBA) is one possible rule (acceptance-by-aspects, or ABA, is
another rule, see Table 5 for formal definitions of different decision rules) for how CS
3 For example, if a consumer is shopping for a car she can search for cars that get over 30 miles to the gallon. She could then go back and within this set search for cars with four doors. From this point, she would go back and include only the remaining cars with more than 2 airbags and include these in the set. This process is an include strategy because she is including entire alternatives. It is by-attribute because she is processing within an attribute across several alternatives before moving on to the next attribute. Another way to use an include strategy is by-alternative. In this case, a consumer could search entire alternatives instead of attributes, and each alternative would be analyzed on several attributes—such as over 30 miles to the gallon, four doors, and more than 2 airbags—and include those alternatives into the consideration set. This process is by-alternative because the consumer is processing within the alternative across several attributes. In an exclude strategy the same consumer shopping for a car can exclude cars that get less than 30 miles to the gallon, then exclude cars that have 2 doors, and then exclude cars without more than 2 airbags. In this example entire alternatives are excluded processing within each attribute. Similarly, she can exclude cars that get less than 30 miles to the gallon, do not have four doors, or do not have more than 2 airbags. In this case entire alternatives are excluded processing within each alternative.

50
construction could take place by-attribute. The use of an EBA rule can be used to
construct a universal set of options by either including those options that are not
eliminated by the aspect (e.g., include cars that are not black), or by excluding those
options that are eliminated by the aspect (e.g., excluding cars that are black).
A consumer first decides which CS strategy will be used (include or exclude) and
then decides which specific rule(s) to use to carry out the strategy. It is important to note
that they are indeed different concepts. For example, Yee et al. (2006) find that
consumers use both EBA and ABA, depending on the attribute, to construct a
consideration set using an include strategy (they only had consumers use an include
strategy and an exclude strategy was not tested in their experiment). Additionally, the
EBA and ABA decision rules are not complimentary (except when there are only two-
level features, see Yee et al. 2006 for an illustration) whereas, from a normative
standpoint, include and exclude strategies are complimentary and mathematically
equivalent [(include set) = 1 – (exclude set)].
Marketing research on consideration set construction has focused on what rules
describe consumer choice when using an include strategy and they have not addressed the
role of assortment. For instance, empirical modeling research shows that a cost-benefit
tradeoff model predicts consideration sets and choice relatively well (Hauser and
Wernerfelt 1990; Roberts and Lattin 1991), but as these authors have pointed out, the
models do not describe the actual consumer decision process (see also Roberts and Lattin
1997). More recent research is instructive as to the rules consumers use to determine
inclusion, such as disjunctive, conjunctive, and lexicographic-by-aspects (Gilbride and
Allenby 2004; Yee et al. 2006),4 but insight into the antecedents to consideration set
construction, such as assortment, is still limited (Paulssen and Bagozzi 2005). 4 Gilbride and Allenby (2004) model consideration sets using conjunctive, disjunctive, and compensatory techniques and find evidence for the use of conjunctive screening rules (multiple elimination-by-aspects,

51
ASSORTMENT AND CONSIDERATION SET STRATEGIES
Decision making research has shown that an exclude strategy is the default
strategy and is more likely to be used in CS construction (Ordóñez et al. 1999; Heller et
al. 2002). According to image theory, people search and reject options from consideration
when they pass a rejection threshold (Beach 1993). Ordóñez et al. (1999) found that CS
construction in a control condition was more similar to an exclude strategy compared to
an include strategy.
Yet, previous decision making research on assortment points towards an include
strategy in large assortments. As the number of options in a set increase, search becomes
less complete and more selective (Payne 1976; Payne et al. 1993; Chernev 2003a). This
pattern of less complete and more selective processing is consistent with an include
strategy which is associated with smaller and more selective consideration sets (Levin et
al. 1998, 2000, 2001; Heller et al. 2002; Yaniv et al. 2002; Irwin and Naylor 2006). An
exclusion strategy will also be used less in large assortments because it requires more
effort as the size of an assortment increases. When using an exclude strategy additional
options have to be excluded to reach an equivalent consideration set size. For instance, to
reach a consideration set size of four, only two options have to be removed from a set of
six, but 26 options have be removed from a set of 30. As the number of options increase
in an assortment, consumers will be more likely to seek strategies that minimize effort in
exchange for accuracy (Payne et al. 1993) and thus an exclude strategy will be less likely
to be employed compared to an include strategy.
To further corroborate this prediction, an informal analysis of screening strategy
studies was conducted to examine if consumers’ consideration set formation strategies EBA, rules) in consideration set formation. Yee et al. (2006) use a greedoid-based dynamic program and find that lexicographic-by-aspects (LBA; a combination of EBA and acceptance-by-aspects, ABA) predicts consumers consideration set composition and choice relatively well compared to its compensatory counterpart. However, consumers only used include strategies in their study.

52
change as a function of assortment size. These exploratory results support the hypothesis
that larger assortments will increase the use of an include strategy. Heller et al. (2002)
reported in their first experiment that when asked to choose between 8 possible answers
for each question, 30% of participants opted toward an include strategy. In experiment 2,
participants were presented with multiple choice questions with 10 possible answers to
choose from for each question. In this experiment around 53% of participants opted for
an include strategy in the objective and judgment questions respectively. Using a 24
options to choose from, Levin et al. (2001) found that 81% chose an include strategy
when faced with the hiring task (see Table 4 for full details). These studies suggest that
larger assortments will lead consumers to shift away from the default strategy of exclude,
and towards the use of an include strategy.
Thus, based on the results from the include versus exclude literature and an
effort/accuracy framework, I predict that consumers will be more likely to select an
include strategy to generate a consideration set compared to an exclude strategy as the
assortment size increases.
H1: Consumers will be more likely to adopt an include (versus exclude) CS
construction strategy when faced with large compared to small assortments.
II.3: Theoretical Framework -- Consequences of Consideration Set Construction Strategies on the Consideration Sets
The above framework predicts that, in general, as assortment size increases
consumers will be more likely to use an inclusion strategy to construct a consideration
set. The next question is how such a consideration set strategy will affect consideration
set composition. Research has shown systematic biases based on whether a decision
maker employs an include versus exclude strategy. These systematic biases affect

53
consideration set size, attribute weighting, and ultimately which options make it into the
consideration set.
Consideration Set Size
One of the most consistent findings in the include/exclude literature is the
increased consideration set size associated with an exclude compared to include strategy
(Levin et al. 1998, 2000, 2001; Heller et al. 2002; Yaniv et al. 2002; Irwin and Naylor
2006; but see Ordóñez et al. 1999 for an interesting exception). Studies by Yaniv and
Schul (2000) that asked participants to respond to multiple-choice type questions with 20
possible answers per question found that participants using an exclude strategy had
consideration sets that were about twice the size (experiment 1: 9.9; experiment 2: 8.9) as
those using an include strategy (experiment 1: 3.6; experiment 2: 4.6). Similar studies by
Heller et al. (2002) found more modest differences (around 35%) when the total option
set only included 8 or 10 options (see Table 4 for more details). Thus, we can make the
following prediction.
H2: Consumers using an include CS construction strategy will have smaller
consideration sets compared to consumers using an exclude CS construction
strategy.
ATTRIBUTE WEIGHTING
When decision makers are faced with a binary choice task, Shafir (1993)
suggested that people seek positive attributes (and positive reasons) when in a select task
and seek negative attributes (and negative reasons) when in a reject task. Results showed
that the “enriched” option that was comprised of both extremely positive and negative
attributes was both selected more and rejected more than the “impoverished” option with

54
moderate level of attribute values. The findings are explained using a reason-based
approached in which decision makers seek positive reasons to select an option (leading to
the selection of the enriched option) and negative reasons to reject an option (leading to
the rejection of the enriched option, Shafir, Simonson, and Tversky 1993).5
Corroborating those binary choice results, Meloy and Russo (2004) also found
evidence of a “compatibility” effect such that when there is a match between the type of
attributes presented (e.g., all negative attribute information) and the choice strategy (e.g.,
reject), participants reported greater certainty, confidence, and information distortion
compared to a mismatch (e.g., all positive information and a reject strategy). Though they
did not directly measure the weight placed on each attribute, they argue that the increased
certainty and confidence when task and information are compatible is evidence of
differential weighting in a choice task.
Will consumers exhibit the same compatibility effect in CS construction as they
used in these binary choice studies? There is no direct evidence of differential weighting
in CS construction, but there is one experiment that suggests support. Levin et al. (2001)
manipulated the screening goal by informing participants that they were to either identify
a set of employees to hire or a set of applicants to fire. In two studies they found that
people were more likely to choose an include strategy (81%) when hiring compared to
firing (39%). Although this experiment does show that the valence of the task affects
5Ganzach (1995) found instances where the impoverished options were both selected and rejected more than the enriched option. Wedell’s (1997) accentuation model explains these effects by noting a key moderator: the overall preference for the enriched option. The accentuation model posits that the select/reject discrepancy is due to the accentuation of attributes when in a selection mode. When in a selection mode people need to provide greater justification for what they choose than what they reject, leading to greater discrimination in the selection task. Specifically, the accentuation model states that if the enriched option is more preferred than the impoverished option, then it is both selected and rejected more than the impoverished option; however, if the enriched options is less preferred than the impoverished option, then it is both selected and rejected less than the impoverished option. However, Meloy and Russo (2004) found mixed evidence for the accentuation model when only negative information was presented with a reject strategy.

55
which strategy is used, it does not directly show that the strategy used affects attribute
weighting. I propose that the CS strategy will affect the weighting of attributes used in
CS construction: Positive attributes will be weighted more in an include compared to an
exclude CS construction strategy and negative attributes will be weighted less in an
include compared to an exclude CS strategy.
H3: The weighting of positive compared to negative attributes in CS construction
will be dependent upon the type of CS construction strategy used to compose the
consideration set.
a) Positive attributes will be weighted more in an include strategy than exclude
strategy.
b) Negative attributes will be weighted less in an include strategy compared to an
exclude strategy.
CHOICE PHASE: DECISION DIFFICULTY AND DECISION REGRET
At this point we have only discussed how CS strategies impact the CS strategy
phase. We will now discuss how the use of an include and exclude strategy in the CS
strategy phase affects the choice phase.
The use of include CS strategy could arguably lead to either more or less decision
difficulty compared to an exclude CS strategy. There are three lines of reasoning that
would support less difficulty in choice after using an include strategy. First, there is
evidence that an include choice strategy in the choice phase leads to greater commitment
compared to exclude choice strategies (Ganzach 1995; Meloy and Russo 2004), which
should lead to less difficulty associated with the choice. As noted previously, this prior
research was conducted on small choice sets (i.e, two or three options) and not on CS
construction. If we were to extrapolate on these findings from the binary choice literature,

56
we may expect that an include CS strategy would also lead to less difficulty with the
choice. Second, since the use of an include strategy in the CS phase will require fewer
resources when faced with a large assortment, consumers should have more resources left
over after the CS phase to complete the choice phase suggesting less difficulty. Third,
consumers will focus on more positive attributes in the CS phase when using an include
(vs. exclude) strategy, and these positive attributes should be easier to tradeoff compared
to negative attributes in the final choice phase (Dhar and Sherman 1996).
Other research, however, suggests that an include strategy will lead to more
decision difficulty. Research on the screening effect and option attachment suggests that
an include strategy may lead to more decision difficulty and anticipated regret in the final
choice phase due to heightened deliberation of foregone alternatives. Studies on the
screening effect (Chakravarti, Janiszewski, and Ülkümen 2006; van Zee, Paluchowski,
and Beach 1992) show that the more important attributes in the screening phase become
less important in the final choice phase. In these studies participants are asked to narrow
down a set of options into a consideration set using an include strategy. They are then
presented with new attribute information that was not available in the screening phase
(e.g., the square footage of each apartment). In the final choice phase, the attributes that
were important in the screening phase become less important relative to the new attribute
information. Interestingly, this screening effect does not occur when consumers use an
exclude strategy (Study 3, Chakravarti et al. 2006). These results suggest that consumers
using an include strategy feel the need to switch their attention to the newly presented
attribute information because they have already spent time deliberating over the other
attributes in the consideration set. However, when using an exclude strategy consumers
deliberated on alternatives that were not in the final consideration set during CS
construction, and they feel less of a need to switch their attribute focus when they begin

57
the choosing between options in the final consideration set. Across several studies,
Carmon et al. (2003) showed that the more consumers deliberate on options, the more
attached they become to those options, which makes foregone options appear more
attractive. The increased attractiveness of the options caused by the use of an include
strategy in the CS phase will lead to more decision difficulty in the final choice phase.
Since there is substantial evidence on both sides, it is an empirical issue as to how
the consideration set strategy in the CS phase affects decision difficulty in the choice
phase. Thus, no formal hypothesis will be made and we will defer to the data. If attribute
weighting in the CS phase is contributing to the change in decision difficulty in the
choice phase, as proposed, then attribute weighting should mediate (at least partially) the
effect of an include (vs. exclude) strategy on decision difficulty.
In terms of decision regret, the option attachment literature suggests that an
include strategy will lead to heightened deliberation of foregone options and ultimately
lead consumers to experience more choice discomfort (Carmon et al. 2003) and decision
regret.
Regret will also increase due to the increased weighting of positive attributes
when using an include CS construction strategy. When using an include strategy
consumers will focus on positive attributes, and in the choice phase, they will then be
faced with alternatives that all have positive attributes. Consumers will be forced to give
up a good option that is high on several positive attributes. However, when using an
exclude strategy consumers will focus on avoiding negative attributes and will only have
to give up an option that is low on a negative, which will lead to less regret.
Large assortments should exacerbate the increase in regret associated with using
an include CS strategy for several reasons. Large assortments are associated with an
increase in regret (Broniarczyk 2006; Iyengar and Lepper 2000; and see Essay 1) because
58
there are more foregone options available and a more favorable foregone option. These
additional foregone options coupled with the fact that an include strategy leads to the
additional deliberation of foregone option in the consideration set, will lead consumers to
experience more regret in the choice phase. In addition, the large consideration set
created by a large assortment (see Essay 1) will lead consumers to trade off more options
on positive attributes, which will also increase regret more in large assortments.
H4: An include (vs. exclude) strategy in the CS construction phase will lead to
more anticipated regret in the choice phase, particularly for large relative to small
assortments.
If attribute weighting is contributing to the increase in anticipated regret when
consumers use an include (vs. exclude) strategy, as I propose, then attribute weighting
should mediate (at least partially) the effect of an include (vs. exclude) strategy on regret.
H5: The increase in anticipated regret in the choice phase when consumers use an
include (vs. exclude) strategy in the CS phase when faced with a large compared
to small assortment will be mediated by the weighting of positive versus negative
attributes in the CS phase.
MAXIMIZERS VERSUS SATISFICERS
Recent research has developed a Maximization scale that measures an
individual’s propensity to maximize decisions as opposed to simply seeking out a
satisfactory option (Schwartz et al. 2002). Though limited research has been conducted
on the actual decision processing dimensions of those high on the maximization scale, we
do know that compared to satisficers, maximizers tend to experience more regret and
dissatisfaction, and they rely on more external sources of information (Iyengar, Wells,

59
and Schwartz 2006). Maximizers also tend to seek out the best options in choice whereas
satisficers simply seek acceptable options (Schwartz et al. 2002). We would posit that
satisficers will seek out acceptable options and select them, which is an include strategy.
Thus, satisficers will be more likely to use an include strategy compared to maximizers.
When faced with the added difficulty associated with a large assortment,
satisficers will already be more likely to be using the easier include strategy as their
default. However, maximizers, who are likely to have an exclude strategy as the default
as previously noted, will be more likely to switch to an include strategy when faced with
a large assortment to help reduce some of this difficulty associated with larger
assortments.
H6: Whether consumers adopt an include (versus exclude) CS construction
strategy when faced with large compared to small assortments will depend on
their tendency to maximize versus satisfice.
In summary, large assortments will lead consumers to use a less effortful include
(vs. exclude) strategy in the CS construction phase (H1), and this will be especially true
for maximizers compared to satisficers (H6). The use of an include strategy in the CS
construction phase will lead consumers to form smaller consideration sets (H2), focus
more (less) on positive (negative) attributes (H3), and deliberate more on foregone
options. Using an include strategy in the CS construction phase will, in turn, affect the
choice phase by increasing decision regret, especially when faced with a large assortment
(H4), and this will be mediated by the increased (decreased) focus on positive (negative)
attributes (H5).

60
II.4: Experiment Overview
All four experiments test how the CS construction strategy affects consideration
set size (H2) and how the strategy used in the CS construction phase affects decision
difficulty and regret in the final choice phase (H4). The first experiment tests the
hypothesis that consumers faced with large assortments will be more likely to use an
include compared to an exclude strategy to construct a consideration set (H1) and
whether the use of an include strategy increases consideration set size (H2). The second
experiment further tests both of these hypotheses, and it also tests the consequences of an
include and exclude strategy, namely whether positive and negative attributes are
weighted differentially across the two CS construction strategies (H3), and how they
affect decision difficulty and regret in the choice phase (H4 and H5). The third
experiment manipulates the type of CS construction strategy to establish the causal
direction between CS strategy and attribute weighting. Experiments 2-4 test whether the
increased use of an include strategy in large assortments is stronger for maximizers
compared to satisficers (H6). Lastly, the fourth experiment tests the hypotheses using a
different experimental procedure.
II.5: Experiment 1
METHOD
Procedure
Seventy undergraduates participated in the experiment in exchange for extra
credit in their marketing class. They were presented planograms containing pictures of
either 6 or 30 chocolates. Participants were first given instructions regarding CS

61
construction strategies. The administrator explained to the participants that two strategies
exist for reducing an assortment down to a smaller set of options: people can either circle
the options they like, or they can cross out options they do not like. Participants were then
instructed to either select an include or exclude strategy and narrow down the set of
options to those that they “would actually consider buying” (adapted from Heller et al.
2002). Participants were told that they would receive one of the chocolates that they
choose later in the experiment. After the consideration set strategy task, participants were
instructed to go back and make a choice of chocolate. They then answered the dependent
measures and in another room received their chocolate or a comparable alternative if it
was not available.
Dependent Measures
In addition to the consideration set formation strategy measure, participants also
answered two decision regret and four decision difficulty measures on 7-point Likert
scales. The regret questions asked, “When you were trying to decide, how concerned
were you that other choices might be better than the one you were considering?” and
“When you were trying to decide, how concerned were you that you might regret your
decision?” (both anchored 1=Not at all concerned, 7=Extremely concerned). The
measures were average to create a regret score (α = .84). The decision difficulty questions
asked, “How difficult was it to make your decision of which chocolate to pick?” (1=Not
very difficulty, 7=Very difficult), “How frustrated did you feel when making the choice
of a chocolate?” (1=Not very frustrated, 7=Very frustrated), “How annoyed did you feel
while you were making the choice of a chocolate?” (1=Not very annoyed, 7=Very
annoyed), and “How overwhelmed did you feel while making the choice of a chocolate?”
(1=Not very overwhelmed, 7=Very overwhelmed). The measured where combined to
create a decision difficulty score (α = 0.73). Category involvement was then measured

62
with three questions on 7-point scales (α = 0.88) adapted from Zaichkowsky (1985). See
Appendix B for the actual stimuli used in the experiment.
RESULTS
The data was analyzed using general linear models unless the dependent measure
was dichotomous, in which case a logistic regression was modeled. All models included
category involvement as a covariate.
Consideration Set Strategy
The first hypothesis proposed that participants would be more likely to choose an
include strategy when faced with a large assortment compared to a small assortment due
to the increase in effort associated with large assortments. The results confirmed
hypothesis 1 and show that participants were indeed more likely to use an include (vs.
exclude) CS strategy in large (M = 65%) compared to small assortments [31%, χ2 (1) =
7.84, p < .01].
Consideration Set Size
Hypothesis 2 proposed that an include strategy will lead to smaller consideration
sets compared to an exclude strategy. On average participants did indeed have smaller
consideration sets after using an include (M = 5.36) compared to an exclude strategy [M
= 8.59, F(1,69) = 28.52, p < .001]. Replicating the results in essay 1, I also found that
large assortments led to larger sets compared to small assortments [M = 10.94 vs. 3.01,
F(1,69) = 171.41, p < .001]. However, these results are qualified by an Assortment X CS
Strategy interaction [F(1,69) = 17.52, p < .001]. The effects of CS strategy on set size
was bigger in large (MInclude= 8.04 vs. MExclude= 13.85) compared to small assortments
(MInclude= 2.67 vs. MExclude= 3.34).

63
Decision Difficulty and Decision Regret
Since essay 1 showed that large assortments lead to larger consideration set sizes
compared to small assortments, which in turn increases decision difficulty, consideration
set size was added as a covariate to test the effect of CS construction strategy and
assortment on decision. Though the covariate estimate was in the expected direction (i.e.,
larger consideration sets leading to more decision difficulty), it was not reliable [F(1,64)
= 1.08, p = .3].
It was left as an empirical question as to how decision difficulty would be affected
by the CS strategy. The results showed a significant Assortment X CS Strategy
interaction on decision difficulty [F(1,64) = 5.36, p = .024, see Figure 5]. A closer look at
the simple effects for the large assortment found that the decision difficulty was
marginally greater when using an include (MInclude= 2.46) compared to exclude strategy
[MExclude= 1.58, F(1,64) = 3.55, p = .064]. However, for the small assortment condition,
there was no significant difference across CS strategies [MInclude= 1.91 vs. MExclude= 2.37,
F(1,64) = 1.56, p > .21].
I proposed in hypothesis 4 that whether participants experience more regret using
an include (vs. exclude) strategy would depend on assortment size. Controlling for the
effects of consideration set size [F(1,64) = 1.58, p = .21], the results showed a significant
Assortment X CS Strategy interaction on decision regret [F(1,64) = 3.97, p = .051, see
Figure 5]. A closer look at the simple effects for the large assortment condition showed
that an include strategy (MInclude= 3.18) led to marginally more regret than using an
exclude strategy [MExclude= 1.86, F(1,64) = 3.14, p = .081]. However, for the small
assortment condition there was no significant difference across CS strategies [MInclude=
2.90 vs. MExclude= 3.41, F(1,64) < 1].

64
In summary, experiment 1 finds support for hypothesis 1, proposing that
consumers are more likely to use an include (vs. exclude) strategy in large compared to
small assortments. It finds support for hypothesis 2, proposing that an include strategy is
associated with smaller consideration sets. The experiment also finds support for
Hypotheses 4 regarding decision regret and provides preliminary evidence that an include
strategy in the CS construction phase increases decision difficulty in the choice phase.
Specifically, when faced with a large assortment consumers using an include strategy
experienced heightened decision difficulty and regret compared to their counterparts
using an exclude CS construction strategy.
II.6: Experiment 2
The first goal of experiment 2 is to test whether attributes are weighted differently
in include versus exclude using cognitive responses (H3): Specifically, whether positive
(negative) attributes are weighted more (less) when using an include compared to exclude
CS construction strategy. A secondary goal is to replicate the experimental results that
consumers are more likely to choose an include strategy in large compared to small
assortments (H1) in a different product category, and to test whether this change in CS
strategy is more likely to occur for consumers identified as maximizers (H6).
METHOD
Design
The experiment was a 2(Assortment: Small vs. Large, between) x 2(Replicate:
Chocolates vs. Backpacks, within) x 2(Replicate Order, between). Assortment was
manipulated the same fashion as experiment 1 and the chocolate replicate was the same

65
as in experiment 1. The backpack replicate was created by finding the top 30 backpacks
in terms of sales on ebags.com. The top 6 were chosen for the small assortment such that
some variance in attributes (e.g., color) was achieved.
Procedure
One hundred sixty-five undergraduates received extra credit in their marketing
class for participating in the experiment. They were told that they are looking to buy a
box of chocolates (and a backpack, order counterbalanced). They then received the
include/exclude CS strategy instructions and the cognitive response instructions.
Participants practiced their responses on a test category (chairs) first to allow them to
practice writing their cognitive responses in the packet and to make sure they understood
the instructions. Participants read the following instructions and asked to write their
responses in the space provided:
Please write all your thoughts, including those dealing with the products as
well as any other random thoughts you might have. For instance, we are
interested in:
1) Which items you are considering or not considering
2) Why you are considering or not considering each item
Two independent coders blind to the hypotheses coded their thoughts as positive,
negative, or neutral, and whether each thought was referring to an alternative in the
consideration set, not in the consideration set, or neither (see Appendix D for the
Cognitive Response Coding Methodology). The average respondent expressed 22.1
thoughts for a total of 3,669 thoughts. Since the two coders showed acceptable levels of
reliability (α = .91 for positive thoughts, α = .96 for negative thoughts), their two
measures were averaged for the analyses. To control for the number of thoughts

66
expressed, a proportion of thoughts relative to total thoughts was used as the dependent
variable (e.g., # of pos. thoughts / total # thoughts).
After the practice CS phase, they performed the CS phase on the first product
replicate but were not told about the choice phase until after completing the CS phase.
After the first non-practice CS phase (but before choice) participants answered a second,
more direct question on attribute weighting that asked:
Think back to when you were narrowing down the set of chocolates.
Which attributes were important to you when narrowing down the set of
chocolates? List them below:
Would you say that each attribute is positive or negative? Write either a
positive (+) or a negative (-) sign next to each attribute that you just wrote down
to indicate whether each attribute is positive or negative.
Again, to control for the variance in the number of attributes listed, a proportion
of attributes listed relative to the total number of attributes listed was used as the
dependent variable (e.g., # of pos. attributes / total # attributes). Participants then made
their choice. After the choice phase they responded to measures of decision difficulty,
anticipated regret with their choice, category involvement, and four questions (α = .5)
tapping into the three dimensions of the maximizer/satisficer scale (Schwartz et al. 2002).
The entire study took approximately 20 minutes to complete.
RESULTS
The data was analyzed using general linear models unless the dependent measure
was dichotomous, in which case a logistic regression was modeled. All models included
category (backpack and chocolate) involvement as covariates, and included the
continuous, mean-centered, maximizer/satisficer variable and its interactions with the

67
independent variables. For simplicity, the maximizer/satisficer results will be discussed at
the end. The results control for replicate order and its interaction with the independent
variables in the model. No consistent order effects were found.
Consideration Set Strategy
The first hypothesis predicts that participants will be more likely to use an include
strategy in large compared to small assortments. To test these hypotheses, the dependent
variables were regressed on the probability that a participant chose an include strategy
versus an exclude strategy for both replicates in a logistic regression. Supporting
hypotheses 1 I find that participants were more likely to choose an include strategy in
large (M = .45) compared to small assortments [M = .25, χ² (1) = 4.04, p = .044].
Another way to analyze the data is to use as the dependent variable the number of
times each participant chose an include strategy across the two product replicates: 0, 1, or
2. To make this variable more comparable to the previous dependent variables used, the
variable was scaled between 0 and 1 by dividing it by two, which gave each respondent
either a 0, .5, or 1. A multivariate analysis using Product Replicate as a within-subject
variable finds the same pattern of statistical results as the logistic regression used above.
Participants were more likely to choose an include strategy in large (M = .46) compared
to small assortments [M = .34, F(1,144) = 2.98, p = .087]. The effects were not
moderated by product replicate (p’s > .2).
I proposed that participants would be more likely to use an include strategy in
large compared to small assortments due to the greater effort required to use an exclude
CS strategy. If this is true, then participants should learn over time that an exclude
strategy is more effortful and they should be more likely to switch from an exclude
strategy in the first replicate to include strategy in the second replicate compared to
switching from include strategy to an exclude strategy. In addition, this difference should
68
only occur in large assortments. To test this hypothesis, two dummy variables were
created with one capturing switching from an exclude to an include strategy and another
capturing switching from an include to an exclude strategy. A multivariate analysis
showed that participants were more likely to perform the exclude to include strategy
switch compared to the reverse and that it depended on assortment [F(1,146) = 4.84, p =
.029]. Looking at the simple effect showed that people were marginally more likely to
switch from exclude to an include strategy in large (M = .29) compared to small
assortments [M = .18, χ² (1) = 2.64, p = .1]; however, there was no significant change in
switching from an include to an exclude strategy in large (M = .12) compared to small
assortments [M = .17, χ² (1) < 1].
Consideration Set Size
Hypothesis 2 proposed that an include strategy leads to smaller consideration sets
compared to an exclude strategy. Results from experiment 2 confirm this hypothesis as
well. Participants had smaller consideration sets after using an include (M = 5.04)
compared to an exclude strategy [M = 7.49, F(1,136) = 7.67, p = .006]. Replicating the
results in essay 1 and experiment 1 in essay 2, I also found that large assortments led to
larger sets compared to small assortments [M = 10.06 vs. 2.92, F(1,136) = 88.99, p <
.001]. However, these results are qualified by an Assortment X CS Strategy interaction
[F(1,136) = 6.12, p = .015]. The effects of CS strategy on set size was bigger in large
[MInclude= 7.32 vs. MExclude= 11.96, F(1,136) = 15.18, p < .001] compared to small
assortments [MInclude= 5.04 vs. MExclude= 7.49, F < 1].
Weighting of Thoughts and Attributes
Hypothesis 3 predicts that the weighting of positive and negative attributes will
depend on the CS construction strategy. To test these hypotheses we looked at (1) the

69
types of thoughts participants wrote during the CS strategy and (2) the attributes listed by
participants and whether they classified them as positive or negative. Two repeated
measures analyses were computed to compare positive and negative thoughts and
positive and negative attributes listed.
Thoughts
Looking at the proportion of positive and negative thoughts written, we find a
significant Thought Valence X CS Strategy interaction [F(1,132) = 52.32, p < 0.001]
consistent with hypothesis 3: Participants listed more positive thoughts when including
(M = .68) compared to excluding [M = .38, F(1,132) = 48.78, p < 0.001], and listed fewer
negative thoughts when including (M = .26) compared to excluding [M = .56, F(1,132) =
48.64, p < .001]. Figure 6 displays the means.
When I look at the effect of CS strategy on the number of positive and negative
thoughts expressed by participations, I find that Thought Valence X CS Strategy two-way
interaction was moderated by assortment. There was a marginally significant Thought
Valence X CS Strategy X Assortment three-way interaction [F(1,132) = 3.53, p = 0.067].
The simple effects show that participants in both large and small assortments expressed
more positive thoughts when using an include compared to exclude strategy [large
assortment: MInclude = .68 vs. MExclude= .31, F(1,132) = 40.12, p < .001; small assortment:
MInclude = .68 vs. MExclude= .45, F(1,132) = 13.47, p < .001], but the effect was marginally
bigger in large assortments compared to small assortments [F(1,132) = 2.60, p = .11].
Similarly, simple effects show that participants in both large and small assortments
expressed fewer negative thoughts when using an include compared to exclude strategy
[large assortment: MInclude = .24 vs. MExclude= .63, F(1,132) = 43.85, p < .001; small
assortment: MInclude = .28 vs. MExclude= .50, F(1,132) = 11.49, p < .001], but the effect was
significant bigger for large compared to small assortments [F(1,132) = 4.06, p = .046].

70
These results provide further evidence that the effects on thought valence found in small
assortments are exacerbated when participants chose from a large assortment.
Attributes
I can also test hypotheses 3 by looking at the attributes participants listed when
asked to recall “which attributes where important to you when narrowing down the set of
backpacks/chocolates?” I find the same pattern of results in terms of CS strategy and
thought valence on the number of thoughts listed with a significant Attribute Valence X
CS Strategy interaction [F(1,135) = 18.91, p < .001]. Participants listed more positive
attributes when including (M = .87) compared to excluding [M = .67, F(1,135) = 19.46, p
< .001], and listed fewer negative attributes when including (M = .15) compared to
excluding [M = .31, F(1,135) = 15.04, p < .001]. These results were not moderated by
assortment in a three-way interaction, but there was a significant four-way interaction
with assortment and maximizer, which will be discussed later in the Maximizer versus
Satisficer section.
Type of Thoughts
I proposed that one of the differences between an include and exclude CS strategy
was that they lead consumers to focus on different options. Specifically, I proposed that
an include CS strategy would lead consumers to deliberate more on options that are in the
consideration set during CS construction, whereas an exclude strategy would lead
consumers to deliberate more on options that are not in the final consideration set. To test
this proposition, the number of thoughts about options in the consideration set was
divided by the number of total thoughts (CS thoughts), and the same proportion was
created for the number of thoughts about options not in the consideration set (NCS
thoughts). A multivariate analysis with CS thoughts and NCS thoughts confirmed this
71
proposition: The type of thoughts listed depended on whether an include or exclude CS
strategy was used [Type of Thoughts X CS Strategy interaction: F(1,132) = 42.53, p <
.001]. In other words, participants using an include strategy had more CS thoughts
compared to those using an exclude strategy [MInclude = .66 vs. MExclude= .39, F(1,132) =
34.86, p < .001]. However, participants using an include strategy also had a fewer NCS
thoughts compared to those using an exclude strategy [MInclude = .23 vs. MExclude= .50,
F(1,132) = 42.38, p < .001]. Thus, as predicted, participants using an include strategy
deliberate more on options in the consideration set and participants using an exclude
strategy deliberate more on options that will not be in the consideration set.
Decision Difficulty and Decision Regret
As in experiment 1, consideration set size was added as a covariate to test for the
effects of CS strategy on decision difficulty in the choice phase. It should be noted that
though the covariate of consideration set size was marginally significant [F(1,135) =
3.20, p = .076], leaving the consideration set covariate out of the analysis does not
substantially change the results. Specifically, there is no evidence in the data that
consideration set size is a mediator in the process between an include strategy and
decision difficulty and regret.
Experiment 1 found that an include strategy was associated with more decision
difficulty when consumers were faced with a large assortment. Experiment 2, however,
does not find these results: There was no significant main effect of CS strategy or higher-
order interactions with assortment. The means are presented in Table 7.
As in experiment 1, consideration set size was added as a covariate to test for the
effects of CS strategy on decision difficulty in the choice phase and had a marginal effect
[F(1,135) = 2.72, p = .10]. Experiment 1 found that an include strategy was associated
with more regret when consumers were faced with a large assortment, consistent with

72
hypothesis 4. Experiment 2, however, does not find consistent results: There was no
significant main effect of CS strategy or higher-order interactions with assortment or
maximizer on decision regret in the choice phase [p’s > .19]. The means are presented in
Table 7.
Maximizers versus Satisficers
Confirming Hypothesis 6 the results show that the tendency to use an include
strategy in large compared to small assortments was moderated by whether consumers
were maximizers or satisficers [Assortment X Maximizer, χ² (1) = 4.32, p = .038, see
Figure 6]. Plotting the model one standard deviation above and below the mean of the
maximizer scale (Muller et al. 2005), I find that maximizers were more likely to choose
an include strategy in large compared to small assortments [M = .48 vs. M = .13, χ² (1) =
6.19, p = .013], but satisficers did not exhibit this difference [M = .42 vs. M = .42, χ² (1)
< .1]. I find the same pattern of results analyzing the data with a general linear model
using as the dependent variable the number of times each participant chose an include
strategy across the two product replicates [Assortment X Maximizer, F(1,144) = 4.44, p =
.066]. Maximizers used an include strategy more in large compared to small assortments
[M = .49 vs. M = .23, F(1,144) = 5.62, p = .019], but satisficers did not exhibit this
difference [M = .44 vs. M = .43, F(1,144) < 1].
Looking at consideration set sizes, maximizers did show smaller consideration
sets compared to satisficers [M = 5.63 vs. M = 7.35, F(1,136) = 4.88, p = 029], but it did
not moderate the assortment and CS strategy results.
Thoughts by Maximizer/Satisficer
When we look at the proportion of positive and negative thoughts, satisficers were
more prone to change their thought valence based on the type of CS strategy they were
73
using. Maximizers, however, have more stable thoughts (in terms of valence) across CS
strategies [Thought Valence X CS Strategy X Maximizer interaction, F(1,132) = 4.44, p
= 0.037]. The interaction shows that both maximizers and satisficers expressed more
(less) positive (negative) thoughts when using an include strategy; but the change in
negative thoughts between an include and exclude strategy was marginally bigger for
satisficers compared to maximizers [F(1,132) = 2.86, p = .093, see Table 6 for the
means]. There was no four-way interaction with assortment.
Attributes by Maximizer/Satisficer
Looking at the proportion of positive and negative attributes listed, we do not see
the same pattern of results as thoughts listed. However, the results do suggest that the
effect of CS strategy on the decision process is bigger in large compared to small
assortments. In large assortments maximizers were more likely to change the proportion
of positive and negative attributes used in CS construction based on the CS strategy, but
in small assortments there were no differences [Attribute Valence X CS Strategy X
Assortment X Maximizer, F(1,135) = 3.68, p = .057, see Table 6 for means]. In large
assortments maximizers listed significantly more positive attributes when using an
include compared to exclude strategy [F(1,135) = 15.31, p < .001] but satisficers did not
[F(1,135) < 1]. Similarly, only maximizers listed significantly fewer negative attributes
when using an include compared to exclude strategy [F(1,135) = 12.36, p < .001]
whereas satisficers did not [F(1,135) < 1].
Type of Thoughts by Maximizer/Satisficer
Satisficers expressed a bigger difference in positive and negative thoughts based
on an include or exclude strategy (as previously noted), and they also showed a bigger
difference in the type of thoughts they listed. Satisficers expressed a marginally greater

74
difference (include vs. exclude) in CS thoughts and in NCS thoughts compared to
maximizers [CS Strategy X Maximizer interaction on the proportion of CS thoughts,
F(1,132) = 3.39, p = .068; CS Strategy X Maximizer interaction on NCS thoughts,
F(1,132) = 3.34, p = .07, see Table 6 for means]. These findings are further evidence that
a change in the CS construction strategy may have a bigger impact on the thoughts of
satisficers compared to maximizers.
Decision Difficulty and Decision Regret by Maximizer/Satisficer
Maximizers expressed marginally more decision difficulty than satisficers
[F(1,135) = 3.42, p = .066, see Table 6 for means], as would be expected by the
maximizer/satisficer literature (Schwartz et al. 2002). There were no significant higher-
order interactions with the independent variables and maximizer on decision difficulty in
the choice phase [p’s > .2].
Maximizers also expressed more regret than satisficers [M = 3.27 vs. M = 2.79,
F(1,135) = 5.76, p = .018], especially when faced with large assortments [Maximizers X
Assortment, F(1,135) =3.57, p = .061, see Table 6 for means]. In large assortments the
difference in regret between maximizers and satisficers was significant [F(1,135) = 8.38,
p = .004] whereas in small assortments it was not [F(1,135) < 1]. Unfortunately, there
were no significant higher-order interactions with the independent variables and
maximizer on decision regret in the choice phase [p’s > .19].
In summary, experiment 2 found additional support for hypothesis 1 in regards to
which CS strategy is the default strategy: Consumers were more likely to use an include
CS strategy in large compared to small assortments. In addition, experiment 2 found that
this was especially the case for consumers rated high on the maximizer scale (Schwartz et
al. 2002; H6). The use of an include strategy also led consumers to compose smaller
consideration sets (H2), and it led consumers to express more (less) positive (negative)

75
thoughts, and mention more (less) positive (negative) attributes, compared to an exclude
strategy (H3). In addition, an include strategy led consumers to focus more on
alternatives that were in the consideration set and less on alternatives that were not in the
consideration set compared to consumers using an exclude strategy.
When looking at the second phase of the decision process, the choice phase, the
results were less conclusive. Experiment 1 found that, compared to an exclude strategy,
an include strategy led to more decision difficulty and regret in large, but not small,
assortments. Experiment 2 did not find a significant increase in decision difficulty and
regret in the choice phase based on the strategy used in the CS phase. The inconclusive
findings from experiment 2 could suggest one of the following: A) the CS strategy does
not reliably change consumers’ decision difficulty and regret in the choice phase, B) the
written protocols in experiment 2 interrupted the task and contaminated the dependent
measures, or C) in the self selection of their preferred CS strategy, consumers naturally
gravitated to the strategy that minimized the negative consequence that they would
experience in the final choice phase. Experiment 3 was designed to test explanation A)
and C) by manipulating whether participants are forced to use either an include or
exclude CS strategy, and written protocols will be collected again. Experiment 4 was
designed to test explanation A) and B) by eliminating the written protocols from the
experimental procedure and manipulating whether participants must list the attributes
used in the CS construction process. Thus, if self selection is leading to the results in
experiment 2, then we should see an effect of an include strategy in the CS phase on
decision difficulty and regret in the choice phase in experiment 3. However, if the written
protocols are responsible for the results in experiment 2, then we would expect an effect
on decision difficulty and regret in the choice phase in experiment 4.

76
II.7: Experiment 3
One goal of experiment 3 is to test whether allowing participants to choose an
include or exclude strategy in the CS phase of experiment 2 inhibited the clear
measurement of decision difficulty and regret in the choice phase. Another goal of
experiment 3 is to test the causal direction of the effect of CS strategy on the weighting of
attributes. Researchers have proposed that the weighting of positive and negative
attributes changes when accepting compared to rejecting in a binary choice task (Meloy
and Russo 2004; Shafir 1993), and others have proposed that the valence of the task (e.g.,
hiring vs. firing) can affect the CS strategy (Levin et al. 2000, 2001). However, the effect
of CS strategy on attribute weighting has not been established empirically and some have
questioned its validity in choice (Ganzach 1995; Wedell 1997). To establish this causal
direction–that strategy leads to differential attribute weighting—experiment 3
manipulates the CS strategy by forcing participants to use either an include or exclude
strategy (i.e., they cannot chose which one to use).
METHOD
The experiment was a 2(Strategy: Include vs. Exclude) x 2(Replicate: Chocolates
vs. Backpacks, within) x 2(Replicate Order, between). The following results control for
replicate order and no consistent order effects were found. Assortment and product
replicate were manipulated in the same fashion as the previous experiments. Strategy was
manipulated in two ways: include or exclude. The Include condition forced participants
to use an include strategy and the Exclude condition forced participants to use an exclude
strategy.
77
One hundred forty-five undergraduates participated in the experiment in exchange
for extra credit in their marketing class. The procedure was identical to experiment 2 with
the exception of the CS instructions. Instead of choosing which strategy to use,
participants were told to use either an include or an exclude strategy, depending on the
strategy condition. Cognitive thoughts were coded in the same fashion by the same
independent coders.
RESULTS
Consideration Set Size
Consistent with experiments 1 and 2 and hypothesis 2, participants had smaller
consideration sets after using an include (M = 3.26) compared to an exclude strategy [M
= 7.31, F(1,127) = 34.57, p < .001]. Consistent with previous results, large assortments
led to larger sets compared to small assortments [M = 7.92 vs. 2.64, F(1,127) = 59.14, p <
.001]. However, these results are qualified by an Assortment X CS Strategy interaction
[F(1,127) = 23.13, p < .001]. The effects of CS strategy on set size was bigger in large
[MInclude= 4.25 vs. MExclude= 11.60, F(1,127) = 60.04, p < .001] compared to small
assortments [MInclude= 2.26 vs. MExclude= 3.01, F(1,127) < 1].
Weighting of Thoughts and Attributes
The third hypothesis predicts that the weighting of positive and negative attributes
will depend on the CS strategy. As in experiment 2, I looked at (1) the types of thoughts
participants wrote during the CS construction process and (2) the attributes listed by
participants and whether they classified them as positive or negative. The proportion of
thoughts relative to total thoughts was used as the dependent variables (e.g., # of pos.
thoughts / total # thoughts). Two repeated measures analyses were computed to compare
positive and negative thoughts and positive and negative attributes listed.

78
Thoughts
Looking at the proportion of thoughts listed I find the same pattern of results as in
experiment 2: An include strategy leads participants to focus on positive thoughts and an
exclude strategy leads them to focus on negative thoughts. The significant Thought
Valence X CS Strategy interaction [F(1,127) = 14.30, p < .001] showed that participants
listed more positive thoughts when including (M = .53) compared to excluding [M = .48,
F(1,127) = 10.24, p = 0.002], and listed fewer negative thoughts when including (M =
.38) compared to excluding [M = .45, F(1,127) = 16.89, p < .001].
Attributes
Looking at the proportion of attributes listed, I again find the same pattern of
results in terms of CS strategy on the proportion of attributes listed. There was a
significant Thought Valence X CS Strategy interaction on the proportion of attributes
listed [F(1,125) = 3.56, p = 0.062]. Participants appeared to list more positive attributes
when including (M = .80) compared to excluding (M = .77), but it was not reliable
[F(1,125) = 1.23, p = 0.27]. They did list fewer negative attributes when including (M =
.25) compared to excluding [M = .30, F(1,125) = 3.96, p = .049]. These results taken with
the results of experiments 3 show that participants focus on positive attributes more when
using an include strategy and focus more on negative attributes when using an exclude
strategy. Next I will turn toward whether the thoughts were about options in or out of the
consideration set.
Type of Thoughts
The type of thoughts expressed by participants was analyzed in the same fashion
as experiment 2. The number of thoughts about options in the consideration set was
divided by the number of total thoughts (CS thoughts), and the same proportion was

79
created for the number of thoughts about options not in the consideration set (NCS
thoughts). A multivariate analysis with CS thoughts and NCS thoughts as dependent
variables showed that the type of thoughts listed depended on whether an include or
exclude strategy was used [Type of Thoughts X CS Strategy interaction: F(1,127) = 9.86,
p = .002]. Specifically, participants using an include strategy had more CS thoughts
compared to those using an exclude strategy [MInclude = .55 vs. MExclude= .45, F(1,127) =
7.40, p = .007]. However, participants using an include strategy also had a fewer NCS
thoughts compared to those using an exclude strategy [MInclude = .31 vs. MExclude= .43,
F(1,127) = 10.43, p = .002]. Unlike experiment 2, these effects on the type of thoughts
listed by participants were not moderated by assortment. However, the general effect is
consistent with experiment 2: Participants deliberated more on options in the
consideration set when using an include strategy, and participants deliberated more
options not in the consideration set when using an exclude strategy.
Decision Difficulty and Decision Regret
A second goal of experiment 3 was to determine if the choice procedure in
experiment 2 (i.e., allowing participants to choose either an include or exclude strategy)
was leading to the missed effects on decision difficulty and regret in the choice phase. If
this self-selection was contributing to the effects, then we should expect to see a
difference between the strategy used in the CS phase and decision difficulty and regret
experienced in the choice phase. Consistent with experiments 1 and 2, consideration set
size was added as a covariate to the models for decision difficulty and regret. As in
experiment 2, the covariate was marginal for decision difficulty [F(1,125) = 3.03, p =
.083] and significant for regret [F(1,125) = 6.50, p = .012], but it did not mediate the
results. There was no significant CS Strategy X Assortment interaction, but there was a

80
significant CS Strategy X Maximizer interaction that will be discussed in the next
section.
In terms of decision regret in the choice phase, I find the same pattern of results as
in experiment 1, but the CS Strategy X Assortment interaction is not reliable [F(1,125) =
2.13, p = .15]. In large assortment participants did not show a reliable difference in CS
strategy on regret [MInclude= 3.00 vs. MExclude= 2.57, F(1,125) = 1.85, p = .176], nor did
they show a reliable effect in small assortments [MInclude= 3.00 vs. MExclude= 2.57,
F(1,125) < 1]. Again, the means are presented in Table 7.
Maximizer versus Satisficer
Looking at how the results differed for maximizers versus satisficers, we find that
maximizers exhibited marginally smaller consideration sets compared to satisficers [M =
5.88 vs. M = 4.68, F(1,127) = 2.69, p = .1], but it did not moderate the assortment and CS
strategy results. These results are consistent with experiment 2 which also found that
maximizers exhibited smaller consideration sets compared to satisficers.
The maximizer variable did not moderate the effects on the proportion of positive
and negative thoughts, positive and negative attributes, or the type of thoughts listed by
participants (see Table 6 for means).
Maximizers found the choice phase more difficult compared to satisficers
[F(1,125) = 7.84, p =.006] and maximizers expressed more regret [F(1,125) = 11.70, p <
.001, see Table 6 for means]. Maximizers also found the include strategy more difficult
than the exclude strategy but satisficers did not [CS Strategy X Maximizer, F(1,125) =
3.57, p = .061]. Though there were no higher-order interactions with maximizer on regret,
the results do suggest that at least for maximizers an include strategy can lead to more
decision difficulty.

81
In summary, experiment 3 manipulated the use of an include or exclude CS
construction strategy and found consistent results with experiment 2. Supporting
hypothesis 2, consumers composed smaller consideration sets when they used an include
strategy; supporting hypothesis 3, consumers using an include strategy focused more
(less) on positive (negative) thoughts and attributes compared to those using an exclude
CS strategy. The use of an include strategy also led participants to deliberate more on
alternatives that were in the consideration set and less on alternatives that were not in the
consideration set compared to consumers using an exclude strategy.
II.8: Experiment 4
In addition to replicating the effect of assortment on CS construction strategy, one
goal of experiment 4 was to further test whether the CS strategy used in the CS phase has
negative consequences on the decision process in the choice phase. A possible
explanation for the lack of results in experiments 2 and 3 is that participants were asked
to write down their thoughts during the CS phase. Since the expression of thoughts and
reasons for choice has been shown to disrupt the decision making process and affect
satisfaction (Wilson et al. 1993), we could attribute the differential results to this
introspection. Thus, experiment 4 changes the experimental procedure and will not have
participants express their thoughts during the CS phase.
Another goal of experiment 4 was to test whether consumers find one CS strategy
more difficult than another. Experiments 1 through 3 have tested the decision difficulty
experienced in the choice phase, but I have not measured whether increased feelings of
CS construction difficulty in the CS phase is leading consumers to use an include
strategy. I proposed that consumers are more likely to use an include strategy because

82
they find the large assortment difficult to process. Thus, the consumers that find the CS
construction process more difficult in large assortments should be using an include
strategy. Whereas those not finding it difficult should stick to the exclude strategy.
Lastly, experiment 4 will test whether the order of the instructions in the previous
experiments could account for the results. Experiments 1 and 2 did not counterbalance
the order of the include and exclude instructions—the exclude strategy was always
introduced first. Experiment 4 counterbalances the instruction order.
METHOD
The experiment was a 2(Assortment: Small vs. Large, between) x 2(Replicate:
Chocolates vs. Backpacks, within) x 2(Replicate Order, between) x 2(Instruction Order,
between) x 2(Attributes: Listed vs. Not Listed, between) mixed design. Assortment was
manipulated the same fashion as experiment 1 through 3 and the replicates were the same
as experiments 2 and 3. Instruction Order was manipulated by explaining to participants
either the include strategy first and then the exclude strategy or the exclude strategy first
and then the include strategy. The Attributes variable was manipulated by only having a
subset of participants provide a list of important attributes after the CS phase (but before
choice), identical to the procedures in experiment 2 and 3. Another subset was not asked
to list attributes to ensure that providing attributes was not affecting the decision regret
dependent variable. No significant main effects or interactions were found for the
attribute variable so it was combined for the analyses. The following results control for
replicate order and its higher-order interactions, and no consistent order effects were
found.
One hundred ninety-five undergraduates participated in the experiment in
exchange for extra credit in their marketing class. After receiving the instructions,
participants were asked to do the CS phase of the decision process. They then answered

83
two CS construction difficulty questions. One asked “How difficult was it to narrow
down the display of Backpacks/Chocolates?” (1=Not at all Difficult, 7=Extremely
Difficult) and “How complex did you find it to narrow down the display of
Backpacks/Chocolates?” (1=Not at all complex, 7=Extremely Complex). Participants in
the attributes condition then responded the attribute weighting measure as in experiments
2 and 3. They then made a choice and responded to the decision regret questions. This
procedure was repeated for the other replicate, depending on replicate order, and they
then responded to involvement and maximizer/satisficer questions. In this experiment the
six maximizer/satisficer measures recommended by Yordanova et al. (2007) were used.
RESULTS
Consideration Set Construction Strategy
Consistent with the previous experiments and hypothesis 1, when looking at
participants that either excluded or included in both product replicates, participants were
more likely to choose an include strategy in large assortments (M = .53) compared to
small assortments [M = .36, χ²(1) = 3.59, p = .058]. A multivariate analysis also shows
that participants were more likely to choose an include strategy in large (M = .52)
compared to small assortments [M = .37, F(1,184) = 4.60, p = .033], and this effect was
not moderated by product replicate.
Consideration Set Size
Consistent with experiments 1 through 3 and hypothesis 2, participants had
smaller consideration sets after using an include (M = 5.00) compared to an exclude
strategy [M = 11.36, F(1,177) = 196, p < .001]. Consistent with previous results, large
assortments led to larger sets compared to small assortments [M = 12.79 vs. 2.95,
F(1,177) = 565.49, p < .001]. A CS Strategy X Assortment interaction [F(1,177) =

84
118.37, p < .001] showed that the increase in consideration set size from using an exclude
strategy compared to include strategy was bigger in large [MInclude= 6.85 vs. MExclude=
17.46, F(1,177) = 316.79, p < .001] compared to small assortments [MInclude= 2.54 vs.
MExclude= 3.27, F(1,177) = 1.11, p = .29].
Weighting of Attributes
Experiments 2 and 3 found support for hypothesis 3 that predicted that the
weighting of positive and negative attributes will depend on the CS strategy. To test this
hypothesis in experiment 4 I again looked at the attributes listed by participants and
whether they classified them as positive or negative. As in experiments 2 and 3, the
proportions of positive and negative attributes relative to total attributes listed were used
as the dependent variables.
Replicating the results of experiments 2 and 3 and confirming hypothesis 3, a
repeated measures analysis showed a significant Thought Valence X CS Strategy
interaction on the proportion of attributes listed [F(1,102) = 5.28, p = .024, see Figure 9].
Participants listed more positive attributes when using an include strategy (M = .84)
compared to an exclude strategy [M = .72, F(1,102) = 5.48, p = .022], but listed fewer
negative attributes when using an include strategy (M = .16) compared to an exclude
strategy [M = .28, F(1,102) = 5.06, p = .027]. These results provide further evidence that
an include strategy leads participants to focus on more positive attributes and an exclude
strategy leads them to focus on more negative attributes.
Consideration Set Construction Difficulty
I proposed that some consumers will find the CS phase more difficult in large
assortments and that this difficulty will lead them towards an include strategy. We find
that there was not a reliable CS Strategy X Assortment interaction on CS construction

85
difficulty [F(1,176) = 2.44, p = .12]. The means are presented in Table 7. Though these
null results do not allow us to make conclusions regarding CS difficulty at this time, they
do suggest that future research should investigate CS difficulty in perhaps a different
procedure. Since I propose that it is expected CS difficulty that drives choice of an
include strategy, future experiments may want to measure consumers expectations of CS
difficulty before CS construction actually takes place.
Decision Regret
We now turn to how the strategy used in the CS phase affects decision regret in
the choice phase. One goal of experiment 4 was to determine whether the written
protocols in experiment 2 and 3 were responsible for the lack of results in terms of
decision regret. In experiment 4 there is also not a significant effect of CS strategy or
assortment on decision regret (p’s > .2, see Table 7 for the means). Thus, it seems
unlikely that the written protocols were responsible for the results, or lack thereof, in
experiments 2 and 3. However, it should be noted that the procedure used in these
experiments may not be optimal for testing the true effects of CS strategy on decision
regret because participants may not be able to separate the difficulty and regret
experienced in the CS construction phase from the difficulty and regret experienced in
the choice phase. A more subtle measure may be necessary.
Maximizers versus Satisficer
Looking at the results for maximizers and satisficers, we do not find the same
interaction with assortment that was found in experiment 2 (p’s > .2). It appears that both
maximizers and satisficers were more likely to choose an include strategy in large and
small assortments. The means are graphed in Figure 6.

86
As previously discussed, when using an include strategy consideration set sizes
decreased more in large compared to small assortments. This decrease was bigger for
satisficers compared to maximizers [Assortment X CS Strategy X Maximizer, F(1,177) =
5.06, p = .023, see Table 6 for means]. In other words, satisficers’ consideration sets were
influenced more by their decision strategy than maximizers.
As in experiment 3 the effect on the proportion of attributes listed was not
moderated by maximizer or assortment, and there was no four-way interaction. In
addition, there were no significant higher-order interactions between maximizer and the
independent variables on CS construction difficulty or decision regret.
In summary, experiment 4 shows again that consumers are more likely to use an
include CS strategy when faced with a large compared to small assortment (H1).
Importantly, the include and exclude instructions were counterbalanced to rule-out a
primacy effect explanation. The use of an include strategy leads consumers to form
smaller consideration sets (H2) and focus more on positive attributes and less on negative
attributes (H3). There was inconclusive evidence in terms of whether one strategy was
associated with more or less CS construction difficulty or whether it resulted in more
decision regret in the choice phase; however, we do know that the experimental method
in experiment 2 and 3 was not artificially masking potentially negative consequences of
an include strategy on final choice. Table 7 summarizes the results across the four
experiments in essay 2.
II.9: General Discussion
Essay 2 provides a framework for understanding the role of consumers’ CS
construction strategies on choice, particularly when faced with large assortments. The
87
proposed framework integrates the include/exclude literature in decision making with the
vast knowledge of consideration sets that the marketing literature has accumulated. The
notion of an inept set established in the consideration set literature (e.g., Narayana and
Markin 1975; Shocker et al. 1991) represents the set of alternatives created by an exclude
strategy; the notion of a consideration set represents the set of alternatives created by an
include strategy. Whether consumers focus on the creation of an inept set (exclude
strategy) or consideration set (include strategy) has important consequences for CS
construction and choice, particularly when consumers are faced with large assortments.
Experiments 1, 2, and 4 demonstrate that the size of the assortment affects
whether consumers use an include or exclude CS strategy. Since an exclude strategy
requires more effort as the assortment size increases, participants were more likely to use
an include CS strategy compared to exclude strategy as the size of the assortment
increased. The findings suggest that, consistent with past research (Ordóñez et al. 1999),
an exclude strategy is the default CS strategy—but only for smaller assortments. For
large assortments decision makers are more likely to use an include strategy as the default
CS strategy. As a result of using an include, compared to exclude, CS strategy,
consumers focus more on positive thoughts and attributes, focus less on negative
thoughts and attributes, form smaller consideration sets, deliberate more on alternatives
in the consideration, and deliberate less on alternatives that do not make it into the final
consideration set.
Whether a consumer chooses to use an include or exclude strategy in the CS
phase has potentially important effects on choice in the final choice phase. There was
mixed evidence as to whether and how the CS strategy has reliably predictive effects on
the final choice phase of the decision process. At this point our best guess might be that
an include strategy leads to more regret overall. This result was found in experiment 1,

88
and it was neither confirmed nor refuted in subsequent experiments. Though the weak
results for regret and decision difficulty are disappointing, they do provide us with some
information that can be used to help guide future research. Future research should
continue to investigate the effects of CS strategy on the final choice phase. This
investigation could include not only decision difficulty and regret, but also anticipated
and experienced satisfaction and regret, confidence, or the type of choice (e.g., licensing
effects, Chakravarti, Fishbach, Janiszewski, and Ülkümen 2007; screening effects,
Chakravarti et al. 2006).
FUTURE RESEARCH
There are several avenues for future research to explore consumers’ use of include
and exclude strategies in choice. There are three areas that I will discuss and provide
propositions for future research: (a) moderators affecting when an include or exclude
strategy will be used, (b) the effect of include and exclude CS strategies on the choice
phase, and (c) other contextual factors.
Moderators to the use of an Include and Exclude Strategy
Decision Focus
Chernev (2006) addresses the paradox in which larger assortments are preferred
over smaller assortments despite the fact that consumers experience more decision
difficulty, regret, and choice deferral with larger assortments. Consistent with previous
research (e.g., Broniarczyk et al. 1998; Chernev 2003a; Iyengar and Lepper 2000; Kahn
and Lehmann 1991), Chernev shows that consumers generally prefer large (versus small)
assortments in the first stage of the decision process (i.e., when choosing between
assortments). However, this advantage for large assortments is reduced when consumers
focus on the second stage of the decision (i.e., the product-selection task) in addition to

89
the first stage of the decision (the assortment-selection task). In experiment 2 of Chernev
(2006), for example, participants in the decision focus condition were primed to focus on
choice by choosing from a set of 80 chocolates and then asked the difficulty of the choice
task. Compared to the control condition that did not make this choice, participants were
more likely to favor the small assortment when subsequently asked to choose between
two stores (16% vs. 2%). Chernev also shows that this preference decreases when a clear
dominating alternative is available, suggesting that when consumers expect an easy
decision, the large assortment is still embraced regardless of decision focus.
The experiments suggest that consumers are not automatically aware of the
difficulty associated with making choices among large assortments. In terms of CS
strategies, the studies suggest that when consumers are focused on the decision at hand,
and not simply focused on forming a consideration set, different decision strategies are
likely to be employed. When consumers are constructing a CS with explicit knowledge of
a future choice (opposed to CS construction with no knowledge of future choice, e.g.,
browsing), they are likely to use a strategy that minimizes cognitive resources in order to
maximize the amount of resources left over for subsequent choice. As the number of
alternatives in the assortment increases, so will the demand on cognitive resources
(Malholtra 1982; Shugan 1980), which will lead to greater use of simplifying decision
strategies (Payne 1976). As previously discussed, an include strategy will save more
cognitive resources compared to an exclusion strategy as the size of the assortment
increases. Thus, if a cognitive resources explanation is correct, then we would expect that
a moderator on CS strategy will be the decision focus of consumers, such that any change
in consideration set strategy from small to large assortments will be enhanced (mitigated)
when consumers are focused (not focused) on the final choice phase. Future research
should test this process further by using a similar decision focus manipulation.

90
Preference Articulation
Another area for future research is in the preference articulation domain. Research
has shown that when preferences have been articulated, consumers prefer large
assortments over small (Chernev 2003a). This research has also found that preference
articulation leads to more confirmatory processing and alternative-based compared to
attribute-based searches, and this is especially pronounced with large assortments
(Chernev 2003a). Consumers that have defined their preferences through articulation do
not need a CS strategy to help define their preferences; instead they will use the
consideration set formation phase to simply identify all the options that are close to their
ideal point. Thus, we would expect that when consumers have articulated an ideal point
they are more likely to conduct a confirmatory include strategy that simply searches for
positive matches compared to an exclude strategy which eliminates poor options when
creating their consideration set.
Positive versus Negative Attributes and Strategy Choice
One are for future research is testing the impact of attribute valence on decision
strategy. There is evidence to suggest that attribute valence will moderate the choice of
CS strategy. Experiments 2, 3, and 4 showed that consumers focused more on positive
attributes when using an include strategy and more on negative attributes when using an
exclude strategy. Experiment 3 in particular showed that it was the CS construction
strategy that led to the differential weighting of attributes.
There is evidence that the causal direction may work in reverse as well. When
deciding on which strategy to use to screen a set of alternatives, decision makers tend to
choose a strategy that is consistent with their task. For instance, when screening is
positively framed (e.g., hiring task, adding stocks to a portfolio) an include strategy is
more likely to be used, and when screening is negatively framed (e.g., firing task,

91
dropping stocks from a portfolio) an exclude strategy is more likely to be used (Levin et
al. 2001; Ordóñez et al. 1999). Similarly, Meloy and Russo (2004) have found a
compatibility effect when faced with binary choice. Decisions seem to “flow more
smoothly” when the contexts match. Specifically, decision makers faced with a positive
decision task are more likely to switch strategies when instructed to use an exclusion
strategy. From these findings we would expect that when attribute in an assortment set
are framed positively, more inclusion will occur, and when attribute are framed
negatively, more exclusion will occur. However, when faced with a small assortment,
consumers will be less burdened by information and will have excess cognitive capacity.
They will be better able to convert positive information into negative information and
still conduct an exclude strategy, arguably the default strategy in small assortments
(Ordóñez et al.1999; but see Levin et al. 2001). In other words, we would expect that in
small assortments the feature frame will have less of an impact on consideration set
formation strategy compared to large assortments. Future studies should address these
framing effects on CS strategy.
Choice Phase
This proposal addresses the use of strategies on the CS construction phase, but the
next question is how they will affect the choice phase. There is evidence that the
weighting effect will not carryover to the choice stage and the opposite might occur in
choice compared to CS constrcution. Screening tends to be more noncompensatory
(compared to choice which is more compensatory) and the goal of screening is to avoid
bad outcomes, though this avoidance could be achieved by either including good options
or excluding bad options (Beach 1993; Ordóñez et al. 1999). The screening effect
proposes that the consideration set construction process is different from the final choice
process (Beach 1993; Chakravarti et al. 2006; van Zee et al. 1992). Specifically,

92
attributes that are important in the CS phase are used less in subsequent choice, but only
when CS construction is done using an include strategy (Chakravarti et al. 2006). When
Chakravarti et al. (2006) allowed participants to use an exclude strategy in their third
experiment instead of the include strategy used in studies 1 and 2, the screening effect
was eliminated. The findings suggest that the consideration set is a less mentally coherent
category when an exclude (vs. include) strategy is used. Since include strategies will lead
decision makers to focus on positive features in the consideration set formation phase,
positive attributes are likely to have less weight in the choice phase according the
screening effect. In other words, when choice is preceded by an include strategy the
relative weighting of positive features should decrease in choice compared to
consideration set construction; however, when choice is preceded by an exclude strategy
there should be no change in the weighting of negative and positive attributes in choice
compared to consideration set construction.
In addition to licensing and screening effects (Chakravarti et al. 2006, 2007),
future research should also investigate the potential negative consequences of an include
strategy on anticipated and experienced satisfaction, decision confidence and quality. The
use of an include strategy may lead consumers to be more susceptible to framing effects
and robust decision context effects that occur with small consideration sets, such as the
compromise effect (Simonson 1989) and asymmetric dominance (Huber, Payne, and Puto
1982). It may be interesting to investigate how the use of a CS strategy affects the use of
decision rules and heuristics in the choice phase. Though these strategies and rules are
orthogonal concepts, it may be that certain strategies increase the probability that
decision makers use specific compatible rules or short cuts. Future research could begin
to tackle this issue.

93
Other Contextual Factors
Testing the use of an include or exclude strategy in an online shopping
environment and its consequences on decision difficulty and conversion rates is an
important area for future research and for marketing practice. We would assume that less
difficulty and anticipated regret from using an exclude strategy would lead to higher
conversion rates, but it is an empirical question that should be investigated. Follow-up
studies can also test whether this decrease in difficulty and regret translates into more
repeat purchase.
In some product categories (e.g., chocolates) we could imagine that a small
amount of regret might lead to variety seeking and repeat purchases but large amounts of
regret would translate into less repeat purchases. However, product categories such as
consumer durables (e.g., cell phones, cars) are likely to only lead to a decrease in repeat
purchasing as decision difficulty and regret increase. Identifying if and when these effects
occur is an important area for future research as well.
MARKETING IMPLICATIONS AND CONTRIBUTIONS
The findings from this research have important implications for consumers and
retailers as well. Though we are often taught as students to use an exclude strategy when
taking multiple choice tests, and an exclude strategy is arguably the default strategy in
small assortments (Ordóñez et al. 1999), the results show that people are likely to switch
away from an exclude strategy and towards an include strategy when faced with large
assortments. Knowing which strategy consumers are likely to use can be beneficial to
marketers and knowing who is likely to use each strategy can be helpful as well. On the
one hand, some consumers may be reluctant to switch to an include strategy when faced
with a large assortment because they have been conditioned to eliminate alternatives first,
which may ultimately restrict the decision process. On the other hand, some consumers

94
may be more eager to use an include strategy when faced with a large assortment.
Experiment 2 provides evidence that maximizers may be these eager consumers that are
more likely to use an include strategy in large compared to small assortments.
One of the major implications from the second essay is that an include strategy
leads consumers to form considerably smaller consideration sets and that these
consideration sets are formed based on more positive attributes. As a manufacturer, the
prospect that your product is now less likely to make it into a consumer’s consideration
set due to a shrinking set may be disturbing; however, there are now fewer options to
compete with in the final set, which also provides opportunities.
What is more important is how products make it into the consideration set. If
consumers are using an include strategy, then they are more likely to be including a
product based on its positive attributes. Thus, for product categories that are likely to lead
to an include CS construction strategy, it would be in a marketers best interest to create
and market enriched options (options with both extremely positive and extremely
negative attributes) compared to impoverished options (options with more average
attributes and few extreme attributes). In other words, for an option to make it into the
consideration set it needs to be strong on something, not average on everything. On the
flip side, to avoid falling into the inept set when we know consumers are using an
exclude strategy, it would be best for marketers to provide impoverished options that are
not extremely negative—even if it they come at the expense of extremely positive
attributes.
When do consumers use an include or exclude consideration set strategy and what
product categories are likely to lead to an include strategy? First, we do know that as the
assortment increases they are more likely to use an include strategy. Thus, marketers
should be providing enriched options in product categories that are well developed and

95
saturated with several options. In newer product categories with small assortments, or
luxury products or commoditized categories with fewer options, marketers should avoid
extreme negative attributes that would lead to exclusion of their product.
There are also decision tools that marketers currently use that help consumers use
an include strategy. Most websites allow consumers to use an include strategy by placing
them into a virtual shopping cart. For example, real estate broker websites often allow
consumers to save their favorite properties, and websites like Amazon.com allow
consumers to place options in their cart or simply save them for later. However, there are
few tools that allow consumers to throw out or exclude options that are not acceptable.
Where an exclude strategy is allowed, marketers are likely to see consideration sets with
more impoverished options and fewer enriched options.
Retailers, especially those on the Internet, may want to consider offering tools that
allow consumers to use both exclude and include strategies to better meet consumer
preferences. For instance, Kayak.com allows consumers to “pin up” and save potential
flight, car, and hotel reservations (an include strategy) and/or remove entire reservations
that are not acceptable (an exclude strategy). These two strategies help consumers narrow
down the hundreds of options down to a much more manageable set and allow consumers
to use an include or exclude strategy depending on their own personal preference.
Another interesting finding from the consideration set analyses is that maximizers
showed consistently smaller consideration sets compared to satisficers. This effect has
not been shown before in the literature and is a little counterintuitive. Maximizers may be
more likely to examine more options in the choice process (Schwartz et al. 2002; Iyengar
et al. 2006), but fewer options ultimately make it into their final consideration set. For
marketers, the size of a consumers consideration set, which can often be measured on a

96
website, could be used to help profile consumers as leaning more towards a maximizer or
more towards being a satisficer.
CONCLUSION
We know that assortment sizes are likely to increase as the proliferation of
products increases and access to more options increases over the Internet. One solution to
mitigating the negative consequences of large assortments is to simply offer fewer
options to consumers. However, this solution also eliminates some of the benefits of large
assortments, such as increased variety seeking (Kahn and Lehman 1991; Baumol and Ide
1956) and the increased likelihood of the assortment containing a consumers ideal point
(Chernev 2003a). Though the lure of assortment can depend on individual preferences
(Briesch et al. 2006), it does appear that decreasing the size of an assortment overall is
not a viable option for less frequently purchased product categories due to its affect on
sales (Borle et al. 2004).
As marketers and retailers we know that we should be offering more flexibility in
how consumers narrow down the vast set of alternatives to a manageable consideration
set, and we should continue to investigate and be cautious of tools that we may intuitively
believe will help consumers. Essay 1 shows that seemingly innocuous signage that should
help consumers, can actually backfire and lead to more difficulty and regret for
consumers with more developed preferences. Essay 2 clearly shows that some consumers
prefer using an include consideration set strategy compared to an exclude strategy and
that this changes with assortment. It would be advantageous for retailers to offer both
include and exclude tools to cater to both types of consumers. As the size of the
assortment increases, retailers should be encouraging consumers to use an include
strategy because it is the more natural strategy as assortment increases, and it would
behoove them to highlight positive attributes and frame attributes in a positive manner to

97
aid the decision process. As researchers we should continue to identifying what strategies
consumers and retailers can use to help people wade through the vast assortment of
product options and further examine its impact on the final choice phase of the decision.
This dissertation provides a structured framework for understanding these strategies and
paves several fruitful avenues for future research.

98
Figure 1
Essay I: Experiment 1
Decision Difficulty
0
0.5
1
1.5
2
2.5
3
3.5
SmallAssortment
LargeAssortment
Control
Sign
Anticipated Regret
2
2.5
3
3.5
4
4.5
SmallAssortment
LargeAssortment
Control
Sign

99
Figure 2
Essay I: Experiment 2
Consideration Set Size Decision Difficulty
2
2.5
3
3.5
4
4.5
5
5.5
SmallAssortment
LargeAssortment
Control
Low Attract
High Attract
2
2.5
3
3.5
4
4.5
SmallAssortment
LargeAssortment
Control
Low Attract
High Attract
Anticipated Regret Experienced Regret
2
2.5
3
3.5
4
4.5
5
SmallAssortment
LargeAssortment
Control
LowAttract
HighAttract
1
1.2
1.4
1.6
1.8
2
2.2
2.4
2.6
2.8
3
SmallAssortment
LargeAssortment
Control
LowAttract
HighAttract

100
Figure 3
Essay I: Experiment 3Large Assortment Only
Consideration Set Size Decision Difficulty
5.00
5.50
6.00
6.50
7.00
LessDeveloped
MoreDeveloped
Control
Best Seller
2.00
2.20
2.40
2.60
2.80
LessDeveloped
MoreDeveloped
Control
Best Seller
Consideration of Signed Options Consideration of Non-Signed Options
0.00
0.50
1.00
1.50
2.00
LessDeveloped
MoreDeveloped
Control
Best Seller
4.00
4.50
5.00
5.50
6.00
6.50
7.00
LessDeveloped
MoreDeveloped
Control
Best Seller
Regret
2.40
2.60
2.80
3.00
3.20
3.40
LessDeveloped
MoreDeveloped
Control
Best Seller

101
Figure 4
Essay I: Experiment 4 Large Assortment Only
Consideration Set Size Anticipated Regret
Consideration of Signed Options Consideration of Non-Signed Options
Number Purchased Likelihood of Purchasing a Best Seller
0
0.2
0.4
0.6
0.8
1
LessDevelop
MoreDevelop
LessDevelop
MoreDevelop
Single Choice Multiple Choice
Control
Best Seller
0
1
2
3
4
5
6
LessDevelop
MoreDevelop
LessDevelop
MoreDevelop
Single Choice Multiple Choice
Control
Best Seller
0
1
2
3
4
LessDevelop
MoreDevelop
LessDevelop
MoreDevelop
Single Choice Multiple Choice
Control
Best Seller
0
1
2
3
4
5
6
7
LessDevelop
MoreDevelop
LessDevelop
MoreDevelop
Single Choice Multiple Choice
Control
Best Seller
0
0.2
0.4
0.6
0.8
1
LessDevelop
MoreDevelop
LessDevelop
MoreDevelop
Single Choice Multiple Choice
Control
Best Seller
0
1
2
3
4
LessDevelop
MoreDevelop
LessDevelop
MoreDevelop
Single Choice Multiple Choice
Control
Best Seller

102
Figure 5
Essay II: Experiment 1
Decision Difficulty by CS Construction Strategy and Assortment
0
0.5
1
1.5
2
2.5
3
Small Assort Large Assort
Diff
icul
ty
Exclude
Include
Decision Regret by CS Construction Strategy and Assortment
00.5
11.5
22.5
33.5
4
Small Assort Large Assort
Re
gre
t Exclude
Include

103
Figure 6
Essay II: Experiment 2
Include vs. Exclude Strategy by Assortment and Maximizer/Satisficer
0.10
0.20
0.30
0.40
0.50
0.60
Satisficers Overall MaximizersPro
porti
on C
hoo
sin
g an
Incl
ude
S
trat
egy Small
Assort
LargeAssort
Proportion of Positive and Negative Thoughts by Consideration Set Strategy and Assortment
0.20
0.30
0.40
0.50
0.60
0.70
Include Exclude Include Exclude
Positive Negative
Pro
port
ion
of T
houg
hts
SmallAssort
LargeAssort
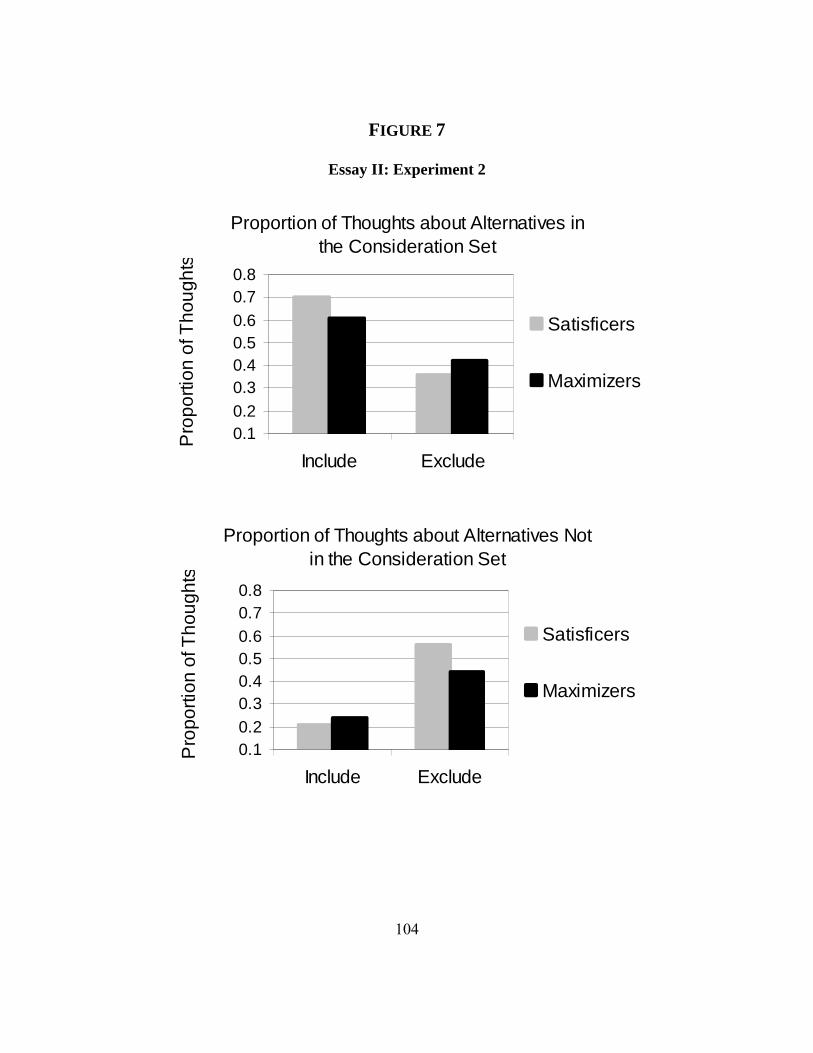
104
FIGURE 7
Essay II: Experiment 2
Proportion of Thoughts about Alternatives in the Consideration Set
0.10.2
0.30.40.50.6
0.70.8
Include Exclude
Pro
po
rtio
n o
f Th
ou
gh
ts
Satisficers
Maximizers
Proportion of Thoughts about Alternatives Not in the Consideration Set
0.10.2
0.30.40.50.6
0.70.8
Include Exclude
Pro
po
rtio
n o
f Th
ou
gh
ts
Satisficers
Maximizers

105
Figure 8
Essay II: Experiment 2
Decision Regret
2.40
2.60
2.80
3.00
3.20
3.40
3.60
3.80
Small Assort Large Assort
Re
gre
t Include
Exclude

106
Figure 9
Essay II: Experiment 4
Include vs. Exclude by Assortment and Maximizer/Satisficer
0.10
0.20
0.30
0.40
0.50
0.60
Satisficer Overall MaximizersPro
po
rtio
n C
ho
osi
ng
an
Incl
ud
e
Str
ate
gy
SmallAssort
LargeAssort
Proportion of Positive and Negative Attributes Listed by Screening Strategy
0.10
0.30
0.50
0.70
0.90
Positive Negative
Attributes
Pro
porti
on
of A
ttrib
utes
L
iste
d Include
Exclude

107
Table 1
Essay I: Experiment 2
Study 2 Regression Coefficients
Dependent Variable Intercept
Category Involvement Assortment
Sign Contrast1
Assortment X Sign Contrast1
Sign Contrast2
Assortment X Sign Contrast2
Consideration Set Size 3.43** 0.07** 0.88** -0.07 -0.18 0.25** 0.23**
Decision Difficulty 2.50** 0.04** 0.22** 0.00 -0.02 0.15** 0.13**
Anticipated Regret 3.63** 0.03 0.37** 0.15 -0.05 -0.07 0.12*
Experienced Regret 2.40** -0.03 0.26** 0.15 -0.12 0.00 0.13**
**p < .05, *p < .1
Assortment variable coded 1 for large assortments and -1 for small assortments.Sign Contrast1 variable coded 0 for High Attractive Signs, 1 for Low Attractive Signs, and -1 for Control.Sign Contrast2 variable coded 2 for High Attractive signs, -1 for Low Attractive signs, and -1 for Control.

108
Table 2
Essay I: Experiment 2
Consideration Set Least Squares Means
Assortment Sign
Number of High Attractive Options
Number of Low Attractive Options
Number of Other Options
Total Number of Options
Small Control 1.16 0.56 0.73 2.45Low Attractive 1.14 0.58 0.89 2.62High Attractive 1.07 0.40 1.15 2.61
Large Control 0.39 0.07 3.58 4.03Low Attractive 0.26 0.18 3.13 3.57High Attractive 0.67 0.17 4.46 5.30
Note that of the 30 (6) total options in the large (small) choice set, 2 are high attractive options, 2 are low attractive options, and 26 (2) were other options in the large (small) assortment condition, respectively.

109
Table 3
Essay II: Consideration Set Literature Summary
Definitions (CS = Consideration Set) Moderators and other Factors Other CommentsHowerd and Sheth 1969
Evoked Set: “brands the buyer considers when he/she contemplates purchasing a unit of the product class” (p. 416)
Shocker et al. (1991) in their review compare the evoked set to the choice set
Narayana and Markin 1975
Awareness Set: brands in a product class of which the consumer is awareEvoked Set: brands evaluated positively and considered for purchaseInert Set: brands with neither positive or negative evaluationsInept Set: brands evaluated negatively and not considered for purchase
The inept set is the compliment of the evoked or consideration set
Payne 1976 As # options increase, use more noncompensatory strategies.
Wright and Barbour 1977
CS: “brands a consumer will consider”
Hauser 1978 CS accounts for 78% of uncertainty in choice, preference accounts for 22%
Lussier and Olshavsky 1979
More likely to form a CS with larger assortment (6 & 12) compared to small (3).
Noncompensatory rules: CS constructionCompensatory models: Choice
Bettman 1979 Noncompensatory rules: CS constructionCompensatory models: Choice
Nedungadi 1990 CS: “Brands brought to mind on a particular choice occasion” (p. 264)
Memory effects (i.e., accessibility, organization, primes) affect CS construction
CS composition can affect choice without changing evaluations. Evaluation takes place in choice stage.
Hauser and Wernefelt 1990
CS: Options receiving “serious attention” Cost-benefit model for the addition of each option. CS size between 2 and 8.
Shocker et al. 1991 CS: “Goal-satisfying alternatives salient or accessible on a particular occasion”Choice (Evoked) Set: brands evaluated at the point of decision making
Contextual factors such as usage factors and retrieval cues
Simonson, Nowlis, and Lemon 1993
Local CS: subset of options from the complete set of alternatives under consideration
Division of CS into local sets can impact preferences. See also Kahn, Moore, and Glazer (1987)
Lehmann and Pan 1994
CS: “Brands being considered at a prior stage in the choice process…often portrayed as developed by a retrieval process from memory” (p. 364)
Extremeness aversion and compromise effect hold with CS construction
CS tend to include options that are closer in perceptual space

110
Table 3 (cont.)
Essay I: Consideration Set Literature Summary (cont.)
Definitions (CS = Consideration Set) Moderators and other Factors Other CommentsMitra 1995; Mitra and Lynch 1995
Advertising stabilizes CS and can both increase and decrease CS sizes
Allenby and Ginter 1995
In-store displays and features influence consideration, merchandising support variables affect choice
Heide and Weiss 1995
Closed set: only previously used supplies/options; Open set: new vendors/options are added to the set
Roberts and Lattin 1991, 1997
An option is included in the CS if its cost of consideration is lower than the benefits
Adding a CS stage to choice models increases fit and prediction.
Ratneshwar, Pechmann, and Shocker 1996
“CS are constructed as part of consumers’ problem-solving routines” (p. 241)
Conflicting and ambiguous goals led to consideration beyond nominal product categories (not impact CS size)
CS can extend beyond nominal product categories when goals are conflicting or ambiguous
Desai and Hoyer 2000
More familiar situations yield less stable, larger, and more varied CSs with unequal preferences
Familiar situations can either be by occasion or location. Supports notion that CS are dynamic.
Haubl and Trifts 2000
CS: Set of options that has survived the screening process
Chakravarti and Janiszewski 2003
CS construction: “relatively effortless process aimed at simplifying the more burdensome final choice task” (p. 245)
CS more likely to contain easily comparable, or alignable, options to facilitate final choice
CS composition affected by screening criteria, screening processes, and context goals
Gilbride and Allenby 2004
Use the term Choice Set, but define as CS consistent with literature
Consumers use screening rules, particularly conjuctive (EBA) rules
Model CS using screening rules, not just overall utility
Paulssen and Bagozzi 2005
CS conceptualized as goal-derived categories
Desired benefits, which are based on macrolevel goals of the ideal self, determine brand consideration.
“direct investigation of the antecedents of brand consideration is worthwhile…which cognitive processes lead to the formation of consideration sets?” (p. 787)
Yee, Dahan, Hauser, and Orlin 2006
Lexicographic-by-aspects model predicts CS better than EBA or ABA, and consumers tend to process by aspects rather than features.

111
Table 4
Essay II: Include/Exclude Literature Summary
Ass
ortm
ent
Siz
e Type ofStimuli #
of
Att
rib
ute
s
Consideration Set Size: Include/Exclude
P(Include) or Manipulated? Comments
Choice StudiesShafir 1993
2 Various Choice Task ManipulatedEnriched option chosen more in select vs. reject. An alternative’s positive (negative) features are weighed more in select (reject).
Ganzach 1995
3 Various Choice Task Manipulated
Enriched options chosen less in select vs. reject. Commitment greater in select, which leads to a conjunctive strategy and the avoidance of negative attributes.
Ganzach and Schul 19952
Room-mates
2 -12 Choice Task Manipulated
Options with 6+ & 6- preferred to 3+ & 3- in select (.52) vs. reject (.32). Supports Shafir (1993), but see Wedell (1997).
Wedell 1997
2 Various4 -6 Choice Task Manipulated
Accentuation model: Effects not due to a change in weighting, but accentuation when in choose mode. Enriched preferred: advantage for choose. Enriched not preferred: advantage for reject.
Meloy and Russo 2004
2
Resorts & Courses 6 Choice Task Manipulated
Compatibility Effect: Match between alternative valence and strategy leads to greater accentuation of attribute differences, higher certainty, more info distortion
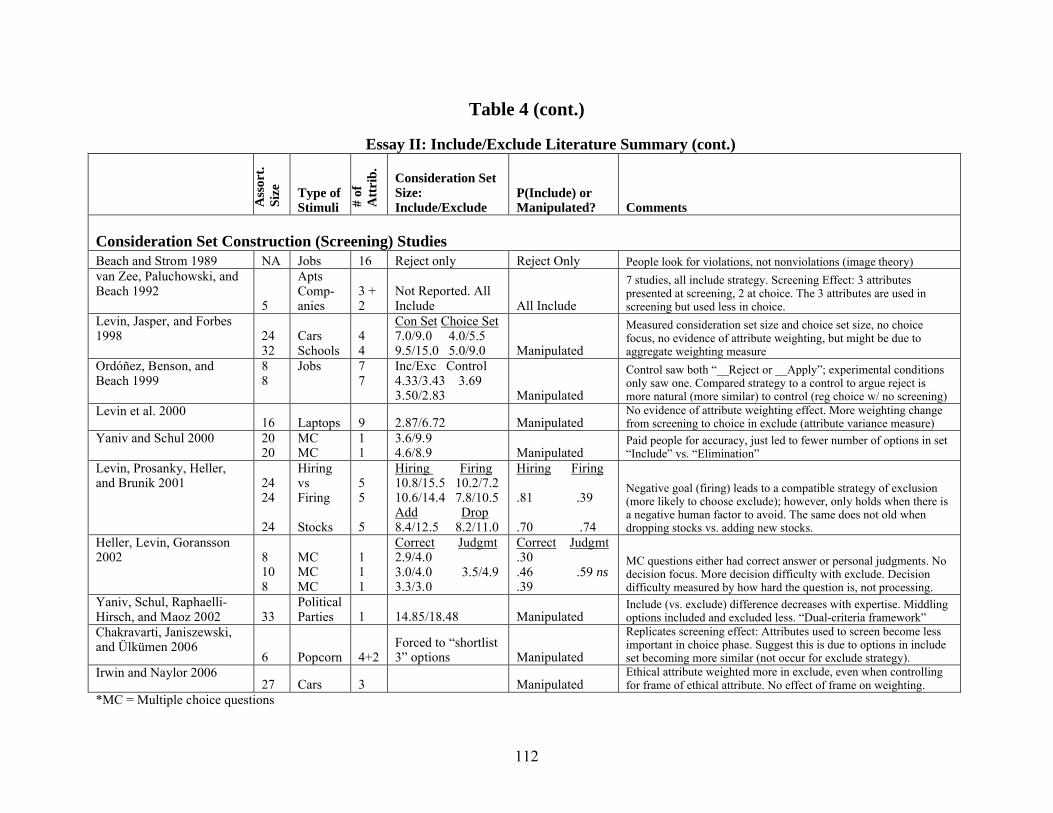
112
Table 4 (cont.)
Essay II: Include/Exclude Literature Summary (cont.)
Ass
ort.
S
ize Type of
Stimuli # of
A
ttri
b.
Consideration Set Size: Include/Exclude
P(Include) or Manipulated? Comments
Consideration Set Construction (Screening) StudiesBeach and Strom 1989 NA Jobs 16 Reject only Reject Only People look for violations, not nonviolations (image theory)van Zee, Paluchowski, and Beach 1992
5
AptsComp-anies
3 + 2
Not Reported. All Include All Include
7 studies, all include strategy. Screening Effect: 3 attributes presented at screening, 2 at choice. The 3 attributes are used in screening but used less in choice.
Levin, Jasper, and Forbes 1998 24
32CarsSchools
44
Con Set Choice Set7.0/9.0 4.0/5.59.5/15.0 5.0/9.0 Manipulated
Measured consideration set size and choice set size, no choice focus, no evidence of attribute weighting, but might be due to aggregate weighting measure
Ordóñez, Benson, and Beach 1999
88
Jobs 77
Inc/Exc Control4.33/3.43 3.693.50/2.83 Manipulated
Control saw both “__Reject or __Apply”; experimental conditions only saw one. Compared strategy to a control to argue reject is more natural (more similar) to control (reg choice w/ no screening)
Levin et al. 200016 Laptops 9 2.87/6.72 Manipulated
No evidence of attribute weighting effect. More weighting change from screening to choice in exclude (attribute variance measure)
Yaniv and Schul 2000 2020
MCMC
11
3.6/9.94.6/8.9 Manipulated
Paid people for accuracy, just led to fewer number of options in set“Include” vs. “Elimination”
Levin, Prosanky, Heller, and Brunik 2001 24
24
24
Hiring vs Firing
Stocks
55
5
Hiring Firing10.8/15.5 10.2/7.210.6/14.4 7.8/10.5Add Drop8.4/12.5 8.2/11.0
Hiring Firing
.81 .39
.70 .74
Negative goal (firing) leads to a compatible strategy of exclusion (more likely to choose exclude); however, only holds when there is a negative human factor to avoid. The same does not old when dropping stocks vs. adding new stocks.
Heller, Levin, Goransson 2002 8
108
MCMCMC
111
Correct Judgmt2.9/4.03.0/4.0 3.5/4.93.3/3.0
Correct Judgmt.30.46 .59 ns.39
MC questions either had correct answer or personal judgments. No decision focus. More decision difficulty with exclude. Decision difficulty measured by how hard the question is, not processing.
Yaniv, Schul, Raphaelli-Hirsch, and Maoz 2002 33
Political Parties 1 14.85/18.48 Manipulated
Include (vs. exclude) difference decreases with expertise. Middling options included and excluded less. “Dual-criteria framework”
Chakravarti, Janiszewski, and Ülkümen 2006
6 Popcorn 4+2Forced to “shortlist 3” options Manipulated
Replicates screening effect: Attributes used to screen become less important in choice phase. Suggest this is due to options in include set becoming more similar (not occur for exclude strategy).
Irwin and Naylor 200627 Cars 3 Manipulated
Ethical attribute weighted more in exclude, even when controlling for frame of ethical attribute. No effect of frame on weighting.
*MC = Multiple choice questions

113
Table 5
Essay II: Definitions of Noncompensatory Decision Rules and their Relation to Include/Exclude Strategies
Definitions* Peter and Olson (2005) state the a conjunctive rule can be used to either accept or reject options: “…applying the conjunctive choice rule requires thealternative be rejected if any one of its consequences does not surpass a minimum threshold level of acceptability” and “Consumer establishes a minimum acceptable level for each choice criterion. Accept an alternative only if every criterion equals or exceeds the minimum cutoff level” (p. 176).** Payne et al. (1993) note that “an EBA process violates the idea that one should use all relevant information in making a decision,” and it is only rational in terms of the order in which the attributes are used (p. 27). This note is important because one can use an include (or exclude) strategy without violating rationality. ***A binary attribute is an aspect. A multi-level attribute is a collection of related aspects (Yee et al. 2006
Cite and Terminology used
Conjunctive Disjunctive Lexicographic Acceptance-by-Aspects (ABA)
Elimination-by-Aspects(EBA)***
Satisficing
Hoyer and MacInnis (2001)“Models of choice”
Alternative-Based: Minimum cutoffs for all attributes to reject “bad” options. Focus on negative info.
Alternative-Based: Acceptable cutoffs on most important attributes to select “good” options. Focus on positive info.
Attribute-Based: Choose based on the most important attribute, if tie move to the next.
Attribute-Based: Eliminate options below the cutoff on most important attribute first until one options remains.
Find an option that satisfies a need even though the option may not be the best.
Peter and Olson 2005 “Choice rule”, or “Models of information integration processes on choice”
Minimum level for each criterion. Accept an alternative only if every criterion equals or exceeds the minimum cutoff.*
Minimum standards for each criterion. Product is acceptable if it exceeds the minimum level on at least one criterion.
Choose best alternative on most important criterion. If tie, select best on 2nd most important, and so on.
Select one criterion and eliminate all alternatives until one alternative remains.
Hawkins, Best, and Coney 2004, “Decision rules for attribute-based choices”
Establishes minimum required performance standards for each evaluative criterion and selects options that surpass these standards.
Establish a minimum performance level for each important attribute. All options surpassing performance level for anyattribute are considered.
Rank criteria in order of importance. Select options that perform best on most important attribute, if more than one option, evaluate based on 2nd mostimportant attribute.
Rank criteria in order of importance and establish a cutoff point for each. Start with most important attribute and drop options that do not surpass the cutoff. Then repeat for 2nd
most important.**Bettman 1979, “Choice heuristics”
Alternative-Based. Minimum cutoffs for each dimension. If alternative not pass all cutoffs, it is rejected. Weight negative data more.
Alternative-Based. Acceptable standards for each dimension (which may be higher than minimum cutoff in conjunctive). Ifalternative passes standard on any attribute, it is accepted.
Attribute-Based. Options compared with respect to most important attribute. Choose option preferred on this attribute. If tie, 2nd most important attribute is considered.
Attribute-Based. Aspect, or attribute, is selected with probability proportional to its weight. Eliminate all alternatives not having satisfactory values for the selected aspect. Second attribute then selected and process continues.

114
Table 5 (cont.)
Essay II: Definitions (cont.)
****ABA and EBA are not complimentary (Yee et al. 2006) and attribute-based (Payne et al. 1998). However, an include and exclude strategy are complimentary, from a normative standpoint, and they are alternative-based.
Relation to Include/Exclude Strategies
Conjunctive Disjunctive Lexicographic Acceptance-by-Aspects (ABA)****
Elimination-by-Aspects (EBA)
Satisficing (only applies to choice, not screening)
Yee, Dahan, Hauser, and Orlin 2006, “Decision processes”
Labeled “Lexicographic-by-feature”. Every level of an attribute is ordered starting with first attribute. Similar to Lexicographic but assumes complete ordering of attribute levels.
Successive acceptance of aspects.
Lexicographic-by-Aspects: Combination of acceptance and elimination criteria
Successive elimination of aspects.
Payne, Bettman, and Johnson 1993, “Decision strategies,” “Choice processes,” and “Heuristics”
Option with the best value on the most important attribute is selected. If two options have tied, second most important attribute is considered and so on
Cutoff value for most important attribute is retrieved and all alternatives with values for that attribute below the cutoff are eliminated.
Alternatives considered one at a time. If any attribute vqalue sis below cutoff, then reject. First alternative that has values that meet the cutoffs for all attributes is chosen and processing stops.
Bettman, Luce,and Payne 1998, “Decision strategies”
Alternative with the best value on the most important attribute is selected.
Combines lexicographic and satisficing. Eliminates options that do not meet minimum cutoff value for most important attribute. Repeated for 2nd most important attribute
Alternatives considered sequentially, see whether an options meets a predetermined cutoff level for each attribute. If fails, reject; if pass cutoff, select.
Satisficing Conjunctive Disjunctive Lexicographic Acceptance-by-Aspects
Elimination-by-Aspects
Can it be used while using an include strategy?
No. It would lead to a consideration set size of 1.
Yes. Search for options that are satisfactory on all dimensions and include them.
Yes. Search for options that satisfy at least one criterion and include them.
Yes. Search for options that are top performers on most important attribute and include them.
Yes. After identifying aspect to be accepted (e.g., red cars), include options that are red.
Yes. After identifying aspect to be eliminated (e.g., black cars), include options that are not black.
Can it be used while using an exclude strategy?
No. It would lead to a consideration set size of 1.
Yes. Search for options that violate one dimension and exclude them.
Yes. Search for options that violate all criterion and exclude them.
Yes. Search for options that are not top performers on most important attribute and exclude them.
Yes. After identifying aspect to be accepted (e.g., red cars), exclude options that are not red.
Yes. After identifying aspect to be eliminated (e.g., black cars), exclude options that are black.

115
Table 6
Essay II: Experiment 2 and 3 Means by Maximizers/Satisficer
Include Exclude Include Exclude Include Exclude Include Exclude Include Exclude Include Exclude Include Exclude Include Exclude
Screening Phase
Positive Thoughts 0.65 0.47 0.57 0.36 0.70 0.42 0.78 0.25 0.60 0.54 0.44 0.38 0.50 0.47 0.56 0.50
Negative Thoughts 0.30 0.45 0.31 0.60 0.27 0.53 0.20 0.66 0.32 0.40 0.41 0.50 0.45 0.47 0.36 0.44
Cons. Set Thoughts 0.69 0.49 0.53 0.35 0.69 0.46 0.72 0.25 0.67 0.54 0.44 0.35 0.54 0.48 0.56 0.44
Non-Cons. Set Thoughts 0.25 0.43 0.24 0.45 0.27 0.51 0.15 0.60 0.28 0.41 0.32 0.48 0.41 0.45 0.25 0.38
Positive Attributes 0.91 0.78 0.84 0.47 0.91 0.72 0.78 0.70 0.84 0.77 0.66 0.64 0.77 0.79 0.88 0.79
Negative Attributes 0.09 0.18 0.18 0.53 0.12 0.24 0.22 0.29 0.19 0.25 0.27 0.32 0.28 0.35 0.29 0.27
Choice Phase
Decision Difficulty 2.24 2.43228 2.22 2.70186 2.09 2.41 2.27 1.93 2.34 2.30 3.09 2.32 1.72 2.15 1.98 2.13
Decision Regret 3.31 2.83 3.27 3.67 3.00 2.86 2.57 2.73 3.1805 3.21859 3.4318 2.86612 2.258 2.61715 2.5631 2.28172
Small Assort Large Assort Small Assort Large Assort Small Assort Large Assort Small Assort Large Assort
Maximizers Satisficers
Experiment 2 Experiment 3
Maximizers Satisficers
*Means plotted one standard deviation above and below the mean on the maximizer/satisficer scale

116
Table 7
Essay II: Summary of Means across Experiments
Include Exclude Include Exclude Include Exclude Include Exclude Include Exclude Include Exclude Include Exclude Include Exclude
Screening Phase
Include Strategy 0.31 0.69 0.65 0.35 0.34 0.66 0.46 0.54 0.37 0.63 0.52 0.48
Consideration Set 2.67 3.34 8.04 13.65 5.04 7.49 7.32 11.96 2.26 3.01 4.25 11.60 2.54 3.27 6.85 17.46
Positive Thoughts 0.68 0.45 0.68 0.31 0.55 0.51 0.50 0.44
Negative Thoughts 0.28 0.50 0.24 0.63 0.39 0.43 0.39 0.47
Cons. Set Thoughts 0.69 0.47 0.62 0.30 0.60 0.51 0.50 0.39
Non-Cons. Set Thoughts 0.26 0.47 0.20 0.52 0.34 0.43 0.28 0.43
Positive Attributes 0.91 0.75 0.81 0.58 0.81 0.78 0.77 0.71 0.86 0.75 0.28 0.69
Negative Attributes 0.11 0.21 0.20 0.40 0.24 0.30 0.28 0.29 0.14 0.25 0.17 0.31
CS Construction Difficulty 2.49 2.78 2.80 2.34
Choice Phase
Decision Difficulty 1.91 2.37 2.46 1.58 2.16 2.42 2.24 2.32 2.03 2.23 2.53 2.23
Decision Regret 2.90 3.41 3.18 1.86 3.16 2.84 2.92 3.20 2.72 2.92 3.00 2.57 3.05 3.43 3.07 2.88
Large AssortSmall AssortLarge AssortSmall Assort Large AssortSmall AssortLarge AssortSmall Assort
Experiment 4Experiment 3Experiment 2Experiment 1

117
Appendix A
Essay I: Experiment 1 & 2 Sample Stimuli
Shopping StudyToday we are doing a marketing research study that examines how people select chocolate. We simply would like you to look at the set of chocolates and let us know which you would be most likely to buy. You can look as closely at the chocolates as you’d like, but you may not touch them. Later in the experiment, you will actually receive the chocolate you choose.
Please circle the number corresponding to your choice.
1 Heart 16 Strawberry Truffle2 Mandarin Orange Truffle 17 Open Oyster3 Grande Mint 18 Myers Rum Truffle4 Vanilla Truffle 19 Crown 5 Raspberry Truffle 20 Vanilla Caramel6 Honey Roasted Almond Truffle 21 Hazelnut Croquant7 Dark Chocolate Truffle 22 Praline Cascade8 Raspberry Cordial 23 Milk Chocolate Truffle9 Pecan Caramel Truffle 24 Raspberry Starfish
10 Scallop Shell 25 Praline Truffle11 Coconut Truffle 26 Cocoa Demitasse12 Demitasse 27 Cappuccino Truffle13 Grand Marnier Truffle 28 Ivory Demitasse14 Ivory Heart 29 Strawberry Cheesecake15 Ganache 30 Chocolate Caramel

118
When you were trying to decide, how concerned were you that other choices might be better than the one you were considering?
Rating:______ |----------|----------|----------|----------|----------|----------|1 2 3 4 5 6 7
Not At All Concerned Extremely Concerned
When you were trying to decide, how concerned were you that you might regret your decision?
Rating:______ |----------|----------|----------|----------|----------|----------|1 2 3 4 5 6 7
Not At All Concerned Extremely Concerned
How confident are you about your choice of chocolate?
Rating:______ |----------|----------|----------|----------|----------|----------|1 2 3 4 5 6 7
Not At All Confident Extremely Confident
How difficult was it to make your decision of which chocolate to pick?
Rating:______ |----------|----------|----------|----------|----------|----------|1 2 3 4 5 6 7
Not At All Difficult Extremely Difficult
How complex did you find it to make your decision of which chocolate to pick?
Rating:______ |----------|----------|----------|----------|----------|----------|1 2 3 4 5 6 7
Not At All Complex Extremely Complex
How much did you enjoy making the choice of a chocolate?
Rating:______ |----------|----------|----------|----------|----------|----------|1 2 3 4 5 6 7
Not At All Enjoy Extremely Enjoyed
How pleasant did you find the process of making the choice of a chocolate?
Rating:______ |----------|----------|----------|----------|----------|----------|1 2 3 4 5 6 7
Not At All Pleasant Extremely Pleasant

119
How frustrated did you feel when making the choice of a chocolate?
Rating:______ |----------|----------|----------|----------|----------|----------|1 2 3 4 5 6 7
Not At All Frustrated Extremely Frustrated
How annoyed did you feel while you were making the choice of a chocolate?
Rating:______ |----------|----------|----------|----------|----------|----------|1 2 3 4 5 6 7
Not At All Annoyed Extremely Annoyed
How overwhelmed did you feel while making the choice of a chocolate?
Rating:______ |----------|----------|----------|----------|----------|----------|1 2 3 4 5 6 7
Not At All Overwhelmed Extremely Overwhelmed
How satisfied do you think you will be with the chocolate you chose?
Rating:______ |----------|----------|----------|----------|----------|----------|1 2 3 4 5 6 7
Not At All Satisfied Extremely Satisfied
How did you feel at the moment when you were making your decision?
a) I was relaxed
Rating:______ |----------|----------|----------|----------|----------|----------|1 2 3 4 5 6 7
Not At All Very Much
b) I felt calm
Rating:______ |----------|----------|----------|----------|----------|----------|1 2 3 4 5 6 7
Not At All Very Much
c) I was content
Rating:______ |----------|----------|----------|----------|----------|----------|1 2 3 4 5 6 7
Not At All Very Much

120
(NOTE: Only experiment 2 participants received the following instructions and regret questions)
STOP!
Please Stop. Bring Your Questionnaire to the Administrator in Next Room to
Sample Your Chocolate Selection.
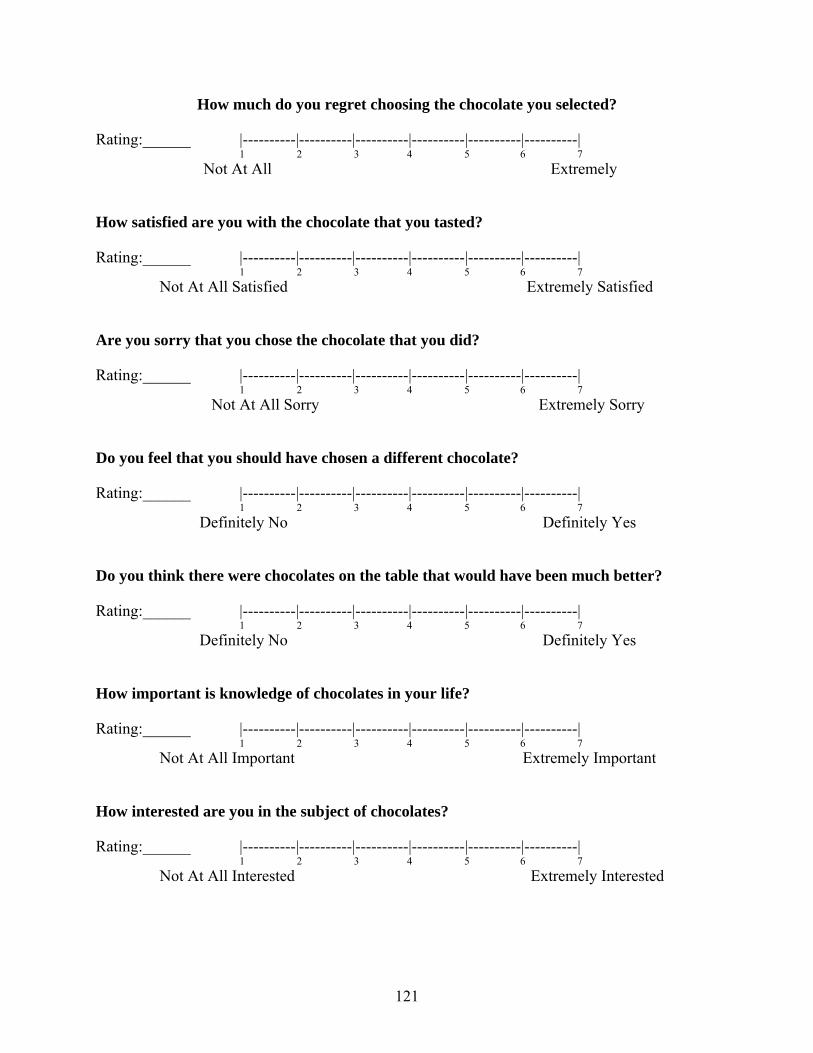
121
How much do you regret choosing the chocolate you selected?
Rating:______ |----------|----------|----------|----------|----------|----------|1 2 3 4 5 6 7
Not At All Extremely
How satisfied are you with the chocolate that you tasted?
Rating:______ |----------|----------|----------|----------|----------|----------|1 2 3 4 5 6 7
Not At All Satisfied Extremely Satisfied
Are you sorry that you chose the chocolate that you did?
Rating:______ |----------|----------|----------|----------|----------|----------|1 2 3 4 5 6 7
Not At All Sorry Extremely Sorry
Do you feel that you should have chosen a different chocolate?
Rating:______ |----------|----------|----------|----------|----------|----------|1 2 3 4 5 6 7
Definitely No Definitely Yes
Do you think there were chocolates on the table that would have been much better?
Rating:______ |----------|----------|----------|----------|----------|----------|1 2 3 4 5 6 7
Definitely No Definitely Yes
How important is knowledge of chocolates in your life?
Rating:______ |----------|----------|----------|----------|----------|----------|1 2 3 4 5 6 7
Not At All Important Extremely Important
How interested are you in the subject of chocolates?
Rating:______ |----------|----------|----------|----------|----------|----------|1 2 3 4 5 6 7
Not At All Interested Extremely Interested

122
How often do you find yourself thinking about chocolates?
Rating:______ |----------|----------|----------|----------|----------|----------|1 2 3 4 5 6 7
Not At All Extremely Frequently
When initially given the task to pick a chocolate from the display, what did you think about the selection of chocolate?
Rating:______ |----------|----------|----------|----------|----------|----------|1 2 3 4 5 6 7
I had too few I had the right I had too many to choose from number of choices to choose from to choose from
I enjoy a task that involves coming up with solutions to problems.
Rating:______ |----------|----------|----------|----------|----------|----------|1 2 3 4 5 6 7
Strongly Disagree Strongly Agree
I would rather do something that requires a little thought than something that is sure to challenge my thinking abilities.
Rating:______ |----------|----------|----------|----------|----------|----------|1 2 3 4 5 6 7
Strongly Disagree Strongly Agree
Compared to other people, I would say that my knowledge of chocolates is:
Rating:______ |----------|----------|----------|----------|----------|----------|1 2 3 4 5 6 7
Significantly Less Significantly More Knowledge Than Others Knowledge Than Others

123
(NOTE: Only experiment 2 participants received the following questions)
As you were deciding which chocolate to select, how many chocolates did you consider other than the one you chose?
_____None
_____1
_____2
_____3
_____4
_____5
_____6 or more
Did you notice the Best Seller signs? ___Yes ___No
(If you answered No, then go to the next page)
How much did you rely on the Best Seller sign when making your decision?
Rating:______ |----------|----------|----------|----------|----------|----------|1 2 3 4 5 6 7
Not At All A Lot
How believable were the Best Seller signs?
Rating:______ |----------|----------|----------|----------|----------|----------|1 2 3 4 5 6 7
Not At All Believable Extremely Believable
How did the presence of the Best Seller signs affect your decision?
Rating:______ |----------|----------|----------|----------|----------|----------|1 2 3 4 5 6 7
Made it Easier Made it Harder
The Best Seller signs triggered a sense of resistance in me.
Rating:______ |----------|----------|----------|----------|----------|----------|1 2 3 4 5 6 7
Disagree completely Agree Completely

124
Appendix B: Essay 2, Experiment 1 Stimuli
Instructions
On the next page you will see a display of chocolates. We would like to know which of these chocolates you would consider buying. That is, we would like you to narrow down the display to a smaller group of chocolates that you would actually consider buying.
To thank you for participating, we will actually give you one of the chocolates that you choose later in the experiment, so keep that in mind when making your choices!
Now, there are two ways you may narrow down the display. You can use either method—it doesn’t matter to us. You can use:
Option (1): Exclusion Decide which chocolates you WOULD NOT consider and then CROSS-OUT these choices, or
Option (2): Inclusion Decide which chocolates you WOULD consider and then CIRCLE these choices.
After you look at the chocolates, you may then decide which way you will narrow down the display into a smaller group. You may CROSS-OUT the ones you do NOT like OR CIRCLE the ones you DO like —it’s up to you!

125
ExampleLet’s say there are 4 chocolates to choose from:
Of these 4 chocolates, let’s say you would consider buying only 2 of them (chocolates A and D). You would narrow the 4 chocolates down to 2 chocolates in ONE OF TWO METHODS:
I. If you chose Option (1) Exclusion you would CROSS OUT the chocolates that you DID NOT like:
II. If you chose Option (2) Inclusion you would CIRCLE the chocolates that you DID like:
You may now go to the real display of chocolates and decide which method you would use.
Chocolate A
Chocolate B
Chocolate C
Chocolate D
Chocolate A
Chocolate B
Chocolate C
Chocolate D
Chocolate A
Chocolate B
Chocolate C
Chocolate D

126
Please write the name of the chocolate you would like to receive.
_______________________________________________________________________
When you were trying to decide, how concerned were you that other choices might be better than the one you were considering?
Rating:______ |----------|----------|----------|----------|----------|----------|1 2 3 4 5 6 7
Not At All Concerned Extremely Concerned
When you were trying to decide, how concerned were you that you might regret your decision?
Rating:______ |----------|----------|----------|----------|----------|----------|1 2 3 4 5 6 7
Not At All Concerned Extremely Concerned
How confident are you about your choice of chocolate?
Rating:______ |----------|----------|----------|----------|----------|----------|1 2 3 4 5 6 7
Not At All Confident Extremely Confident
How difficult was it to make your decision of which chocolate to pick?
Rating:______ |----------|----------|----------|----------|----------|----------|1 2 3 4 5 6 7
Not At All Difficult Extremely Difficult
How complex did you find it to make your decision of which chocolate to pick?
Rating:______ |----------|----------|----------|----------|----------|----------|1 2 3 4 5 6 7
Not At All Complex Extremely Complex

127
How frustrated did you feel when making the choice of a chocolate?
Rating:______ |----------|----------|----------|----------|----------|----------|1 2 3 4 5 6 7
Not At All Frustrated Extremely Frustrated
How annoyed did you feel while you were making the choice of a chocolate?
Rating:______ |----------|----------|----------|----------|----------|----------|1 2 3 4 5 6 7
Not At All Annoyed Extremely Annoyed
How overwhelmed did you feel while making the choice of a chocolate?
Rating:______ |----------|----------|----------|----------|----------|----------|1 2 3 4 5 6 7
Not At All Overwhelmed Extremely Overwhelmed
How satisfied do you think you will be with the chocolate you chose?
Rating:______ |----------|----------|----------|----------|----------|----------|1 2 3 4 5 6 7
Not At All Satisfied Extremely Satisfied
How important is knowledge of chocolates in your life?
Rating:______ |----------|----------|----------|----------|----------|----------|1 2 3 4 5 6 7
Not At All Important Extremely Important
How interested are you in the subject of chocolates?
Rating:______ |----------|----------|----------|----------|----------|----------|1 2 3 4 5 6 7
Not At All Interested Extremely Interested
How often do you find yourself thinking about chocolates?
Rating:______ |----------|----------|----------|----------|----------|----------|1 2 3 4 5 6 7
Not At All Extremely Frequently

128
Appendix C: Essay 2, Experiments 2 and 3 Stimuli
Instructions
The next decision is to look at a set of backpacks and let us know which backpack you would EITHER INCLUDE OR EXCLUDE. You can use either strategy, but do NOT use both.
To thank you for participating, you will have a chance to win one of the backpacks that you choose later in the experiment, so keep that in mind when making your choices!
Please look at the set of chocolates and let us know which items you would EITHER INCLUDE OR EXCLUDE.
Remember, please write ALL your thoughts, including those dealing with the products as well as any other random thoughts you might have. For instance, we are interested in:
1) Which items you are considering or not considering2) Reasons why you are considering or not considering each item
(if you need more space, you may use the back of the sheet)When you are finished, please turn to the next page and wait for further instructions.

129
Part III
Please wait for further instructions. Do NOT proceed.
STOP!

130
Think back to when you were narrowing down the set of backpacks. Which attributes where important to you when narrowing down the set of backpacks? List them below:
Would you say that each attribute is positive or negative? Write either a positive (+) or a negative (-) sign next to each attribute that you just wrote down to indicate whether each attribute is positive or negative.
Please look back at the backpacks that you considered. If you had to choose ONE backpack right now, which backpack would you choose?
Write the name of the backpack you would like to receive:
___________________________________________________________
The following questions are about your choice of ONE backpack:
When you were trying to decide, how concerned were you that other choices on the list might be better than the one you were considering?
Rating:______ |----------|----------|----------|----------|----------|----------|1 2 3 4 5 6 7
Not At All Concerned Extremely Concerned
When you were trying to decide, how concerned were you that you might regret your decision?
Rating:______ |----------|----------|----------|----------|----------|----------|1 2 3 4 5 6 7
Not At All Concerned Extremely Concerned
How confident are you about your choice of backpack?
Rating:______ |----------|----------|----------|----------|----------|----------|1 2 3 4 5 6 7
Not At All Confident Extremely Confident
How difficult was it to make your decision of which backpack to pick?
Rating:______ |----------|----------|----------|----------|----------|----------|1 2 3 4 5 6 7
Not At All Difficult Extremely Difficult How complex did you find it to make your decision of which backpack to pick?

131
Rating:______ |----------|----------|----------|----------|----------|----------|1 2 3 4 5 6 7
Not At All Complex Extremely Complex
How frustrated did you feel when making the choice of a backpack?
Rating:______ |----------|----------|----------|----------|----------|----------|1 2 3 4 5 6 7
Not At All Frustrated Extremely Frustrated
How annoyed did you feel while you were making the choice of a backpack?
Rating:______ |----------|----------|----------|----------|----------|----------|1 2 3 4 5 6 7
Not At All Annoyed Extremely Annoyed
How overwhelmed did you feel while making the choice of a backpack?
Rating:______ |----------|----------|----------|----------|----------|----------|1 2 3 4 5 6 7
Not At All Overwhelmed Extremely Overwhelmed
How satisfied do you think you will be with the backpack you chose?
Rating:______ |----------|----------|----------|----------|----------|----------|1 2 3 4 5 6 7
Not At All Satisfied Extremely Satisfied
How many other backpacks (other than the one you chose) are you still thinking about right now?
______

132
Appendix D: Essay 2, Experiment 2 and 3 Cognitive Response Coding Methodology
MULTIPLIER RULE
Many participants answered the suggested response, “which ones you would consider,” separately. Each mention of stimuli constitutes a thought.
Ex. “I would consider backpacks #1,3,5,6”Ex. “I would consider backpack #1. I would consider backpack #3. I would consider backpack #5. I would consider backpack #6.”
Both examples constitute 4 thoughts, the former using a multiplier for consistency. All 4 are also considered to be positive thoughts. Conversely, an “I am not considering” comment would have yielded negative thoughts.
Additionally, many participants wrote short hand responses, grouping one particular attribute/thought to multiple stimuli:
Ex. “I like the color on #6, 9, 10 and 13”Ex. “Heart, crown, open oyster, milk choc truffle, all taste the best”
Both examples yield 4 thoughts and in both instances the multiplier was used.
CLAUSES AND PUNCTUATION
Independent clauses linked by a subordinating conjunction (e.g. and, because) are counted as separate thoughts.
There is a caveat to this in the event that the chocolate/backpack consideration is mentioned:
Ex. “Considering #2 because it has the cool zipper.”
This would constitute two thoughts; it mentions which one they are considering. It would also be considered two thoughts if the subject had written “I am considering #2. It has the cool zipper.”
There are many instances where there is one sentence and no subordinating conjunction, but they are counted as multiple thoughts:
Ex. “I like the color, size, and shape of backpack #3”
Three different attributes, three thoughts. This is compensating for shorthand and considered the same as if subject had written “I like the color. I like the size. I like the shape.”
133
NEUTRAL COMMENTS
Thoughts were counted as negative or positive as much as possible. Some thoughts requiredmore interpretation of previous context compared to others (i.e. coders looked at a previous thought as a clue as to whether an afterthought is positive or negative).
In instances where thoughts could not be designated as negative or positive (even after looking at context in which thought was stated), the thought was coded as neutral:
Ex. “I like ivory Demitassee, I don’t even know what that means”
In this instance there are two thoughts: The first positive, the second neutral (not necessarily negative or positive). Note: if Demitasse were in the consideration set, both thoughts—positive and neutral—would be counted as “thoughts in the consideration set.”
A thought is also considered neutral when the thought is not associated with any particular chocolate or backpack:
Ex. “Now I’m hungry for chocolate”Ex. “I haven’t been to the dentist in a long time”
DETERMINING REFERENCES TO NUMEROUS CHOCOLATES
When the backpack or chocolate thoughts cannot be linked to a given chocolate or backpack, they were not tallied as neither “thoughts in consideration set” nor “thoughts not in consideration set:”
Ex. “I like the green backpacks”Ex. “I don’t like truffles”
In the first example, it is impossible to determine which backpack the participant is referencing.Thus, it was not counted as a thought about an alternative in or not in the consideration set.
The second example poses a similar problem. There are multiple truffles and we cannot determine which one the participant was referencing; thus, it is also not counted.
Sometimes, however, the participant will be commenting on the backpacks in the order they are presented on the stimulus sheet, though the subject does not explicitly give the backpack number or chocolate name. In such instances, the thoughts can be linked to a given backpack or chocolate and are counted.
Additionally, there may be a feature exclusive to the chocolate/backpack that helps to identify it:
Ex. “Orange looks like it tastes good.”
There is only one orange chocolate (Mandarin Orange Truffle), so it is clear that they are referring to that alternative.

134
EQUIVOCATING THOUGHTS
Some participants equivocated. In this instance, each thought still acts independently, though they may come to a specific conclusion that is positive or negative:
Ex. “I like raspberry, but I don’t like truffles, so I wouldn’t choose the raspberry truffle.”
This would constitute 3 thoughts (the first positive, the second negative, the third negative).
EXPLANATORY THOUGHTS
Explanations that identify an attribute and clarify with a thought did not count as additional thoughts.
Ex. “The backpack is green, which is something that I like in a backpack.”Ex. “The backpack is blue. I like that.”
Both examples are counted as one positive thought.

135
Bibliography
Allenby, Greg M. and James L. Ginter (1995), “The Effects of In-store Displays and Feature
Advertising on Consideration Sets,” International Journal of Research in Marketing, 12
(May), 67-80.
Anderson, Christopher J. (2003), “The Psychology of Doing Nothing: Forms of Decision
Avoidance Result From Reason and Emotion,” Psychological Bulletin, 129 (1), 139-167.
Arnold, Stephen J., Tae H. Oum and Douglas J. Tigert (1983), “Determining Attributes in Retail
Patronage: Seasonal, Temporal, Regional, and International Comparisons,” Journal of
Marketing Research, 20 (May), 149-157.
Baron, Reuben, and David Kenny (1986), “The Moderator-Mediator Variable Distinction in
Social Psychological Research: Conceptual, Strategic, and Statistical Considerations,”
Journal of Personality and Social Psychology, 51, 1173-1182.
Baumol, William J., and Edward A. Ide (1956), “Variety in Retailing,” Management Science, 3
(1), 93-101.
Beach, Lee Roy (1993), “Broadening the Definition of Decision Making: The Role of Prechoice
Screening of Options,” Psychological Science, 4 (July), 215-220.

136
----- and Eric Strom, (1989), “A Toadstool Among the Mushrooms: Screening Decisions and
Image Theory's Compatibility Test,” Acta Psycholgica, 72 (September), 1-12.
Bettman, James R. (1979), An Information Processing Theory of Consumer Choice, Reading,
MA: Addison-Wesley.
-----, Mary Frances Luce & John W. Payne (1998), “Constructive Consumer Choice Processes,”
Journal of Consumer Research, 25 (December), 187-217.
Boatwright, Peter and Joseph C. Nunes (2001), “Reducing Assortment: An Attribute-Based
Approach,” Journal of Marketing, 65 (July), 50-63.
Boatwright, Peter and Joseph C. Nunes (2004), “Correction Note for ‘Reducing Assortment: An
Attribute-Based Approach,’” Journal of Marketing, 68 (July).
Borle, Shared, Peter Boatwright, Joseph B. Kadane, Joseph C. Nunes, and Galit Shmueli (2004),
“The Effect of Product Assortment Changes on Customer Retention,” Marketing Science,
24 (Fall), 616-622.
Bown, Nicola J., Daniel Read, and Barbara Summers (2003), “The Lure of Choice,” Journal of
Behavioral Decision Making, 16 (October), 297-308.

137
Briesch, Richard A. Pradeep K. Chintagunta, Edward J. Fox (2006), “Assortment, Price, and
Convenience: Modeling the Determinants of Grocery Store Choice,” working paper,
Edwin L. Cox School of Business, Southern Methodist University.
Broniarczyk, Susan M., Wayne D. Hoyer, and Leigh McAlister (1998), “Consumers' Perceptions
of the Assortment Offered in a Grocery Category: The Impact of Item Reduction,”
Journal of Marketing Research, 35 (May), 166-176.
----- (2006) “Product Assortment,” in Handbook of Consumer Psychology, forthcoming..
Carmon, Ziv, Klaus Wertenbroch and Marcel Zeelenberg (2003), “Option Attachment: When
Deliberating Makes Choosing Feel Like Losing,” Journal of Consumer Research, 30
(June), 15-29.
Chakravarti, Amitav, Ayelet Fishbach, Chris Janiszewski, and Gülden Ülkümen (2007), “The
Licensing Effect of Two-Stage Decisions on Choices between Virtues and Vices,”
presented at the Society for Consumer Psychology Conference, Las Vegas, NV.
-----, Chris Janiszewski (2003), “The Influence of Macro-Level Motives on Consideration Set
Composition in Novel Purchase Situations,” Journal of Consumer Research, 30
(September), 244-258.
-----, Chris Janiszewski, and Gülden Ülkümen (2006), “The Neglect of Prescreening
Information,” Journal of Marketing Research, 43 (November), 642-653.

138
Chernev, Alexander (2003a), “"Product Assortment and Individual Decision Processes," Journal
of Personality and Social Psychology, 85 (July), 151-162.
------ (2003b), “When More is Less and Less is More: The Role of Ideal Point Availability and
Assortment in Consumer Choice,” Journal of Consumer Research, 30 (September), 170-
183.
------ (2006), “Decision Focus and Consumer Choice among Assortments,” Journal of
Consumer Research, 33 (June), 50-59.
Desai, Kalpesh Kaushik and Wayne D. Hoyer (2000), “Descriptive Characteristics of Memory-
Based Consideration Sets: Influence of Usage Occasion Frequency and Usage Location
Familiarity,” Journal of Consumer Research, 27 (December), 309-323.
Dhar, Sanjay K., Stephen J. Hoch, and Nanda Kumar (2001), “Affective Category Management
Depends on the Role of the Category,” Journal of Retailing, 77 (Summer), 165-184.
------, and Stephen J. Sherman (1996), The Effect of Common and Unique Features in Consumer
Choice,” Journal of Consumer Research, 23 (December), 193-203.
Diehl, Kristin (2005), “When Two Rights Make A Wrong: Searching Too Much in Ordered
Environments,” Journal of Marketing Research, 42 (August), 313-322.
Fitzsimons, Gavan J. and Donald R. Lehmann (2004), “Reactance to Recommendations: When
Unsolicited Advice Yields Contrary Responses,” Marketing Science 23 (Winter), 82–94.

139
Ganzach, Yoav (1995), “Attribute Scatter and Decision Outcome: Judgment versus Choice,”
Organizational Behavior and Human Decision Processes, 62 (April) 113-122.
------, and Yaacov Schul (1995), “The influence of quantity of information and goal framing on
decision,” Acta Psychologica, 89 (June), 23-36.
Gershoff, Andrew, Susan Broniarczyk, and Patricia M. West (2001), “Recommendation or
Evaluation? Task Sensitivity in Information Source Selection,” Journal of Consumer
Research, 28 (December), 418-438.
Glazer, Rashi, Barbara E. Kahn, and William L. Moore (1991), “The Influence of External
Constraints on Brand Choice: The Lone-Alternative Effect,” Journal of Consumer
Research, 18 (June), 119-127.
Godek, John, J. Frank Yates and Seigyoung Auh (2001), “Evaluation of Customized Products:
The Effects of Assortment and Control,” working paper, Stephen M. Ross School of
Business, University of Michigan.
Gilbride, Timothy J. and Greg M. Allenby (2004) “A Choice Model with Conjunctive,
Disjunctive, and Compensatory Screening Rules,” Marketing Science, 23 (Summer), 391-
406.
Guadagni, Peter M. and John D.C. Little (1983), “A Logit Model of Brand Choice Calibrated on
Scanner Data,” Marketing Science, 2 (Summer), 203-238.

140
Häubl, Gerald and Valerie Trifts (2000), “Consumer Decision Making in Online Shopping
Environments: The Effects of Interactive Decision Aids,” Marketing Science, 19
(Winter), 1-21.
Hauser, John R. (1978), “Testing the Accuracy, Usefulness and Significance of Probabilistic
Models: An Information Theoretic Approach,” Operations Research, 26 (May-June),
406-421.
------ and Birger Wernerfelt. (1990), “An Evaluation Cost Model of Evoked Sets,” Journal of
Consumer Research, 16 (November), 393-408.
Hawkins, Del I., Roer J. Best, and Kenneth A. Coney (2004), Consumer Behavior: Building
Marketing Strategy, 9th ed., New York: McGraw-Hill/Irwin.
Heide, Jan B. and Allen M. Weiss (1995), “Vendor Consideration and Switching Behavior for
Buyers in High Technology Markets,” Journal of Marketing, 59 (July), 30-43.
Heller, Daniel, Irwin P. Levin, and Martin Goransson (2002), “Selection of Strategies for
Narrowing Choice Options: Antecedents and Consequences,” Organizational Behavior
and Human Decision Processes, 89, 1194-1213.
; Hoch, Stephen J.; Bradlow, Eric T.; Wansink, Brian (1998), “The Variety of an Assortment,”
Marketing Science, 18 (4), 527-546

141
Howard, John A.; Jagdish N. Sheth (1969), The Theory of Buyer Behavior, New York : John
Wiley & Sons.
Hoyer, Wayne D. and Deborah J. MacInnis (2001), Consumer Behavior, 2nd ed., Boston:
Houghton Mifflin Company.
Huber, Joel, John W. Payne, and Christopher P. Puto (1982), "Adding Asymmetrically
Dominated Alternatives: Violations of Regularity and the Similarity Hypothesis,"
Journal of Consumer Research, 9 (June), 90-98.
Huffman, Cynthia and Barbara E. Kahn (1998), “Variety for Sale: Mass Customization or Mass
Confusion,” Journal of Retailing, 74 (Winter), 491-513.
Inman, J. Jeffrey, Leigh McAlister, and Wayne D. Hoyer (1990), “Promotion Signal: Proxy for a
Price Cut?”, Journal of Consumer Research, 17 (June), 74-81.
------, and Russell S. Winer (1998), “Where the Rubber Meets the Road: A model of In-Store
Consumer Decision-Making,” Marketing Science Institute Report 98-122.
------ and Marcel Zeelenberg (2002), “Regret Repeat Versus Switch Decisions: The Attenuation
Role of Decision Justifiability,” Journal of Consumer Research, 29 (June), 116-128.

142
Irwin, Julie R. and Rebecca W. Naylor (2006), “Indirect Immorality and the Ethical Action
Heuristic: Differential Weighting of Ethical Attributes in Consideration Sets Formed by
Excluding versus Including Product Alternatives,” working paper, McCombs School of
Business, The University of Texas at Austin.
Iyengar, Sheena S. and Mark Lepper (2000), “When Choice is Demotivating: Can One Desire
Too Much of a Good Thing?” Journal of Personality and Social Psychology, 79, 995-
1006.
------, Rachael E. Wells, and Barry Schwartz (2006), “Doing Better but Feeling Worse: Looking
for the ‘Best’ Job Undermines Satisfaction,” Psychological Science, 17 (2), 143-150.
Kahn, Barbara E. and Donald R. Lehmann (1991), “Modeling Choice Among Assortments,”
Journal of Retailing, 67 (Fall), 274-299.
Kahneman, Daniel and Dale Miller (1986), “Norm Theory: Comparing Reality to Its
Alternatives,” Psychological Review, 93, 136-153.
Lehmann, Donald R. (1998), “Customer Reactions to Variety: Too Much of a Good Thing?”
Journal of the Academy of Marketing Science, 26 (Winter), 62-65.
------, and Yigang Pan (1994), "Context Effects, New Brand Entry, and Consideration Sets,"
Journal of Marketing Research, 31 (August), 364-74.

143
Levin, Irwin P., Mary E. Huneke, and J. D. Jasper (2000), “Information Processing at Successive
Stages of Decision Making: Need for Cognition and Inclusion-Exclusion Effects,”
Organizational Behavior and Human Decision Processes, 82 (July), 171-193.
------, J. D. Jasper, and Wendy S. Forbes (1998), “Choosing Versus Rejecting Options at
Different Stages of Decision Making,” Journal of Behavioral Decision Making, 11
(October), 193-210.
------, Caryn M. Prosansky, and Daniel M. Brunick (2001), “Prescreening of Choice Options in
'Positive' and 'Negative' Decision-making Tasks,” Journal of Behavioral Decision
Making, 14 (October), 279-93.
Luce, Mary Frances (1998), “Choosing to Avoid: Coping with Negatively Emotion-Laden
Consumer Decisions,” Journal of Consumer Research, 24 (March), 409-433.
Lussier, Denis A. and Richard W. Olshavsky (1979), “Task Complexity and Contingent
Processing on Brand Choice,” Journal of Consumer Research, 6 (September), 154-165.
Maholtra, Naresh K. (1982), “Information Load and Consumer Decision Making,” Journal of
Consumer Research, 8 (March), 419-430.
McAlister, Leigh (1982), “A Dynamic Attribute Satiation Model of Variety-Seeking Behavior,”
Journal of Consumer Research, 9 (September), 141–151.
144
Meloy, Margaret G. and J. Edward Russo (2004), “Binary Choice under Instructions to Select
versus Reject,” Organizational Behavior and Human Decision Processes, 93, 114-128.
Mitra, Anustee (1995), “Advertising and the Stability of Consideration Sets Over Multiple
Purchase Occasions,” International Journal of Research in Marketing, 12 (May), 81-94.
------, and John Lynch (1995), “Toward a Reconciliation of Market Power and Information
Theories of Advertising Effects on Price Elasticity,” Journal of Consumer Research, 21
(March), 644-59.
Muller, Dominique, Charles M. Judd, and Vincent Y. Yzerbyt (2005), “When Moderation is
Mediated and Mediation is Moderated,” Journal of Personality and Social Psychology,
89 (December), 852-863.
Narayana, Chem L. and Rom J. Markin (1975), “Consumer Behavior and Product Performance:
An Alternative Conceptualization,” Journal of Marketing, 39 (October), 1-6.
Nedungadi, Prakash (1990), “Recall and Consumer Consideration Sets: Influencing Choice
Without Altering Brand Evaluations,” Journal of Consumer Research, 17 (3), 245-253.
Ordóñez, Lisa D. Lehman Benson, III, and Lee Roy Beach (1999), “Testing the Compatibility
Test: How Instructions, Accountability, and Anticipated Regret Affect Prechoice
Screening of Options,” Organizational Behavior and Human Decision Processes, 78
(April), 63-80.

145
Paulssen, Marcel and Richard P. Bagozzi (2005), “A Self-Regulatory Model of Consideration
Set Formation,” Psychology & Marketing, 22 (October), 785-812.
Payne, John W. (1976), “Task Complexity and Contingent Processing in Decision Making: An
Information Search and Protocol Analysis,” Organization Behavior & Human
Performance, 16 (August), 366-87.
------, James Bettman, and Eric J. Johnson (1993), The Adaptive Decision Maker, Cambridge,
England: Cambridge University Press.
Peter, J. Paul and Jerry C. Olson (2005), Consumer Behavior and Marketing Strategy, 7th ed.,
New York: McGraw-Hill/Irwin.
Prelec, Drazen, Birger Wernerfelt, and Florian Zettelmeyer (1997), “The Role of Inference in
Context Effects: Inferring What You Want from What is Available,” Journal of
Consumer Research, 24 (June), 118-125.
Rao, Akshay R. and Kent B. Monroe (1989), “The Effect of Price, Brand Name, and Store Name
on Buyers' Perceptions of Product Quality: An Integrative Review,” Journal of
Marketing Research, 26 (August), 351-257.

146
Ratneshwar, S., Cornelia Pechmann, Allan D. Shocker (1996), “Goal-derived Categories and the
Antecedents of Across-category Consideration,” Journal of Consumer Research, 23
(December), 240-250.
Roberts, John H. and James M. Lattin (1991), “Development and Testing of a Model of
Consideration Set Composition,” Journal of Marketing Research, 28 (November), 429-
40.
------ and James M. Lattin (1997), “Consideration: Review of Research and Prospects for Future
Insights,” Journal of Marketing Research, 34 (August), 406-410.
Rosenthal, Robert, Ralph L. Rosnow, and Donald B. Rubin (2000), Contrasts and Effect Sizes in
Behavioral Research: A Correlational Approach, New York: Cambridge University
Press.
Schwartz, Barry (2004), The Paradox of Choice, New York: Harper Collins.
------, Andrew Ward, John Monterosso, Sonja Lyubomirsky, Katherine White, Darrin Lehman
(2002), “Maximizing versus Satisficing: Happiness is a Matter of Choice,” Journal of
Personality and Social Psychology, 83 (November), 1178-1197.
Shafir, Eldar (1993), “Choosing Versus Rejecting: Why Some Options are Both Better and
Worse than Others,” Memory and Cognition, 21 (July), 546-556.

147
------ Itamar Simonson, and Amos Tversky (1993), “Reason-Based Choice,” Cognition, 49
(October-November) 11-36.
Shocker, Allan D., Moshe Ben-Akiva, Bruno Boccara, and Prakash Nedungadi (1991)
“Consideration Set Influences on Consumer Decision-Making and Choice: Issues,
Models, and Suggestions,” Marketing Letters, 2 (3), 181-197.
Shugan, Steven M. (1980), “The Cost of Thinking,” Journal of Consumer Research, 7 2 (Sept-
ember), 99-111.
Simonson, Itamar (1989), "Choice Based on Reasons: The Case of Attraction and Compromise
Effects," Journal of Consumer Research, 16 (2), 158-74.
------, Stephen Nowlis, and Katherine Lemon (1993), "The Effect of Local Consideration Sets on
Global Choice Between Lower Price and Higher Quality," Marketing Science, 12, 357-
77.
Smith, N. Kyle, Jeff T. Larsen, Tanya L. Chartrand, John T. Cacioppo, Heather A. Katafiasz,
Kathleen E. Moran (2006), “Being Bad Isn't Always Good: Affective Context Moderates
the Attention Bias Toward Negative Information,” Journal of Personality and Social
Psychology, 90 (February), 210-220.

148
Sobel, Michael E. (1982), “Asymptotic Confidence Intervals for Indirect Effects in Structural
Equation Models,” in Sociological Methodology, ed. S. Leinhardt, Washington DC:
American Sociological Association, 290-312.
Tversky, Amos (1972), “Elimination by Aspects: A Theory of Choice,” Psychological Rewiew,
79, 281-299.
van Zee, Emily H., Thaddeus F. Paluchowski, and Lee Roy Beach (1992), “The Effects of
Screening and Task Partitioning upon Evaluations of Decision Options,” Journal of
Behavioral Decision Making, 5 (Jan-Mar), 1-19.
Wedell, Douglas H. (1997), “Another Look at Reasons for Choosing and Rejecting,” Memory &
Cognition, 25 (6), 873-887.
West, Patricia M. and Susan M. Broniarczyk (1998), “Integrating Multiple Opinions: The Role
of Aspiration Level on Consumer Response to Critic Consensus,” Journal of Consumer
Research, 25 (June), 38–51.
Wright, Peter, and Frederick Barbour (1977), “Phased Decision Strategies: Sequels to Initial
Screening,” in Martin Starr and Milan Zeleny (es.), Multiple Criteria Decision Making,
North Holland TIMS Studies in Management Science, Amsterdam: North Holland, 91-
109.

149
Wilson, Timothy D., Douglas J. Lisle, Jonathan W. Schooler, Sara D. Hodges, Kristen J.
Klaaren, and Suzanne J. LaFleur (1993), “Introspecting About Reasons Can Reduce Post-
Choice Satisfaction,” Personality and Social Psychology Bulletin, 19 (3), 331-339.
Yaniv, Ilan and Yaacov Schul (2000), “Acceptance and elimination Procedures in Choice: Non-
complementarity and the Role of Implied Status Quo,” Organizational Behavior and
Human Decision Processes, 82, 293-313.
------ and Yaacov Schul, Ronna Raphaelli-Hirsch, and Ifat Maoz (2001), “Inclusive and
Exclusive Modes of Thinking: Studies of Prediction, Preferences, and Social Perception
During Parliamentary Elections,” Journal of Experimental Social Psychology, 38, 352-
367.
Yee, Michael, Ely Dahan, John R. Hauser, and James Orlin (2006), “Greedoid-Based
Noncompensatory Inference,” Marketing Science, forthcoming.
Ying, Yuanping, Fred Feinberg, and Michel Wedel (2006), “Leveraging Missing Ratings to
Improve Online Recommendation Systems,” Journal of Marketing Research, 43
(August), 355-365.
Yordanova, Gergana, Maureen Morrin, Barry Schwartz, Andrew Ward, John Hulland (2007),
“Re-Examination of Maximization: Factor Structure, Reliability and Validity Studies and
Derivation of a Short Form,” working paper, Boston College Carroll School of
Management.

150
Zaichkowsky, Judith Lynne (1985), "Measuring the Involvement Construct," Journal of
Consumer Research, 12 (December), 341-352.

151
Vita
Joseph Kozak Goodman was born in Lincoln, Nebraska on November 23, 1978 early in
the morning. He is the son of Andrew Eliot Goodman, son of Joseph and Ruth Goodman of
Lincoln, Nebraska, and Dorothy Kozak Goodman, daughter of Joseph and Dorothy Kozak of
Wilkes-Barre, Pennsylvania. After his Bar Mitzvah in Des Moines, Iowa in 1991, and attending
Camp Ramah in Wisconsin he graduated from Valley High School in West Des Moines, Iowa
with Daniel C. Wolf, Benjamin (BJ) Hockenberg, and Andrew T. Sherman at the ripe age of 18.
He attended The University of Texas at Austin with David Lazaroff, H. Mathew Linderman,
David Cohen, his sister Liz, a few Sammies, and about 50,000 other students. He graduated from
the Business Honors Program with a Bachelor in Business Administration in 2001. He worked as
a research assistant for Leigh McAlister and Julie R. Irwin before officially entering the Ph.D.
program in marketing in the McCombs School of Business at The University of Texas at Austin.
In 2006, while a Ph.D. student at UT, he taught a Principles of Marketing and published his first
work with coauthor Julie R. Irwin in Organizational Behavior and Human Decision Processes
entitled, “Special Random Numbers: Beyond the Illusion Control.”
Joe will be joining the faculty of the Moore School of Business at the University of South
Carolina as an assistant professor of marketing in the fall of 2007.
Permanent address: 505 W. 7th St.
Apt. 203
Austin, TX 78701
This dissertation was typed by the author.