copyright 2019, jessica mehta
TRANSCRIPT

An Examination of Juvenile Northern Bobwhite Survival and Movement Patterns in
Late Summer and Early Fall on the Rolling Plains of Texas
by
Jessica Ann Mehta, B.S.
A Thesis
In
Wildlife, Aquatic, and Wildlands Science and Management
Submitted to the Graduate Faculty
of Texas Tech University in
Partial Fulfillment of
the Requirements for
the Degree of
MASTER OF SCIENCES
Approved
Dr. Brad Dabbert
Chair of Committee
Dr. Clint Boal
Dr. Kevin Mulligan
Mark Sheridan
Dean of the Graduate School
May, 2019

Copyright 2019, Jessica Mehta

Texas Tech University, Jessica Mehta, May 2019
ii
ACKNOWLEDGMENTS
This research would not have been possible without the help of many amazing
and hard-working people. To my advisor, Dr. Brad Dabbert: thank you for taking me
on as a graduate student with the Quail-Tech Alliance, as well as for your guidance
and never-ending patience with me as I learned the ropes of being a graduate student.
I would like to thank my committee members, Dr. Clint Boal and Dr. Kevin Mulligan,
for their guidance during my thesis writing process.
I would like to thank all the people from the Quail-Tech Alliance for assisting
me in my research, especially Matthew McEwen, Rowdy White, and Byron Buckley
for always being there for me- on my best days and my worst. To Dr. Daniel Greene,
Dr. Blake Grisham, Natasia Mitchell, and Shea Mullican: this thesis would not have
been possible without you all. Most of all, I would like to thank my family, especially
my parents, and my dear friends who always gave me support to infinity and beyond
during the last three years.
Thank you to the landowners of the Quail-Tech Alliance Anchor Ranches for
participating in my study. Thank you to the Burnett Foundation and Quail First for
providing the funding for this research.
Texas Tech University, Jessica Mehta, May 2019
iii
TABLE OF CONTENTS
ACKNOWLEDGMENTS ...................................................................................... ii
ABSTRACT ........................................................................................................... iv
LIST OF TABLES .................................................................................................. v
I. ECOLOGY AND HISTORY OF NORTHERN BOBWHITES ON THE
ROLLING PLAINS OF TEXAS ........................................................................... 1
Ecology ................................................................................................................... 1
History to Present .................................................................................................... 5
Literature Cited ..................................................................................................... 10
II. SURVIVAL AND HOME RANGE ESTIMATES OF JUVENILE ...................
NORTHERN BOBWHITE ON THE ROLLING PLAINS OF TEXAS .............. 14
Introduction ........................................................................................................... 14
Methods ................................................................................................................. 17
Study Area ................................................................................................. 17
Field Methods ........................................................................................... 18
Analysis ..................................................................................................... 21
Survival Analysis ............................................................................ 21
Home Range .................................................................................... 22
Results ................................................................................................................... 23
Survival Analysis ...................................................................................... 23
Home Range .............................................................................................. 26
Discussion ............................................................................................................. 26
Literature Cited ..................................................................................................... 34

Texas Tech University, Jessica Mehta, May 2019
iv
ABSTRACT
The Rolling Plains of Texas have long been known for its diverse abundance
of wildlife, which include northern bobwhite. Landowners and wildlife managers
commonly report observing significant northern bobwhite numbers present in August
and September but observe an apparent decrease in quail numbers by November.
While many survival studies have been conducted on northern bobwhite in the past,
however, there is a dearth of information available regarding survival or home range
of the juvenile age class during late summer and early fall months.
I conducted a telemetry study from July-December during 2016 and 2017 to
analyze survival and home range of juvenile Northern bobwhite on the Rolling Plains
of Texas. My goal was to provide a possible explanation for the perceived
disappearance of Northern bobwhite observed by landowners. I used Program MARK
to generate survival estimates, and I found that weekly survival was 0.97 in 2016 and
0.91 in 2017. I used ArcMap 10.5 to analyze home ranges, and I found that home
ranges in 2016 across my study sites were larger than home ranges in 2017.
Ultimately, I concluded that while juvenile northern bobwhite survival and home
range are influenced by a variety of factors, rainfall is the most important factor
driving juvenile northern bobwhite demographics.

Texas Tech University, Jessica Mehta, May 2019
v
LIST OF TABLES
2.1 List of individual covariates classified by study site used in
Program MARK analysis for 2016 survival estimates. Each
study site had a total of 18 covariates. All covarites were named
using the concatenate function in Microsoft Excel, where
month, temperature, precipitation, and name of ranch are
abbreviated. ............................................................................................... 38
2.2 List of individual covariates classified by study site used in
Program MARK analysis for 2017 survival estimates. Each
study site had a total of 18 covariates. All covarites were named
using the concatenate function in Microsoft Excel, where
month, temperature, precipitation, and name of ranch are
abbreviated. ............................................................................................... 39
2.3 Statistics for tagged birds by study site on the Rolling Plains of
Texas in 2016. Statistics include the totals for birds alive at the
end of the study, birds that died during the study, birds that
were censored from the study, and birds captured per study site .............. 40
2.4 Statistics for tagged birds by study site on the Rolling Plains of
Texas in 2017. Statistics include the totals for birds alive at the
end of the study, birds that died during the study, birds that
were censored from the study, and birds captured per study site .............. 40
2.5 Survival models and corresponding results generated by
Program MARK ........................................................................................ 41
2.6 Beta estimates for the Year survival model. Each parameter is
listed with its corresponding beta estimate, standard error, and
95% confidence intervals .......................................................................... 42
2.7 Beta estimates for the 2016 October Rainfall by Ranch model.
Each parameter is listed with its corresponding beta estimate,
standard error, 95% confidence intervals, and logistic regression
equation ..................................................................................................... 43
2.8 Beta estimates for the 2016 September Rainfall by Ranch
model. Each parameter is listed with its corresponding beta
estimate, standard error, 95% confidence intervals, and logistic
regression equation.................................................................................... 44
2.9 Beta estimates for the 2016 December Rainfall by Ranch
model. Each parameter is listed with its corresponding beta
estimate, standard error, 95% confidence intervals, and logistic
regression equation.................................................................................... 45

Texas Tech University, Jessica Mehta, May 2019
vi
2.10 Beta estimates for the 2016 August Rainfall by Ranch model.
Each parameter is listed with its corresponding beta estimate,
standard error, 95% confidence intervals, and logistic regression
equation ..................................................................................................... 46
2.11 Beta estimates for the 2016 June Rainfall by Ranch model. Each
parameter is listed with its corresponding beta estimate,
standard error, 95% intervals, and logistic regression equation................ 47
2.12 Minimum, maximum, and average home range sizes for
radiotagged birds from 2016-2017 by study site. Home range
values are measured in hectares. ............................................................... 48
2.13 Comparison of average adult and juvenile home ranges on the
Indian Canyon ranch on the Rolling Plains in 2017. Home
range values are measured in hectares ...................................................... 48
2.14 Weekly survival estimates generated by Program MARK for the
Year model. Each parameter is listed with its corresponding
beta estimate, standard error, and 95% confidence intervals .................... 49
2.15 Weekly survival estimates generated by Program MARK for the
5 competing models. Each estimate is listed with its
corresponding 95% confidence intervals .................................................. 49

Texas Tech University, Jessica Mehta, May 2019
1
CHAPTER I
ECOLOGY AND HISTORY OF NORTHEN BOBWHITES ON THE ROLLING
PLAINS
ECOLOGY
The Rolling Plains of Texas is bordered by the Edwards Plateau ecoregion in the
south, the High Plains ecoregion in the west, and the Cross Timbers and Prairies
ecoregion in the east (Rollins 2007, Texas Parks and Wildlife Department 2019).
Precipitation for this ecoregion averages about 40-75 centimeters annually, with the
heaviest precipitation levels occurring in spring and summer. Temperatures in this
ecoregion often fluctuate between extremes, with blistering summers and mild to frigid
winters (Rollins 2007). Fine sand, clay, and loamy soils have given rise to a landscape
covered by rangelands and croplands (Rollins 2007, Texas Parks and Wildlife
Department 2019).
Mesquite (Prosopsis glandulosa) is the dominant plant across the Rolling Plains,
alongside junipers (primarily Juniperus pinchotii) and prickly pear (Opuntia spp.)
(Rollins 2007). The Rolling Plains is also home to various woody plants and grasses,
including lotebush (Ziziphus Obtusifolia), sand shinnery oak (Quercus havardii), catclaw
(Acacia spp.), netleaf hackberry (Celtis reticulatus), buffalograss (Buchloe dactyloides),
sideoats gramma (Bouteloua curtipendula), and silver bluestem (Bothricola
saccharoides) (Rollins 2007).
Among the four species of quail that inhabit Texas, northern bobwhites (Colinus
virginanus) are by far the most familiar to landowners and residents across the Rolling
Plains, along with scaled quail (Calipepla squamata) (Brennan et al. 2005). Northern
bobwhites are most often associated with the “ah, bob-white” call made by males during

Texas Tech University, Jessica Mehta, May 2019
2
the breeding season and occur statewide, with populations present across all 10
ecoregions of Texas (Gould 1975b, Hernàndez and Peterson 2007, Agrilife Extension
Wildlife and Fisheries 2019).
A small galliform bird averaging 20.3 to 24.7 centimeters in length and weighing
between 140-190 grams, northern bobwhites have a physical structure built for short,
rapid bursts of flight (Chumchal 2000, Cornell Lab of Ornithology 2017, Agrilife
Extension Wildlife and Fisheries 2019). Their bodies are short and rounded, with a
wingspan ranging from 9 to 12 centimeters (Chumchal 2000, Hernàndez and Peterson
2007, Agrilife Extension Wildlife and Fisheries 2019).
Northern bobwhites have an overall mottled appearance, exhibiting a color pattern
of rufous, white, and black (Cornell Lab of Ornithology 2017, Agrilife Extension
Wildlife and Fisheries 2019). Males are the more colorful sex and are easily
distinguishable from females by their bright facial patterning, with a vivid black-and-
white striped face and a white throat. Females have a more subtle appearance, with a
buff-colored throat and eye stripe (Chumchal 2000, Cornell Lab of Ornithology 2017,
Agrilife Extension Wildlife and Fisheries 2019). Both males and females have a tufted
crest on the crown of their heads, which is used for various purposes, including attracting
a mate and displaying dominance (Agrilife Extension Wildlife and Fisheries 2019).
Habitat is a driving force for northern bobwhite populations, with numbers often
fluctuating due to habitat quality, habitat accessibility, and availability of sufficient food
and nesting resources (Rollins 2007, Mississippi State University 2019). On the Rolling
Plains, quail habitat is primarily influenced by rainfall and rangeland management
(Jackson 1962, Rollins 2007). Northern bobwhite habitat is mostly comprised of patchy

Texas Tech University, Jessica Mehta, May 2019
3
areas that are a mosaic of woody edges, grasslands, shrublands, herbaceous cover, and
areas of bare ground (Roseberry and Sudkamp 1998, Rollins 2007, Cornell Lab of
Ornithology 2017, Agrilife Extension Wildlife and Fisheries 2019).
Northern bobwhites require five types of cover in order to survive and reproduce
successfully: nesting cover, loafing cover, escape cover, roosting cover, and brooding
cover (Rollins 2007). Breeding occurs during the months of February-October, with
clutch sizes consisting of 12-14 eggs per nest (Chumchal 2000, Hernàndez and Peterson
2007, Cornell Lab of Ornithology 2017, Agrilife Extension of Wildlife and Fisheries
2019). Nesting cover is the most important habitat requirement for northern bobwhite
and consists of a small bowl-shaped depression surrounded by bunchgrasses positioned in
a circle approximately 12 inches wide and 12 inches tall (Rollins 2007). The most
common bunchgrass used by northern bobwhite for nesting is little bluestem
(Schizachyrium scoparium) (Hernàndez 1999, Townsend et al. 2001, Rollins 2007).
Loafing cover contains dense vegetation approximately 1-3 meters high and
provides protection from avian predators while simultaneously permitting quail clear
visibility at ground level (Rollins 2007). Acceptable loafing cover for northern
bobwhites include lotebush, elbowbush (Forestieria pubescens), and fourwing saltbush
(Atriplex canescens) (Rollins 2007). Escape cover consists of mostly dense, usually
prickly brush that allows quail to escape and hide from predators (Rollins 2007). Some
forms of escape cover used by Northern bobwhites on the Rolling Plains include
mesquite, prickly pear, and various bunchgrasses (Rollins 2007).
Roosting cover, unlike the other types of cover, requires little to no overhead
vegetation (Virginia Department of Game and Inland Fisheries 2019). When roosting

Texas Tech University, Jessica Mehta, May 2019
4
during the evening, quail sit in a circle in a relatively open area in order to a) retain good
visibility and watch for predators and b) flush quickly if a predator is spotted (Virginia
Department of Game and Inland Fisheries 2019).
Brooding cover is a primary concern for quail chicks, particularly during the
initiation of the breeding season in February-March (Hernàndez and Peterson 2007,
Rollins 2007, Agrilife Extension Wildlife and Fisheries 2019). This cover type must
provide ample sources of food (e.g. insects), especially protein- which is critical for
growing quail chicks- and protection from predators (Hernàndez and Peterson 2007,
Rollins 2007). Acceptable plants for brooding cover include pigweed (Amaranthus spp.),
kochia (Kochia scoparia), and Russian thistle (Salsola iberica) (Rollins 2007).
In addition to providing protection and reproductive sites, vegetation used by
northern bobwhite also provides a significant amount of their diet (Hernàndez and
Peterson 2007, Rollins 2007). Northern bobwhites are primarily granivorous. Seeds
from various forbs, woody plants, and grasses make up almost 90% of northern bobwhite
diet during the fall and winter, along with varying amounts of greens and insects,
particularly during the Spring (Rollins 2007). Some common staples for northern
bobwhite include seeds of western ragweed (Ambrosia cumanensis), mesquite,
Johnsongrass (Sorghum halepense), and buffalobur (Solanum rostratum) (Rollins 2007).
Grasshoppers are the most frequently consumed insect, especially for bobwhite chicks
and adult females during the spring (Hernàndez and Peterson 2007, Rollins 2007).
Northern bobwhites do not require standing water, as they often use preformed water
(Guthery 2000, Rollins 2007, Agrilife Extension of Wildlife and Fisheries 2019).

Texas Tech University, Jessica Mehta, May 2019
5
Northern bobwhites are a relatively short-lived bird, usually capable of living up
to 6-12 months in the wild (Chumchal 2000, Hernàndez and Peterson 2007). Numerous
studies have examined survival in northern bobwhite adults and chicks (Burger et al.
1995, Dixon 1996, DeMaso 1997, Brennan 1999). However, there are currently little
data on northern bobwhite survival or dispersal over the late summer and early fall
periods, during which chicks are transitioning into juveniles.
The available literature suggests that juvenile northern bobwhites are capable (or
more inclined) of dispersing for longer distances than adult northern bobwhites (Fies et
al. 2002, Townsend et al. 2003). Fies et al. (2002) in Virginia reported that a) a higher
portion of juveniles (28%) dispersed more than 2 km compared to adults (10%), b)
juveniles moved farther between wintering and breeding regions than adults, c) juvenile
males were the most inclined to disperse, and d) adult males were the least inclined to
disperse. Howard (1960) suggested that juveniles are more inclined to disperse to avoid
inbreeding in populations. Fies et al. (2002) also suggested that adult males may be less
likely to disperse if they have success in obtaining a mate close to their area of residence.
Based on the available literature, I believe that the disappearance of northern bobwhites
observed by landowners and hunters could be explained by long-distance movements of
juvenile birds during the late summer and early fall periods.
HISTORY TO PRESENT
The northern bobwhite is one of North America’s most heavily researched birds
(Guthery 1997, Rollins 2007, Brennan et al. 2014). Additionally, as one of the most
hunted game birds, it is of critical economic importance, particularly in the southern and
midwestern regions of the United States (Chumchal 2000, Rollins 2007). Northern

Texas Tech University, Jessica Mehta, May 2019
6
bobwhites used to occur in Texas on an unprecedented scale, with populations numbering
into the millions (Dimmick et al. 2002). In 1960, the Bureau of the Census put the
number of bagged quails during the hunting season at 98 million birds, most of which
were northern bobwhites (Jackson et al.1990).
By the start of the 1980s, northern bobwhite populations began to decline sharply.
The Northern Bobwhite Conservation Initiative calculated that northern bobwhite
populations fell drastically from 58,857,000 to 20,241,000 birds from 1980-1999
(Dimmick et al. 2002). Rollins (2007) noted that, per Texas Parks and Wildlife
Department data, northern bobwhite harvest declined across the Rolling Plains from
1981-2001; harvest was high (668,167 birds) in 1982, compared to a much lower harvest
(87,570 birds) in 1996. Additionally, Rollins (2007) noted that northern bobwhite
populations had declined annually by 3.5% from 1980-2001. This is in keeping with the
trend observed by Jackson (1962), who stated that northern bobwhites exhibit a “boom
and bust” growth cycle that is correlated directly to annual precipitation averages (Koerth
and Guthery 1991, Rollins 1999, Hernàndez et al. 2005, Tri et al. 2013).
Rollins (1999) cited Jackson (1962) while dividing this “boom and bust” cycle
into 5 steps: a) periods of extreme drought are followed by b) a year of average rainfall,
which is then followed by c) a year of excessive rainfall, and d) a year of normal rainfall,
which can all lead to e) a crash in Northern bobwhite populations if food or cover is not
built up adequately before the breeding season in Spring. A study by Koerth and Guthery
(1991) found that a substantial decrease in water can lead to decreased (and perhaps
cause a cessation of) reproduction in northern bobwhite populations. Clearly, northern

Texas Tech University, Jessica Mehta, May 2019
7
bobwhite demographics and annual precipitation unequivocally have a direct relationship
(Koerth and Guthery 1991, Rollins 1999, Hernàndez et al. 2005, Tri et al. 2013).
Numerous studies have been conducted to address the decline in northern
bobwhite populations (Brennan et al. 2014). The introduction of radio telemetry has been
an incredible asset to northern bobwhite studies (White and Garrot 1990). Through the
use of radio telemetry, researchers have been able to examine a myriad of aspects
concerning northern bobwhite demographics, including habitat use, dispersal patterns,
survival, reproduction, mating systems, and more (White and Garrot 1990, Burger et al.
1995, Dixon et al. 1996,Townsend et al. 2003, Cox et al. 2004, Cook et al. 2009, Buckley
et al. 2015). However, over the years, there has been much controversy within the
scientific community about whether this method of analyzing survival should be used.
Per White and Garrot (1990), some noticeable effects on animals from radiotags
(particularly in avian studies) have included aggravation of the skin (Bartholomew 1967,
Hessler et al. 1970), hair and/or feather loss (Bartholomew 1967, Hessler et al. 1970),
snagging of the antenna on vegetation or other objects (Burger et al. 1995), and the
possibility of electrocution for birds perched on telephone poles and power lines
(Dunstan 1977). Guthery and Lusk (2004) also observed that the estimates of survival
from radio telemetry studies tend to be extremely low and therefore these estimates
shouldn’t be used as a valid source of data. However, White and Garrot (1990) argue that
there is plenty of good information available when it comes to survival studies of various
animals, including northern bobwhites.
Despite the possible impacts of these effects on radiotagged animals, there has
been much support for the use of radiotelemetry in northern bobwhite survival studies. A

Texas Tech University, Jessica Mehta, May 2019
8
study by Mueller et al. (1988) using only male northern bobwhites reported that survival
rates did not differ between marked and un-marked males. Terhune et al. (2007) found
that there was no evidence for adverse effects of radiotransmitters while measuring
factors effecting northern bobwhite survival in Georgia. I chose to use radio telemetry to
conduct my study because a) it has been used by my colleagues in the past with reliable
results, b) it is the most financially feasible and updated technology available to us, and
c) it can be used on a broad scale, without which this project could not be done.
Prior to the start of 2016, landowners and hunters reported to the Quail-Tech
Alliance that they would see lots of northern bobwhite in August and September, but very
few during the start of hunting season (late October-February). While numerous studies
have indicated that northern bobwhite populations exhibit a “boom and bust” growth
cycle, indicating that fluctuations in populations is a natural occurrence, this
disappearance of quail during the late summer to early fall periods remains unexplained
(Koerth and Guthery 1991, Rollins 1999, Hernàndez et al. 2005, Tri et al. 2013).
In this study, I addressed two major aspects of northern bobwhite populations.
Firstly, I examined survival of young-of-the-year (i.e. juvenile) birds during the late
summer to early fall. Secondly, I examined home range among young-of-the-year birds
(i.e., where do they move during the late summer and early fall). The results of each
component are presented in chapter 2. My results should give valuable information
concerning a) possible factors contributing to the reduced sightings of northern bobwhite
during this late summer to early fall period, b) survival of young-of-the year birds during
this period, and c) associated movement patterns of young-of the year birds during this

Texas Tech University, Jessica Mehta, May 2019
9
period in an effort to provide an explanation for these reduced sightings, and conversely,
to provide vital information that could aid in management solutions.

Texas Tech University, Jessica Mehta, May 2019
10
LITERATURE CITED
Agrilife Extension Wildlife and Fisheries. 2019. Northern bobwhite.
<https://wildlife.tamu.edu/quail/northern-bobwhites/>. Accessed 8 March 2019.
Bartholomew, R.M. 1967. A study of the winter activities of bobwhites through the use
of radiotelemetry. Occasional Papers of the C.C. Adams Center for Ecological
Studies 17:1-25.
Brennan, L.A. 1999. Northern bobwhite (Colinus virginianus). Account 397 in A. Poole
and F. Gill, editors. The birds of North America. The Academy of Natural
Sciences, Philadelphia, Pennsylvania, and The American Ornithologists’ Union,
Washington, D.C., USA.
Brennan, L.A., S. DeMaso, F. Guthery, J. Hardin, C. Kowaleski, S. Lerich, R. Perez, M.
Porter, D. Rollins, M. Sams, T. Trail, and D. Wilhelm. 2005. Where have all the
quail gone. The Texas Quail Conservation Initiative, Texas, USA.
Brennan, L. A., F. Hernandez, and D. Williford. 2014. Northern Bobwhite (Colinus
virginianus). Version 2.0. in A. Poole and F. Gill, editors. The birds of North
America. The Academy of Natural Sciences, Philadelphia, Pennsylvania, and The
American Ornithologists’ Union, Washington, D.C., USA.
Buckley, B.R., A.K. Andes, B.A. Grisham, and C.B. Dabbert. 2015. Effects of
broadcasting supplemental feed into roadside vegetation on home range and
survival of female northern bobwhite. Journal of Wildlife Management 39(2):
301-309.
Burger, L.W. Jr., T.V. Dailey, E.W. Kurzejeski, and M.R. Ryan. 1995. Survival and
cause-specific mortality of northern bobwhite in Missouri. Journal of Wildlife
Management 59(2):401-410.
Chumchal, M. 2000. Colinus virginianus. Animal Diversity Web.
<https://animaldiversity.org/accounts/Colinus_virginianus/>. Accessed 1 March
2019.
Cook, P.M., R.G. Hamrick, and J.P. Carroll. 2009. Effects of sex, age, and habitat on
northern bobwhite spring dispersal patterns. Gamebird 135-145.
Cornell Lab of Ornithology. 2017. Northern bobwhites.
<https://www.allaboutbirds.org/guide/Northern_Bobwhite/id>. Accessed 9 March
2019.

Texas Tech University, Jessica Mehta, May 2019
11
Cox, S.A., A.D. Peoples, S.J. DeMaso, J.R. Lusk, and F.S. Guthery. 2004. Survival and
cause-specific mortality of northern bobwhites in western Oklahoma. Journal of
Wildlife Management 68(3):663-671.
DeMaso, S.J., A.D. Peoples, S.A. Cox, and E.S. Perry. 1997. Survival of northern
bobwhite chicks in western Oklahoma. Journal of Wildlife Management 61(3):
846-853.
Dimmick, R.W., M.J. Gudlin, and D.F. McKenzie. 2002. The northern bobwhite
conservation initiative. Miscellaneous publication of the Southeastern
Association of Fish and Wildlife Agencies, South Carolina. 96 pp.
Dixon, K.R., M.A. Horner, S.R. Anderson, W.D. Henriques, D. Dunham, and R.J.
Kendall. 1996. Northern bobwhite habitat use and survival on a South Carolina
plantation during winter. Wildlife Society Bulletin 24(4):627-635.
Dunstan, T.C. 1977. Types and uses of radio packages for North American Falconiform
and Strigiform birds. Pages 30-39 in F.M. Long, editor. Proceedings of the 2nd
International Conference of Wildlife Biotelemetry. University of Wyoming,
Laramie, USA.
Fies, M.L., K.M. Puckett, and B. Larson-Brogdon. 2002. Breeding season movements
and dispersal of northern bobwhites in fragmented habitats of Virginia. Pages
173-179 in S.J. DeMaso, W.P. Kuvlesky Jr., F. Hernàndez and M.E. Burger,
editors. Quail V Proceedings of the Fifth National Quail Symposium. Texas
Parks and Wildlife Department, Austin, Texas, USA.
Gould, F.W. 1975b. Texas plants- a checklist and ecological summary. Texas
Agricultural Experiment Station Miscellaneous Publication 585- revision.
College Station, Texas, USA.
Guthery, F.S. 1997. A philosophy of habitat management for northern bobwhites. Journal
of Wildlife Management 61:291-301.
Guthery, F. S., N.M. King, K.R. Nolte, W.P. Kuvlesky Jr., S. DeStefano, S.A. Gall, and
N.J. Silvy. 2000. Comparative habitat ecology of Texas and masked bobwhites.
Journal of Wildlife Management 64:407-420.
Guthery, F. S. and J.L. Lusk. 2004. Radiotelemetry studies: are we radio-handicapping
northern bobwhites? Wildlife Society Bulletin 32(1):194-201.
Hernàndez, F. 1999. The value of prickly pear cactus as nesting cover for northern
bobwhite. Dissertation, Texas A & M University-Kingsville, College Station,
Texas, USA.

Texas Tech University, Jessica Mehta, May 2019
12
Hernàndez, F., F. Hernàndez, J.A. Arredondo, F.C. Bryant, L.A. Brennan, and R.L.
Bingham. 2005. Influence of precipitation on demographics of northern bobwhite
in southern Texas. Wildlife Society Bulletin 33(3):1071-1079.
Hernàndez, F., and M.J. Peterson. 2007. Northern bobwhite ecology and life history.
Pages 117–141. in Texas Quails:Ecology and Management, Chapter 4, Texas
A&M University, College Station, USA.
Hessler, E., J.R. Tester, D.B. Siniff, and M.M. Nelson. 1970. A biotelemetry study of
survival of pen-reared pheasants in selected habitats. Journal of Wildlife
Management 34:267-274.
Howard, W.E. 1960. Innate and environmental dispersal of individual vertebrates.
American Midland Naturalist 63(1):152-161.
Jackson, A.S. 1962. A pattern to population oscillations of the bobwhite quail in the
lower plains grazing regions of northwest Texas. Proceedings Southeastern
Association Game and Fish Commissioners 16:120-126.
Jackson, A. S., Clyde Holt., and D.W. Lay. 1990. Bobwhite quail in Texas. Texas Parks
and Wildlife Publication.
Koerth, N.E. and F.S. Guthery. 1991. Water restriction on northern bobwhite
reproduction. Journal of Wildlife Management 55:132-137.
Mississippi State University. 2019. Bobwhite quail (Colinus virginianus).
<http://www.naturalresources.msstate.edu/wildlife/northern-bobwhite-quail.asp>.
Accessed 12 March 2019.
Mueller, B. S., J. B. Atkinson Jr., and T. DeVos. 1988. Mortality of radio-tagged and
unmarked northern bobwhite quail. Biotelemetry X: Proceedings of the Tenth
Symposium on Biotelemetry 10:139–144.
Rollins, D. 1999. A pattern to quail irruptions in the rolling plains of Texas. Texas
Agricultural Extension Service, San Angelo.
Rollins, D. 2007. Quails on the rolling plains. Pages 117–141. in Texas Quails: Ecology
and Management, Chapter 7, Texas A&M University, College Station, USA.
Roseberry, J. L., and S.D. Sudkamp. 1998. Assessing the Suitability of Landscapes for
Northern Bobwhite. The Journal of Wildlife Management 62(3):895-902.
Terhune, T.M., D.C. Sisson, J.B. Grand, and H.L.Stribling. 2007. Factors influencing
survival of radiotagged and banded northern bobwhites in Georgia. Journal of
Wildlife Management 71(4):1288-1297.

Texas Tech University, Jessica Mehta, May 2019
13
Texas Parks and Wildlife Department. 2019. Quail forecast 2018-2019.
<http://tpwd.texas.gov/huntwild/hunt/planning/quail_forecast/forecast/>.
Accessed 14 March 2019.
Townsend, D.E., II, R.E. Masters, R.L. Lochmiller, D.M. Leslie Jr., S. J. DeMaso, and
A.D. Peoples. 2001. Characteristics of nest sites of northern bobwhites in western
Oklahoma. Journal of Range Management 54:260-264.
Townsend, D. E., II, D.M. Leslie Jr., R.L. Lochmiller, S.J. DeMaso, S.A. Cox, and A.D.
Peoples. 2003. Fitness costs and benefits associated with dispersal in northern
bobwhites (Colinus virginianus). American Midland Naturalist 150(1):73-82.
Tri, A.N., J.P. Sands, M.C. Buelow, D.W., E.M. Wehland, J.A. Larson, K.A. Brazil, J. B.
Hardin, F. Hernàndez, and L.A. Brennan. 2013. Impacts of weather on northern
bobwhite sex ratios, body mass, and annual production in south Texas. Journal of
Wildlife Management 77(3):579-586.
Virginia Department of Game and Inland Fisheries. 2019. Roosting.
<https://www.dgif.virginia.gov/quail/get-to-know-bobwhite/roosting/>. Accessed
15 March 2019.
White, G.C., and R.A. Garrot. 1990. Analysis of wildlife radio-tracking data. Academic
Press, Inc., San Diego, California, USA.

Texas Tech University, Jessica Mehta, May 2019
14
CHAPTER II
SURVIVAL AND HOME RANGE ESTIMATES OF JUVENILE NORTHERN
BOBWHITE ON THE ROLLING PLAINS OF TEXAS
INTRODUCTION
The northern bobwhite (Colinus virginianus) is one of the most commonly
recognized game birds in North America, with its range extending to the midwestern and
southeastern regions of the United States, the Caribbean, and Mexico (American Bird
Conservancy 2017). Since the late 1960’s, population trend estimates for northern
bobwhite have declined sharply (Brennan 1991, United States Geological Survey 2015,
American Bird Conservancy 2017). Texas Parks and Wildlife Department data stated
that the mean number of northern bobwhites observed per survey route for 2018 was
5.43, a drastic drop compared to 2017 (26.72) and 2016 (53.89) (Texas Parks and
Wildlife Department 2019). The mean number of northern bobwhites observed per
survey route for 2018 is comparable to observations in 2011 (5.39) and 2012 (3.80),
which were years of severe drought in the Rolling Plains (Texas Parks and Wildlife
Department 2019). Many causes have been linked to these declines, including habitat
loss and/or degredation, predation (avian and mammal), poor land management (i.e.
overgrazing by cattle), and drought (Brennan et al. 2005, American Bird Conservancy
2017).
Drought and quail population fluctuations are not new phenomena in the Rolling
Plains. In fact, Jackson (1962) described this boom and bust sequence and referred to the
large population response to plentiful precipitation after drought as a quail irruption.
Unfortunately, analyses of data from the past 2 decades in the Rolling Plains of Texas
suggests quail populations are not responding with the same magnitude of population

Texas Tech University, Jessica Mehta, May 2019
15
increase upon receiving above “normal” precipitation following drought (Texas Parks
and Wildlife Department 2013). Some evidence from field observations suggests
bobwhites might be successfully breeding but then disappearing before the hunting
season. Landowners commonly report observing significant quail populations present in
August and September, but few to no quail in November. However, no data are available
that documents this late summer to early fall bobwhite disappearance in the Rolling
Plains of Texas. The length of bobwhite telemetry studies is limited by radiotransmitter
life, which is usually 9 to 11 months. Most studies concentrate on the wintering period or
a reproductive period that ends in late July or August. These constraints prevent
monitoring from occurring during the critical period of late August to early October.
Data concerning the precise timing, geographic extent, incidence within and
among coveys, and corresponding environmental conditions of bobwhite mortalities
might provide essential evidence that explains the cause or causes of this decline. These
data could be obtained by radiomarking and monitoring bobwhites prior to the typical
period of disappearance. For instance, radiotelemetry studies were instrumental in
revealing the influence of West Nile Virus on Greater Sage Grouse (Centrocercus
urophasianus) survival (Walker et al. 2007) and the influence of cecal nematodes on Red
Grouse (Lagopus lagopus) survival (Hudson et al. 1992). These studies documented
mortality in the field that led to identification and understanding of the specific causes of
mortality. The specific timing, rate of spread, or spatial extent of the bobwhite
disappearance is unknown. The current uncertainty concerning the cause of the late
summer and early fall disappearance of bobwhites could lead to missteps in how we use
our limited resources (Johnson et al. 2014). A telemetry study that monitors bobwhite

Texas Tech University, Jessica Mehta, May 2019
16
survival across the landscape during this period of disappearance could reduce this
uncertainty in our knowledge and improve our ability to manage bobwhite populations in
the Rolling Plains of Texas.
Alternative to large scale mortality, movement or dispersal of bobwhites away
from an area could explain local disappearance on a property. A fall shuffle dispersal
event is known to occur in bobwhites (Hernàndez and Peterson 2007) and could be a
possible explanation for the reduced sightings of northern bobwhites in early fall. Many
investigators have examined northern bobwhite movement (Townsend et al. 2003, Cook
et al. 2009). However, few studies have been conducted to determine home range and
dispersal patterns of juvenile northern bobwhites. Based on the available literature, I
hypothesize that the disappearance of northern bobwhites observed by landowners and
hunters could be due to long-distance movements of the birds during the late summer and
early fall periods.
Survival estimates for northern bobwhite adults (Dixon et al. 1996, Sisson et al.
2000, Taylor et al. 2000, Cox et al. 2004, Buckley et al. 2015) and chicks (Lochmiller et
al. 1993, DeMaso et al. 1997, Mueller et al. 1999) have been thoroughly examined for
years. Adult survival generally averages between 18 to 30 percent annually (Jackson
1962, Roseberry and Klimstra 1984, Hernàndez and Peterson 2007), while chick survival
has been estimated as high as 36.7% (DeMaso et al. 1997). Additionally, many studies
have examined home range of adult northern bobwhites (Sisson et al. 2000, Townsend et
al. 2003, Buckley et al. 2015). Little to no research, however, has been conducted to
evaluate survival and home range for young-of-the year (i.e. juvenile) birds. Research in
this area could aid in land management techniques and could provide insights to

Texas Tech University, Jessica Mehta, May 2019
17
enhancing northern bobwhite populations. Consequently, I conducted a 6-month broad-
scale telemetry study during 2016 and 2017 to estimate home range and survival rates for
juvenile northern bobwhites during the late summer and early fall on the Rolling Plains of
Texas. My objective for this study was to find a possible explanation for the reduced
sightings of northern bobwhites during this late summer to early fall period.
METHODS
Study Area
My study sites were chosen because of their availability and degree of spread
across the landscape. This spread allowed me to examine the spatial extent of this
disappearance in Northern bobwhites. Additionally, one study site (the Clark Ranch) was
chosen because several dead Northern bobwhites had been found intact on the property.
All study sites are Quail-Tech Alliance Anchor Ranches, and all study sites are
dispersed across the Rolling Plains of Texas. The study site names and locations are as
follows: the Esperanza Ranch in Spur, the Indian Canyon Ranch in Lamesa, the
Pitchfork Ranch in Guthrie, the Double Fork Ranch in Clairemont, and the Clark Ranch
in Sweetwater. In 2016, birds were captured and monitored at all 5 study sites. In 2017,
birds were captured and monitored at only 3 of the 5 study sites (the Esperanza Ranch,
the Indian Canyon Ranch, and the Pitchfork Ranch). All 5 study sites exhibit weather
patterns that reflect the trend of extremes in the Rolling Plains; the climate in these areas
is mixed, ranging from searing hot temperatures in the summer to quite lower
temperatures during the early winter (Rollins 2007). The average precipitation in the
Rolling Plains is extremely variable, fluctuating from 40.64 centimeters in the western
areas to as much as 76.20 centimeters in the eastern areas (Rollins 2007). The wet season

Texas Tech University, Jessica Mehta, May 2019
18
for the Rolling Plains is often during the spring and summer months, with occasional
apexes in May and September (Rollins 2007).
Dominant plants in the Rolling Plains that are known for high use by northern
bobwhite include mesquite (Prosopsis glandulosa), junipers (mainly Juniperus pinchotii),
prickly pear (Optunia spp.), lotebush (Ziziphus Obtusifolia), sand shinnery oak (Quercus
havardii), catclaw (Acacia spp.), and netleaf hackberry (Celtis reticulatus) (Rollins
2007). Common grasses in the Rolling Plains that are known for high use by Northern
bobwhite include buffalograss (Buchloe dactyloides), sideoats gramma (Bouteloua
curtipendula), and silver bluestem (Bothricola saccharoides) (Rollins 2007).
The Esperanza Ranch in Spur is mostly dominated by 16-21″ deep hardland and
limey upland ecological systems. The Indian Canyon Ranch in Lamesa is mostly
dominated by 16-21″ shallow and hardland slopes ecological systems. The Pitchfork
Ranch in Guthrie is mostly dominated by 19-26″ lakebed and loamy bottomland
ecological systems. The Double Fork Ranch in Clairemont is mostly dominated by 16-
24″ hardland slopes and 20-24″ gravelly ecological systems. The Clark Ranch in
Sweetwater is mostly dominated by 19-26″ loamy bottomland and 23-31″ clay loam
ecological systems (Web Soil Survey 2017).
Field Methods
I conducted a telemetry study running from July-December of 2016 and 2017,
thus encompassing the periods of late summer and early fall in which disappearances of
northern bobwhites were noted. All birds were trapped under the authority of a Texas
Parks and Wildlife Scientific Collecting Permit. Birds were trapped using wire funnel
traps (Stoddard 1931). In order to place emphasis on young-of-the year (i.e. juvenile)

Texas Tech University, Jessica Mehta, May 2019
19
birds, I began trapping in late July through the end of August (or until I reached my
minimum sample size of 100 birds). To get a statistically appropriate sample size, I
attempted to capture 20-30 birds per study site (Krejcie and Morgan 1970). Traps were
baited with milo, a type of supplemental feed commonly used and preferred by quail
(Michael and Beckwith 1955).
Traps were set around dawn (around 6:00-6:30 a.m.) in correlation with northern
bobwhite covey movements and early morning feeding times (Pierce and Gallagher
2005). To protect birds from predators and provide sufficient cover from the summer
heat, all traps were covered with available vegetation (i.e. grasses, junipers, mesquite
branches). Traps were checked at least 2 times per day and monitored frequently to
reduce risk of injury (American Ornithologists Union 1988). No water was placed in the
traps based on the ecological premise that quail do not need surface water (Hernàndez et
al. 2005).
Upon checking the traps, I immediately transferred all bobwhites into a ventilated
box that was placed either under the truck bed (or in another thoroughly shaded area) or
inside the truck where there was sufficient air conditioning. All non-target species were
released immediately. Birds were taken from the ventilated box and placed individually
into a ventilated bag until processing began. Birds were held with the neck between the
first and second fingers, with the other fingers gently encompassing the rest of the body
(American Ornithologists Union 1988).
I recorded the sex (when possible) and age of each bird (Rosene 1969). Each bird
was weighed to the nearest gram using an Ohaus HH120 digital pocket scale (Ohaus
Corporation, Parsippany NJ). Age was determined using primary coverts (i.e., juvenile

Texas Tech University, Jessica Mehta, May 2019
20
birds have buffy-tipped primary coverts) (Koerth et al.1991, Pierce and Gallagher 2005).
All juvenile birds weighing ≥120 grams were banded with an aluminum band (National
Band Tag & Co, No. 8 bands) and fitted with a 6.0 necklace-style radiostransmitter
(American Wildlife Enterprises). This insured that transmitters weighed ≤ 5% of the
bobwhites body weight. After the radiotransmitter and band were secured, I drew blood
from the brachial vein by gently poking it with a sterile needle. Blood was then
transferred into tubes labeled with the band number, ranch name, and date.
I used radiotelemetry to monitor survival and movement of radio-marked juvenile
northern bobwhites from late July until the first week of December (White and Garrot
1990). Birds were tracked using a hand-held yagi (AF Antronics, Inc) and a receiver
(Communication Specialists, Inc). Birds at each study site were checked 1-2 times a
week, time and weather permitting. Birds were tracked as early in the day as possible to
account for unexpected and/or long-distance movement. Birds were not flushed, if
possible, to prevent movement bias (White and Garrot 1990). To get an exact location
without flushing the birds, I would circle an individual bird, get a visual, and use a
rangefinder. I recorded the new location and status of each bird, and maps were made
using Google Maps for day-to-day monitoring purposes.
Birds were not tracked up to 7 days after capture to account for capture myopathy
and adjustment to the radiotransmitter (Kurzejeski et al. 1987, Pollock et al. 1989, White
and Garrot 1990). Due to time constraints and limited manpower, this period was
extended up to more than 7 days for some birds. During this time, I checked birds’
frequencies to make sure that no mortality signal was detected, but I did not get an exact
location. Birds who did not survive this period were removed from the study and any

Texas Tech University, Jessica Mehta, May 2019
21
statistical analysis (Kurzejeski et al. 1987, Burger et al. 1995, Pollock et al. 1989, White
and Garrot 1990).
I assigned three possible fates: dead, alive, or unknown. I took photos of any
dead birds or kill sites. When possible, the cause of death was determined using physical
evidence at the kill site (Dumke and Pils 1973). I categorized cause(s) of death as
follows: mammalian predation, raptor predation, other (e.g. death from weather
conditions), and unknown.
Analysis
Survival Analysis
Because the fate of each bird was known during the study, I ran a known-fate
analysis in Program MARK to estimate survival rate (Cooch and White 2006). The study
periods for 2016 and 2017 lasted 19 weeks each (i.e. 19 intervals). I set up my analysis
using a staggered entry design, in which a bird received a coding of 00 for each interval
until it was tagged. Additionally, a coding of 00 was entered for each interval following
the death of a bird. Birds that were removed or censored from the study followed the
guidelines set in previous survival studies (Burger et al. 1995, Curtis et al. 1988,
Kurzejeski et al. 1987). Birds were removed from the study if they did not survive the 7-
day conditioning period following capture, and birds were censored from the study if
there was a radio failure, radio loss, or they emigrated from the study site.
I recorded 136 individual encounter histories, and I recorded 11 attribute groups
categorized by study site, year, and month of capture (Esperanza, Indian Canyon,
Pitchfork, Clark, Double Fork, 2016, 2017, July, August, September, October).
Additionally, I recorded 144 individual covariates (90 in 2016, 54 in 2017) (Table 2.1,

Texas Tech University, Jessica Mehta, May 2019
22
Table 2.2). My covariates were chosen based on factors known to influence northern
bobwhite survival such as year, temperature, precipitation, and month/season (Jackson
1962, Hernàndez et al. 2005, Rollins 2007). All temperature and precipitation data were
obtained from the West Texas Mesonet National Wind Institute (2016 and 2017). Data
for each study site was retrieved from the Mesonet station in the nearest county
(Aspermont for the Double Fork Ranch, Guthrie for the Pitchfork Ranch, Lamesa for the
Indian Canyon Ranch, Spur for the Esperanza Ranch, Sweetwater for the Clark Ranch).
Initially, I ran models for year, ranch, month of capture, temperature, precipitation, and a
time constant model (in which each day held the same probability of survival). In total, I
created 56 models in Program MARK. Competing models are discussed further for
models with a ΔAIC ≤ 3.0 (Burnham and Anderson 2002).
Home Range
I used Arc Map 10.5 to calculate an MCP (Minimum Convex Polygon) and
determine a home range size for each radiotagged individual. To generate each MCP, I
firstly uploaded a Microsoft spreadsheet containing bird ID (i.e. leg band number),
date(s) located, latitude coordinates, and longitude coordinates into Arc Map. Using the
“Display XY Data” function, I displayed the coordinates for each individual on a county
basemap supplied by the Quail-Tech Alliance (Dickens County for the Esperanza Ranch,
Dawson County for the Indian Canyon ranch, Kent County for the Double Fork Ranch,
King County for the Pitchfork Ranch, Nolan County for the Clark Ranch). All
coordinates were projected using the WGS_1984 Geographic Coordinate System.
To maintain consistency, any birds that were removed from the MARK survival
analysis were also excluded from the home range analysis. Additionally, I censored any

Texas Tech University, Jessica Mehta, May 2019
23
birds that had ≤ 2 locations. For this reason, there are no results for my home range
analysis at the Pitchfork Ranch in 2017, as the one bird I captured had only 2 locations.
After I displayed the coordinates for an individual bird, I generated an MCP by using the
“Minimum Bounding Geometry” option located in the Data Management section of
ArcToolbox. Each MCP was labeled with the ranch, year, and bird ID. To calculate area
of each MCP (i.e. home range), I used the “Calculate Geometry” function. The area of
each MCP was calculated in hectares.
Once I calculated the home ranges of the individuals in a study site, I put all the
home range values into a Microsoft Excel spreadsheet and calculated the average home
range size for that study site using the “AVG” function. Additionally, I recorded the
individuals with the smallest and largest home ranges and calculated the corresponding
values using the “MIN” and “MAX” functions in Microsoft Excel. For the 2017 data, I
had 9 radiotagged adults in my sample at the Indian Canyon Ranch due to the limited
capture success of juvenile birds. To test the observations found in the current literature
concerning adult and juvenile Northern bobwhite home range sizes, I averaged both the
adult and juvenile home range sizes within this study site for comparison.
RESULTS
Survival Analysis
I tagged 145 birds during 2016 and 2017 (104 in 2016, 41 in 2017, Table 2.3,
Table 2.4). I tagged birds across all 5 study sites during my 2016 field season. I tagged
birds across only 3 of my 5 study sites during my 2017 field season due to limited capture
success. All tagged birds in 2016 were juveniles. In 2017, I used 10 adults in my sample

Texas Tech University, Jessica Mehta, May 2019
24
due to the limited abundance of juvenile birds. Of the 104 birds tagged in 2016, 24 birds
(23.1%) died during the study, 45 birds survived the study (43.2%), 35 birds were
censored from the study (33.7%) and 5 (4.8%) birds were removed from the study and
any subsequent analyses (Table 2.3). Of the 41 birds tagged in 2017, 26 (63.4%) birds
died during the study, 10 (24.3%) birds survived the study, 5 birds (12.1%) were
censored from the study, and 4 (9.8%) birds were removed from the study and any
subsequent analyses (Table 2.4).
Of the 56 models I ran in Program MARK, I am reporting the first 16, as they fall
within 3 ΔAICc units of the top competing model (Table 2.5). Of those 16 models, I will
be discussing the top 6 competing models, as they are the most relevant to the results of
this study. Each model generated Beta estimates for survival probability across each
study site and included a constant regression line. The beta estimates were graphed
following the logistic regression formula below, where P represents the probability of
survival, e represents the base of the natural logarithm, and a and b represent the
parameters of the model (University of South Florida 2019).
For each model, the logistic regression equation line is represented by the following
equation: logit survival= (beta estimate of study site) + [(monthly beta estimate for
rainfall or temperature) x (total monthly rainfall or temperature)] (Table 2.6-2.11). This
equation ultimately states that for X inches of rainfall, survival increases by a given
percentage.
The Year model carried the most weight, suggesting that year is most likely the
biggest factor driving juvenile northern bobwhite survival (Table 2.5). The confidence
Texas Tech University, Jessica Mehta, May 2019
25
intervals for the Year model did not overlap, demonstrating that there is a significant
difference in survival between 2016 and 2017 (Table 2.5, Figure 2.2). The Year model
was followed in weight by the 2016 October Rainfall by Ranch, the 2016 September
Rainfall by Ranch, the 2016 December Rainfall by Ranch, the 2016 August Rainfall by
Ranch, and the 2016 June Rainfall by Ranch models. It is important to note that of the 6
competing models, 5 of the models included rainfall as a covariate.
In terms of juvenile survival, the 2016 October Rainfall by Ranch model showed
that the Clark Ranch had the highest beta estimate, while the Double Fork Ranch had the
lowest beta estimate (Table 2.7). The 2016 September Rainfall by Ranch model showed
that the Indian Canyon Ranch had the highest beta estimate, while the Clark Ranch had
the lowest beta estimate (Table 2.8). The 2016 December Rainfall by Ranch model
showed that the Indian Canyon Ranch had the highest beta estimate, while the Double
Fork Ranch had the lowest beta estimate (Table 2.9). The 2016 August Rainfall by
Ranch model showed that the Clark Ranch had the highest beta estimate, while the
Double Fork Ranch had the lowest beta estimate (Table 2.10). The 2016 June Rainfall by
Ranch model showed that the Indian Canyon Ranch had the highest beta estimate, while
the Clark Ranch (Table 2.11).
The AIC weights (Table 2.5) and beta estimates for the 6 competing models
(Table 2.6-2.11) collectively demonstrate that juvenile survival is driven by year and
rainfall levels. The beta estimates also clearly show that winter rainfall levels are more
important to juvenile survival than summer rainfall levels, results of which are
substantiated by current literature (Hernàndez et al. 2005). Additionally, the beta

Texas Tech University, Jessica Mehta, May 2019
26
estimates from the competing models demonstrate that warm, wet winters have the
potential for greater juvenile survival rates of Northern bobwhite within these study sites.
Home Range
The average home range sizes for juvenile northern bobwhites varied across study
sites from 2016-2017 (Table 2.12). The average home range size of juvenile northern
bobwhite was smallest (3.67 hectares) at the Double Fork Ranch and largest at the
Pitchfork Ranch (112.11 hectares) in 2016 (Table 2.12). In 2017, the average home
range size of juvenile northern bobwhite was smallest (6.32 hectares) at the Esperanza
Ranch and largest at the Indian Canyon Ranch (11.91 hectares) (Table 2.12). The
minimum and maximum home range sizes for individuals between ranches was
extremely variable (Table 2.12). Furthermore, the comparison analysis of adult and
juvenile home range sizes from 2017 data at the Indian Canyon Ranch revealed that the
average adult home range was larger (15.11 hectares) than the average juvenile home
range (9.35 hectares) (Table 2.13).
DISCUSSION
In 2016, ranch owners came to the Quail-Tech Alliance when they started
noticing local disappearances of northern bobwhite on their properties, and my study was
designed to identify possible explanations for these observations. Based on the available
literature, I believed that these observed disappearances of northern bobwhite could be
due to either large-scale movements, especially during October when the Fall shuffle
occurs, or large-scale mortality (Hernàndez and Peterson 2007). In my discussion, I
address 4 major questions based off my data and personal observations:
a) Was a sudden die-off of quail observed over the 2 years of my study?

Texas Tech University, Jessica Mehta, May 2019
27
b) Did quail move from the area where they were originally trapped and did not return?
c) Did quail display a Fall shuffle?
d) What did my statistical survival analysis show as a driving force of juvenile survival?
While northern bobwhites are one of the most studied birds in the world, little to
no research exists concerning the juvenile age class, presumably because it is difficult to
catch birds during the specified time period in which I was trapping, many survival
studies for Northern bobwhite conclude around July or August, and the limitations posed
by technology and/or radio size (Burger et al. 1995, Dixon et al. 1996). Based on my
data and personal observations over the 2 years of my study, I believe no sudden die-off
was observed during either my 2016 or my 2017 study periods. While the percentage of
birds that survived during my study in 2016 was noticeably higher (43%) than 2017
(24.3%), the number of deaths across the 2 study periods was relatively similar (24 in
2016 and 26 in 2017) (Table 2.3, Table 2.4). It is important to note that the sample sizes
were different for each year (104 birds in 2016 and 41 birds in 2017), so this could be as
cause of the observed differences in survival between years as opposed to large-scale
mortality.
In addition to survival, other aspects of northern bobwhite ecology that have been
frequently studied are home range and dispersal (Howard 1960, Fies et al. 2002,
Townsend et al. 2003, Cook et al. 2009, Buckley et al. 2015). For the purposes of this
study, I examined home range of juvenile Northern bobwhites. I made note of any
radiotagged quail that moved from the area in which they were trapped and did not
return, as well as any large-scale movements during October and November, the months

Texas Tech University, Jessica Mehta, May 2019
28
during which the Fall shuffle occurs in which landowners noted disappearances of
Northern bobwhite.
In my 2016 field season, I noted that 14 birds at the Clark and Pitchfork ranches
in August and September moved from the area in which they were trapped and did not
return. I was unable to locate or pick up a radio signal on any of these birds for the
remainder of the 2016 study period following their day of capture, and I classified their
fate as “unknown”. Subsequently, they were censored from my known-fate survival
analysis in Program MARK (Burger et al. 1995, Curtis et al. 1988, Kurzejeski et al.
1987).
Additionally, I was unable to locate 15 other birds throughout my 2016 study.
These 15 birds disappeared from my study sites during my 2016 field season in the
months of September, October, and November. Interestingly, my observations matched
the months in which landowners noted disappearances of northern bobwhite. Of the 15
birds, 8 of them moved off Clark Ranch to an adjacent property in October. I was able to
pick up radio signals on these 8 birds until the end of my study. However, due to
property boundaries, I could not physically locate them.
Of these 15 birds from my 2016 study, 2 birds moved off the Pitchfork Ranch (1
in October and 1 in November), 1 moved off the Indian Canyon Ranch in October, 1 bird
moved off the Esperanza Ranch in September, and 3 birds moved off the Double Fork
Ranch in September. I could not pick up radio signals on any of these 7 birds, and I did
not locate them for the remainder of my 2016 study. Their fates were classified as
“unknown”.
Texas Tech University, Jessica Mehta, May 2019
29
The movement of my radiotagged birds from these properties in 2016 during
these 3 months, especially the Clark Ranch, could be indicative of a Fall shuffle. The 8
birds at the Clark Ranch for which I was able to obtain radio signals throughout the study
were all observed in the western portion of the ranch and simultaneously emigrated to an
adjacent property in the same week of October. As for the remaining 7 birds across the
other properties, I could not definitively state that their disappearance was due to the Fall
shuffle, as I was unable to obtain a radio signal or physically locate them for the
remainder of my 2016 study. However, the fact that they moved off their respective
study sites during September through November could suggest evidence of a Fall shuffle.
In my 2017 field season, I only had 1 bird disappear from the Indian Canyon
Ranch during October. I could not pick up a radio signals on this bird, and I did not
locate it for the remainder of my 2017 study. Therefore, its fate was classified as
“unknown”. I do not have a definitive explanation as to why the number of birds that left
the study sites was higher in 2016 than in 2017. However, additional studies that
examine other factors such as vegetation use and availability across the individual
properties could lend evidence as to why northern bobwhite are inclined to move from
one property to another.
In addition to addressing my personal observations in the field, I also ran a
known-fate analysis for survival in Program MARK. Of the 56 models I ran, I was
required to report 16 models from my Program MARK results that were within ≤3
ΔAICc units of the top competing model. The weekly survival estimates for the 6
competing models was variable between the 5 study sites (Table 2.15). Of the 6
competing models generated by Program MARK that I discussed in this study, 5 of the

Texas Tech University, Jessica Mehta, May 2019
30
models included rainfall as a covariate (Table 2.5). This suggests there is a rainfall effect
and that rainfall could be driving the differences in survival estimates observed between
2016 and 2017. Additionally, my results showed which specific times of the year rainfall
is important for survival of juvenile northern bobwhite. In this case, my results showed
that rainfall during fall and winter months (September, October, December) were more
important to juvenile survival than rainfall in summer months (August and June) (Table
2.5).
The available literature supports both my statistical results as well as my personal
observations during my 2 field seasons. In 2016, which was a year of high precipitation,
I had high capture success (Table 2.3). In 2017, which had substantially less
precipitation, I had limited capture success (Table 2.4). The reduced capture success
during my 2017 field season could possibly be explained by the limited amount of
precipitation during that year (West Texas Mesonet). Additionally, my weekly survival
estimate for 2016 was higher (0.97) than 2017 (0.91) (Table 2.14). Because 2017 was
dry year (West Texas Mesonet National Wind Institute), there was presumably less
vegetation growth, which means that there were reduced levels of available food, cover,
and nesting sites in 2017. Not only could a reduction in precipitation lower reproduction
levels, but it could also negatively impact the physiological condition of the birds due to
the limited presence of food (Buckley et al. 2018). Therefore, the lack of precipitation in
2017 could be a possible explanation for why the yearly survival estimate for 2017 was
lower than 2016.
For my home range analysis, I used 100% MCP’s to examine how much area
Northern bobwhite were using during the duration of my study. My home range results

Texas Tech University, Jessica Mehta, May 2019
31
across the 5 study sites were variable. Overall, the study site with the largest home range
average was the Pitchfork Ranch in 2016 and the Indian Canyon Ranch in 2017 (Table
2.12). Overall, the home range averages in 2016 across my study sites were all larger
than the home range averages in 2017 (Table 2.12).
This goes against the findings of the available literature, which suggests that
northern bobwhite will often travel farther in dry years to locate food and cover (Miller et
al. 2017). However, the reduced movements during the 2017 field season could still be
explained by reduced precipitation levels. Townsend et al. (2003) proposed that
northern bobwhite in high-quality condition could increase their survival by a) by being
able to successfully evade predators and b) having enough remaining energy to start
building a nest immediately after dispersal. If the birds in my sample in 2017 were in
poor physiological condition due to lack of food availability caused by low precipitation
levels, this could explain why they did not disperse as much compared to 2016.
Because I had adults in my 2017 sample, I calculated the home range averages of
the adults and juveniles for comparison (Table 2.13). Surprisingly, the average home
range of adults was larger (15.11 hectares) than that of juveniles (9.34 hectares), which
goes against the findings of the available literature. Fies et al. (2002) in Virginia reported
that a) a higher portion of juveniles (28%) dispersed more than 2 km compared to adults
(10%), b) juveniles moved farther between wintering and breeding regions than adults, c)
juvenile males were the most inclined to disperse, and d) adult males were the least
inclined to disperse. Howard (1960) suggested that juveniles are more inclined to
disperse to avoid inbreeding in populations. I am not certain as to why adults dispersed
farther than juveniles. However, I believe a possible explanation for this could be that

Texas Tech University, Jessica Mehta, May 2019
32
the adults were in better physiological condition than the juveniles and could therefore
disperse further (Townsend et al. 2003).
While I did not observe a die-off of quail between my 2016 and 2017 field
seasons, the findings of my study showed that weekly survival was higher in 2016 (0.97)
than 2017 (0.91) (Table 2.14). Of the many survival studies that have been done on
northern bobwhite, rainfall has been identified as an essential factor driving both northern
bobwhite survival and reproduction (Rollins 1999, Hernàndez et al. 2005, Tri et al. 2013,
Buckley et al. 2018). Rainfall promotes vegetation growth, which contributes
significantly to Northern bobwhite survival in terms food, cover, and nesting sites
(Rollins 2007).
Buckley et al. (2018) observed that wild female northern bobwhite did not
reproduce following a significant drought during 2011. Additionally, Koerth and
Guthery (1991) observed that a substantial decrease in water can lead to decreased (and
perhaps cause a cessation of) reproduction in Northern bobwhite populations. I believe
that the differences in my yearly survival rates could be explained by the vast differences
in precipitation between 2016 and 2017. Low precipitation levels in 2017 could not have
only limited the amount of food and cover that my birds had access to, thus reducing
survival levels, but could also have subsequently affected reproduction levels for that
year. This could have resulted in my lowered capture success (Table 2.4), as well as
lower weekly survival estimate for 2017.
My birds dispersed farther in 2016 than 2017 (Table 2.12), and I observed many
birds move from my study sites after capture and throughout the duration of my study
periods, especially during 2016 (29 in 2016, 1 in 2017). I believe these movements could
Texas Tech University, Jessica Mehta, May 2019
33
be due to a Fall shuffle, as I observed several birds move off my respective study sites in
the months of September through November. The 8 birds that moved off the Clark
Ranch in October strongly suggested evidence of a Fall shuffle. However, due to
restricted property access, I could not assess if these birds moved from the property for
the purpose of forming new coveys.
Ultimately, based on my data and personal observations from my 2016 and 2017
field seasons, I believe the results of my survival analysis did not show evidence of a die-
off of Northern bobwhite on these respective properties. However, my survival analysis
indicated that rainfall is a driving factor for juvenile Northern bobwhite populations on
these ranches. Specifically, my results suggested that rainfall levels are more important
to juvenile Northern bobwhite survival during the fall and winter months as opposed to
the summer months (Table 2.5). Additionally, my home range analysis did suggest
evidence of a Fall shuffle. Because my study was done solely on juvenile populations
within each of my 5 study sites, I believe that my results are not necessarily
representative of other quail populations outside of these properties. As such, I believe
further survival and home range studies outside of the given spatial scope of my study
could examine other individuals within Northern bobwhite populations, such as males
and females.

Texas Tech University, Jessica Mehta, May 2019
34
LITERATURE CITED
American Bird Conservancy. 2017. Northern bobwhite.
<https://abcbirds.org/bird/northern-bobwhite/>. Accessed 14 March 2019.
American Ornithologists Union. 1988. Report of committee on use of wild birds in
research. Auk 105(1):1-41.
Brennan, L.A. 1991. How can we reverse the northern bobwhite population decline?
Wildlife Society Bulletin 19:54-55.
Brennan, L.A., S. DeMaso, F. Guthery, J. Hardin, C. Kowaleski, S. Lerich, R. Perez, M.
Porter, D. Rollins, M. Sams, T. Trail, and D. Wilhelm. 2005. Where have all the
quail gone. The Texas Quail Conservation Initiative, Texas, USA.
Buckley, B.R., A.K. Andes, B.A. Grisham, and C.B. Dabbert. 2015. Effects of
broadcasting supplemental feed into roadside vegetation on home range and
survival of female northern bobwhite. Journal of Wildlife Management 39(2):301-
309.
Buckley, B.R., A.K.Andes, and C.B. Dabbert. 2018. Effects of food supplementation on
the nesting dynamics of wild northern bobwhite. The Journal of Wildlife Biology
1:1-8.
Burger, L.W. Jr., T.V. Dailey, E.W. Kurzejeski, and M.R. Ryan. 1995. Survival and
cause-specific mortality of northern bobwhite in Missouri. Journal of Wildlife
Management 59(2):401-410.
Burnham, K.P., and D.L. Anderson. 2002. Model selection and inference: a practical
information theoretic-approach. 2nd edition. Springer-Verlag, New York.
Cook, P.M., R.G. Hamrick, and J.P. Carroll. 2009. Effects of sex, age, and habitat on
northern bobwhite spring dispersal patterns. Gamebird 135-145.
Cooch, E. and G. White. 2006. Program MARK: a gentle introduction. <http://www.
phidot. org/software/mark/docs/book>.
Cox, S.A., A.D. Peoples, S.J. DeMaso, J.R. Lusk, and F.S. Guthery. 2004. Survival and
cause-specific mortality of northern bobwhites in western Oklahoma. Journal of
Wildlife Management 68(3):663-671.
Curtis, P.D., B.S. Mueller, P.D. Doerr, and C.F. Robinette. 1988. Seasonal survival of
radio-marked northern bobwhite quail from hunted and non-hunted populations.
Proceedings of the international Biotelemetry Symposium 10:263-275.

Texas Tech University, Jessica Mehta, May 2019
35
DeMaso, S.J., A.D. Peoples, S.A. Cox, and E.S. Perry. 1997. Survival of northern
bobwhite chicks in western Oklahoma. Journal of Wildlife Management 61(3):
846-853.
Dixon, K.R., M.A. Horner, S.R. Anderson, W.D. Henriques, D. Dunham, and R.J.
Kendall. 1996. Northern bobwhite habitat use and survival on a South Carolina
plantation during winter. Wildlife Society Bulletin 24(4):627-635.
Dumke, R.T., and C.M. Pils. 1973. Mortality of radio-tagged pheasants on the Waterloo
Wildlife Area. Wisconsin Department of Natural Resources. Technical Bulletin
72.
Fies, M.L., K.M. Puckett, and B. Larson-Brogdon. 2002. Breeding season movements
and dispersal of northern bobwhites in fragmented habitats of Virginia. Pages
173-179 in S.J. DeMaso, W.P. Kuvlesky Jr., F. Hernàndez and M.E. Burger,
editors. Quail V Proceedings of the Fifth National Quail Symposium. Texas
Parks and Wildlife Department, Austin, Texas, USA.
Hernàndez, F., F. Hernàndez, J.A. Arredondo, F.C. Bryant, L.A. Brennan, and R.L.
Bingham. 2005. Influence of precipitation on demographics of northern bobwhite
in southern Texas. Wildlife Society Bulletin 33(3):1071-1079.
Hernàndez, F., and M.J. Peterson. 2007. Northern bobwhite ecology and life history.
Pages 117–141. in Texas Quails:Ecology and Management, Chapter 4, Texas
A&M University, College Station, USA.
Howard, W.E. 1960. Innate and environmental dispersal of individual vertebrates.
American Midland Naturalist 63(1):152-161.
Hudson P.J., D.Newborn, and A.P. Dobson. 1992. Regulation and stability of a free-
living host-parasite system—Trichostrongylus tenuis in red grouse. Monitoring
and parasite reduction experiments. Journal of Animal Ecology 61:477–486.
Jackson, A.S. 1962. A pattern to population oscillations of the bobwhite quail in the
lower plains grazing regions of northwest Texas. Proceedings Southeastern
Association Game and Fish Commissioners 16:120-126.
Johnson, F.A., Hagan, G., Palmer, W.E., and M. Kemmerer. 2014. Uncertainty,
robustness, and the value of information in managing a population of Northern
bobwhites. The Journal of Wildlife Management 78(3):531–539.
Koerth, B., B. Kuvlesky Jr., and J. Payne. 1991. Sexing and aging the northern bobwhite.
Leaflet 2455. College Station:Texas Agricultural Extension Service.
Krejcie, R.V., and D.W. Morgan. 1970. Determining sample size for research activities.
Educational and Psychological Measurement 30:607-610.

Texas Tech University, Jessica Mehta, May 2019
36
Kurzejeski, E.W., L.D. Vanglider, and J.B. Lewis. 1987. Survival of wild turkey hens in
north Missouri. The Journal of Wildlife Management 51(1):188-193.
Lochmiller, R.L., M. R. Vestey, and J.C. Boren. 1993. Relationship between protein
nutritional status and immunocompetence in Northern bobwhite chicks. The Auk:
Ornithological Advances 110(3):503-510.
Michael, V.C., and S.L. Beckwith. 1955. Quail preference for seed of farm crops.
Journal of Wildlife Management 19(2):281-296.
Miller, K.S., F. Hernàndez, L.A. Brennan, R.W. DeYoung, and X.B. Wu. 2017. Northern
bobwhite home range sizes and movements in south Texas. National Quail
Symposium Proceedings 56(8):1-10.
Mueller, J.M., C.B. Dabbert, S. Demarais, and A.R. Forbes. 1999. Northern bobwhite
chick mortality caused by red imported fire ants. Journal of Wildlife Management
63(4):1291-1298.
Pierce, R.A. II, and E. Gallagher. 2005. Ecology of northern bobwhite quail in Missouri.
University of Missouri Extension. Columbia, Missouri, USA.
Pollock, K.H., S.R. Winterstein, C.M. Bunck, and P.D. Curtis. 1989. Survival analysis in
telemetry studies: the staggered entry approach. Journal of Wildlife Management
53:1-6.
Rollins, D. 2007. Quails on the rolling plains. Pages 117–141. in Texas Quails: Ecology
and Management, Chapter 7, Texas A&M University, College Station, USA.
Roseberry, J.L, and W.D. Klimstra. 1984. Population ecology of the bobwhite. Southern
Illinois University, Carbondale. 259pp.
Rosene, W. Jr. 1969. The bobwhite quail: it’s life and management. Rutgers University
Press, New Brunswick, New Jersey, USA.
Sisson, C.D., L.H. Stribling, and D.W. Speake. 2000. Effects of supplemental feeding on
home range size and survival of northern bobwhites in south georgia. National
Quail Symposium Proceedings 4(34):128-131.
Stoddard, H.L. 1931. The bobwhite quail: its habits, preservation, and increase. Charles
Scibner and Sons, New York, New York, USA.
Taylor, J.D., L.W Burger Jr., S.W. Manley, and L.A. Brennan. 2000. Seasonal survival
and cause-specific mortality of northern bobwhites in Mississippi. 2000. National
Quail Symposium Proceedings 4(23):103-107.

Texas Tech University, Jessica Mehta, May 2019
37
Texas Parks and Wildlife Department. 2013. Quail forecast 2013-2014.
<http://tpwd.texas.gov/huntwild/hunt/planning/quail_forecast/forecast/>.
Accessed 14 March 2019.
Texas Parks and Wildlife Department. 2019. Quail forecast 2018-2019.
<http://tpwd.texas.gov/huntwild/hunt/planning/quail_forecast/forecast/>.
Accessed 14 March 2019.
Townsend, D. E., II, D.M. Leslie Jr., R.L. Lochmiller, S.J. DeMaso, S.A. Cox, and A.D.
Peoples. 2003. Fitness costs and benefits associated with dispersal in northern
bobwhites (Colinus virginianus). American Midland Naturalist 150(1):73-82.
United States Geological Survey. 2015. The North American breeding bird survey,
results and analysis 1996-2015. USGS Patuxent Wildlife Research Center,
Laurel, Maryland, USA.
University of South Florida College of Arts and Sciences. Logistic Regression.
< http://faculty.cas.usf.edu/mbrannick/regression/Logistic.html>. Accessed March
14 2019.
Walker, B.L., Naugle, D.E., and K.E. Doherty. 2007. West Nile virus and greater sage-
grouse: estimating infection rate in a wild bird population. Avian Diseases
51(3):691-6.
Web Soil Survey. 2017. Soil Survey Staff, Natural Resources Conservation Service,
United States Department of Agriculture.
<https://websoilsurvey.sc.egov.usda.gov/>. Accessed 1 March 2019.
West Texas Mesonet National Wind Institute. 2016-2017. Homepage.
<http://www.depts.ttu.edu/nwi/research/facilities/wtm/index.php>. Accessed 8
Feb 2019.
White, G.C., and R.A. Garrot. 1990. Analysis of wildlife radio-tracking data. Academic
Press, Inc., San Diego, California, USA.

Texas Tech University, Jessica Mehta, May 2019
38
Table 2.1. List of individual covariates classified by study site used in Program MARK
analysis for 2016 survival estimates. Each study site had a total of 18 covariates. All
covariates were named using the concatenate function in Microsoft Excel, where month,
temperature, precipitation, and name of ranch are abbreviated.*
Esperanza Indian Canyon Pitchfork Clark Double Fork
EJanTemp16 IJanTemp16 PJanTemp16 CJanTemp16 DJanTemp16
EJanRain16 IJanRain16 PJanRain16 CJanRain16 DJanRain16
EFebTemp16 IFebTemp16 PFebTemp16 CFebTemp16 DFebTemp16
EFebRain16 IFebRain16 PFebRain16 CFebRain16 DFebRain16
EJunTemp16 IJunTemp16 PJunTemp16 CJunTemp16 DJunTemp16
EJunRain16 IJunRain16 PJunRain16 CJunRain16 DJunRain16
EJulTemp16 IJulTemp16 PJulTemp16 CJulTemp16 DJulTemp16
EJulRain16 IJulRain16 PJulRain16 CJulRain16 DJulRain16
EAugTemp16 IAugTemp16 PAugTemp16 CAugTemp16 DAugTemp16
EAugRain16 IAugRain16 PAugRain16 CAugRain16 DAugRain16
ESepTemp16 ISepTemp16 PSepTemp16 CSepTemp16 DSepTemp16
ESepRain16 ISepRain16 PSepRain16 CSepRain16 DSepRain16
EOctTemp16 IOctTemp16 POctTemp16 COctTemp16 DOctTemp16
EOctRain16 IOctRain16 POctRain16 COctRain16 DOctRain16
ENovTemp16 INovTemp16 PNovTemp16 CNovTemp16 DNovTemp16
ENovRain16 INovRain16 PNovRain16 CNovRain16 DNovRain16
EDecTemp16 IDecTemp16 PDecTemp16 CDecTemp16 DDecTemp16
EDecRain16 IDecRain16 PDecRain16 CDecRain16 DDecRain16
*E= Esperanza Ranch, I= Indian Canyon Ranch, P= Pitchfork Ranch, C= Clark Ranch,
and D= Double Fork Ranch.

Texas Tech University, Jessica Mehta, May 2019
39
Table 2.2. List of individual covariates classified by study site used in Program MARK
analysis for 2017 survival estimates. Each study site had a total of 18 covariates. All
covariates were named using the concatenate function in Microsoft Excel, where month,
temperature, precipitation, and name of ranch are abbreviated. *
Esperanza Indian Canyon Pitchfork
EJanTemp17 IJanTemp17 PJanTemp17
EJanRain17 IJanRain17 PJanRain17
EFebTemp17 IFebTemp17 PFebTemp17
EFebRain17 IFebRain17 PFebRain17
EJunTemp17 IJunTemp17 PJunTemp17
EJunRain17 IJunRain17 PJunRain17
EJulTemp17 IJulTemp17 PJulTemp17
EJulRain17 IJulRain17 PJulRain17
EAugTemp17 IAugTemp17 PAugTemp17
EAugRain17 IAugRain17 PAugRain17
ESepTemp17 ISepTemp17 PSepTemp17
ESepRain17 ISepRain17 PSepRain17
EOctTemp17 IOctTemp17 POctTemp17
EOctRain17 IOctRain17 POctRain17
ENovTemp17 INovTemp17 PNovTemp17
ENovRain17 INovRain17 PNovRain17
EDecTemp17 IDecTemp17 PDecTemp17
EDecRain17 IDecRain17 PDecRain17
*E= Esperanza Ranch, I= Indian Canyon Ranch, P= Pitchfork Ranch.

Texas Tech University, Jessica Mehta, May 2019
40
Table 2.3. Statistics for tagged birds by study site on the Rolling Plains of Texas in 2016.
Statistics include the totals for birds alive at the end of the study, birds that died during
the study, birds that were censored from the study, and birds captured per study site.
Fate Esperanza Indian Canyon Clark Pitchfork Double Fork Total
Survived Study 12 10 9 8 6 45
Died 11 4 3 3 3 24
Censored 3 9 9 11 3 35
Total 26 23 21 22 12 104
Table 2.4. Statistics for tagged birds by study site on the Rolling Plains of Texas in 2017.
Statistics include the totals for birds alive at the end of the study, birds that died during
the study, birds that were censored from the study, and birds captured per study site.
Fate Esperanza Indian Canyon Pitchfork Total
Survived Study 4 6 0 10
Died 11 14 1 26
Censored 3 2 0 5
Total 18 22 1 41

Texas Tech University, Jessica Mehta, May 2019
41
Table 2.5. Survival models and corresponding results generated by Program MARK.
Model AICc Delta AICc AICc Weight Model Likelihood No. Par.
Year 985.8418 0.0000 0.1608 1.0000 4
2016 October Rainfall by Ranch 987.8624 2.0206 0.0585 0.3641 7
2016 September Rainfall by Ranch 987.8718 2.0300 0.0583 0.3624 7
2016 December Rainfall by Ranch 988.1791 2.3373 0.0500 0.3108 7
2016 August Rainfall by Ranch 988.2509 2.4091 0.0482 0.2998 7
2016 June Rainfall by Ranch 988.3263 2.4845 0.0464 0.2887 7
2016 January Temperature by Ranch 988.3897 2.5479 0.0450 0.2797 7
2016 December Temperature by Ranch 988.4739 2.6321 0.0431 0.2682 7
2016 February Temperature by Ranch 988.5150 2.6732 0.0422 0.2627 7
2016 November Temperature by Ranch 988.6136 2.7718 0.0402 0.2501 7
2016 October Temperature by Ranch 988.6758 2.8340 0.0390 0.2425 7
2016 July Rainfall by Ranch 988.7142 2.8724 0.0382 0.2378 7
2016 June Temperature by Ranch 988.7150 2.8732 0.0382 0.2377 7
2016 July Temperature by Ranch 988.7153 2.8735 0.0382 0.2377 7
2016 August Temperature by Ranch 988.7161 2.8743 0.0382 0.2376 7
2016 September Temperature by Ranch 988.7178 2.8760 0.0382 0.2374 7

Texas Tech University, Jessica Mehta, May 2019
42
Table 2.6. Beta estimates for the Year survival model. Each parameter is listed with its corresponding beta estimate, standard error,
and 95% confidence intervals. *
* Parameter 2:S represents 2016, and parameter 3:S represents 2017. Parameters 1:S and 4:S are constants.
Parameter Beta Standard Error Lower CI Upper CI
1:S 1.1568054 0.0324956 1.093114 1.2204968
2:S 1.2527639 0.0384048 1.1774905 1.3280372
3:S 0.9773105 0.0609711 0.8578072 1.0968138
4:S 1.1541184 0.0327035 1.0900195 1.2182172
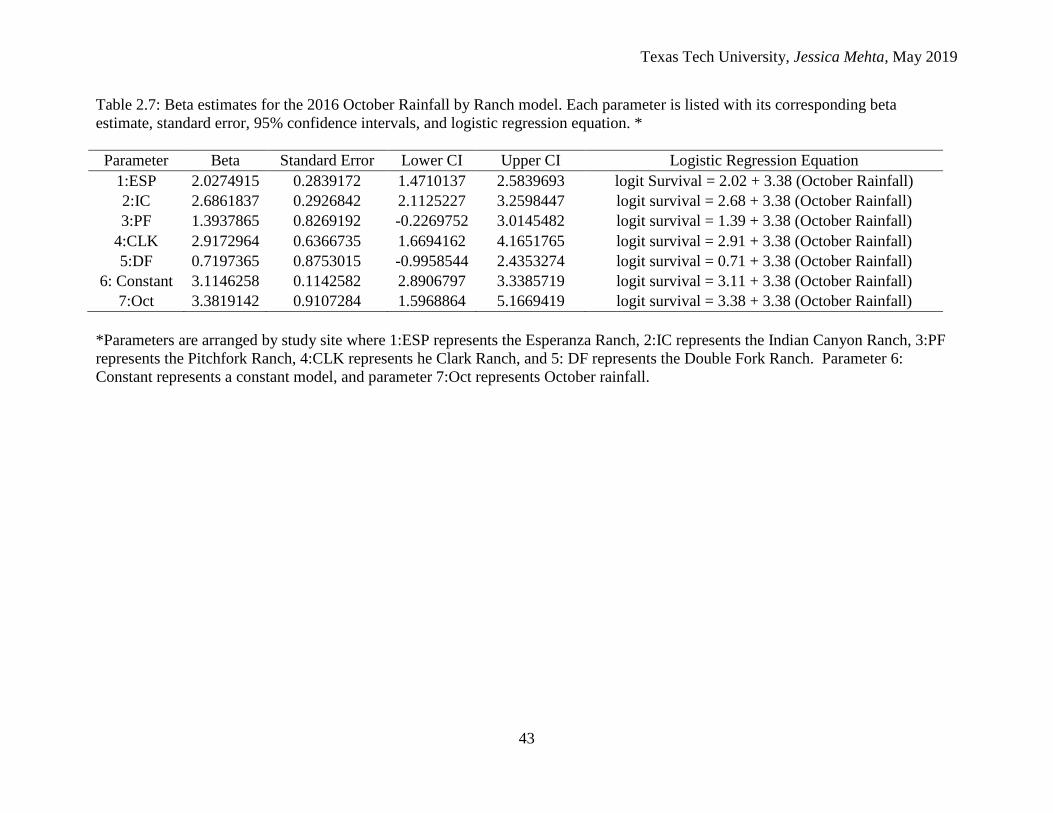
Texas Tech University, Jessica Mehta, May 2019
43
Table 2.7: Beta estimates for the 2016 October Rainfall by Ranch model. Each parameter is listed with its corresponding beta
estimate, standard error, 95% confidence intervals, and logistic regression equation. *
Parameter Beta Standard Error Lower CI Upper CI Logistic Regression Equation
1:ESP 2.0274915 0.2839172 1.4710137 2.5839693 logit Survival = 2.02 + 3.38 (October Rainfall)
2:IC 2.6861837 0.2926842 2.1125227 3.2598447 logit survival = 2.68 + 3.38 (October Rainfall)
3:PF 1.3937865 0.8269192 -0.2269752 3.0145482 logit survival = 1.39 + 3.38 (October Rainfall)
4:CLK 2.9172964 0.6366735 1.6694162 4.1651765 logit survival = 2.91 + 3.38 (October Rainfall)
5:DF 0.7197365 0.8753015 -0.9958544 2.4353274 logit survival = 0.71 + 3.38 (October Rainfall)
6: Constant 3.1146258 0.1142582 2.8906797 3.3385719 logit survival = 3.11 + 3.38 (October Rainfall)
7:Oct 3.3819142 0.9107284 1.5968864 5.1669419 logit survival = 3.38 + 3.38 (October Rainfall)
*Parameters are arranged by study site where 1:ESP represents the Esperanza Ranch, 2:IC represents the Indian Canyon Ranch, 3:PF
represents the Pitchfork Ranch, 4:CLK represents he Clark Ranch, and 5: DF represents the Double Fork Ranch. Parameter 6:
Constant represents a constant model, and parameter 7:Oct represents October rainfall.

Texas Tech University, Jessica Mehta, May 2019
44
Table 2.8: Beta estimates for the 2016 September Rainfall by Ranch model. Each parameter is listed with its corresponding beta
estimate, standard error, 95% confidence intervals, and logistic regression equation.*
Parameter Beta Standard Error Lower CI Upper CI Logistic Regression Equation
1:ESP 2.0774335 0.2852656 1.5183129 2.6365541 logit survival= 2.07 + 0.57 (September Rainfall)
2:IC 2.5972562 0.2940873 2.0208451 3.1736673 logit survival= 2.59 + 0.57 (September Rainfall)
3:PF 1.8489482 0.7742812 0.331357 3.3665395 logit survival= 1.84+ 0.57 (September Rainfall)
4:CLK -1.1274632 1.5213335 -4.1092769 1.8543505 logit survival= -1.12+ 0.57 (September Rainfall)
5:DF 1.5548731 0.7364374 0.1114558 2.9982905 logit survival= 1.55 + 0.57 (September Rainfall)
6: Constant 3.1146258 0.1142582 2.8906797 3.3385719 logit survival= 3.11 + 0.57 (September Rainfall)
7:Sept 0.5757435 0.1620575 0.2581107 0.8933762 logit survival= 0.57 + 0.57 (September Rainfall)
*Parameters are arranged by study site where 1:ESP represents the Esperanza Ranch, 2:IC represents the Indian Canyon Ranch, 3:PF
represents the Pitchfork Ranch, 4:CLK represents the Clark Ranch, and 5: DF represents the Double Fork Ranch. Parameter 6:
Constant represents a constant model, and parameter 7:Sept represents September rainfall.
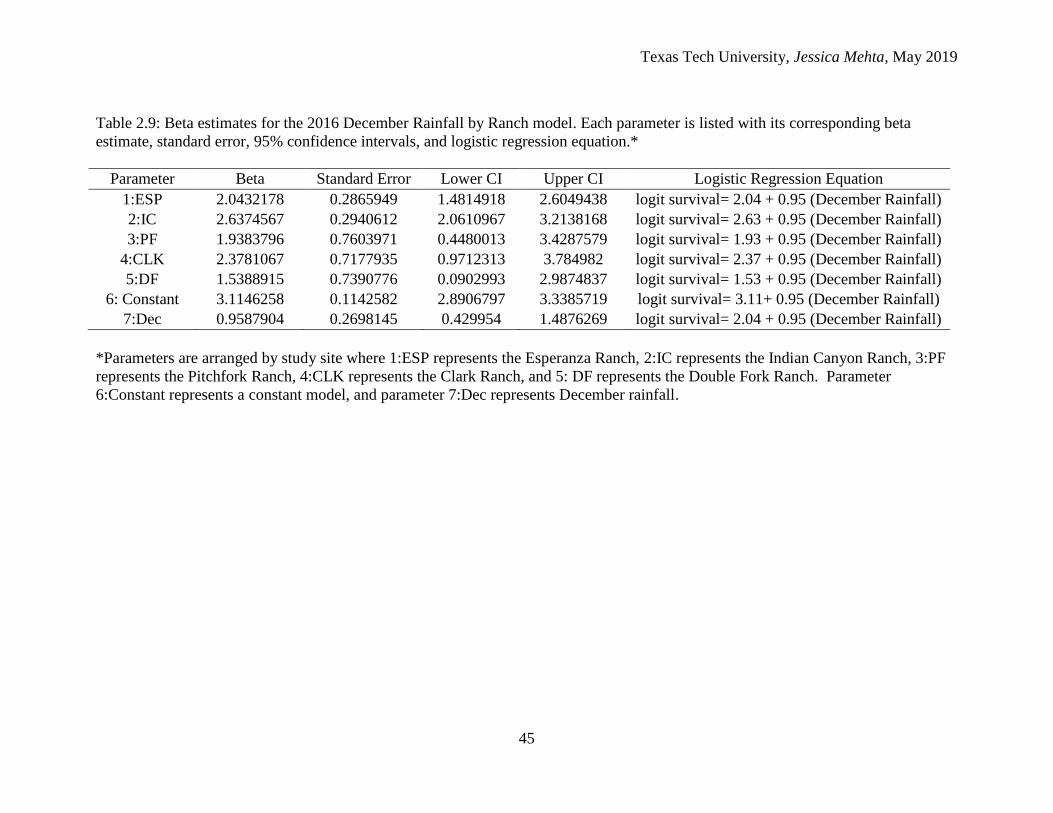
Texas Tech University, Jessica Mehta, May 2019
45
Table 2.9: Beta estimates for the 2016 December Rainfall by Ranch model. Each parameter is listed with its corresponding beta
estimate, standard error, 95% confidence intervals, and logistic regression equation.*
Parameter Beta Standard Error Lower CI Upper CI Logistic Regression Equation
1:ESP 2.0432178 0.2865949 1.4814918 2.6049438 logit survival= 2.04 + 0.95 (December Rainfall)
2:IC 2.6374567 0.2940612 2.0610967 3.2138168 logit survival= 2.63 + 0.95 (December Rainfall)
3:PF 1.9383796 0.7603971 0.4480013 3.4287579 logit survival= 1.93 + 0.95 (December Rainfall)
4:CLK 2.3781067 0.7177935 0.9712313 3.784982 logit survival= 2.37 + 0.95 (December Rainfall)
5:DF 1.5388915 0.7390776 0.0902993 2.9874837 logit survival= 1.53 + 0.95 (December Rainfall)
6: Constant 3.1146258 0.1142582 2.8906797 3.3385719 logit survival= 3.11+ 0.95 (December Rainfall)
7:Dec 0.9587904 0.2698145 0.429954 1.4876269 logit survival= 2.04 + 0.95 (December Rainfall)
*Parameters are arranged by study site where 1:ESP represents the Esperanza Ranch, 2:IC represents the Indian Canyon Ranch, 3:PF
represents the Pitchfork Ranch, 4:CLK represents the Clark Ranch, and 5: DF represents the Double Fork Ranch. Parameter
6:Constant represents a constant model, and parameter 7:Dec represents December rainfall.

Texas Tech University, Jessica Mehta, May 2019
46
Table 2.10: Beta estimates for the 2016 August Rainfall by Ranch model. Each parameter is listed with its corresponding beta
estimate, standard error, 95% confidence intervals, and logistic regression equation.*
Parameter Beta Standard Error Lower CI Upper CI Logistic Regression Equation
1:ESP 2.1670311 0.2845656 1.6092826 2.7247796 logit survival= 2.16 + 0.40 (August Rainfall)
2:IC 2.5448441 0.2939901 1.9686235 3.1210647 logit survival= 2.54 + 0.40 (August Rainfall)
3:PF 1.93012 0.781579 0.3982252 3.4620148 logit survival= 1.93 + 0.40 (August Rainfall)
4:CLK 2.6525212 0.6868725 1.3062511 3.9987913 logit survival= 2.65 + 0.40 (August Rainfall)
5:DF 1.3910456 0.7848429 -0.1472466 2.9293377 logit survival= 1.39 + 0.40 (August Rainfall)
6:Constant 3.1146257 0.1142582 2.8906796 3.3385718 logit survival= 3.11 + 0.40 (August Rainfall)
7:Aug 0.4079835 0.1220823 0.1687021 0.6472649 logit survival= 0.40 + 0.40 (August Rainfall)
*Parameters are arranged by study site where 1:ESP the Esperanza Ranch, 2:IC represents for the Indian Canyon Ranch, 3:PF
represents the Pitchfork Ranch, 4:CLK represents the Clark Ranch, and 5: DF represents the Double Fork Ranch. Parameter 6:
Constant represents a constant model, and parameter 7:Aug represents August rainfall.

Texas Tech University, Jessica Mehta, May 2019
47
Table 2.11: Beta estimates for the 2016 June Rainfall by Ranch model. Each parameter is listed with its corresponding beta estimate,
standard error, 95% intervals, and logistic regression equation.*
Parameter Beta Standard Error Lower CI Upper CI Logistic Regression Equation
1:ESP 2.2315032 0.2808079 1.6811197 2.7818867 logit survival= 2.23 + 1.11 (June Rainfall)
2:IC 2.5275294 0.2935757 1.952121 3.1029377 logit survival= 2.52 + 1.11 (June Rainfall)
3:PF 1.6481892 0.8370231 0.0076239 3.2887546 logit survival= 1.64 + 1.11 (June Rainfall)
4:CLK -0.0483219 1.3272203 -2.6496738 2.55303 logit survival= -0.04 + 1.11 (June Rainfall)
5:DF 1.6900184 0.7335653 0.2522304 3.1278064 logit survival= 1.69 + 1.11 (June Rainfall)
6: Constant 3.1146258 0.1142582 2.8906797 3.3385719 logit survival= 3.11+ 1.11 (June Rainfall)
7:June 1.1178723 0.3406102 0.4502764 1.7854682 logit survival= 1.11 + 1.11 (June Rainfall)
*Parameters are arranged by study site where 1:ESP represents the Esperanza Ranch, 2:IC represents the Indian Canyon Ranch, 3:PF
represents the Pitchfork Ranch, 4:CLK represents the Clark Ranch, and 5: DF represents the Double Fork Ranch. Parameter 6:
Constant represents a constant model, and parameter 7:June represents June rainfall.

Texas Tech University, Jessica Mehta, May 2019
48
Table 2.12. Minimum, maximum, and average home range sizes for radiotagged birds from 2016-2017 by study site. Home range
values are measured in hectares.*
Study Site
2016 Min home
range size (ha)
2016 Max home
range size (ha)
2016 Average home
range size (ha)
2017 Min home
range size (ha)
2017 Max home
range size (Ha)
2017 Average home
range size (ha)
Esperanza 0.05 42.87 8.27 0.18 13.43 6.32
Indian Canyon 0.37 78.74 16.12 0.85 41.36 11.91
Clark 2.79 16.96 7.10 N/A N/A N/A
Pitchfork 8.88 354.57 112.11 N/A N/A N/A
Double Fork 0.03 8.63 3.67 N/A N/A N/A
*No data for Clark, Pitchfork, or Double Fork ranches in 2017.
Table 2.13. Comparison of average adult and juvenile home ranges on the Indian Canyon ranch on the Rolling Plains in 2017. Home
range values are measured in hectares.
Age Class Average Home Range Size (Ha)
Adults 15.11
Juveniles 9.35

Texas Tech University, Jessica Mehta, May 2019
49
Table 2.14: Weekly survival estimates generated by Program MARK for the Year model. Each parameter is listed with its
corresponding beta estimate, standard error, and 95% confidence intervals. *
Parameter Estimate Standard Error Lower CI Upper CI
1:S 0.9577614 0.0065359 0.9429239 0.968869
2:S 0.9749263 0.0060046 0.96004 0.9843573
3:S 0.9144981 0.0170492 0.8746233 0.9425245
4:S 0.9572192 0.006618 0.942198 0.9684675
* Parameter 2:S represents 2016, and parameter 3:S represents 2017. Parameters 1:S and 4:S are constants.
Table 2.15. Weekly survival estimates generated by Program MARK for the 5 competing models. Each estimate is listed with its
corresponding 95% confidence intervals.
Study Site Oct16[CI] Sept16[CI] Dec16[CI] Aug16[CI] June16[CI]
Esperanza 0.91 [0.85-0.94] 0.91 [0.85-0.94] 0.91 [.85-0.94] 0.91 [0.86-0.94] 0.92 [0.86-0.94]
Indian Canyon 0.95 [0.90-0.96] 0.95 [0.90-0.96] 0.95 [0.90-0.96] 0.95 [0.90-0.96] 0.95 [0.90-0.96]
Pitchfork 0.86 [0.57-0.96] 0.90 [0.68-0.97] 0.90 [0.69-0.97] 0.90 [0.69-0.97] 0.88 [0.62-0.97]
Clark 0.95 [0.86-0.98] 0.41 [0.04-0.90] 0.93 [0.78-0.98] 0.94 [0.82-0.98] 0.64 [0.15-0.94]
Double Fork 0.72 [0.33-0.92] 0.84 [0.57-0.95] 0.84 [0.56-0.95] 0.82 [0.94-0.96] 0.86 [0.60-0.96]

Texas Tech University, Jessica Mehta, May 2019
50
Figure 2.1. Location of study sites in relation to Lubbock, Texas.

Texas Tech University, Jessica Mehta, May 2019
51
Figure 2.2. Line graph generated by Program MARK to show the differences between juvenile survival in 2016 and 2017. Parameter
2 represents 2016, and Parameter 3 represents 2017. Parameters 1 and 4 are constants.