copyright 2017 national sporting goods association...copyright 2017 national sporting goods...
TRANSCRIPT

Copyright 2017National Sporting Goods Association
1

Copyright 2017National Sporting Goods Association
2
Sports Participation: 2017 Edition(Sport)
ISSN: 0882-8210
National Sporting Goods Association1601 Feehanville Drive, Suite 300Mount Prospect, IL 60056-6035
Phone: (800) 815-5422 Fax: (847) 391-9827Email: [email protected]
All rights in this document are reserved. No part of this document may be used or reproduced in any manner whatsoever without written permission from the National Sporting Goods Association. For permission or information, please contact the NSGA
Research Department at 800-815-5422 or [email protected].
A Statistical Study of Sports Participation

Copyright 2017National Sporting Goods Association
3
Table of Contents
• Explanation of Contents……………………………………….4▪ Introduction▪ Methodology▪ Data Indicated in the Report
• Participation Overview Snapshots………………………..8▪ Overall Participation▪ Lifecycle Demographics▪ Cross Participation
• Detailed Tables…………………………………………………….20

Copyright 2017National Sporting Goods Association
4
The “Sports Participation in the United States” study is a research program designed to measure the number of individuals seven years of age or older who participated in each of a number of different sports / recreational activities within the previous year.
This study measures the annual number of participants in each sport/activity, the frequency of participation (number of days of participation in 2016), total days of participation, and the mean (average) and median (mid-point) number of days of participation.
This report includes quick-view snapshots and detailed tables related to overall participation, lifecycle demographics, and cross participation. Overall participation is broken out by :
• Gender, Age, and Presence of Children age 18 or under in the household• Male Age, Mean Age, and Education of Male Household Head (if present)• Female Age, Mean Age, and Education of Female Household Head (if present)• Household Income and Market Size• U.S. Census Region and Ethnicity/Race
The Single Sports Detailed Tables are generated for selected demographics, including gender, age, mean, and median ages by gender and frequency of participation, education of male and female household heads (if present), household income, market size, U.S. census region, and ethnicity/race.
The data reported for ethnicity/race should be used only to rank sport/activity participation within that ethnic group/race. Due to sampling constraints, it is inappropriate to subtract this data from the total in order to arrive at participation numbers for non-African American or non-Hispanic participants.
Introduction

Copyright 2017National Sporting Goods Association
5
SamplingAn online panel maintained by Survey Sampling International (SSI) was used. The panel is balanced on a number of characteristics determined to be key indicators of general purchase behavior, including household size and composition, household income, age of household head, region, and market size. Due to the online methodology African Americans and Hispanics are somewhat underrepresented in the sample.
2010 marks the first year that an online survey methodology was used for collecting data on sports participation. Prior to 2010, this annual study was conducted using a mailback survey methodology. Readers should keep this in mind when making direct comparisons between 2010 and data published prior to 2010.
QuestionnaireIn January 2017, sample members of the SSI panel were invited to complete the sports participation survey online. Respondents were asked to identify other household members ages seven or older, indicate their age and gender, and provide the number of days of participation for each sport/activity in 2016.
ReturnsThe study results are based on approximately 34,000 individuals who are ages 7 and older.
In order to ensure returns were representative of the U.S., the data was weighted to represent the demographic composition of the U.S. based on the following characteristics: state of residence, household income, and population density.
The returns were then projected to 293,474,000 - the U.S. population age 7 and older in 2016. An 816-cell age/gender/state weight matrix was used to project the weighted sample to represent the actual age and gender distribution by state of the U.S. population.
Methodology

Copyright 2017National Sporting Goods Association
6
ParticipantsA participant is defined as an individual seven years of age or older who participates in a sport/activity at least two days in a given year for all sports/activities except aerobic exercising, bicycle riding, exercise walking, exercise with equipment, running/jogging, swimming, weightlifting, and work out at club/gym/fitness studio. For these fitness activities, participation is defined as six days or more during the year.
The definition of "Frequent", "Occasional" and "Infrequent" participants varies for each sport/activity and is indicated in the report. For sports/activities where the incidence of participation is low, participants may be divided into "Frequent" and "Occasional" only.
Geographic TablesThe tables in this report show the demographic distribution of participants for each sport by geographic region. The states in the geographic regions are:
Data Indicated in the Report
East West East West
New Middle North North South South South
England Atlantic Central Central Atlantic Central Central Mountain Pacific
CT NJ IL IA DE AL AR AZ CA
ME NY IN KS FL KY LA CO OR
MA PA MI MN GA MS OK ID WA
NH OH MO MD TN TX MT AK
RI WI NE NC NV HI
VT ND SC NM
SD VA UT
WV WY
DC

Copyright 2017National Sporting Goods Association
7
Data Indicated in the Report (cont’d)
Lifecycle SegmentsThe LifeCycle segments used in this report are:
• Affluent Singles: single head of household, under 65, top third in per capita income• Low/Middle Income Singles: single head of household, under 65, bottom two-thirds in per capita income• Double Income with No Kids (DINKS): two heads of household, under 45, both employed, without children• Working Parents: two heads of household, under 65, both employed, with children• Single Parents: single head of household (usually female), under 65, with children• Affluent Traditional Families: two heads of household, under 65, one spouse employed, with children under
18, top third in per capita income• Low/Middle Income Traditional Families: two heads of household, under 65, one spouse employed, with
children under 18, bottom two-thirds in per capita income• Affluent Empty Nesters: middle-aged, no children under 18 in household, top third in per capita income• Low/Middle Income Empty Nesters: middle-aged, no children under 18 in household, bottom two-thirds in per
capita income• Seniors (Age 65+): Female Head (Male Head if Female Head is not present) is 65 or over

Copyright 2017National Sporting Goods Association
8
Participation OverviewSnapshots
Copyright 2017National Sporting Goods Association
9
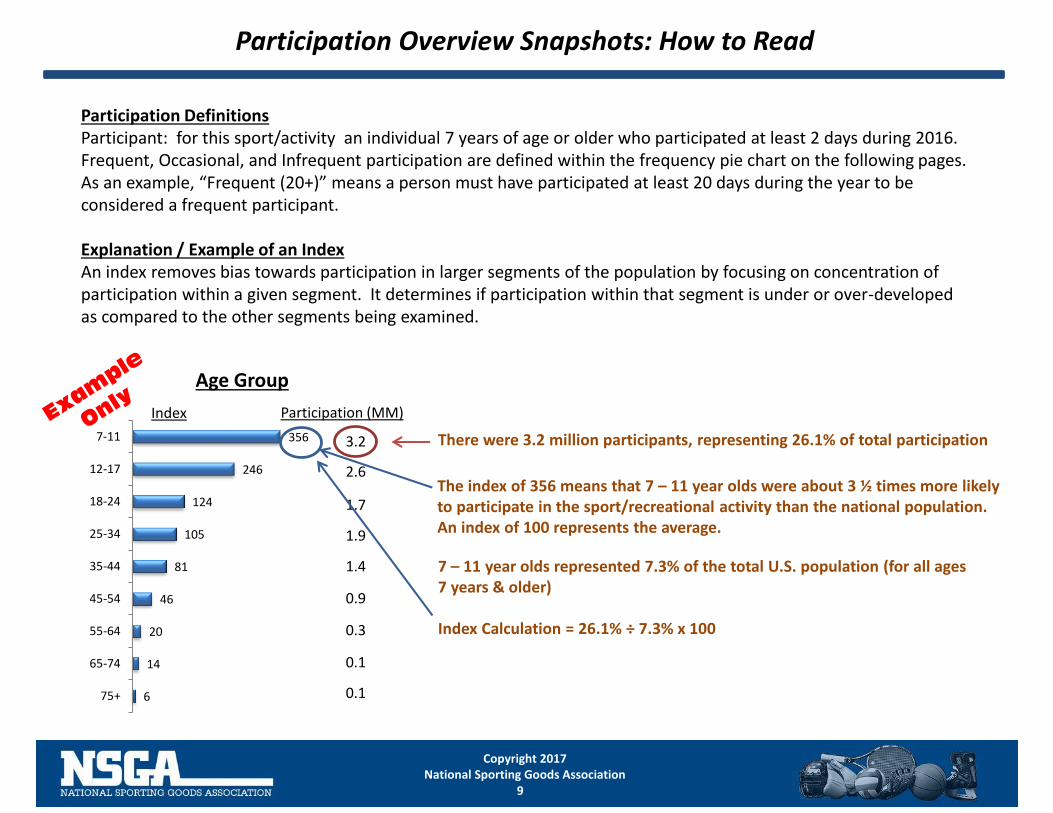
Participation DefinitionsParticipant: for this sport/activity an individual 7 years of age or older who participated at least 2 days during 2016. Frequent, Occasional, and Infrequent participation are defined within the frequency pie chart on the following pages. As an example, “Frequent (20+)” means a person must have participated at least 20 days during the year to be considered a frequent participant.
Explanation / Example of an IndexAn index removes bias towards participation in larger segments of the population by focusing on concentration of participation within a given segment. It determines if participation within that segment is under or over-developed as compared to the other segments being examined.
Participation Overview Snapshots: How to Read
3.2
Participation (MM)Index
Age Group
2.6
1.7
1.9
1.4
0.9
0.3
0.1
0.16
14
20
46
81
105
124
246
356
75+
65-74
55-64
45-54
35-44
25-34
18-24
12-17
7-11 There were 3.2 million participants, representing 26.1% of total participation
The index of 356 means that 7 – 11 year olds were about 3 ½ times more likely to participate in the sport/recreational activity than the national population. An index of 100 represents the average.
7 – 11 year olds represented 7.3% of the total U.S. population (for all ages 7 years & older)
Index Calculation = 26.1% ÷ 7.3% x 100

Copyright 2017National Sporting Goods Association
10
Sport Participation Overview Snapshot #1
Total Participation• In 2016 there were 12.6 million sport participants in
the U.S.• 7.6 million (60%) were male• 5.0 million (40%) were female
Frequency of Participation• 11.8% were frequent participants
(participated 20 or more days during 2016)• 44.2% were occasional participants
(participated 5 – 19 days during 2016)• 44.1% were infrequent participants
(participated 2 – 4 days during 2016)
Frequent (20+)11.8%
Occasional (5-19)44.2%
Infrequent (2-4)
44.1%
Frequency of Participation
13.0 13.012.3
11.1 11.6 11.712.2 12.0 12.3 12.6
7.6 7.4 7.0 7.2 6.9 6.8 6.7 6.87.6 7.6
5.4 5.6 5.23.9
4.6 4.95.5 5.2 4.7 5.0
2007 2008 2009 2010 2011 2012 2013 2014 2015 2016
Participation (in millions)
Total Participation Male Participation Female Participation
Copyright 2017National Sporting Goods Association
11
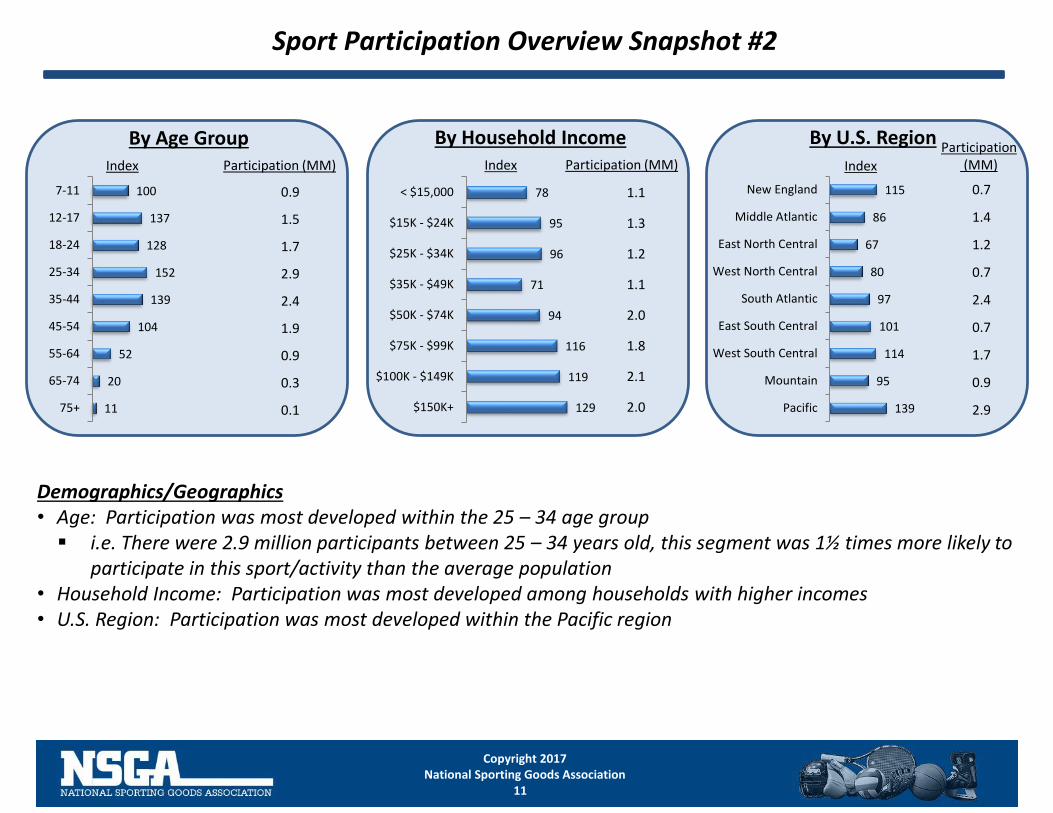
Demographics/Geographics• Age: Participation was most developed within the 25 – 34 age group▪ i.e. There were 2.9 million participants between 25 – 34 years old, this segment was 1½ times more likely to
participate in this sport/activity than the average population• Household Income: Participation was most developed among households with higher incomes• U.S. Region: Participation was most developed within the Pacific region
Sport Participation Overview Snapshot #2
139
95
114
101
97
80
67
86
115
Pacific
Mountain
West South Central
East South Central
South Atlantic
West North Central
East North Central
Middle Atlantic
New England
129
119
116
94
71
96
95
78
$150K+
$100K - $149K
$75K - $99K
$50K - $74K
$35K - $49K
$25K - $34K
$15K - $24K
< $15,0000.9
1.5
1.7
2.9
2.4
1.9
0.9
0.3
0.111
20
52
104
139
152
128
137
100
75+
65-74
55-64
45-54
35-44
25-34
18-24
12-17
7-11
Participation (MM)Index
By Household Income By U.S. RegionParticipation
(MM)Index
1.1
1.3
1.2
1.1
2.0
1.8
2.1
2.0
0.7
1.4
1.2
0.7
2.4
0.7
1.7
0.9
2.9
Index
By Age GroupParticipation (MM)
Copyright 2017National Sporting Goods Association
12
Lifecycle DemographicSnapshots

Copyright 2017National Sporting Goods Association
13
Lifecycle Demographics: Segments
Segment Definitions
• Affluent Singles: single head of household, under 65, top third in per capita income
• Low/Middle Income Singles: single head of household, under 65, bottom two-thirds in per capita income
• Double Income with No Kids (DINKS): two heads of household, under 45, both employed, without children
• Working Parents: two heads of household, under 65, both employed, with children
• Single Parents: single head of household (usually female), under 65, with children
• Affluent Traditional Families: two heads of household, under 65, one spouse employed, with children under
18, top third in per capita income
• Low/Middle Income Traditional Families: two heads of household, under 65, one spouse employed, with
children under 18, bottom two-thirds in per capita income
• Affluent Empty Nesters: middle-aged, no children under 18 in household, top third in per capita income
• Low/Middle Income Empty Nesters: middle-aged, no children under 18 in household, bottom two-thirds in per
capita income
• Seniors (Age 65+): Female Head (Male Head if Female Head is not present) is 65 or over

Copyright 2017National Sporting Goods Association
14
73 63
102
206 194
162 155
61
18 6
Sport
6.8%
4.9%
13.6%
8.6%8.5% 8.6%8.8%
18.2%
9.7%
18.8%
10.4%
16.8%
10.1%
15.7%
10.2%
6.2%6.8%
1.2%
15.1%
0.9%
Total U.S. Population (Ages 7+) Sport
Lifecycle Demographics Snapshots: How to Read
Lifecycle Demographics Snapshot #1: Participation Index Provides a view of participation through use of an index. An index removes bias towards participation in larger segments of the population by focusing on concentration of participation within a given segment. It determines if participation within that segment is under or over-developed as compared to the other segments being examined.
Lifecycle Demographics Snapshot #2: % of ParticipationProvides a view of participation as a % of total U.S. population.
The index of 194 indicates that this segment was almost 2 times more likely to participate in the sport/activity than the national population. An index of 100 represents the average.
This segment represented 9.7% of the total U.S. population (ages 7+)
This segment represented 18.8% of this sport’s participation
The index is calculated by using the example data in the charts below: 18.8% ÷ 9.7% *100 = 194

Copyright 2017National Sporting Goods Association
15
Sport Lifecycle Demographics Snapshot #1
152
185
165
130
140
114
127
161
117
144
99
127
78
63
88
71
143
104
160
137141
97
121
173
102
162
100
88
71
129
79
4847
76
59
29
18
13
29
8
Total Sport Frequent Occasional Infrequent
Affluent Singles Low / Mid Income Singles DINKS Working Parents Single Parents
Affluent Families Low / Mid Income Families Affluent Empty Nesters Low / Mid Empty Nesters Age 65+
Index to Total U.S. Population (Ages 7+)
Sport Participants = XX,XXX,XXX

Copyright 2017National Sporting Goods Association
16
Sport Lifecycle Demographics Snapshot #2
Distribution of Participation
Sport Participants = XX,XXX,XXX
6.1%
9.2%
11.2%
10.0%
7.9%
16.3%
22.9%
18.6%
20.7%
26.3%
10.9%
12.7%
15.7%
10.7%
13.9%
9.6%
7.5%
6.1%
8.5%
6.8%
9.9%
14.2%
10.3%
15.9%
13.6%
10.7%
15.0%
10.4%
12.9%
18.4%
8.0% 8.2%
13.0%
8.0%
7.0%
6.3%
4.5%
8.2%
5.0%
3.1%
5.9%
2.8%
4.4%
3.4%
1.7%
16.3%
3.0%
2.2%
4.8%
1.4%
Total U.S. Population (Ages 7+) Total Sport Frequent Occasional Infrequent
Affluent Singles Low / Mid Income Singles DINKS Working Parents Single Parents
Affluent Families Low / Mid Income Families Affluent Empty Nesters Low / Mid Empty Nesters Age 65+

Copyright 2017National Sporting Goods Association
17
Cross ParticipationSnapshot

Copyright 2017National Sporting Goods Association
18
How to Read Cross Participation Data:
Cross Participation Snapshot: How to Read
The index of 283 indicates participants in Sport Z were almost 3 times more likely to also participate in Sport A.
The index is calculated in the following manner: 46.4% ÷ 16.4% *100 = 283
16.4% of the U.S. population (7 years of age or older) participated in Sport A
46.4% of participants in Sport Z also participated in Sport A
Sport Z
An index of 100 represents the average.

Copyright 2017National Sporting Goods Association
19
Sport Cross Participation
Sport Cross Participation
Including Index vs. Total U.S. Participation
Sport Participants = XX,XXX,XXX
% Participating In… % Participating In… IndexTotal U.S.
Participation
17.0%
18.8%
19.2%
19.8%
21.2%
21.6%
23.1%
24.4%
24.8%
27.9%
28.3%
28.3%
32.9%
35.0%
35.4%
38.3%
38.6%
40.7%
46.4%
47.6%
48.0%
50.4%
67.2%
67.9%
69.7%
Football (Touch)
Fishing (Salt Water)
Dart Throwing
Kayaking
Golf
Yoga
Baseball
Canoeing
Work Out At Club/Gym/Fitness…
Boating (Motor/Power)
Target Shooting (Live Ammo)
Basketball
Weightlifting
Aerobic Exercising
Hunting w/Firearms
Running/Jogging
Billiards/Pool
Swimming
Bowling
Bicycle Riding
Fishing (Fresh Water)
Exercising with Equipment
Camping (Vacation/Overnight)
Hiking
Exercise Walking
4.9%
5.3%
6.1%
6.3%
7.3%
7.5%
7.6%
7.9%
8.0%
8.2%
8.8%
9.6%
10.5%
10.5%
12.0%
12.4%
12.6%
13.2%
13.5%
13.6%
14.0%
14.4%
15.4%
15.6%
16.0%
Wrestling
Boxing
Pilates
Hockey (Ice)
Lacrosse
Water Skiing
Snowboarding
Martial Arts/MMA/Tae Kwon Do
Skiing (Alpine)
Archery (Target)
Target Shooting (Airgun)
Gymnastics
Skateboarding
In-line Roller Skating
Football (Flag)
Ice/Figure Skating
Football (Tackle)
Hunting w/Bow & Arrow
Paintball Games
Soccer
Tennis
Softball
Volleyball
Table Tennis
Mountain Biking (Off Road)
IndexTotal U.S.
Participation
36.0%
14.6%
13.8%
19.5%
9.9%
12.3%
11.8%
15.5%
7.2%
15.3%
6.1%
15.5%
12.1%
8.4%
7.0%
4.9%
12.9%
2.7%
4.1%
10.3%
6.3%
3.3%
3.2%
3.1%
3.1%
193
464
488
259
487
386
393
262
533
250
577
225
272
336
406
568
193
900
556
209
337
605
592
605
541
2.0%
3.5%
3.6%
3.3%
4.3%
4.8%
1.8%
2.0%
2.7%
2.6%
2.3%
1.6%
1.8%
2.1%
1.7%
2.8%
2.0%
2.1%
1.4%
1.2%
1.0%
1.1%
1.9%
1.2%
1.0%
817
448
424
439
325
284
743
664
468
475
530
673
572
460
511
290
407
374
559
613
722
552
324
435
482

Copyright 2017National Sporting Goods Association
20
DetailedTables

Copyright 2017National Sporting Goods Association
21
How to Read
Example
= + + + + + + + +Read HorizontallyRead Vertically
How to Read:Most data sets have three rows:
- Row 1: total participation for that segment (i.e. 2.4 million participants are males between 12-17 yrs. old)- Row 2: read vertically (i.e. 26.5% of male participants are frequent participants, 53.9% are occasionals, and 19.6% are infrequents)- Row 3: read horizontally (i.e. 30.4% of the 2.9 million frequent male participants are between 7-11 yrs. old; 30.4% / 88.5% = 34.4% of frequent male
participants are between 7-11 yrs. old)
Example
Only

Copyright 2017National Sporting Goods Association
22
Sport NSGA Sports Participation January-December 2016 (presented in '000)
Male Age Male Head Education
Total Total Male 7-11 12-17 18-24 25-34 35-44 45-54 55-64 65-74 75+ Mean Age Median
Age
Not HS
Grad
HS Grad Coll Grad
Total Participants 12555 7600 402 837 980 1766 1564 1163 565 300 23 34.69 33.00 110 3408 6344
100.0 100.0 100.0 100.0 100.0 100.0 100.0 100.0 100.0 100.0 100.0 100.0 100.0 100.0
100.0 60.5 3.2 6.7 7.8 14.1 12.5 9.3 4.5 2.4 0.2 0.9 27.1 50.5
Frequent (20+) 1477 744 40 102 147 64 176 116 68 15 17 34.47 35.00 3 385 664
11.8 9.8 10.1 12.2 15.0 3.6 11.2 9.9 12.0 5.1 72.4 2.8 11.3 10.5
100.0 50.4 2.7 6.9 9.9 4.3 11.9 7.8 4.6 1.0 1.1 0.2 26.1 44.9
Occasional (5 to 19) 5543 3558 150 374 331 852 603 678 307 256 6 37.32 35.00 25 1400 3121
44.2 46.8 37.4 44.7 33.8 48.2 38.5 58.3 54.4 85.1 27.6 22.4 41.1 49.2
100.0 64.2 2.7 6.7 6.0 15.4 10.9 12.2 5.5 4.6 0.1 0.4 25.3 56.3
Infrequent (2 to 4) 5535 3299 211 361 502 851 786 369 190 29 -- 31.90 31.00 83 1623 2559
44.1 43.4 52.6 43.2 51.2 48.2 50.2 31.7 33.6 9.7 -- 74.8 47.6 40.3
100.0 59.6 3.8 6.5 9.1 15.4 14.2 6.7 3.4 0.5 -- 1.5 29.3 46.2
Mean number of days 7.88 7.52 6.81 7.62 8.31 5.33 8.27 7.83 9.18 9.53 16.42 -- -- 4.54 7.73 7.79
Median number of days 5.00 5.00 3.00 5.00 4.00 5.00 4.00 6.00 7.00 10.00 20.00 -- -- 4.00 5.00 5.00
PARTICIPATION
Days of participation 98894 57129 2734 6372 8139 9412 12941 9106 5186 2860 378 -- -- 501 26334 49393
1 day only 2516 1368 53 143 303 240 318 179 86 45 -- -- -- 18 700 1070
Males: Age/Education Including Frequency of Participation

Copyright 2017National Sporting Goods Association
23
Sport NSGA Sports Participation January-December 2016 (presented in '000)
Female Age Female Head Education
Total Total
Female
7-11 12-17 18-24 25-34 35-44 45-54 55-64 65-74 75+ Mean Age Median
Age
Not HS
Grad
HS Grad Coll Grad
Total Participants 12555 4955 482 633 733 1107 854 755 341 20 30 31.68 30.00 253 2430 4903
100.0 100.0 100.0 100.0 100.0 100.0 100.0 100.0 100.0 100.0 100.0 100.0 100.0 100.0
100.0 39.5 3.8 5.0 5.8 8.8 6.8 6.0 2.7 0.2 0.2 2.0 19.4 39.0
Frequent (20+) 1477 733 33 35 82 171 172 135 106 -- -- 37.41 37.00 22 261 681
11.8 14.8 6.7 5.5 11.3 15.5 20.1 17.9 31.0 -- -- 8.5 10.7 13.9
100.0 49.6 2.2 2.3 5.6 11.6 11.6 9.1 7.1 -- -- 1.5 17.7 46.1
Occasional (5 to 19) 5543 1986 154 432 279 354 261 317 186 4 -- 31.19 29.00 63 1022 2004
44.2 40.1 31.9 68.2 38.0 32.0 30.5 42.0 54.5 18.1 -- 24.9 42.1 40.9
100.0 35.8 2.8 7.8 5.0 6.4 4.7 5.7 3.3 0.1 -- 1.1 18.4 36.2
Infrequent (2 to 4) 5535 2236 296 167 372 581 422 303 50 17 30 30.23 29.00 168 1147 2217
44.1 45.1 61.4 26.3 50.7 52.5 49.4 40.1 14.6 81.9 100.0 66.6 47.2 45.2
100.0 40.4 5.3 3.0 6.7 10.5 7.6 5.5 0.9 0.3 0.5 3.0 20.7 40.1
Mean number of days 7.88 8.43 7.03 8.57 7.55 6.97 9.90 8.80 13.10 3.50 2.00 -- -- 5.19 7.60 7.92
Median number of days 5.00 5.00 4.00 5.00 4.00 4.00 5.00 7.00 10.00 3.00 2.00 -- -- 2.00 5.00 5.00
PARTICIPATION
Days of participation 98894 41765 3388 5427 5536 7720 8452 6644 4467 72 60 -- -- 1312 18476 38846
1 day only 2516 1148 40 57 249 430 174 101 48 48 -- -- -- 24 473 1038
Females: Age/Education Including Frequency of Participation

Copyright 2017National Sporting Goods Association
24
Sport NSGA Sports Participation January-December 2016 (presented in '000)
Household Income Market Size
Total Under $15,000- $25,000- $35,000- $50,000- $75,000- $100,000- Non-Cbsa/
$15,000 $24,999 $34,999 $49,999 $74,999 $99,999 $149,999 $150,000+ CSA < 100K 100K- 499K 500K- 1.9M 2M & Over
Total Participants 12555 1129 1258 1206 1137 1972 1759 2111 1985 1842 2060 2127 6526
100.0 100.0 100.0 100.0 100.0 100.0 100.0 100.0 100.0 100.0 100.0 100.0 100.0
100.0 9.0 10.0 9.6 9.1 15.7 14.0 16.8 15.8 14.7 16.4 16.9 52.0
Frequent (20+) 1477 181 212 87 136 243 183 295 141 202 342 218 715
11.8 16.0 16.9 7.2 11.9 12.3 10.4 14.0 7.1 11.0 16.6 10.3 11.0
100.0 12.2 14.4 5.9 9.2 16.4 12.4 20.0 9.5 13.7 23.2 14.8 48.4
Occasional (5 to 19) 5543 355 528 522 459 994 847 971 868 1080 852 1048 2563
44.2 31.4 42.0 43.3 40.4 50.4 48.1 46.0 43.7 58.6 41.4 49.3 39.3
100.0 6.4 9.5 9.4 8.3 17.9 15.3 17.5 15.7 19.5 15.4 18.9 46.2
Infrequent (2 to 4) 5535 594 517 597 542 735 730 844 976 560 866 861 3248
44.1 52.6 41.1 49.5 47.7 37.3 41.5 40.0 49.2 30.4 42.0 40.5 49.8
100.0 10.7 9.3 10.8 9.8 13.3 13.2 15.3 17.6 10.1 15.6 15.6 58.7
Mean number of days 7.88 8.91 9.04 6.89 7.76 7.92 8.41 8.10 6.47 8.37 9.35 7.64 7.35
Median number of days 5.00 3.00 5.00 5.00 5.00 5.00 5.00 5.00 5.00 5.00 5.00 5.00 5.00
PARTICIPATION
Days of participation 98894 10063 11371 8309 8822 15606 14786 17086 12851 15412 19255 16263 47964
1 day only 2516 282 215 321 198 365 399 402 334 384 332 457 1343
Household Income Including Frequency of Participation

Copyright 2017National Sporting Goods Association
25
Sport NSGA Sports Participation January-December 2016 (presented in '000)
U.S. Region Ethnicity/Race
Total New England Middle
Atlantic
East North
Central
West North
Central
South
Atlantic
East South
Central
West South
Central
Mountain Pacific African-
American
Hispanic
Total Participants 12555 674 1398 1233 658 2414 747 1713 864 2853 1020 1876
100.0 100.0 100.0 100.0 100.0 100.0 100.0 100.0 100.0 100.0 100.0 100.0
100.0 5.4 11.1 9.8 5.2 19.2 6.0 13.6 6.9 22.7 8.1 14.9
Frequent (20+) 1477 54 179 163 70 269 164 196 124 258 21 348
11.8 8.0 12.8 13.2 10.7 11.1 22.0 11.4 14.3 9.0 2.0 18.5
100.0 3.7 12.2 11.0 4.8 18.2 11.1 13.2 8.4 17.4 1.4 23.5
Occasional (5 to 19) 5543 378 609 552 378 1062 319 554 464 1228 304 785
44.2 56.1 43.6 44.8 57.4 44.0 42.6 32.3 53.7 43.0 29.8 41.8
100.0 6.8 11.0 10.0 6.8 19.2 5.7 10.0 8.4 22.2 5.5 14.2
Infrequent (2 to 4) 5535 242 609 518 210 1084 264 964 276 1368 696 744
44.1 35.9 43.6 42.0 31.9 44.9 35.4 56.3 31.9 47.9 68.2 39.6
100.0 4.4 11.0 9.4 3.8 19.6 4.8 17.4 5.0 24.7 12.6 13.4
Mean number of days 7.88 7.24 8.37 8.95 8.48 7.76 9.64 6.74 8.75 7.23 5.00 8.46
Median number of days 5.00 5.00 5.00 5.00 5.00 5.00 6.00 3.00 5.00 5.00 3.00 5.00
PARTICIPATION
Days of participation 98894 4877 11701 11040 5579 18742 7205 11549 7562 20638 5100 15871
1 day only 2516 113 358 413 31 402 100 365 215 520 227 451
U.S. Region Including Frequency of Participation

Copyright 2017National Sporting Goods Association
26
Lifecycle Demographics Including Frequency of Participation
Sport NSGA Sports Participation January-December 2016 (presented in '000)
Lifecycle
Total Affluent
Singles
Low/Mid
Income
Singles
Dinks Working
Parents
Single
Parents
Affluent
Families
Low/Mid
Income
Families
Affluent
Empty
Nesters
Low/Mid
Empty
Nesters
Age 65+
Total Population 293474 17841 47941 31919 28292 29099 31317 23501 18596 17205 47761
100.0 100.0 100.0 100.0 100.0 100.0 100.0 100.0 100.0 100.0 100.0
100.0 6.1 16.3 10.9 9.6 9.9 10.7 8.0 6.3 5.9 16.3
Sport
Total Participants 12555 1158 2877 1593 939 1783 1889 1026 567 350 374
100.0 100.0 100.0 100.0 100.0 100.0 100.0 100.0 100.0 100.0 100.0
100.0 9.2 22.9 12.7 7.5 14.2 15.0 8.2 4.5 2.8 3.0
Frequent (20+) 1477 166 275 232 90 152 153 191 120 66 32
11.8 14.3 9.6 14.5 9.6 8.5 8.1 18.6 21.3 18.8 8.6
100.0 11.2 18.6 15.7 6.1 10.3 10.4 13.0 8.2 4.4 2.2
Occasional (5 to 19) 5543 556 1148 595 471 880 715 446 276 191 266
44.2 48.0 39.9 37.3 50.2 49.3 37.9 43.5 48.8 54.7 71.1
100.0 10.0 20.7 10.7 8.5 15.9 12.9 8.0 5.0 3.4 4.8
Infrequent (2 to 4) 5535 436 1454 767 378 751 1020 389 170 93 76
44.1 37.7 50.6 48.1 40.3 42.1 54.0 37.9 30.0 26.6 20.3
100.0 7.9 26.3 13.9 6.8 13.6 18.4 7.0 3.1 1.7 1.4

Copyright 2017National Sporting Goods Association
27
Lifecycle Demographics Including Gender and Age
SEGMENT BY SPORT BY DEMOGRAPHICS - Sport NSGA Sports Participation January-December 2016 (presented in '000)
Lifecycle
Total Affluent
Singles
Low/Mid
Income
Singles
Dinks Working
Parents
Single
Parents
Affluent
Families
Low/Mid
Income
Families
Affluent
Empty
Nesters
Low/Mid
Empty
Nesters
Age 65+
Total Participants 12555 1158 2877 1593 939 1783 1889 1026 567 350 374
100.0 100.0 100.0 100.0 100.0 100.0 100.0 100.0 100.0 100.0 100.0
100.0 9.2 22.9 12.7 7.5 14.2 15.0 8.2 4.5 2.8 3.0Gender
Male 7600 757 2211 794 614 851 995 529 306 220 323
60.5 65.4 76.9 49.8 65.4 47.7 52.7 51.5 54.1 62.9 86.5
100.0 10.0 29.1 10.4 8.1 11.2 13.1 7.0 4.0 2.9 4.3
Female 4955 401 666 800 325 932 894 497 260 130 50
39.5 34.6 23.1 50.2 34.6 52.3 47.3 48.5 45.9 37.1 13.5
100.0 8.1 13.4 16.1 6.6 18.8 18.0 10.0 5.3 2.6 1.0Age
7-11 884 -- -- -- 76 370 269 169 -- -- --
7.0 -- -- -- 8.1 20.7 14.3 16.5 -- -- --
100.0 -- -- -- 8.6 41.8 30.5 19.1 -- -- --
12-17 1470 -- -- -- 134 568 512 255 -- -- --
11.7 -- -- -- 14.3 31.9 27.1 24.8 -- -- --
100.0 -- -- -- 9.1 38.7 34.8 17.3 -- -- --
18-24 1713 48 699 451 178 184 72 81 -- -- --
13.6 4.1 24.3 28.3 18.9 10.3 3.8 7.9 -- -- --
100.0 2.8 40.8 26.3 10.4 10.7 4.2 4.8 -- -- --
25-34 2873 431 695 687 211 208 449 192 -- -- --
22.9 37.2 24.2 43.1 22.4 11.7 23.8 18.7 -- -- --
100.0 15.0 24.2 23.9 7.3 7.2 15.6 6.7 -- -- --
35-44 2419 323 629 456 169 248 397 198 -- -- --
19.3 27.9 21.9 28.6 18.0 13.9 21.0 19.3 -- -- --
100.0 13.3 26.0 18.8 7.0 10.2 16.4 8.2 -- -- --
45-54 1918 268 437 -- 159 175 175 110 336 259 --
15.3 23.2 15.2 -- 16.9 9.8 9.2 10.8 59.2 74.1 --
100.0 14.0 22.8 -- 8.3 9.1 9.1 5.8 17.5 13.5 --
55-64 906 88 417 -- 13 31 16 20 231 91 --
7.2 7.6 14.5 -- 1.4 1.7 0.8 1.9 40.8 25.9 --
100.0 9.8 46.0 -- 1.4 3.4 1.7 2.2 25.5 10.0 --
65-74 321 -- -- -- -- -- -- -- -- -- 321
2.6 -- -- -- -- -- -- -- -- -- 85.8
100.0 -- -- -- -- -- -- -- -- -- 100.0
75+ 53 -- -- -- -- -- -- -- -- -- 53
0.4 -- -- -- -- -- -- -- -- -- 14.2
100.0 -- -- -- -- -- -- -- -- -- 100.0

Copyright 2017National Sporting Goods Association
28
Lifecycle Demographics Including Region and Metro Market Size
SEGMENT BY SPORT BY DEMOGRAPHICS - Sport NSGA Sports Participation January-December 2016 (presented in '000)
Lifecycle
Total Affluent
Singles
Low/Mid
Income
Singles
Dinks Working
Parents
Single
Parents
Affluent
Families
Low/Mid
Income
Families
Affluent
Empty
Nesters
Low/Mid
Empty
Nesters
Age 65+
Region
New England 674 95 212 80 40 117 45 20 20 19 25
5.4 8.2 7.4 5.0 4.3 6.6 2.4 1.9 3.5 5.4 6.7
100.0 14.2 31.5 11.9 6.0 17.4 6.6 2.9 3.0 2.8 3.7
Middle Atlantic 1398 208 141 145 114 248 220 118 153 36 15
11.1 18.0 4.9 9.1 12.2 13.9 11.6 11.5 27.0 10.2 4.1
100.0 14.9 10.1 10.4 8.2 17.8 15.7 8.5 10.9 2.6 1.1
East North Central 1233 94 321 138 143 105 77 207 73 30 46
9.8 8.1 11.2 8.6 15.3 5.9 4.1 20.2 12.8 8.5 12.2
100.0 7.6 26.1 11.2 11.6 8.5 6.2 16.8 5.9 2.4 3.7
West North Central 658 15 189 106 53 153 43 38 31 2 26
5.2 1.3 6.6 6.6 5.7 8.6 2.3 3.7 5.5 0.5 7.0
100.0 2.3 28.7 16.1 8.1 23.3 6.6 5.8 4.8 0.3 4.0
South Atlantic 2414 131 483 217 113 337 719 157 117 77 63
19.2 11.3 16.8 13.6 12.0 18.9 38.1 15.3 20.6 21.9 16.8
100.0 5.4 20.0 9.0 4.7 14.0 29.8 6.5 4.8 3.2 2.6
East South Central 747 18 290 63 9 84 171 105 7 -- --
6.0 1.6 10.1 4.0 1.0 4.7 9.0 10.2 1.3 -- --
100.0 2.4 38.8 8.5 1.2 11.2 22.9 14.1 1.0 -- --
West South Central 1713 202 185 313 331 282 127 94 43 40 96
13.6 17.4 6.4 19.6 35.3 15.8 6.7 9.2 7.6 11.5 25.7
100.0 11.8 10.8 18.2 19.3 16.5 7.4 5.5 2.5 2.3 5.6
Mountain 864 20 210 175 58 42 107 121 11 73 49
6.9 1.7 7.3 11.0 6.2 2.3 5.7 11.8 2.0 20.9 13.0
100.0 2.3 24.3 20.2 6.7 4.8 12.4 14.0 1.3 8.4 5.6
Pacific 2853 374 846 357 77 414 380 166 112 74 54
22.7 32.3 29.4 22.4 8.2 23.2 20.1 16.2 19.7 21.1 14.3
100.0 13.1 29.7 12.5 2.7 14.5 13.3 5.8 3.9 2.6 1.9Metro Market Size
Non-Cbsa/CSA < 100K 1842 127 409 277 145 290 230 203 58 18 85
14.7 11.0 14.2 17.4 15.5 16.3 12.2 19.8 10.1 5.1 22.8
100.0 6.9 22.2 15.0 7.9 15.7 12.5 11.0 3.1 1.0 4.6
100K-499K 2060 230 527 219 156 125 234 328 137 48 56
16.4 19.9 18.3 13.8 16.6 7.0 12.4 32.0 24.2 13.8 14.9
100.0 11.2 25.6 10.7 7.6 6.0 11.3 15.9 6.7 2.3 2.7
500K-1.9M 2127 171 461 243 152 269 341 217 75 95 104
16.9 14.7 16.0 15.2 16.2 15.1 18.0 21.1 13.3 27.2 27.8
100.0 8.0 21.7 11.4 7.1 12.7 16.0 10.2 3.5 4.5 4.9
2M and Over 6526 630 1480 854 486 1099 1084 278 297 188 129
52.0 54.4 51.5 53.6 51.8 61.6 57.4 27.1 52.3 53.9 34.5
100.0 9.7 22.7 13.1 7.4 16.8 16.6 4.3 4.5 2.9 2.0
