copyright © 2009 pearson education, inc. 6- 1 review for final exam will include questions from:...
TRANSCRIPT

Copyright © 2009 Pearson Education, Inc. 6- 1
Review For Final Exam
Will Include Questions From:
In-Class Lectures Chapter 6 (exclude pps. 185-187 and 202-205)Chapter 8 (exclude appendix)Chapter 9 (exclude appendix)Chapter 10 (exclude pps. 347-354)Chapter 12 (exclude pps. 422-427 and appendix)Articles 7, 8, and 9

Copyright © 2009 Pearson Education, Inc. 6- 2
Chapter 6 - Supply of Labor and Decision to Work
Theory of the Decision to Work Income and Substitution Effects of a Wage ChangeThe Graphics of Labor-Leisure Choice Graphical Analysis of Income Replacement ProgramsGraphical Analysis of Welfare ProgramsWelfare Reform and Workfare
Copyright © 2009 Pearson Education, Inc. 6- 3
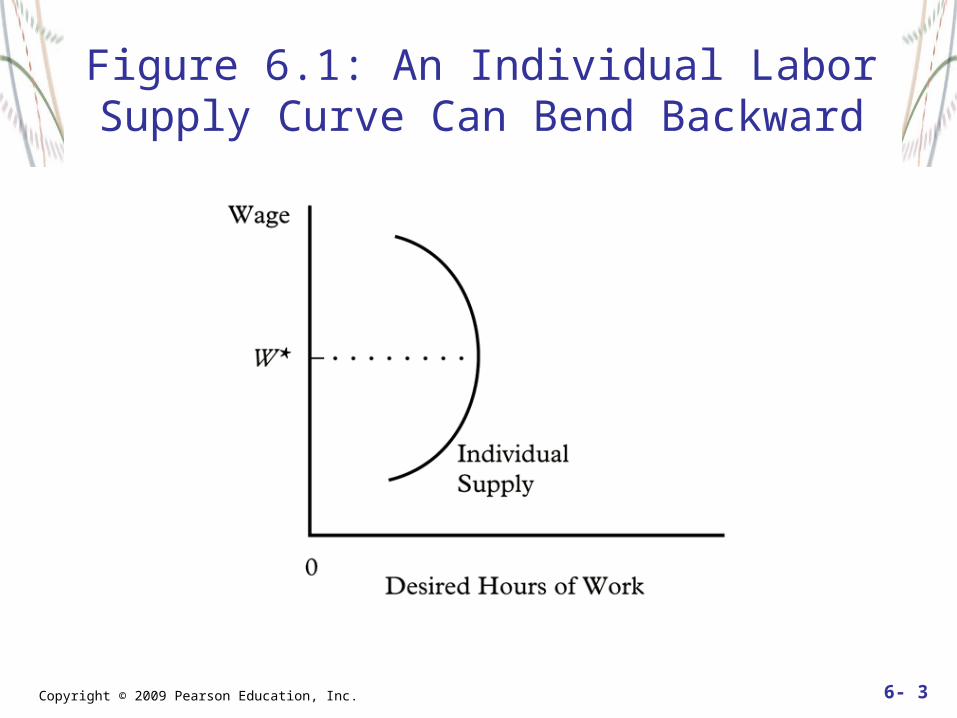
Figure 6.1: An Individual Labor Supply Curve Can Bend Backward

Copyright © 2009 Pearson Education, Inc. 6- 4
Figure 6.7: Indifference Curves and Budget Constraint (with an increase in nonlabor income)
Copyright © 2009 Pearson Education, Inc. 6- 5
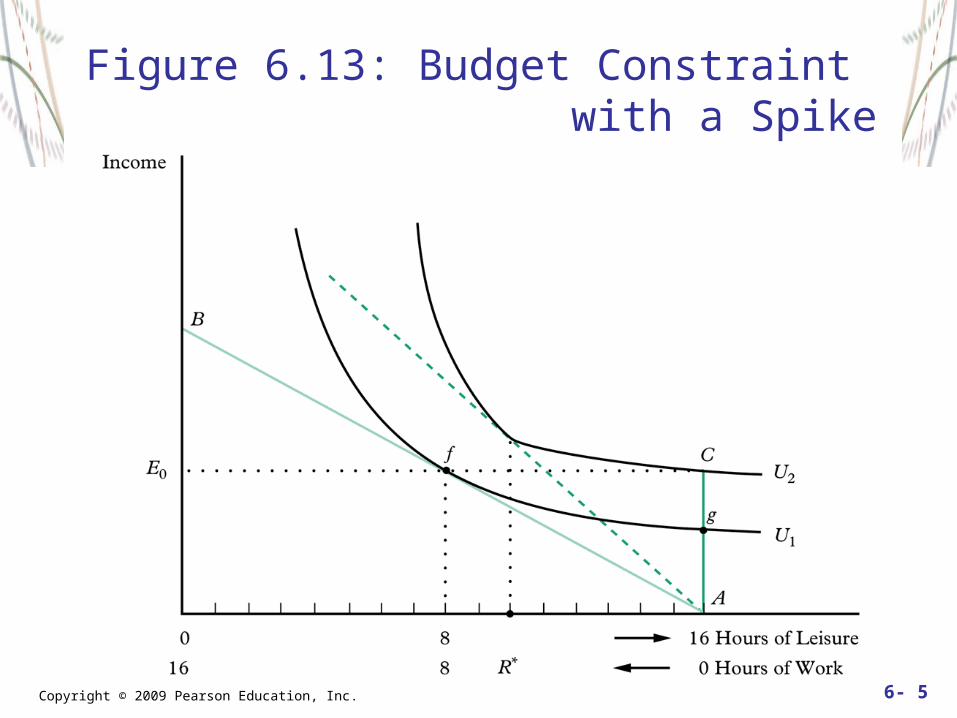
Figure 6.13: Budget Constraint with a Spike

Copyright © 2009 Pearson Education, Inc. 6- 6
Figure 6.14: Income and Substitution Effects for the Basic Welfare System
Copyright © 2009 Pearson Education, Inc. 6- 7
Chapter 8 - Compensating Wage Differentials
The Role of Compensating Wage Differentials in Matching Worker and EmployerHedonic Wage Theory and Risk of Injury -Worker Indifference Curves -Employer Isoprofit Curves -The Offer Curve Hedonic Wage Theory and Employee Benefits

Copyright © 2009 Pearson Education, Inc. 6- 8
Figure 8.1: A Family of Indifference Curves between Wages and Risk of Injury
Copyright © 2009 Pearson Education, Inc. 6- 9
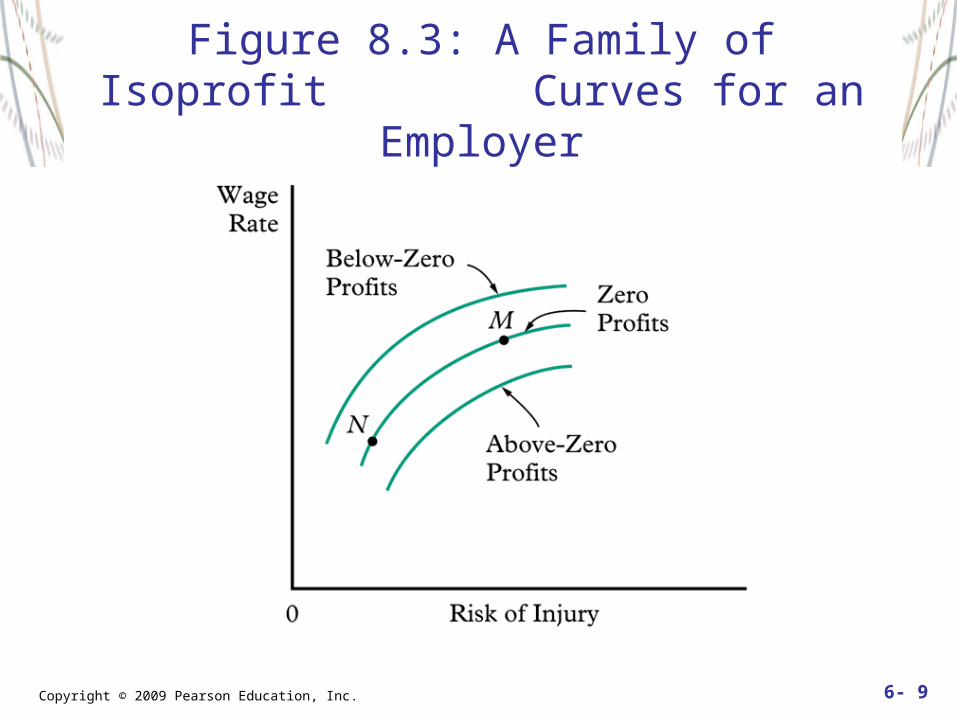
Figure 8.3: A Family of Isoprofit Curves for an Employer

Copyright © 2009 Pearson Education, Inc. 6- 10
Figure 8.6: An Offer Curve

Copyright © 2009 Pearson Education, Inc. 6- 11
Figure 8.12: Market Determination of the Mix of Wages and Benefits
Copyright © 2009 Pearson Education, Inc. 6- 12
Chapter 9 - Human Capital Investments
Net Present Value and The Human Capital Investment DecisionThe Effect of Education and OJT on Earnings - Males and Females Women and Human Capital Acquisition Is Education a Good Investment? The Signaling Model
Copyright © 2009 Pearson Education, Inc. 6- 13
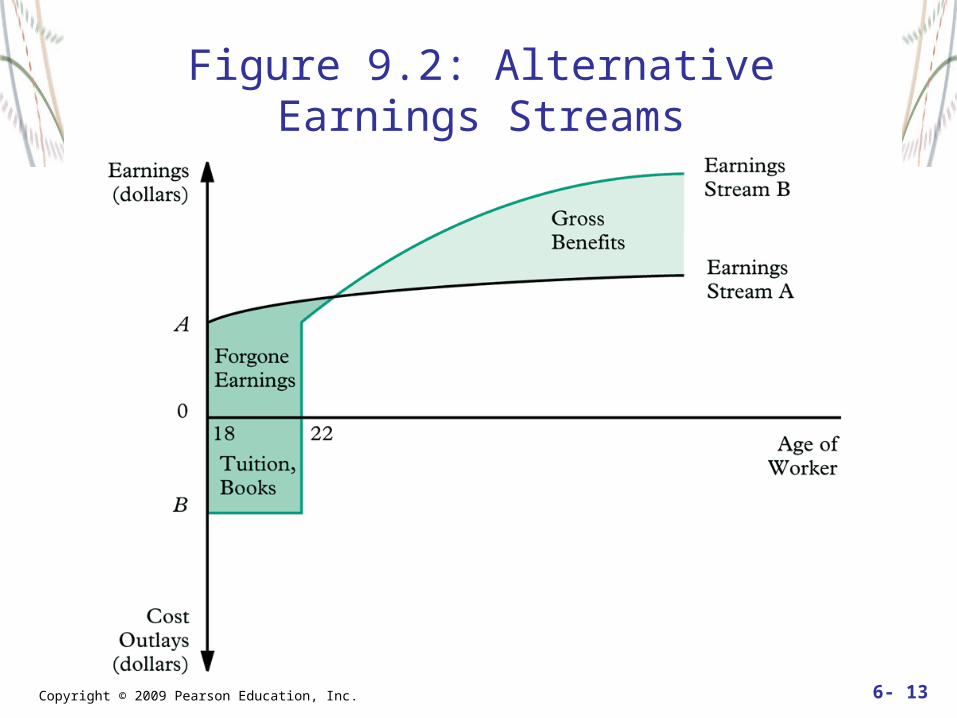
Figure 9.2: Alternative Earnings Streams
Copyright © 2009 Pearson Education, Inc. 6- 14
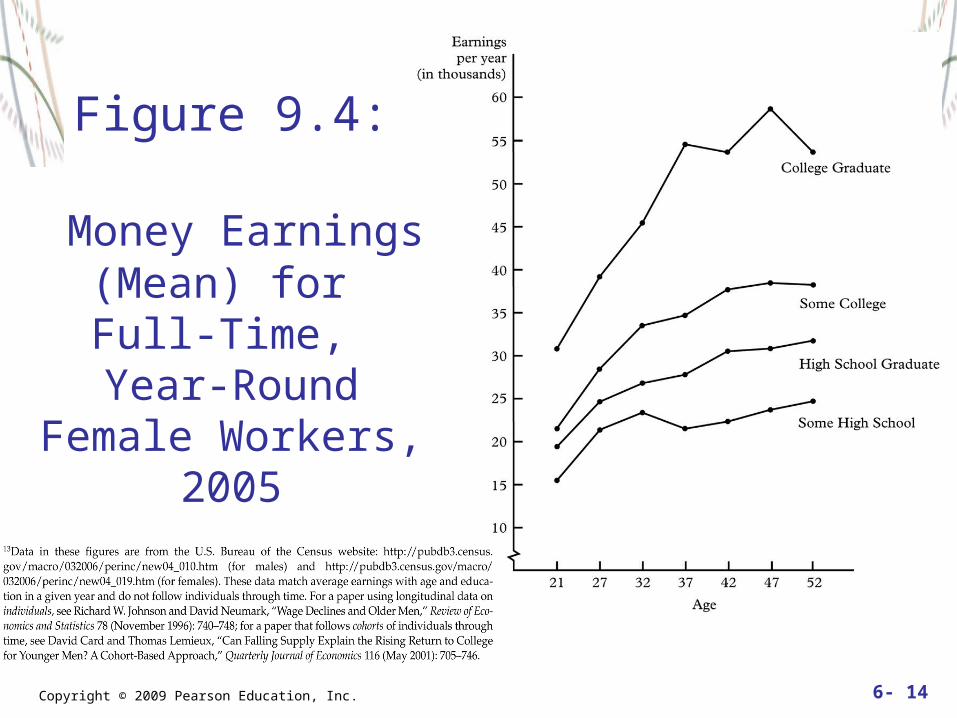
Figure 9.4:
Money Earnings (Mean) for Full-Time,
Year-Round Female Workers, 2005
Copyright © 2009 Pearson Education, Inc. 6- 15
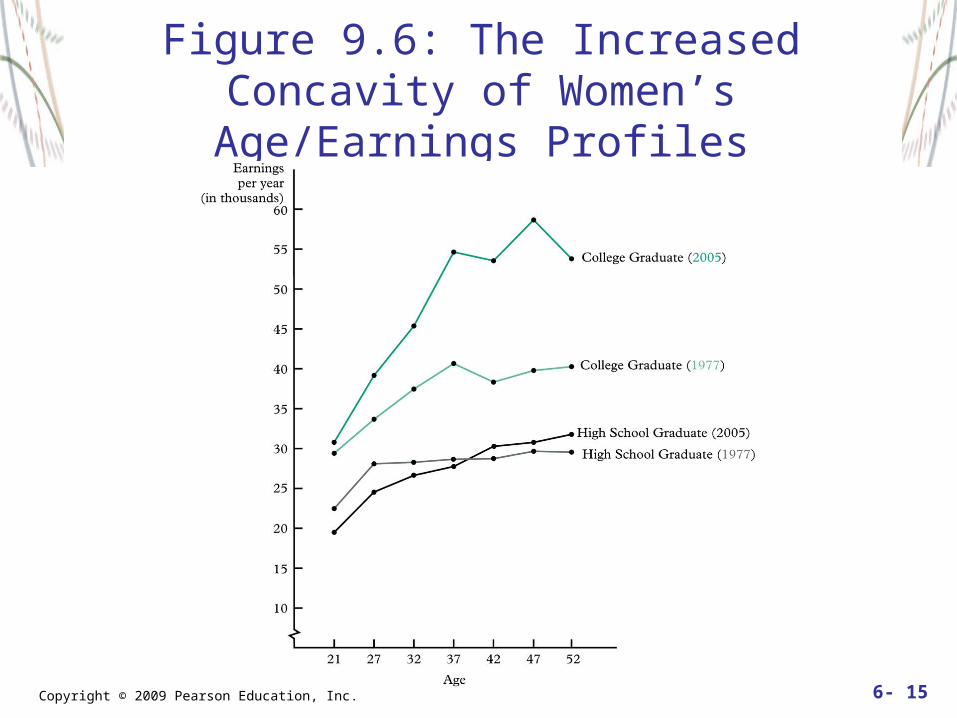
Figure 9.6: The Increased Concavity of Women’s Age/Earnings Profiles

Copyright © 2009 Pearson Education, Inc. 6- 16
Figure 9.8: The Lifetime Benefits and Costs of Educational Signaling

Copyright © 2009 Pearson Education, Inc. 6- 17
Chapter 10 - Worker Mobility
Net Present Value and Worker MobilityCharacteristics of MoversReturns to ImmigrationU.S. Immigration HistoryCharacteristics of Illegal Immigrants to the U.S. Benefits and Costs of immigration