copyright © 2006 by mosby, inc. slide 1 chapter 8 radiologic examination of the chest radiologic...
TRANSCRIPT

Copyright © 2006 by Mosby, Inc.Slide 1
Chapter 8Chapter 8
Radiologic Examination of the ChestRadiologic Examination of the Chest
Copyright © 2006 by Mosby, Inc.Slide 2
Fundamentals Fundamentals of of
RadiographyRadiography

Copyright © 2006 by Mosby, Inc.Slide 3
Standard Positions and Techniques Standard Positions and Techniques of Chest Radiographyof Chest Radiography
Posteroanterior radiographPosteroanterior radiograph
Anteroposterior radiographAnteroposterior radiograph
Lateral radiographLateral radiograph
Lateral decubitus radiographLateral decubitus radiograph

Copyright © 2006 by Mosby, Inc.Slide 4
Figure 8-1. Figure 8-1. Standard PA chest radiograph with the patient’s lungs in full inspiration.Standard PA chest radiograph with the patient’s lungs in full inspiration.

Copyright © 2006 by Mosby, Inc.Slide 5
Figure 8-2. Figure 8-2. A PA chest radiograph of the same patient shown in Figure 8-1 during expiration.A PA chest radiograph of the same patient shown in Figure 8-1 during expiration.

Copyright © 2006 by Mosby, Inc.Slide 6
Figure 8-3. Figure 8-3. Compared with the PA chest radiograph, the heart is significantly magnified in the AP Compared with the PA chest radiograph, the heart is significantly magnified in the AP chest radiograph. In the PA radiograph the ratio of the width of the heart to the thorax is normally chest radiograph. In the PA radiograph the ratio of the width of the heart to the thorax is normally less than 1:2. less than 1:2.
Copyright © 2006 by Mosby, Inc.Slide 7
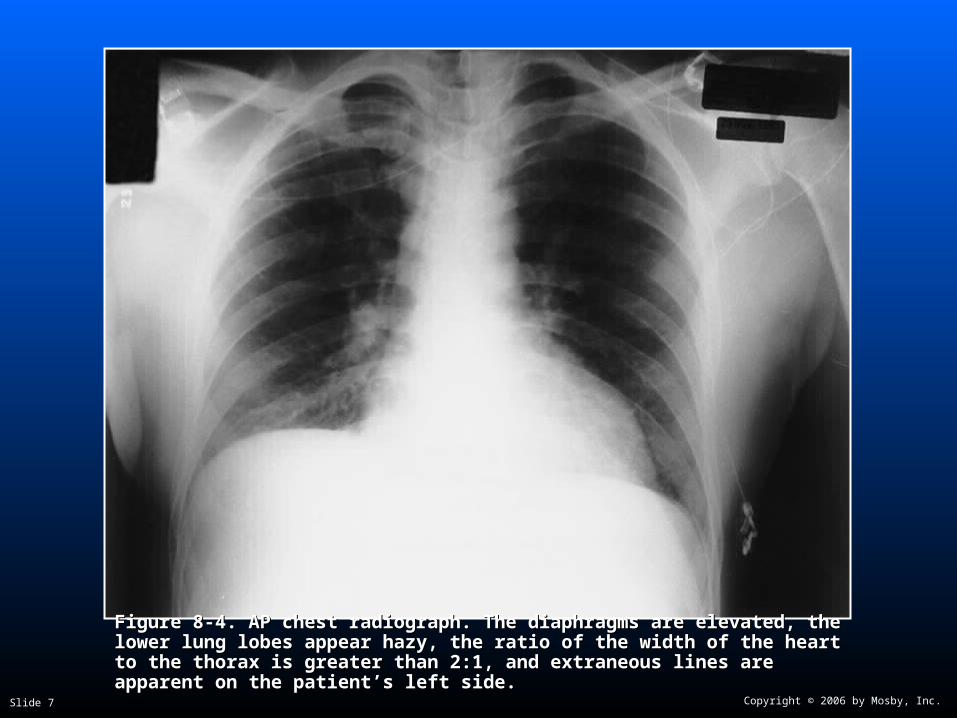
Figure 8-4. Figure 8-4. AP chest radiograph. The diaphragms are elevated, the lower lung AP chest radiograph. The diaphragms are elevated, the lower lung lobes appear hazy, the ratio of the width of the heart to the thorax is greater than lobes appear hazy, the ratio of the width of the heart to the thorax is greater than 2:1, and extraneous lines are apparent on the patient’s left side. 2:1, and extraneous lines are apparent on the patient’s left side.

Copyright © 2006 by Mosby, Inc.Slide 8
Figure 8-5. Figure 8-5. Lateral radiograph.Lateral radiograph.

Copyright © 2006 by Mosby, Inc.Slide 9
Figure 8-6. Figure 8-6. Subpulmonic pleural effusion. Right lateral decubitus view. Subdiaphragmatic Subpulmonic pleural effusion. Right lateral decubitus view. Subdiaphragmatic fluid has run up the lateral chest wall, producing a band of soft tissue density. The medial fluid has run up the lateral chest wall, producing a band of soft tissue density. The medial curvilinear shadow curvilinear shadow (arrow)(arrow) indicates fluid in the lips of the major fissure. indicates fluid in the lips of the major fissure.

Copyright © 2006 by Mosby, Inc.Slide 10
Inspecting the Inspecting the Chest RadiographChest Radiograph

Copyright © 2006 by Mosby, Inc.Slide 11
Figure 8-7. Figure 8-7. Normal PA chest radiograph. Normal PA chest radiograph. 1,1, Trachea (note vertebral column in middle of trachea); Trachea (note vertebral column in middle of trachea);2,2, carina; carina; 3,3, right main stem bronchus; right main stem bronchus; 4,4, left main stem bronchus; left main stem bronchus; 5,5, right atrium; right atrium; 6,6, left ventricle; left ventricle; 7,7, hilar vasculature; hilar vasculature; 8,8, aortic knob; aortic knob; 9,9, diaphragm; diaphragm; 10,10, costophrenic angles; costophrenic angles; 11,11, breast shadows; breast shadows;12,12, gastric air bubble; gastric air bubble; 13,13, clavicle; clavicle; 14,14, rib. rib.

Copyright © 2006 by Mosby, Inc.Slide 12
Figure 8-8. Figure 8-8. Normal lateral chest radiograph. Normal lateral chest radiograph. 1,1, Manubrium; Manubrium; 2,2, sternum; sternum; 3,3, cardiac shadow; cardiac shadow;4,4, retrosternal air space in the lung; retrosternal air space in the lung; 5,5, trachea; trachea; 6,6, bronchus, on end; bronchus, on end; 7,7, aortic arch (ascending aortic arch (ascending and descending); and descending); 8,8, scapulae; scapulae; 9,9, vertebral column; vertebral column; 10,10, diaphragm; diaphragm; 11,11, breast shadow. breast shadow.

Copyright © 2006 by Mosby, Inc.Slide 13
Table 8-1 Table 8-1 Common Radiologic TermsCommon Radiologic Terms
Air cystAir cyst
BlebBleb
BullaBulla
BronchogramBronchogram
CavityCavity
ConsolidationConsolidation
Homogeneous densityHomogeneous density
HoneycombingHoneycombing
InfiltrateInfiltrate

Copyright © 2006 by Mosby, Inc.Slide 14
Table 8-1 Table 8-1 Common Radiologic Terms, cont.Common Radiologic Terms, cont.
Interstitial densityInterstitial density
LesionLesion
OpacityOpacity
Pleural densityPleural density
Pulmonary massPulmonary mass
Pulmonary nodulePulmonary nodule
RadiodensityRadiodensity
RadiolucencyRadiolucency
TranslucentTranslucent

Copyright © 2006 by Mosby, Inc.Slide 15
Selected Examples Selected Examples of Common of Common
Radiologic TermsRadiologic Terms

Copyright © 2006 by Mosby, Inc.Slide 16
CavityCavityLung with TB cavitiesLung with TB cavities Radiograph of cavityRadiograph of cavity
Figure 17-1, C.Figure 17-1, C. Figure 17-2; Figure 17-2; FromFrom Armstrong P et al: Armstrong P et al: Imaging Imaging of diseases of the chest,of diseases of the chest, ed ed
2, St. Louis, 1995, Mosby.2, St. Louis, 1995, Mosby.

Copyright © 2006 by Mosby, Inc.Slide 17
Consolidation or OpacityConsolidation or Opacity(Caused by a Right Lung Pneumonia)(Caused by a Right Lung Pneumonia)
PneumoniaPneumonia
Figure 15-5.Figure 15-5.
Figure 15-1.Figure 15-1.

Copyright © 2006 by Mosby, Inc.Slide 18
BronchogramBronchogram
Figure 15-6. Air bronchogram. Figure 15-6. Air bronchogram. (From Armstrong P et al: (From Armstrong P et al: Imaging of diseases of the chestImaging of diseases of the chest, ed 2, St. Louis, 1995, Mosby.), ed 2, St. Louis, 1995, Mosby.)

Copyright © 2006 by Mosby, Inc.Slide 19
BronchogramBronchogramShown in chest CT ScanShown in chest CT Scan
Figure 15-7. Figure 15-7. (From Armstrong P et al: (From Armstrong P et al: Imaging of diseases of the chestImaging of diseases of the chest, ed 2, St. Louis, 1995, Mosby.), ed 2, St. Louis, 1995, Mosby.)

Copyright © 2006 by Mosby, Inc.Slide 20
HoneycombingHoneycombing(as shown in interstitial pulmonary fibrosis) (as shown in interstitial pulmonary fibrosis)
Figure 28-4. Figure 28-4. (From Armstrong P et al: (From Armstrong P et al: Imaging of diseases of the chestImaging of diseases of the chest, ed 2, St. Louis, 1995, Mosby.), ed 2, St. Louis, 1995, Mosby.)

Copyright © 2006 by Mosby, Inc.Slide 21
InfiltrateInfiltrate(As shown in patient with ARDS—general term)(As shown in patient with ARDS—general term)
Figure 27-2.Figure 27-2.

Copyright © 2006 by Mosby, Inc.Slide 22
Pleural DensityPleural Density
Figure 28-3.Figure 28-3. (From Armstrong P et al: (From Armstrong P et al: Imaging of diseases of the chestImaging of diseases of the chest, ed 2, St. Louis, 1995, Mosby.), ed 2, St. Louis, 1995, Mosby.)

Copyright © 2006 by Mosby, Inc.Slide 23
Pulmonary Mass Pulmonary Mass
Figure 26-3.Figure 26-3. (From Rau JL, Pearce DJ: (From Rau JL, Pearce DJ: Understanding chest radiographsUnderstanding chest radiographs, Denver, 1984, Multi-Media Publishing.), Denver, 1984, Multi-Media Publishing.)

Copyright © 2006 by Mosby, Inc.Slide 24
Radiodensity Radiodensity (Caused by a Right Lung Pneumonia)(Caused by a Right Lung Pneumonia)
PneumoniaPneumonia
Figure 15-5.Figure 15-5.
Figure 15-1.Figure 15-1.

Copyright © 2006 by Mosby, Inc.Slide 25
Translucency or RadiolucencyTranslucency or Radiolucency(Caused by a Right Pneumothorax)(Caused by a Right Pneumothorax)
Right pneumothoraxRight pneumothoraxRight pneumothoraxRight pneumothorax
Figure 22-10, B.Figure 22-10, B.Figure 22-1.Figure 22-1.

Copyright © 2006 by Mosby, Inc.Slide 26
Emphysema Emphysema Emphysema Emphysema
Translucency or RadiolucencyTranslucency or Radiolucency(Caused by a Chronic Emphysema)(Caused by a Chronic Emphysema)
Figure 12-3.Figure 12-3. Figure 12-2.Figure 12-2.

Copyright © 2006 by Mosby, Inc.Slide 27
Technical Quality of the RadiographTechnical Quality of the Radiograph
Technical qualityTechnical quality
Exposure qualityExposure quality
Level of inspirationLevel of inspiration

Copyright © 2006 by Mosby, Inc.Slide 28
FirstFirstTechnical QualityTechnical Quality
Was the patient in the correct position?Was the patient in the correct position? Check the medial ends of the clavicles to the Check the medial ends of the clavicles to the
vertebral columnvertebral column
Even a small degree of patient rotation can Even a small degree of patient rotation can create a false imagecreate a false image Erroneously suggesting tracheal deviation, cardiac Erroneously suggesting tracheal deviation, cardiac
displacement, or cardiac enlargementdisplacement, or cardiac enlargement

Copyright © 2006 by Mosby, Inc.Slide 29
SecondSecondExposure QualityExposure Quality
Normal exposure is verified by determining Normal exposure is verified by determining whether the spinal processes of the vertebrae whether the spinal processes of the vertebrae are visible to the 5th or 6th thoracic levelare visible to the 5th or 6th thoracic level
Compare the relative densities of the heart Compare the relative densities of the heart and lungsand lungs Overexposure: heart and lungs more radiolucentOverexposure: heart and lungs more radiolucent
Underexposure: heart and lungs more dense or Underexposure: heart and lungs more dense or whiterwhiter
Copyright © 2006 by Mosby, Inc.Slide 30
Third Level of Inspiration When Third Level of Inspiration When Radiograph Was TakenRadiograph Was Taken
At full inspiration, the diaphragmatic domes At full inspiration, the diaphragmatic domes should be at the level of the 9th to 11th ribs should be at the level of the 9th to 11th ribs posteriorlyposteriorly
At expiration, the lungs appear denser, the At expiration, the lungs appear denser, the diaphragm is elevated, and the heart appears diaphragm is elevated, and the heart appears wider and enlargedwider and enlarged

Copyright © 2006 by Mosby, Inc.Slide 31
Sequence of ExaminationSequence of Examination
MediastinumMediastinum
TracheaTrachea
HeartHeart
Hilar regionHilar region
Lung tissueLung tissue
PleuraPleura
DiaphragmDiaphragm
Gastric air bubbleGastric air bubble
Bony thorax and soft tissuesBony thorax and soft tissues

Copyright © 2006 by Mosby, Inc.Slide 32
Figure 8-7. Figure 8-7. Normal PA chest radiograph. Normal PA chest radiograph. 1,1, Trachea (note vertebral column in middle of trachea); Trachea (note vertebral column in middle of trachea);2,2, carina; carina; 3,3, right main stem bronchus; right main stem bronchus; 4,4, left main stem bronchus; left main stem bronchus; 5,5, right atrium; right atrium; 6,6, left ventricle; left ventricle; 7,7, hilar vasculature; hilar vasculature; 8,8, aortic knob; aortic knob; 9,9, diaphragm; diaphragm; 10,10, costophrenic angles; costophrenic angles; 11,11, breast shadows; breast shadows;12,12, gastric air bubble; gastric air bubble; 13,13, clavicle; clavicle; 14,14, rib. rib.

Copyright © 2006 by Mosby, Inc.Slide 33
StructureStructure
MediastinumMediastinum TracheaTrachea
CarinaCarina
HeartHeart
Major vesselsMajor vessels
Abnormal PositionAbnormal Position
Leftward shiftLeftward shift
Table 8-2.Table 8-2.Examples of Factors That Pull or Push Anatomic Structures Examples of Factors That Pull or Push Anatomic Structures
Out of Their Normal Position in the Chest Radiograph.Out of Their Normal Position in the Chest Radiograph.
CausesCauses Pulled left by upper lobe tuberculosis, atelectasis, or Pulled left by upper lobe tuberculosis, atelectasis, or
fibrosisfibrosis
Pushed left by right upper lobe emphysematous bulla, Pushed left by right upper lobe emphysematous bulla, fluid, gas, or tumorfluid, gas, or tumor

Copyright © 2006 by Mosby, Inc.Slide 34
StructureStructure
Left diaphragmLeft diaphragm
Abnormal PositionAbnormal Position
Upward shiftUpward shift
Table 8-2.Table 8-2.Examples of Factors That Pull or Push Anatomic StructuresExamples of Factors That Pull or Push Anatomic StructuresOut of Their Normal Position in the Chest Radiograph, cont.Out of Their Normal Position in the Chest Radiograph, cont.
CausesCauses Pulled up by left lower lobe atelectasis or fibrosisPulled up by left lower lobe atelectasis or fibrosis
Pushed up by distended gastric air bubblePushed up by distended gastric air bubble

Copyright © 2006 by Mosby, Inc.Slide 35
StructureStructure
Horizontal fissureHorizontal fissure Right lungRight lung
Right hilumRight hilum
Abnormal PositionAbnormal Position
DownDownward shiftward shift
Table 8-2.Table 8-2.Examples of Factors That Pull or Push Anatomic StructuresExamples of Factors That Pull or Push Anatomic StructuresOut of Their Normal Position in the Chest Radiograph, cont.Out of Their Normal Position in the Chest Radiograph, cont.
CausesCauses Pulled down by right middle lobe or right lower lobe Pulled down by right middle lobe or right lower lobe
atelectasisatelectasis
Pushed down by right upper lobe neoplasmPushed down by right upper lobe neoplasm

Copyright © 2006 by Mosby, Inc.Slide 36
StructureStructure
Left lungLeft lung
Abnormal PositionAbnormal Position
Rightward shiftRightward shift
Table 8-2.Table 8-2.Examples of Factors That Pull or Push Anatomic StructuresExamples of Factors That Pull or Push Anatomic StructuresOut of Their Normal Position in the Chest Radiograph, cont.Out of Their Normal Position in the Chest Radiograph, cont.
CausesCauses Pulled right by right lung collapse, atelectasis, or fibrosisPulled right by right lung collapse, atelectasis, or fibrosis
Pushed right by left-sided tension pneumothorax or Pushed right by left-sided tension pneumothorax or hemothoraxhemothorax

Copyright © 2006 by Mosby, Inc.Slide 37
Other Radiologic TechniquesOther Radiologic Techniques
Computed tomography (CT)Computed tomography (CT) CT scanCT scan
Position emission tomography (PET)Position emission tomography (PET) PET scanPET scan
Magnetic resonance imagingMagnetic resonance imaging Pulmonary angiographyPulmonary angiography Ventilation-perfusion scanVentilation-perfusion scan FluoroscopyFluoroscopy BronchographyBronchography

Copyright © 2006 by Mosby, Inc.Slide 38
Normal CT Scan Lung Window Normal CT Scan Lung Window
Figure 8-9. Figure 8-9. Overview of normal lung window CT scan. The apex appears in the two Overview of normal lung window CT scan. The apex appears in the two views in the upper right hand corner of this figure; the diaphragm at the base of the views in the upper right hand corner of this figure; the diaphragm at the base of the lungs appears in the lower right hand view.lungs appears in the lower right hand view.

Copyright © 2006 by Mosby, Inc.Slide 39
Example of Several Normal Example of Several Normal CT Scan Lung Window SlicesCT Scan Lung Window Slices

Copyright © 2006 by Mosby, Inc.Slide 40
Normal CT Scan Lung Window Normal CT Scan Lung Window
Figure 8-9 B. The actual cross-Figure 8-9 B. The actual cross-sectional slice, or axial view of the sectional slice, or axial view of the chest.chest.
A B
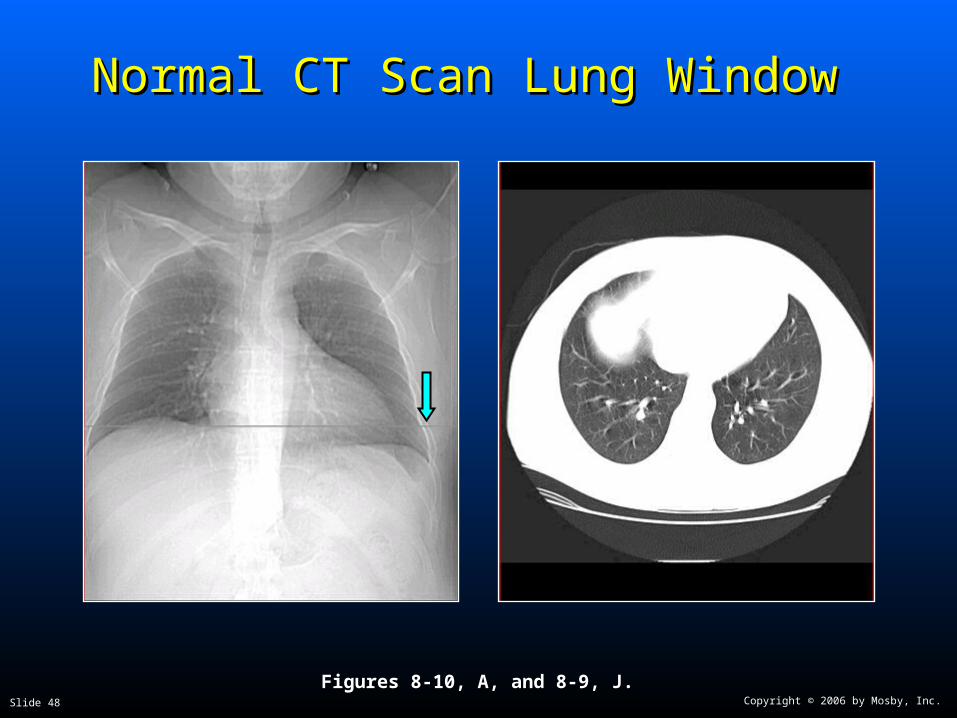
Figure 8-10. Figure 8-10. Close-up of a normal lung Close-up of a normal lung window CT scan. A, The portion of the window CT scan. A, The portion of the chest the CT scan is taken. chest the CT scan is taken.

Copyright © 2006 by Mosby, Inc.Slide 41
Figures 8-10, A, and 8-9, C.Figures 8-10, A, and 8-9, C.
Normal CT Scan Lung Window Normal CT Scan Lung Window

Copyright © 2006 by Mosby, Inc.Slide 42
Normal CT Scan Lung Window Normal CT Scan Lung Window
Figures 8-10, A, and 8-9, D.Figures 8-10, A, and 8-9, D.

Copyright © 2006 by Mosby, Inc.Slide 43
Normal CT Scan Lung Window Normal CT Scan Lung Window
Figures 8-10, A, and 8-9, E.Figures 8-10, A, and 8-9, E.

Copyright © 2006 by Mosby, Inc.Slide 44
Normal CT Scan Lung Window Normal CT Scan Lung Window
Figures 8-10, A, and 8-9, F.Figures 8-10, A, and 8-9, F.

Copyright © 2006 by Mosby, Inc.Slide 45
Normal CT Scan Lung Window Normal CT Scan Lung Window
Figures 8-10, A, and 8-9, G.Figures 8-10, A, and 8-9, G.

Copyright © 2006 by Mosby, Inc.Slide 46
Normal CT Scan Lung Window Normal CT Scan Lung Window
Figures 8-10, A, and 8-9, H.Figures 8-10, A, and 8-9, H.

Copyright © 2006 by Mosby, Inc.Slide 47
Normal CT Scan Lung Window Normal CT Scan Lung Window
Figures 8-10, A, and 8-9, I.Figures 8-10, A, and 8-9, I.
Copyright © 2006 by Mosby, Inc.Slide 48
Normal CT Scan Lung Window Normal CT Scan Lung Window
Figures 8-10, A, and 8-9, J.Figures 8-10, A, and 8-9, J.

Copyright © 2006 by Mosby, Inc.Slide 49
Normal CT Scan Lung Window Normal CT Scan Lung Window
Figures 8-10, A, and 8-9, K.Figures 8-10, A, and 8-9, K.

Copyright © 2006 by Mosby, Inc.Slide 50
Normal CT Scan Lung Window Normal CT Scan Lung Window
Figures 8-10, A, and 8-9, L.Figures 8-10, A, and 8-9, L.

Copyright © 2006 by Mosby, Inc.Slide 51
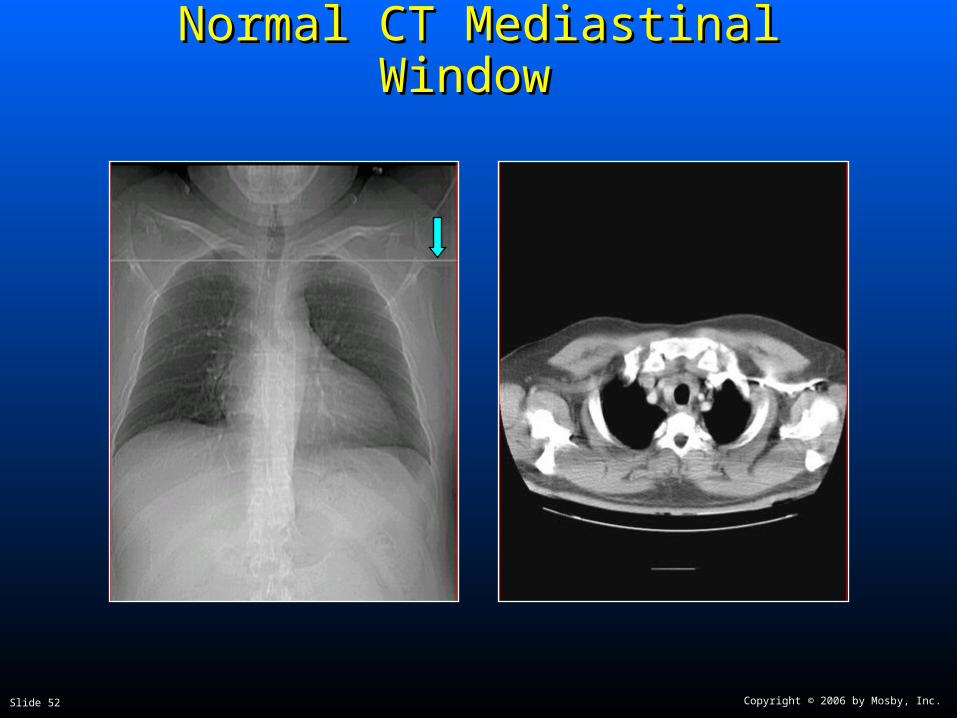
Example of Several Normal Example of Several Normal CT Scan Mediastinal WindowCT Scan Mediastinal Window
Copyright © 2006 by Mosby, Inc.Slide 52
Normal CT Mediastinal Window Normal CT Mediastinal Window
Copyright © 2006 by Mosby, Inc.Slide 53
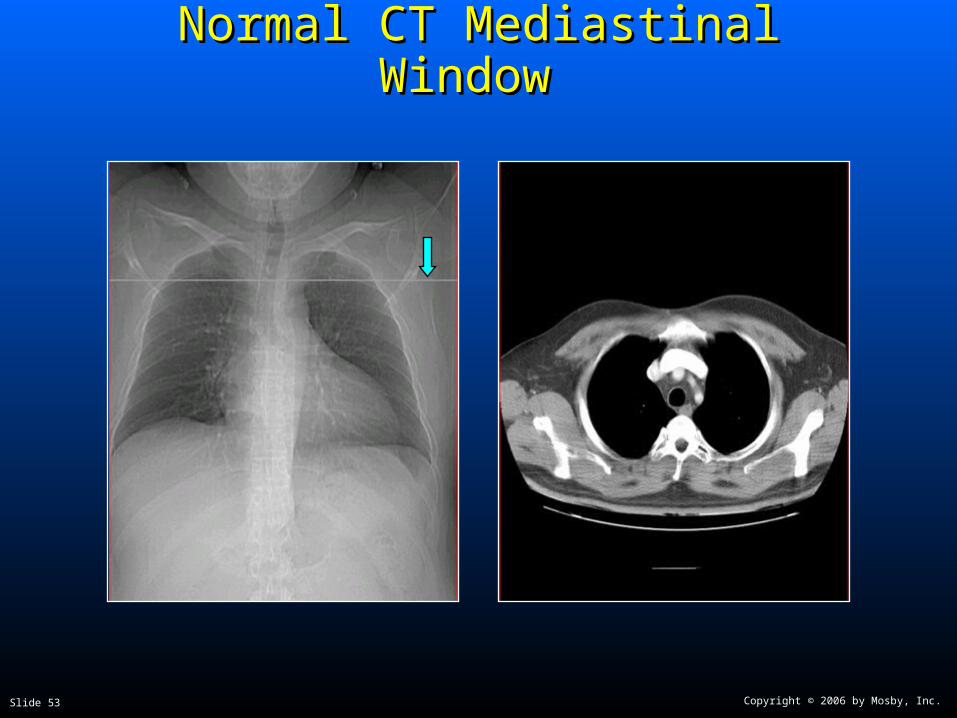
Normal CT Mediastinal Window Normal CT Mediastinal Window

Copyright © 2006 by Mosby, Inc.Slide 54
Normal CT Mediastinal WindowNormal CT Mediastinal Window

Copyright © 2006 by Mosby, Inc.Slide 55
Normal CT Mediastinal WindowNormal CT Mediastinal Window

Copyright © 2006 by Mosby, Inc.Slide 56
Normal CT Mediastinal WindowNormal CT Mediastinal Window

Copyright © 2006 by Mosby, Inc.Slide 57
Normal CT Mediastinal Window Normal CT Mediastinal Window
Figures 8-11. Figures 8-11. Close up of normal CT mediastinal window. A, The portion of the Close up of normal CT mediastinal window. A, The portion of the chest the CT scan is taken. B, The actual cross-sectional slice, or axial view of chest the CT scan is taken. B, The actual cross-sectional slice, or axial view of the chest. Note that the lungs are overexposed and appear mostly black. The the chest. Note that the lungs are overexposed and appear mostly black. The bone and mediastinal organs appear mostly white.bone and mediastinal organs appear mostly white.

Copyright © 2006 by Mosby, Inc.Slide 58
Normal CT Mediastinal WindowNormal CT Mediastinal Window

Copyright © 2006 by Mosby, Inc.Slide 59
Normal CT Mediastinal WindowNormal CT Mediastinal Window
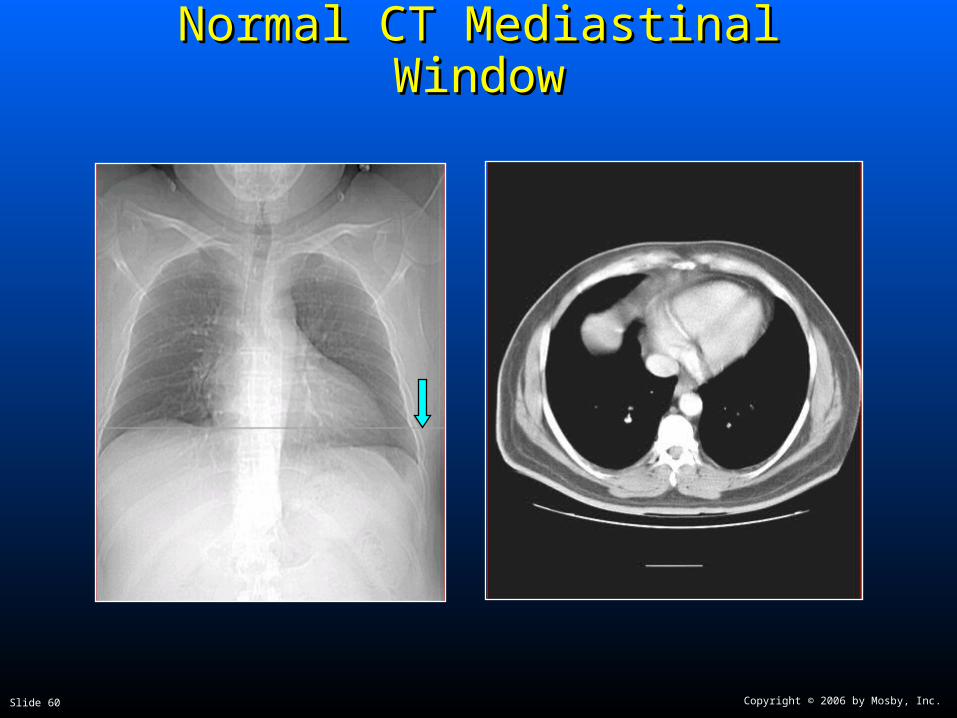
Copyright © 2006 by Mosby, Inc.Slide 60
Normal CT Mediastinal WindowNormal CT Mediastinal Window

Copyright © 2006 by Mosby, Inc.Slide 61
Normal CT Mediastinal WindowNormal CT Mediastinal Window

Copyright © 2006 by Mosby, Inc.Slide 62
Normal CT Mediastinal WindowNormal CT Mediastinal Window

Copyright © 2006 by Mosby, Inc.Slide 63
Positron Emission TomographyPositron Emission TomographyPET ScanPET Scan

Copyright © 2006 by Mosby, Inc.Slide 64
AA
BB
Figure 8-12. Figure 8-12. Chest radiograph identifying two suspicious findings: in the right upper lobe (A) and in the Chest radiograph identifying two suspicious findings: in the right upper lobe (A) and in the
left lower lobe (B), just behind the heart (see left lower lobe (B), just behind the heart (see white arrowswhite arrows).).

Copyright © 2006 by Mosby, Inc.Slide 65
A
B
CT scan, CT scan, upper right lobeupper right lobe
CT scan, CT scan, left lower lobeleft lower lobe
Chest radiographChest radiograph
Figure 8-13. Figure 8-13. Same chest radiograph as shown in Figure 8-12. Note the CT scanSame chest radiograph as shown in Figure 8-12. Note the CT scanalso identifies the suspicious nodules and their precise location.also identifies the suspicious nodules and their precise location.

Copyright © 2006 by Mosby, Inc.Slide 66
Coronal ViewCoronal View
Figure 8-14. Figure 8-14. PET scan: coronal views. PET scan: coronal views.
The last three views show a “hot spot” in left lower lung lobe.The last three views show a “hot spot” in left lower lung lobe.
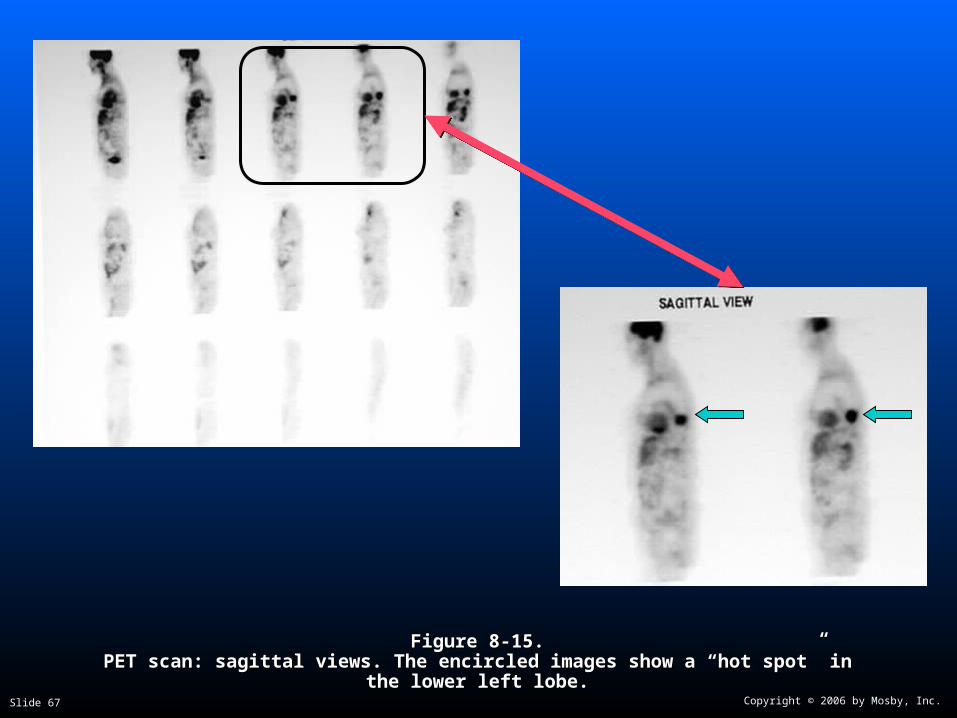
Copyright © 2006 by Mosby, Inc.Slide 67
Figure 8-15.Figure 8-15.PET scan: sagittal views. The encircled images show a “hot spot” in the lower left PET scan: sagittal views. The encircled images show a “hot spot” in the lower left
lobe.lobe.

Copyright © 2006 by Mosby, Inc.Slide 68
Axial View
Figure 8-16.Figure 8-16.PET scan: axial view. A “hot spot” is further confirmed in left lower lung lobe.PET scan: axial view. A “hot spot” is further confirmed in left lower lung lobe.
Copyright © 2006 by Mosby, Inc.Slide 69
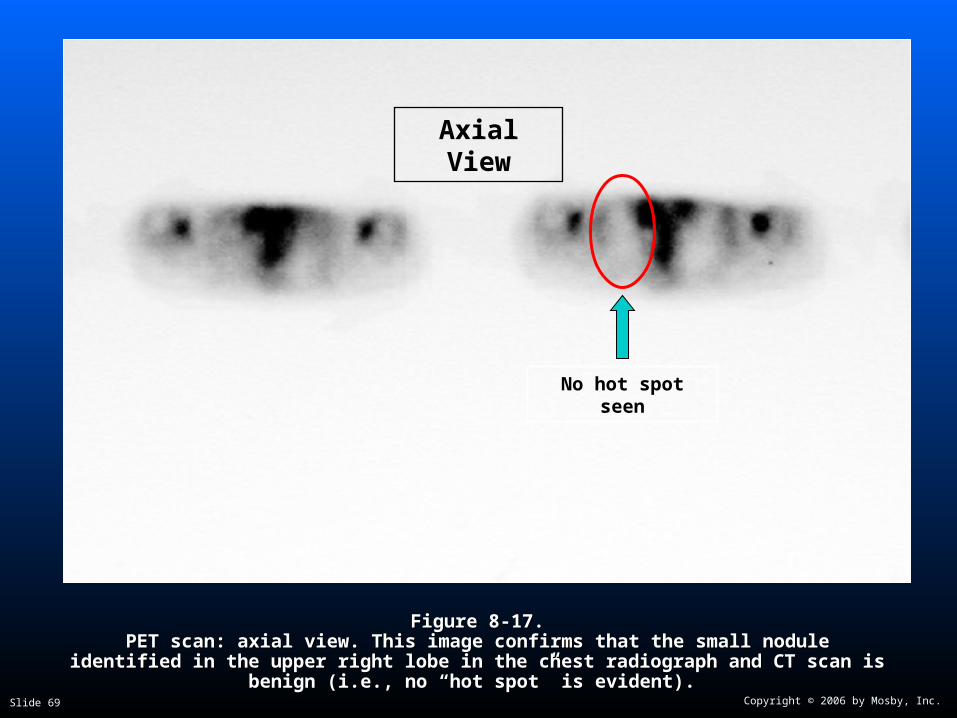
No hot spot seen
Axial View
Figure 8-17.Figure 8-17.PET scan: axial view. This image confirms that the small nodule identified in the upper right PET scan: axial view. This image confirms that the small nodule identified in the upper right
lobe in the chest radiograph and CT scan is benign (i.e., no “hot spot” is evident).lobe in the chest radiograph and CT scan is benign (i.e., no “hot spot” is evident).

Copyright © 2006 by Mosby, Inc.Slide 70
PET Scan PET Scan andand
CT ScanCT Scan

Copyright © 2006 by Mosby, Inc.Slide 71
CT Scan PET ScanCT/PET Fusion
Axial ViewAxial View
CoronalView
CoronalView
Figure 8-18. CT/PET scan (center). CT scan, CT/PET fusion, and PET scan, all showing the Figure 8-18. CT/PET scan (center). CT scan, CT/PET fusion, and PET scan, all showing the same malignant nodule in right upper lobe (see same malignant nodule in right upper lobe (see white arrowwhite arrow). Note: The CT/PET fusion is ). Note: The CT/PET fusion is
normally presented in color (e.g., red, blue, yellow).normally presented in color (e.g., red, blue, yellow).
Copyright © 2006 by Mosby, Inc.Slide 72
Magnetic Resonance ImagingMagnetic Resonance Imaging

Copyright © 2006 by Mosby, Inc.Slide 73
Figure 8-19. Figure 8-19. Anatomy of mediastinum on MRI. A, Anatomy of mediastinum on MRI. A, LBCV,LBCV, Left brachiocephalic vein; Left brachiocephalic vein; RBCV,RBCV, right brachiocephalic vein; right brachiocephalic vein; Ao A,Ao A, aortic arch; aortic arch; T,T, trachea; trachea; Es,Es, esophagus. B, esophagus. B, RV, RV, Right Right ventricle; ventricle; LV,LV, left ventricle; left ventricle; RA,RA, right atrium; right atrium; LA,LA, left atrium; left atrium; D Ao,D Ao, descending aorta; descending aorta; Es,Es, esophagus; esophagus; Az V,Az V, azygos vein. (From Armstrong P, Wilson AG, Dee P: azygos vein. (From Armstrong P, Wilson AG, Dee P: Imaging of diseases Imaging of diseases of the chestof the chest, St. Louis, 1990, Mosby.), St. Louis, 1990, Mosby.)

Copyright © 2006 by Mosby, Inc.Slide 74
Pulmonary AngiographyPulmonary Angiography

Copyright © 2006 by Mosby, Inc.Slide 75
Figure 8-20. Figure 8-20. Abnormal pulmonary angiogram. Radiopaque material injected into the blood Abnormal pulmonary angiogram. Radiopaque material injected into the blood is prevented from flowing into the left lung past the pulmonary embolism is prevented from flowing into the left lung past the pulmonary embolism (arrow).(arrow). No No vascular structures are seen distal to the obstruction.vascular structures are seen distal to the obstruction.

Copyright © 2006 by Mosby, Inc.Slide 76
BronchographyBronchography

Copyright © 2006 by Mosby, Inc.Slide 77
Figure 8-21. Figure 8-21. Bronchogram obtained using contrast medium in a patient with a history of Bronchogram obtained using contrast medium in a patient with a history of bronchiectasis. bronchiectasis. ArrowsArrows indicate the carina and the bronchi leading to the posterior basilar indicate the carina and the bronchi leading to the posterior basilar segment of the left lower lobe. (From Rau JL, Jr, Pearce DJ: segment of the left lower lobe. (From Rau JL, Jr, Pearce DJ: Understanding chest Understanding chest radiographs,radiographs, Denver, 1984, Multi-Media Publishing.) Denver, 1984, Multi-Media Publishing.)