copyright © 2005 pearson education, inc. publishing as benjamin cummings quantifying communities...
TRANSCRIPT
Copyright © 2005 Pearson Education, Inc. publishing as Benjamin Cummings
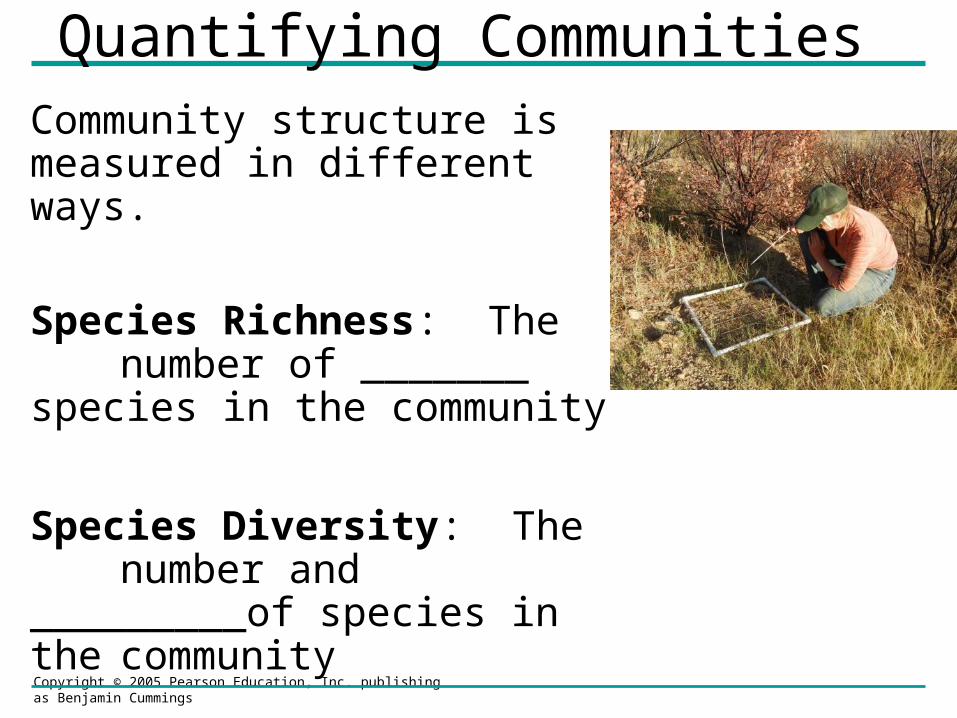
Quantifying Communities Community structure is measured in different ways.
Species Richness: The number of _______species in the community
Species Diversity: The number and _________of species in thecommunity
Copyright © 2005 Pearson Education, Inc. publishing as Benjamin Cummings
Copyright © 2005 Pearson Education, Inc. publishing as Benjamin Cummings
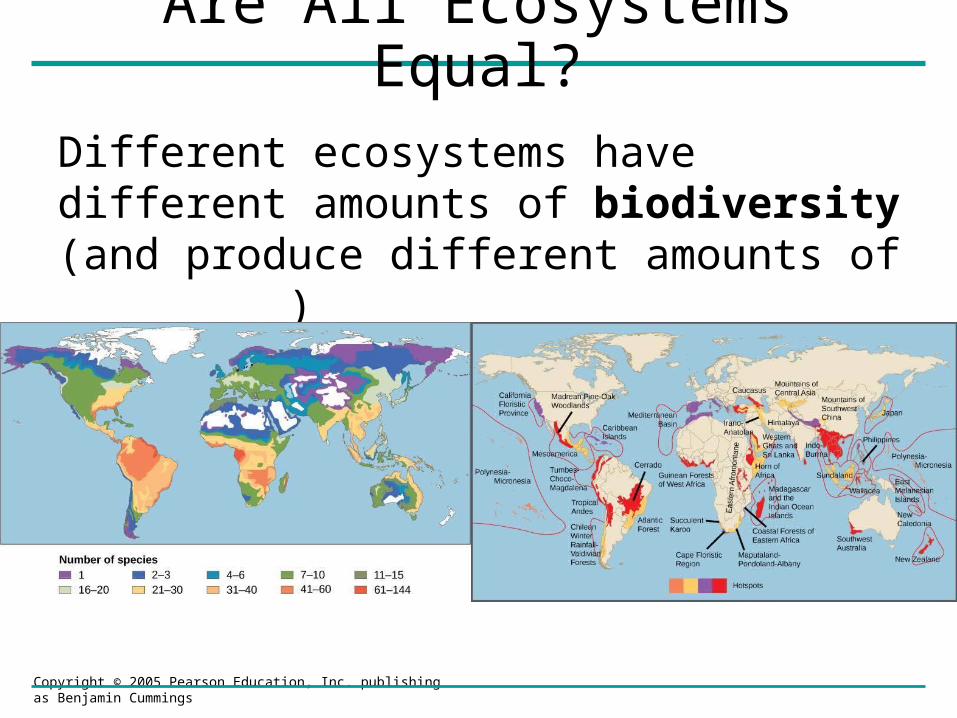
Are All Ecosystems Equal?
Different ecosystems have different amounts of biodiversity (and produce different amounts of _________)
Copyright © 2005 Pearson Education, Inc. publishing as Benjamin Cummings
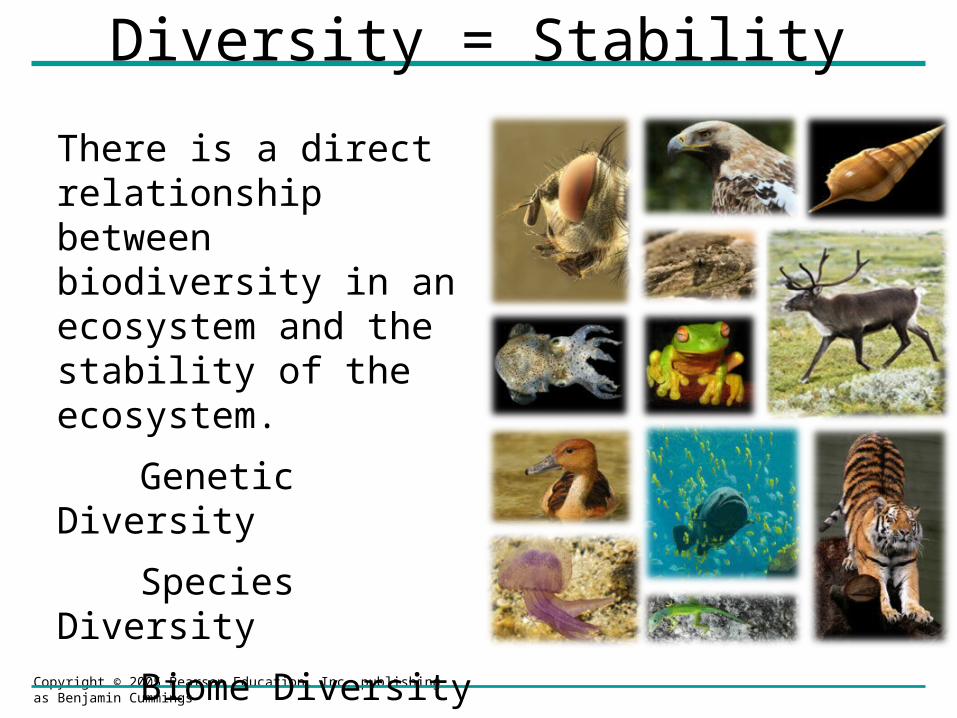
Diversity = Stability
There is a direct relationship between biodiversity in an ecosystem and the stability of the ecosystem.
Genetic Diversity
Species Diversity
Biome Diversity
Copyright © 2005 Pearson Education, Inc. publishing as Benjamin Cummings
Ch 55: Ecosystems
• Ecosystems, Energy, and Matter
• An ecosystem consists of all the organisms living in a community (___________ factors) and all the abiotic factors with which they rely on
Copyright © 2005 Pearson Education, Inc. publishing as Benjamin Cummings
The only constant is change
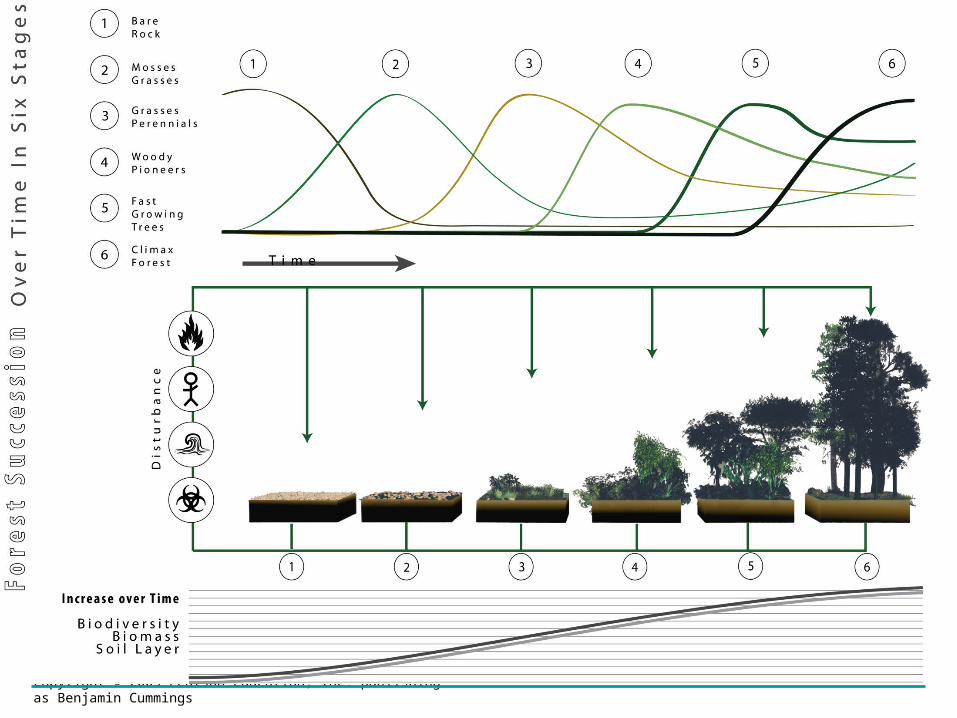
Ecosystems are constantly changing.
Disturbance: Anything that disrupts the homeostatic balance of an ecosystem.
Copyright © 2005 Pearson Education, Inc. publishing as Benjamin Cummings
Copyright © 2005 Pearson Education, Inc. publishing as Benjamin Cummings
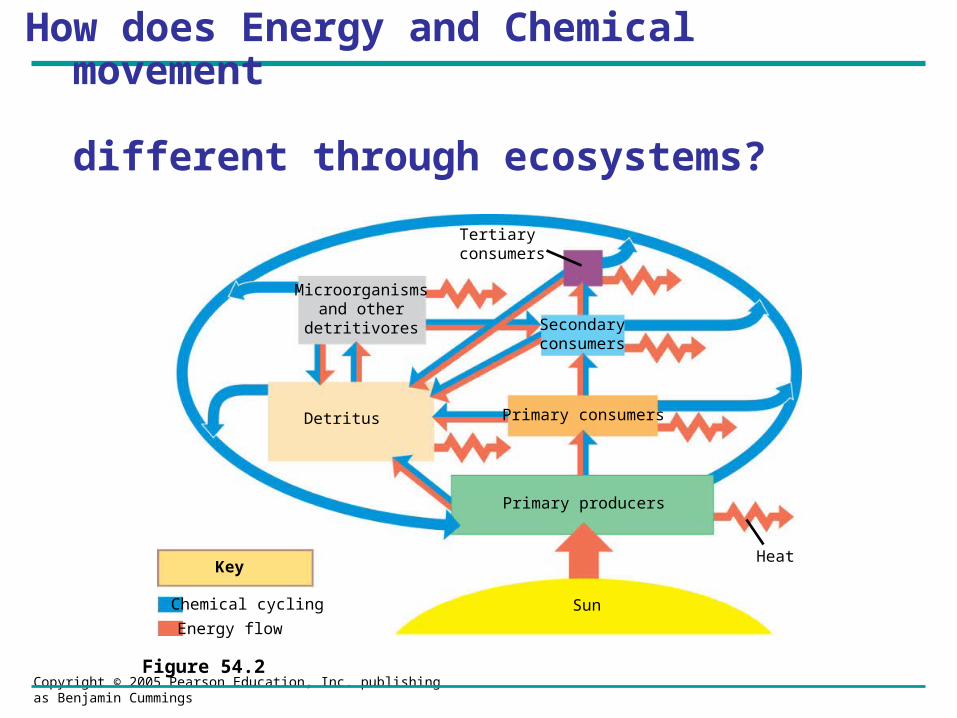
How does Energy and Chemical movement
different through ecosystems?
Figure 54.2
Microorganismsand other
detritivores
Detritus
Primary producers
Primary consumers
Secondaryconsumers
Tertiary consumers
Heat
Sun
Key
Chemical cycling
Energy flow
Copyright © 2005 Pearson Education, Inc. publishing as Benjamin Cummings
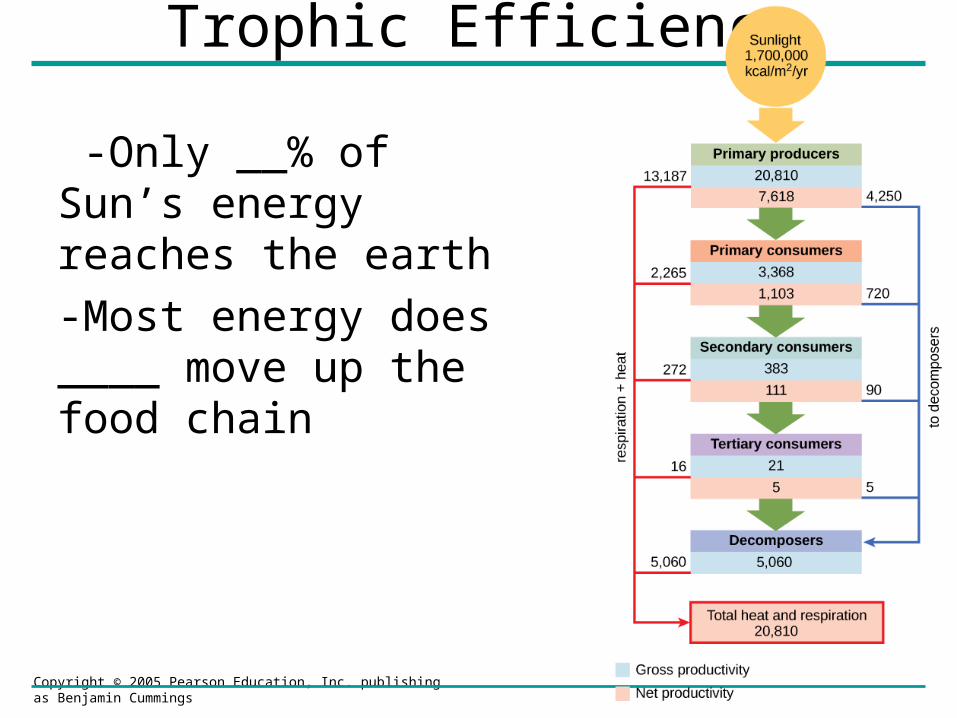
Trophic Efficiency
-Only __% of Sun’s energy reaches the earth -Most energy does ____ move up the food chain
Copyright © 2005 Pearson Education, Inc. publishing as Benjamin Cummings
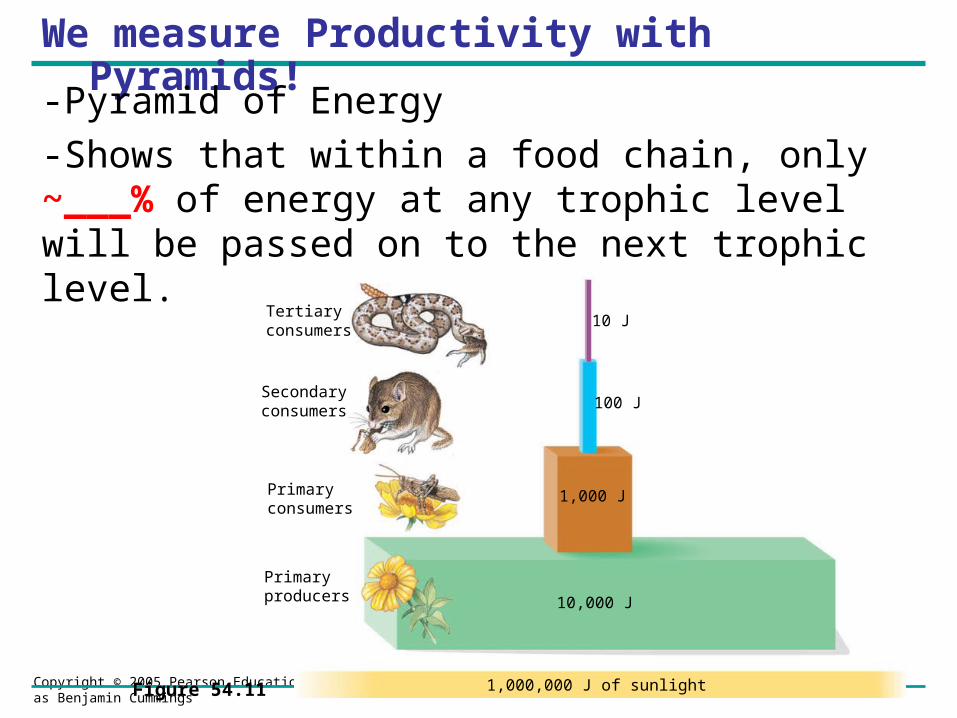
We measure Productivity with Pyramids!
-Pyramid of Energy-Shows that within a food chain, only ~___% of energy at any trophic level will be passed on to the next trophic level.
Figure 54.11
Tertiaryconsumers
Secondaryconsumers
Primaryconsumers
Primaryproducers
1,000,000 J of sunlight
10 J
100 J
1,000 J
10,000 J
Copyright © 2005 Pearson Education, Inc. publishing as Benjamin Cummings
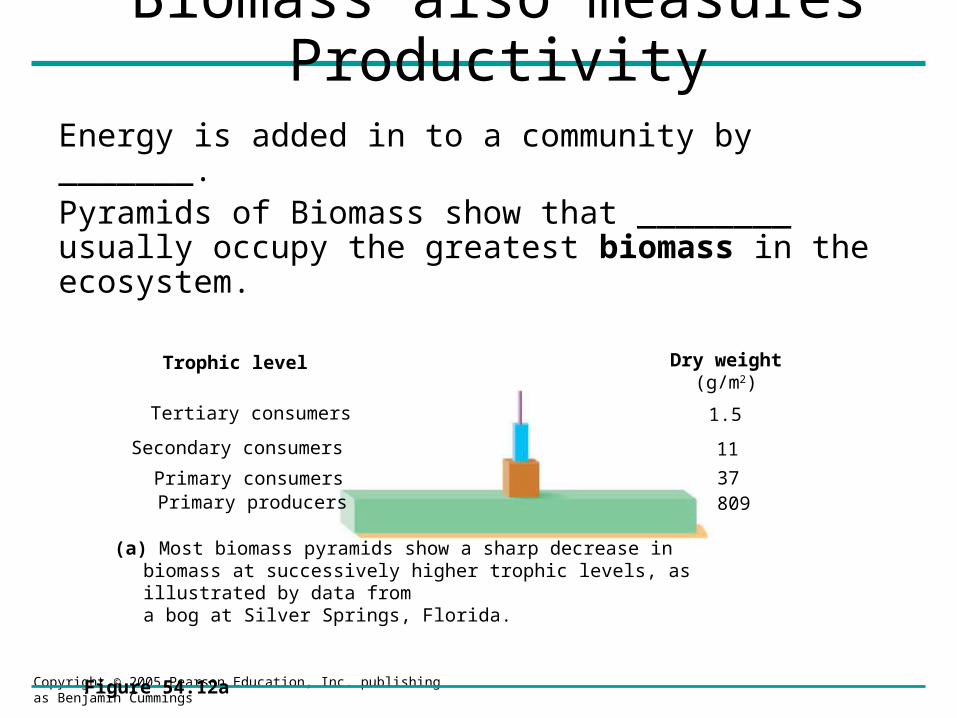
Biomass also measures Productivity
Energy is added in to a community by _______. Pyramids of Biomass show that ________ usually occupy the greatest biomass in the ecosystem.
Figure 54.12a
(a) Most biomass pyramids show a sharp decrease in biomass at successively higher trophic levels, as illustrated by data froma bog at Silver Springs, Florida.
Trophic level Dry weight(g/m2)
Primary producers
Tertiary consumers
Secondary consumers
Primary consumers
1.5
11
37809
Copyright © 2005 Pearson Education, Inc. publishing as Benjamin Cummings
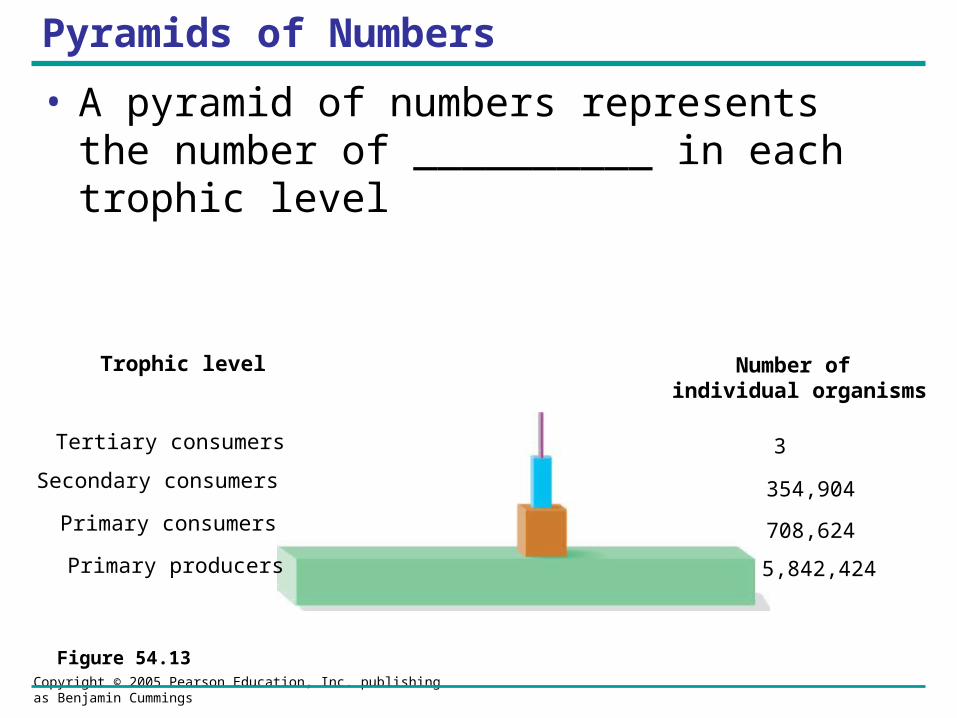
Pyramids of Numbers
• A pyramid of numbers represents the number of __________ in each trophic level
Figure 54.13
Trophic level Number of individual organisms
Primary producers
Tertiary consumers
Secondary consumers
Primary consumers
3
354,904
708,624
5,842,424
Copyright © 2005 Pearson Education, Inc. publishing as Benjamin Cummings
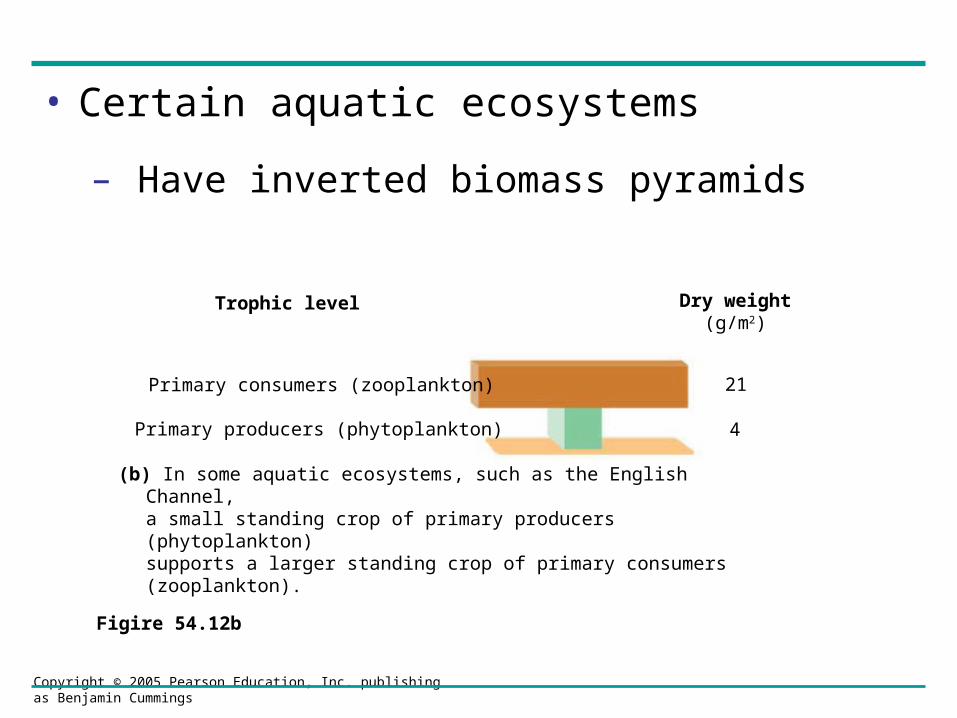
• Certain aquatic ecosystems
– Have inverted biomass pyramids
Figire 54.12b
Trophic level
Primary producers (phytoplankton)
Primary consumers (zooplankton)
(b) In some aquatic ecosystems, such as the English Channel, a small standing crop of primary producers (phytoplankton)supports a larger standing crop of primary consumers (zooplankton).
Dry weight(g/m2)
21
4
Copyright © 2005 Pearson Education, Inc. publishing as Benjamin Cummings
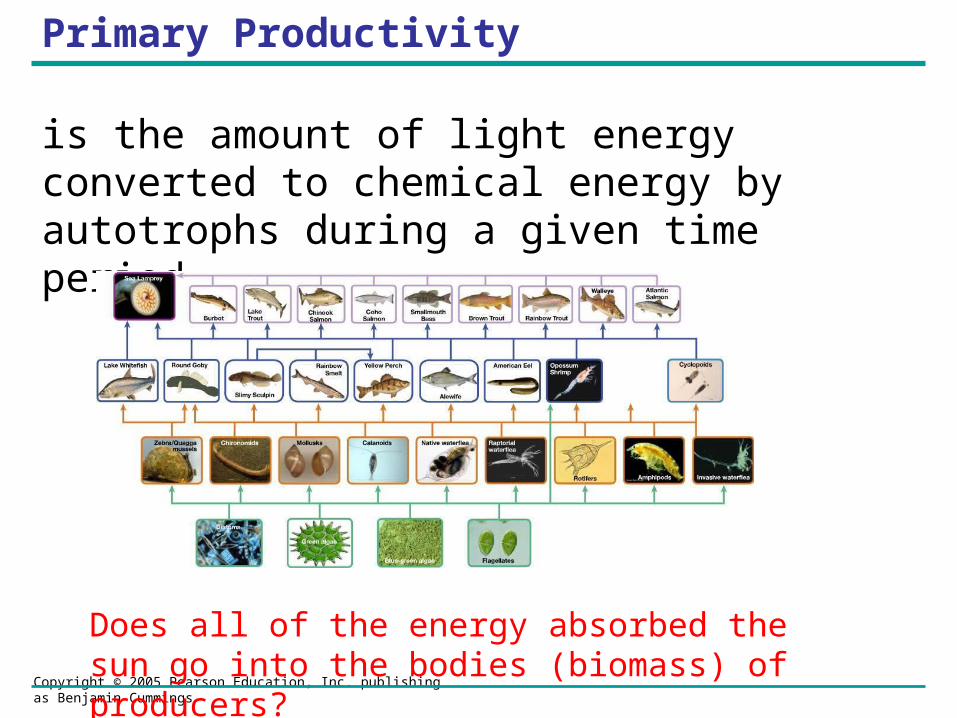
Primary Productivity
is the amount of light energy converted to chemical energy by autotrophs during a given time period
Does all of the energy absorbed the sun go into the bodies (biomass) of producers?
Copyright © 2005 Pearson Education, Inc. publishing as Benjamin Cummings
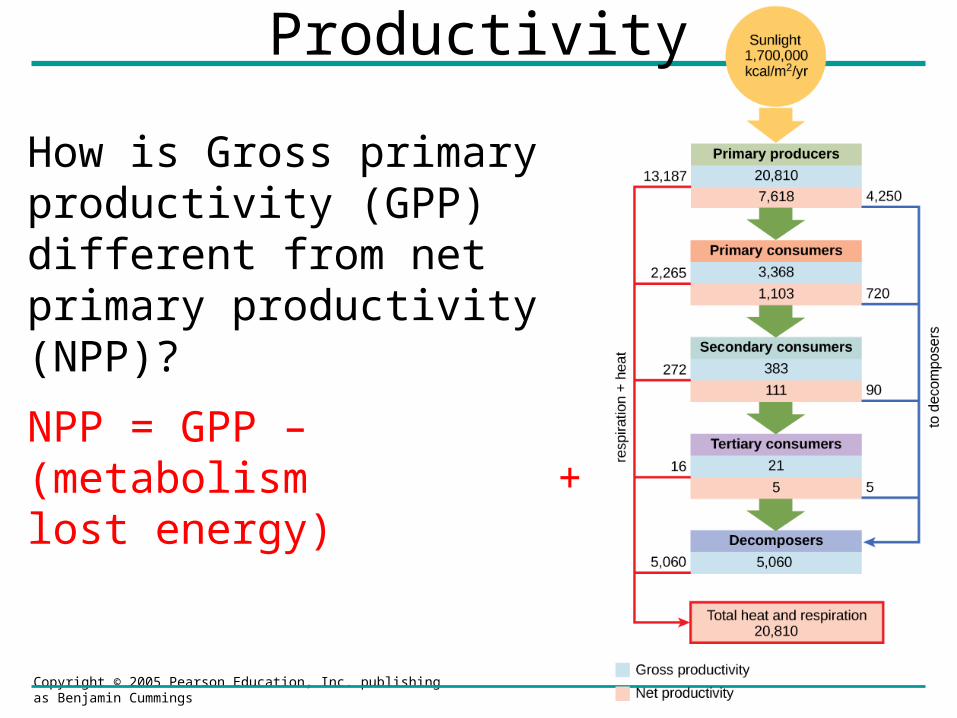
Productivity
How is Gross primary productivity (GPP) different from net primary productivity (NPP)?
NPP = GPP – (metabolism + lost energy)
Copyright © 2005 Pearson Education, Inc. publishing as Benjamin Cummings
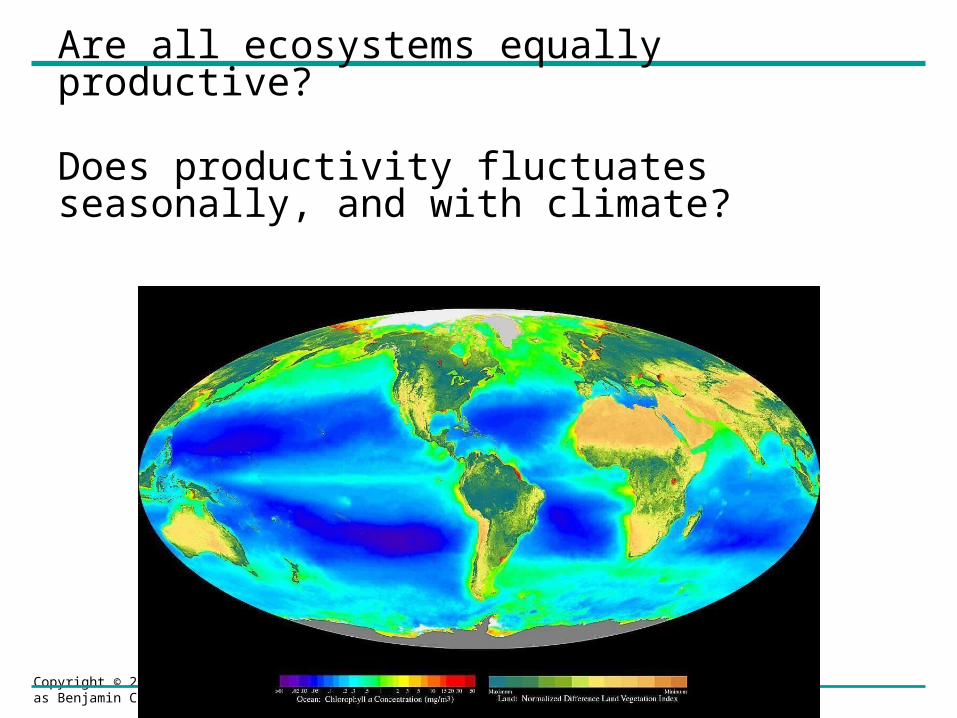
Are all ecosystems equally productive?
Does productivity fluctuates seasonally, and with climate?
Copyright © 2005 Pearson Education, Inc. publishing as Benjamin Cummings
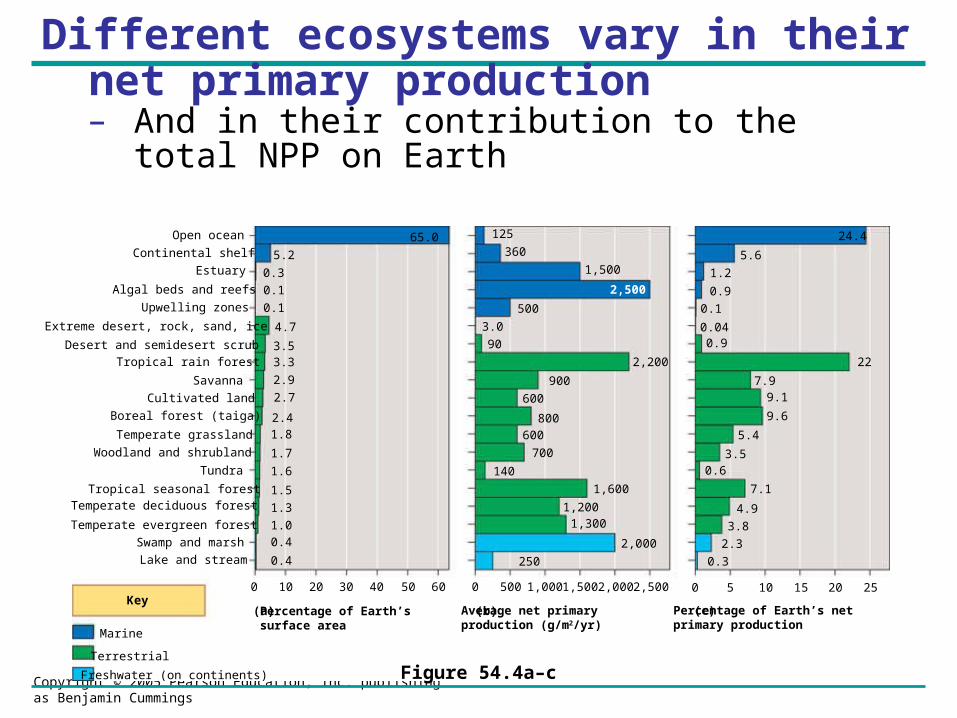
Different ecosystems vary in their net primary production– And in their contribution to the total NPP on Earth
Lake and stream
Open ocean
Continental shelf
Estuary
Algal beds and reefs
Upwelling zones
Extreme desert, rock, sand, ice
Desert and semidesert scrub
Tropical rain forest
Savanna
Cultivated land
Boreal forest (taiga)
Temperate grassland
Tundra
Tropical seasonal forestTemperate deciduous forest
Temperate evergreen forest
Swamp and marsh
Woodland and shrubland
0 10 20 30 40 50 60 0 500 1,000 1,500 2,000 2,500 0 5 10 15 20 25
Percentage of Earth’s netprimary production
Key
Marine
Freshwater (on continents)
Terrestrial
5.2
0.3
0.1
0.1
4.7
3.53.3
2.9
2.7
2.41.8
1.7
1.6
1.5
1.3
1.0
0.4
0.4
125
360
1,500
2,500
500
3.0
90
2,200
900
600
800
600
700
140
1,600
1,2001,300
2,000
250
5.6
1.2
0.9
0.1
0.040.9
22
7.99.1
9.6
5.4
3.50.6
7.1
4.9
3.8
2.3
0.3
65.0 24.4
Figure 54.4a–c
Percentage of Earth’ssurface area
(a) Average net primaryproduction (g/m2/yr)(b) (c)
Copyright © 2005 Pearson Education, Inc. publishing as Benjamin Cummings
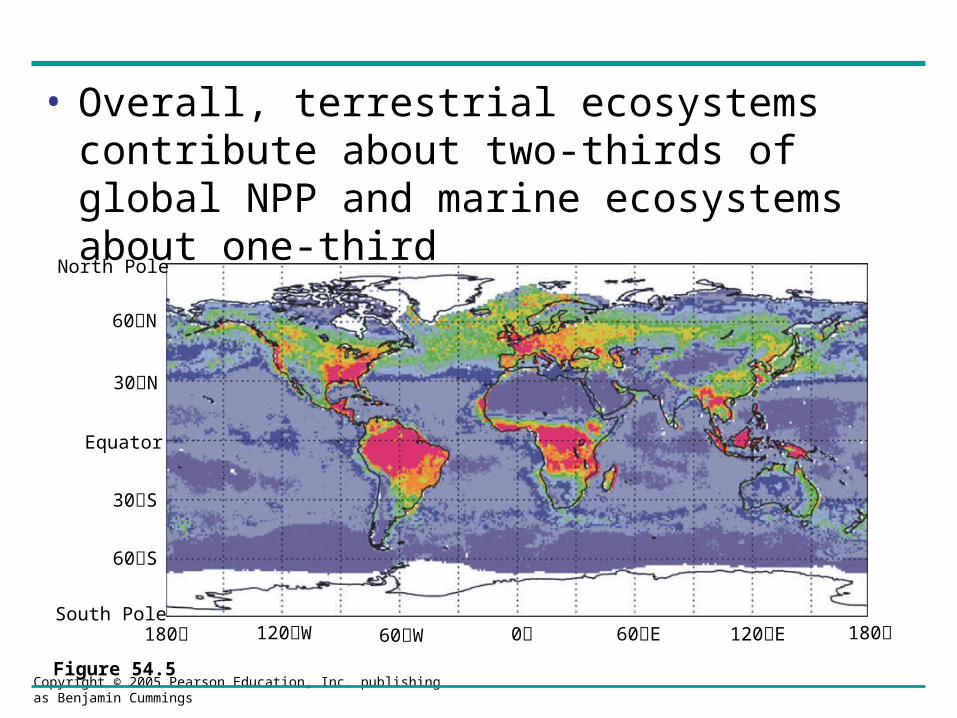
• Overall, terrestrial ecosystems contribute about two-thirds of global NPP and marine ecosystems about one-third
Figure 54.5
180 120W 60W 0 60E 120E 180
North Pole
60N
30N
Equator
30S
60S
South Pole

Copyright © 2005 Pearson Education, Inc. publishing as Benjamin Cummings
Matter Cycles
Matter cycles between abiotic and ________ reservoirs in an ecosystem
Copyright © 2005 Pearson Education, Inc. publishing as Benjamin Cummings
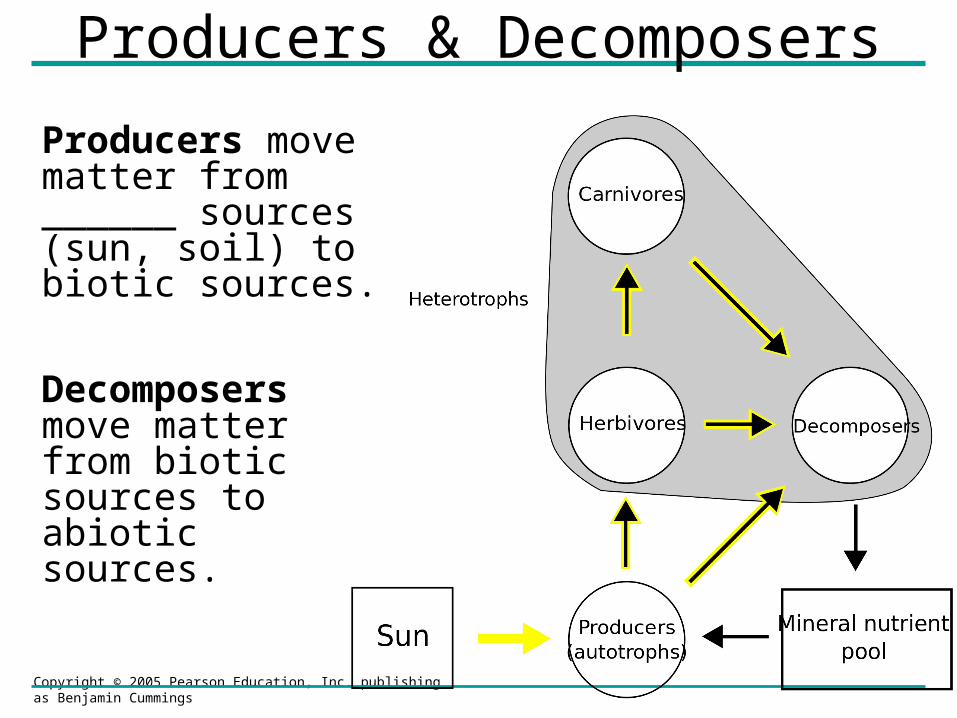
Producers & Decomposers
Producers move matter from ______ sources (sun, soil) to biotic sources.
Decomposers move matter from biotic sources to abiotic sources.
Copyright © 2005 Pearson Education, Inc. publishing as Benjamin Cummings
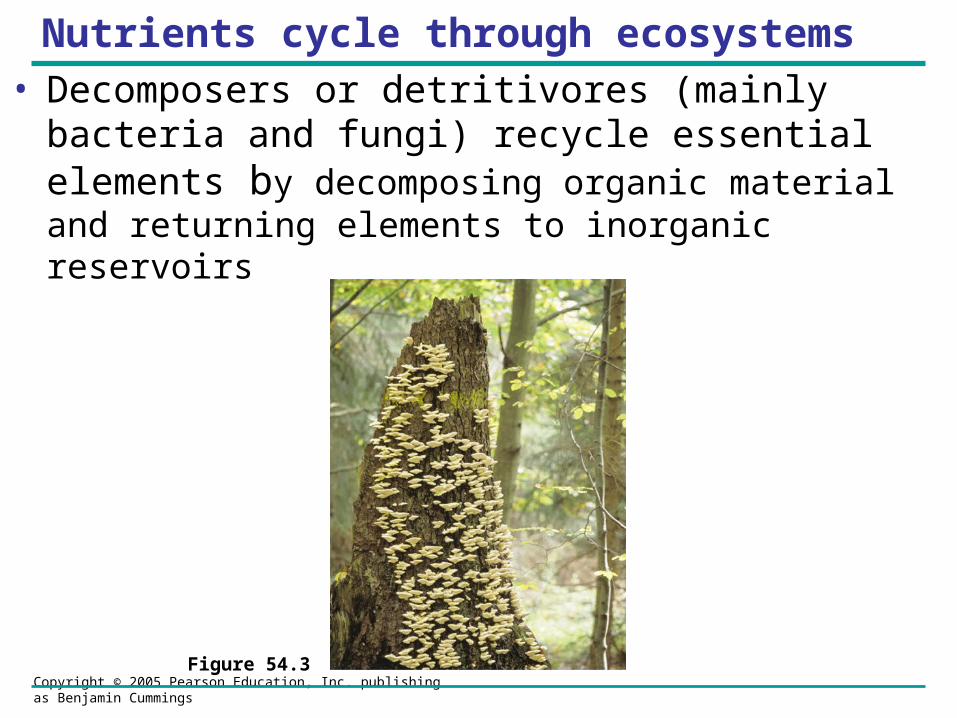
Nutrients cycle through ecosystems• Decomposers or detritivores (mainly bacteria and
fungi) recycle essential elements by decomposing organic material and returning elements to inorganic reservoirs
Figure 54.3
Copyright © 2005 Pearson Education, Inc. publishing as Benjamin Cummings
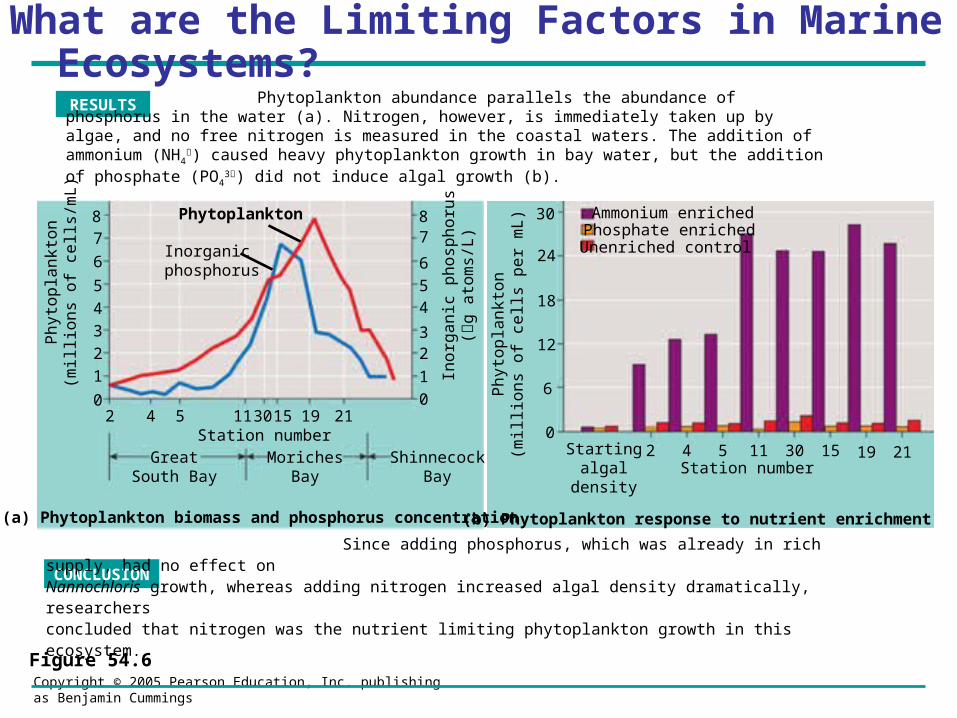
What are the Limiting Factors in Marine Ecosystems?
Figure 54.6
(a) Phytoplankton biomass and phosphorus concentration (b) Phytoplankton response to nutrient enrichment
GreatSouth Bay
MorichesBay
ShinnecockBay
Startingalgal
density
2 4 5 11 30 15 19 21
30
24
18
12
6
0
Unenriched control
Ammonium enrichedPhosphate enriched
Station number
Ph
yto
pla
nkt
on
(mill
ion
s o
f ce
lls p
er
mL
)
87
6
5
4
3
2
1
02 4 5 11 3015 19 21
87
6
54
32
1
0
Ino
rga
nic
ph
osp
ho
rus
(g
ato
ms/
L)
Ph
yto
pla
nkt
on
(mill
ion
s o
f ce
lls/m
L)
Station number
CONCLUSION Since adding phosphorus, which was already in rich supply, had no effect on Nannochloris growth, whereas adding nitrogen increased algal density dramatically, researchers concluded that nitrogen was the nutrient limiting phytoplankton growth in this ecosystem.
Phytoplankton
Inorganicphosphorus
RESULTS Phytoplankton abundance parallels the abundance of phosphorus in the water (a). Nitrogen, however, is immediately taken up by algae, and no free nitrogen is measured in the coastal waters. The addition of ammonium (NH4
) caused heavy phytoplankton growth in bay water, but the addition of phosphate (PO4
3) did not induce algal growth (b).
Copyright © 2005 Pearson Education, Inc. publishing as Benjamin Cummings
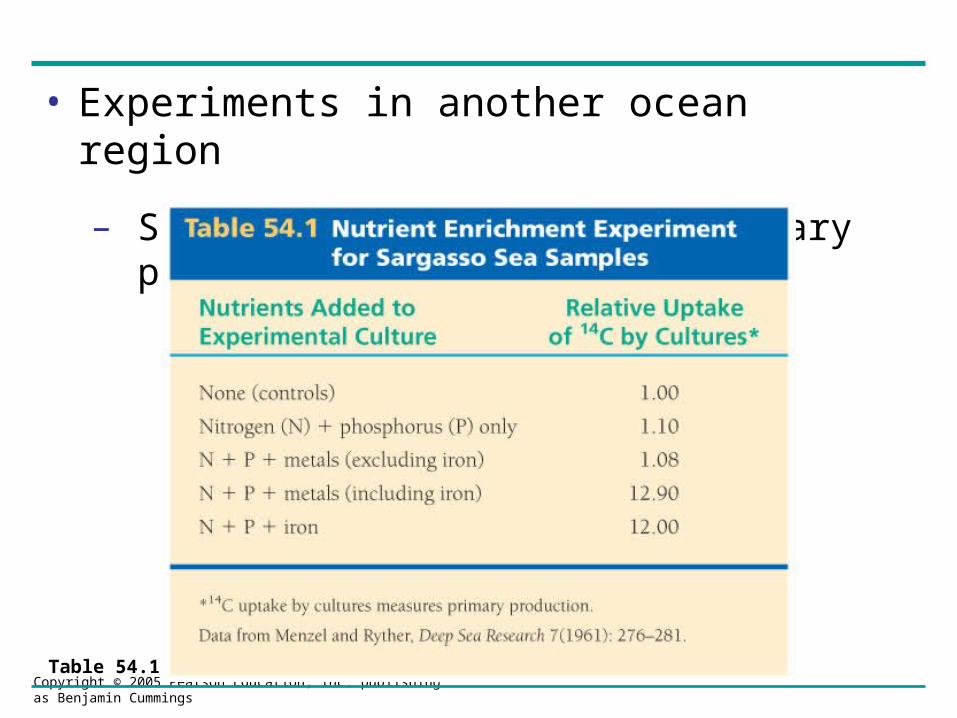
• Experiments in another ocean region
– Showed that iron limited primary production
Table 54.1
Copyright © 2005 Pearson Education, Inc. publishing as Benjamin Cummings
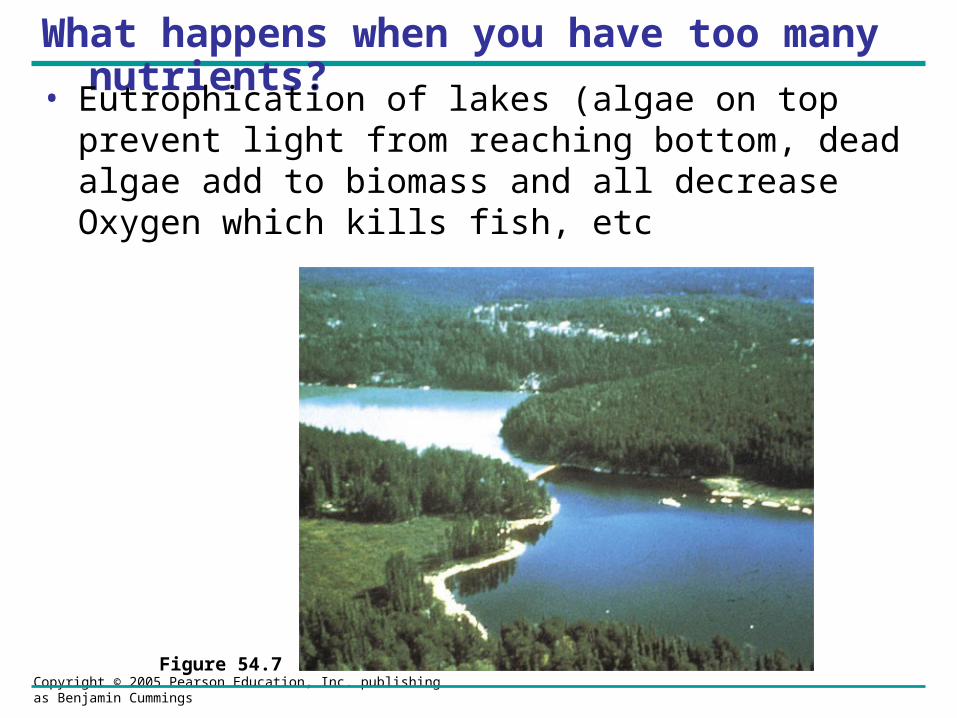
What happens when you have too many nutrients?
• Eutrophication of lakes (algae on top prevent light from reaching bottom, dead algae add to biomass and all decrease Oxygen which kills fish, etc
Figure 54.7
Copyright © 2005 Pearson Education, Inc. publishing as Benjamin Cummings
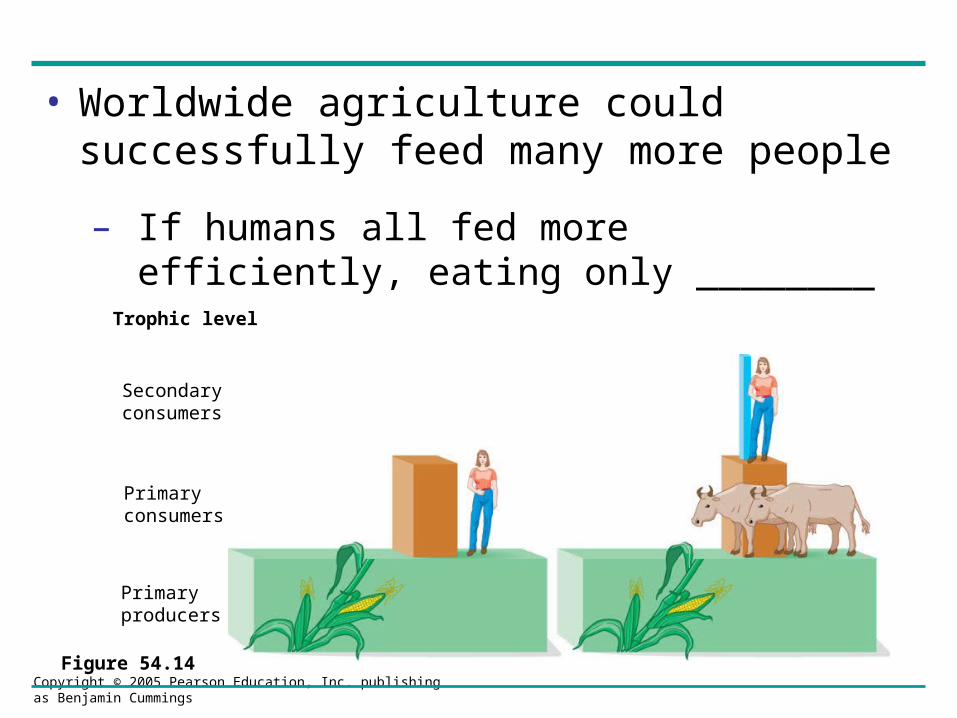
• Worldwide agriculture could successfully feed many more people
– If humans all fed more efficiently, eating only ________
Figure 54.14
Trophic level
Secondaryconsumers
Primaryconsumers
Primaryproducers
Copyright © 2005 Pearson Education, Inc. publishing as Benjamin Cummings
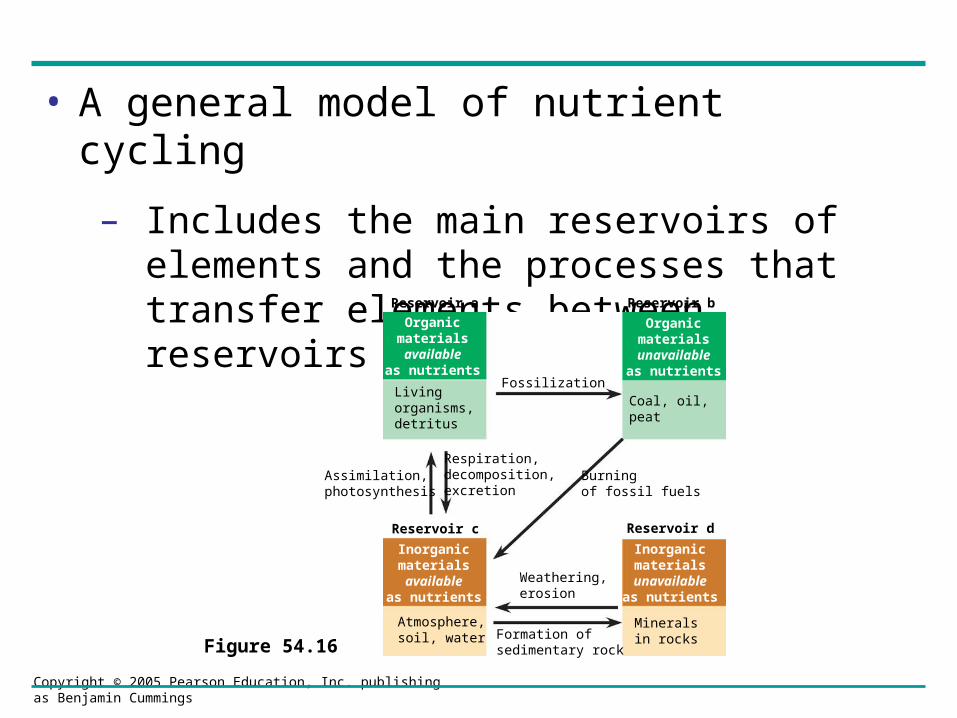
• A general model of nutrient cycling
– Includes the main reservoirs of elements and the processes that transfer elements between reservoirs
Figure 54.16
Organicmaterialsavailable
as nutrients
Livingorganisms,detritus
Organicmaterialsunavailableas nutrients
Coal, oil,peat
Inorganicmaterialsavailable
as nutrients
Inorganicmaterialsunavailableas nutrients
Atmosphere,soil, water
Mineralsin rocksFormation of
sedimentary rock
Weathering,erosion
Respiration,decomposition,excretion
Burningof fossil fuels
Fossilization
Reservoir a Reservoir b
Reservoir c Reservoir d
Assimilation, photosynthesis
Copyright © 2005 Pearson Education, Inc. publishing as Benjamin Cummings
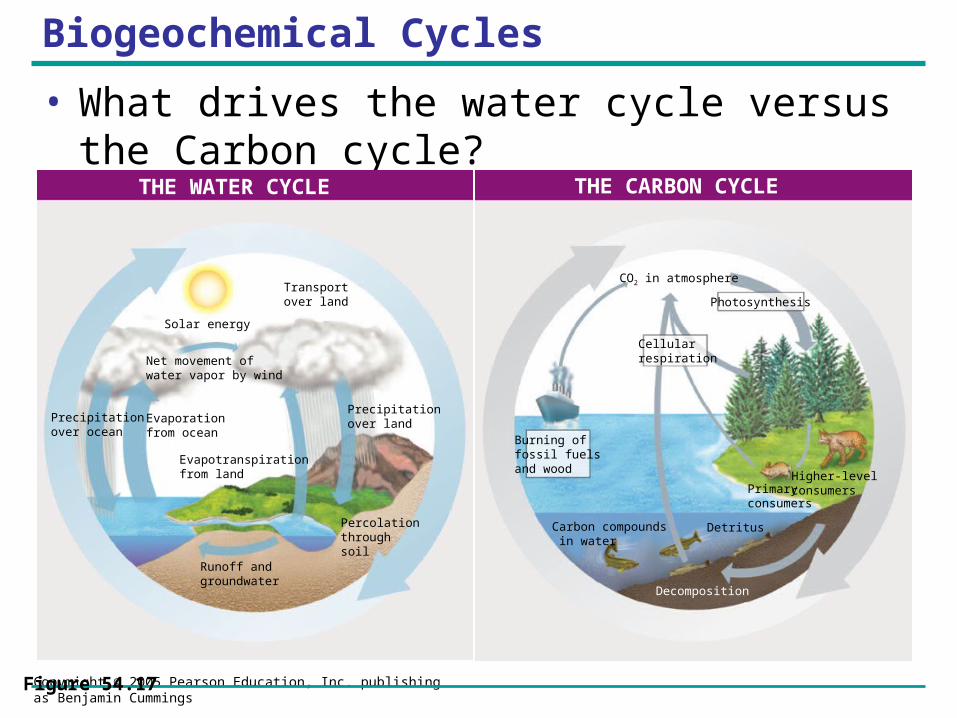
Biogeochemical Cycles
• What drives the water cycle versus the Carbon cycle?
Figure 54.17
Transportover land
Solar energy
Net movement ofwater vapor by wind
Precipitationover ocean
Evaporationfrom ocean
Evapotranspirationfrom land
Precipitationover land
Percolationthroughsoil
Runoff andgroundwater
CO2 in atmosphere
Photosynthesis
Cellularrespiration
Burning offossil fuelsand wood
Higher-levelconsumersPrimary
consumers
DetritusCarbon compounds in water
Decomposition
THE WATER CYCLE THE CARBON CYCLE
Copyright © 2005 Pearson Education, Inc. publishing as Benjamin Cummings
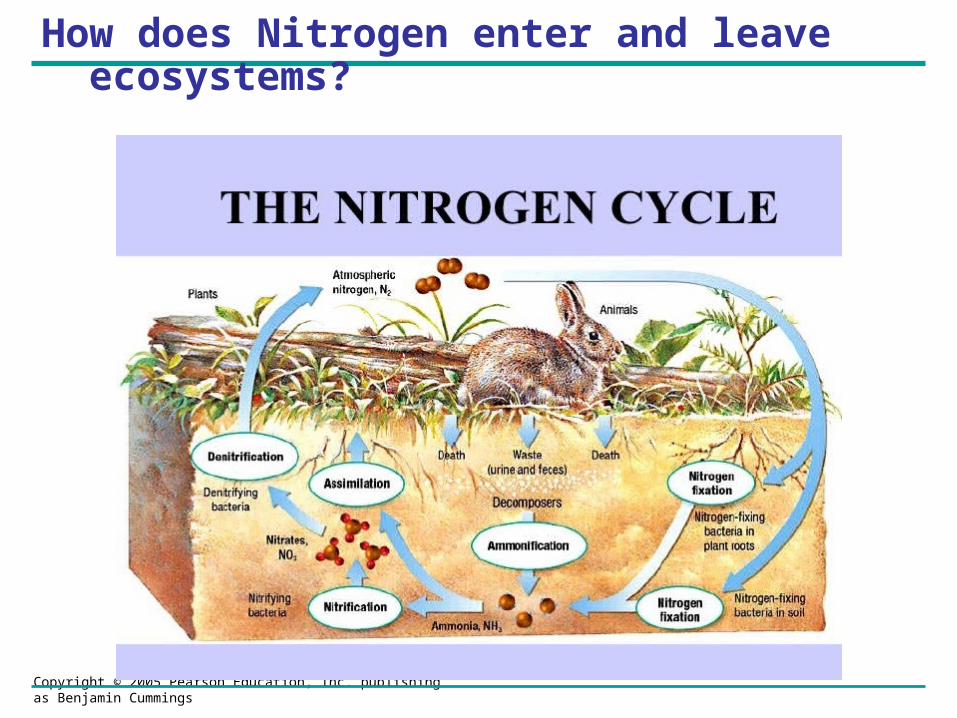
How does Nitrogen enter and leave ecosystems?
Copyright © 2005 Pearson Education, Inc. publishing as Benjamin Cummings
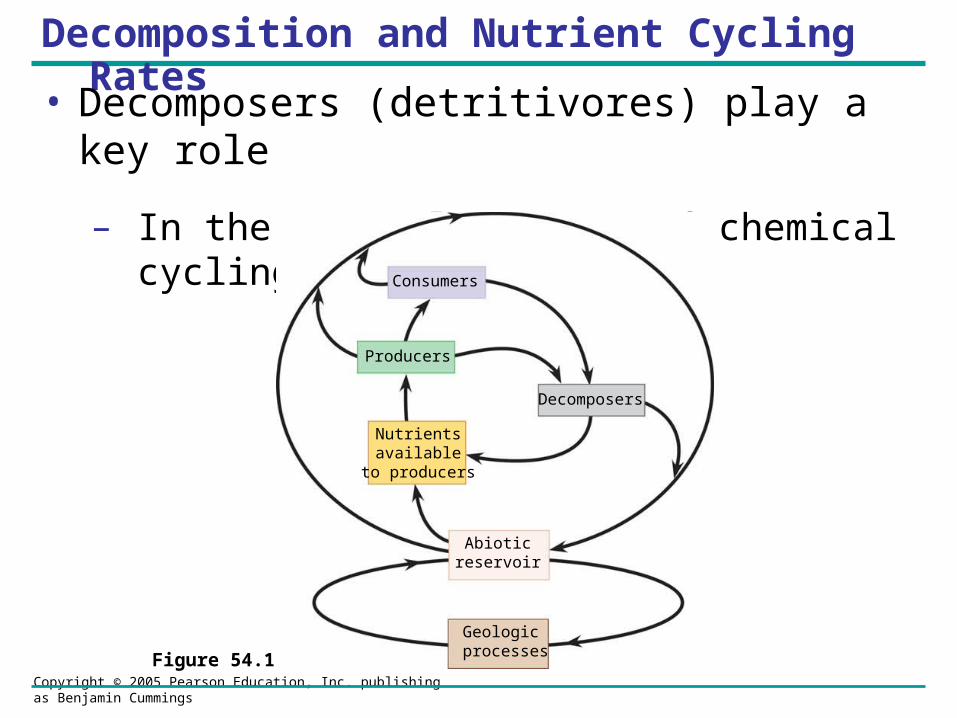
Decomposition and Nutrient Cycling Rates
• Decomposers (detritivores) play a key role
– In the general pattern of chemical cycling
Figure 54.18
Consumers
Producers
Nutrientsavailable
to producers
Abioticreservoir
Geologicprocesses
Decomposers
Copyright © 2005 Pearson Education, Inc. publishing as Benjamin Cummings
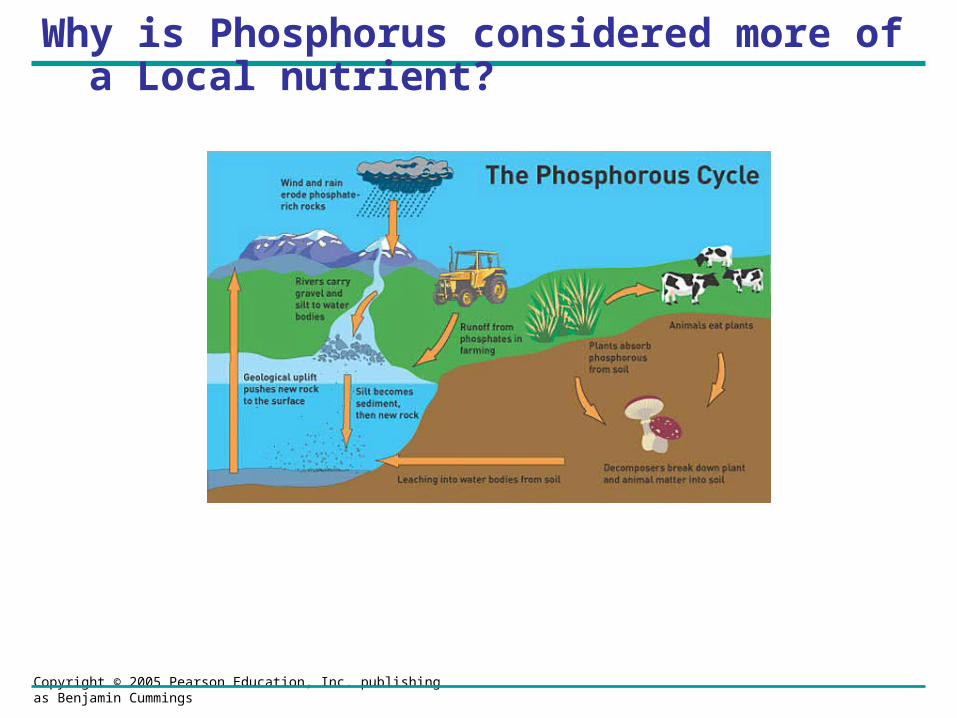
Why is Phosphorus considered more of a Local nutrient?
Copyright © 2005 Pearson Education, Inc. publishing as Benjamin Cummings
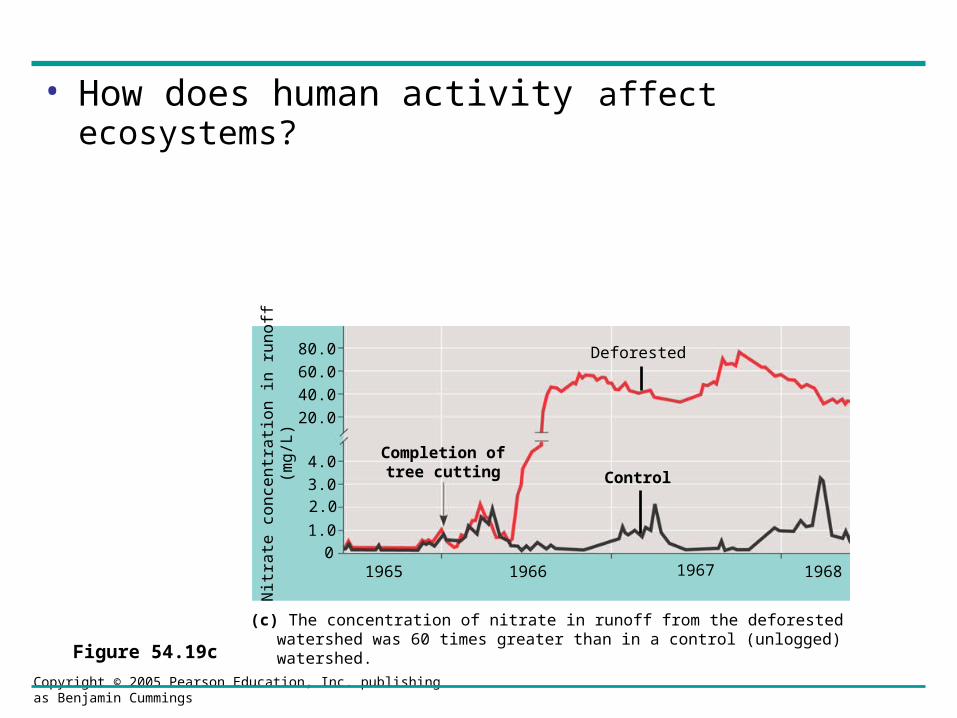
• How does human activity affect ecosystems?
Figure 54.19c(c) The concentration of nitrate in runoff from the deforested watershed was 60 times
greater than in a control (unlogged) watershed.
Nitr
ate
co
nce
ntr
atio
n in
ru
no
ff(m
g/L
)
Deforested
Control
Completion oftree cutting
1965 1966 1967 1968
80.0
60.0
40.0
20.0
4.0
3.02.0
1.0
0
Copyright © 2005 Pearson Education, Inc. publishing as Benjamin Cummings
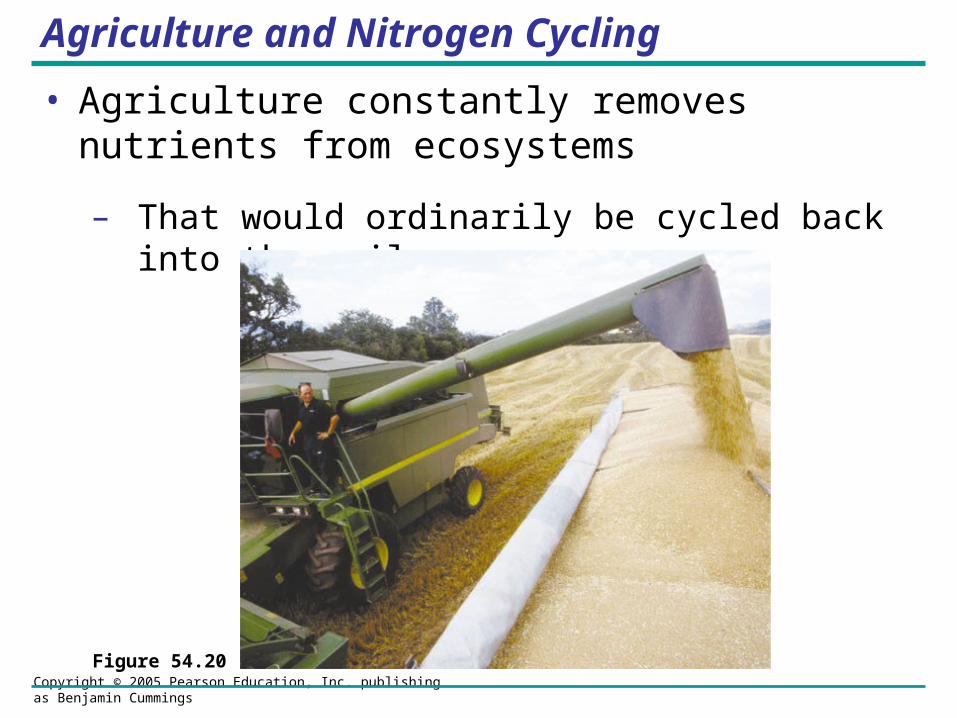
Agriculture and Nitrogen Cycling
• Agriculture constantly removes nutrients from ecosystems
– That would ordinarily be cycled back into the soil
Figure 54.20
Copyright © 2005 Pearson Education, Inc. publishing as Benjamin Cummings
• Nitrogen is the main nutrient lost through agriculture
– Thus, agriculture has a great impact on the nitrogen cycle
• Industrially produced fertilizer is typically used to replace lost nitrogen
– But the effects on an ecosystem can be harmful

Copyright © 2005 Pearson Education, Inc. publishing as Benjamin Cummings
Contamination of Aquatic Ecosystems
• The critical load for a nutrient
– Is the amount of that nutrient that can be absorbed by plants in an ecosystem without damaging it
Copyright © 2005 Pearson Education, Inc. publishing as Benjamin Cummings
• When excess nutrients are added to an ecosystem, the critical load is exceeded
– And the remaining nutrients can contaminate groundwater and freshwater and marine ecosystems
Copyright © 2005 Pearson Education, Inc. publishing as Benjamin Cummings
• Sewage runoff contaminates freshwater ecosystems
– Causing cultural eutrophication, excessive algal growth, which can cause significant harm to these ecosystems
Copyright © 2005 Pearson Education, Inc. publishing as Benjamin Cummings
Acid Precipitation
• Combustion of fossil fuels
– Is the main cause of acid precipitation
Copyright © 2005 Pearson Education, Inc. publishing as Benjamin Cummings
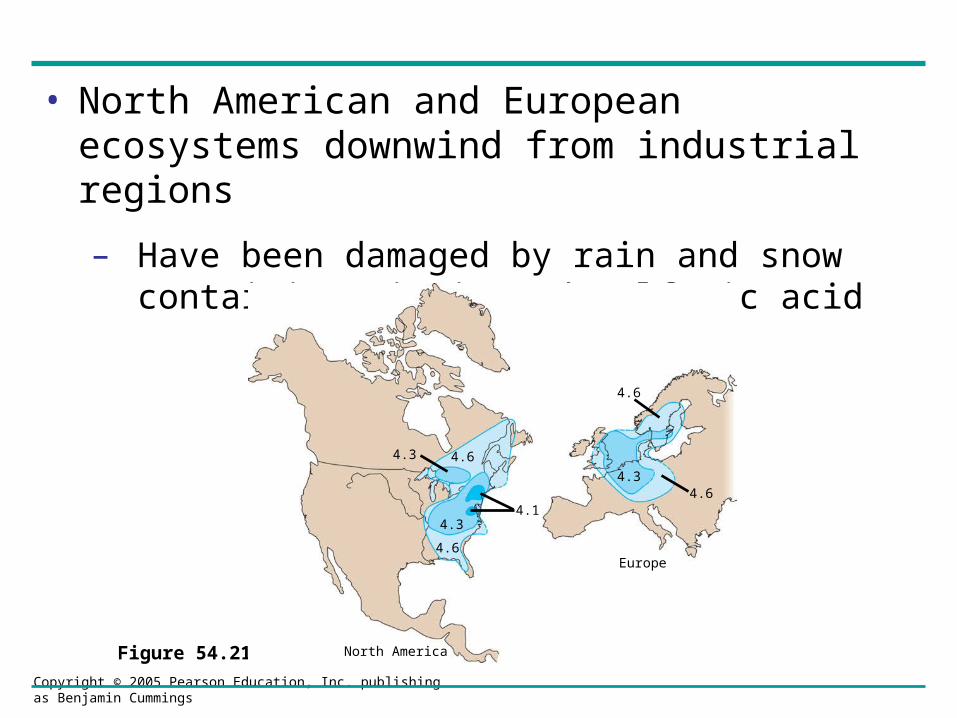
• North American and European ecosystems downwind from industrial regions
– Have been damaged by rain and snow containing nitric and sulfuric acid
Figure 54.21
4.6
4.64.3
4.14.3
4.6
4.64.3
Europe
North America
Copyright © 2005 Pearson Education, Inc. publishing as Benjamin Cummings
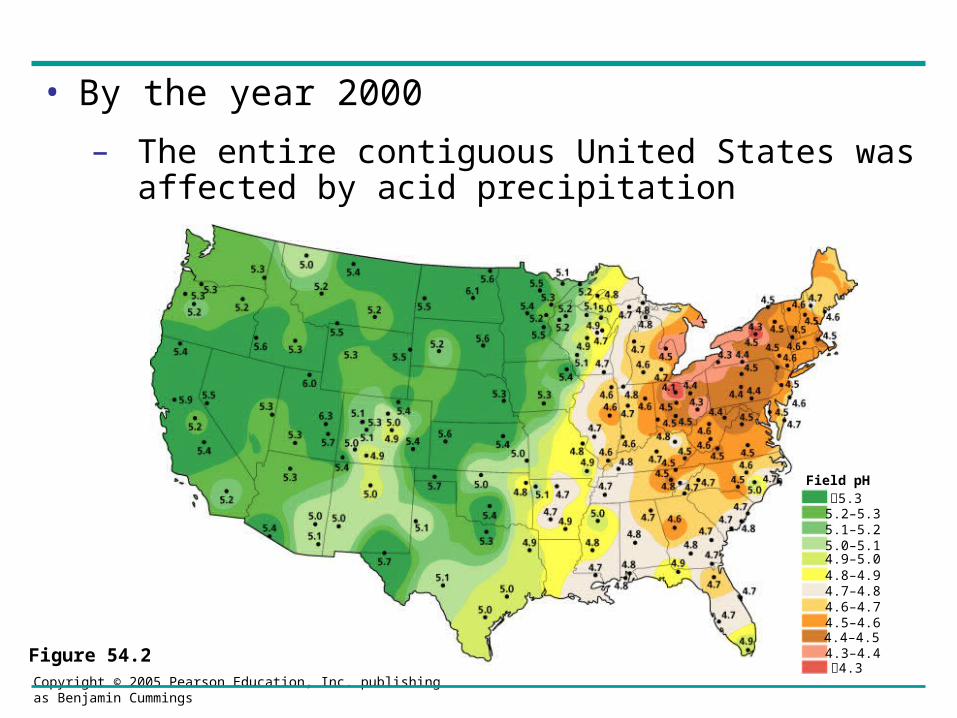
• By the year 2000
– The entire contiguous United States was affected by acid precipitation
Figure 54.22
Field pH5.35.2–5.35.1–5.25.0–5.14.9–5.04.8–4.94.7–4.84.6–4.74.5–4.64.4–4.54.3–4.44.3
Copyright © 2005 Pearson Education, Inc. publishing as Benjamin Cummings
• Environmental regulations and new industrial technologies
– Have allowed many developed countries to reduce sulfur dioxide emissions in the past 30 years
Copyright © 2005 Pearson Education, Inc. publishing as Benjamin Cummings
Toxins in the Environment
• Humans release an immense variety of toxic chemicals
– Including thousands of synthetics previously unknown to nature
• One of the reasons such toxins are so harmful
– Is that they become more concentrated in successive trophic levels of a food web
Copyright © 2005 Pearson Education, Inc. publishing as Benjamin Cummings
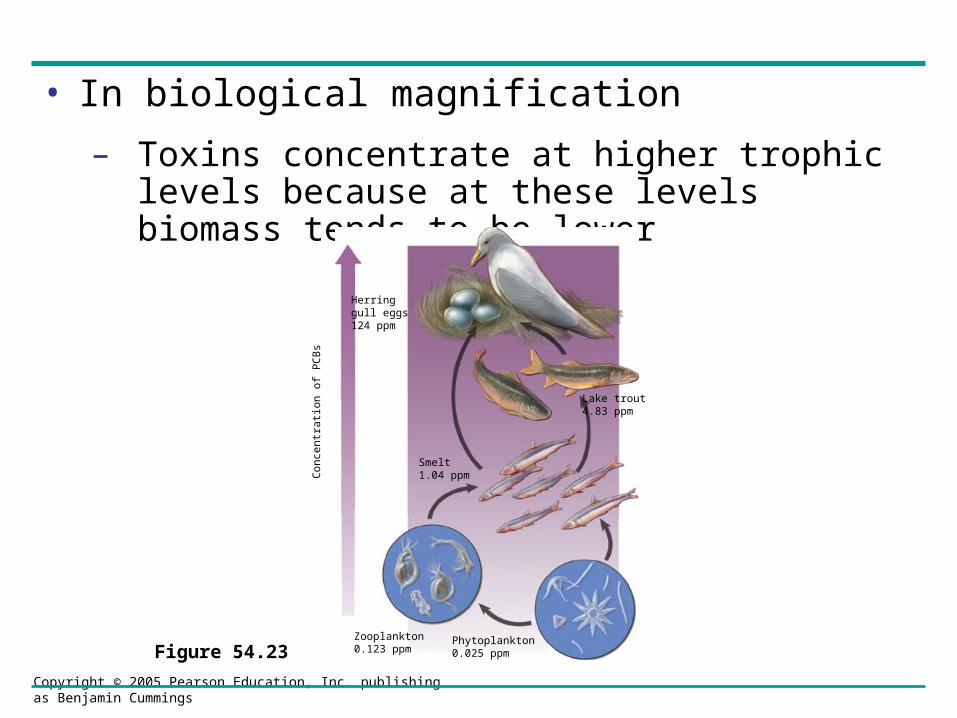
• In biological magnification
– Toxins concentrate at higher trophic levels because at these levels biomass tends to be lower
Figure 54.23
Con
cent
ratio
n of
PC
Bs
Herringgull eggs124 ppm
Zooplankton 0.123 ppm
Phytoplankton 0.025 ppm
Lake trout 4.83 ppm
Smelt 1.04 ppm
Copyright © 2005 Pearson Education, Inc. publishing as Benjamin Cummings
• In some cases, harmful substances
– Persist for long periods of time in an ecosystem and continue to cause harm
Copyright © 2005 Pearson Education, Inc. publishing as Benjamin Cummings
Atmospheric Carbon Dioxide
• One pressing problem caused by human activities
– Is the rising level of atmospheric carbon dioxide
Copyright © 2005 Pearson Education, Inc. publishing as Benjamin Cummings
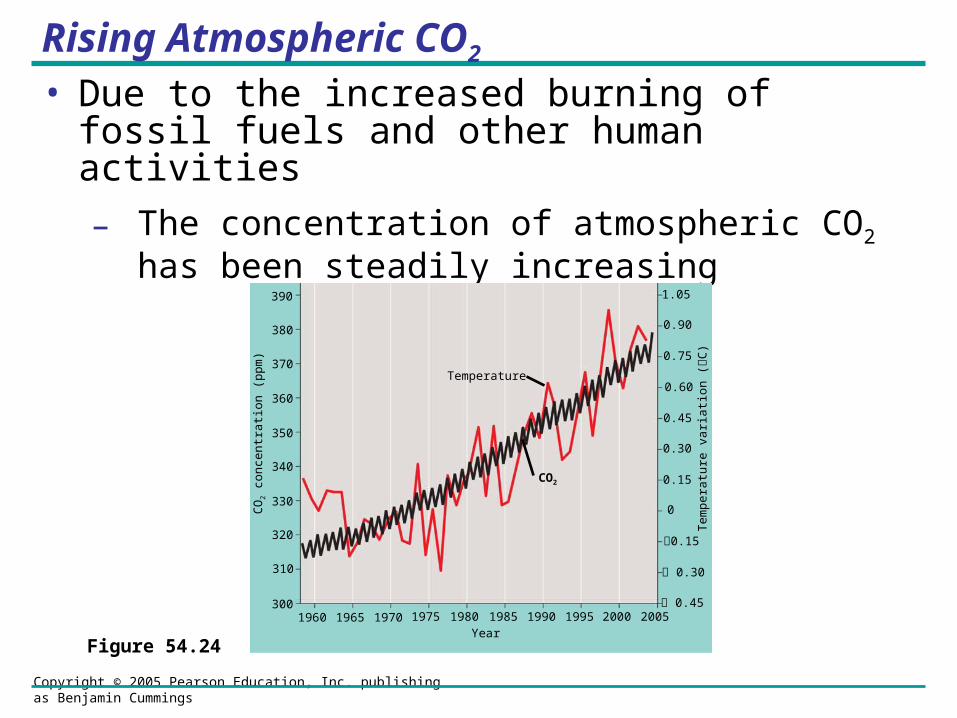
Rising Atmospheric CO2
• Due to the increased burning of fossil fuels and other human activities
– The concentration of atmospheric CO2 has been steadily increasing
Figure 54.24
CO
2 c
onc
en
trat
ion
(pp
m)
390
380
370
360
350
340
330
320
310
3001960 1965 1970 1975 1980 1985 1990 1995 2000 2005
1.05
0.90
0.75
0.60
0.45
0.30
0.15
0
0.15
0.30
0.45
Te
mp
era
ture
va
ria
tion
(
C)
Temperature
CO2
Year
Copyright © 2005 Pearson Education, Inc. publishing as Benjamin Cummings
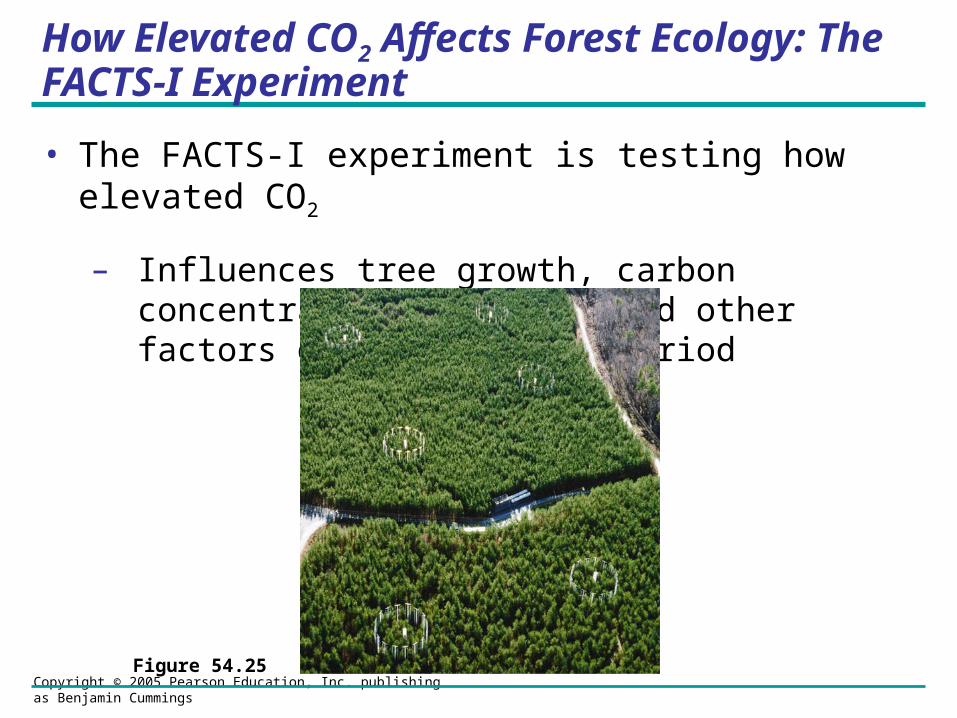
How Elevated CO2 Affects Forest Ecology: The FACTS-I Experiment
• The FACTS-I experiment is testing how elevated CO2
– Influences tree growth, carbon concentration in soils, and other factors over a ten-year period
Figure 54.25
Copyright © 2005 Pearson Education, Inc. publishing as Benjamin Cummings
The Greenhouse Effect and Global Warming
• The greenhouse effect is caused by atmospheric CO2
– But is necessary to keep the surface of the Earth at a habitable temperature
Copyright © 2005 Pearson Education, Inc. publishing as Benjamin Cummings
• Increased levels of atmospheric CO2 are magnifying the greenhouse effect
– Which could cause global warming and significant climatic change
Copyright © 2005 Pearson Education, Inc. publishing as Benjamin Cummings
Depletion of Atmospheric Ozone
• Life on Earth is protected from the damaging effects of UV radiation
– By a protective layer or ozone molecules present in the atmosphere
Copyright © 2005 Pearson Education, Inc. publishing as Benjamin Cummings
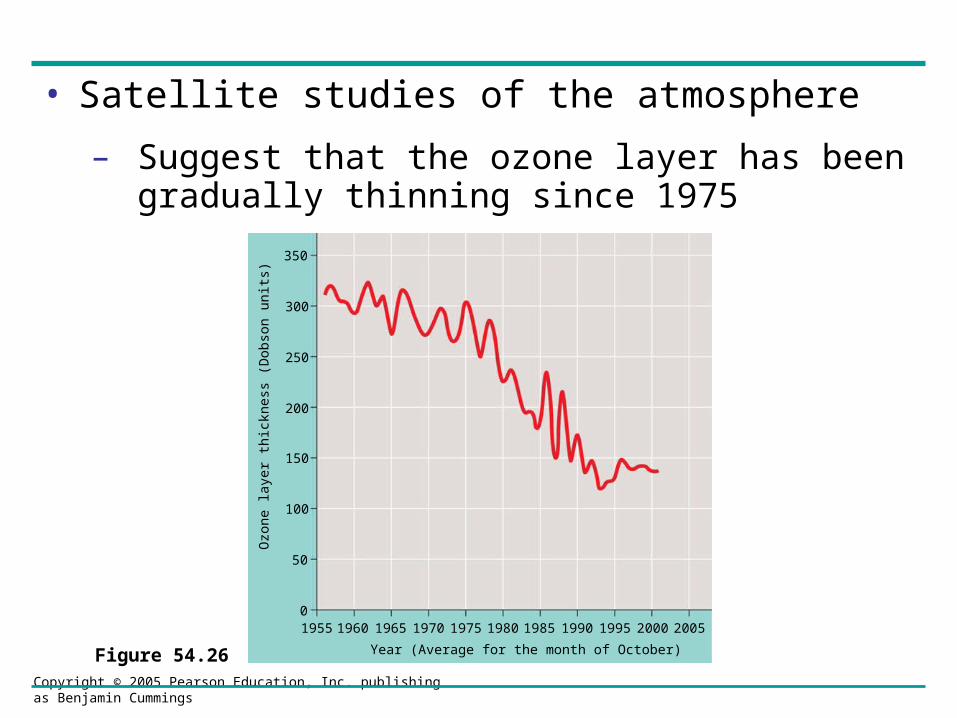
• Satellite studies of the atmosphere
– Suggest that the ozone layer has been gradually thinning since 1975
Figure 54.26
Ozo
ne la
yer
thic
knes
s (D
obso
n un
its)
Year (Average for the month of October)
350
300
250
200
150
100
50
01955 1960 1965 1970 1975 1980 1985 1990 1995 2000 2005
Copyright © 2005 Pearson Education, Inc. publishing as Benjamin Cummings
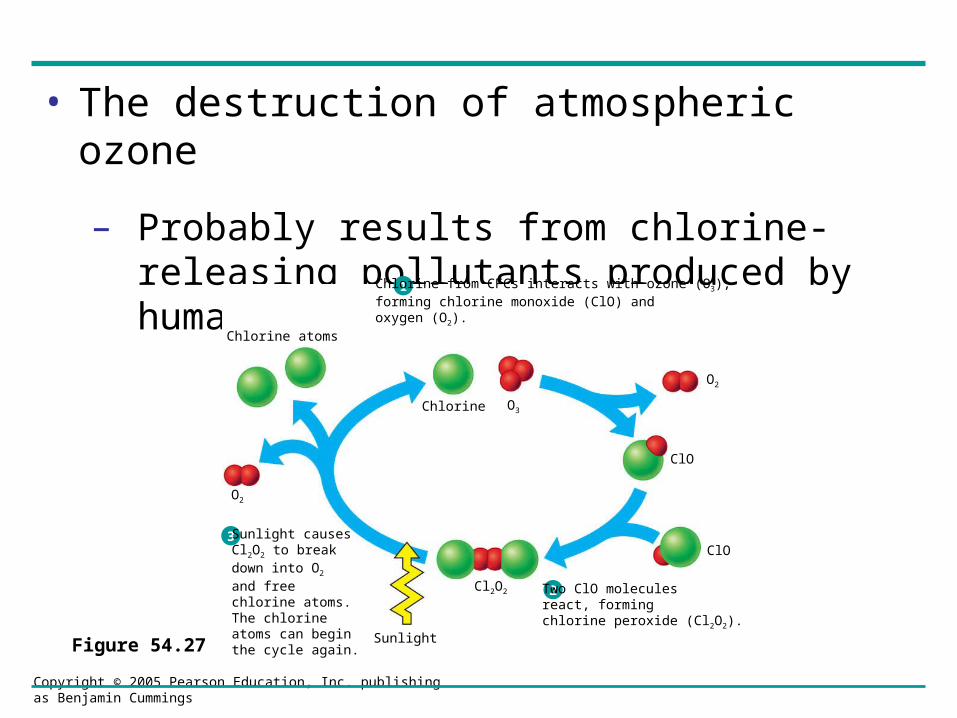
• The destruction of atmospheric ozone
– Probably results from chlorine-releasing pollutants produced by human activity
Figure 54.27
1
2
3
Chlorine from CFCs interacts with ozone (O3),forming chlorine monoxide (ClO) and oxygen (O2).
Two ClO molecules react, forming chlorine peroxide (Cl2O2).
Sunlight causes Cl2O2 to break down into O2 and free chlorine atoms. The chlorine atoms can begin the cycle again.
Sunlight
Chlorine O3
O2
ClO
ClO
Cl2O2
O2
Chlorine atoms
Copyright © 2005 Pearson Education, Inc. publishing as Benjamin Cummings
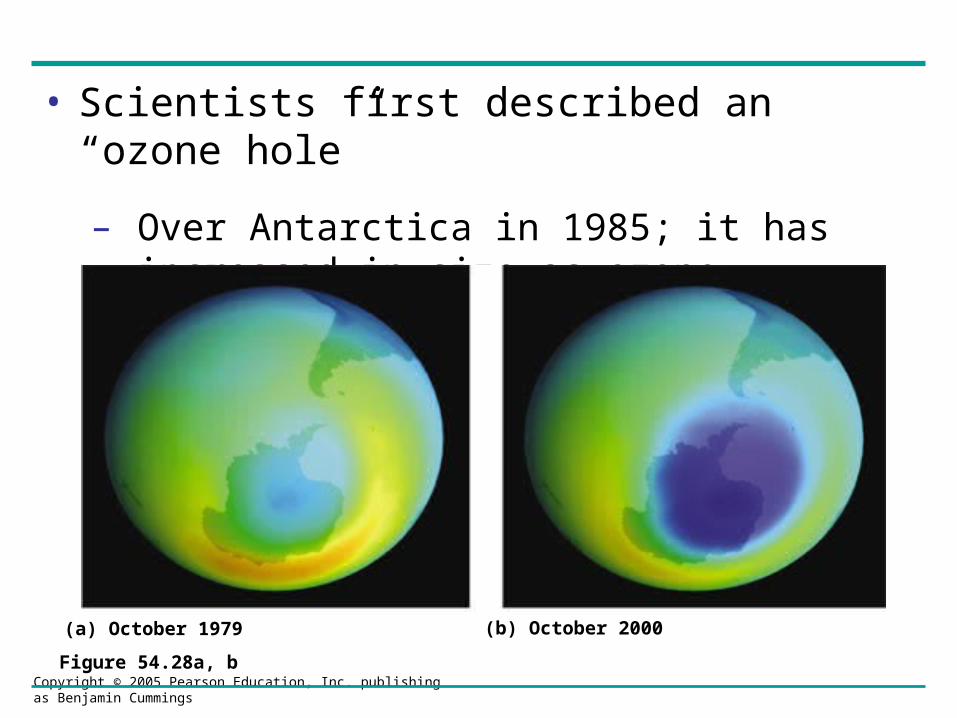
• Scientists first described an “ozone hole”
– Over Antarctica in 1985; it has increased in size as ozone depletion has increased
Figure 54.28a, b
(a) October 1979 (b) October 2000