copyright ® 2005 global insight, inc. global insight’s industry outlook worldwide: winners and...
TRANSCRIPT

Copyright ® 2005 Global Insight, Inc.
Global Insight’s Industry Outlook Worldwide: Winners and Losers
Mark Killion, CFA
Managing DirectorWorld Industry Service
Global Insight
April 2005

2Copyright ® 2005 Global Insight, Inc.
Agenda – Global Outlook for Sector Activity
World Industry Service (WIS) provides sector data and benchmark forecasts for sales, growth, returns and risks
Globally consistent views, harmonized sector indicators Flexible benchmarks for each company’s own sector “peer group”, as well
as all the sectors that represent key markets for each company
Comparative sector performances, industry forecasts Which sectors enjoy the fastest growth? What geographies are driving sector activity?
Global Benchmarks of Production, Trade and Capital Sales Patterns, Profits Growth, Profit Margin Exports, Imports, Fixed Capital Expenditures

3Copyright ® 2005 Global Insight, Inc.
Introduction to the World Industry Service (WIS)
Unique set of global sector fundamental data, financial benchmarks, written reports, sector experts
Harmonized set of industries and indicators allow comparisons and aggregations across sectors and geography
71 industries and sub sectors that together comprise the entire economy; available for each of 70 countries/economies
Sales, Profits, Demand, Exports, Imports, CapEx, Prices
History since 1980 with forecasts 10+ years out
User friendly interface for navigation through choice of sector, country, indicator, time frame; all delivered via Web
Flexible metrics and reports for use in sales forecasting, credit risk management, corporate strategy, research

4Copyright ® 2005 Global Insight, Inc.
Global Sectors Analysts interact with Country Macroeconomic Experts
Sector Forecasts
Autos Energy Chemicals Construction Tourism Health Care Transport Communications Financial
Global Sector Expertise
Glo
bal M
acroeco
no
mic E
xpertise
World Industry Service• All Countries• All Sectors• Harmonized to Common Standard
World Industry Service• All Countries• All Sectors• Harmonized to Common Standard
U.S. MacroEconomics
U.S. MacroEconomics
Asia, Latin America, Rest of World
Macro Economics
Asia, Latin America, Rest of World
Macro Economics
West and EastEurope Macro
Economics
West and EastEurope Macro
Economics
WIS sector forecasts incorporate both the country and industry perspectives

5Copyright ® 2005 Global Insight, Inc.
Common Applications of WIS Available for Review
1) Custom Market Indexes Follow key customer performances, calculate market share, forecast sales for business segments and geographyhttp://www.globalinsight.com/Highlight/HighlightDetail133.htm
2) Sector Risk RatingManage risk exposure by tracking industry level changes in credit and operating risk, stress test portfolios with simulations and alternate “house view” scenarios http://www.globalinsight.com/Highlights/HighlightDetail1103.htm
3) Key Drivers for TechnologyUse Global Sector Activity and Spending as Key Drivers for technology sector forecasts, or research into industry structurehttp://www.globalinsight.com/Highlight/HighlightDetail133.htm
4) Stock Sector NavigatorSector earnings and capital expenditures are used to value financial securities such as stocks, bonds, loans, for investment research and portfolio managementhttp://www.globalinsight.com/Highlight/HighlightDetail1104.htm
Translating Economic Events into Implications for Global Sector Markets

6Copyright ® 2005 Global Insight, Inc.
-4
-2
0
2
4
6
8
19
95
19
96
19
97
19
98
19
99
20
00
20
01
20
02
20
03
20
04
20
05
20
06
20
07
An
nu
al G
row
th (
%)
Manufacturing Construction Services
Global Sector Growth PerformancesPercent Annual Growth of Real Value Added - World
Strong economic recovery since the down-turn in 2001, but slower relative growth in 2005-07 compared to 2004
Manufacturing sector played key role in both the down-turn and in the subsequent recovery
Service sector growth rates are more resilient in the face of economic volatility
Strong re-bound and steady forecast for construction
Outlook for Global Sector Markets

7Copyright ® 2005 Global Insight, Inc.
-10
-5
0
5
10
15
20
25
19
95
19
96
19
97
19
98
19
99
20
00
20
01
20
02
20
03
20
04
20
05
Transport Equip.
Chemicals &RefineriesComputers &Electronics
Manufacturing Leads the Current Expansion(%Growth in Inflation Adjusted Sector Sales for World Total)
-10
-5
0
5
10
15
20
25
19
95
19
96
19
97
19
98
19
99
20
00
20
01
20
02
20
03
20
04
20
05
Banking &InsuranceCommunications
Wholsale & Retail
Key Manufacturing Sectors Key Services Sectors
Outlook for Global Sector Markets

8Copyright ® 2005 Global Insight, Inc.
-10
-5
0
5
10
15
20
19
95
19
96
19
97
19
98
19
99
20
00
20
01
20
02
20
03
20
04
20
05
Motor Vehicles
Air Craft
Ships & RailEquipment
Transportation Equipment(%Growth in Inflation Adjusted Sector Sales for World Total)
-10
-5
0
5
10
15
20
19
95
19
96
19
97
19
98
19
99
20
00
20
01
20
02
20
03
20
04
20
05
Asia-Pacific
NAFTA
Western Europe
Transportation Equipment Sales Motor Vehicle Sales by Region
Outlook for Global Sector Markets

9Copyright ® 2005 Global Insight, Inc.
Strongest Volume Growth in Computers and Electronics
% in Aggregate Sales
Growth 2005 (%)
1 Office & Computing Machinery 1.16 10.94
2 Communications Equipment incl. Semiconductors 3.24 9.06
3 Computer Support and Software Services 1.86 6.43
4 Motor Cycles & Bicycles 0.11 6.29
5 Electrical Apparatus & Supplies 0.50 5.84
6 Synthetic Resins 0.60 5.69
7 Metal & Woodworking Machinery 0.21 5.01
8 Electrical Industrial Machinery 0.57 5.00
9 Small Electrical Appliances & Housewares 0.26 4.86
10 Drugs & Medicines 0.79 4.74
Top-Ten Real Growth PerformersBy Worldwide Growth Rate in Value Added (Real)

10
Copyright ® 2005 Global Insight, Inc.
Share in Total Sales (%)
Average Growth 2005-07 (%)
1 Drugs and Medicines 0.81 11.17
2 Aircraft and Aerospace 0.45 9.60
3 Educational Services 2.27 9.22
4 Health Services 4.45 8.93
5 Transport & Storage 4.31 8.43
6 Small Electrical Appliances and Housewares 0.21 8.36
7 Financial Institutions 3.75 8.18
8 Communication Equipment incl. Semiconductors 1.33 8.06
9 Computer Support and Software Services 1.96 8.03
10 Electrical Machinery 2.57 7.93
Top-Ten Revenue PerformersBy Growth Rate in Sales (Nominal US$)
Strongest Revenue Gains in Health Care and Services

11
Copyright ® 2005 Global Insight, Inc.
Ranking Sectors by the Outlook for Sales Growth
Share in Total Sales (%)
Average Growth 2005-07 (%)
10 Furniture and Fixtures 0.43 5.45
9 Paper and Products 0.86 4.68
8 Wholesale Trade 5.20 4.05
7 Agriculture, Hunting, Forestry & Fishing 3.21 3.29
6 Industrial Chemicals 1.64 3.09
5 Footwear (Excluding Rubber or Plastic) 0.10 3.06
4 Retail Trade 4.31 2.14
3 Petroleum Refineries 1.65 1.36
2 Primary Metals 1.93 -0.69
1 Mining and Quarrying 1.90 -2.09
Most Modest Performers By Growth Rate in Sales (Nominal US$)

12
Copyright ® 2005 Global Insight, Inc.
Public & Community Svs.
20%
Construction5%
Utilities2%
Manuf.20%
Mining & Quar.2%
Agric.4%
Financials24%
Communication,
Transportation
7%
Trade16%
s
Goods sector accounts for 32% of total world sales, manufacturing accounts for 20%
Financials’ 25% share dominate Services Sector
Community (public) services account for 20%
“Distributive Sectors” of Wholesale, Retail Trade account for 16%
How Big Are Sector Markets in the Global Economy?
Sector Percent Shares of Total World Sales

13
Copyright ® 2005 Global Insight, Inc.
0
20
40
60
80
100S
ervi
ce
Go
od
s
Ag
ric.
Min
ing
Man
uf.
Uti
litie
s
Co
nst
ruc.
Tra
de
Co
m.&
Tra
n.
Fin
an.&
Bu
si.
Pu
blic
Ser
v.
OECD Share in World Total (Avg. 2000 - '05)OECD Share of Growth (from 2000 to '05)
OECD Countries’ Shares in Sector and Sector GrowthBased on Value Added in ’97 US$
Aggregate By ISIC One-Digit Sectors

14
Copyright ® 2005 Global Insight, Inc.
0
20
40
60
80
100S
ervi
ce
Goo
ds
Agr
ic.
Min
ing
Man
uf.
Util
ities
Con
stru
c.
Trad
e
Com
.&Tr
an.
Fina
n.&
Bus
i.
Pub
lic S
erv.
Sector Share (Avg. 2000 - '05)Share of Growth (from 2000 to '05)
Rest of the World (Non OECD) Shares in Sector and Sector GrowthBased on Value Added in ’97 US$
Aggregate By ISIC One-Digit Sectors

15
Copyright ® 2005 Global Insight, Inc.
Regional Shares of Global Manufacturing Sector Sales
($2.9 Trillion Year 2005)
India2%
U.S.20%
O ther17%
China13%
Korea3%
Taiwan2%
Japan13%
W. Europe30%
Role of Chinese Manufacturing in the World Economy
0
5
10
15
20
25
30
35
40
45
Share in Global Manufaturing Sector Sales
Regional Share of Global Growth in Manufacturing from 2000 to 2005
Regional Shares of Growth in Global Manufacturing Sector Sales
Source: GII World Industry ServiceSource: GII World Industry Service

16
Copyright ® 2005 Global Insight, Inc.
China Manufacturing Sector Sales
($2.9 Trillion Year 2005)
Basic Metals
12%
Machinery &
Equipment
37%
Food & Tobacco
10%
Textiles10%
Wood, Paper & Printing
4%
Chemicals
23%
Minerals4%
Role of Manufacturing Sector in the Chinese Economy
0
10
20
30
40
50
60
70
Manufacturing Value Added as Share of GDP, 2003
Manufacturing's Share of Total GDP Growth -- 2000 to 2005
Regional Shares of Manufacturing VA in GDP and Growth in GDP
Source: GII World Industry ServiceSource: GII World Industry Service

17
Copyright ® 2005 Global Insight, Inc.
0
50
100
150
200
250
300
China
India
Korea
Germ
any
France
U.S.
Bil
. U
S$
- Δ
fro
m 2
000
0
5
10
15
20
25
% A
nn
ual
Ch
ang
e si
nce
200
0
Increase during 2000 to 2004, $ Bil.(left)% annual growth (right)
Growth in Goods Imports in Selected Countries Change in Imports Since 2000
China recorded the largest growth in Goods imports for any country during 2000 to 2004
Growth in imports of US$ 245 Bill. Amounts to 23.6% annual average growth
Although increase in India’s imports were smaller in value, it was also very strong at 16% percent annual growth

18
Copyright ® 2005 Global Insight, Inc.
What is Role of Chinese Exports in World Trade?
Greater China Manufacturing Exports Percent Share of Total World Manufacturing Exports
0
2
4
6
8
10
12
14
1980 1990 1995 2000 2005
China* Hong Kong* Taiwan* Intra-Regional
* Export totals from China, Hong Kong and Taiwan exclude trade with each other. These are included in Intra-Regional.
Source: World Industry ServiceSource: World Industry Service

19
Copyright ® 2005 Global Insight, Inc.
What is Role of EU 15 Exports in World Trade?
EU 15 Manufacturing Exports Percent Share of Total World Manufacturing Exports
0
10
20
30
40
50
60
1980 1990 1995 2000 2005
EU 15 Rest of World* Intra-Regional
* Export totals from EU 15 Rest of World exclude trade with each other. These are included in Intra-Regional.
Source: World Industry ServiceSource: World Industry Service

20
Copyright ® 2005 Global Insight, Inc.
0
0.5
1
1.5
2
2.5
3
3.5
4
4.5
5
Ch
an
ge
in S
ha
re
Taiwan South Korea China
1980-1989 1990-1999 2000-2009
Change in World Manufacturing Export Shares (Delta on the Shares: Share at End of Period less Share at Start of Period)
What is the Chinese Competitive Threat?
2005--2009: +2.0%
2000--2004: +2.9%
Source: World Industry ServiceSource: World Industry Service

21
Copyright ® 2005 Global Insight, Inc.
Cross Border Trade Still Growing in Importance for Sector Production
0
2
4
6
8
10
12
1990 1995 2000 2005 2010
Tri
l. U
S$
0
5
10
15
20
25
30
35
Shar
e in
%
Global Exports of All Goods (Tril. US$)
Exports as Share of Production (All Goods)
Manufacturing accounts for the largest share of merchandise exports
Of the $ 8.34 Trill. anticipated trade value, $7.54 Trill. Will be from the manufacturing sector
Agriculture and Mining provide $230 and $575 Bill. respectively
Rising trade intensity: While volume of Global exports continued to grow, share of exports in global production also continued to expand

22
Copyright ® 2005 Global Insight, Inc.
0
20
40
60
80
100
120
1995 2000 2005
China North Asia
Did the trade intensity increase over the past decade in China? Trade Intensity = (Export+Import)/Production
North Asia: High Technology Sector Trade Intensity in High-Tech in China
Source: World Industry ServiceSource: World Industry Service

23
Copyright ® 2005 Global Insight, Inc.
0
20
40
60
80
100
1995 2000 2005
India SAARC
Did the trade intensity increase over the past decade in India? Trade Intensity = (Export+Import)/Production
Source: World Industry ServiceSource: World Industry Service
SAARC: High Technology Sector Trade Intensity in High-Tech in India

24
Copyright ® 2005 Global Insight, Inc.
0
20
40
60
80
100
120
140
1995 2000 2005
Brazil Latin and Central America
Did the trade intensity increase over the past decade in Brazil? Trade Intensity = (Export+Import)/Production
Latin America: High Technology Sector Trade Intensity in High-Tech in Brazil
Source: World Industry ServiceSource: World Industry Service

25
Copyright ® 2005 Global Insight, Inc.
Comparing China’s Trade Shares with Other Countries
Source: World Industry ServiceSource: World Industry Service
0
10
20
30
40
50
60
Share of Export in Production (Sales)
Share of Imports in Consumption
Trade Shares of Metals & Construction Materials(World Production US$ 1.5 Trill. in 2005)
05
10
1520253035
404550
Share of Export in Production (Sales)
Share of Imports in Consumption
Trade Shares of Industrial Chemicals(World Production US$ 1.3 Trill. in 2005)

26
Copyright ® 2005 Global Insight, Inc.
Comparing China’s Trade Shares with Other Countries
Source: World Industry ServiceSource: World Industry Service
01020
3040506070
8090
100
Share of Export in Production (Sales)
Share of Imports in Consumption
Trade Shares of Communication Equip.(World Production US$ 1.04 Trill. in 2005)
0
10
20
30
40
50
60
Share of Export in Production (Sales)
Share of Imports in Consumption
Trade Shares of Motor Vehicles(World Production US$ 2.1 Trill. in 2005)

27
Copyright ® 2005 Global Insight, Inc.
What Is the Role of Capital Expenditures in Sector Activity?
0
2
4
6
8
1 0
1 2
1 4
1 6
TO
TA
L
No
n F
inan
cial
Fin
anci
als
En
erg
y
Mat
eria
ls
Ind
ust
rial
s
Co
ns.
Dis
cr.
Co
ns.
Sta
ple
s
Hea
lth
Car
e
Tec
hn
olo
gy
Tel
eco
ms
Uti
liti
es
U S W e s t E u r o p e
0
0 . 5
1
1 . 5
2
2 . 5
3
3 . 5
4
4 . 5
5
1993
1994
1995
1996
1997
1998
1999
2000
2001
2002
2003
2004
2
3
4
5
6
7
8
9
F in a n c ia l ( L H S ) N o n F in a n c ia l ( R H S )
CapEx Spending as % of Total SalesUnited States Vs Europe, (2003)
US CapEx Spending as % of Total SalesTotal for 446 US Corporations in the GICS
Sector Classification
Source: Worldscope Company Financial Statements & WIS CalculationsSource: Worldscope Company Financial Statements & WIS Calculations

28
Copyright ® 2005 Global Insight, Inc.
Ratio of Fixed CapEx to Sales(CapEx / Total Sales)
0
5
10
15
20
25
30
35
40
U.S. EU-15 Brazil India China
1995 2000 2005
0
2
4
6
8
10
12
U.S. EU-15 Brazil India China
1995 2000 2005
Service Sector (ISIC 6-9) Goods Sector (ISIC 1-3)

29
Copyright ® 2005 Global Insight, Inc.
What is the Return on Fixed CapEx Spending? (ROFIC)
0
2 0
4 0
6 0
8 0
1 0 0
1 2 0
1 4 0
1 6 0
1 8 0
19
93
19
94
19
95
19
96
19
97
19
98
19
99
20
00
20
01
20
02
20
03
20
04
0
5
1 0
1 5
2 0
2 5
3 0
3 5
4 0
4 5
F i n a n c i a l N o n F i n a n c i a l
US Corporate Sector: Return from Investment in Fixed Capital
Company Net Income / 3-year sum of Fixed Investments
5
10
15
2 0
2 5
3 0
1993
1994
1995
1996
1997
1998
1999
2000
2001
2002
2003
2004
∆ G D P / P r i v a t e F i x e d C a p E x
∆ G D P / C a p E x - - E q u i p m e n t & S o f t w a r e
US Macro Economy: Marginal Efficiency of Private Fixed Investment
∆ in GDP / 3-year sum of Fixed Investments
Source: US BEA, Worldscope Company Financial Statements & Source: US BEA, Worldscope Company Financial Statements & WIS CalculationsWIS Calculations

30
Copyright ® 2005 Global Insight, Inc.
Marginal Efficiency of Investment(∆ in GDP / Three-year sum of CapEx)
-5
0
5
10
15
20
25
'95 '96 '97 '98 '99 '00 '01 '02 '03 '04 '05 '06
OECD LDC's
OECD and LDC’s U.S. and China
0
5
10
15
20
25
'95 '96 '97 '98 '99 '00 '01 '02 '03 '04 '05 '06
US China

31
Copyright ® 2005 Global Insight, Inc.
Sector Return on Fixed Capital Spending(Operating Profits / Three-year sum of CapEx)
0
20
40
60
80
100
120
140
U.S
.
EU
-15
Bra
zil
Ind
ia
Ch
ina
1995 2000 2005
0
10
20
30
40
50
60
All
Goo
ds
Serv
ices
Fina
ncia
ls
Med
. Tch
1995 2000 2005
Aggregate ISIC: 1 to 9 China, by Sector

32
Copyright ® 2005 Global Insight, Inc.
Please Contact Us for a Personal Demonstration!
More Information?
Mark Killion, CFAManaging Director, World Industry [email protected]
Prem PremakumarApplications Manager, World Industry [email protected]

Copyright ® 2005 Global Insight, Inc.
Custom Market IndexesA Framework to Track and Forecast Company Sales
Prospects for Multiple Business Segments and Geographies
World Industry Service

34
Copyright ® 2005 Global Insight, Inc.
Global Insight’s World Industry Service (WIS) Provides Sector Benchmarks for Global Sales Forecasting
WIS provides a unique set of global sector data, financial benchmarks, and written reports, all delivered via Global Insight’s easy-to-use Web-based platform
Harmonized industries and indicators allow for consistency and comparisons across sectors and geography
User-friendly access facilitates navigation through a multi-dimensional choice of sector, country, indicator, and timeframe
The application of WIS featured here is the Custom Market Index (CMI) framework, which uses WIS sector data to aid in company sales forecasting and market planning
An ideal tool to forecast sales in several business segments and multiple countries/regions around the world

35
Copyright ® 2005 Global Insight, Inc.
WIS Sectors Are the “Gear Box” that Connects
Macro and Companies!
WIS sector data represents a big “peer group” of all players that operate in each sector Data derived from company tax filings Includes public and private ownership Creates robust financial benchmarks Uses sector benchmarks to anticipate
likely company prospects
WIS Platform Drives Macro Performances through Sector Activity to Individual Company Performances
Macro
Policies Slate of
Demand Scenarios Prices and
Exchange Rates
Industry
Sources of Demand Purchases, COGS Consumer, B2B Markets Technology, Commercial
Linkages Trade, Competition, and
Profits
Company
Benchmark Global Sales Growth, Cost Structure, Risks
Market Share Competitive
Technology

36
Copyright ® 2005 Global Insight, Inc.
WIS provides comparative and consistent benchmarks of market size, growth, volatility, correlation, and structure
Use the WIS indicators and reports to understand demand conditions and structural changes in key customer markets
The Custom Market Index (CMI) framework facilitates the tracking, analysis, and forecasting of company sales prospects for multiple business segments and regions
Use WIS sector information as the basis for custom framework
Use company sales patterns to “weight” or tie sectors together into tailored market bundles
Produce a finely targeted and informed view of sales prospects
How to Use WIS Information in Sales Forecasting
Translate economic events into implications for key markets

37
Copyright ® 2005 Global Insight, Inc.
What is the Market Size of Key Global Sectors?—Examples of WIS Benchmark Indicators
WIS indicators show the size and composition of sector markets
Comparable measures are scalable to region and world totals
Ability to scan across sector groups and regions, then drill down to more granular market segments
Metrics allow custom definition of segments and geography
WIS Indicators Provide Robust Benchmarks of Sector Peer Groups
(Example of total world sales for the nine top sectors)Utility2%
Construction6%
Trade13%
Transport, Storage,
Communication Services
7%
Agriculture3%
Finance21%
Social Service17%
Mining2%
Manufacturing29%

38
Copyright ® 2005 Global Insight, Inc.
Drill Down from Top-Level Sectors to Sub-Industries, andShow Market Size Across Countries and Business Segments
13%
8%4%
75%
Ships & RailroadsMotor VehiclesAircraftOther
What is the Market Size of Key Global Sectors?—Examples of WIS Benchmark Indicators
25%
8%
21%8%
14%
19%
4%
U.S.
Canada & MexicoJapan
Other Asia
Germany
Other EuropeOther Emerging Markets

39
Copyright ® 2005 Global Insight, Inc.
Percent Growth in Inflation-Adjusted Sector Sales(World total from 70 economies)
-4
-2
0
2
4
6
8
10
1995 1996 1997 1998 1999 2000 2001 2002 2003 2004 2005
All Sectors Manufacturing Sector Services Sectors
Sector Growth Rates are a key metric for sales forecasting
Identify and target the fastest-growing sectors, then determine the best geography for sales and production
CMI: Use custom definition of segments and geography to best represent and track a company’s own set of target market segments
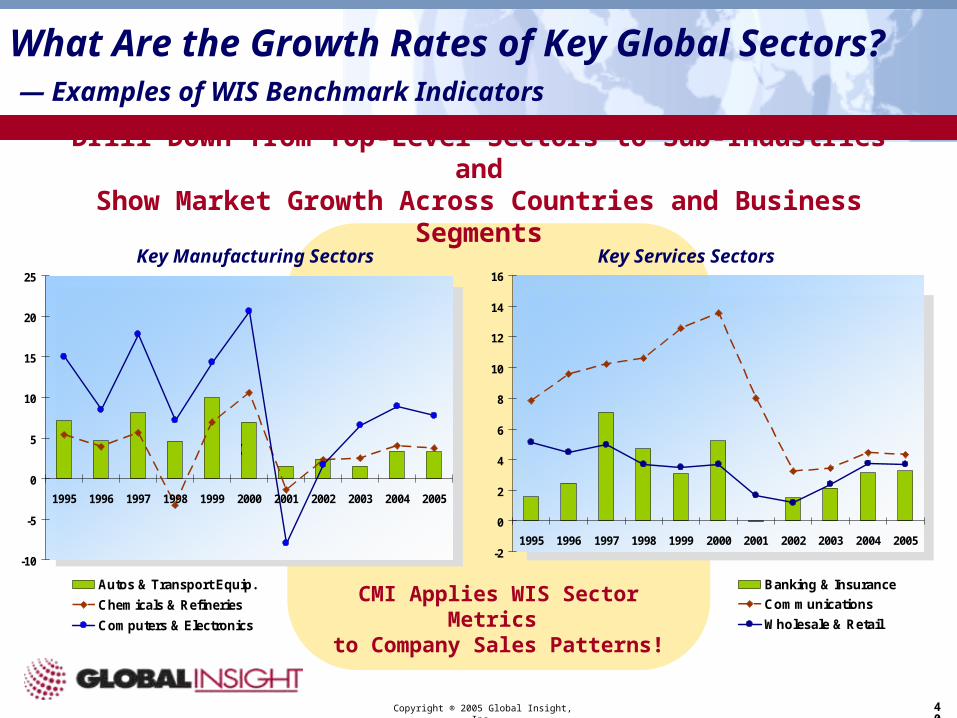
What Are the Growth Rates of Key Global Sectors?— Examples of WIS Benchmark Indicators
40
Copyright ® 2005 Global Insight, Inc.
-2
0
2
4
6
8
10
12
14
16
1995 1996 1997 1998 1999 2000 2001 2002 2003 2004 2005
Banking & Insurance
Communications
Wholesale & Retail
-10
-5
0
5
10
15
20
25
1995 1996 1997 1998 1999 2000 2001 2002 2003 2004 2005
Autos & Transport Equip.
Chemicals & Refineries
Computers & Electronics
(
Key Services SectorsKey Manufacturing Sectors
Drill Down from Top-Level Sectors to Sub-Industries andShow Market Growth Across Countries and Business Segments
What Are the Growth Rates of Key Global Sectors? — Examples of WIS Benchmark Indicators
CMI Applies WIS Sector Metrics to Company Sales Patterns!

41
Copyright ® 2005 Global Insight, Inc.
What Are Custom Market Indexes (CMI)?
Companies that operate in or sell into various sectors and several different countries are typically more difficult to track and forecast on a comparable basis across all business components
Also, the actual size of sectors and countries are naturally “weighted” by their actual US$ market size, but these natural “weights” may not be relevant for many companies
The importance of particular sectors to a client can be quite different than the importance of the same sectors to the macro economy
Solution: Create a tailored or Custom Market Index (CMI) that calibrates sector measures to an individual company and/or client business patterns
Provides a consistent framework that can be employed on a common basis across all business segments and regions

42
Copyright ® 2005 Global Insight, Inc.
Forecast sales growth, profits and margins, and market share Communication tool for Wall Street analysts to best illustrate
company performance relative to relevant markets Benchmarking, segmentation, and competitive analysis Corporate planning and strategy, resource management,
expansion, procurement, and competitive investment requirements Active risk management by sector and geographical dimensions
Global Insight’s Custom Market Indexes
Common Use of Custom Market Indexes

43
Copyright ® 2005 Global Insight, Inc.
Custom Market Indexes Take Several Forms
Global Insight’s Custom Market Indexes
1) Structural models provide strategic forecasts of company sales Sales forecasts are measured in US$ (or euro) for size, growth rates, and market
share calculations Flexible “slice and dice,” roll up across all business segments and regions
2) High-frequency models that feature turning point indicators Advantage is shorter time forecast horizons These models can only address segments selling to manufacturing sectors Forecasts are produced only in growth rate terms (not US$ size or market share)
3) Leading indicator models of inflection points Indexes whose known historical values have leading information for future company sales Identify turning points in growth without forecasts These models shows turning points only, not growth rates, market size, or market share

44
Copyright ® 2005 Global Insight, Inc.
Autos, Trucks
Textiles Paper Chemicals
United States 7 3 4 16
West Europe 5 5 13 7
Asia 11 6 15 8
Shares of Company Sales from Geographical Regions and Client Industries Are Used to Create Custom Market Index
0
5
10
15
20
25
30
35
40
1993 1994 1995 1996 1997 1998 1999 2000 2001 2002 2003 2004 2005 2006
0
2
4
6
8
10
12
Company Actual Sales Growth (%, Left Scale)
Custom Market Index Growth (%, Right Scale)
Example of Company Custom Market Index—Structural Model Approach
Roll up sales from all segments and region to company totals; compare CMI to actual company sales performances
Use CMI over history to analyze and explain changes in market shares
Use CMI forecasts as unbiased market growth expectations
Cells show the percent shares of company sales that originate from clients in the listed sectors and regions
These shares are used as “weights” that are applied to WIS data to create the company’s actual, attainable custom market

45
Copyright ® 2005 Global Insight, Inc.
CMI for Brazil versus Brazilian GDP
(% change)
-4
-2
0
2
4
6
8
10
1991
1993
1995
1997
1999
2001
2003
2005
Brazil GDP
Custom Market Index for Brazil
CMI Is a Framework for Tracking Key Customer MarketsAcross Different Countries’ Business Segments
CMI for the Chemicals Business Segment
in Different Regions (%)
-3
-1
1
3
5
7
9
11
1991
1992
1993
1994
1995
1996
1997
1998
1999
2000
2001
2002
2003
2004
2005
Chemicals Segment CMI for North America
Chemicals Segment CMI for Asia

46
Copyright ® 2005 Global Insight, Inc.
Custom Market Index – Example of High Frequency Framework for Selling Into High Technology Sectors
Incorporate WIS high-frequency indicators for key technology and process industries
Use with company sales patterns to create Custom Market Index
Latest WIS data provide up-to-date snapshot of client markets
This version of CMI will forecast sales for a short time horizon (3-6 months), with statistical standard deviations around the forecasts
Focus on growth and inflection points in sales
Use Monthly/Quarterly Indicators to Track and Forecast Near-Term Growth in Sales
0
10
20
30
40
50
60
70
99 Q
1
99 Q
3
00 Q
1
00Q
3
01 Q
1
01 Q
2
01 Q
4
02 Q
2
02 Q
4
03 Q
2
03 Q
4
04 Q
2
04 Q
4
05 Q
2
05 Q
4
06 Q
2
06 Q
4
Plus One Std. Deviation
Segment Sales -- 3 Month Moving Average
Minus One Std. Deviation
History Forecast

47
Copyright ® 2005 Global Insight, Inc.
Custom Market Index – Example of Leading Indicator Based Forecast (Lead/Lag Relationships)
Nature and Length of the Lead/Lag Relationships Are Determined by the Data
US - $ Sales and Turning Point Index
0
2
4
6
8
10
12
14
16
18
1999
M1
2000
M1
2001
M1
2002
M1
2003
M1
2004
M1
Mo
nth
ly S
ales
$M
M 3
mm
a
94
96
98
100
102
104
106Sales 3mma
Index +8
Asia - $ Sales and Turning Point Index
6
7
8
9
10
11
12
13
Mo
nth
ly S
ales
$M
3m
ma
94
96
98
100
102
104
106
108
Ind
ex
Sales 3mma
Index +4
Use monthly/quarterly sector indicators to develop lead/lag relationships with sector indicators
Use high-frequency data for “leading indicators” of future sales Focus on metrics whose known values today anticipate future company sales trends Show likelihood of turning point in sales growth

48
Copyright ® 2005 Global Insight, Inc.
CMIs Deliver the Global Insight Advantage
Accurately forecast your business segment sales
Determine the strength and vulnerability of your markets
Improve your performance against competitors
Target resources toward most promising areas
Minimize the impact of exposure to business cycles
Minimize your risks as a lender or investor
Translate economic events into impacts on key markets

49
Copyright ® 2005 Global Insight, Inc.
Please contact us for a personal demonstration!
More Information?
Mark Killion, CFAManaging Director, World Industry [email protected]
Prem PremakumarApplications Manager, World Industry [email protected]