copyright 2003 limsoon wong recognition of gene features limsoon wong institute for infocomm...
TRANSCRIPT

Copyright 2003 limsoon wong
Recognition of Gene Features
Limsoon Wong
Institute for Infocomm ResearchBI6103 guest lecture on ?? February 2004
For written notes, please read chapters 3, 4, and 7 of The Practical Bioinformatician,http://sdmc.i2r.a-star.edu.sg/~limsoon/psZ/practical-bioinformatician

Copyright 2003 limsoon wong
Lecture Plan
• experiment design, result interpretation
• central dogma
• recognition of translation initiation sites
• recognition of transcription start sites
• survey of some ANN-based systems for recognizing gene features
Copyright 2003 limsoon wong
What is Accuracy?

Copyright 2003 limsoon wong
What is Accuracy?
Accuracy =No. of correct predictions
No. of predictions
=TP + TN
TP + TN + FP + FN
Copyright 2003 limsoon wong
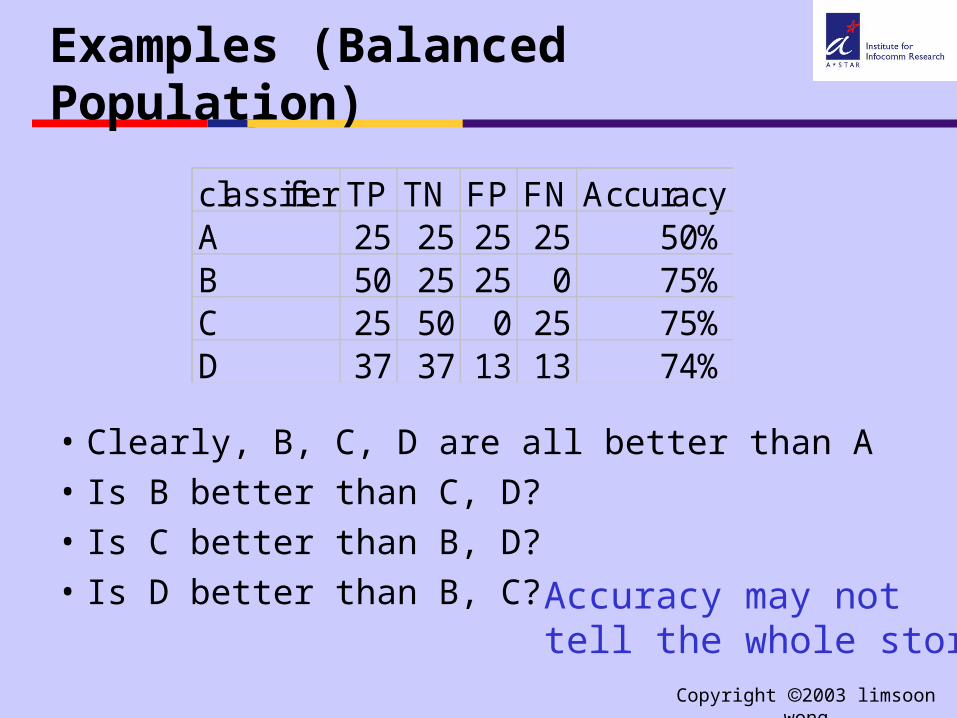
Examples (Balanced Population)
• Clearly, B, C, D are all better than A
• Is B better than C, D?
• Is C better than B, D?
• Is D better than B, C?
classifier TP TN FP FN AccuracyA 25 25 25 25 50%B 50 25 25 0 75%C 25 50 0 25 75%D 37 37 13 13 74%
Accuracy may nottell the whole story

Copyright 2003 limsoon wong
Examples (Unbalanced Population)
• Clearly, D is better than A
• Is B better than A, C, D?
classifier TP TN FP FN AccuracyA 25 75 75 25 50%B 0 150 0 50 75%C 50 0 150 0 25%D 30 100 50 20 65%
high accuracy is meaningless if population is unbalanced
Copyright 2003 limsoon wong
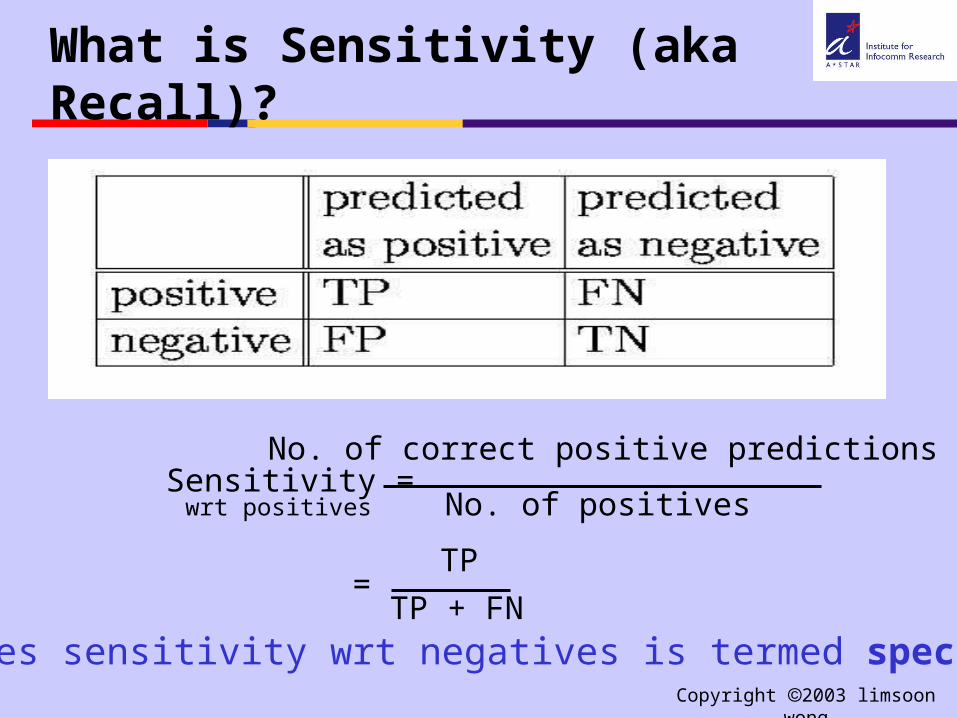
What is Sensitivity (aka Recall)?
Sensitivity =No. of correct positive predictions
No. of positives
=TP
TP + FN
wrt positives
Sometimes sensitivity wrt negatives is termed specificity
Copyright 2003 limsoon wong
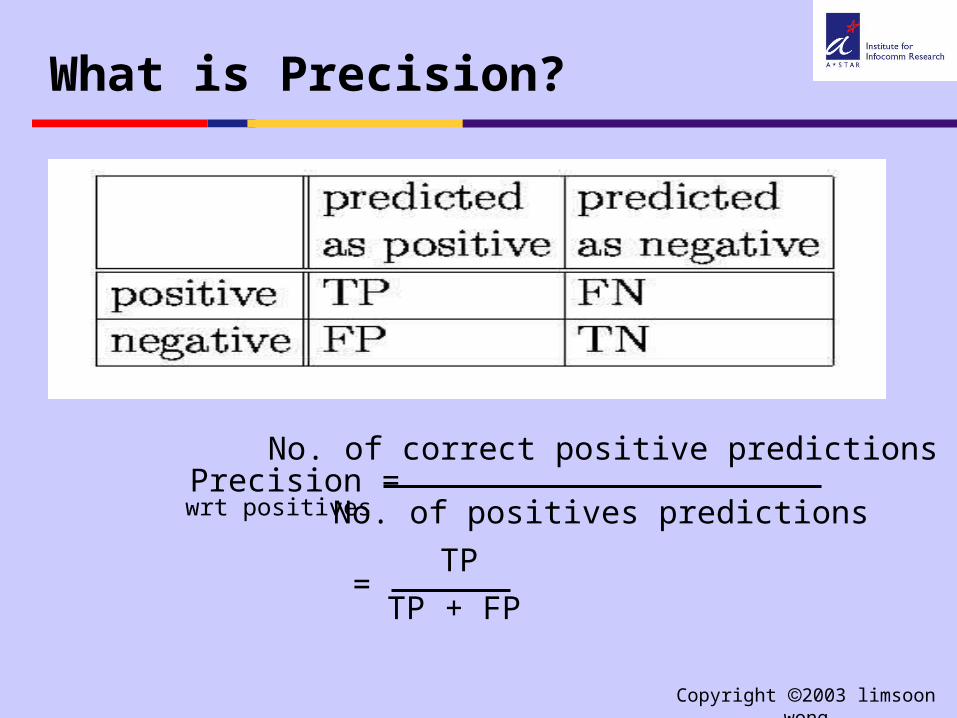
What is Precision?
Precision =No. of correct positive predictions
No. of positives predictions
=TP
TP + FP
wrt positives

Copyright 2003 limsoon wong
Precision-Recall Trade-off
• A predicts better than B if A has better recall and precision than B
• There is a trade-off between recall and precision
• In some applications, once you reach a satisfactory precision, you optimize for recall
• In some applications, once you reach a satisfactory recall, you optimize for precision
reca
ll
precision

Copyright 2003 limsoon wong
Comparing Prediction Performance
• Accuracy is the obvious measure– But it conveys the right intuition only when
the positive and negative populations are roughly equal in size
• Recall and precision together form a better measure– But what do you do when A has better recall
than B and B has better precision than A?

Copyright 2003 limsoon wong
Adjusted Accuracy
• Weigh by the importance of the classes
classifier TP TN FP FN Accuracy Adj AccuracyA 25 75 75 25 50% 50%B 0 150 0 50 75% 50%C 50 0 150 0 25% 50%D 30 100 50 20 65% 63%
Adjusted accuracy = * Sensitivity * Specificity+
where + = 1typically, = = 0.5
But people can’t always agree on values for ,
Copyright 2003 limsoon wong
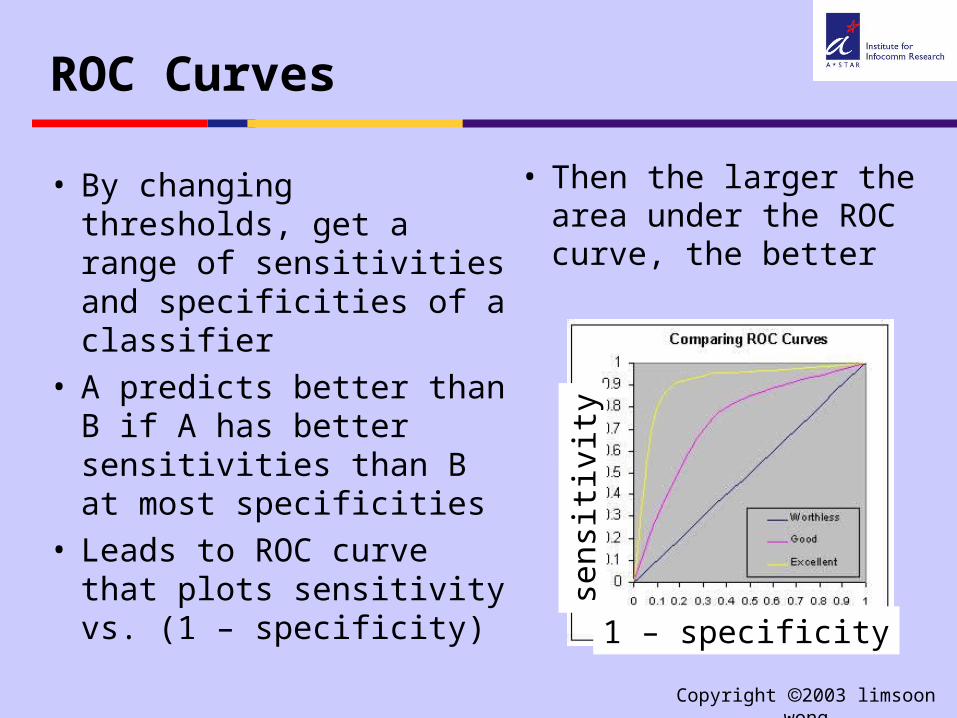
ROC Curves
• By changing thresholds, get a range of sensitivities and specificities of a classifier
• A predicts better than B if A has better sensitivities than B at most specificities
• Leads to ROC curve that plots sensitivity vs. (1 – specificity)
• Then the larger the area under the ROC curve, the better
s en s
iti v
ity
1 – specificity

Copyright 2003 limsoon wong
What is Cross Validation?

Copyright 2003 limsoon wong
Construction of a Classifier
Build ClassifierTrainingsamples
Classifier
Apply ClassifierTest
instancePrediction

Copyright 2003 limsoon wong
Estimate Accuracy: Wrong Way
Apply Classifier
Predictions
Build Classifier
Trainingsamples
Classifier
EstimateAccuracy
Accuracy
Why is this way of estimating accuracy wrong?

Copyright 2003 limsoon wong
Recall ...
• Given a test sample S
• Compute scores p(S), n(S)
• Predict S as negative if p(S) < t * n(s)
• Predict S as positive if p(S) t * n(s)
t is the decision threshold of the classifier
…the abstract model of a classifier

Copyright 2003 limsoon wong
K-Nearest Neighbour Classifier (k-NN)
• Given a sample S, find the k observations Si in the known data that are “closest” to it, and average their responses.
• Assume S is well approximated by its neighbours
p(S) = 1Si Nk(S) DP
n(S) = 1Si Nk(S) DN
where Nk(S) is the neighbourhood of Sdefined by the k nearest samples to it.
Assume distance between samples is Euclidean distance for now

Copyright 2003 limsoon wong
Estimate Accuracy: Wrong Way
Apply 1-NN
Predictions
Build 1-NN
Trainingsamples
1-NN
EstimateAccuracy
100%Accuracy
For sure k-NN (k = 1) has 100% accuracy in the“accuracy estimation” procedure above. But doesthis accuracy generalize to new test instances?

Copyright 2003 limsoon wong
Estimate Accuracy: Right Way
Testing samples are NOT to be used during “Build Classifier”
Apply Classifier
Predictions
Build Classifier
Trainingsamples
Classifier
EstimateAccuracy
Accuracy
Testingsamples
Copyright 2003 limsoon wong
How Many Training and Testing Samples?
• No fixed ratio between training and testing samples; but typically 2:1 ratio
• Proportion of instances of different classes in testing samples should be similar to proportion in training samples
• What if there are insufficient samples to reserve 1/3 for testing?
• Ans: Cross validation

Copyright 2003 limsoon wong
Cross Validation
2.Train 3.Train 4.Train 5.Train 1.Test • Divide samples into k roughly equal parts
• Each part has similar proportion of samples from different classes
• Use each part to testing other parts
• Total up accuracy
2.Test 3.Train 4.Train 5.Train 1.Train
2.Train 3.Test 4.Train 5.Train 1.Train
2.Train 3.Train 4.Test 5.Train 1.Train
2.Train 3.Train 4.Train 5.Test 1.Train

Copyright 2003 limsoon wong
How Many Fold?
• If samples are divided into k parts, we call this k-fold cross validation
• Choose k so that – the k-fold cross
validation accuracy does not change much from k-1 fold
– each part within the k-fold cross validation has similar accuracy
• k = 5 or 10 are popular choices for k.
Size of training set
Acc
urac
y

Copyright 2003 limsoon wong
Bias-Variance Decomposition
• Suppose classifiers Cj
and Ck were trained on different sets Sj and Sk
of 1000 samples each
• Then Cj and Ck might have different accuracy
• What is the expected accuracy of a classifier C trained this way?
• Let Y = f(X) be what C is trying to predict
• The expected squared error at a test instance x, averaging over all such training samples, is
E[f(x) – C(x)]2
= E[C(x) – E[C(x)]]2
+ [E[C(x)] - f(x)]2
variance
bias
Copyright 2003 limsoon wong
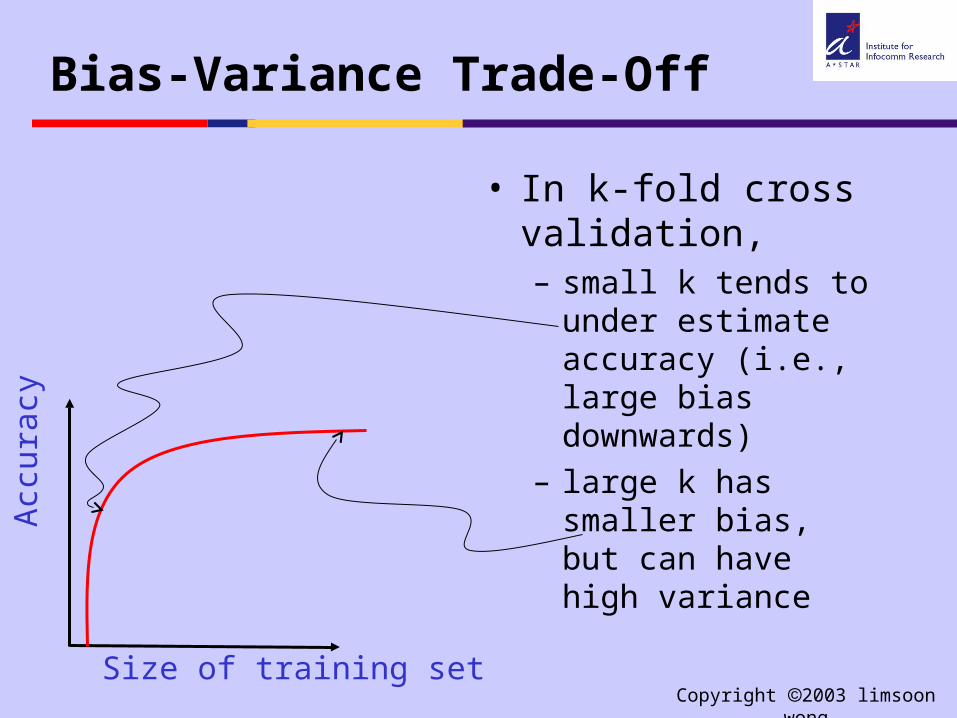
Bias-Variance Trade-Off
• In k-fold cross validation, – small k tends to under
estimate accuracy (i.e., large bias downwards)
– large k has smaller bias, but can have high variance
Size of training set
Acc
urac
y

Copyright 2003 limsoon wong
Curse of Dimensionality

Copyright 2003 limsoon wong
Curse of Dimensionality
• How much of each dimension is needed to cover a proportion r of total sample space?
• Calculate by ep(r) = r1/p
• So, to cover 1% of a 15-D space, need 85% of each dimension!
00.10.20.30.40.50.60.70.80.9
1
p=3 p=6 p=9 p=12 p=15
r=0.01
r=0.1
Copyright 2003 limsoon wong
Consequence of the Curse
• Suppose the number of samples given to us in the total sample space is fixed
• Let the dimension increase
• Then the distance of the k nearest neighbours of any point increases
• Then the k nearest neighbours are less and less useful for prediction, and can confuse the k-NN classifier
Copyright 2003 limsoon wong
What is Feature Selection?

Copyright 2003 limsoon wong
Tackling the Curse
• Given a sample space of p dimensions
• It is possible that some dimensions are irrelevant
• Need to find ways to separate those dimensions (aka features) that are relevant (aka signals) from those that are irrelevant (aka noise)

Copyright 2003 limsoon wong
Signal Selection (Basic Idea)
• Choose a feature w/ low intra-class distance• Choose a feature w/ high inter-class distance

Copyright 2003 limsoon wong
Signal Selection (eg., t-statistics)

Copyright 2003 limsoon wong
Signal Selection (eg., MIT-correlation)
Copyright 2003 limsoon wong
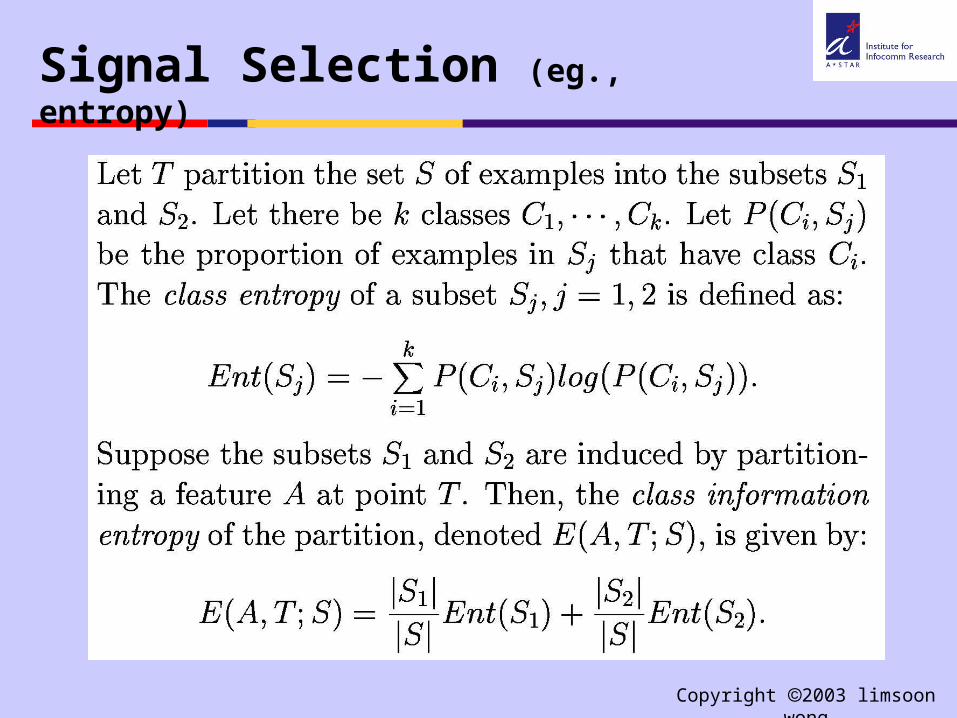
Signal Selection (eg., entropy)
Copyright 2003 limsoon wong
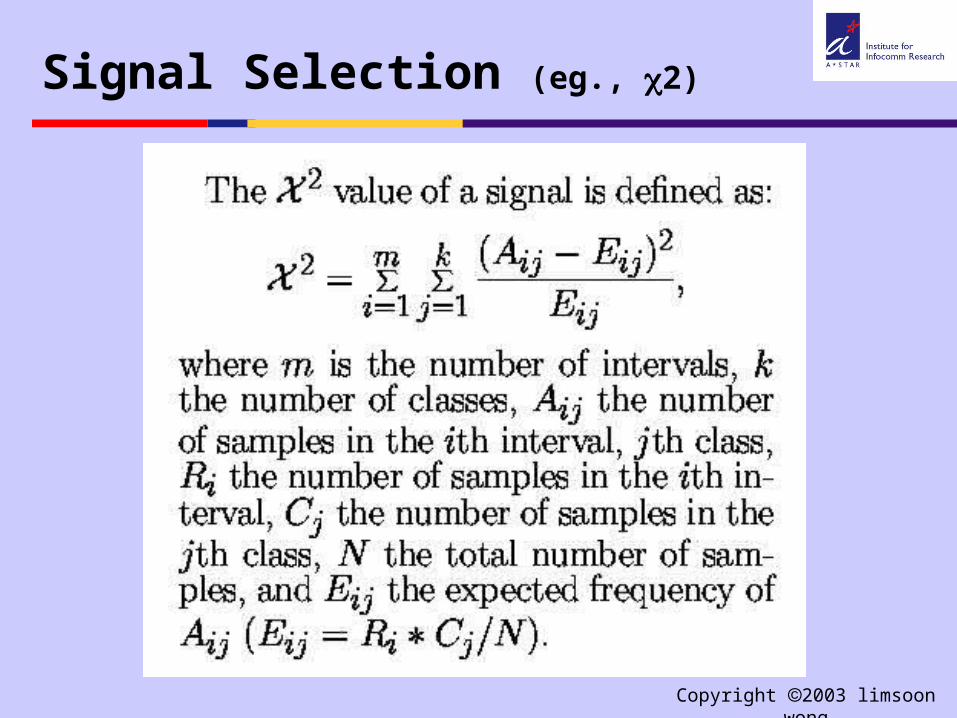
Signal Selection (eg., 2)

Copyright 2003 limsoon wong
Signal Selection (eg., CFS)
• Instead of scoring individual signals, how about scoring a group of signals as a whole?
• CFS– Correlation-based Feature Selection– A good group contains signals that are
highly correlated with the class, and yet uncorrelated with each other

Copyright 2003 limsoon wong
Self-fulfilling Oracle
• Construct artificial dataset with 100 samples, each with 100,000 randomly generated features and randomly assigned class labels
• select 20 features with the best t-statistics (or other methods)
• Evaluate accuracy by cross validation using only the 20 selected features
• The resultant estimated accuracy can be ~90%
• But the true accuracy should be 50%, as the data were derived randomly

Copyright 2003 limsoon wong
What Went Wrong?
• The 20 features were selected from the whole dataset
• Information in the held-out testing samples has thus been “leaked” to the training process
• The correct way is to re-select the 20 features at each fold; better still, use a totally new set of samples for testing

Copyright 2003 limsoon wong
Short Break

Copyright 2003 limsoon wong
Central Dogma of Molecular Biology

Copyright 2003 limsoon wong
What is a gene?

Copyright 2003 limsoon wong
Central Dogma
Copyright 2003 limsoon wong
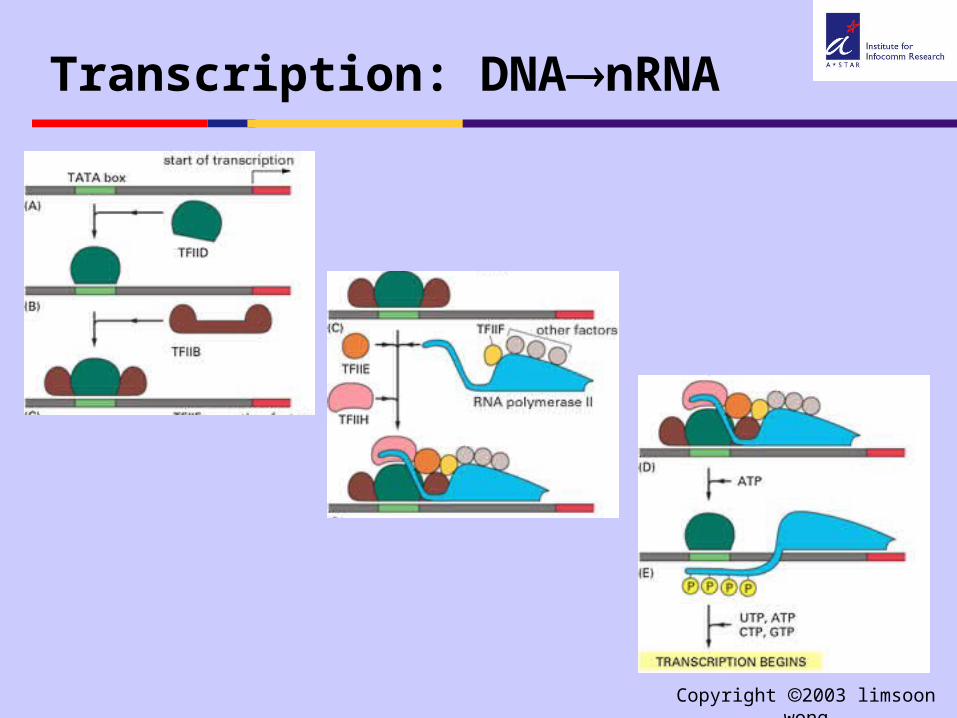
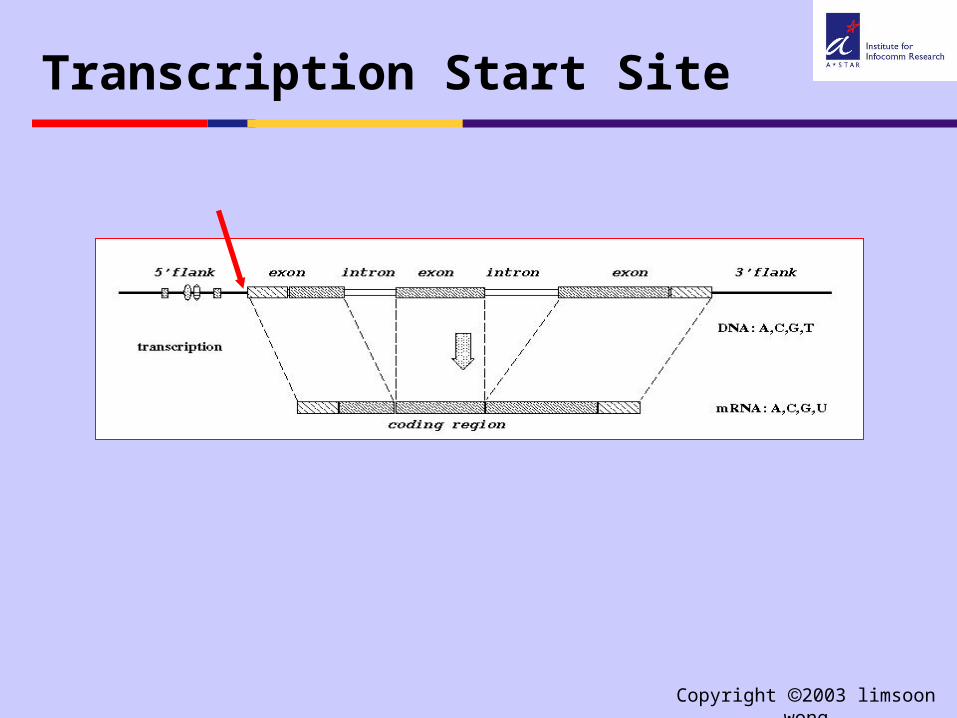
Transcription: DNAnRNA

Copyright 2003 limsoon wong
Splicing: nRNAmRNA
Copyright 2003 limsoon wong
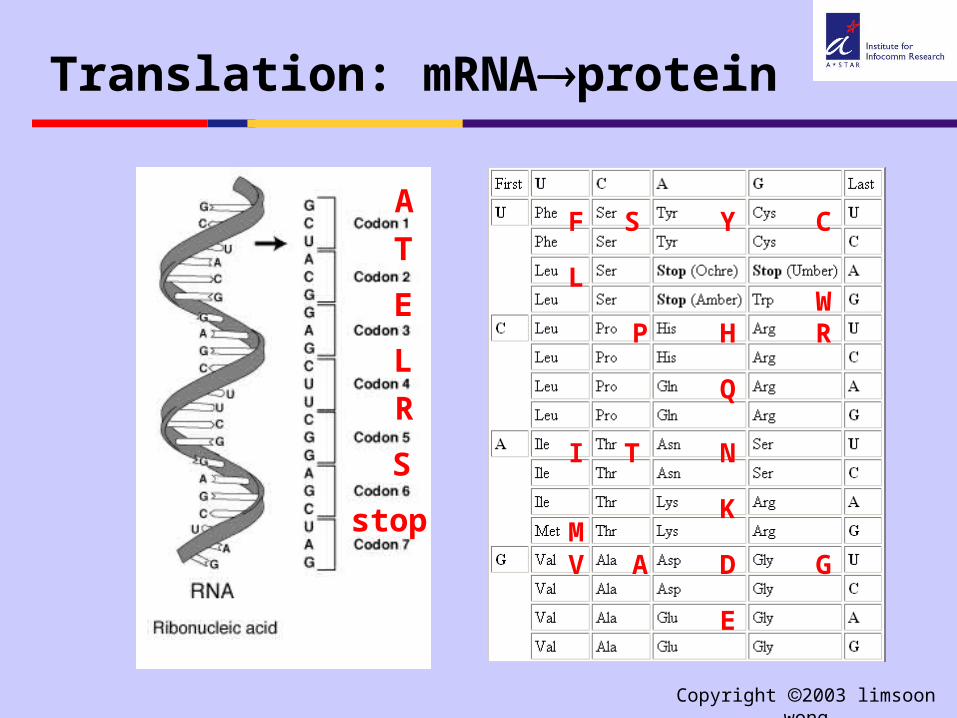
Translation: mRNAprotein
F
L
I
MV
S
P
T
A
Y
H
Q
N
K
D
E
C
WR
G
A
T
E
L
R
S
stop
Copyright 2003 limsoon wong
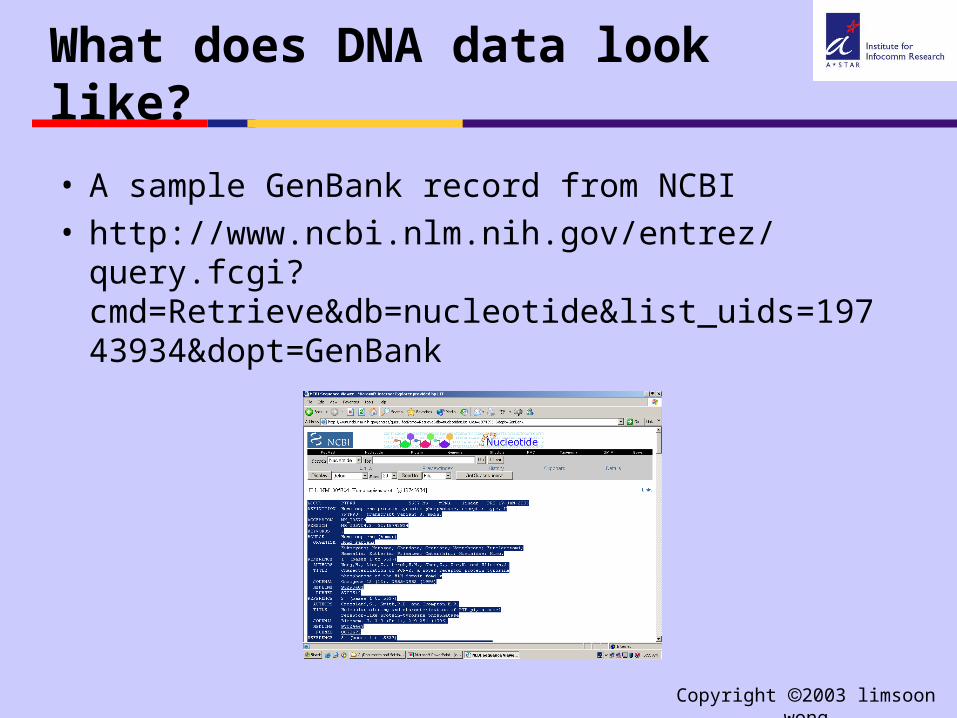
What does DNA data look like?
• A sample GenBank record from NCBI• http://www.ncbi.nlm.nih.gov/entrez/query.fcgi?
cmd=Retrieve&db=nucleotide&list_uids=19743934&dopt=GenBank
Copyright 2003 limsoon wong
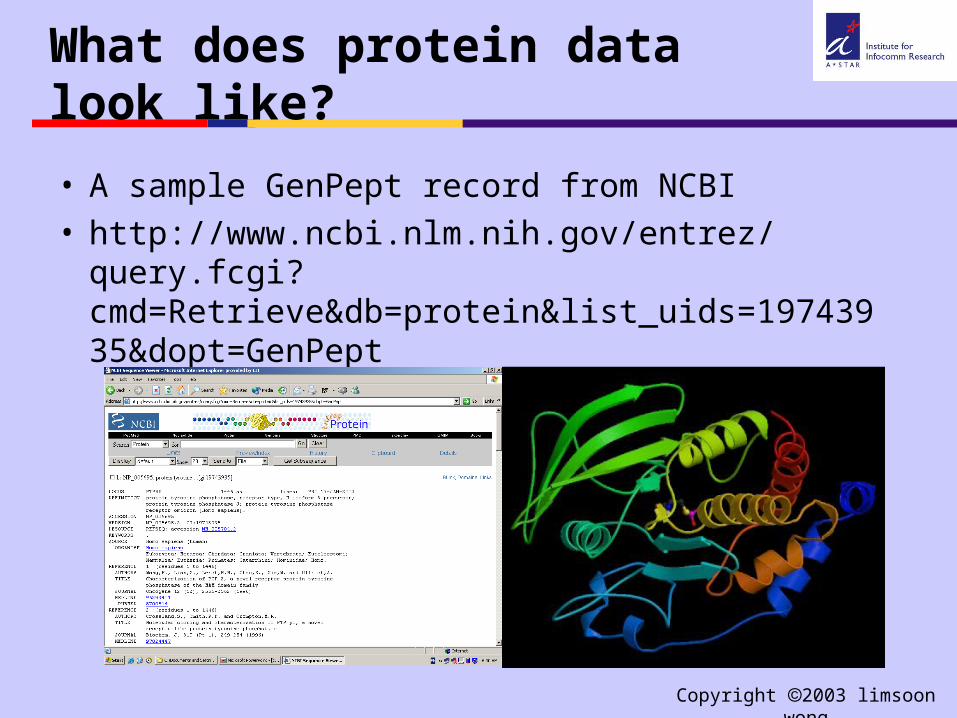
What does protein data look like?
• A sample GenPept record from NCBI• http://www.ncbi.nlm.nih.gov/entrez/query.fcgi?
cmd=Retrieve&db=protein&list_uids=19743935&dopt=GenPept
Copyright 2003 limsoon wong
Recognition of Translation Initiation Sites
An introduction to the World’s simplest TIS recognition system A simple approach to accuracy and understandability

Copyright 2003 limsoon wong
Translation Initiation Site
Copyright 2003 limsoon wong
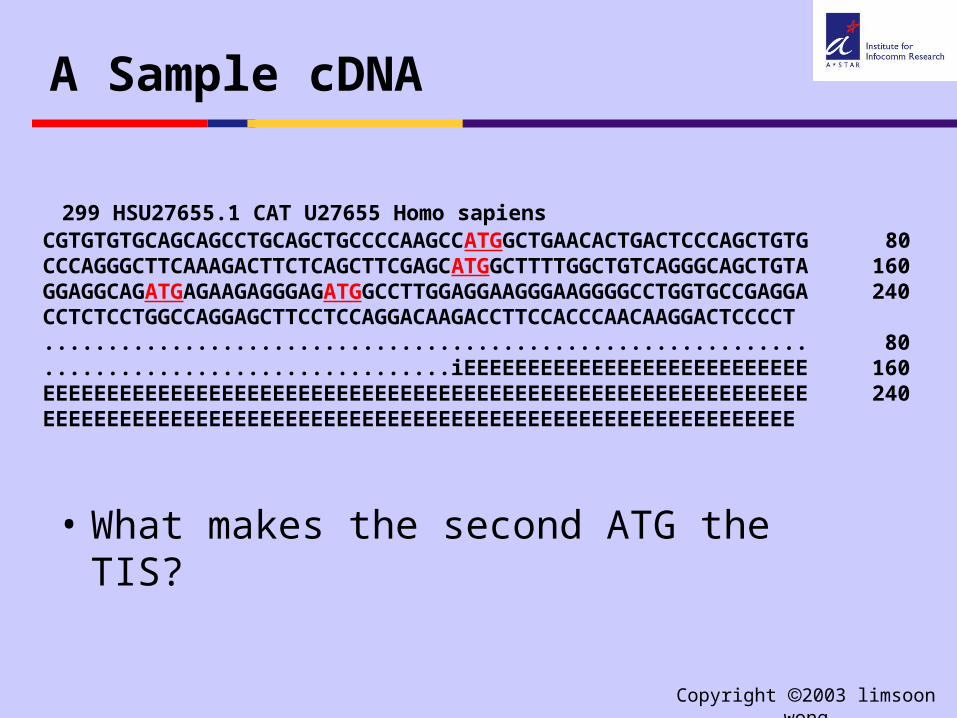
A Sample cDNA
299 HSU27655.1 CAT U27655 Homo sapiensCGTGTGTGCAGCAGCCTGCAGCTGCCCCAAGCCATGGCTGAACACTGACTCCCAGCTGTG 80CCCAGGGCTTCAAAGACTTCTCAGCTTCGAGCATGGCTTTTGGCTGTCAGGGCAGCTGTA 160GGAGGCAGATGAGAAGAGGGAGATGGCCTTGGAGGAAGGGAAGGGGCCTGGTGCCGAGGA 240CCTCTCCTGGCCAGGAGCTTCCTCCAGGACAAGACCTTCCACCCAACAAGGACTCCCCT............................................................ 80................................iEEEEEEEEEEEEEEEEEEEEEEEEEEE 160EEEEEEEEEEEEEEEEEEEEEEEEEEEEEEEEEEEEEEEEEEEEEEEEEEEEEEEEEEEE 240EEEEEEEEEEEEEEEEEEEEEEEEEEEEEEEEEEEEEEEEEEEEEEEEEEEEEEEEEEE
• What makes the second ATG the TIS?

Copyright 2003 limsoon wong
Approach
• Training data gathering
• Signal generation k-grams, distance, domain know-how, ...
• Signal selection Entropy, 2, CFS, t-test, domain know-how...
• Signal integration SVM, ANN, PCL, CART, C4.5, kNN, ...

Copyright 2003 limsoon wong
Training & Testing Data
• Vertebrate dataset of Pedersen & Nielsen [ISMB’97]
• 3312 sequences• 13503 ATG sites• 3312 (24.5%) are TIS• 10191 (75.5%) are non-TIS• Use for 3-fold x-validation expts
Copyright 2003 limsoon wong
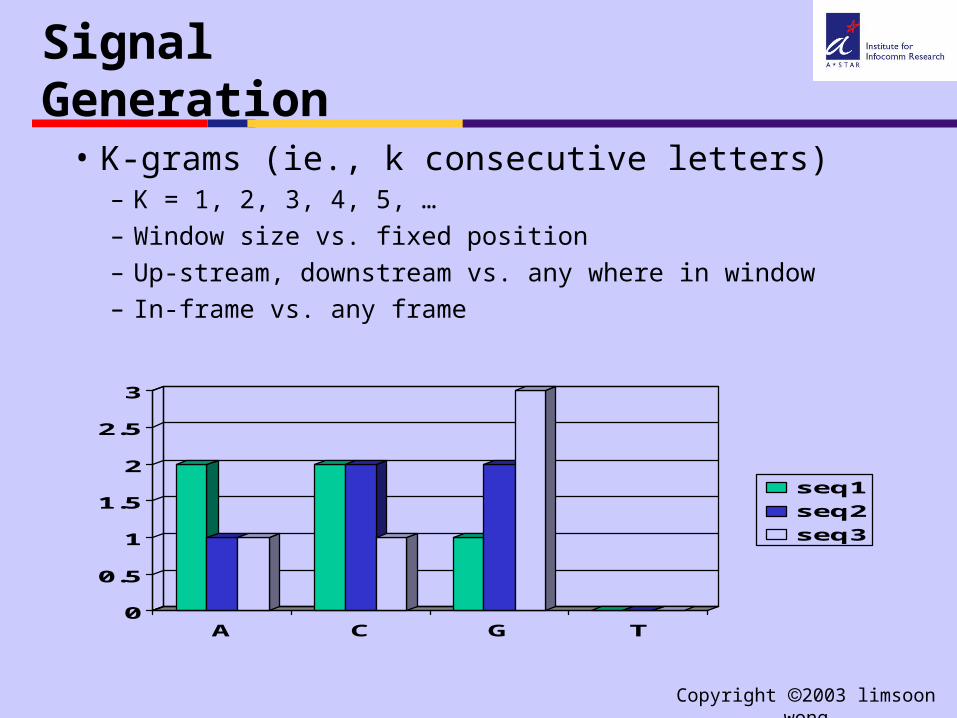
Signal Generation
• K-grams (ie., k consecutive letters)– K = 1, 2, 3, 4, 5, …– Window size vs. fixed position– Up-stream, downstream vs. any where in window– In-frame vs. any frame
0
0.5
1
1.5
2
2.5
3
A C G T
seq1
seq2
seq3
Copyright 2003 limsoon wong
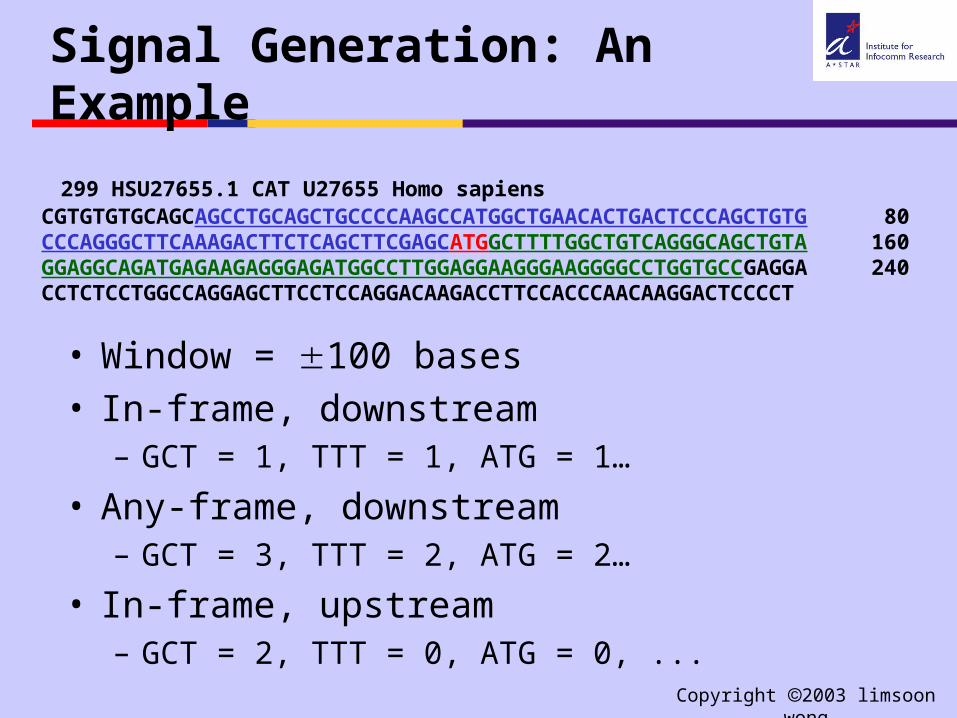
Signal Generation: An Example
299 HSU27655.1 CAT U27655 Homo sapiensCGTGTGTGCAGCAGCCTGCAGCTGCCCCAAGCCATGGCTGAACACTGACTCCCAGCTGTG 80CCCAGGGCTTCAAAGACTTCTCAGCTTCGAGCATGGCTTTTGGCTGTCAGGGCAGCTGTA 160GGAGGCAGATGAGAAGAGGGAGATGGCCTTGGAGGAAGGGAAGGGGCCTGGTGCCGAGGA 240CCTCTCCTGGCCAGGAGCTTCCTCCAGGACAAGACCTTCCACCCAACAAGGACTCCCCT
• Window = 100 bases• In-frame, downstream
– GCT = 1, TTT = 1, ATG = 1…
• Any-frame, downstream– GCT = 3, TTT = 2, ATG = 2…
• In-frame, upstream– GCT = 2, TTT = 0, ATG = 0, ...
Copyright 2003 limsoon wong
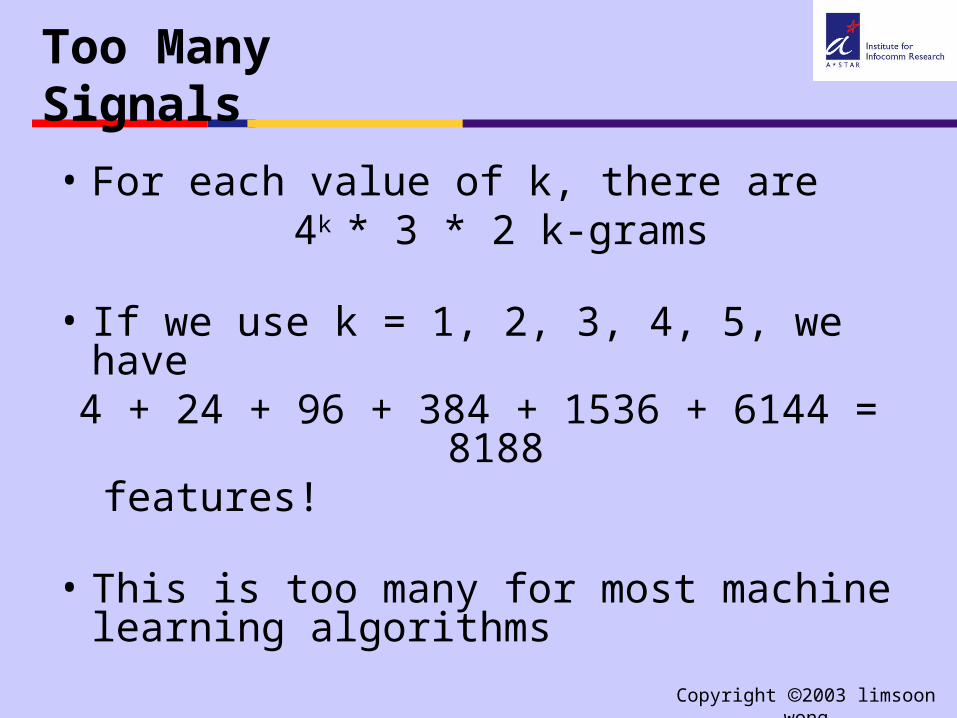
Too Many Signals
• For each value of k, there are4k * 3 * 2 k-grams
• If we use k = 1, 2, 3, 4, 5, we have4 + 24 + 96 + 384 + 1536 + 6144 = 8188features!
• This is too many for most machine learning algorithms
Copyright 2003 limsoon wong
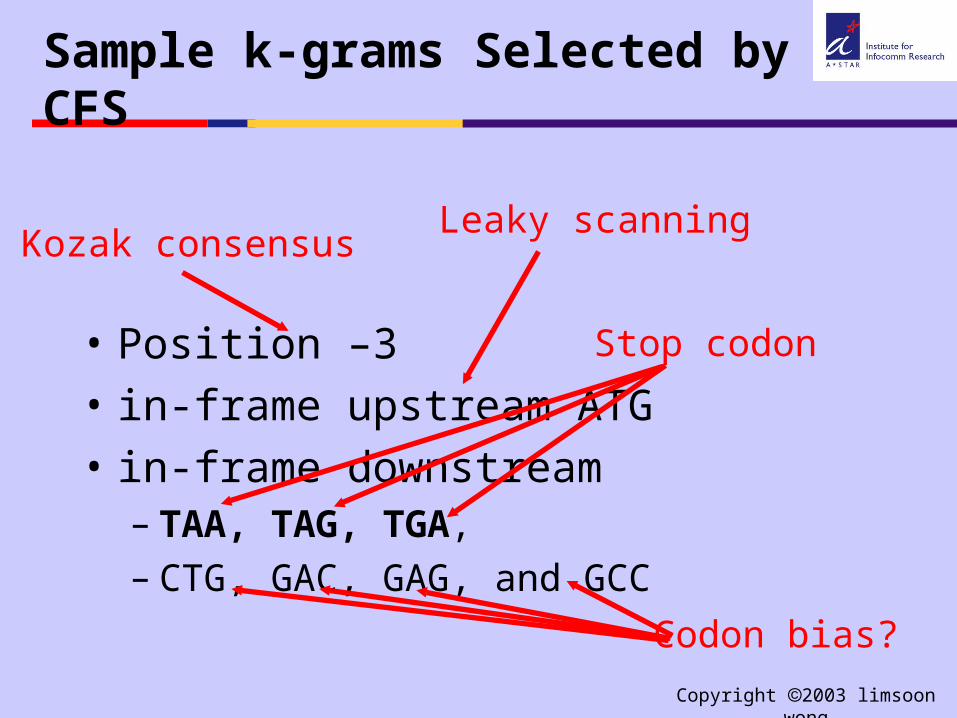
Sample k-grams Selected by CFS
• Position –3
• in-frame upstream ATG
• in-frame downstream – TAA, TAG, TGA, – CTG, GAC, GAG, and GCC
Kozak consensusLeaky scanning
Stop codon
Codon bias?

Copyright 2003 limsoon wong
Signal Integration
• kNNGiven a test sample, find the k training
samples that are most similar to it. Let the majority class win.
• SVMGiven a group of training samples from two
classes, determine a separating plane that maximises the margin of error.
• Naïve Bayes, ANN, C4.5, ...
Copyright 2003 limsoon wong
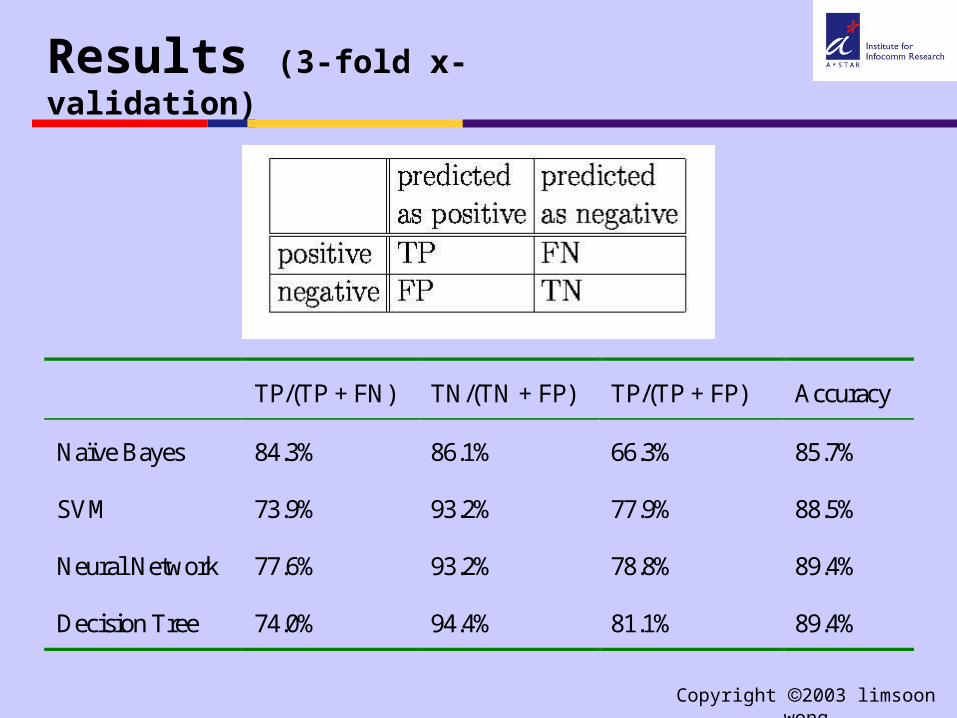
Results (3-fold x-validation)
TP/(TP + FN) TN/(TN + FP) TP/(TP + FP) Accuracy
Naïve Bayes 84.3% 86.1% 66.3% 85.7%
SVM 73.9% 93.2% 77.9% 88.5%
Neural Network 77.6% 93.2% 78.8% 89.4%
Decision Tree 74.0% 94.4% 81.1% 89.4%
Copyright 2003 limsoon wong
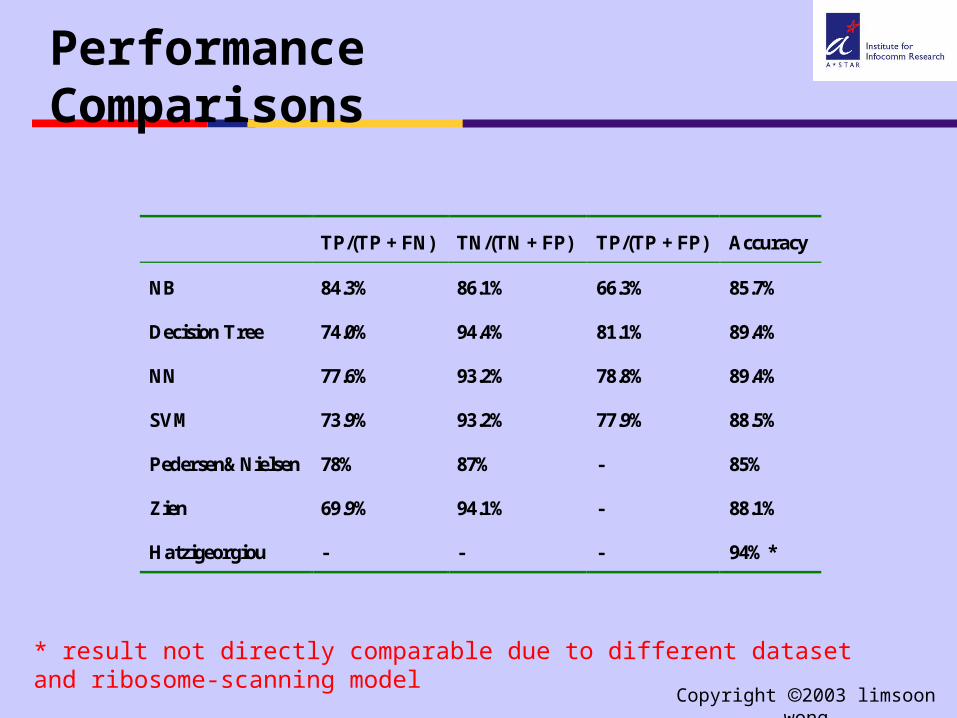
Performance Comparisons
TP/(TP + FN) TN/(TN + FP) TP/(TP + FP) Accuracy
NB 84.3% 86.1% 66.3% 85.7%
Decision Tree 74.0% 94.4% 81.1% 89.4%
NN 77.6% 93.2% 78.8% 89.4%
SVM 73.9% 93.2% 77.9% 88.5%
Pedersen&Nielsen 78% 87% - 85%
Zien 69.9% 94.1% - 88.1%
Hatzigeorgiou - - - 94%*
* result not directly comparable due to different dataset and ribosome-scanning model

Copyright 2003 limsoon wong
Improvement by Scanning
• Apply Naïve Bayes or SVM left-to-right until first ATG predicted as positive. That’s the TIS.
• Naïve Bayes & SVM models were trained using TIS vs. Up-stream ATG
TP/(TP + FN) TN/(TN + FP) TP/(TP + FP) Accuracy
NB 84.3% 86.1% 66.3% 85.7%
SVM 73.9% 93.2% 77.9% 88.5%
NB+Scanning 87.3% 96.1% 87.9% 93.9%
SVM+Scanning 88.5% 96.3% 88.6% 94.4%

Copyright 2003 limsoon wong
Technique Comparisons
• Pedersen&Nielsen [ISMB’97]
– Neural network– No explicit features
• Zien [Bioinformatics’00]
– SVM+kernel engineering
– No explicit features• Hatzigeorgiou [Bioinformatics’02]
– Multiple neural networks– Scanning rule– No explicit features
• Our approach
– Explicit feature
generation
– Explicit feature selection
– Use any machine
learning method w/o any
form of complicated
tuning
– Scanning rule is optional

Copyright 2003 limsoon wong
Can we do even better?
F
L
I
MV
S
P
T
A
Y
H
Q
N
K
D
E
C
WR
G
A
T
E
L
R
S
stop
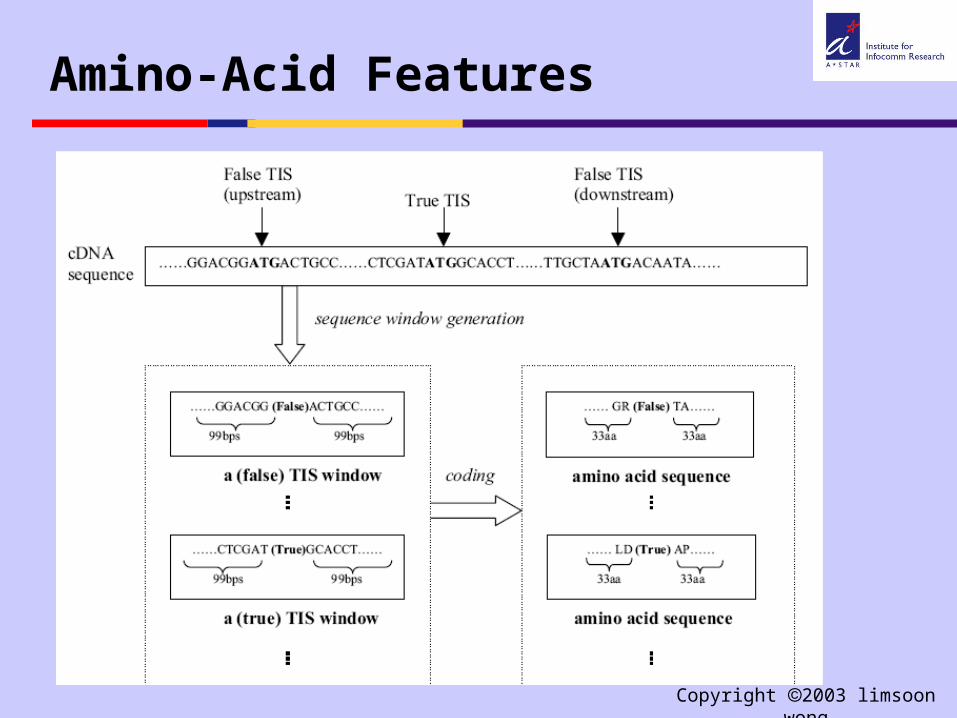
How about using k-grams from the translation?
Copyright 2003 limsoon wong
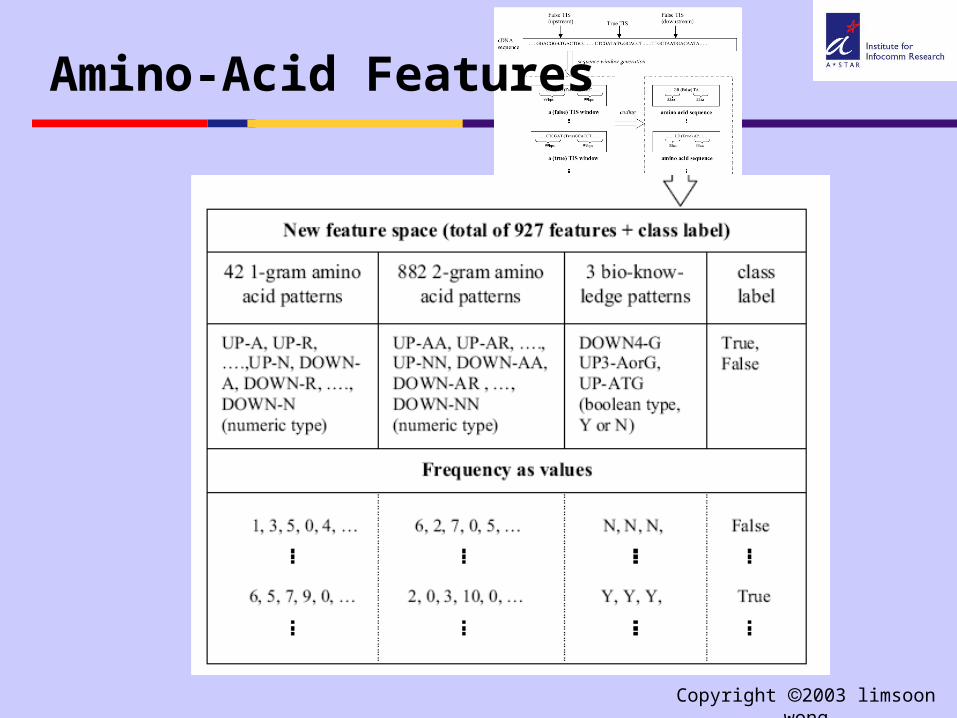
Amino-Acid Features
Copyright 2003 limsoon wong
Amino-Acid Features

Copyright 2003 limsoon wong
Amino Acid K-grams Discovered by Entropy

Copyright 2003 limsoon wong
Results (on Pedersen & Nielsen’s mRNA)
Performance based on top 100 amino-acid features:
is better than performance based on DNA seq. features:
Copyright 2003 limsoon wong
Independent Validation Sets
• A. Hatzigeorgiou:– 480 fully sequenced human cDNAs– 188 left after eliminating sequences similar
to training set (Pedersen & Nielsen’s)– 3.42% of ATGs are TIS
• Our own:– well characterized human gene sequences
from chromosome X (565 TIS) and chromosome 21 (180 TIS)

Copyright 2003 limsoon wong
Validation Results (on Hatzigeorgiou’s)
– Using top 100 features selected by entropy and trained on Pedersen & Nielsen’s dataset
Copyright 2003 limsoon wong
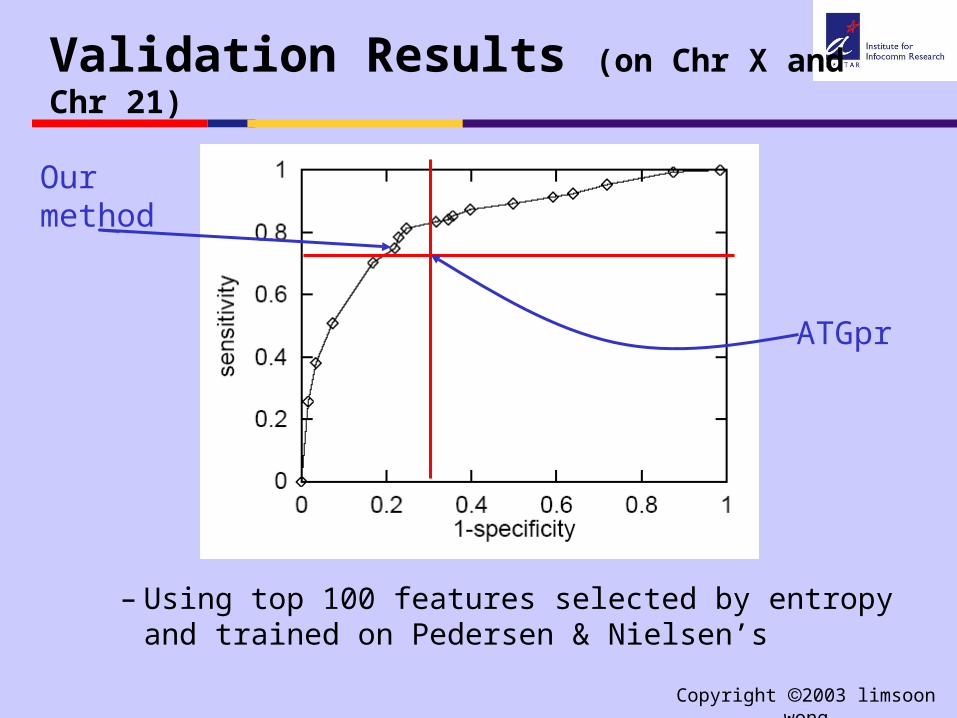
Validation Results (on Chr X and Chr 21)
– Using top 100 features selected by entropy and trained on Pedersen & Nielsen’s
ATGpr
Ourmethod

Copyright 2003 limsoon wong
Recognition of Transcription Start Sites
An introduction to the World’s best TSS recognition system A heavy tuning approach
Copyright 2003 limsoon wong
Transcription Start Site
Copyright 2003 limsoon wong
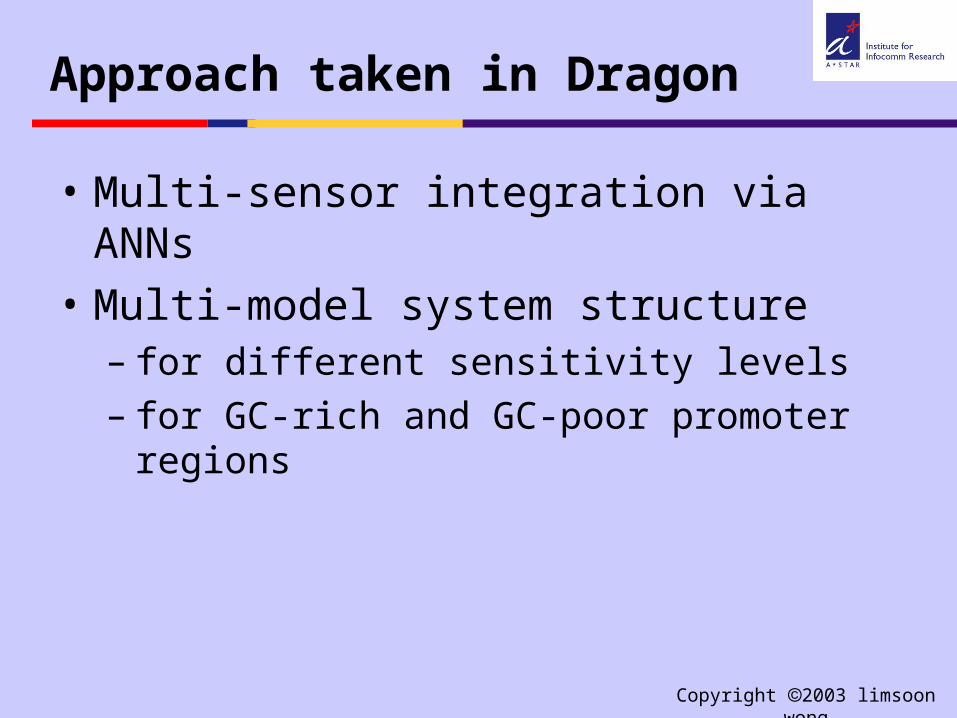
Approach taken in Dragon
• Multi-sensor integration via ANNs
• Multi-model system structure – for different sensitivity levels– for GC-rich and GC-poor promoter regions
Copyright 2003 limsoon wong
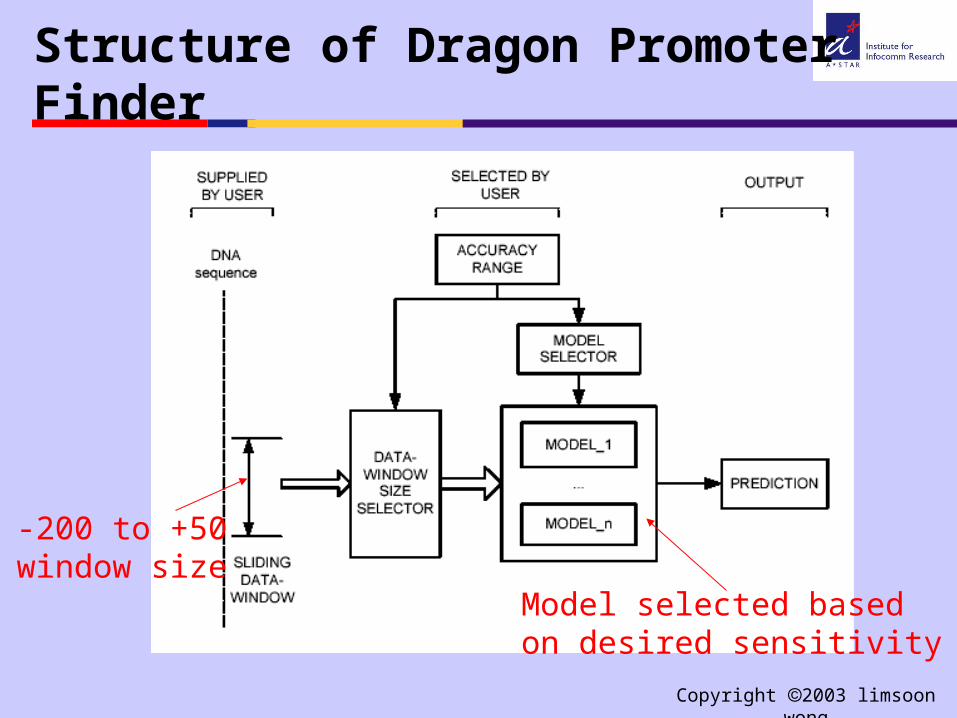
Structure of Dragon Promoter Finder
-200 to +50window size
Model selected based on desired sensitivity
Copyright 2003 limsoon wong
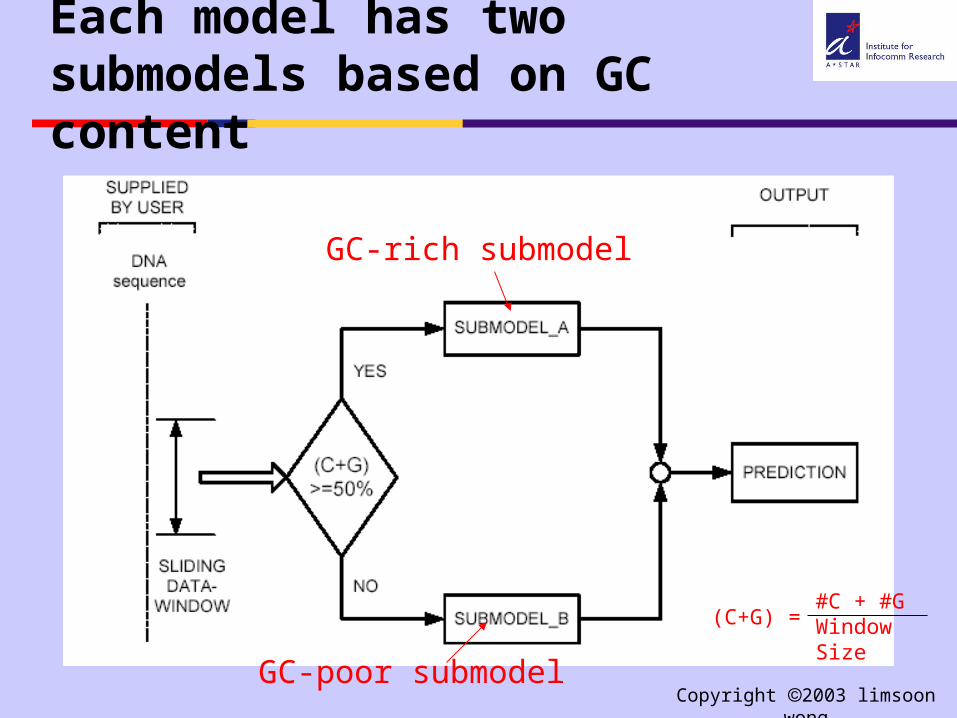
Each model has two submodels based on GC content
GC-rich submodel
GC-poor submodel
(C+G) =#C + #GWindow Size

Copyright 2003 limsoon wong
Data Analysis Within Submodel
K-gram (k = 5) positional weight matrix
p
e
i

Copyright 2003 limsoon wong
Promoter, Exon, Intron Sensors
• These sensors are positional weight matrices of k-grams, k = 5 (aka pentamers)
• They are calculated as below using promoter, exon, intron data respectively
Pentamer at ith
position in input
jth pentamer atith position in training window
Frequency of jthpentamer at ith positionin training window
Window size

Copyright 2003 limsoon wong
Data Preprocessing & ANN
Tuning parameters
tanh(x) =ex e-x
ex e-x
sIE
sI
sEtanh(net)
Simple feedforward ANN trained by the Bayesian regularisation method
wi
net = si * wi
Tunedthreshold

Copyright 2003 limsoon wong
Accuracy Comparisons
without C+G submodels
with C+G submodels
Copyright 2003 limsoon wong
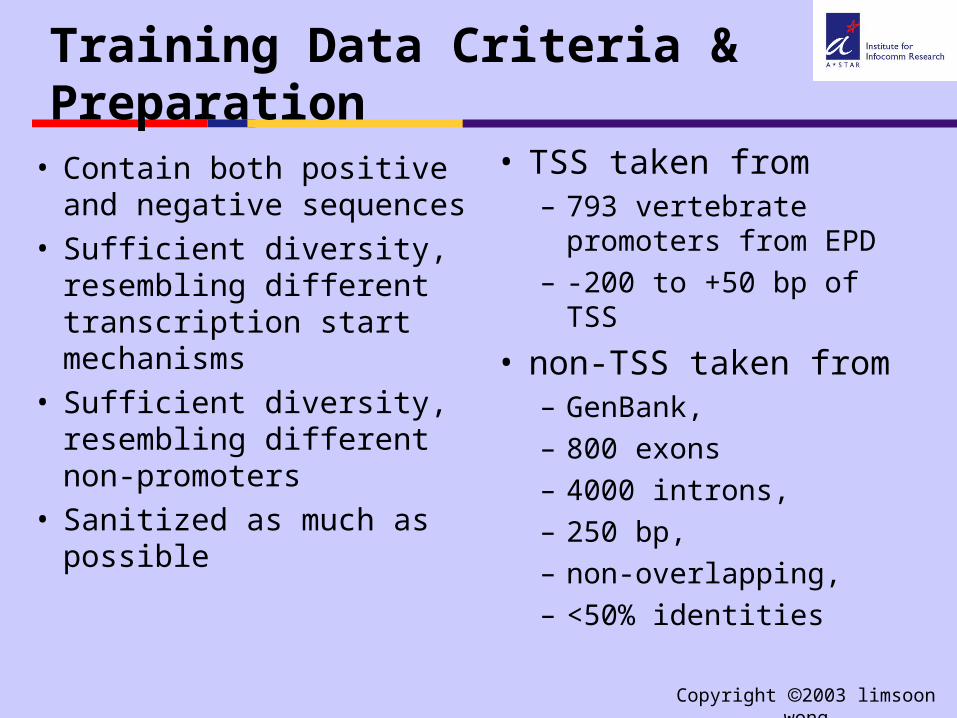
Training Data Criteria & Preparation
• Contain both positive and negative sequences
• Sufficient diversity, resembling different transcription start mechanisms
• Sufficient diversity, resembling different non-promoters
• Sanitized as much as possible
• TSS taken from– 793 vertebrate
promoters from EPD– -200 to +50 bp of TSS
• non-TSS taken from – GenBank, – 800 exons – 4000 introns, – 250 bp, – non-overlapping, – <50% identities
Copyright 2003 limsoon wong
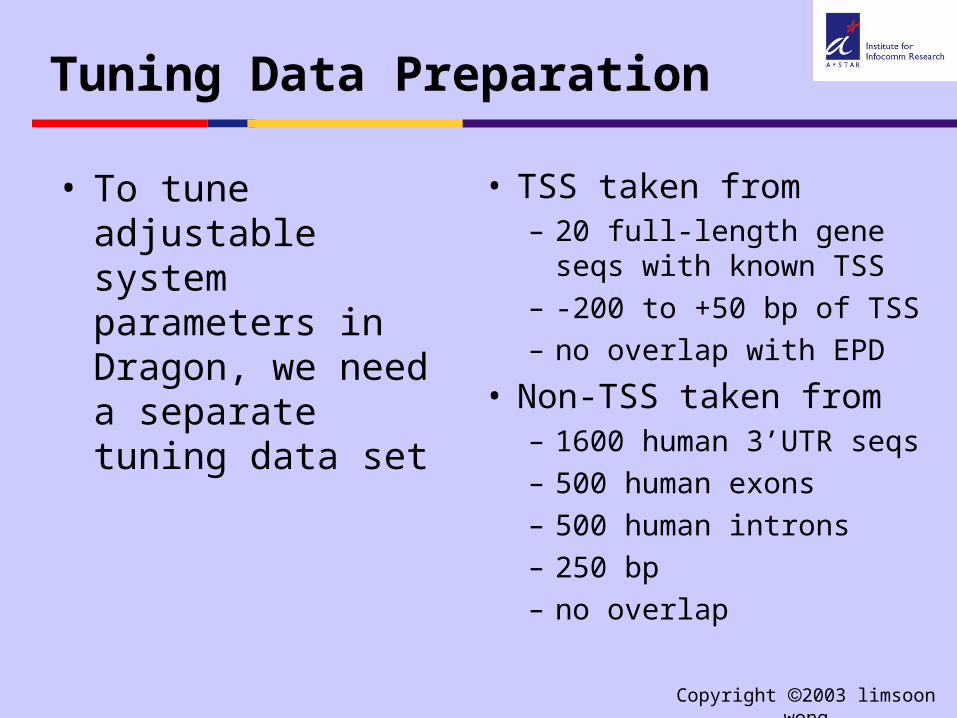
Tuning Data Preparation
• To tune adjustable system parameters in Dragon, we need a separate tuning data set
• TSS taken from – 20 full-length gene seqs
with known TSS– -200 to +50 bp of TSS– no overlap with EPD
• Non-TSS taken from– 1600 human 3’UTR seqs– 500 human exons– 500 human introns– 250 bp– no overlap
Copyright 2003 limsoon wong
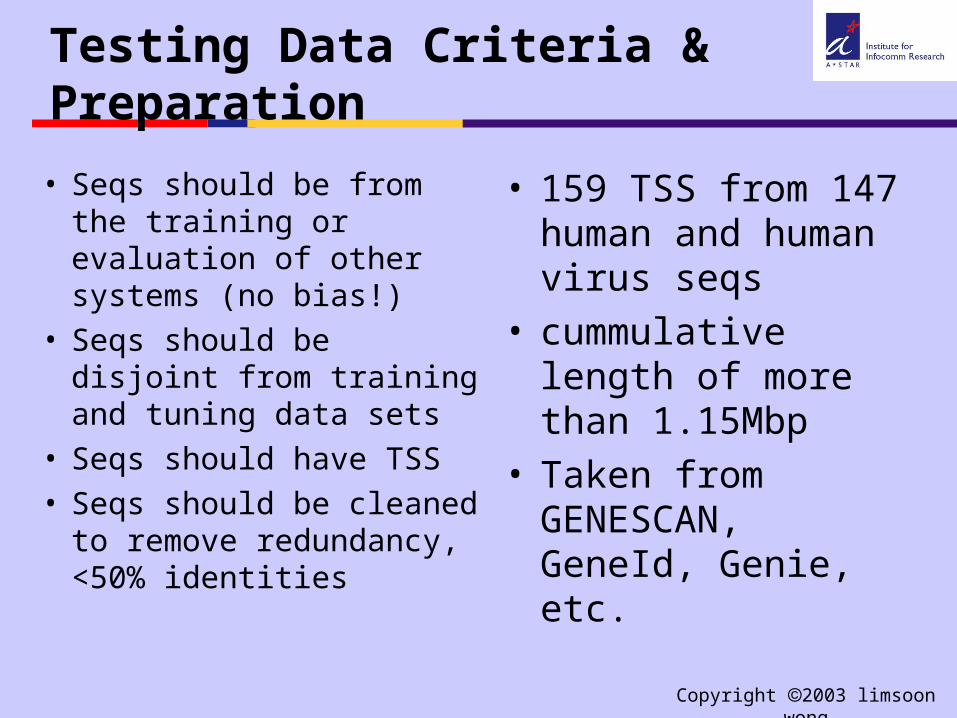
Testing Data Criteria & Preparation
• Seqs should be from the training or evaluation of other systems (no bias!)
• Seqs should be disjoint from training and tuning data sets
• Seqs should have TSS• Seqs should be cleaned
to remove redundancy, <50% identities
• 159 TSS from 147 human and human virus seqs
• cummulative length of more than 1.15Mbp
• Taken from GENESCAN, GeneId, Genie, etc.
Copyright 2003 limsoon wong
Survey of Neural Network Based Systems for Recognizing Gene
Features
Copyright 2003 limsoon wong
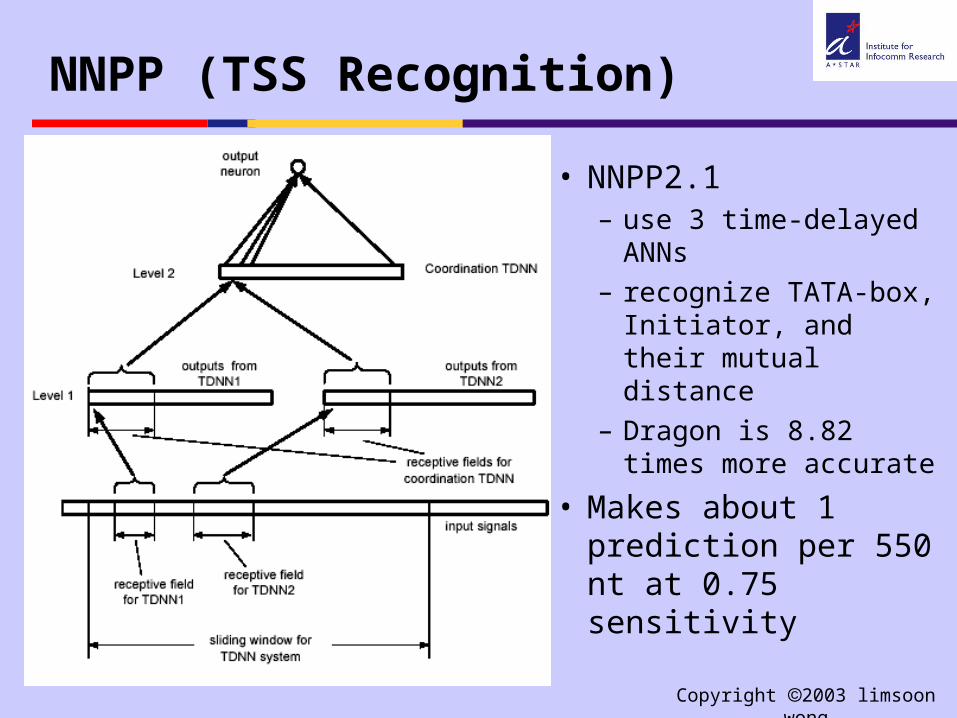
NNPP (TSS Recognition)
• NNPP2.1– use 3 time-delayed
ANNs– recognize TATA-box,
Initiator, and their mutual distance
– Dragon is 8.82 times more accurate
• Makes about 1 prediction per 550 nt at 0.75 sensitivity

Copyright 2003 limsoon wong
Promoter 2.0 (TSS Recognition)
• Promoter 2.0– use ANN – recognize 4 signals
commonly present in eukaryotic promoters: TATA-box, Initiator, GC-box, CCAAT-box, and their mutual distances
– Dragon is 56.9 times more accurate

Copyright 2003 limsoon wong
Promoter Inspector (TSS Recognition)
• statistics-based
• the most accurate reported system for finding promoter region
• uses sensors for promoters, exons, introns, 3’UTRs
• Strong bias for CpG-related promoters
• Dragon is 6.88 times better– to compare with Dragon, we consider Promoter Inspector to
have made correct prediction if TSS falls within a predicted promoter region by Promoter Inspector

Copyright 2003 limsoon wong
Grail’s Promoter Prediction Module
Makes about 1 prediction per 230000 nt at 0.66 sensitivity
Copyright 2003 limsoon wong
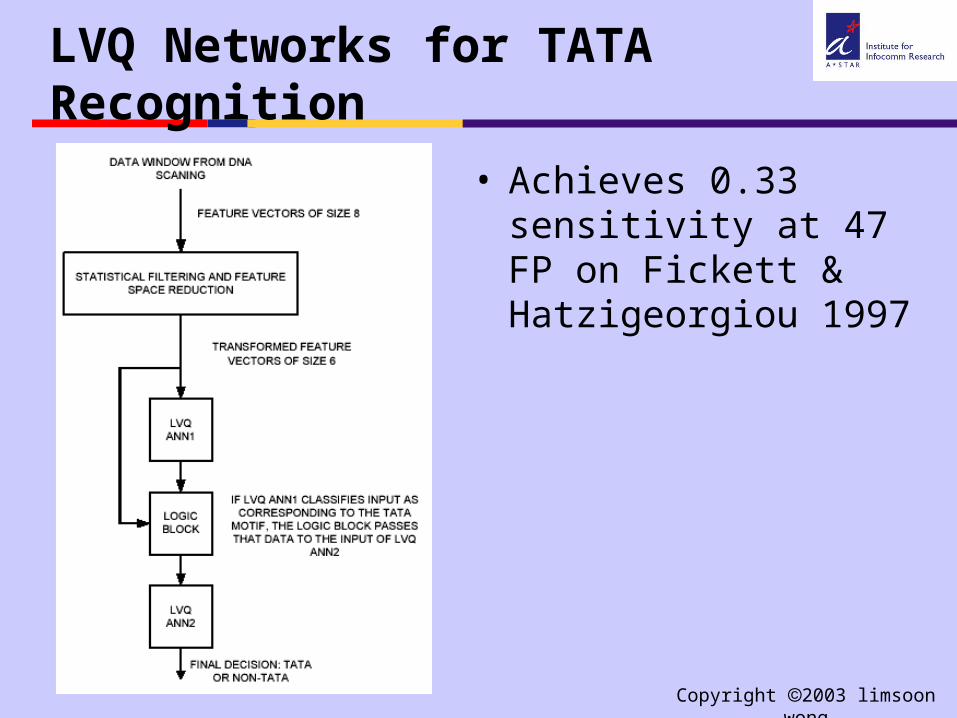
LVQ Networks for TATA Recognition
• Achieves 0.33 sensitivity at 47 FP on Fickett & Hatzigeorgiou 1997
Copyright 2003 limsoon wong
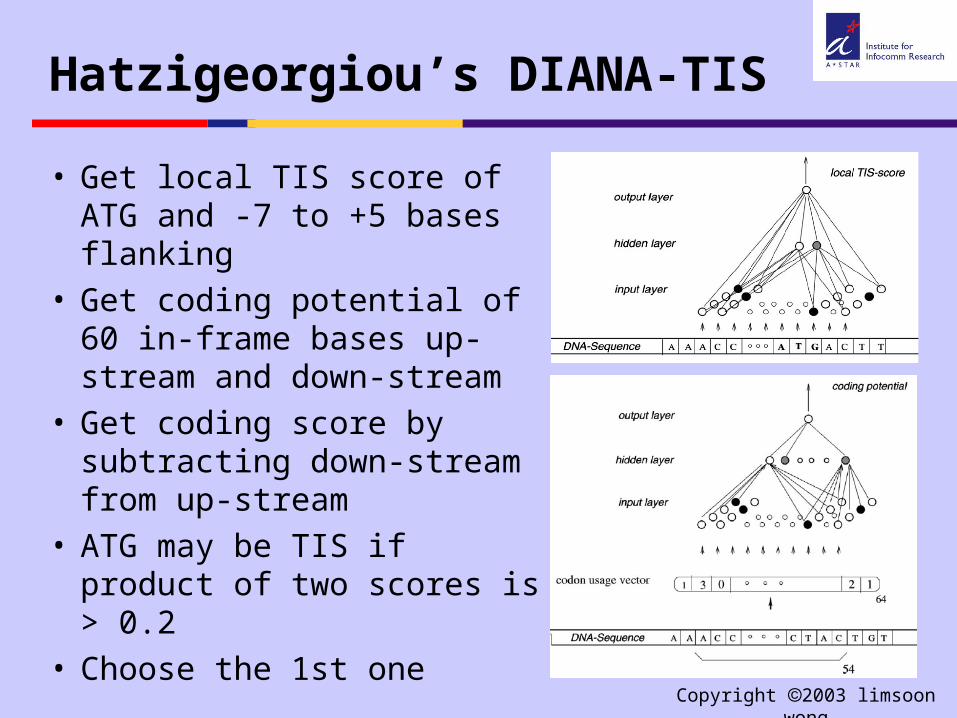
Hatzigeorgiou’s DIANA-TIS
• Get local TIS score of ATG and -7 to +5 bases flanking
• Get coding potential of 60 in-frame bases up-stream and down-stream
• Get coding score by subtracting down-stream from up-stream
• ATG may be TIS if product of two scores is > 0.2
• Choose the 1st one

Copyright 2003 limsoon wong
Pedersen & Nielson’s NetStart
• Predict TIS by ANN
• -100 to +100 bases as input window
• feedforward 3 layer ANN
• 30 hidden neurons
• sensitivity = 78%
• specificity = 87%

Copyright 2003 limsoon wong
Notes

Copyright 2003 limsoon wong
References (expt design, result interpretation)
• John A. Swets, “Measuring the accuracy of diagnostic systems”, Science 240:1285--1293, June 1988
• Trevor Hastie, Robert Tibshirani, Jerome Friedman, The Elements of Statistical Learning: Data Mining, Inference, and Prediction, Springer, 2001. Chapters 1, 7
• Lance D. Miller et al., “Optimal gene expression analysis by microarrays”, Cancer Cell 2:353--361, November 2002

Copyright 2003 limsoon wong
References (TIS recognition)
• A. G. Pedersen, H. Nielsen, “Neural network prediction of translation initiation sites in eukaryotes”, ISMB 5:226--233, 1997
• L. Wong et al., “Using feature generation and feature selection for accurate prediction of translation initiation sites”, GIW 13:192--200, 2002
• A. Zien et al., “Engineering support vector machine kernels that recognize translation initiation sites”, Bioinformatics 16:799--807, 2000
• A. G. Hatzigeorgiou, “Translation initiation start prediction in human cDNAs with high accuracy”, Bioinformatics 18:343--350, 2002

Copyright 2003 limsoon wong
References (TSS Recognition)
• V.B.Bajic et al., “Computer model for recognition of functional transcription start sites in RNA polymerase II promoters of vertebrates”, J. Mol. Graph. & Mod. 21:323--332, 2003
• V.B.Bajic et al., “Dragon Promoter Finder: Recognition of vertebrate RNA polymerase II promoters”, Bioinformatics 18:198--199, 2002.
• V.B.Bajic et al., “Intelligent system for vertebrate promoter recognition”, IEEE Intelligent Systems 17:64--70, 2002.

Copyright 2003 limsoon wong
References (TSS Recognition)
• J.W.Fickett, A.G.Hatzigeorgiou, “Eukaryotic promoter recognition”, Gen. Res. 7:861--878, 1997
• Y.Xu, et al., “GRAIL: A multi-agent neural network system for gene identification”, Proc. IEEE 84:1544--1552, 1996
• M.G.Reese, “Application of a time-delay neural network to promoter annotation in the D. melanogaster genome”, Comp. & Chem. 26:51--56, 2001
• A.G.Pedersen et al., “The biology of eukaryotic promoter prediction---a review”, Comp. & Chem. 23:191--207, 1999
Copyright 2003 limsoon wong
References (TSS Recognition)
• S.Knudsen, “Promoter 2.0 for the recognition of Pol II promoter sequences”, Bioinformatics 15:356--361, 1999.
• H.Wang, “Statistical pattern recognition based on LVQ ANN: Application to TATA-box motif”, M.Tech Thesis, Technikon Natal, South Africa
• M.Scherf, et al., “Highly specific localisation of promoter region in large genome sequences by Promoter Inspector: A novel context analysis approach”, JMB 297:599--606, 2000

Copyright 2003 limsoon wong
References (feature selection)
• M. A. Hall, “Correlation-based feature selection machine learning”, PhD thesis, Dept of Comp. Sci., Univ. of Waikato, New Zealand, 1998
• U. M. Fayyad, K. B. Irani, “Multi-interval discretization of continuous-valued attributes”, IJCAI 13:1022-1027, 1993
• H. Liu, R. Sentiono, “Chi2: Feature selection and discretization of numeric attributes”, IEEE Intl. Conf. Tools with Artificial Intelligence 7:338--391, 1995

Copyright 2003 limsoon wong
Acknowledgements (for TIS)
• A.G. Pedersen
• H. Nielsen
• Roland Yap
• Fanfan Zeng
Jinyan Li
Huiqing Liu

Copyright 2003 limsoon wong
Acknowledgements (for TSS)

Copyright 2003 limsoon wong
The lecture will be on Thursday, 20th, from 6.30--9.30pmat LT07 (which is very close to the entrance of the schoolof computer engineering, 2nd floor). If you come to my officeBlk N4 - 2a05, which is close to the General Office of SCE,I am happy to usher you to the lecture theater.