copy and paste almost anything arthur tabachneck myqna, inc. john king ouachita clinical data...
Post on 20-Dec-2015
217 views
TRANSCRIPT

Copy and paste almost anythingArthur Tabachneck
Myqna, Inc.
John KingOuachita Clinical Data Services, Inc.
Ben PowellGenworth Financial
Nate DerbyStakana Analytics
Randy HerbisonWestat
Richard DeVeneziaIndependent Consultant
2012OrlandoFloridaApril 22-25, 2012

Suppose you found a table on the web that you needed to have in a SAS datasetTable A. Total tax revenue as percentage of GDP
1975 1985 1990 1995 2000 2004 2005 20062007
Provisional
Korea 15.1 16.4 18.9 19.4 23.6 24.6 25.5 26.8 28.7
New Zealand 28.5 31.1 37.4 36.6 33.6 35.3 37.5 36.7 36.0
Austria 36.7 40.9 39.6 41.2 42.6 42.8 42.1 41.7 41.9
Belgium 39.5 44.4 42.0 43.6 44.9 44.8 44.8 44.5 n.a.
Czech Republic 37.5 35.3 37.8 37.5 36.9 36.4
Denmark1 38.4 46.1 46.5 48.8 49.4 49.0 50.7 49.1 48.9
Source: http://www.oecd.org/dataoecd/48/27/41498733.pdf

The table might be in the form of: an html page
a pdf document
a spreadsheet
a word document
a page from a wikior any other form that you can copy to your system's clipboard
and, of course, it could come from any source .. not just the web

things that can complicate copying and pasting:
Table A. Total tax revenue as percentage of GDP
1975 1985 1990 1995 2000 2004 2005 20062007
Provisional
Korea 15.1 16.4 18.9 19.4 23.6 24.6 25.5 26.8 28.7
New Zealand 28.5 31.1 37.4 36.6 33.6 35.3 37.5 36.7 36.0
Austria 36.7 40.9 39.6 41.2 42.6 42.8 42.1 41.7 41.9
Belgium 39.5 44.4 42.0 43.6 44.9 44.8 44.8 44.5 n.a.
Czech Republic 37.5 35.3 37.8 37.5 36.9 36.4
Denmark1 38.4 46.1 46.5 48.8 49.4 49.0 50.7 49.1 48.9
some columns may not have variable names
Source: http://www.oecd.org/dataoecd/48/27/41498733.pdf

Table A. Total tax revenue as percentage of GDP
1975 1985 1990 1995 2000 2004 2005 20062007
Provisional
Korea 15.1 16.4 18.9 19.4 23.6 24.6 25.5 26.8 28.7
New Zealand 28.5 31.1 37.4 36.6 33.6 35.3 37.5 36.7 36.0
Austria 36.7 40.9 39.6 41.2 42.6 42.8 42.1 41.7 41.9
Belgium 39.5 44.4 42.0 43.6 44.9 44.8 44.8 44.5 n.a.
Czech Republic 37.5 35.3 37.8 37.5 36.9 36.4
Denmark1 38.4 46.1 46.5 48.8 49.4 49.0 50.7 49.1 48.9
variable names may take up more than one row
Row 3Row 2
Row 1
Source: http://www.oecd.org/dataoecd/48/27/41498733.pdf
things that can complicate copying and pasting:

tables may contain one or more blank rowsthings that can complicate copying and pasting:
Source: http://www.oecd.org/dataoecd/48/27/41498733.pdf
Table A. Total tax revenue as percentage of GDP
1975 1985 1990 1995 2000 2004 2005 20062007
Provisional
Korea 15.1 16.4 18.9 19.4 23.6 24.6 25.5 26.8 28.7
New Zealand 28.5 31.1 37.4 36.6 33.6 35.3 37.5 36.7 36.0
Austria 36.7 40.9 39.6 41.2 42.6 42.8 42.1 41.7 41.9
Belgium 39.5 44.4 42.0 43.6 44.9 44.8 44.8 44.5 n.a.
Czech Republic 37.5 35.3 37.8 37.5 36.9 36.4
Denmark1 38.4 46.1 46.5 48.8 49.4 49.0 50.7 49.1 48.9
rows may have some missing values
Source: http://www.oecd.org/dataoecd/48/27/41498733.pdf
things that can complicate copying and pasting:

Table A. Total tax revenue as percentage of GDP
1975 1985 1990 1995 2000 2004 2005 20062007
Provisional
Korea 15.1 16.4 18.9 19.4 23.6 24.6 25.5 26.8 28.7
New Zealand 28.5 31.1 37.4 36.6 33.6 35.3 37.5 36.7 36.0
Austria 36.7 40.9 39.6 41.2 42.6 42.8 42.1 41.7 41.9
Belgium 39.5 44.4 42.0 43.6 44.9 44.8 44.8 44.5 n.a.
Czech Republic 37.5 35.3 37.8 37.5 36.9 36.4
Denmark1 38.4 46.1 46.5 48.8 49.4 49.0 50.7 49.1 48.9
data may contain sub or superscript values
Source: http://www.oecd.org/dataoecd/48/27/41498733.pdf
things that can complicate copying and pasting:

Table A. Total tax revenue as percentage of GDP
1975 1985 1990 1995 2000 2004 2005 20062007
Provisional
Korea 15.1 16.4 18.9 19.4 23.6 24.6 25.5 26.8 28.7
New Zealand 28.5 31.1 37.4 36.6 33.6 35.3 37.5 36.7 36.0
Austria 36.7 40.9 39.6 41.2 42.6 42.8 42.1 41.7 41.9
Belgium 39.5 44.4 42.0 43.6 44.9 44.8 44.8 44.5 n.a.
Czech Republic 37.5 35.3 37.8 37.5 36.9 36.4
Denmark1 38.4 46.1 46.5 48.8 49.4 49.0 50.7 49.1 48.9
Source: http://www.oecd.org/dataoecd/48/27/41498733.pdf
you may want to name or rename some variablesplus, there might be things you want to change:
Country

Table A. Total tax revenue as percentage of GDP
1975 1985 1990 1995 2000 2004 2005 20062007
Provisional
Korea 15.1 16.4 18.9 19.4 23.6 24.6 25.5 26.8 28.7
New Zealand 28.5 31.1 37.4 36.6 33.6 35.3 37.5 36.7 36.0
Austria 36.7 40.9 39.6 41.2 42.6 42.8 42.1 41.7 41.9
Belgium 39.5 44.4 42.0 43.6 44.9 44.8 44.8 44.5 n.a.
Czech Republic 37.5 35.3 37.8 37.5 36.9 36.4
Denmark1 38.4 46.1 46.5 48.8 49.4 49.0 50.7 49.1 48.9
Source: http://www.oecd.org/dataoecd/48/27/41498733.pdf
Revenue1975
you may want to add a variable name prefix/suffix
CountryRevenue
2000Revenue
1985Revenue
1990Revenue
1995Revenue
2004Revenue
2005Revenue
2006
plus, there might be things you want to change:

Table A. Total tax revenue as percentage of GDP
1975 1985 1990 1995 2000 2004 2005 20062007
Provisional
Korea 15.1 16.4 18.9 19.4 23.6 24.6 25.5 26.8 28.7
New Zealand 28.5 31.1 37.4 36.6 33.6 35.3 37.5 36.7 36.0
Austria 36.7 40.9 39.6 41.2 42.6 42.8 42.1 41.7 41.9
Belgium 39.5 44.4 42.0 43.6 44.9 44.8 44.8 44.5 n.a.
Czech Republic 37.5 35.3 37.8 37.5 36.9 36.4
Denmark1 38.4 46.1 46.5 48.8 49.4 49.0 50.7 49.1 48.9
Source: http://www.oecd.org/dataoecd/48/27/41498733.pdf
you might want to add a variable label
2007Guesstimate
plus, there might be things you want to change:

Table A. Total tax revenue as percentage of GDP
1975 1985 1990 1995 2000 2004 2005 20062007
Provisional
Korea 15.1 16.4 18.9 19.4 23.6 24.6 25.5 26.8 28.7
New Zealand 28.5 31.1 37.4 36.6 33.6 35.3 37.5 36.7 36.0
Austria 36.7 40.9 39.6 41.2 42.6 42.8 42.1 41.7 41.9
Belgium 39.5 44.4 42.0 43.6 44.9 44.8 44.8 44.5 n.a.
Czech Republic 37.5 35.3 37.8 37.5 36.9 36.4
Denmark1 38.4 46.1 46.5 48.8 49.4 49.0 50.7 49.1 48.9
Source: http://www.oecd.org/dataoecd/48/27/41498733.pdf
you might want to specify missing values
n.a.
plus, there might be things you want to change:

Table A. Total tax revenue as percentage of GDP
1975 1985 1990 1995 2000 2004 2005 20062007
Provisional
Korea 15.1 16.4 18.9 19.4 23.6 24.6 25.5 26.8 28.7
New Zealand 28.5 31.1 37.4 36.6 33.6 35.3 37.5 36.7 36.0
Austria 36.7 40.9 39.6 41.2 42.6 42.8 42.1 41.7 41.9
Belgium 39.5 44.4 42.0 43.6 44.9 44.8 44.8 44.5 n.a.
Czech Republic 37.5 35.3 37.8 37.5 36.9 36.4
Denmark1 38.4 46.1 46.5 48.8 49.4 49.0 50.7 49.1 48.9Source: http://www.oecd.org/dataoecd/48/27/41498733.pdf
you may want to multiply a variable by a constant
.384
plus, there might be things you want to change:

Table A. Total tax revenue as percentage of GDP
1975 1985 1990 1995 2000 2004 2005 20062007
Provisional
Korea 15.1 16.4 18.9 19.4 23.6 24.6 25.5 26.8 28.7
New Zealand 28.5 31.1 37.4 36.6 33.6 35.3 37.5 36.7 36.0
Austria 36.7 40.9 39.6 41.2 42.6 42.8 42.1 41.7 41.9
Belgium 39.5 44.4 42.0 43.6 44.9 44.8 44.8 44.5 n.a.
Czech Republic 37.5 35.3 37.8 37.5 36.9 36.4
Denmark1 38.4 46.1 46.5 48.8 49.4 49.0 50.7 49.1 48.9
Source: http://www.oecd.org/dataoecd/48/27/41498733.pdf
37.5%
you may want to specify formats or informatsplus, there might be things you want to change:

Table A. Total tax revenue as percentage of GDP
1975 1985 1990 1995 2000 2004 2005 20062007
Provisional
Korea 15.1 16.4 18.9 19.4 23.6 24.6 25.5 26.8 28.7
New Zealand 28.5 31.1 37.4 36.6 33.6 35.3 37.5 36.7 36.0
Austria 36.7 40.9 39.6 41.2 42.6 42.8 42.1 41.7 41.9
Belgium 39.5 44.4 42.0 43.6 44.9 44.8 44.8 44.5 n.a.
Czech Republic 37.5 35.3 37.8 37.5 36.9 36.4
Denmark1 38.4 46.1 46.5 48.8 49.4 49.0 50.7 49.1 48.9
Source: http://www.oecd.org/dataoecd/48/27/41498733.pdf
you may want to specify which row(s) should be used to guess formats and informats
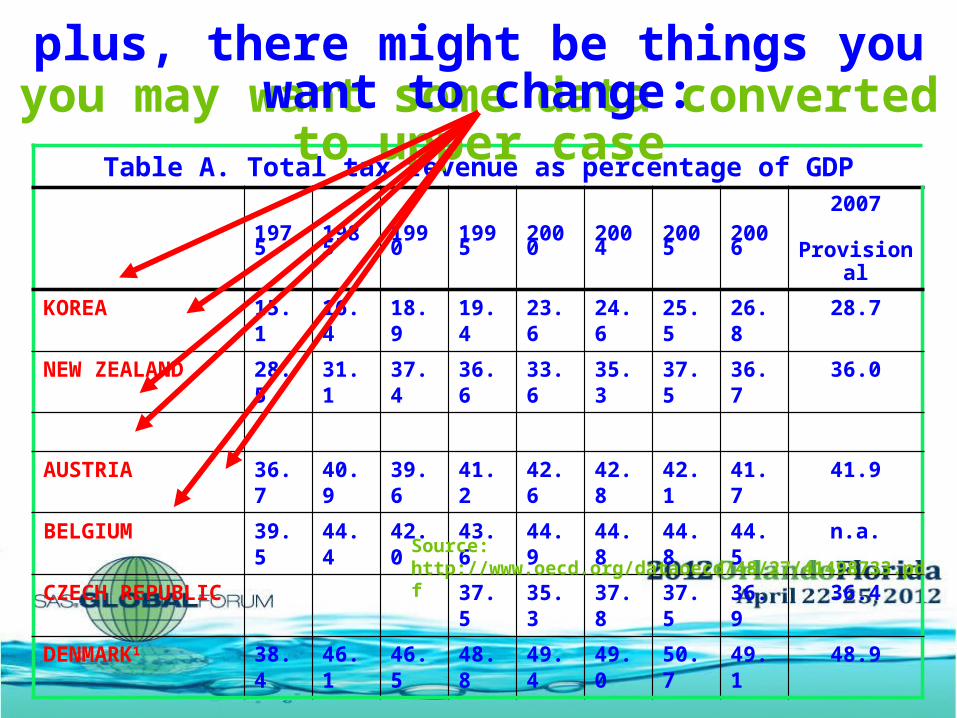
Table A. Total tax revenue as percentage of GDP
1975 1985 1990 1995 2000 2004 2005 20062007
Provisional
KOREA 15.1 16.4 18.9 19.4 23.6 24.6 25.5 26.8 28.7
NEW ZEALAND 28.5 31.1 37.4 36.6 33.6 35.3 37.5 36.7 36.0
AUSTRIA 36.7 40.9 39.6 41.2 42.6 42.8 42.1 41.7 41.9
BELGIUM 39.5 44.4 42.0 43.6 44.9 44.8 44.8 44.5 n.a.
CZECH REPUBLIC 37.5 35.3 37.8 37.5 36.9 36.4
DENMARK1 38.4 46.1 46.5 48.8 49.4 49.0 50.7 49.1 48.9
Source: http://www.oecd.org/dataoecd/48/27/41498733.pdf
you may want some data converted to upper caseplus, there might be things you want to change:

Table A. Total tax revenue as percentage of GDP
1975 1985 1990 1995 2000 2004 2005 20062007
Provisional
Korea 15.1 16.4 18.9 19.4 23.6 24.6 25.5 26.8 28.7
New Zealand 28.5 31.1 37.4 36.6 33.6 35.3 37.5 36.7 36.0
Austria 36.7 40.9 39.6 41.2 42.6 42.8 42.1 41.7 41.9
Belgium 39.5 44.4 42.0 43.6 44.9 44.8 44.8 44.5 n.a.
Czech Republic 37.5 35.3 37.8 37.5 36.9 36.4
Denmark1 38.4 46.1 46.5 48.8 49.4 49.0 50.7 49.1 48.9
Source: http://www.oecd.org/dataoecd/48/27/41498733.pdf
you may not want all of the data
Revenue1975Country
Revenue2000
Revenue1985
Revenue1990
Revenue1995
Revenue2004
Revenue2005
Revenue2006
plus, there might be things you want to change:

Table A. Total tax revenue as percentage of GDP
1975 1985 1990 1995 2000 2004 2005 20062007
Provisional
Korea 15.1 16.4 18.9 19.4 23.6 24.6 25.5 26.8 28.7
New Zealand 28.5 31.1 37.4 36.6 33.6 35.3 37.5 36.7 36.0
Austria 36.7 40.9 39.6 41.2 42.6 42.8 42.1 41.7 41.9
Belgium 39.5 44.4 42.0 43.6 44.9 44.8 44.8 44.5 n.a.
Czech Republic 37.5 35.3 37.8 37.5 36.9 36.4
Denmark1 38.4 46.1 46.5 48.8 49.4 49.0 50.7 49.1 48.9
Source: http://www.oecd.org/dataoecd/48/27/41498733.pdf
you may want to drop one or more columns
Country
plus, there might be things you want to change:
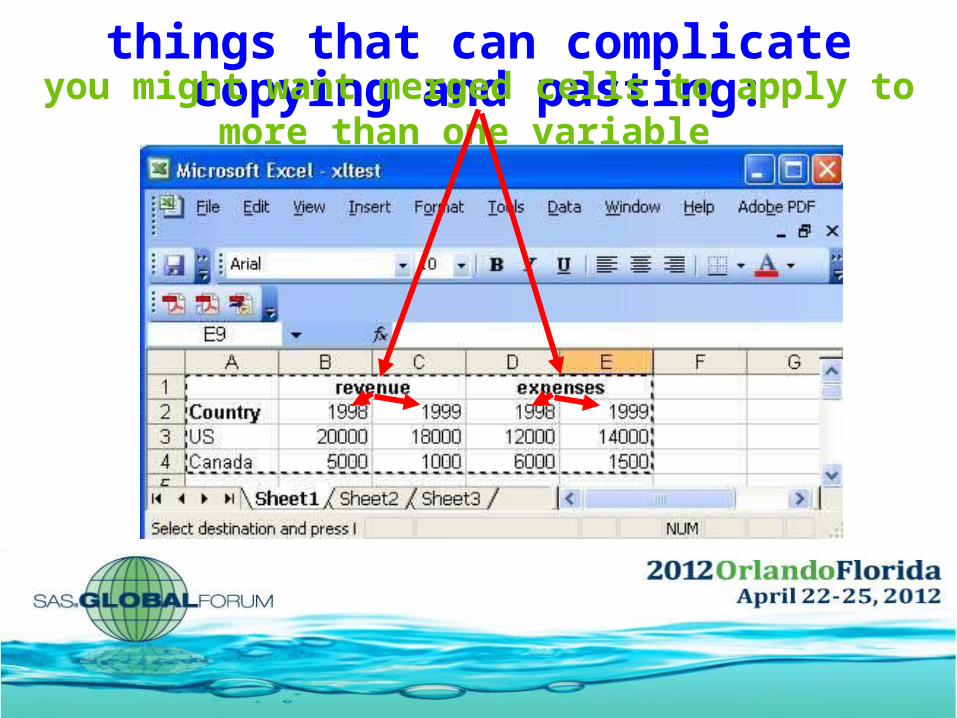
things that can complicate copying and pasting:you might want merged cells to apply to more than one variable
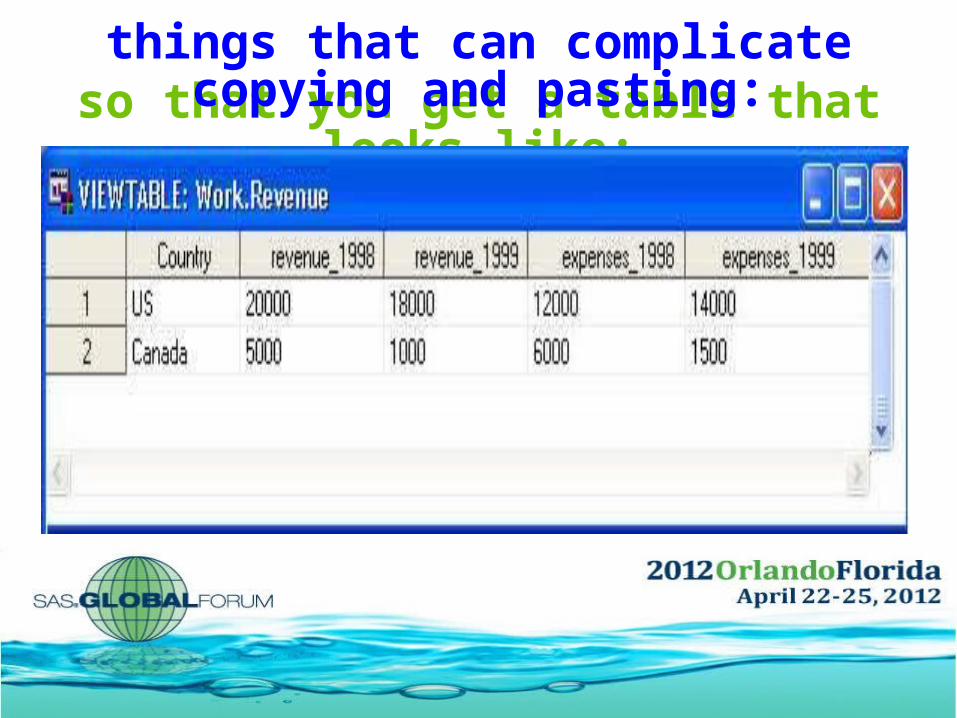
so that you get a table that looks like:things that can complicate copying and pasting:

things that can complicate copying and pasting:the table might need to be transposed – Have:
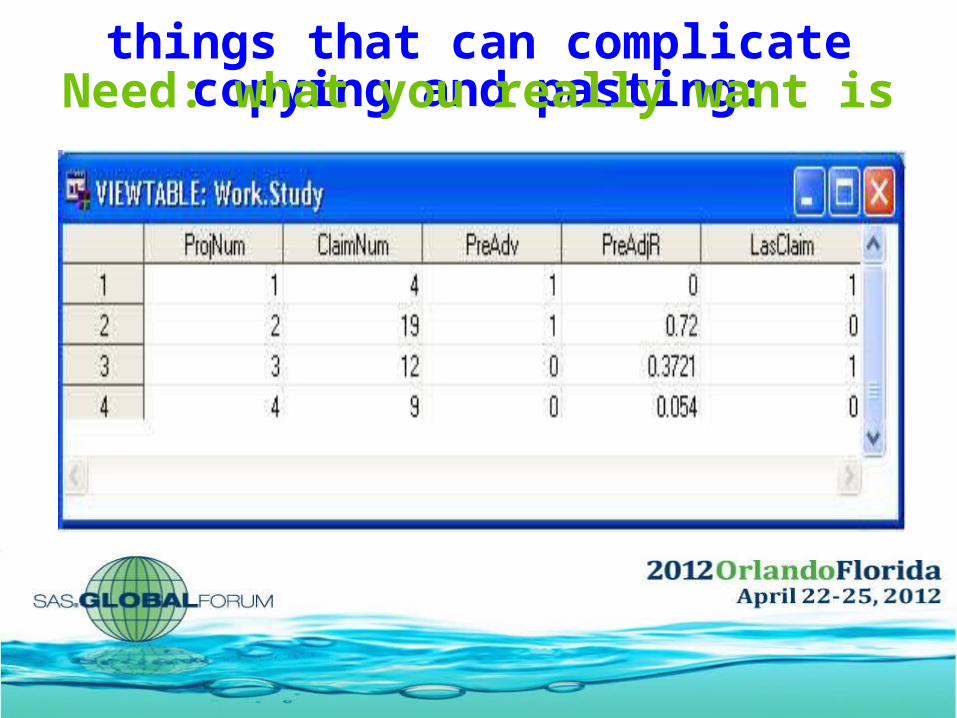
things that can complicate copying and pasting:Need: what you really want is

things that can complicate copying and pasting:the table might copy in the following form – Have:
ProjNum1234ClaimNum419129PreAdv11(continued)

things that can complicate copying and pasting:Need: what you really want is

Note: Ensure that use of these methods does not violate a site's terms of use
things that can complicate copying and pasting:the data might not even be in tabular form

Note: Ensure that use of these methods does not violate a site's terms of use
things that can complicate copying and pasting:and may even be a bit more complex

Would you know how to get such data into SAS quickly, painlessly and totally accurately?
other than asking some very carefulperson to re-enter all of the data
"Excuse me. Is this the Society for Asking Stupid Questions?"
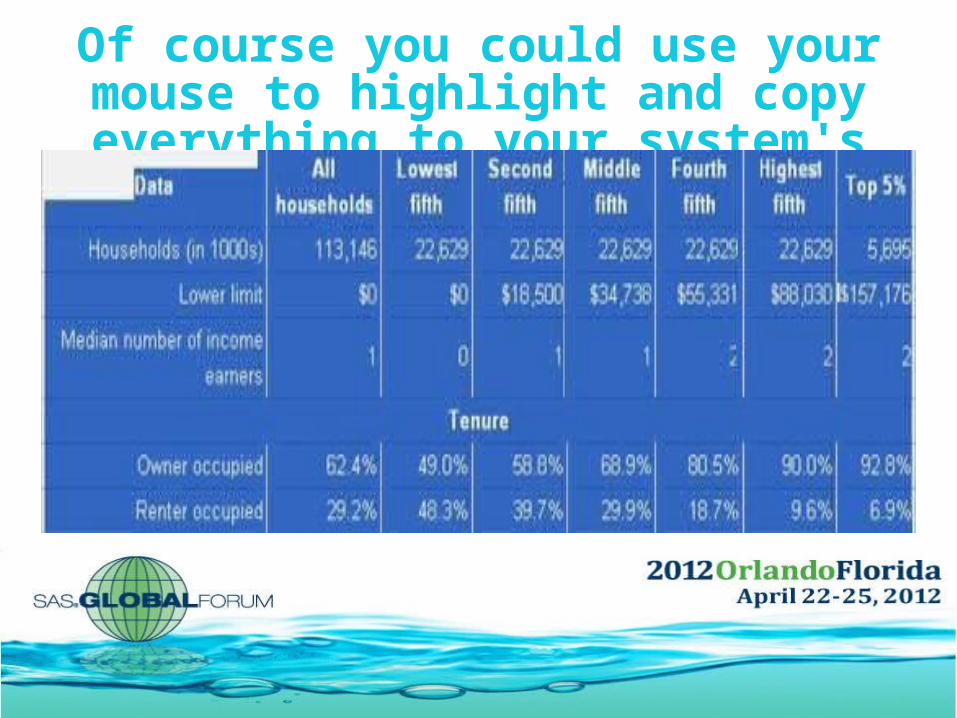
Of course you could use your mouse to highlight and copy everything to your system's clipboard

and, if only a simple extract was needed,and SAS/Access to PC-Files was licensed,
you might be able to paste it into an Excel file and then use proc import

or if the task requires some featuresnot currently offered with proc import?
but what if one doesn't haveSAS/Access to PC-Files?

access the system clipboardassign or rename variable names
parse a structured documentassign missing values
indicate which data rows to select
specify formats and/or informats
import multiple row variable names
proc import currently doesn’t provide a way to:
transpose data
account for merged cells in variable names
add a prefix or suffix to variable names
specify variable labels
change a variable's unit of measurementupcase any variable's values
specify the rows to use to guess (in)formats
drop one or more columns

the code presented in this paper includes all of those options and capabilities
but, for tables that you can paste,

our Truth in Advertising commitment
may not work on all systems
WARNING: The code/method presented in this paper:
IS PROVIDED "AS IS" WITHOUT WARRANTY OF ANY KIND, EITHER EXPRESS OR IMPLIED, INCLUDING, BUT NOT LIMITED TO, THE IMPLIED WARRANTIES OF MERCHANTABILITY, FITNESS FOR A PARTICULAR PURPOSE, OR NON-INFRINGEMENT. The authors shall not be liable whatsoever for any damages arising out of the use of this documentation or code, including any direct, indirect, or consequential damages. In addition, the authors will provide no support for the materials contained herein.
is NOT production quality
are NOT substitutes for proc import
should NOT be used if such use violates any copyright or terms of agreement

copy and paste almost anything
This presentation, the code and a paper on the topic are all available on the past presentation’s page for September 16, 2011 at: www.torsas.ca

copy and paste almost anything
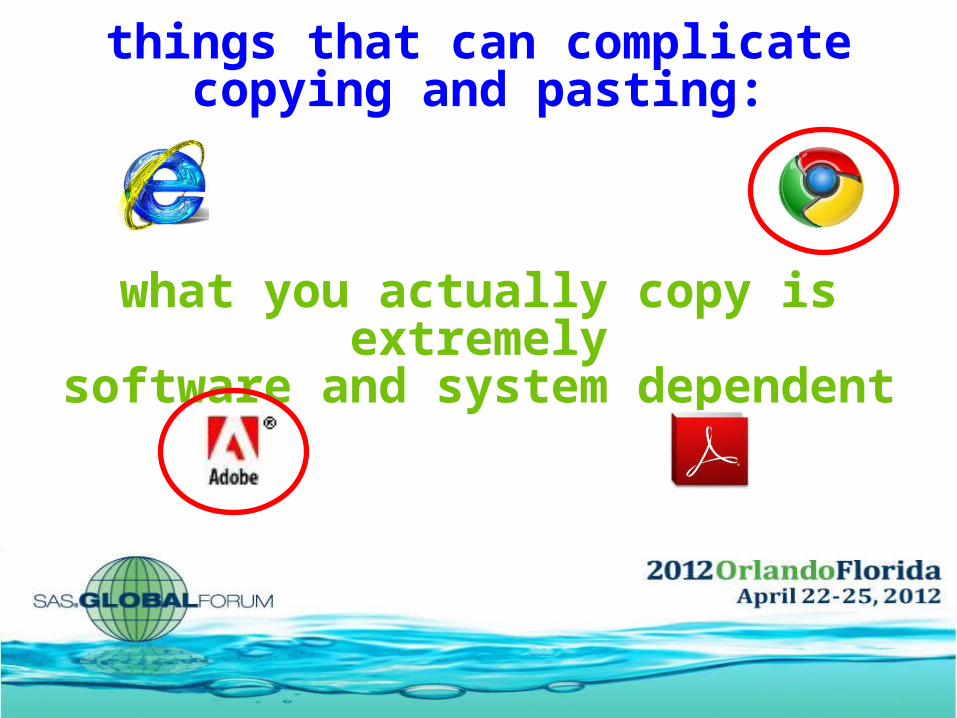
what you actually copy is extremelysoftware and system dependent
things that can complicate copying and pasting:

our proposed solutionfirst, declare needed macro variables
%let spaces=" ";%let hrows=2;%let var_share=3~2 5~4;%let var_renames=;%let var_prefix=;%let var_suffix=;%let var_labels=;%let first_data_row=3;%let var_missing=10~n.a.;%let var_formats=2-5~best12.;%let var_informats=2-5~best12.;%let var_units=;%let var_drop=;%let var_upcase=;%let guessingrows=3-3;%let outfile=revenue;
account for multiple row variable names
clipbrd method lets you "paste" data from your system's clipboard, but
translates tabs into spaces
and
different systems translate tabs into
different numbers of spaces
account for rows between data and variable names
add and recode variable names
specify formats and informats
if needed, indicate amount data should
be multiplied by
specify one variableor a range of variables
add a prefix or suffix to any variable namespecify desired
variable labels
account for merged cells in variable names
upcase any variables
specify missing values for any
variablesspecify which rows should be considered in guessing formats
and informatsdrop any columns
that you don’t want

our proposed solutionfirst, declare needed macro variables
%let spaces=" ";%let hrows=2;%let var_share=3~2 5~4;%let var_renames=;%let var_prefix=;%let var_suffix=;%let var_labels=;%let first_data_row=3;%let var_missing=10~n.a.;%let var_formats=2-5~best12.;%let var_informats=2-5~best12.;%let var_units=;%let var_upcase=;%let guessingrows=3-3;%let outfile=revenue;
or any combination you might neede.g.,
%let var_informats= 1~$20. 2-5~best12. 6~comma8. 7~percent8. 8~anydtdte21. 9~trailsgn8. ;

our proposed solutionfirst, declare needed macro variables
%let spaces=" ";%let hrows=2;%let var_share=3~2 5~4;%let var_renames=;%let var_prefix=;%let var_suffix=;%let var_labels=;%let first_data_row=3;%let var_missing=10~n.a.;%let var_formats=2-5~best12.;%let var_informats=2-5~best12.;%let var_units=;%let var_upcase=;%let guessingrows=3-3;%let outfile=revenue;
or any combination you might neede.g.,
%let var_informats= 1~$20. 2-5~best12. 6~comma8. 7~percent8. 8~anydtdte21. 9~negative8. ;
Note: there are additional macro variablesto address structured layouts and files thatneed to be transposed
%let transpose=YES;%let columns=5;%let rows=80;%look_for=view all editions and formats;%skip_lines=1;

our proposed solutionin the code, instructions are shown as comments. e.g.
%let var_prefix=; *specify any string that you want appended before any variable name. A ~ must be used to separate variable number(s) and variable prefixes, and either a space or separate line to represent additional entries. If you want the same prefix used for a range of variables, specify the range as #-#. E.g., if variables 2 thru 4 are named 1996, 1997 and 1998, and you want them to be named Revenue_1996, Revenue_1997 and Revenue_1998 you would specify: %let var_prefix=2-4~Revenue_;

create macros for code that is used repeatedlyf
%macro expandr (type,string); i=1; hold_rec=""; do while (scan("&string.",i," ") ne ""); if scan(scan(scan("&string.",i," "),1,"~"),2,"-") ne "" then do; start=scan(scan(scan("&string.",i," "),1,"~"),1,"-"); end=scan(scan(scan("&string.",i," "),1,"~"),2,"-"); end; else do; start=scan(scan("&string.",i," "),1,"~"); end=scan(scan("&string.",i," "),1,"~"); end; do j=start to end; hold_rec=catx(" ",hold_rec,cat(strip(j)||"~"|| strip(scan(scan("&string.",i," "),2,"~")))); end; i+1; end; call symput(&type.,strip(hold_rec));%mend expandr;

create macros for code that is used repeatedlyf
%macro expandr (type,string); hold_formt=catx(" ",hold_formt,cat(strip(j)||"~"|| strip(scan(scan("&string.",i," "),2,"~")))); end; i+1; end; call symput(&type.,strip(hold_formt));%mend expandr;
%macro filarray (type,string); if scan("&string.",i," ") ne "" then &type(scan(scan("&string.",i," "),1,"~"))= scan(scan("&string.",i," "),2,"~");%mend filarray;
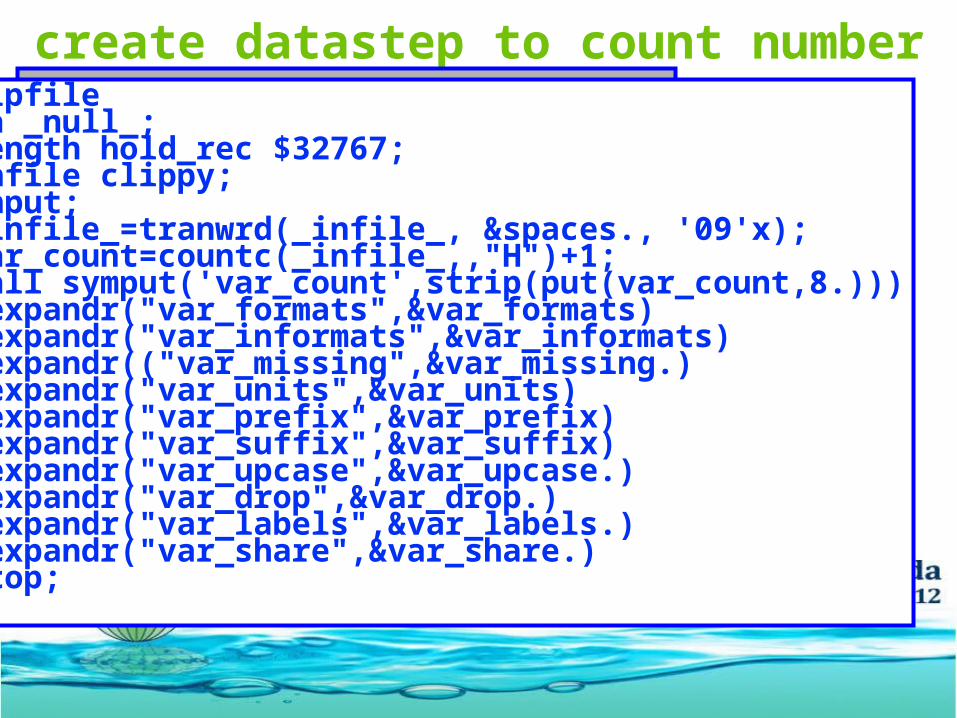
create datastep to count number of variablesf
%flipfiledata _null_; length hold_rec $32767; infile clippy; input; _infile_=tranwrd(_infile_, &spaces., '09'x); var_count=countc(_infile_,,"H")+1; call symput('var_count',strip(put(var_count,8.))) %expandr("var_formats",&var_formats) %expandr("var_informats",&var_informats) %expandr(("var_missing",&var_missing.) %expandr("var_units",&var_units) %expandr("var_prefix",&var_prefix) %expandr("var_suffix",&var_suffix) %expandr("var_upcase",&var_upcase.) %expandr("var_drop",&var_drop.) %expandr("var_labels",&var_labels.) %expandr("var_share",&var_share.) stop;run;

declare arrays and variables in main datastepf
d r
data _null_; file revised lrecl=32767; infile clippy end=eof; array headers(%sysfunc(max(&hrows.,1))) $32767.; array varnames(&var_count.) $32.; array formats(&var_count.) $32.; array informats(&var_count.) $32.; array renames(&var_count.) $32.; array prefix(&var_count.) $32.; array suffix(&var_count.) $32.; array labels(&var_count.) $32.; array miss(&var_count.) $255.; array upcases(&var_count.) $3.; array drops(&var_count.) $3.; array units(&var_count.) $32.; array share(&var_count.) $32.; array varlens(&var_count.); array vartypes(&var_count.); length hold_rec temp ivartype fvartype var_units var_names var_labels var_drop $32767; length missval $255; retain headers renames varnames vartypes varlens formats informats units prefix suffix labels drops miss upcases share grows_start grows_end;

parse the header row(s) and macro variables f
d r
data _null_;
le
input;_infile_=tranwrd(_infile_, &spaces., '09'x);if _n_ le &hrows. then headers(_n_)=tranwrd(tranwrd( tranwrd(_infile_, '%', 'percent'),'-','_to_'),'–','_to_');if _n_ eq &hrows. or (_n_ eq 1 and &hrows eq 0) then do; grows_start=scan("&guessingrows.",1,'-'); if missing(grows_start) then grows_start=&first_data_row.; grows_end=scan("&guessingrows.",2,'-'); if missing(grows_end) then grows_end=999999; do i=1 to &var_count.; %filarray(renames,&var_renames.) %filarray(prefix,&var_prefix.) %filarray(suffix,&var_suffix.) %filarray(units,&var_units.) %filarray(formats,&var_formats.) %filarray(informats,&var_informats.) %filarray(upcases,&var_upcase.) %filarray(drops,&var_drop.) %filarray(labels,&var_labels.) %filarray(miss,&var_missing.) %filarray(share,&var_share.) if &hrows. eq 0 then varnames(i)=cat("Col"||strip(i));

obtain and assign variable namesf
d r
data _null_;
le
% c
else do; varnames(i)=""; do j=1 to &hrows.; if j eq 1 and share(i) ne "" then do; if strip(scan(headers(j),share(i),,"HM")) ne "" then varnames(i)=strip(scan(headers(j),share(i),,"HM")); end; else do; if strip(scan(headers(j),i,,"HM")) ne "" then do; if strip(varnames(i)) ne "" then varnames(i)= strip(varnames(i))||"_"||strip(scan(headers(j),i,,"HM")); else varnames(i)=strip(scan(headers(j),i,,"HM")); end; end; if j eq &hrows. and varnames(i) eq "" then varnames(i)=cat("Col"||strip(i)); end;end;

create macro variables and write file (part 1 of 4)f;f;;%;
%;
%; ; ; ;
r; r; "
;%;
%; ;
; ; ;
;
;;
%; ; ;
;%;
g i
"); 1; ; ; ;;
if renames(i) ne "" then varnames(i)=renames(i);if prefix(i) ne "" then varnames(i)= strip(prefix(i))||strip(varnames(i));if suffix(i) ne "" then varnames(i)= strip(varnames(i))||strip(suffix(i));if strip(labels(i)) eq "" then labels(i)=strip(varnames(i)); else labels(i)=tranwrd(strip(labels(i)), '^', ' ');varnames(i)=tranwrd(strip(varnames(i)),'%', 'percent');varnames(i)=tranwrd(strip(varnames(i)),'-','_to_');varnames(i)=tranwrd(strip(varnames(i)),'–','_to_');varnames(i)=tranwrd(strip(varnames(i)),'#', 'number');varnames(i)=tranwrd(strip(varnames(i)), ' ', '_');varnames(i)=compress(varnames(i),,'kn');if anydigit(substr(varnames(i),1,1)) then varnames(i)=cat("_",strip(varnames(i)));var_names=catx(" ",var_names,strip(varnames(i)));var_labels=cat(strip(var_labels)||"label "|| strip(varnames(i))||"="||quote(strip(labels(i)))||";");

create macro variables and write file (part 2 of 4)f;f;;%;
%;
%; ; ; ;
r; r; "
;%;
%; ;
; ; ;
;
;;
%; ; ;
;%;
g i
"); 1; ; ; ;;
if units(i) ne "" then var_units= catx(" ",var_units,strip(varnames(i))||"="|| strip(varnames(i))||"*"||strip(units(i))||";"); if drops(i) eq “YES” then var_drop= catx((" ",var_drop,strip(varnames(i))); end; if var_drop ne “” then var_drop= “(drop=)||strip(var_drop)||”)”; call symput('varnames',var_names); call symput('varlabls',var_labels); call symput('varunits',var_units); call symput('vardrop',var_drop); end; if _n_ ge &first_data_row. then do; if countc(_infile_,,"H")+1 eq &var_count. then do; do i=1 to &var_count.; temp=strip(scan(_infile_,i,,"HM")); if upcase(upcases(i)) eq "YES" then temp= upcase(temp); if strip(temp) ne "" then do; if miss(i) ne "" then do; k=1;

create macro variables and write file (part 3 of 4)f;f;;%;
%;
%; ; ; ;
r; r; "
;%;
%; ;
; ; ;
;
;;
%; ; ;
;%;
g i
"); 1; ; ; ;;
do while (scan(miss(i),k,"` ") ne ""); missval=tranwrd(strip(scan(miss(i),k,"` ")),'^',' '); temp=tranwrd(strip(temp),strip(missval), ''); k+1; end; end; if grows_start LE _n_ and grows_end GE _n_ then do; call missing(vartype); in_test = input(temp, ?? best12.); if not missing(in_test) then vartype=0; else do; in_test = input(temp, ?? anydtdte21.); if not missing(in_test) then vartype=2; else do; if index(temp,"$") then in_test = input(temp, ?? dollar21.); if not missing(in_test) then vartype=4; else do; if index(temp,",") then in_test = input(temp, ?? comma21.); if not missing(in_test) then vartype=5;

create macro variables and write file (part 4 of 4)f;f;;%;
%;
%; ; ; ;
r; r; "
;%;
%; ;
; ; ;
;
;;
%; ; ;
;%;
g i
"); 1; ; ; ;;
else do; if index(temp,"%") then in_test = input(temp, ?? percent21.); if not missing(in_test) then vartype=3; else vartype=1; end; end; end; end; if missing(vartypes(i)) then vartypes(i)=vartype; else if vartype ne vartypes(i) then vartypes(i)=1; if missing(varlens(i)) or length(temp) gt varlens(i) then varlens(i)=length(temp); end; end; if i eq 1 then hold_rec=strip(temp); else hold_rec=cat(strip(hold_rec),"09"x,strip(temp)); end; put hold_rec;end;

assign formats and informatsf;f;;%;
%;
%; ; ; ;
r; r; "
;%;
%; ;
; ; ;
;
;;
%; ; ;
;%;
g i
"); 1; ; ; ;;
g i
"); 1; ; ; ;;
if eof then do; ivartype=""; fvartype=""; do i=1 to &var_count.; if vartypes(i)=1 then do; itempvar=cat("$",strip(put(varlens(i),3.)),"."); ftempvar=itempvar; end; else if vartypes(i)=2 then do; itempvar="anydtdte21."; ftempvar="date9."; end; else if vartypes(i)=3 then do; itempvar="percent."; ftempvar="percent8.2"; end; else if vartypes(i)=4 then do; itempvar="dollar."; ftempvar=cat("dollar",strip(put(varlens(i),3.)),"."); end; else if vartypes(i)=5 then do; itempvar="comma."; ftempvar=cat("comma",strip(put(varlens(i),3.)),"."); end; else do; itempvar="best12."; ftempvar="best12."; end;

bring in user specs and create macro variablesf;f;;%;
%;
%; ; ; ;
r; r; "
;%;
%; ;
; ; ;
;
;;
%; ; ;
;%;
g i
"); 1; ; ; ;;
g i
"); 1; ; ; ;;
i ; ; ; r; ; ; ; ; ; ; ;
if strip(informats(i)) ne "" then itempvar=strip(informats(i)); if strip(formats(i)) ne "" then ftempvar= strip(formats(i)); ivartype=catx(" ",ivartype,"informat", varnames(i),itempvar,";"); fvartype=catx(" ",fvartype,"format", varnames(i),ftempvar,";"); end; call symput('informt',ivartype); call symput('formt',fvartype); end; end;run;

create the data step that pastes the dataf;f;;%;
%;
%; ; ; ;
r; r; "
;%;
%; ;
; ; ;
;
;;
%; ; ;
;%;
g i
"); 1; ; ; ;;
g i
"); 1; ; ; ;;
i ; ; ; r; ; ; ; ; ; ; ;
= ; r
data &outfile. &vardrop.; infile revised lrecl=32767 dsd delimiter="09"x; &informt.; &formt.; &varlabls.; input &varnames.; &varunits.;run;
proc delete data=work.form_varnames;run;
filename clippy clear;filename revised clear;

combined, the code really isn't very intimidating

and to complete the task
highlight the tableclick copy
enter desired macro variable settingsrun the code
however, it may not be THAT simple in all cases!
not all tables are directly copyable(i.e., without losing critical table metadata)

a useful free set of tools you might find helpful
Adobe Acrobat Reader 6http://www.oldapps.com/adobe_reader.php
Adobe Acrobat 5 TAPS Pluginhttp://www.pdfhacks.com/TAPS/

any version of Adobe Acrobat (other than Reader) may be needed to convert a table into a PDF file in order to take advantage of TAPS

how TAPS can be helpful (an example)
copy the first four lines from the table athttp://www.oecd.org/dataoecd/48/27/41498733.pdf
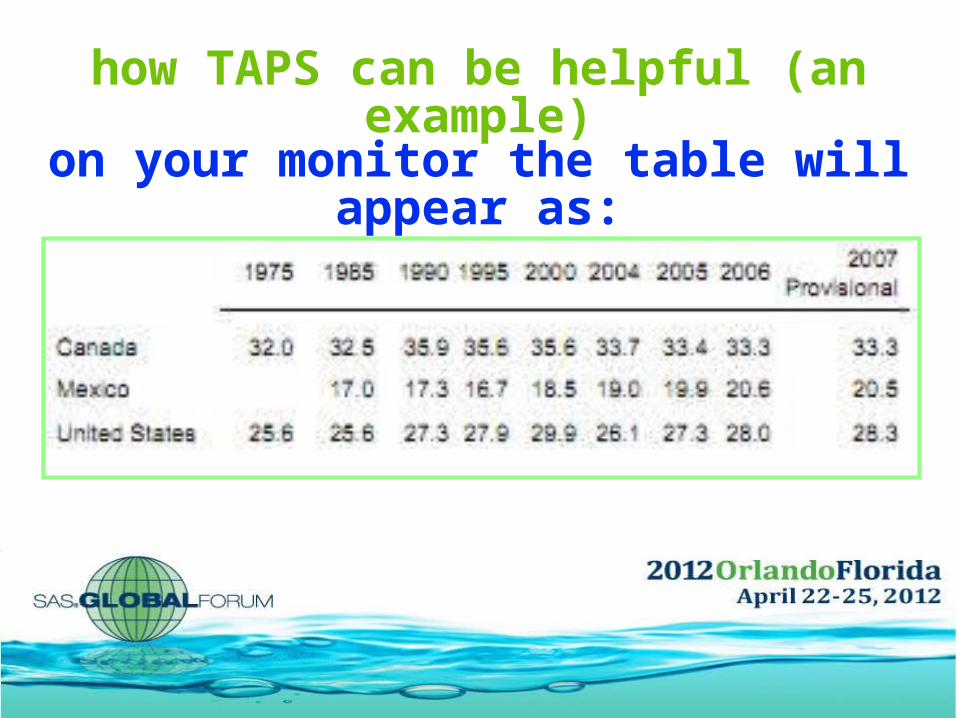
how TAPS can be helpful (an example)
on your monitor the table will appear as:

how TAPS can be helpful (an example)
but, if you paste it into notepad, it will appear as:
there is no indication that column #1's
heading is missing
the heading for column #10 appears in column #1 on the
2nd and 3rd rows
there is no indication that column #2 is missing

how TAPS can be helpful (an example)
but if you open it with Adobe 6 Reader with TAPS:

how TAPS can be helpful (an example)
drag a rectangle around the data you want
right click on Text-Flow, click on Table, then copy
Table
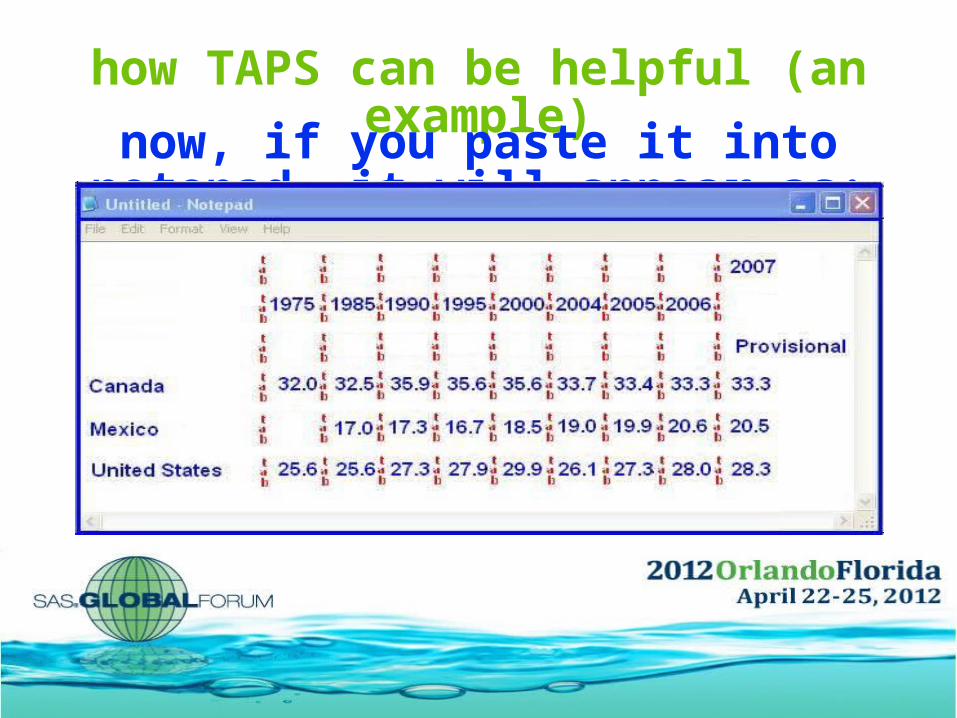
how TAPS can be helpful (an example)
now, if you paste it into notepad, it will appear as:
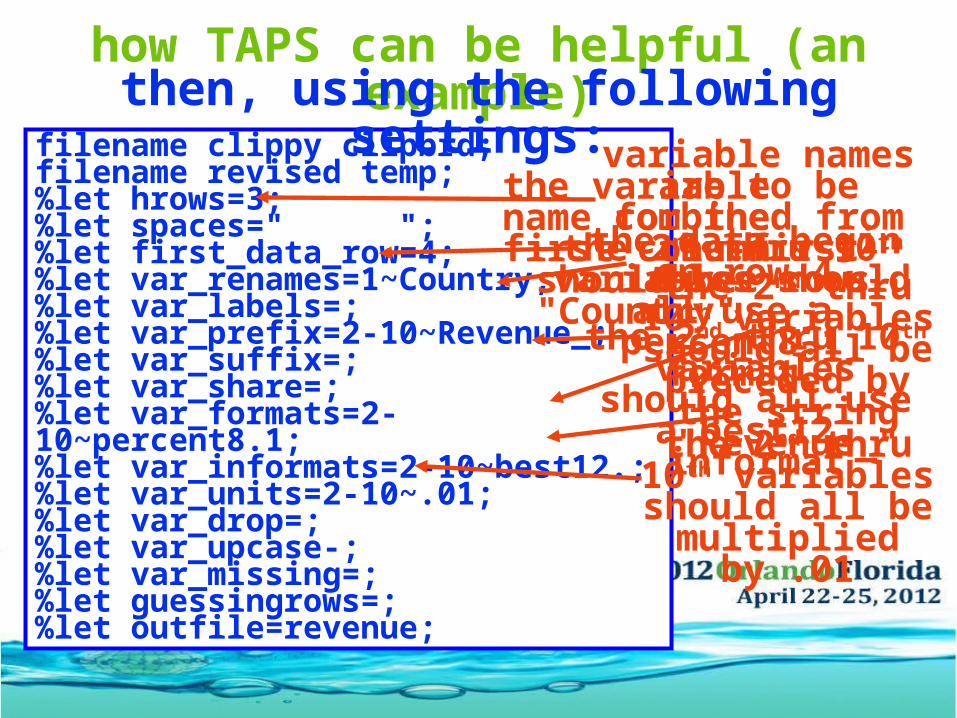
filename clippy clipbrd;filename revised temp;%let hrows=3;%let spaces=" ";%let first_data_row=4;%let var_renames=1~Country;%let var_labels=;%let var_prefix=2-10~Revenue_;%let var_suffix=;%let var_share=;%let var_formats=2-10~percent8.1;%let var_informats=2-10~best12.;%let var_units=2-10~.01;%let var_drop=;%let var_upcase-;%let var_missing=;%let guessingrows=;%let outfile=revenue;
how TAPS can be helpful (an example)then, using the following settings:
variable names are to be combined from the
first three rowsthe data begin on row 4
the variable name for the first column
should be "Country"the 2nd thru 10th variables should all use a
percent8.1 formatthe 2nd thru 10th
variables should all use a best12. informat
the 2nd thru 10th variables should all be multiplied by .01
the 2nd thru 10th variables should all be preceded by the string "Revenue_"
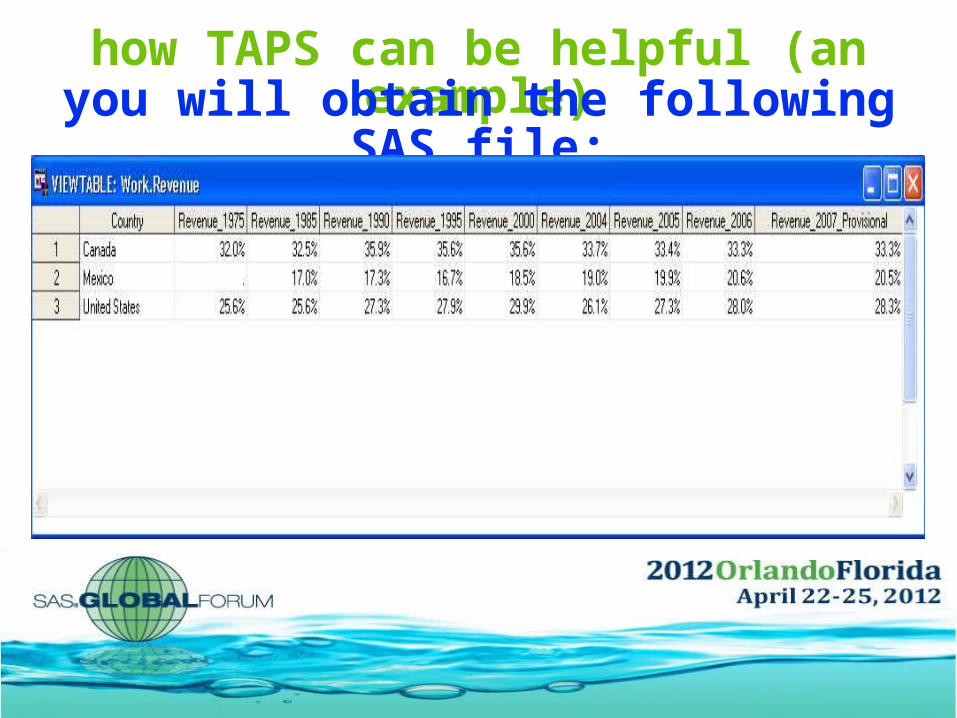
how TAPS can be helpful (an example)you will obtain the following SAS file:

not all browsers were created equally
the method described in this paper appears to work better with Google Chrome
than with Microsoft Internet Explorer
and better with a TAPS enhanced version of Adobe Acrobat Reader 6
than with newer versions of Acrobat Reader
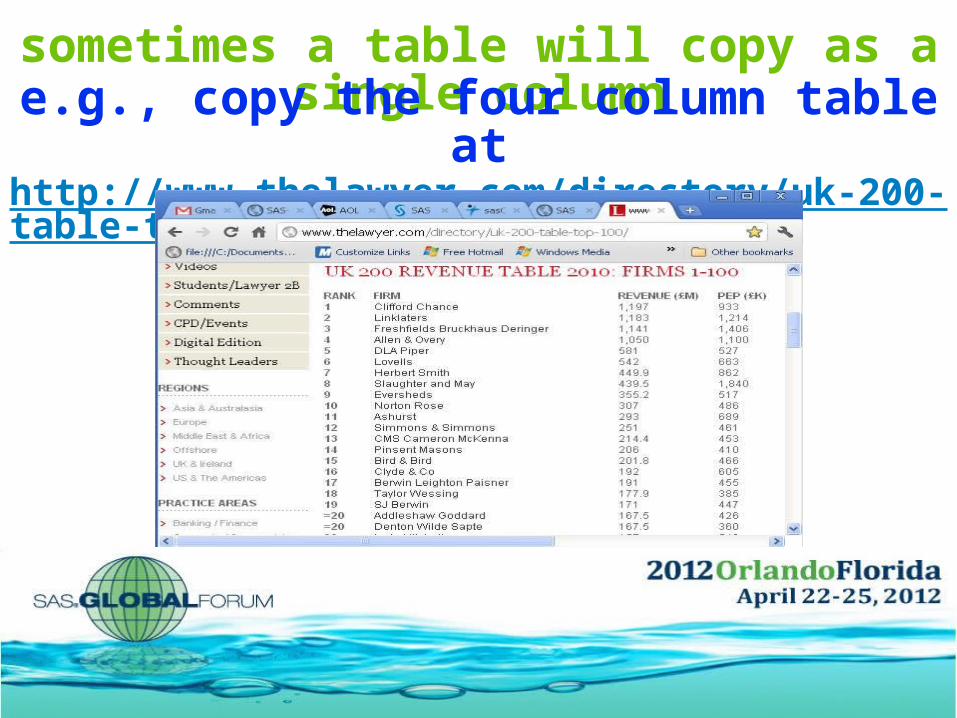
sometimes a table will copy as a single columne.g., copy the four column table at
http://www.thelawyer.com/directory/uk-200-table-top-100/
sometimes a table will copy as a single column
you'll find that entire columns get highlighted as you drag your mouse from left to right
although it appears as a 101 row 4 column tableit actually copies as a 404 row 1 column table

adding the following macro variable assignmentswill transpose the data as it is being "pasted"
%let columns=4;%let rows=100;

importing non-tabular datafor example, what if you wanted to copy a page
from a search at: http://www.worldcat.org/
Note: This site's terms of use explicitly prohibits the use of programming routines to "mine" or harvest material amounts of Data
irrelevant listing id is each entry's first record titles appear without
any identifier author is always preceded by the word "by" type appears without
any identifier Language is always
preceded by the string "Language:"
Publisher is always preceded by the string
"Publisher:" Record always ends
with the string "View all editions and formats"
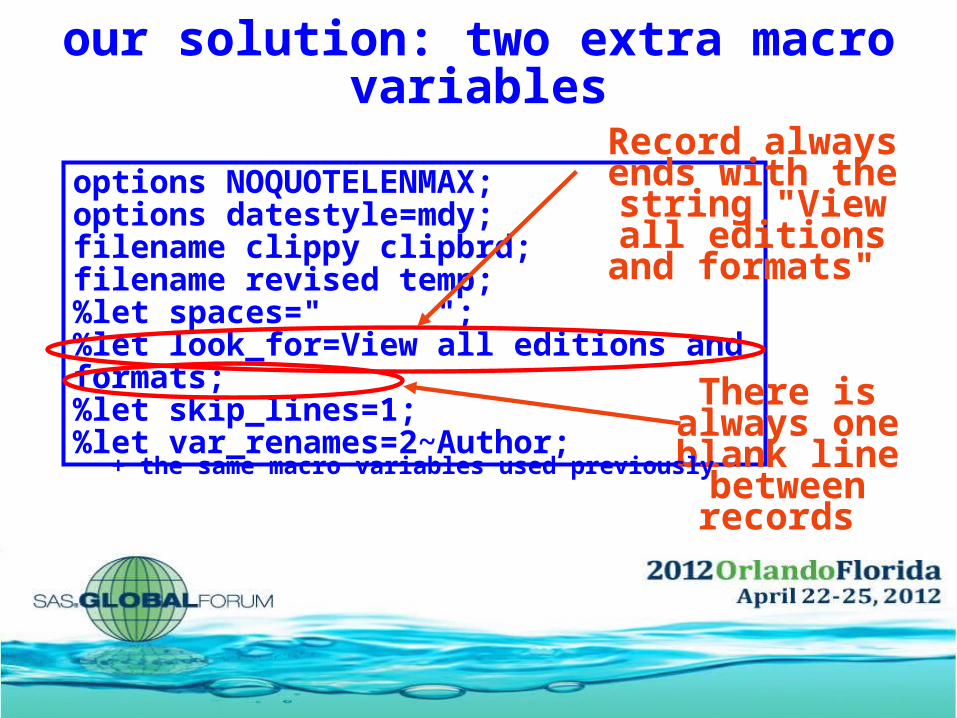
our solution: two extra macro variables
options NOQUOTELENMAX;options datestyle=mdy;filename clippy clipbrd;filename revised temp;%let spaces=" ";%let look_for=View all editions and formats;%let skip_lines=1;%let var_renames=2~Author;
Record always ends with the string "View all editions and formats"
There is always one blank line
between records + the same macro variables used previously

a datastep to describe the form's layout
data form_varnames; informat varname $50.; input varname &; cards;1~Title~1~1~02~by~1~1~13~Type~1~1~04~Language:~1~1~15~Publisher:~1~1~1;
Variable number Variable name or field header
Field's position within a row (in right to left order)
Number of rows that must be read to read
the entire field
Whether or not the field has a header in the data
(i.e., 0=no, 1=yes)

and to complete the task
highlight the formclick copy
enter macro variable settings and field definitionsrun the code

should work on any operating system
has a number of useful import features
tables can be pasted from any source that you can copy to your system's clipboard
modifiable (new features can be added)
benefits
avoid extra datasteps
only requires base SAS

unsupported - can't complain to anyone if it doesn't work correctly
extremely software dependent
limitations
requires you to know your data
may require some additional software


Author Contact InformationYour comments and questions are valued and encouraged.Contact the authors:
Richard A. DeVenezia9949 East Steuben RoadRemsen, NY 13438http://www.devenezia.com/contact.php
John King,Ouachita Clinical Data Services, Inc.Mount Ida, ARe-mail: [email protected]
Randy Herbison,Senior Systems Analyst Westat1650 Research BoulevardRockville, MD 20850e-mail: [email protected]
Arthur Tabachneck, Ph.D.Myqna, Inc.Toronto, Ontarioe-mail: [email protected]
Nate DerbyStakana Analytics815 First Ave., Suite 287Seattle, WA 98104-1404e-mail: [email protected] Ben Powell Genworth Financial e-mail: [email protected]