copq at tetra pak 2009-02-03 for print - lthiii sammanfattning i dagens affärsvärld blir kundens...
TRANSCRIPT

Preface
This dissertation is the final part of the Master of Science programme in Industrial Engineering and
Management at Lund University, Faculty of Engineering. The dissertation corresponds to 30 ECT
Credits during a period of 20 weeks. The original idea and project specification for the dissertations
topic came from Tetra Pak, Capital Equipment, Total Quality and the main part of the work has been
conducted in their Facilities in Lund.
First we would like to thank our instructors at Tetra Pak, Adam Smith, Director Total Quality and
Clara Carlsson, Manager Total Quality Supplier Management. They have helped us to regain focus
when the road has been winding and supported us with both time and resources. We would also like
to thank the rest of the Total Quality department that took care of us with open arms. A thought is
also sent to all the helpful people at Tetra Pak who have spent their valuable time to answer our
questions in interviews and build and validate models. Another person that we want to express our
gratitude to is Niclas Hanzon, Claims Engineer at Market Area Nordics, who have made huge
contributions to this dissertation. We are very glad that we got the opportunity to conduct this
dissertation at a world leading company in its field.
We would also like to thank our tutor at the Department of Industrial Management and Logistics and
the Division of Production Management, Lund University, Bertil I Nilsson for the help with the
academic part of this Dissertation and support and smoothness of all administrative matters. Few
people are more helpful and supporting, no matter what day or hour it is.
Lund, January 2009
Magnus Fransson
Klas Turesson
ii
Abstract
Contemporary business trends are more and more shifting focus to the requirements of the
customers. One of the most important factors for the customer is quality, both in the interface with
the selling company and in the products sold. Tetra Pak is a pioneer within the packaging of diaries
and food. The company has been profitable in most situations which have created a state of mind
where quality in the supply chain has not been a top priority. As competition has become more
intense, Tetra Pak has realised the importance of quality and put it high on the agenda. In order to
make good decisions that can improve quality the company needs an understanding of the current
situation.
The purpose of this dissertation is to find the cost of poor quality and increase the transparency of
quality in Tetra Pak Capital Equipment (CE) supply chain. With this as base, recommendations for
improvements are given. Tetra Pak CE is responsible for the production, supply and installation of
Filling Machines and Distribution Equipment. The cost calculation has been done with a supply chain
perspective and focus has been set in the area that was considered to create most costs. The areas
chosen were products that failed to conform with specification, both internally and externally. In
Tetra Pak the internal of these are called Non Conformities and the external are called Claims.
The main sources of data in this dissertation has been, nearly 50 interviewed employees and internal
data regarding the area investigated. From this the most important processes has been mapped and
cost calculations conducted with a triangulation of Activity Based Costing (ABC) analysis, Top Down
analysis and estimations from the persons interviewed. The outcome of the cost calculations can
unfortunately not be published in this academic report due to company restrictions, but it can be
reviled that it is more that twelve times more expensive to find failures outside the company than
internally. It became apparent during the investigation that it is only a minor part of the current
supply chain costs of poor quality that can be seen within the company, and little costs are
transferred to the suppliers, unless they are obliged by Tetra Pak to conduct special investigations.
When the findings above were investigated it was concluded that the supply chain currently has a
very low transparency. Information about poor quality is scattered in several systems and the impact
of low quality on customer does not reach those who decides what corrective actions to take. The
main instrument to prioritise is currently the number of incoming claims. To improve this area a
customer claims related cost model has been developed with the intention to bring a better
understanding of the customer impact into the organisation and aid prioritisation of corrective
actions.
To further increase the customer perspective in the company it is suggested that a new
measurement that capture the impact of claims at the customers is formed. The current quality
measurements is considered to have several flaws in order to truly align with the corporate strategy
and in some instance the formulation might even prevent registrations of claims and therefore limit
the information to the central organisation. A divergence in the purpose of the claims process has
been seen. This leads to the recommendation that the process should be separated into one part
that is concerned with handling and compensating the customer and one part that is concerned with
solving the technical issue. To further improve the information, a centralisation of the claim handling
near the customer is recommended.

iii
Sammanfattning
I dagens affärsvärld blir kundens önskemål och krav allt viktigare. Ett av de viktigaste kundkraven är
vanligtvis kvalitet, både gällande mötet med det säljande bolaget och i kvaliteten på dess produkter.
Tetra Pak är en pionjär inom förpackningsindustrin. Företaget har ständigt haft sunda finanser och
goda vinster vilket har resulterat i en företagskultur där kvalitet i försörjningskedjan inte varit
högprioriterat. Tack vare en hårdare konkurrens har Tetra Pak insett vikten av hög kvalitet och därför
numer satt det högt på agendan. För att kunna ta goda beslut som kan förbättra kvalitén behövs en
god grundförståelse av hur situationen egentligen ser ut för närvarande.
Syftet med detta examensarbete är att hitta kostnaden för kvalitetsbrister samt att kartlägga hur
kvalitetsarbetet utförs och mäts idag på Tetra Pak Capital Equipment. Med detta som grund kommer
sedan rekommendationer ges för förbättringar inom dessa områden. Tetra Pak CE är ansvariga för
att fyllmaskiner och distributionsutrustning produceras och installeras hos kunderna. Beräkningarna
är gjorda utifrån ett försörjningskedjeperspektiv och i det som undersöks har fokus lagts på de
områden som anses skapa de största kvalitetsbristkostnaderna och där mest data kunde hittas. De
valda områdena är då produkter inte överensstämt med specifikationerna, internt och externt. På
Tetra Pak kallas dessa Non Conformities (produktionsfel funna internt) samt claims (reklamationer
från kunder).
Huvudkällan till information i detta arbete är närmare 50 intervjuade personer samt intern data från
Tetra Pak. Ur detta material har de viktigaste processerna kartlagts och utifrån dessa har
kostnadsberäkningar gjorts med en triangulering av Aktivitetsbaserade kostnadskalkyler (ABC), ”Top
Down”-kalkyler samt uppskattningar från de intervjuade. Tyvärr kan inte några exakta resultat
publiceras i denna akademiska rapport på grund av sekretesskäl. Vad som kan sägas är dock att
beräkningarna visar att det är över tolv gånger dyrare för Tetra Pak om ett fel upptäcks externt än
internt. De blev även tydligt under undersökningen att det endast är en mindre del av
kvalitetsbristkostnaderna som är synliga internt i företaget och en väldigt liten del av kostnaderna
som uppstår överförs till leverantörerna. Åtminstone så länge Tetra Pak CE inte tvingar dem att vidta
speciella åtgärder.
Tetra Pak CEs försörjningskedja har för närvarande väldigt låg transparens. Information om
kvalitetsbrister är utspritt över ett flertal system och vetskapen om hur kvalitetsbrister påverkar
kunden når inte in till de personer som beslutar om vilka åtgärder som ska vidtas för att komma
tillrätta med problemen. Huvudinstrumentet för att prioritera åtgärder är idag antalet claim som har
inkommit om ett visst problem. För att förbättra prioriteringen har en claimsrelaterad
kundkostnadsmodell skapats med intentionen att skapa en bättre förståelse i företaget om vilka
kostnader kunden påverkas av vid olika kvalitetsbrister.
För att fördjupa kundperspektivet i företagskulturen föreslås även ett nytt mätetal som mäter
kundpåverkan vid claims. De nuvarande kvalitetsmätetalen anses ha flera brister, vilka gör att de inte
stämmer överens med företagsstrategin. De kan till och med i vissa avseenden påverka antalet
registrerade claims negativt och därför begränsa mängden information in i företaget.
Vidare har en divergens i uppfattningen om claims setts. Därför rekommenderas claimsprocessen att
delas i en del som hanterar kunden och kundklagan och en som hanterar lösningen av problemet. För
att ytterligare förbättra informationen bör en centralisering av claimshanteringen närmast kund ske.

iv
Table of Contents
Preface...................................................................................................................................................... i
Abstract ....................................................................................................................................................ii
Sammanfattning ......................................................................................................................................iii
Table of Contents ....................................................................................................................................iv
1 Exordium ......................................................................................................................................... 1
1.1 Background ............................................................................................................................ 1
1.2 Problem description............................................................................................................... 2
1.3 Target group........................................................................................................................... 3
1.4 Limitations/Delimitations ...................................................................................................... 3
1.5 Purpose & Objectives............................................................................................................. 4
1.6 Report outline ........................................................................................................................ 4
2 Methodology ................................................................................................................................... 7
2.1 Case study .............................................................................................................................. 7
2.2 The abductive approach ........................................................................................................ 7
2.3 Qualitative and quantitative methodology............................................................................ 8
2.4 Primary and secondary sources ............................................................................................. 8
2.5 Validity and reliability ............................................................................................................ 9
2.6 Criticism of sources .............................................................................................................. 10
2.7 Tetra Pak restricted material ............................................................................................... 11
3 Frame of Reference ....................................................................................................................... 12
3.1 What is quality? ................................................................................................................... 12
3.2 Quality work......................................................................................................................... 15
3.3 Quality Costing ..................................................................................................................... 17
3.4 Overview of Quality costing models .................................................................................... 19
3.5 PAF model ............................................................................................................................ 19
3.6 Process cost model .............................................................................................................. 27
3.7 Activity-based costing (ABC) model ..................................................................................... 29
3.8 Incentives and design of measurement systems................................................................. 31
4 Empirics ......................................................................................................................................... 38
v
4.1 Tetra Pak, background and organisation ............................................................................. 38
4.2 Total Quality in Tetra Pak..................................................................................................... 44
4.3 The Claim Process ................................................................................................................ 44
4.4 The Non Conformance (NC) Process.................................................................................... 56
4.5 Prioritisation and corrective actions .................................................................................... 59
4.6 Case descriptions ................................................................................................................. 61
4.7 Key Performance Index in Tetra Pak.................................................................................... 65
5 Analysis.......................................................................................................................................... 68
5.1 Quality in Tetra Pak.............................................................................................................. 68
5.2 Quality Costing ..................................................................................................................... 70
5.3 Claims................................................................................................................................... 74
5.4 Non Conformities ................................................................................................................. 88
5.5 Corrective actions ................................................................................................................ 91
5.6 Cost of failure of control compared to cost of control ........................................................ 92
5.7 Supply chain transparency................................................................................................... 94
5.8 KPI ........................................................................................................................................ 95
6 Discussion & Conclusions .............................................................................................................. 98
7 References................................................................................................................................... 101
7.1 Literature ........................................................................................................................... 101
7.2 Articles ............................................................................................................................... 102
7.3 Interviewees....................................................................................................................... 104
7.4 Abbreviations and definitions............................................................................................ 106
Appendix 1: Process charts over the claims process............................................................................... 1
Appendix 2: Process charts over the NC process .................................................................................... 5
Appendix 3: Customer claim-related cost model (CCRCM)..................................................................... 7
Appendix 4: Activity Based Cost Model for CE Claims ............................................................................ 8
Appendix 5: Activity Based Cost Model for NCs...................................................................................... 9
Appendix 6: KPI comparison chart ........................................................................................................ 10

1
1 Exordium
In this chapter the dissertation is presented with its background and the authors’ goals and
purposes. Also the delimitations and outline of the report is presented.
1.1 Background
Contemporary business trends concerning customer focus, work in processes and the realisation that
the supply chain is not stronger than its weakest link, has stressed the need of quality. The globalised
business context has led to massive outsourcing, resulting in more organisational boundaries where
quality control and management becomes a challenging task. Much of the influences in the quality
field origins from Japanese work methods like Kaizen, Kanban and Just-in-Time, which during the
1960-70 developed into an organisational quality management system. This system was based on
how the individual can help to increase quality and in the same time decrease cost. In Japan this was
called “Company Wide Quality Control” but in the West it was given the name “Total Quality
Management (TQM)”.
To get an impact and to make organisational members understand the value of quality it is
sometimes better to present information in hard, cold monetary terms. When investigations about
what poor quality actually cost an organisation are conducted they most often make a big
impression. It might be convenient for most senior executives to believe that their organisation does
not have a big problem with quality cost, since their quality issues is not bigger than any other in the
industry. The truth is though that the Cost of Poor Quality (COPQ) most often has an enormous
impact on an organisations turnover. In case studies conducted in the field, researchers have found
that 5-30% of company turnover is spent on COPQ (Sörqvist 2001 p.43; Srivastava 2008 p.194;
Giakatis 2001 p.182). Sörqvist (2001 p.43) though claim that the true cost are by far, much higher
since hidden costs like lost sales, lost goodwill or customer cost seldom or never are included in
these calculations. Therefore it can bring comparative advantages to minimise the COPQ.
The purpose of developing the types of cost calculations mentioned above is normally an action that
is based in the corporate strategy in order to give the employees incentives to act in a specific way,
simply because “what get measured gets done” (Anthony & Govindarajan 2003 p.494). To get
employees to act in a certain way demands that their manager’s act as role models (Crosby 1979
p.18). To help management realise what impact the quality makes on the bottom line, COPQ
naturally is a good way.
To illustrate this, the following story, adopted from Juran (1993), can be told. In the 1950s the Xerox
Corporation revolutionised the copying industry. With patents they managed to get their own spot in
the market and by leasing their copiers the company grew and made astonishing profits. Senior
executives knew that the copiers broke down regularly but instead of addressing the quality issue
they built up a very good service department. The service department earned Xerox even more profit
so everyone at Xerox were happy. This was the case until patents expired and the competitors came
in on the field. The Japanese build copiers that did the same things as Xerox did. They did not have a
great service department. Their copier simply broke down less, so the customers preferred theirs
instead. Since Xerox executive only used short term economic measures they simply did not realise
that their customers were dissatisfied and ready to change to something else as soon as the

2
opportunity came. Many contemporary authors, as Robert Kaplan and David Norton, claim that in
order to get good long term results and to reach corporate goals there has to be other
measurements besides the financial. These measurements should be concluded out of the corporate
strategy and provide adequate guidance for actions to create future financial value (Kaplan & Norton
1996).
1.2 Problem description
In the situation that Xerox were in, there are parallels to the current state at Tetra Pak. The food &
beverage processing and packaging company have a dominant position on the market and control of
almost 80% of the ambient white milk segment for example. They have had patents and almost
monopoly positions in certain markets. Tetra Pak have been dedicated to produce innovative, system
solutions. Well organised Service Departments have been set up, and the spare parts organisation
can send articles within 24 hours with over 95% availability. Unfortunately there has not been any
strong emphasis on quality. During the last few years senior management has started to realise that,
in order to remain competitive in a growing market with new threats, they had to increase their
customer focus. As a direct result of this, quality became more important and placed on the agenda.
The business unit that construct and make sure that the filling machines are delivered is called Tetra
Pak Capital Equipment (CE). Within this unit a department called Total Quality was formed and
during 2007 this group was given a more central role and department Director Adam Smith started to
report direct to Vice President Giovanni de Filippo. This centralisation was created since many issues
that needed to be addressed concerning the filling machines quality were found. One problem for
the Total Quality department was that in a profitable company the mindset and culture of the
organisation results in that no one feels that they have to change their behaviour, work methods and
processes in order to improve quality. If the gains can be shown in monetary terms or at least
quantitatively they are much easier to understand. Therefore continuous improvement, that is one
of the pillars in TQM, can be more compliant with cost measurements.
One problem for Tetra Pak has been that their suppliers have not had any real good incentives to
improve quality. Naturally they have been contacted and sometimes audited when quality has not
reached precipitated performance but they have low risks to get abolished from the Tetra Pak
supplier base. Once they are in a relationship with Tetra Pak it most often become deep and
problems that arise are regularly handled internally instead of turning to another supplier. Today the
company is not able to share the understanding to their suppliers on what effects arise further
downstream in the supply chain.
The company currently has two methods to collect costs regarding poor quality. The first is claims
from customers. When Tetra Pak equipment breaks down at a customer site and still is under
warrant, the customer has the possibility to get some direct losses covered from Tetra Pak. What is
refunded depends on what is stated in the contract and what local regulations urge. Most often
though this is much less than the true cost incurred. The second method to track down quality costs
is Non Conformities (NC). In Tetra Pak vocabulary NC is a quality flaw that is found before the
product has reached the customer. An NC can be either internal or supplier related. Until today, only
the number of them has been used as a management tool, but now Tetra Pak CE want to know the
cost of claims and NCs so that the cost can be used in a better way as a management tool, both
inside and outside the company.

3
Another problem is if the strategic setup, the organisations infrastructure and the current way of
working truly supports a quality mindset. One example of this is the way measurements concerning
quality are carried out in the company. Tetra Pak is a leader of their field but as with the Xerox case
this does not directly imply that they truly are the customer’s first choice.
The initial task to the authors was to study the cost of claims and especially the supplier-related
claims. However early during the dissertation it was obvious that the cost of claims could not be
handled separately. It had to be put in a broader context. This, together with the problem discussion
led to two issues that needed to be clarified:
What is the cost of poor quality at Tetra Pak CE?
How are issues concerning poor quality handled and measured, and is this done in the best possible
way to decrease the cost of poor quality?
1.3 Target group
The primary target group for this dissertation is managers and employees at Tetra Pak Capital
Equipment and the dissertation is based on a task description from the managers of the Total Quality
department at Tetra Pak CE. The secondary target group is scholars and students within the quality
and economical management area.
1.4 Limitations/Delimitations
In this dissertation only the Tetra Pak Capital Equipment supply chain will be in focus and the part of
the supply chain that will be given the most attention is Tetra Pak CE, their customers and suppliers.
This is done due to the fact that the authors together with the supervisors has identified that the
main part of the resulting cost of poor quality at Tetra Pak CE can be found there. Supplier internal
transactions can be found in NC pictures in the dissertation for understanding purpose, but will not
be analysed since it would be a dissertation in itself.
Currently Tetra Pak uses the main part of their efforts in the quality field in reactive action when
products have failed to conform to specifications. Of the quality cost in Tetra Pak, the authors and
the company instructors have made the assumption that the largest cost are created within the areas
of failure of control. Therefore claims and NCs are in the main focus of this dissertation.

4
1.5 Purpose & Objectives
The purpose of this dissertation is to find the cost of poor quality at Tetra Pak Capital Equipment.
With this information current Key Performance Indicators and the handling of quality flaws will be
investigated and recommendations for improvements, that are in line with the corporate strategy
and that gives the right incentives to those who are affected by it, will be made.
To clarify the purpose and make it more operational, it is broken down into five objectives:
• Explore where cost of poor quality can be found and suggest a framework for how to find
quality cost
• Find an average cost of a claim
• Find an average cost of a NC
• Find an average cost of a corrective action
• Explore if the quality failure processes and the quality performance measurements support
and drive good quality. If not, suggest improvements
1.6 Report outline
This report will have a fairly traditional outline with a theoretical review and a following empiric
chapter that then is analysed and discussed in the end. See chapter 2.2 to get a deeper
understanding on why this structure is chosen.
Methodology
This chapter explains the methodological considerations that made the base of this dissertation. It
starts with a discussion regarding case studies and the abductive methodology. From this starting
point an explanation of the research methods that are considered suitable from the authors’ point of
view is conducted. The chapter ends with a discussion regarding validity, reliability and criticism of
sources.
Theoretical framework
The theoretical framework is based on two blocks of theory. First come the quality block. This begins
with descriptions of basic concepts of quality and well known models. Then the review goes deeper
into concepts of quality costs, or more accurately the costs of poor quality, and how these costs
should be measured. The second block concerns performance measurement and how such should be
constructed. The theoretical review especially take up one specific concept called the balanced
Scorecard (BSC) since this is the model currently used by Tetra Pak.
Empirics
In order to make it easier for the reader, the empirics and analysis are built with the same foundation
and the authors has, as much as possible, tried to structure the material in the same order in the two
chapters. The chapter will consist of five main parts.

5
The chapter will take off with a company presentation. Tetra Pak is a very large and complex
organisation and though that the result of this dissertation, in large part, only will concern the
business unit Capital Equipment the conclusions and recommendations will affect larger part of the
company. In order to understand why, the company presentation is somewhat extensive.
The second part is intended to unravel the paths and activities a claim goes through. The cost of
claims is viewed from a supply chain perspective and the authors have acknowledged two
dimensions that should be investigated in order to find how the supply chain is affected by the cost
arising from claims. These are the actual costs that arise in the different organisations and the
financial transactions that are made to reimburse organisations downstream. The specified costs can
be seen in Figure 1 below.
MC CustomerPlatformSupplier
SCO
Customer costs and losses
Reimbursement to customer
MC costs
Reimbursement to MC
Platform/SCO-CE costs
Reimbursement to TP
Supplier costs
765
1234
Financial transactions
Actual cost at organisations
Figure 1: Costs for claims along the supply chain
The third part concern NCs. The costs that are associated to NCs are presented in the same way as
claims above. The only difference is that the quality flaw is found before the product has reached the
customer which result in that fewer organisations need to be included. In Figure 2 below the costs
that are associated to NCs are displayed.
PlatformMod sup
SCO
Platform/SCO-CE costs
Reimbursement to TP
Supplier costs
4
12
Financial transactions
Actual cost at organisations
Comp sup
3Supplier internal
transactions
Figure 2: Costs for NCs along the supply chain

6
Corrective actions that are made in order to eradicate claims or NCs, is not done for all issues and can
therefore not be integrated in the claim or NC chapters. This is why the corrective actions have got
their own part in the empirics.
In the last empirical part Tetra Pak's current BSC and measurement systems will be explained to
make the reader understand what environment suggested KPIs might be included in.
Analysis
In this section the outline will be basically the same as in the empiric chapter with the difference that
it will start with a general analysis of the cost of poor quality and Tetra Pak and include summarising
analyses and a study of the current cost and transparency in the supply chain.
Discussion & Conclusion
Here the most important findings in the analysis are brought together and a discussion of the most
interesting results will lead to recommendations for how Tetra Pak can decrease their costs of poor
quality and improve the way quality work is conducted from the authors’ point of view.

7
2 Methodology
In this chapter considerations concerning the research methods that was used during this master
dissertation will be discussed. With the case study as foundation the authors explain why abductive
and qualitative methods have been used and continues with an explanation of what sources have
been used and why. The section ends with a discussion of validity, reliability and how criticism of
the source has been handled.
2.1 Case study
This dissertation is a result of a request from Tetra Pak to investigate the matters that was described
in the purpose above. Therefore it is natural to form this investigation as a case study. In case studies
it is normal to form investigation entities in different levels in order to make analysis in lower levels
and generalise the result for higher levels (Jacobsen 2002 p.96). For this project it could for example
be one single claim or corrective action that is generalised to a special group of the type, which in
turn is transferred and made as an example for the organisation. Brayman and Bell (2005 p.79)
though warn that one has to be careful in this type of investigations since a result that is valid at one
level might not be valid at another. The case study is a good method for describing a current
situation and how that reflects the context the situation was generated from (Jacobsen 2002 p.95).
The aim of the authors is therefore to conduct the first part of this dissertation as a descriptive
investigation in order to move into an exploratory second part, in which performance measurements
will be discussed and elaborated. Halvorsen (1992 p.84) describes the exploratory approach as good
to use when broad insights and covering view is wanted. In the forming of performance
measurements the authors sincerely believe that the exploratory approach is needed in order to
elaborate all angles and consequences of suggested KPIs and recommendations. The generalisation
of the cases studied at Tetra Pak might not be applicable globally but will hopefully have similarities
with nearby industries.
2.2 The abductive approach
The aim of this case study is to investigate a chain of events in order to find a cost of poor quality and
use this information in evaluating future and current KPIs. The search of a pattern that can be
generalised is a characteristic of the inductive approach (Chalmers 1995; Johansson 2003). At the
same time the goal of the authors is to use an existing frame of theories that is applied to the studied
case. The use of theories as a base to analyse empiric facts is described as the deductive approach
(Jacobsen 2002 p.34). According to Alvesson and Skjöldberg (1994 p.42) a mixture of these two
approaches mentioned above is what most often is used in case studies. This mixture is called
abduction. With this methodology the investigator can move back and forth through theory and
empirics in a free way during the research. With this methodological aspect of the case study the
authors can first investigate different empirical aspects in order to find appropriate theories that can
be used to analyse the situation in an adequate manner. By this it will be easier to dig down and see
beyond the first appearance of the case. To make it easier for the reader to follow the work this
dissertation layout will though take the form of the deductive approach since it is more structured
and easy to follow.
8
2.3 Qualitative and quantitative methodology
The purpose of this dissertation demanded that the authors had a thorough understanding of all
processes and what could affect them. In the first phase of this dissertation this argument led to a
use of qualitative methodology which creates a deeper understanding of a situation and the involved
participants (Andersen 1998 p.31). With the qualitative approach, data handling and analysis can
start already after the first interview in contrast to the quantitative approach were analysis can not
start until all the data is gathered (Svenning 2003 p.74). For the dissertation’s short timeframe and
the selected abductive methodology, instant handling of the material is essential and with the
qualitative methodology the grindstones can start immediately.
To get a more reliable number for what a poor quality truly cost a quantitative approach is needed in
the second phase, after the chain of events have been mapped, in order to find the costs in each
step. Since Tetra Pak has thousands of machines with different contractual modes and physical
settings, the variety that has to be considered in a statistical investigation would be enormous. To get
more accurate estimations a triangulation methodology has been used were both statistics from the
finance system, activity based calculations and personal estimations from the people involved are
used.
2.4 Primary and secondary sources
The main sources of information for the empirics in this dissertation will be internal documents from
Tetra Pak and interviews from its employees. During the entire period the authors have been
stationed at Tetra Pak Packaging Solutions site in Lund. With this setup internal information,
presentations and statistics have been available and easy accessible. It has also been easy to set up
meetings with people close to the processes studied. One trip to the Tetra Pak site in Modena, Italy
has also been made since some of the people that have good knowledge of the process are stationed
there. As long as the processes are held within Tetra Pak, these sources are primary sources, which
implies that no one has analysed or interpreted them before the authors have been able to see them
(Bell 1995 p.65). If anyone interpret the empiric and then passes it on it is called a secondary source
(Andersen 1998 p.150). This is the case for the material that comes from outside Tetra Pak. When
information from outside the company has been required, the employee from Tetra Pak that is closes
to the primary source has been contacted, however direct contact has been established with a
limited number of specific customers and suppliers.
Interviews have been a main source of information in this case study and approximately 50 persons
have been interviewed at least once. In the beginning the interviews were fairly open and the
respondent were free to go in the directions which pleased him or her. The intention with this
procedure was to gain as much information about the situation as possible. In order to get a full
picture with this procedure, similar questions were repeated in different business units. Bell (1995
p.93) calls this methodology pilot interviews and the main purpose of these are to find themes and
thoughts that can build a base for further investigations. When a knowledge base was gained, the
interviews got more and more focused to make sure that all important areas were covered in
accordance with Andersen (1998 p.162). When the interview questions became more specific,
sensitive areas was covered that include corporate confidential areas, which can cause reluctance to
reveal information. This was though considered to be a minor problem in this dissertation as the
authors partly came as insiders from the company and only in certain occasions help from company
9
tutors were needed to get access to information. The respondents were also assured that no
restricted information would reach outside the company walls. Another risk with having a more
structured interview approach is the risk of bias (Bell 1995 p.94). This risk is difficult to address and in
this case the main way to prevent bias was to be aware of the problem and to strive for objectivity
continually. Another point that has been considered before interviews is the importance of not
asking leading questions in order to not get answers that are biased (Bryman & Bell 2005 p.396). This
problem has been faced with an approach to the responding person based on openness. The
questions have been of a kind that lets the person to make their own judgements and give their
opinions on the matter discussed.
The theoretical sources in this dissertation mostly originate from articles in well known scientific
publications found through Lund University search engine ELIN, books from the predecessors in the
quality field such as Deming, Crosby and Feigenbaum and course literature from adjacent areas.
Within the performance measurement area well known literature from Kaplan & Cooper and
contemporary management literature was used. Important information has also been found through
national standardisation organisations such as Swedish Standards Institute (SIS), British Standards
Institution (BSI).
When searching scientific articles at ELIN a large variation and combination of focus words has been
used. Some of the key words were; Cost of Poor Quality (COPQ), Cost of Quality, PAF, Total Quality
Management (TQM), Quality management, Process analysis, Performance measurement,
Designing/developing performance measurements, Supply Chain Performance.
The reader might notice that some references in the report include page numbers and some do not.
This is because the authors made the decision to include page numbers in book references since
many of those used have a very extensive volume. Hence those references without page numbers
are articles or other sources if it has not been considered vital.
2.5 Validity and reliability
Validity, that is, the degree reality is captured, is often split up in two categories. Logical (internal)
validity and construct (external) validity (Svenning 2003 p.65). The logical validity describes in what
way the different parts of the investigation manages to capture the true nature of the matter and its
ingoing parts (Svenning 2003 p.65). This dissertation came out of a task description from Tetra Pak
and the main part of the work has been accomplished within the company walls with mandate from
senior management. In this way employees have not been afraid that company secrets would be
given away or that unauthorised people were able to see numbers and statistics not intended for
them. Free access has been given to company material and all personnel have been more than
willing to freely answer all questions asked. To get a full covering representation, all departments
that are involved in the matter were permitted to give their picture. Also by starting the case study
with open, unstructured interviews increase the logical validity since the respondents were allowed
to give their version and explanation to the chain of events. The construct validity describes how the
investigation as an entity can be generalised in an appropriate way (Svenning 2003 p.66). This type of
validity has here been strengthened by having a thorough theoretical framework that is built on well
known theories in its field. Furthermore the authors hope that the high number of interviews that
has been conducted for this dissertation is enough to give a clear image of the situation so that good
generalisations are possible. Having high validity is very important for the outcome of this report

10
since one of the goals is to find a KPI that is rooted in the company’s strategy and goals. If our
dissertation has low validity, then the resulting calculations, KPIs and suggestions will be misguiding.
Therefore continuous re-evaluations over validity have been conducted.
Reliability is normally described as how accurate the results are or how much coincidence can effect
the conclusions (Andersen 1998 p.85). It must in this matter be pinpointed that this dissertation is
not aimed at finding any exact numbers. One motto during the work has been:
“It’s better to measure approximately right than exactly wrong”
When measuring the cost of poor quality there are extremely many sources of errors. When a
company as Tetra Pak has a wide variety of products and different ways to report these errors, it gets
even worse. Because of this, focus has been on getting a deep understanding of the processes and its
incentives in order to conclude good approximations and measurements that will promote
appropriate behaviour. One measure that has been taken to increase reliability is a version of asking
the same question on two occasions which is recommended by Bryman & Bell (2005 p.94). The
version used here is that during the primary interviews the most important parts according to the
authors have been revised and converted into a flowchart or a model. After this re-examinations
have been done to see if the respondents were interpreted right and to investigate if the responses
was the same as during the first meeting.
To conclude this discussion the authors wants to pinpoint that there might be pitfalls in claiming that
a case study has a high degree of validity and reliability since it is only one case that is being studied.
To get a higher validity a more rigorous benchmark study could have been conducted. It was though
soon realised that the type of measurements conducted in this dissertation is not common in the
local business environment. Therefore this dissertation is seen as, more or less, a pilot study for how
quality costs can be measured and transferred into the daily work of the organisation.
2.6 Criticism of sources
The main part of the empirical data in this dissertation comes from within Tetra Pak. This can be a
problem since commercial organisations tend to produce material that makes them look better. This
is probably a more common problem for material that is intended for people outside the company.
The largest part of the material used for this dissertation is material that is intended for internal use
which makes it less distorted. In analysing and valuing the material for this dissertation, Scott’s
criterions have been used as they are described of Bryman and Bell (2005 p.425):
• Authenticy. Is the material genuine and of unambiguous sources?
• Credibility. Is the material flawless and free from distortions?
• Representativity. Is the material representative considering its origin? If not, in what degree
does it differ?
• Meaningfulness. Is the material clear and comprehensible?
In addition to the points above the usability of the material has been judged in the environment in
which it was created; the roll of the creator, its purpose, whom it was intended for and the age of the
information. All in accordance with Wallén (1996 p.86).

11
Before interviews the respondent’s role in the organisation has been clarified in order to understand
in which context the person acts. This is important in order to understand how the reality looks
different from someone’s perspective to another’s. It might be inappropriate to approach them in
the same way if they are in very different organisational and environmental contexts. Since multiple
sources that say the same thing are more reliable (Bell 1995 p.68), multiplicity has been a goal in all
the empirics.
2.7 Tetra Pak restricted material
Much of the information reviewed for this dissertation is company internal material. Due to this, the
information that can be viewed here, that is considered classified, has been masked. All financial
numbers are for example represented of Tetra Pak dollars (₮). If a time is presented together with a
masked financial number the time will also be masked with the same denominator. In charts and
graphs only relative numbers or relative comparisons can be viewed. Corporate restrictions have also
resulted in that only descriptions of the models created and calculations done can be given.

12
3 Frame of Reference
This chapter presents literature and theory models relevant for the dissertation. The content is both
a more general start about quality and quality work for readers with none or little experience in
the area as well as more specific models that will be used. The chapter ends with theories about
performance measurement.
3.1 What is quality?
Quality, like truth, beauty and contact lenses, is in the eye of the beholder.
The word quality comes from the Latin word qualitas which would best be translated as character.
(Bergman & Klefsjö 2007, p.23) Today there exist a vast number of definitions of quality. According to
Crosby (1979, p.27) one common misinterpretation is that quality means kindness, wealth or
importance. Quality is then used to mark the comparative value in phrases as god or bad quality.
Crosby means that a definition is important to remove the subjectivity from the definition and
therefore defines quality as “conformance to requirements”. This is according to Bergman & Klefsjö
(2007, p.23) a narrow definition which only focus on a producers view. Both Juran (1951) and Deming
(1986) states definitions with customer focus. Juran defines as “fitness for use” while Deming means
that “quality should be aimed at the needs of the customer, present and future”. ISO9000:2000
defines quality as “Degree to which a set of inherent characteristic fulfil requirements”.
Bergman & Klefsjö (2007 p.25) tries to combine different viewpoints and states that “the quality of a
product is its capacity to satisfy, and preferably outperform, the customer’s needs and expectations”.
One problem in this definition is who the customer is. For industrial products it is important to differ
between user and buyer. Customers can, according to Lehmann & Winer (2005 p. 121), be divided
into five different entities within an organisation.
• Initiator – Identifies the need for the product
• Influencer – Has information or preference input to the decision
• Decider – makes the final decision through budget authorisation
• Purchaser – make the actual purchase
• User – the user of the product
Bergman & Klefsjö (2007 p.29) defines customer “those who our organisation creates value for”.
According to ISO9000:2000 the customer is “the organisation or person who receives a product”.
One other group involved are stakeholders which could be divided into primary and secondary
stakeholder. Stakeholders are organisations or people who give support to the organisation and can
withdraw the support if they are not pleased with the organisation. The classification of primary and
secondary stakeholders depends on if the own organisation directly, respectively or indirectly can
affect if the stakeholder’s support is withdraw.

13
To meet the customer’s needs and expectations is somewhat difficult to achieve since the customer
is normally only aware of some of his or her needs. Some of the needs are only taken for granted or
unknown until they are satisfied. (Sörqvist 2001 p.11) The fulfilment of different needs makes
different impacts on the customer. This is described by the Kano model in Figure 3 below.
Figure 3: The Kano Model (Pyzdek 2003, p.119)
Another way of defining quality is to use five different viewpoints (Garvin 1984):
1. User based – Quality is measured by the customer
2. Production based – Quality is connected to satisfying production tolerances and is mainly a technical issue
3. Value based – Quality is measured in relation to costs
4. Product based – Quality is measurable and is defined by the performance of the product
5. Transcendent – Quality can not be measured but only identified when it is experienced, like beauty
The conclusion of Garvin is that an organisation can not have just one view on quality. Instead they need different views in different departments (Bergman & Klefsjö 2007 p.28).
According to Bergman & Klefsjö (2007 p.32) can product quality be divided into different dimensions
and describe eight of these. In Table 1 these are shown.

14
Table 1: Dimensions of product quality according to Bergman & Klefsjö (2007 p.32)
Reliability How often faults occur and how serious they are
Performance Characteristics of importance for the customer
Serviceability How easy it is to find, locate and eradicate faults
Environmental friendliness The product’s impact on the environment
Appearance Aesthetics parameter created by design and colour
Absence of defect That the product does not have faults or shortages when it is
bought
Security That the product does not cause harm to person or property
Durability That the product can be used, stored and transported without
being fatigued or damaged
Quite similar view with product focus is the one of Garvin (1984). Here in Table 2 it is expanded with
which company function responsible for each dimension that is described by Hill (2000 p.67)
Table 2: Dimensions of product quality according to Garvin (1984), with function responsibilities from Hill
(2000 p.67)
Dimensions of quality Function(s)
responsible
Performance A product’s primary operating characteristics
Features Secondary characteristics, the “bells and whistles”
Reliability The probability of a product malfunctioning within a
given period
Aesthetics How the final product looks
Durability A measure of a product’s life in term of both its
technical and economical dimensions
Design
Conformance The degree to which a product is manufactured to the
agreed specification
Manufacturing
Serviceability The ease of servicing (planned or breakdown) to include
the speed and provision of after-sales service
Design and after-sales
Perceived Quality How a customer views the product Marketing and design

15
Hill especially emphasise that conformance is the only parameter of quality that can be directly
influenced by manufacturing. Another important aspect of the quality dimensions is that the
importance of each dimension differs a lot between different products (Bergman & Klefsjö, 2007
p.37).
3.2 Quality work
Folklore has it in America that quality and productivity are incompatible: that you can not have both –
Edward W. Deming
3.2.1 History of Quality work
In the beginning of the 20th century Frederick Taylor developed Scientific Management. One of the
cornerstones was special inspectors controlling that all operations were within the given tolerances
(Bergman & Klefsjö 2007 p.83). The whole idea of separating control from production would remain
in the western world for a long time. One of the first persons to integrate some customer focus in
quality work was Walter A. Shewhart in 1931 (Bergman & Klefsjö 2007 p.86).
After World War II Japanese quality had a bad reputation, mainly depending on that many company
leaders from the war were replaced by young engineers. The group JUSE (Union of Japanese
Scientists and Engineers) was founded in 1946 as a campaign to improve the reputation. JUSE
worked together with Joseph M. Juran and Edward W. Deming and educated many company key
personnel in quality work. One message was the quality work is a much about leadership as statistic
control (Bergman & Klefsjö 2007 p.91).
One of the fundamentals of Japanese quality work was what today is known as quality circles. The
control and the production was reconnected when the actual operators was engaged in solving their
quality problems in these quality circles. Two important issues raised by Ishikawa in 1964 was
passionate leadership and that quality work should involve everyone in the company (Bergman &
Klefsjö 2007 p.96). This was known as Company Wide Quality Control (CWQC). Many concepts as
lean-production, just-in-time, Kanban, kaizen, 5-why and 7 improvement tools are part of this theory
(Bergman & Klefsjö 2007 p.97).
In the 1980s, to meet the threat from the “Japanese wonder”, the western companies started to
learn from the Japanese way. The term Total Quality Control (TQC) from Feigenbaum (1991) was
used as name but the theories later on became known as Total Quality Management (TQM)
(Bergman & Klefsjö 2007 p.97).
3.2.2 Total Quality Management
The expression TQM was created either by Naval Aviation Logistics Command when they in 1984 did
not like the word “Control” in Total Quality Control and replaced it with “Management” or as an
misinterpretation from Japanese since the difference between control and management do not exist
in Japanese(Bergman & Klefsjö 2007 p.97).
The principle of the Total Quality view is that it starts with identification of customer needs and ends
with the product being placed in the hands of a customer who remains satisfied (Feigenbaum 1991
p.11). Feigenbaum (1991) also describes eight stages of the industrial cycle (see Table 3) where the
quality of a product is affected. This describes that total quality can not be accomplished in one

16
isolated stage. This could be compared to the quality dimensions of Garvin and Hill in the chapter
above.
Table 3: Eight stages of the industry cycle (Feigenbaum 1991 p.11)
Marketing
Engineering
Purchasing
Manufacturing Engineering
Manufacturing supervision and shop operations
Mechanical inspection and functional test
Shipping
Installation and service
Bergman & Klefsjö (2007 p.38) translates TQM into Offensive Quality Development. Offensive should
be read as “to work active with prevention, change and development and not control and repair”.
Bergman & Klefsjö (2007 p.39) defines in Figure 4 five cornerstones and one fundament upon which
TQM is built.
Figure 4: The fundament “Passionate leadership” is a prerequisite for the five cornerstones upon which TQM
is built (Bergman & Klefsjö 2007 p.39)
Work with
processes
Work with
continuous
improvement
Base decisions on
facts
Create a base for
everyone’s
participation
Place the
customers in
the centre
Passionate leadership

17
Another summarisation of TQM is the 13 basic values which are the foundation to get the Award for
Swedish Quality that is given by the Swedish Institute for Quality (SIQ 2008, p.8; Sörqvist 2001, p.9).
The 13 basic values are:
• Customer orientation • Preventive action
• Passionate leadership • Continuous improvement
• Participation • Learn from others
• Competes development • Agility
• Long term goals • Decisions based on facts
• Social responsibility • Cooperation
• Process orientation
These principles can seem a bit vague and difficult to make operational, but they are the pillars that
build the foundation to the Swedish TQM approach. And with proper measurements these principles
can be a foundation for benchmarking and improvement efforts (SIQ 2008).
3.3 Quality Costing
“Money is the basic language of the upper management” – Joseph M. Juran
3.3.1 The Role of Quality Costing
Many companies recognise quality as a key area for customer value and also define quality as a part
of their competitive strategy (Tsai 1998 p.719). Despite this and even though many companies are
involved in quality programs, only a third of the companies in US and England actually calculate cost
of quality (COQ) (Yang 2008 p.176).
Measuring and reporting cost of quality is the first thing to do in a quality program (Tsai 1998 p.719).
Quality has always been difficult to measure and therefore has quality management had problem to
attract top management’s attention (Crosby 1979 p.124; Juran & Gryna 1988 p.4.4). COQ is a way to
measure quality and quantify it as money. Giakatis et al (2001) summaries the COQ in different
companies to be between 5-30% of sales and studies often show that COQ more often are around
15-25% of sales than the 3-7% that companies often assume (Yang 2008 p. 175). However, according
to Crosby (1979 p.129) is COQ primary a tool to focus management attention and only secondly as a
measure of quality improvement programme.
The increased importance of COQ can be explained by the changed customer behaviour from buying
whatever is offered into buying only products that matches their functional requirements and
desired price, caused by the global competition. This has made the customer orientation much more
important for companies and therefore also increased the importance of reduction and financial
measurement of non-conformance (Yang 2008 p.176).

18
Yang (2008 p.176) lists critical issues for effective quality-cost technique as:
• To categorise various quality costs and make sure that all costs are captured
• To collect and analyse data and quantify all quality costs accurately
• To identify areas of poor performance on basis of the data analysis
• To allocate responsibility for the overall cost
Juran & Gryna (1988 p.4.2) describes two different objectives with quality costing:
• Estimate the Quality costs as a one-shot study and use the result from the study to start
projects of improvement.
• Expand the accounting system and continuously present the cost as a scoreboard and make
this drive the starting of improvement projects.
3.3.2 Definition of Quality costing
The concept quality costing was introduced by Juran in 1951 when new quality oriented staff
departments evolved at companies and their managers were faced to “sell” their activities to
company management (Juran & Gryna 1988 p.4.2; Schiffauerova & Thomson 2006 p.4).
The term quality costs have no agreed definition. Two examples of quality cost definitions are the
cost of attaining quality or the cost of running a quality department. These two are according to
Juran & Gryna (1988 p.4.3) faulty and common misinterpretations. Juran & Gryna (1988 p.4.3) means
that quality specialists equate “quality costs” with “cost of poor quality”. With this Juran & Gryna
means the “sum of all costs that would disappear if there were no quality problems”. Srivastava
(2008 p.193) uses the definition “the sum of the costs incurred within a firm in preventing poor
quality, the costs incurred to ensure and evaluate that the quality requirements are being met, and
any other costs incurred as a result of poor quality”.
Yang (2008 p.177) summaries and compare different definitions of quality costs and states that most
of them are similar. Mainly two different groups of terms exist:
1. Cost of Quality – either abbreviated COQ (e.g. Srivastava 2008) or CoQ (e.g. Schiffauerova &
Thompson 2006).
2. Cost of Poor Quality – abbreviated COPQ (e.g. Juran & Gryna 1988). This term also include
Poor-Quality Costs – PQC (e.g. Chen & Tang 1992)
The both terms Cost of Quality and Cost of Poor Quality are essentially synonymous and both can be
used to describe quality costs (Juran & Gryna 1988; Yang 2008). In this subject Plunkett & Dale (1987
p.50) points out that in literature, many writers imply their own definitions of quality related costs
and much of the literature on the subject is on how to interpret or define quality costs.
“The point to be made here is that the literature does not deal with a matter which is fundamental to
the whole exercise of gathering and using quality-related costs. Attention to definitions may obviate

19
many of the obstacles to establishing quality costing as a management tool.” (Plunkett & Dale 1987
p.50)
3.4 Overview of Quality costing models
Different Cost of Quality models for handling the issues described in 3.3.1 exists today. The first
quality costing analysis was performed by Armand Feigenbaum in 1943 (Schiffauerova & Thomson
2006 p.4) and in 1956 Feigenbaum presented the P-A-F cost model which is the foundation of many
of today’s COQ models (Feigenbaum 1991 p.109; Schiffauerova & Thomson 2006 p.4). The P-A-F-
model will be presented in section 3.5. Philip Crosby (Crosby 1979 p.123) evolved the model with his
own quality definition and his work helped to popularise the COQ concept beyond the quality
profession (Srivastava 2008 p.195). The P-A-F model in its original form does not contain any
intangible cost and have been expanded in numerous models in a way to capture the types of hidden
costs that exists in different levels (Schiffauerova & Thomson 2006; Srivastava 2008; Yang 2008).
Process cost approach developed by Ross in 1977 and used for the first time for quality costing by
Marsh in 1989 is the other main model for quality costs (Schiffauerova & Thomson 2006 p.5).
Reviews of COQ models can be found in Plunkett & Dale (1987), Porter & Rayner (1992) and more
recently Schiffauerova & Thomson (2006).
3.5 PAF model
Feigenbaum’s Prevention – Appraisal – Failure (PAF) model presented in 1956 is still the cornerstone
in quality costing models. The quality costs include two different areas: the cost of control and the
cost of failure of control which can be seen in Figure 5 (Feigenbaum 1991 p.110).
Figure 5: Cost of Poor Quality divided into cost of control and cost of failure of control (Feigenbaum 1991
p.111)
Costs of control are measured in two segments: Preventions costs and Appraisal costs, while the
costs of failure of control are divided into the segments: Internal Failure Costs and External Failure
costs which can be seen in Figure 6 on page 21(Feigenbaum 1991 p.111).

20
3.5.1 Prevention costs
Prevention costs are costs incurred to keep failure and appraisal costs to a minimum (Juran & Gryna
1988 p.4.6). The British Standard (BS6143 1981) defines prevention cost as “the cost of any action
taken to investigate, prevent or reduce the risk of non-conformity or defect”. Examples of
preventions cost are (Juran & Gryna 1988 p.4.6):
• Quality planning • New product review
• Process planning • Process control
• Quality audits • Supplier quality evaluation
• Training
3.5.2 Appraisal costs
Appraisal costs are costs incurred to determine the degree of conformance to quality requirements
(Juran & Gryna 1988 p.4.5). Another definition is the cost of evaluating the achievement of quality
requirements including, for example, “the cost of verification and control performed at any stage of
the quality loop” (BS6143 1981). Examples are (Juran & Gryna 1988 p.4.5):
• Incoming inspection and test • In-process inspection and test
• Final inspection and test • Product quality audits
• Maintaining accuracy of test equipment • Inspection and test material services
• Evaluation of stocks
3.5.3 Internal failure costs
Internal failure costs are costs associated with defects that are found prior to transfer of the product
to the customer. They are costs that would disappear if no defects existed in the product prior to
shipment (Juran & Gryna 1988 p.4.5). Another definition is “costs arising within an organisation
owing to non-conformities or defects at any stage of the quality loop, such as costs of scrap,
reworking, retesting, re-inspection or redesign” (BS6143 1981). Examples are (Juran & Gryna 1988
p.4.5):
• Scrap • Rework
• Failure analysis • Scrap and rework – supplier
• One hundred percent sorting inspection • Re-inspection, retest
• Avoidable process losses • Downgrading

21
3.5.4 External failure costs
External failure costs are costs associated with defects that are found after product is shipped to the
customer. These costs also would disappear if there were no defects (Juran & Gryna 1988 p.4.5). The
BS6143 (1981) definition is “costs arising after delivery to customer/user owing to conformities or
defects, which may indicate the cost of claims against warranty, replacement and consequential
losses, and evaluation of the penalties incurred”. Examples are (Juran & Gryna 1988 p.4.5):
• Warranty charges • Complaint adjustment
• Returned material • Allowances
Figure 6: Cost of Poor Quality with the PAF sub division (Feigenbaum 1991 p.111)
3.5.5 Optimal level of PAF-categories
During the development of products, the cost for making changes increase rapidly for each
development step that is entered which is shown in Figure 7. One of the success factors behind the
Japanese industry in the mid-eighties was to make sure the quality was high and that no changes was
required after the commercial launch (Bergman & Klefsjö 2007 p.64).

22
Develop
ment
Plann
ing
Productio
n
In us
e
1
10
100
1000
Time
Relative cost for changes
(Logarithmic scale)
Figure 7: Cost for changes in different steps of product generation (Bergman & Klefsjö 2007 p.64)
This theme is more elaborated in the PAF-model where the costs are related to each other. When
the appraisal cost rise the failure cost normally fall because more failures are discovered at an earlier
stage. The cost of failure increase as the faulty item proceeds down the production process.
Therefore it is less costly to scrap an item at goods intake then when the product is ready for deliver.
But the decreasing rate will fall when increasing the appraisal cost since appraisals activities can
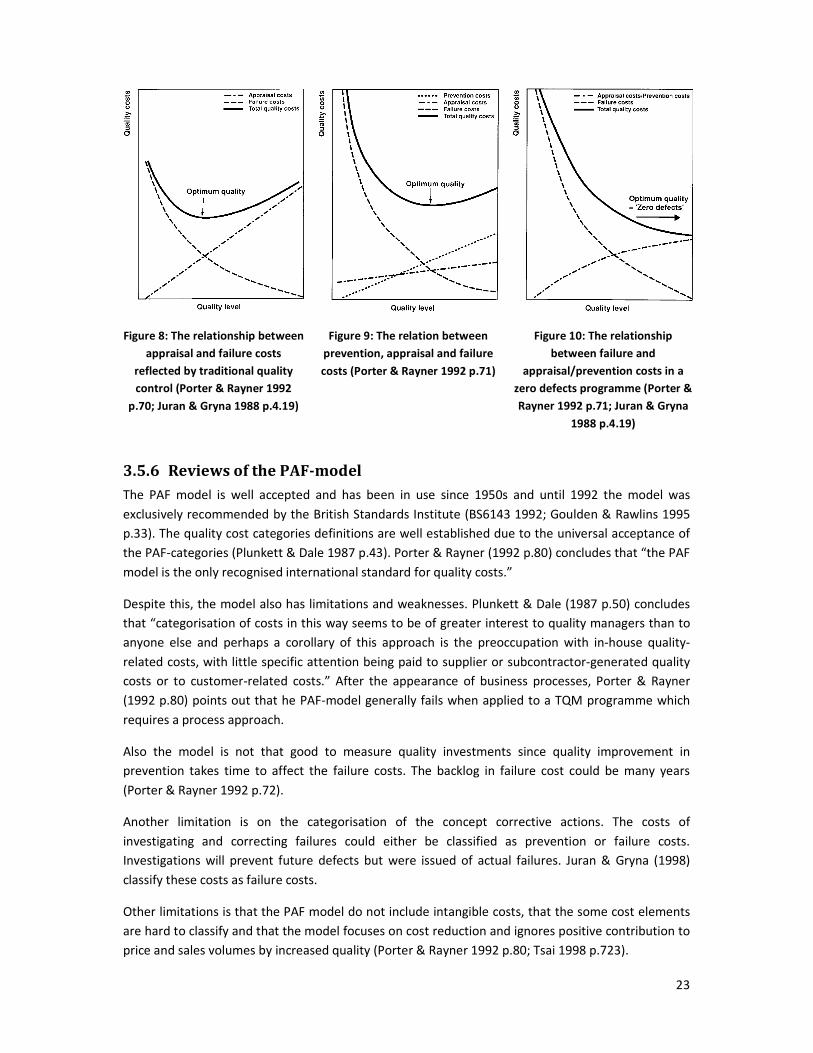
never be fully successful (Porter & Rayner 1992 p.70). This is shown in Figure 8 and represents the
opinions during most of the twentieth century. The figure shows that there is a trade-off between
quality and costs and that beyond the optimum a further investment in quality will not be paid-off
(Porter & Rayner 1992 p.70).
One of the major points in Total Quality Management is prevention rather then letting the failures
happen in the first place. This means that an investment in prevention would decrease the failure
costs without any increase in appraisal costs. Figure 9 shows how the prevention reduces the failure
costs but there is still an optimum beyond which further investments are unprofitable (Porter &
Rayner 1992 p.70).
During the late twentieth century the priorities on prevention became higher. New technology has
reduced errors in both production but mostly in inspection (Juran & Gryna 1988 p.4.19). Also if no
defects at all were produced the appraisal cost could be eliminated or at least lowered. This leads to
the zero-defects view where the optimum point means no failure costs (Porter & Rayner 1992 p.71).
This means doing things right the first time (Crosby 1979 p.223).
Further point has been added that increases the view of Figure 10 as valid. Different types of hidden
costs outside the PAF-model can also be reduced a with higher quality level (Yang 2008 p.178). Also
the cost of losing a customer because of defects is not included in this model (Reichheld & Sasser
1990).
23
Figure 8: The relationship between
appraisal and failure costs
reflected by traditional quality
control (Porter & Rayner 1992
p.70; Juran & Gryna 1988 p.4.19)
Figure 9: The relation between
prevention, appraisal and failure
costs (Porter & Rayner 1992 p.71)
Figure 10: The relationship
between failure and
appraisal/prevention costs in a
zero defects programme (Porter &
Rayner 1992 p.71; Juran & Gryna
1988 p.4.19)
3.5.6 Reviews of the PAF-model
The PAF model is well accepted and has been in use since 1950s and until 1992 the model was
exclusively recommended by the British Standards Institute (BS6143 1992; Goulden & Rawlins 1995
p.33). The quality cost categories definitions are well established due to the universal acceptance of
the PAF-categories (Plunkett & Dale 1987 p.43). Porter & Rayner (1992 p.80) concludes that “the PAF
model is the only recognised international standard for quality costs.”
Despite this, the model also has limitations and weaknesses. Plunkett & Dale (1987 p.50) concludes
that “categorisation of costs in this way seems to be of greater interest to quality managers than to
anyone else and perhaps a corollary of this approach is the preoccupation with in-house quality-
related costs, with little specific attention being paid to supplier or subcontractor-generated quality
costs or to customer-related costs.” After the appearance of business processes, Porter & Rayner
(1992 p.80) points out that he PAF-model generally fails when applied to a TQM programme which
requires a process approach.
Also the model is not that good to measure quality investments since quality improvement in
prevention takes time to affect the failure costs. The backlog in failure cost could be many years
(Porter & Rayner 1992 p.72).
Another limitation is on the categorisation of the concept corrective actions. The costs of
investigating and correcting failures could either be classified as prevention or failure costs.
Investigations will prevent future defects but were issued of actual failures. Juran & Gryna (1998)
classify these costs as failure costs.
Other limitations is that the PAF model do not include intangible costs, that the some cost elements
are hard to classify and that the model focuses on cost reduction and ignores positive contribution to
price and sales volumes by increased quality (Porter & Rayner 1992 p.80; Tsai 1998 p.723).

24
3.5.7 Crosby’s Model
A variant of the PAF-model has been made by Crosby (1979 p.123). Because of Crosby’s definition of
quality (see 3.1) the quality costs is defined as price of non-conformance (PONC) which includes the
same categories as the PAF-model (Prevention, Appraisal and Failure). PONC could also be described
as the cost of getting things wrong (Goulden & Rawlins 1995 p.33). Other authors have expanded
Crosby’s model with the price of conformance (POC) as well where POC refers to the cost of control
and PONC then refers only to the cost of failure. One problem with Crosby’s model and quality
definition is the neglecting of the design quality which can create a conflict between design and
conformance quality. This can either be handled with a correct prioritisation between the two
dimensions or as a synergistic approach based on the view that improvement in one dimension leads
to improvement in the other (Srivastava 2008 p.195).
However, as shown in Figure 11, in the end this is only a different terminology describing the PAF-
model (Goulden & Rawlins 1995 p.36; Schiffauerova & Thomson 2006 p.5).
Figure 11: Cost of Poor Quality with both Crosby’s and Feigenbaum’s subdivisions (after Feigenbaum 1991)
3.5.8 Intangible or hidden costs
Even though the PAF-model is widely used many authors recon that the traditional categories do not
cover all quality related costs. Additional categories have been suggested such as cost of quality
design, cost of inefficient utilisation and other invisible costs (Yang 2008 p.178). These intangible or
hidden costs are often used to show on failure costs that are not recorded in the company accounts.
Dahlgaard et al. (1992) proposes a 2x2 matrix model (Table 4) based on PAF with internal and
external costs as well as visible and invisible costs.

25
Table 4: A new categorization of the quality costs (Dahlgaard et al. 1992)
Internal costs External costs Total costs
1a. Scrap/Repair costs 2. Warranty costs
(complains) Visible costs
1b. Prevention/Appraisal costs
1+2
3a. Cost due to internal
inefficiencies
4. Loss of goodwill
(loss of future sales) Invisible costs
3b. Prevention/Appraisal costs
3+4
Total costs 1+3 2+4 1+2+3+4
Another categorisation proposed by Chen & Tang (1992) is the distinction of direct and indirect
quality costs. Where indirect quality costs is divided in three components:
• Customer incurred costs
• Customer-dissatisfaction costs
• Loss-of-reputation costs
Other categorisation is proposed by Giakatis et al. (2001) who uses the term quality losses.
These hidden costs can account for up to 10-15% of turnover (Dahlgaard et al. 1992). Giakatis et al.
(2001) estimate that the hidden costs are more than three times of the visible costs The problem is
that the costs are not visible in traditional financial reports and this is also the explanation why
companies tolerate the costs; “they are simply ignorant of them” (Yang 2008 p.179).
3.5.9 Different levels of COPQ visibility
Sörqvist (2001) describe a framework for how to understand different levels of COPQ and what types
of cost that normally are visible and what types are not. With a representation of an iceberg that can
be seen in Figure 12, Sörqvist describes that the true cost normally are much higher than normal
accounting systems can display.

26
Level 1 – Traditional COPQ
Traditional COPQ are Costs that can be traced trough time studies or simple checks in accounting
systems. These costs mostly consist of problems that disrupt production in an obvious way.
Examples can be scrap, rework, warranties and cost for control personnel. This knowledge is fairly
simple to find and can help the company improve its processes. But to only focus on these may also
lead to sub-optimisation when only a small part of the quality costs are reviewed.
Level 2 – Hidden COPQ
These costs can not be found in the traditional accounting system and are often chronic process
flaws that are not detected in the day to day work. These often occur in white collar positions but the
hidden costs can also be found among the blue collar workers since corrections are made here and
there without being noted in the accounting system.
Level 3 – Lost revenue
When the customer find the product unsatisfying or perceive the competitors products as more
value for money a loss of goodwill will occur. This leads to decreased sales and loss of customers.
This cost is difficult or even impossible to measure and therefore has to be approximated. Since this
cost most often is considerable it should not be forgotten.
Level 4 – Customers cost
The costs an external customer incurs due to poor quality earlier in the chain can lead to production
stop, malfunctioning products or unwanted market effects. With these effects come goodwill losses
and unsatisfied customers to the customer as a natural consequence which in time will decrease the
focal company sales.
Traditional COPQ
Hidden COPQ
Lost Revenue
Customer Cost
Socioeconomic Cost
Figure 12: Iceberg representation for pinpointing the small proportion traditional COPQ has of the total
sum (Sörqvist 2001, p.39)

27
Level 5 – Socioeconomic cost:
By neglecting the life cycle cost that results in high handling and recycling costs, or if quality
problems result in environmental or personal hazards, the society will have to take action. Either this
will affect the company directly in the form of fees or penalties or else the company will be affected
in the long run by increased taxes.
3.6 Process cost model
Ross (1977 p.16) developed a method called structured analysis (SA) to make a top-down analysis in
a graphical language (Figure 13). The method was originally a computer-aided manufacturing
integrated programme definition methodology (IDef) (Goulden & Rawlins 1995 p.36). In 1989 John
Marsh presented a framework for quality improvements including QIMA (Quality Improvement
Methods Analysis) as quality extension of the modelling language IDef0 (Marsh 1989). Marsh
proposes definitions and analyses of existing processes to find the cost of failure or the cost of non-
conformance (CONC) followed by creation of new prevention processes. Marsh (1989 p.288) then
concludes that “a process approach is a pre-requisite to successful application of the TQM-concept”.
Figure 13: Structured decomposition (Ross 1977 p.18)
BS6143 (1992) has created its own version of Marsh’s model and have added the term Cost of
Conformance (COC) to Marsh’s CONC. BS6143 (1992) uses the terms cost of conformance (COC) and
cost of non-conformance (CONC) with the following definitions:
• COC – The intrinsic cost of providing products or services to declared standards by a given,
specified process in a fully effective manner.
• CONC – The cost of wasted time, materials and capacity (resources) associated with a
process in the receipt, production, despatch and correction of unsatisfactory goods and
services.
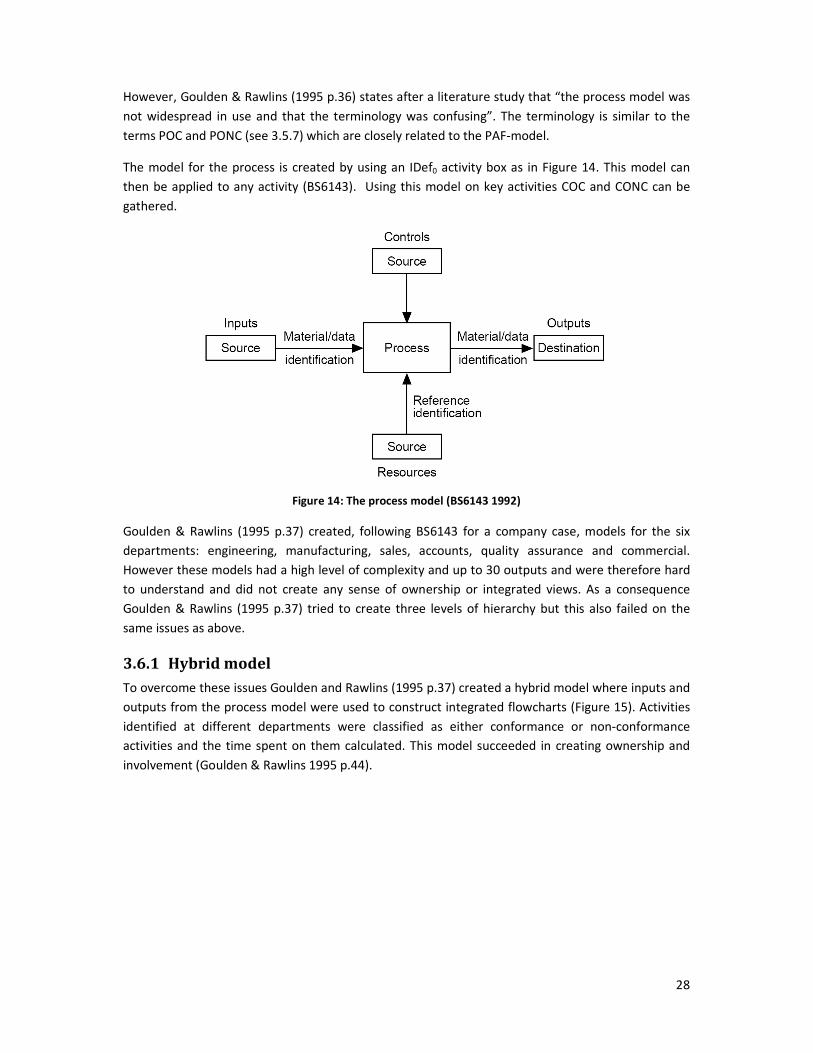
28
However, Goulden & Rawlins (1995 p.36) states after a literature study that “the process model was
not widespread in use and that the terminology was confusing”. The terminology is similar to the
terms POC and PONC (see 3.5.7) which are closely related to the PAF-model.
The model for the process is created by using an IDef0 activity box as in Figure 14. This model can
then be applied to any activity (BS6143). Using this model on key activities COC and CONC can be
gathered.
Figure 14: The process model (BS6143 1992)
Goulden & Rawlins (1995 p.37) created, following BS6143 for a company case, models for the six
departments: engineering, manufacturing, sales, accounts, quality assurance and commercial.
However these models had a high level of complexity and up to 30 outputs and were therefore hard
to understand and did not create any sense of ownership or integrated views. As a consequence
Goulden & Rawlins (1995 p.37) tried to create three levels of hierarchy but this also failed on the
same issues as above.
3.6.1 Hybrid model
To overcome these issues Goulden and Rawlins (1995 p.37) created a hybrid model where inputs and
outputs from the process model were used to construct integrated flowcharts (Figure 15). Activities
identified at different departments were classified as either conformance or non-conformance
activities and the time spent on them calculated. This model succeeded in creating ownership and
involvement (Goulden & Rawlins 1995 p.44).

29
Figure 15: Integrated flowchart (Goulden & Rawlins 1995 p.40)
3.7 Activity-based costing (ABC) model
The main difference between ABC and traditional cost models is that ABC has a process focus. While
traditional cost models use overheads to distribute cost, ABC has the ambition to assign cost to all
activities in the process accordingly to what resources that has been used. Kaplan & Cooper (1998)
claim that a properly designed cost system should be able to answer four questions:
1. What activities are being performed by the organisational resources?
2. How much does it cost to perform organisational activities and business processes?
3. Why does the organisation need to perform activities and business processes?
4. How much of each activity is required for the organisations products, services and
customers?

30
Kaplan & Cooper describe the ABC methodology as a map with which new terrains in an unknown
business environment can be explored in order to see were one should proceed or stop.
In Figure 16 below the assigning of cost in an ABC system according to Tsai (1998) can be seen. The
basic approach when setting up an ABC model is to localise what resources that are available in the
organisation and to map out how they are used by the different activities in order to produce a
specific output. Each resource has its own driver that adds up in the activity cost pool. Since it is the
activities conducted that drive the final cost, suitable activity cost drivers should be attributed that
can accurately describe the resource usage. One commonly used cost driver is time, but depending
on the situation there are loads of alternatives and anything fitting the purpose can be used. These
can be number of machine setups or number of engineering changes (Kaplan & Cooper 1998 p.93).
Figure 16: Assigning costs in an ABC system (Tsai 1998, p. 729)
Tsai (1998) claim that it is impossible to trace quality costs with the use of traditional cost models. He
state that this problem is though easily overcome with the use of ABC system. In order to measure
the quality costing with an ABC-model Tsai (1998) describe the following table to first understand
where the cost drivers can be found:

31
Table 5: Table for understanding of cost drivers performed activites (Tsai 1998, p. 743)
Activities Required
resources
Activity levels PAF Category Value- or non
value- added
(VA) /(NVA)
Activity drivers
Machining People, machines,
tools
Unit - VA Machine Hours
Rework People, machines,
tools
- Internal failure NVA # of reworks
Warranty repair People, machines,
tools
- External failure NVA # of warranty
repairs
Maintenance People, supplies Facility Prevention VA Machine hours
Tsai (1998) goes on to state that by assigning the cost for one unit of the cost driver and multiply this
by the numbers of times the action needs to be conducted, or for example, how many hours of
rework that is required due to maintenance. When summarising these products the total cost of
poor quality will be revealed.
3.8 Incentives and design of measurement systems
“I often say that when you can measure what you are speaking about, and express it in numbers, you
know something about it; but when you cannot express it in numbers, your knowledge is of a meagre
and unsatisfactory kind; it may be the beginning of knowledge, but you have scarcely, in your
thoughts, advanced to the stage of science, whatever the matter may be.” (Lord Kelvin, Lecture on
"Electrical Units of Measurement", 3 May 1883)
Anthony & Govindarajan (2003 p.494) describes the same thing as Lord Kelvin but in a bit more
academic way and also connected with reward systems in the framework below in Figure 17. The
model simply wants to point out that the strategy gives the focus of the critical success factors for
the company. When these factors are measured and rewarded people are motivated and willing to
achieve them.
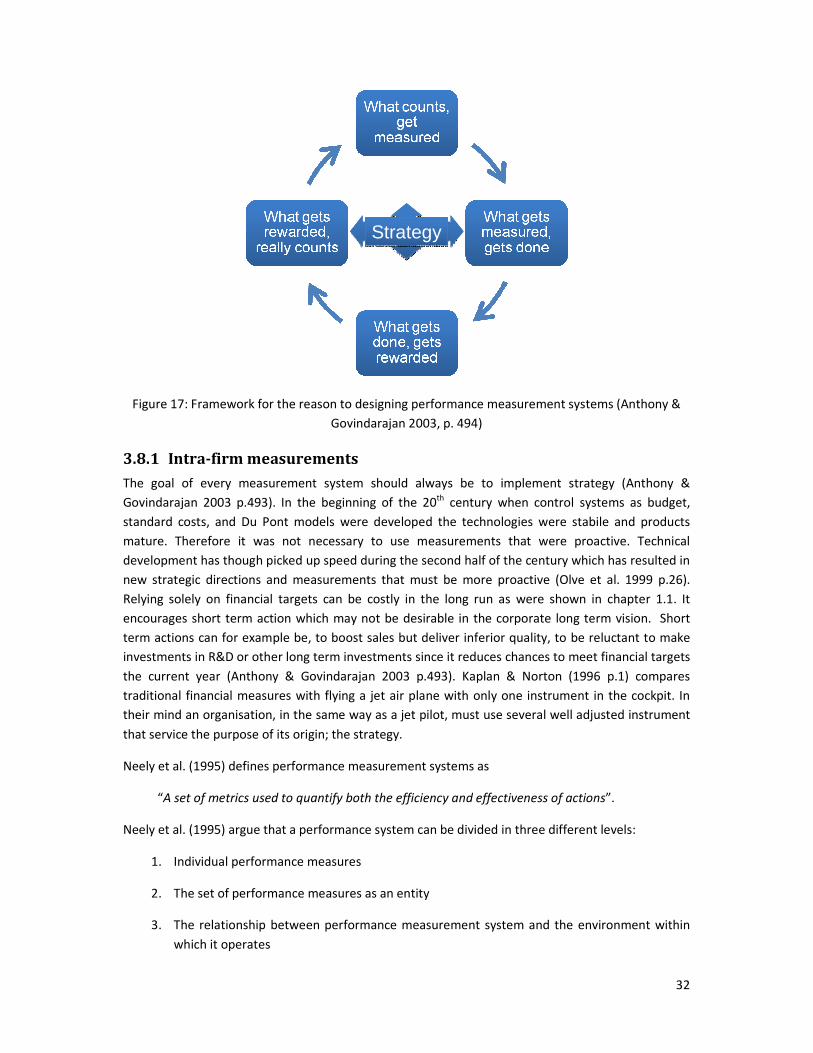
32
StrategyStrategy
Figure 17: Framework for the reason to designing performance measurement systems (Anthony &
Govindarajan 2003, p. 494)
3.8.1 Intra-firm measurements
The goal of every measurement system should always be to implement strategy (Anthony &
Govindarajan 2003 p.493). In the beginning of the 20th century when control systems as budget,
standard costs, and Du Pont models were developed the technologies were stabile and products
mature. Therefore it was not necessary to use measurements that were proactive. Technical
development has though picked up speed during the second half of the century which has resulted in
new strategic directions and measurements that must be more proactive (Olve et al. 1999 p.26).
Relying solely on financial targets can be costly in the long run as were shown in chapter 1.1. It
encourages short term action which may not be desirable in the corporate long term vision. Short
term actions can for example be, to boost sales but deliver inferior quality, to be reluctant to make
investments in R&D or other long term investments since it reduces chances to meet financial targets
the current year (Anthony & Govindarajan 2003 p.493). Kaplan & Norton (1996 p.1) compares
traditional financial measures with flying a jet air plane with only one instrument in the cockpit. In
their mind an organisation, in the same way as a jet pilot, must use several well adjusted instrument
that service the purpose of its origin; the strategy.
Neely et al. (1995) defines performance measurement systems as
“A set of metrics used to quantify both the efficiency and effectiveness of actions”.
Neely et al. (1995) argue that a performance system can be divided in three different levels:
1. Individual performance measures
2. The set of performance measures as an entity
3. The relationship between performance measurement system and the environment within
which it operates
33
The highest levels include areas as strategies, organisation culture and external factors. The
intermediate level concerns the balance of the metrics. That can include time horizons, that no
measures cause actions with conflicting purposes or that all relevant fields are covered. The lower
level examine the nature of the single measure, that is, the purpose of using it, what it contribute
with and what it costs (Neely et al. 1995).
When creating a performance measurement there are some pitfalls more dangerous than others.
Anderson & McAdam (2005) bring forth that the two major risks according to the literature are false
alarms and gaps. False alarms are most often connected with cost-based metrics and give the
managers incentives to focus on improving something that has few benefits for the organisation and
perhaps many harmful consequences. Gaps do most often concern non-financial metrics and means
the performance index actually measures something that has no true value and what is really
important stays neglected.
If the pitfalls above are to be avoided while forming a measurement system there are a number of
criteria that should be followed according to Neely et al. (1995). One of the ways in which this can be
presented is the following seven principles:
1. The measures should be directly related to the firms manufacturing strategy
2. Non-financial measures should be adopted
3. It should be recognised that measures vary between locations – one measure is not suitable
for all departments or sites
4. It should be acknowledged that measures change as circumstances do
5. The measures should be simple and easy to use
6. The measures should provide fast feedback
7. The measures should be designed so that they stimulate continuous improvement rather
than simply monitor
Other suggestions that might aid the creation of a performance measure system can be to use ratio
based performance criteria instead of total numbers, to use objective rather than subjective
measures or to make the methods for collecting data clearly defined (Neely et al. 2000).
When designing the system Anthony & Govindarajan (2003 p.496) states that the need of the
stakeholder requirements should be met with a mix of outcome and drivers, financial and non-
financial measures and finally, internal and external measures. Outcome and drivers are based on a
cause and effect notion. If a certain outcome is wanted the causing drivers and activities must be
found and by the help of proper measures, incentives for promoting certain behaviours that gives the
desired outcome should be adopted. Olve et al. (1999 p.176) especially stresses the importance of
using a measurement based on the driver in situations where the outcome might take long time to
appear. The mix of financial and non-financial measures is extremely important in order to drive both
short- and long-term behaviour in line with the corporate strategy. Finally the company needs to
have a balance between the internal and external perspectives so that the result does not hit rock

34
bottom, but the customers and suppliers love them or the other way around (Anthony &
Govindarajan 2003 p.497).
When it comes to measures regarding quality De Toni & Tonchia (2001) in their study of 115 Italian
companies found that there were few companies that used cost of quality as a performance
measurement. Were it was used it was normally the cost of inbound control, rework and the quality
systems cost. When it comes to returned goods these measurements were normally conducted in
percentage.
The different phases in implementing performance measurement systems are shown below in Figure
18.
Figure 18: Phases in developing a performance measurement system (Bourne et al. 2000, p. 757)
In the first phase key objectives are identified out of the corporate strategy and out of that,
measurements are designed that drives preferred behaviour in order to achieve the company goal
and vision. In the second phase processes are put in place in order to capture new or existing data.
The third phase is aimed at measuring the success in implementing the strategy. At this stage it is
important to note that a performance measurement only aimed at monitoring is not fulfilling its
purpose. The aim of a measurement should always be to be used as a management tool. During the
third stage it is also important to reflect if the measurement really is capturing what it should and if it
is fulfilling its purpose. In other words, a continual discussion of the measurements validity and

35
reliability is needed. In the end the measurement should be used to challenge the strategic
assumptions of the firm (Bourne et al. 2000).
3.8.2 The Balanced Scorecard (BSC)
In the beginning of the 1990s a multi company study lead David Norton and Robert Kaplan to create
one of the most used contemporary performance measurement system. They called it the Balanced
Scorecard since it was aimed at getting a balance between maximising shareholder value today and
at the same time reach the profitability goals of tomorrow (Kaplan & Norton 1996 p.2).
To reach the vision and strategic goals Kaplan & Norton (2001 p.76) describes an iterative
methodology were the executive management first has to decide upon the financial goals and who
the target customers are that can make the firm reach the financial goals? How can we internally
reach these customers and at which processes must we excel? How must our organisation learn and
grow in order to execute the internal business processes required?
The measures consist of the four perspectives described above and is normally displayed as in Figure
19 below. Olve et al. (1999 p.21) bring forth that the BSC actually has three time horizons. Yesterday
through the financial perspective, today through the customer and internal perspectives and
tomorrow through the learning and growth perspective.
Figure 19: The Balanced Scorecard (adapted from Kaplan & Norton 1996)
To implement the strategy properly Kaplan & Norton (2001 p.69) suggest that a Strategy Map should
be used in order to find the right objectives at each perspective. The basic of the Strategy Map is to
define a couple of the strategic goals and try to find the cause and effect relationship on how pushing
the right objectives in learning and growth perspective in the end can lead to financial pay off. One
main thought is that the pillars should contain its own strategic hypothesis and that they might even
”To achieve our
vision, how should
we appear to our
customers?”
Vision and
Strategy
-Objectives
-Measures -Targets -Initiatives
”To achieve our
vision, how will we
sustain our ability
to change and
improve?”
-Objectives
-Measures -Targets -Initiatives
”To succeed
financially, how
should we appear
to our
shareholders?”
-Objectives
-Measures -Targets -Initiatives
Financial
”To satisfy our
shareholders and
customers, what
business processes
must we excel at?”
-Objectives
-Measures -Targets -Initiatives
Internal Business processes
Learning and Growth
Customer
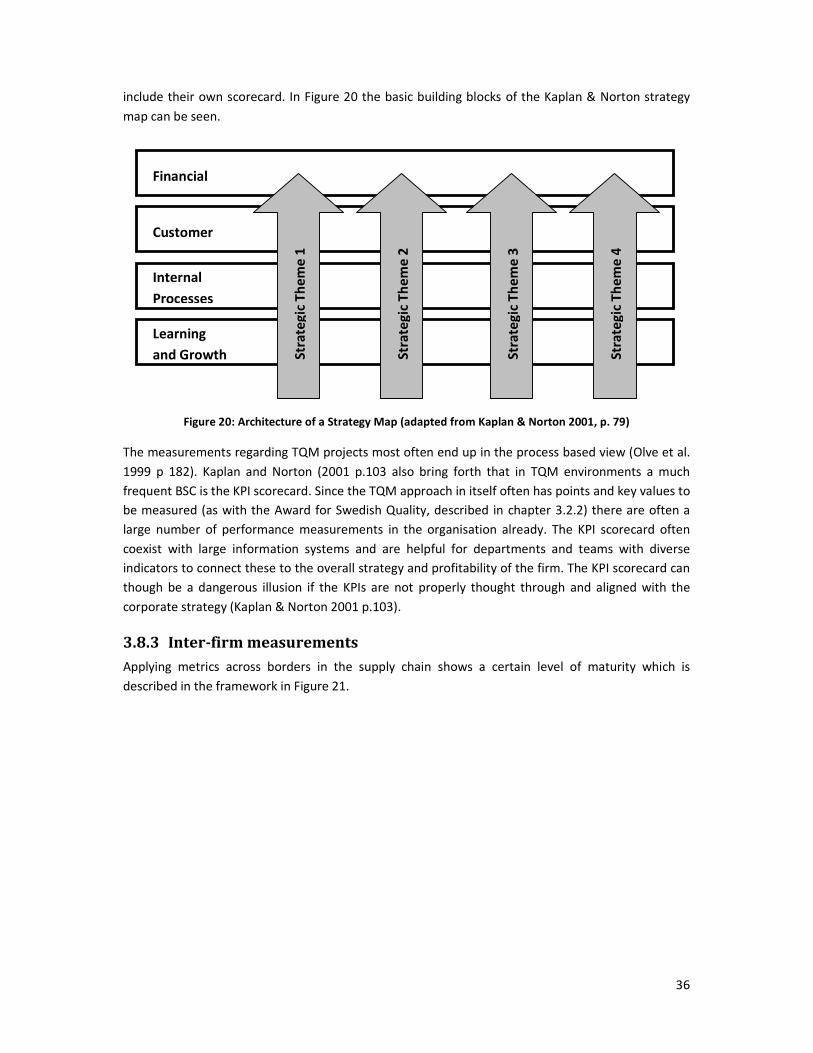
36
include their own scorecard. In Figure 20 the basic building blocks of the Kaplan & Norton strategy
map can be seen.
Figure 20: Architecture of a Strategy Map (adapted from Kaplan & Norton 2001, p. 79)
The measurements regarding TQM projects most often end up in the process based view (Olve et al.
1999 p 182). Kaplan and Norton (2001 p.103 also bring forth that in TQM environments a much
frequent BSC is the KPI scorecard. Since the TQM approach in itself often has points and key values to
be measured (as with the Award for Swedish Quality, described in chapter 3.2.2) there are often a
large number of performance measurements in the organisation already. The KPI scorecard often
coexist with large information systems and are helpful for departments and teams with diverse
indicators to connect these to the overall strategy and profitability of the firm. The KPI scorecard can
though be a dangerous illusion if the KPIs are not properly thought through and aligned with the
corporate strategy (Kaplan & Norton 2001 p.103).
3.8.3 Inter-firm measurements
Applying metrics across borders in the supply chain shows a certain level of maturity which is
described in the framework in Figure 21.
Financial
Customer
Internal
Processes
Learning
and Growth Str
ate
gic
Th
em
e 1
Str
ate
gic
Th
em
e 2
Str
ate
gic
Th
em
e 3
Str
ate
gic
Th
em
e 4

37
Figure 21: Maturity of Supply Chain Performance Measurement (Skjøtt-Larsen et al. 2007 p. 317)
In the ad hoc level no systematic use of performance measurements are used. When measurements
are used it is most often adopted to give senior management financial reports. On the second level
the company put focus on the inter-firm performance and here systematic efforts against process
orientation are starting to show. The third level emphasize that there can be a value in measuring
what happens outside the company in order to form processes that adds value. The performance the
company experience is often communicated to suppliers or customer but on this level the aim is to
optimise the focal company. Customers and suppliers are therefore not included in the
implementation of the measurement system. At the highest level the supply chain is seen as an
entity and implementation of measurement systems and optimisation action involves the entire
chain. This is also the view ISO 9004:2000 push with the following quote:
“Management should ensure that the organization has defined mutually acceptable processes
for communicating effectively and efficiently with its customers and other interested parties
[e.g. suppliers, authors’ comments]…The organization should have a full understanding of the
process requirements of the customer or other interested party, before initiating its action to
comply. This understanding and its impact should be mutually acceptable to the participants.”
(ISO 9004:2000, ch. 7.2, p. 29)
Lockamy & McCormack (2004) note that though it might seem tempting to skip one level to reach a
higher maturity it will probably be counter-productive. They claim that an organisation must evolve
through all the levels to establish a culture of excellence.
Cha
nge
of
para
digm
Cha
nge
of
para
digm
Supply Chain Focus Internal Focus
Investment
Ad hoc performance measurement
Continuous performance
measurement on unconnected
processes or areas
Focus on performance
measurement of inter-organisational activities/processes
Focus on performance measurements and management with
inter-organizational partners
Scope of system

38
4 Empirics
In this chapter information about Tetra Pak will be presented. The section comprises a more
general description of the company in the beginning as well as more specific information from the
actual areas of the dissertation. If nothing else is stated the information in the chapter comes from
Tetra Pak internal information combined with interviews.
4.1 Tetra Pak, background and organisation
In 1951 a subsidiary to the Package Material Company “Åkerlund & Rausing” was formed. It was
given the name Tetra Pak with regards to the tetrahedral shape of the milk and cream packaging
system that the company was inventing. The major benefits with the method were that the package
could be filled under the fluid level and the packaging material was lighter, cheaper and easier to
distribute than the bottles that were norm. In 1959 the development of a brick shaped package
started and its dimensions were adapted for international standard pallets (see Figure 23 in page 39
for package shapes). In 1966 the Tetra Rex could be seen in the store shelves. Innovation has always
been important for Tetra Pak and has resulted in a wide product range suitable for most types of
diary products as well as food, soft drinks, wine and cheese.
The company goal is to be a full system supplier which means that they want to deliver all the
products necessary for diary production. The main components are processing, packaging and
distribution equipment. When a production line is delivered to a customer, Tetra Pak also sells
packaging material and additional material as straws and caps. The company has a matrix structure,
but is in a simplified way organised as seen in Figure 22 below. The Headquarter is situated in
Lausanne, Switzerland and the two main sites are Lund, Sweden and Modena, Italy. The company
employs over 20 000 people worldwide.
Tetra Pak Group
Commercial Operations
Development & Engineering
Supply Chain Operations
Processing Systems
Clusters Clusters VPs
Human Resources Legal & Taxes
Corporate Communication
s
Business Transformation
Packaging Solutions Processing Solutions
Corporate Functions
Legal & Taxes
Figure 22: Tetra Pak organisation chart (www.tetrapak.com)

39
Tetra Pak is present in more than 165 countries across 5 continents. The Commercial Operations
consist of 11 Clusters that are subdivided into 43 MCs all over the world. The market where most
packages are sold is China where about 19 % of the total 137 000 million Tetra Pak packages were
sold during 2007. The proportion of packages per model is shown in Figure 23 below. These packages
were filled in the 9 143 packaging machines that were in operation in the end of the year. Of these
592 were delivered during the year.
Figure 23: Delivered packages during 2007 per product group (TC= Tetra Classic, TCA =Tetra Classic Aseptic,
TWA = Tetra Wedge Aseptic, TR = Tetra Rex, TPA = Tetra Prisma Aseptic, TB = Tetra Brick, TBA = Tetra Brick
Aseptic, TT = Tetra Top, TFA = Tetra Fino Aseptic, TRC = Tetra Recart)
The corporate motto is Protect what’s good and the strategy is presented with the following vision
and mission that can be found on global Tetra Pak homepage.
Our Vision:
We commit to making food safe and available, everywhere
Our Mission:
We work for and with our customers to provide preferred processing and packaging solutions for food.
We apply our commitment to innovation, our understanding of consumer needs and our relationships with suppliers to deliver these solutions, wherever and whenever food is consumed.
We believe in responsible industry leadership, creating profitable growth in harmony with environmental sustainability and good corporate citizenship.

40
The strategy that shall help the company to reach their vision and to complete their mission is concluded in three strategic priorities that has the following formulation:
• Focus on and grow our core
The cornerstone in this strategic priority is that resources are best used in the core activities. The core activities are described as “… where we make most of our money, where customers most appreciate what we sell and where competitors have most difficulties to compete” (Tetra Pak intranet).
• Emphasize cost driven innovation
This priority emphasise the importance of technological leadership and system performance increases with solutions that decrease cost for both the customers and Tetra Pak.
• Drive operational performance
The last one is aimed at doing things better, cheaper, and faster. The aim of this is to improving cost competitiveness, adding more customer value in propositions and to secure long term profitable growth.
Out of this strategic base, the company has put together four pairs of core values of how they want
their employees to act and how they want to be perceived. These are:
• Customer Focus & Long-Term View
• Quality & Innovation
• Freedom & Responsibility
• Partnership & Fun

41
4.1.1 Tetra Pak Supply Chain Operations (SCO)
The part of Tetra Pak that mainly will be discussed in this dissertation concerns the Supply Chain
Operations (SCO), Commercial Operations (CO) and D&E Organisation. SCO is divided into four main
areas and Novembal which is a subsidiary that produce caps.
• Supplier management: Control the supplier base and negotiate general purchase agreements
• Packaging Material (PM): Responsible for that the packaging material is produced and
delivered
• Additional Material (AM): Responsible for that openings and closures, straws and films for
the packaging material are produced and delivered
• Capital Equipment (CE): Responsible for that filling machines and distribution equipment are
produced and delivered.
These main areas are assisted by some supporting functions that will not be discussed in this
dissertation. The organisation chart can be seen in Figure 24 below.
Supply Chain Operations
Supplier Management
Packaging Material
Additional Materials Novembal
WCM Methods & Tools
Human Resources
Corporate Communications
Finance & Control
Capital Equipment
Figure 24: Supply Chain Operations organisation chart
4.1.2 Commercial Operations (CO)
Commercial operations consist of 43 MCs as stated earlier. Some MCs are fairly small and to help
these in the local context, The Clusters were formed. The purpose of the clusters is to achieve
economies of scale and synergies between similar markets. The Clusters are shown in Figure 25
below. The MCs are formed as profit centres and these are relatively autonomous from the main
company and can act accordingly to what is expected in their market. The Clusters are shown in
Figure 25 below. A MC can operate in several countries but are strictly directed to a specific market
area. The MCs are the face to the customer and the channel through which communication should
go.

42
Figure 25: Cluster map
4.1.3 Development and Engineering (D&E) and Platforms
As stated earlier D&E has a key position in the company and one quotation of founder, Ruben
Rausing that can be seen on much public material concerning the company is:
“Doing something that nobody else has done before is actually quite hard”
This quote emphasise the importance for Tetra Pak to offer their customers a value that is unique
and brings a better offer than the competitors. D&E is organised around four basic filling machine
platforms, supporting functions and of course development of packaging- and additional- material.
The platforms are actually five but only four are situated within D&E. The platform that is on its own
is Tetra Recart (TRC) that develops paper based substitutes to tin cans and equivalents for food
packaging. The reason that this division is on its own is that the filling procedure is completely
different then of the rest of the platforms who use a continuous filling method under the liquid level.
TRC is filled one by one and are then heat treated. This uniqueness has resulted in that the TRC
platform is placed under the commercial operations. The other platforms are:
• Carton Value: By far the largest in terms of installed base. Typical product groups are Tetra
Brick and Tetra Prisma. Based in Lund and Modena.
• Carton Economy: Especially popular in developing countries. Product groups are Tetra
Classic, Tetra Wedge and Tetra Fino. Based in Lund.
• Carton Bottle: Characterised by an in-line injection moulded top. Product group is Tetra Top.
Based in Lund.
• Carton Gable Top: Popular on the North American market. Product group is Tetra Rex.
Currently based in Minneapolis, USA but moving to Lund.

43
As seen in Figure 26 below a full packaging system means more than a filling machine, which by the
way is the one in the middle with a service platform and a ladder. First comes the processing
equipment and after that is the distribution equipment that put the cartons into crates and onto
pallets. It might also wrap the pallet in plastics, or what the customer might want.
Figure 26: Complete system for packaging of beverage
4.1.4 Tetra Pak CE’s supply chain
Once a filling machine has been released on the market the Supplier Management organisation make
contracts with the different component suppliers that will be used for the specific model. The
components are thereafter assembled to modules by module suppliers. After this all modules are
shipped to a Tetra Pak facility for assembly and testing. When the machine has passed the test it is
disassembled and sent to the customer for installation. Once the installation phase is done it is Tetra
Pak Part Supply Chain (PSC) that is responsible for after sales of spare parts. The actor towards the
customer is though always the local MC.
Tetra Pak PSCTetra Pak PSC
Figure 27: The Tetra Pak CE supply chain
44
4.2 Total Quality in Tetra Pak
Tetra Pak do not have an outspoken way on how quality should be dealt with. When looking at
different documents and speaking with key quality personnel a Tetra Pak quality definition can
though be found. Under the headline “quality and Innovation” in the companies core values the
following can be read:
“We do not compromise on quality. We relentlessly drive for better, fit-for-purpose
solutions…”
The quote above combined with the vision to “…make food safe and available, everywhere” and in
the interviews done most people mean that it is the customer, and the end consumer that is in the
mindset of quality.
The importance of quality has been put higher up on the agenda for the last couple of years in the
company and a Quality Vice President in D&E recently has been appointed who is reporting direct to
CEO, Dennis Jönsson. Quality issues has always been something that is supposed to be prevalent in
every workers mindset, but to increase the prevalence in the SCO-CE department a Total Quality (TQ)
department was set up a few years ago.
With the motto; “In everything we do we strive to do it better” the TQ department expanded much
during the last two years. The department work in two main groups. One is aimed at working with
TQM at the platforms and there are team members permanently stationed at each platform in order
to drive different aspects of quality. The work at different platforms is though a bit different
depending on how quality work has been conducted there before and what quality aspects that
needs to be addressed the most. The other group work with Total Quality Supplier Management.
They have two main parts. Supplier Quality Assurance (SQA) that follow up on issues with non-
conforming components with the suppliers and Supplier Development Engineers (SDE) that work
with continuous improvement and follow ups of the suppliers.
4.3 The Claim Process
According to Tetra Pak vocabulary a claim is issued when a part fail to conform to what is guarantied
at the customer site and the customer demand compensation. This can for example be that
something in the machine breaks down during the first year when the machine is under warranty, or
when a spare part does not live up to its specified expected lifetime. Essential for the definition of a
claim is that the occurrence must have taken place at the customer site. If a problem of conformance
is found within Tetra Pak it is called Non-Conformance NC and will be explained in chapter 4.4. The
process a claim goes through will be described below. Process charts can be seen in appendix 1 and
might aid the reading. The process is controlled by a Tetra Pak document called PM 9820.10. This
document describe the rules for handling claims within Tetra Pak and is intended for internal use this
can be what type of documentation that is required, what costs the platform will accept or what time
a claim is accepted at each stage. How to act towards the customer is a matter for the local MC and
in this relation it is firstly local legislation and the terms and conditions specified in the sales contract
that decides what obligations Tetra Pak has.
In Figure 28 below the share of the total number of accepted claims in Tetra Pak that are allocated to
each business unit. CE, PM, AM, MC and TRC (see chapter 4.1) has been explained earlier. PSC –

45
discrepancies is logistics failures. Processing is responsible for everything that can be found before
the filling machine in Figure 26.
AM
2%
PSC -
discrepancies
5%
TRC
1%
CE
40%
PM (KPI & R/3)
18%
Processing
4%
MC
30%
Figure 28: Claims accepted per business unit (2008 PLC KPI summary Q3 final)
In Figure 29 below statistics for incoming claim at Tetra Pak Capital Equipment can be reviewed. Of
the CE claims received by Tetra Pak during October 2007 to September 2008, 2 % (1,8 % for all types
of claims) got rejected by the MC. The MC also accepted and paid 22 % (27 % for all types of claims)
of the claims. These claims were either considered caused at the MC or rejected by another business
unit from where the claim originated according to the MC. To accept a claim and not passing it on to
the business unit can have several reasons. The MC can have a specific contract with the customer or
acting under legislation that gives the customer more expanded rights than what the producer can
accept. The claim can be accepted by goodwill reasons though it may not be a claim from a pure
regulatory view. To accept a claim and not send it to the manufacturer can also be a result of the
performance measurement used, since the MC is measured on how many claims that they pass along
gets rejected. If the MC is not sure the claim will pass they therefore will be more reluctant to pass it
on to its rightful owner. Those claims forwarded and accepted by the platform made out 76 % of the
total amount incoming. Of these 62 % was taken by Carton Value, 5 % by Carton Bottle, 3% by Carton
Economy, 4 % by Carton Gable Top and 1 % is not associated to any of the platforms.

46
CE Claims Overview (not Processing or TRC)September 2008 (Rolling 12 months)
Associated to Platform/MC
Claims & disc taken by MCClaims covered by MC
6%Rejected claims by Platform/SCO-CE
22%16%
CV ClaimAccepted claims by MC Accepted claimsby Platform/SCO-CE
62%98% 76%
CB5%
CE3%
CGT4%
Missing cat & Other1%
Rejected claims by MC2%
98%Customer Claims Market Company claims
98%100%
Figure 29: CE Claims overview with rolling 12 month data (Claims2008)
During the installation of a filing machine there is higher occurrence of claims than later in the
lifecycle. During the first few moths there is always a Tetra Pak technician at the site, making sure
that the machine is tuned in properly to the customer’s needs and environment. Due to this the
claim does not always have to be caused by wrong design or that the supplier’s quality was low. It
can be caused by a part being installed wrong, bad settings or any other malfunction that is caused
by the installation process itself. The discrepancies also add up to this since logistics failures most
often are found early in the process. After the first months of fine tuning, in order to adapt the
machine to the environment, the number of claims coming from it normally decrease to the standard
claim frequency for that machine type.
The trend is the same when it comes to spare parts. When all capital equipment claims are revised
and cleared from values from parts with more than 2000 hours runtime the resulting histogram can
be seen in Figure 30. The only reason for clearing for higher values is to get a better visual
presentation. The trend goes steadily down also after 2000 hours.

47
Histogram
10
70
130
190
250
310
370
430
490
550
610
670
730
790
850
910
970
10
30
10
90
11
50
12
10
12
70
13
30
13
90
14
50
15
10
15
70
16
30
16
90
17
50
18
10
18
70
19
30
19
90
Machine Hours
Num
ber o
f Cla
ims
Figure 30: Distribution of claims after part run hours (h < 2000) (SuppliersNCs+Claims_200810)
We can see that the vast majority of the claims come early. The high peaks are due to that the
runtime hours are inserted manually by the service technician and around 100, 250, 500, 1000 and so
forth comes natural round off points. The numbers in the chart should be used with caution since
they are calculated from two sets of numbers that is not always correct.
4.3.1 Customer
MC CustomerPlatformSupplier
SCO
765
1234
When a machine breakdown or part failure occur the machine operator and/or an internal technician
make an initial assessment whether the issue can be solved internally or not. This results in that the
customer either tries to analyse, troubleshoot, secure spare part and solve the issue themselves or
that they bring in Technical Services from the MC to do this for them. If the problem can not be
solved by the technicians from the customer or the MC, expertise knowledge from within the cluster
should be used first, and if this does not solve the problem, additional help can be found at the
platform to which the machine belong. In extreme cases the platforms technical support can send

48
their own technicians, who are experts on a specific machine, within hours if a resolution can not be
found over the phone or email.
Customers are supposed to have a small stock of spare parts that are recommended from Tetra Pak.
If a required part can not be found at the customer, the search continues at the MC spare part stock.
If the part can not be found in the area the distribution centre in Lund or one of the two regional
distribution centres in Asia are contacted. If the case is emergent PSC personnel can take the
requested spare part under the arm and jump onto the next plane to the diary where the part is
needed. This happens a few times per week.
When the problem hopefully is solved the customer and/or the MC technician has to find out if the
breakdown was caused by poor maintenance, mistakes in handling, or supply chain related. If the
root cause is assumed to be supply chain related and the customer wants to be reimbursed for its
cost, a claim is issued by the customer or the technician.
The costs incurred by the customer can be very diverse depending on the customers’ organisation of
production. In some cases customers have very effective production and little room for delays. In
other cases customers has overcapacity with more machines installed than they need. Customers
invest in higher capacity than needed when they, for example want to be able to handle volume
demand changes or minimise risks due to breakdowns. The cost also varies depending on if the filling
machine is aseptic or not. In aseptic machines even a very short stop in production can result in that
the line has to be stopped and washed before production can be resumed. Depending on what
country and culture the machine is operating in there can also be large differences in what costs the
customer might incur.
During the interviews with Customers and Tetra Pak personnel close to the customers were asked for
cost drivers during breakdowns. The costs can be divided into direct losses that are an immediate
result of the failure, or indirect losses that comes as a consequence. The most important direct losses
are:
• Extra washing of the machine • Customer technician
• Waste of product in line • Sorting pallet
• Scrapping products • Extra product testing
• Lost production time
While the indirect or consequential costs are:
• Claim administration • Consequential overtime production
• Raw material consequential losses • Lost sales
• Fines for inability to deliver • Marketing loss, Badwill

49
An earlier study within the company has suggested that the customer cost for quality issues are four
times higher than the cost suffered within Tetra Pak. This number though relate to the entire
company and not Tetra Pak CE specifically.
4.3.2 Market Company (MC)
MC CustomerPlatformSupplier
SCO
765
1234
All claims that reach the MC must be registered in SAP R/3. This is due to that decreasing the total
number of incoming claims is a KPI used in large parts of the company. Some MCs has employees
that only work as claim handlers or claim engineers, but most work only part time with claims. The
registration must be done in the corporate language which is English. This can cause problems due to
the language barriers in some countries. Often it is the case that the Tetra Pak service engineer has
written the claim in the local language and then the information might pass through one or more
channels before the claim administrator, whom often has lower technical skills, translate the claim to
English when entering the information into SAP R/3. When all relevant and needed information is
transferred into SAP R/3 an assessment of the claim is made in order to decide if the claim should be
accepted (given the status CLAA) or not (given the status CLAR). The claim handler is always
supposed to make a decision so that the customer will not have to wait for deeper technical
investigation before acceptance or rejection, but it happens that claims are sent without a decision
to the assigned Platform if the claim handler is not sure what to do. In those cases they let the
experts make their assessment before they give an answer to the customer. If the claim is caused by
a logistic failure it is called a discrepancy (given the status DIS) and will be sent to PSC. If the MC
refuses to accept responsibility the claim will be closed and the customer informed. If the claim on
the other hand is accepted, a credit note is created. On the credit note, the customer can be
compensated for the cost of a new part, the collateral damage the machine suffered from due to the
break down and the cost for Tetra Pak Service Technician or a Customer Technician who is accepted
and approved from Tetra Pak. It happens that the customers also gets “free of charge” parts and
service, but then the costs is not properly captured by the accounting system so this is not a
promoted procedure.
When a claim is accepted by the MC the customer can allege their right for compensation of its direct
costs, which are in the credit note and caused by the failure. These costs are discussed between the
customer and MC and agreed upon. After this the Key Account Manager (KAM) and the Technical
Operations Manager (TOM) signs an official letter (One off letter) that state the customers right to
compensation and its size. Then the customer sends an invoice on the specified amount to Tetra Pak.
Normally the customer has better chances to get reimbursements for additional costs from Tetra Pak
when the filling machine is still under warranty, than when it is a consumable item that does not
survive its expected lifetime.
The number of claims sent in, differs much between MCs. The frequency an MC send in claims can
depend on a great variety of factors and the number of claims sent in compared to machines in use
can be seen in Figure 31 below.

50
Greate
r Chin
a
Sout h
Eur
ope
Centr a
l & S
outh
Am
erica
Greate
r Mid
dle E
ast
Centra
l Eur
ope
East E
urope &
Cen
tral
As ia
Nort h
East
Asia &
Oce
ania
South
& S
outh
east A
s ia
North A
merica
North
Eur
ope
Sub S
ahar
a Afri
ca
Cluster
Tot
al n
umbe
r of m
achi
nes
in p
rodu
ctio
n
Filling Macines 31-12-2007 Distribution Equipment 31-12-2007 Number of claims reported
Figure 31: Comparison between installed base and claims filed in different clusters
One of the most basic differentiators comes with the natural quality assumptions in a country. In
Japan fore example, the general assumptions are that no errors are acceptable and all efforts should
therefore always be to reach zero defects. In other countries the language barrier is so influential,
that it requires claims that can give the MC substantial reimbursements to make it worth the high
efforts to translate a complex technical error description to the company language English. Other
important factors are naturally, installed base, type of machines and their age. Of the hundred most
expensive claims settled 2008 Q1-Q3 that can be found in the Total Cost of Claims report, the only
claim that did not come from Europe, North America and Japan came from Brazil. In Figure 32 the
ten most claiming countries during a year can be seen.
The ten most claiming MCs Q4 2007 - Q3 2008
0%
5%
10%
15%
20%
25%
30%
Ger
man
y
Japa
n
Brazil Ita
ly
China
Sweden
Spain
Russia USA
Mex
ico
Figure 32: The ten most claiming MCs Quarter 4 2007 – Quarter 3 2008 (claims2008)

51
4.3.3 Platform/SCO-CE
MC CustomerPlatformSupplier
SCO
765
1234
At platforms the claims are handled somewhat different, but in order to give a good overview a
simplified generalised process is here described. The platforms have people specially assigned to take
care of the initial handling of the claim. When the claim coordinator receives the claim an initial
screening is made to make sure that all rules in PM 9820.10 has been followed. If not, the claim is
rejected and sent back to the MC for closure. This can also be done later in the process, for example
if requested information or parts are not retrieved within the accepted time frames. If everything is
ok the claim is assigned a code that describes what organisation that will be in charge of the
investigation and not who is responsible for the error. Until November 2008 Tetra Pak used the term
Root Cause Owner instead of Root Cause Investigator. The codes being used today are:
• 41. Production failure: Platform responsible for investigating if the internal mounting and
testing has caused the error.
• 42. Production failure: Platform responsible for investigating if the module supplier has
caused the error.
• 1. Design failure: Platform D&E responsible for investigation of in-house designed
components
• 31. Commercial components: SCO-CE responsible for dealing with the liable supplier
• 32. Manufacturing failure: In-house drawn components, manufactured by suppliers, that
fulfil internal requirements, but the supplier have not been able to reach conformance. SCO-
CE normally lead the investigation
• 73. The investigation is lead by a MC
• 74. For claims of low value or unclear origin. These are under observation and not handled
until recognised as a true quality issue
Simplified the claim can be seen as taking two routes, either it stays at the platform or it is
transferred to SCO-CE if it is a component where the root cause origins at the supplier (31, 32, 41,
42). The two routes however handle the claims somewhat consistently. Most often more information
is required from the MC for a proper analysis. To know what information is needed and to make the
analysis the claims administrator is frequently aided by an experienced technician. At some platforms
the claim is handed over to an expert technician for handling and decision making straight away. In
50-90% of the cases, depending on the claims handler, the part that is claimed has to be sent to the
platform or SCO-CE. When all relevant information is gathered the analysis is made in order to decide
if responsibility for the claim should be taken (given the status CPAA). If responsibility is taken the
MC will be reimbursed with the cost of the claimed part and the service cost. If the claim is not
accepted at the platform/SCO-CE it gets the code (given the status CPAR).
52
The difference between if the root cause is found internally or externally is that if the root cause is
found at a supplier a Supplier Quality Assurance Manager (SQA) take over the claim from the
administrator and face the supplier in order to get a Root Cause Analysis (RCA). This can for example
be done with a 5-why analysis. In the internal case the same is done within the claim analysis activity
which includes the technical expertise on the platform. When the root cause is found and a decision
to accept or reject the claim is made the MC is notified and supposed to close the claim. Sometimes
the MC does not accept the conclusions form the Platform/SCO-CE and they can then start a dispute
and escalate the claim in order to show something that is wrong in the process.
After the claim itself is closed, a corrective action can be started if the issue is serious enough. In 4.5
this part of the chain will be presented. At the SCO-CE it is the SQA that is responsible for working
with the supplier and find a solution that will make sure that no more non-conforming products will
reach the market. Within this responsibility lies the obligation to check the Tetra Pak spare part stock
and make sure that no more defect products that might be in stock will reach customers.
It is important to note that there are very high differences in the scope of work from one claim to
another. Many claims are reoccurring and the platforms continually update lists with known issues
on their machines. For claims with a root cause that can be found in the known issue list the handling
and analysis will naturally be much more rapidly handled in the chain. Sometimes it is the other way
around and the root cause is not known and very difficult to find. These issues might be sent back
and forth within the organisation and it can be difficult to get a specific group to take responsibility
to resolve the case when the feel that the fault is not theirs. In Figure 33 a histogram describing the
number of times one article is occurring during one year in the claims statistics. Nearly 50 % of the
claims come from an article that does not occur more than once in the official statistics. In just above
0,5 % of the cases an article can be connected to more than 30 claims. On the other hand can 30 % of
the incoming claims so far during 2008 be related to known issue lists which makes the handling of
them somewhat simplified. In that root causes are already analysed and the administrators at the
platform already know what follow-up questions to ask. When looking at this statistics it is though
important to bare in mind that just because an article occur twice does not mean that the root cause
is the same both times.
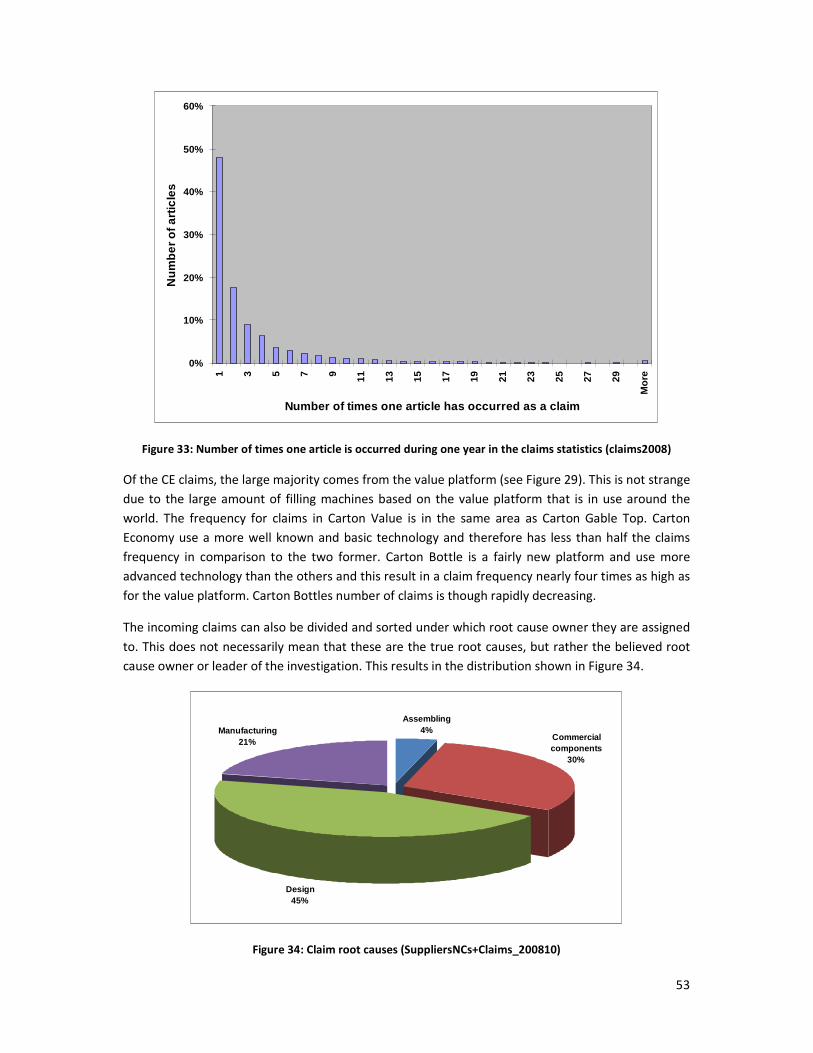
53
0%
10%
20%
30%
40%
50%
60%
1 3 5 7 9 11 13 15 17 19 21 23 25 27 29
Mor
e
Number of times one article has occurred as a claim
Num
ber o
f arti
cles
Figure 33: Number of times one article is occurred during one year in the claims statistics (claims2008)
Of the CE claims, the large majority comes from the value platform (see Figure 29). This is not strange
due to the large amount of filling machines based on the value platform that is in use around the
world. The frequency for claims in Carton Value is in the same area as Carton Gable Top. Carton
Economy use a more well known and basic technology and therefore has less than half the claims
frequency in comparison to the two former. Carton Bottle is a fairly new platform and use more
advanced technology than the others and this result in a claim frequency nearly four times as high as
for the value platform. Carton Bottles number of claims is though rapidly decreasing.
The incoming claims can also be divided and sorted under which root cause owner they are assigned
to. This does not necessarily mean that these are the true root causes, but rather the believed root
cause owner or leader of the investigation. This results in the distribution shown in Figure 34.
Assembling4%
Design45%
Manufacturing21% Commercial
components30%
Figure 34: Claim root causes (SuppliersNCs+Claims_200810)

54
4.3.4 The supplier
MC CustomerPlatformSupplier
SCO
765
1234
The supplier is always required to do a RCA when requested from an SQA. How this look is very
different from supplier to supplier. Tetra Pak has many small suppliers that work on ad hoc basis
when it comes to quality flaw finding and trouble shooting. Large suppliers have more often
systematic ways to handle RCAs. For example can Rockwell Automation be mentioned as they claim
that an industry standard time for conducting a proper RCA is around 8-10 hours. There are also
cases when suppliers have spent up to hundreds of thousand on RCA and RC eradication on a single
case. Sometimes there can be discussions on whose fault the failure is. This can be the case when, for
example, suppliers have been shifted, drawings have been changed or any other circumstance has
changed that one of the included parties not been aware of. Often the RCA is conducted
cooperatively between the supplier and Tetra Pak in order for a good information exchange to be
made and to help the supplier to make corrective actions and improve their production system. This
is often the case with small suppliers that does not have a structured way to deal with the problems
themselves and therefore need assistance. If a supplier needs to make corrective actions in order to
prevent the problems the cost will naturally increase substantially but this is of course very
dependent on the situation.
The authors wants to clarify that the RCA mentioned above follow the description from the
corporate process charts. These describe what actions should be done before the claim is closed.
When interviews with SQAs and suppliers has been cunducted it seems more accurately to transfere
much of what is described above to chapter 4.5.2 that describe corrective actions. Infact it seems as
the suppliers most often just accept the issue as a goodwill action without any deeper analysis and
consider it as a one-time-occurrence. As seen in Figure 33 in page 53 this is most often the case.
There are also companies that does investigation for each issue sent to them, but these seem to be
few. More investigation in this area is though required to get high reliability.
4.3.5 Supplier reimbursement to Tetra Pak
MC CustomerPlatformSupplier
SCO
765
1234
Today the only way that suppliers can reimburse Tetra Pak is by sending a credit note on the broken
part or by delivering an extra part free of charge with the next delivery. Credit notes are highly
uncommon and even though the suppliers sometimes send a single spare part as compensation,
Tetra Pak has no work processes to deal with these types of deliveries, so almost all items sent to
Tetra Pak end up in the garbage. In some specific cases the items can be used by product
development. Other than this the supplier does not reimburse Tetra Pak for their quality failures
concerning claims.

55
4.3.6 The cost reimbursement to Market Company
MC CustomerPlatformSupplier
SCO
765
1234
What gets reimbursed to MCs from the Platforms/SCO-CE is strictly controlled by PM9820.10. For a
accepted claim the MC has the right to be compensated for the internal price for the broken part,
eventual collateral damage and the problem solving time spent at site by an admitted technician (see
Figure 35 in page 56). The Platform/SCO-CE never takes responsibility for consequential losses at the
customer or transportation costs for transports of broken parts back to the investigator.
It is important to note that real money is not transferred if the total claimable amount does not
exceed €10 000. The transfer then only takes place in SAP which means that it is only the
management accounting that gets affected.
4.3.7 Cost reimbursement to customer
MC CustomerPlatformSupplier
SCO
765
1234
The basic thought of a claim is of course that the customer always should be eligible to have a
product with full functionality during the period coerced by law or contract. The customer is always
reimbursed for the costs they might have had for buying parts and for the time spent by Tetra Pak
technicians, if the claim is accepted. What is compensated more than this is though independent for
each MC due to the decentralised structure of the CO organisation in Tetra Pak. In Figure 35 below a
schematic picture of how MC Sweden reimburses their customers can be seen. The pyramid shape
comes from how the claim engineer at MC Sweden illustrates the costs associated to each category
where the indirect customer costs, which never get reimbursed by Tetra Pak, are by far the largest.
The direct costs that can be reimbursed are for example customer internal costs for inspecting,
repairing and recovering the packaging equipment. It can include costs for consequential damage as
wasted packed production, wasted unpacked product, destroyed packaging material and the costs
for sorting and for the time the production has to stand still due to production stops caused. In other
countries the image is very similar on the lower part of the pyramid. The differences that can be
found lies in the upper part of the pyramid. For example MC Italy is willing to reimburse the cost for
extra shifts if it can be proven that it was needed. In some countries with less bureaucracy and
regulation, the customer relation may be very dependent on what gets reimbursed to the customer
and the principle for it is more ad hoc.
56
Not paid
to
customer
Paid to
customer if
accepted by
MC
Platform/
SCO-CE
reimbursement
Not paid
to
customer
Not paid
to
customer
Paid to
customer if
accepted by
MC
Paid to
customer if
accepted by
MC
Platform/
SCO-CE
reimbursement
Platform/
SCO-CE
reimbursement
Figure 35: Cost imbursement to customers and MC (Hanzon)
The internal Tetra Pak routes for claims are somewhat different if the customer wants very high
reimbursements. When the amounts requested are very high, MC and Cluster management has to be
informed and active in the decisions made. In some cases even the CO management can be included
in these types of decision. These high value claim often concern equipment that do not perform at
the level that was stated in the sales agreement.
One problem with the customer compensation is that the MCs do not always know how much is paid
out. This is because the compensation does not always follow the Tetra Pak rules. Sometimes
customer get compensation from Key Account Managers that go beyond the rules and guidelines and
then these costs are hidden in the accounting. Also adding up to this problem is that SAP R/3 has not
given the possibility to track these costs earlier. After a change in December 2008 it will be possible
to associate customer compensations to specific clams in order to track these cost.
4.4 The Non Conformance (NC) Process
In Tetra Pak a NC has occurred when a failure to conformance has been found before the product has
reached the customer. This can be within Tetra Pak, when the filling machines go through the final
testing, or at a module supplier. Unfortunately not all module suppliers report NCs. The suppliers of
distribution equipment, for example, do not report any NCs to Tetra Pak. A NC is always caused by
some of the earlier parts of the supply chain. When a failure is found in-house and caused by the
internal handling the issue is corrected and logged as an internal NC in an internal production
information system and not in SAP R/3. However a majority of the NCs are supplier related. NCs that
are found at module suppliers are forwarded to Tetra Pak CE by some suppliers, but these will not be
included in this dissertation.
57
Claims are much more common than NCs and the ratio between the two is near 10:1 for all CE claims
accepted by the market company. During machine assembly, when the filling machines modules are
assembled by Tetra Pak CE, the distribution of the root causes can be seen in Figure 36. The statistics
from the NC process are captured by the SCO-CE organisation and used together with the claims data
in supplier evaluations and discussions. In this data Carton Bottle NCs are missing since their
numbers are registered in a separate system.
Comercial components
40%
Manufacturing14%
Assembly46%
Figure 36: NC root causes from machine assembly (SuppliersNCs+Claims_200810)
4.4.1 Platform and SCO-CE
P la t f o r mM o d s u p p
S C O
C o m p s u p p
43
12
NC comes from two different directions currently. Either they are Tetra Pak internal where the final
machine assembly and testing is done or it comes from one of the module assembly suppliers that
Tetra Pak use since none of the modules that go into the machines is put together by Tetra Pak
themselves. From the distribution equipment assembly no NCs are collected since this process is
outsourced. In the process chart in Appendix 2: Process charts over the NC process, the process for
external NCs can be seen. The process with internal NCs looks somewhat similar but since the
internal structure is what is most important and easy to influence for Tetra Pak, this is what will be
analysed here.
First a production engineer working with the assembly of the modules and testing of the machine
realise that something is wrong. They find out what might be the problem, register the loss and
notify a product technician. The production technician analyse the problem and decide if the
problem is a NC. If it is a NC the supplier is made aware of the issue. If it is only an assembly issue and
something has been mounted wrong, no new part is needed. Then the production engineers correct
the error, the production technician register the NC in SAP R/3 and request the supplier for a root
cause analysis (RCA). If the issue, on the other hand, demands that a new part is ordered, this is first
done before the issue is registered. If the module supplier can not ship the component themselves
they have to make sure that their component supplier does this. When the new part is delivered and
58
the production engineers can resume their work the faulty part is delivered back to the supplier, who
at the same is time requested to do a RCA. The Production technician then take part of what the
supplier has concluded and states its validity. Often the RCA is done with 5-why analysis or similar
systems. If the RCA is satisfying the NC is closed.
During the internal assembly a NC can be found already when the modules are mounted together
and a production engineer sees that something is wrong. It might also be found during the final
testing. During the final testing the filling machine has to work without problems for a certain
number of hours depending on what system is tested. When a NC occurs in this stage the testing has
to be stopped and restarted first after the issue has been solved. This results in that a machine has to
stand still and wait for new parts. Often the production engineers can help their fellows on other
machines that are being assembled at the same time, but sometimes there will naturally be waiting
times when no other job can be done. Another approach to handle the waiting time can be to steal
the part that is needed from a similar machine that has a later shipping date and place the part that
comes from the supplier in the machine the part was stolen from instead. This will decrease the
waiting time, but increase the time for rework.
4.4.2 The supplier
P la t f o r mM o d s u p p
S C O
C o m p s u p p
43
12
The supplier is always required to deliver a new part as soon as possible if requested. Normally parts
are delivered within a day. It is always the module supplier that is responsible for the module
delivered and all its components. Therefore it also includes the responsibility for that component
supplier’s deliver parts with the specified quality requirements. Due to this, NCs concerning a faulty
part is always sent to the module supplier in order to handle the loss against the component
supplier. Since it is Tetra Pak who dictates the contracts from which the module supplier makes call-
offs from, there has been complaints from large component suppliers that deliver parts to several
module suppliers that the feedback is fragmented and not consistent.
Suppliers are always required to do a RCA when a NC is supposed to originate at their facilities. This is
done in order for the supplier to take corrective actions to prevent reoccurrence. One Tetra Pak
manager claimed that module suppliers spent about 2 hours on each RCA and then they normally
have follow-up sessions with the employees in production in order to prevent reoccurrence. Tetra
Pak does follow ups and audits the supplier to make sure that the actions taken by the supplier is
followed.
4.4.3 Supplier internal financial transactions
P la t f o r mM o d s u p p
S C O
C o m p s u p p
43
12
The financial transactions between component and module suppliers are an important part of the NC
process. Due to the fact that it is the module suppliers that have the contact and control the process

59
towards the component supplier, this is specific for each module supplier. All these can not be
covered in this dissertation and are therefore left out for further studies in the future. One point that
can be noted that there often is a fairly large difference in size and power since many of the
component suppliers are large global companies like SKF, Bosch and ABB, while the module suppliers
are fairly small in comparison.
4.4.4 The supplier reimbursement to Tetra Pak
P la t f o r mM o d s u p p
S C O
C o m p s u p p
43
12
Module suppliers reimburse Tetra Pak with a new part if needed and they also reimburse for the
time Tetra Pak needed in order to find and fix the issue. Besides from this Tetra Pak demand an
administrative fee that is supposed to cover for the costs of handling the NC at Tetra Pak.
4.5 Prioritisation and corrective actions
A corrective action is the main method to address a quality issue, but there are many claims that
never result in an action to prevent reoccurrence. To choose which quality flaws corrective actions
should be targeted at, prioritisations are made.
4.5.1 Prioritisation
When a root cause to a claim or a NC has been found the article is under supervision of the platform
or SCO-CE, depending on who is in charge for the investigation. After this those claims with a claim
frequency of at least five occurrences during two months, or ten in eight months are inserted in a
prioritising tool. This is done in order to decide where corrective actions will add most value to the
company, or more likely were to direct efforts in order to prevent as much damage as possible for
Tetra Pak.
Each platform and the SCO-CE have their own tool for prioritising and the Value platform has two,
due to share size and that the platform has D&E in both Lund and Modena. The prioritisation tools
have the same foundations and are built around the same principles in the different business areas.
The foundation and basics variables of the prioritisation tool which can be seen in Table 6. The
variables are weighted out of its severity and the highest weights are of course received by safety
and legal demands. These have several hundreds times higher weight than the other in order to
always be top prioritised. This is natural since it is food and beverage the company is dealing with.
When components and modules become obsolete they get very high prioritisation in order for
customers to have an updated, good performing installed machine and to make sure that, old and
non-conforming spare parts does not reach the market. Cross boundary issues come from the annual
customer surveys and deals with improvements that are asked for, but which can not be solved by
the clusters alone. In these cases a cross boundary team is set up in order to solve the issue and
speedy resolutions are of greater importance than with normal claims. The key accounts have much
to say in Tetra Pak, so issues that originate from them have higher impact on what should be done
than when the issue is raised by a non key account customer. The claims are though normally only
prioritised by the number of occurrences. The claims and the rest of the variables do not in
themselves create a higher weighting in the priotools, they are merely used as decision support. With
60
claims the SCO-CE also use a subjective variable called customer impact, which is coded as high,
medium or low after what the SCO-CE employees believe is reasonable. It should also be noted that
it is only around 20 % of the corrective actions started that originates from claims. The rest come
from, for example e-liaison, which is a technical help shortcut to the platform, Request for quality
action (RQA), which is handled through SAP R/3 just like claims and other entries can also be used to
come into the prioritisation tools.
Table 6: Criteria, measures and importance of technical issues prioritisation
Criteria Measure Degree of importance
Safety By-pass the prioritization Prompt remedial action
Legal demands By-pass the prioritization Prompt remedial action
Obsolete By-pass the prioritization Prompt remedial action
Cross Border Issue Yes/No High
Key Account Yes/No High
Claims Number High
Package performance Appearance/Functionality High
Hygiene performance Yes/No High
Product plan Remaining years of PLC High
Installed base % affected High
Available production time Minutes improved Medium
Mean Time Between Failure Hrs Medium
Mean Time To Repair Minutes Medium
Maintenance cost impact /1000 packs (L3) Medium
Cost of waste /1000 packs Medium
Cost of packaging/additional mtrl /1000 packs Medium
CE Standard cost reduction Low
Machine deviation impact Degree of extent (low to extensive) Low
4.5.2 Corrective actions
Before a corrective action can start, a business case has to be done in order to capture the benefits
for the customer and Tetra Pak to install a rebuilding kit or to do other types of corrective actions for
the customers. Normally the business cases only compare what costs that can be saved at the
platform when claims will decline with the costs of doing corrective actions. If the solution might take
much time and effort to implement at the customer, the customer implementation costs are also
considered.
When it has been decided that a certain corrective action should be started, one person is assigned
as responsible for that the project is moving forward. The corrective action has different stages
which it has to go through in a structured manner. These stages can be seen in Figure 37. At the first
tollgate the aim is to identify and clearly define the root cause in order to have a good foundation in
the continuing work. At the following tollgate, the orange one, the solution to the issue is developed
and tested. At the yellow tollgate the solution has to be thoroughly tested and validated so that the
solution can be implemented safely at the green tollgate. When this is done and, for example when
the installed base has been updated with the proposed solution, the supplier has changed their
routines or part material has been changed, the blue tollgate is reached and the corrective action has
reached the finishing line.
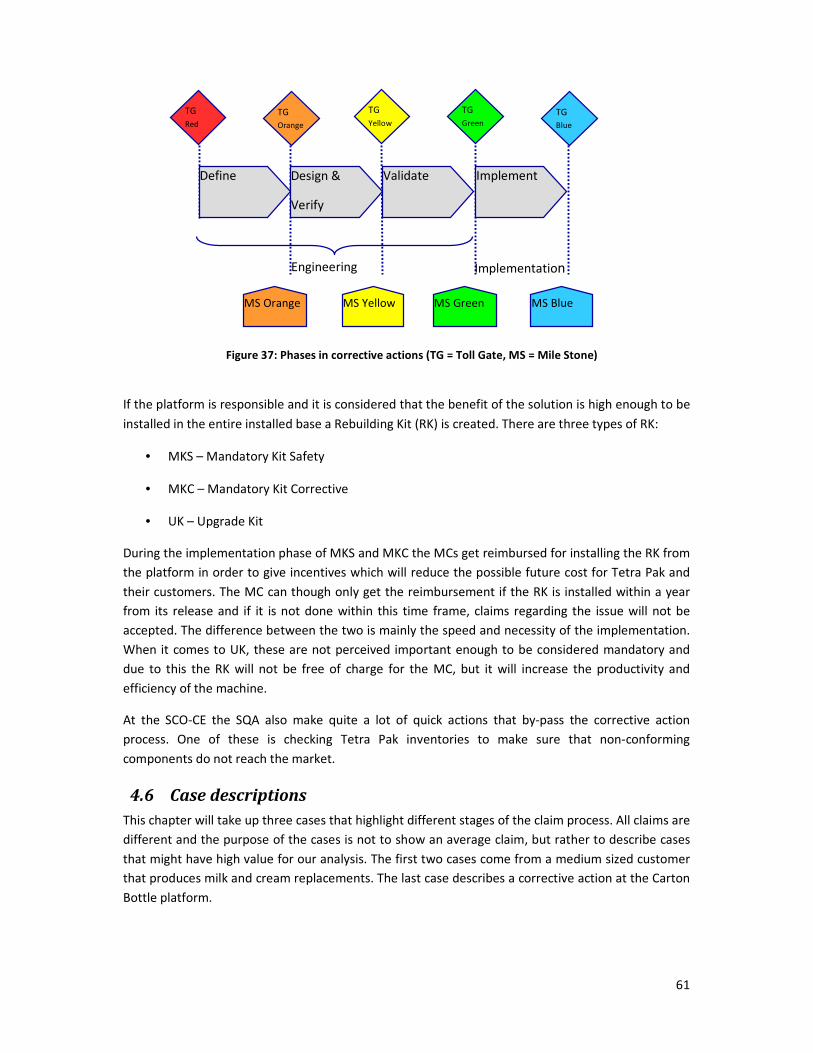
61
If the platform is responsible and it is considered that the benefit of the solution is high enough to be
installed in the entire installed base a Rebuilding Kit (RK) is created. There are three types of RK:
• MKS – Mandatory Kit Safety
• MKC – Mandatory Kit Corrective
• UK – Upgrade Kit
During the implementation phase of MKS and MKC the MCs get reimbursed for installing the RK from
the platform in order to give incentives which will reduce the possible future cost for Tetra Pak and
their customers. The MC can though only get the reimbursement if the RK is installed within a year
from its release and if it is not done within this time frame, claims regarding the issue will not be
accepted. The difference between the two is mainly the speed and necessity of the implementation.
When it comes to UK, these are not perceived important enough to be considered mandatory and
due to this the RK will not be free of charge for the MC, but it will increase the productivity and
efficiency of the machine.
At the SCO-CE the SQA also make quite a lot of quick actions that by-pass the corrective action
process. One of these is checking Tetra Pak inventories to make sure that non-conforming
components do not reach the market.
4.6 Case descriptions
This chapter will take up three cases that highlight different stages of the claim process. All claims are
different and the purpose of the cases is not to show an average claim, but rather to describe cases
that might have high value for our analysis. The first two cases come from a medium sized customer
that produces milk and cream replacements. The last case describes a corrective action at the Carton
Bottle platform.
Engineering Implementation
TG
Red TG Orange
TG
Yellow
TG
Green TG Blue
MS Orange
Orange
MS Yellow
Yellow
MS Green
Green
MS Blue
Blue
Define Design &
Verify
Validate Implement
Figure 37: Phases in corrective actions (TG = Toll Gate, MS = Mile Stone)
62
4.6.1 Cap applicator
3-6% of the caps were not properly glued on and product was leaking from the package. This was a
complex problem that neither customer's technicians nor the Tetra Pak personnel were able to solve
straight away. Customer had problems during 10 weeks before a solution was found. No official
solution was released from platform but at another MC a local solution to make glue supply to cap
more even had been produced. Implementation of this kit plus tightening a loose cable in electrical
cabinet solved the problem for customer.
The direct losses due to this claim that the customer could prove, and thereby were reimbursed from
the MC, are shown in Table 7. Much of these costs were caused by massive sorting and testing
efforts. The customer felt that since the solution took so long and that after all it only was between
every 15th to 20th package that was leaking, they could not stop production entirely.
Table 7: Costs that were reimbursed to the customer
Destroyed products 299 000₮
Scrapped products 72 000₮
Overtime production 3 400₮
Technical service overtime 3 100₮
Extra laboratory test 41 200₮
2% extra waste due to constant restarts 99 300₮
Grand total 518 000₮
The customer had other consequential commercial cost that they estimated to 870 000₮ that was
not reimbursed from the market company. These costs occurred due to the commercial losses
customer suffered from when the consumer demand could not be met because production
continuously was stopped. Some products that reached the market ended up on consumer's clothes
and in places in their kitchens where it was not supposed to be. This as a result of the fact that the
product will sediment during storage and must be shaken by the consumer before tapping from
package. When the cap is not properly applied the product will end up in unexpected places.
Since the German solution was not approved by platform, the troubleshooting took long time and
the platform demanded a higher degree of time specification than the Tetra Pak service engineer
could declare afterwards. This in combination with that the time frames for reporting claims,
specified in PM 9820.10, were not held resulted in that the claim was rejected and that no costs
therefore were reimbursed from the platform. MC took all costs for this claim.
4.6.2 Gasket
The customer identified a batch of their products to be non-aseptic. In the initial assessment no root
cause were found and the entire product piping on the filling machine had to be picked apart in the
attempts to find the problem. Investigations showed that one possible reason could be a gasket that
63
had not survived its expected lifetime. The product quality problems resulted in that customer had
problems to supply consumers demand on different products during a month. A massive testing and
sorting effort had to be conducted in order to sort out what could be sold to consumers and what
could not be sold. Due to the long stop in production and the sorting efforts, the backlog was very
high. Extra night and weekend shifts had to be used to catch up with the consumer demand for
product. Practically all of the 40 employees were involved in the aftermath of the problem. Blue
collar workers to resolve the hands on matters, like sorting and production catch up, and white collar
workers to limit the damages in distribution chain.
In Table 8 the direct costs the customer suffered are shown.
Table 8: Direct costs claimed by the customer
Scrapped products 203 500₮
Cost for scrapping products 33 800₮
Overtime production and sorting 41 400₮
Technicians + overtime 6 200₮
Extra laboratory test of product 27 100₮
Cost for analysis and machine testing 8 300₮
Grand total 320 300₮
The claim was passed on to SCO-CE since it was a supplier matter. SCO-CE organisation accepted
responsibility and MC were reimbursed with the total value of one gasket, 10,90₮. The Customer did
not receive any additional compensation due to uncertainty what really caused the problems. Issues
with short lifetime on these gaskets were at the same time found at another customer and an SQA
investigation was initiated.
SQA used several days to elaborate different root causes of the problem. The Supplier and their sub
supplier were included in the investigation with their technical expertise. The SQA investigation
revealed that the rubber type chosen in design was not optimal for the specific usage. For the
chemicals and high temperatures used, a rubber type with higher tolerances was needed. Since the
claims only came from two plants the possibility that this was a plant specific issue could not be
excluded. Root cause for the product quality problem has not been identified.
4.6.3 Servo Motor on TT/3 1700
Between the years 2000 until 2004 a Tetra Top machine TT/3 1700 with a specific servo motor was
sold in 92 examples. From the very beginning of the market introduction, claims on the servo motor
started to drop in. The servo motor drives a pump that pushes the product into the filling machine.
On this type of machines there are two lines and on each line there are two pumps. In other words,
there are four servomotors on the filling machine. One motor costs 12800₮ to purchase from the
supplier and the price to the customer is practically the double.

64
On a twelve months rolling basis, 40 claims have been filed and the spare part sales of the item were
up to nearly 120 items a year. In addition to this it was also revealed that some customers with
reoccurring problems had double sets of servo motors, so when one broke down it was sent to repair
and the backup was inserted into the machine. Most of the information in the case was gathered in
the local information system used in Carton Bottle called C2. The root cause was defined in two main
problems:
• The piston that drives the pump is not properly calibrated which leads to that it goes too far before it stops. In turn this pressure result in a higher voltage in the servo motor which makes the linings burn.
• Excessive product that is not used or is spilled during the filling process returns for re-usage. If the diary‘s piping infrastructure does not support high enough throughput the pressure in the machine will increase. This causes the servo motor to work harder. In turn this lead to a higher voltage in the servo motor which makes the linings burn.
The team that was assigned for a pilot study made cost calculations of what might be the cost of
problem solving and implementation of different solutions compared to what the suppliers selling
price was and what cost would therefore come in terms of claims. Some of the solutions had
acceptable payback times and therefore it was announced in the prioritisation forum that some kind
of corrective action should be implemented.
There were also problems with the subsequent model 1800 and from the beginning the idea was that
the same solution should be used for both types. On the latest model, 1900, another servo motor
was implemented that resulted in lower cost and a more robust design. The first discussion was to
implement the same servo motor on the other two preceding models, but this would also require
changes with, for example, pump pistons. The cost to implement this solution would be about
15,5M₮ which was perceived as way too high. Instead the team that was put together for the pilot
study brainstormed different possible solutions. When the team had permission to start the
corrective action process in TG Red, the list of solutions proposed was presented to the hygiene risk
assessment team in order to find potential hazardous solutions. The technical support team at the
platform was also consulted in order to find out the possibilities for successful implementations at
customer sites for the remaining options. The solution that was finally proposed was based on a
setup for the first root cause where calibration would occur much more often. To address the other
root cause a container was constructed that would create a buffer so that the pressure in the
machine would decrease.
Before entering TG Orange, risk assessments were done in order to capture the risks in the project
and implementation of the solutions. In the orange toll gate the people involved realised that the
same solution could not be implemented for the 1800-model, why focus were put on only the 1700-
model. The budgeted time for the people involved was 3000 hours for both 1800 and 1700, but when
the project for only the 1700 was in TG yellow already 2700 hours were used. Hopefully though much
of the pre-work for the 1800 is already done. For the mandatory rebuilding kits the target price is set
at 21146₮. The cost is currently 27495₮ though, but negotiations with suppliers are ongoing.
Currently field tests will be conducted in Kazakhstan and one more location in Europe in order to
validate the solution. According to the project leader the problems with the process mainly can be

65
found in the cost calculations. It is difficult to get any good frames for how much projects are allowed
to cost and there are no templates for how to calculate the payback for a project.
4.7 Key Performance Index in Tetra Pak
Tetra Pak use a Balanced Scorecard (BSC) with a KPI structure where all divisions, teams and
managers have personal specified measures that are intended to drive the desired behaviour. With
the vision, mission and resulting strategies as corner stones a strategic map was created that would
guide the organisation to what would be required in each of the four perspectives of the BSC matrix
in order to create sustainable profitable growth. The strategy map can be seen in Figure 38. The map
is horizontally based on the four perspectives of the balanced scorecard and vertically based on the
three strategic objectives.
Figure 38: The Tetra Pak strategy map
Based on the strategy map the measures in the different sectors are boiled down in the organisation
and adopted differently at the different divisions and teams in order to drive proper objectives at the
right level. In Figure 39 the building block for the BSC can be seen. The objectives from the strategic
map are turned into a global BSC that is common for the entire company. This is then split down in
entity BSC that intends to bring desired focus for the different business units and clusters. The
measures used here are not sufficient or valid for all managers and therefore individual objectives
are set. On management level these individual objectives are weighted against a leadership survey
that the employees turn in. The weights on different measures are 40 % for the financial perspective,
25 % for both customer and business processes perspectives and 10 % for the learning and growth
perspective.

66
Figure 39: Building blocks of the BSC used in Tetra Pak
The main KPI that attract the interest in this dissertation is “Total number of customer claims”. This
measure is one of eighteen in the global BSC described as a customer focus KPI. It is used as a
customer focus KPI in the companies update for 2008 with the objective “Commitment to quality”.
During 2007 it was seen as business process measurement aimed at optimizing the supply chain.
2006 it basically looked the same as 2007, and 2005 it was not in the global BSC at all. 2004 it was
called “reduction of customer claims” and sorted under the objective “Achieve the cost-quality-time
targets set in process orientation”. Instead of having a target as the reduction of total numbers, as it
has been the last couple of years, it was a reduction in percentage that was the goal in 2004. The
goals and outcome of them can be viewed in Figure 40 below. The dotted line in the figure describes
the goals set by the organisation the last three years and the continuous line describe what the
actual number of incoming claims were in percentages of the present goal. As seen in Figure 40
number of incoming claims and the goals set has more than doubled during the last three years.
0%
20%
40%
60%
80%
100%
120%
2005 2006 2007 2008Year
Actual Goal
Figure 40: Actual number of incoming claims compared to goal in KPI displayed as percentage of the goal for
2008

67
The current KPI is named “Total number of customer claims”, but it is actually a weighted
measurement. The goal is set with the installed base in the beginning of the year. This gives an
expected ratio that is compared to the ration in the end of the year. The ratio in the end of the year
is then multiplied with the installed base at the end of the year and this gives the number that goes
into the BSC.
4.7.1 KPIs used in different divisions
All units that have claim handling and administration use the same basic claim KPI as is used globally.
Then there are local deviations. The MCs for example get measured on how many of the claims that
have the MC as root cause. A MC can be the root cause when they have given more promises to the
customer than the platform can approve. It can also be because the technical service from Tetra Pak
technicians is not done correctly which has led to the malfunction. The clusters and MCs have their
own targets on how many claims can be acceptable. The variability is though allowed to be fairly high
since top management realise that a true baseline might not yet have been recovered. This is very
similar to how the KPI work in the other business areas.
The MCs are also measured on how many claims that gets rejected by the platform or SCO-CE. The
intention of this KPI is for the MC to deliver good and clear information and also to give the MC
incentives to respect the time limitations stated in PM9820.10. Another reason is that the MC has to
do a comprehensive investigation and not just send in whatever in hope of reimbursement.
At MC level there are also one KPI for handling time until the customer is up and running and
compensated. This KPI is called “Time to Customer claims resolution/restoration”. The target set for
2008 is that, from the point where a claim has occurred until financial compensation is given, it
should not take more than just over a month. There might be a similar measurement for the coming
years that will include both MC and platforms that will measure the total time until the claims root
cause eradication.

68
5 Analysis
This chapter will analyse the empirics with the purpose as base and the presented theories as
framework. The chapter is structured as the former but here the analysis will begin in theoretical
review. After that the different steps in the claims and NC process is studied. This leads into
investigation of corrective actions, transparency in the supply chain and ends with KPI review.
5.1 Quality in Tetra Pak
5.1.1 Quality Definitions
Tetra Pak’s somewhat vague quality view has some similarities with Deming’s customer focused view
but without his time perspective. The authors will though use a broader quality definition, with the
different quality dimensions, to try to capture what is not included in Tetra Pak definition. However,
even though the customer focus is present there is no definition of customer by Tetra Pak. Since a
filling machine from Tetra Pak is a substantial investment a large part both the purchaser and the
decider is found in the top management of the customer organisation. The user is normally found in
the bottom of the organisation as at production leader or a machine operator.
Other important stakeholders are the organisations next in the supply chain, grocery chains and end-
consumers. These stakeholders can act as important influencers.
Mainly two different viewpoints are used within Tetra Pak. The Market companies have a more user-
based view on quality while D&E naturally have a more product-based and SCO-CE have a
production-based quality view. This is not uncommon in companies but can create
misinterpretations and conflicts in interfaces between the viewpoints.
In Table 9 the authors have combined the quality dimensions by Bergman & Klefsjö and Garvin/Hill.
“Absence of defect” and “Appearance” used by Bergman & Klefsjö – has been replaced with the
similar “Conformance” and “Aesthetics” by Garvin/Hill. This means that the difference between the
Garvin/Hill’s Table and Table 9 is “Environmental friendliness” and “Security”. Other than that some
of the dimensions are of less importance to Tetra Pak CE. “Features” and “Aesthetics” are by the
authors not considered important neither by Tetra Pak or customers and therefore excluded in the
table.

69
Table 9: Dimensions of quality and responsible functions
Dimensions of quality Function(s)
responsible
Performance A product’s primary operating characteristics
Reliability The probability of a product malfunctioning within a
given period
Durability A measure of a product’s life in term of both its
technical and economical dimensions
Security That the product does not cause harm to person or
property
Design
Conformance The degree to which a product is manufactured to the
agreed specification
Manufacturing
Serviceability The ease of servicing (planned or breakdown) to
include the speed and provision of after-sales service
Design and after-sales
Perceived Quality How a customer views the product Marketing and design
Environmental
friendliness
The products impact on environment All
5.1.2 Total Quality Management
Total Quality Management at Tetra Pak is based on a customer focus. Also participation of all
members and the continuous improvement is becoming more and more emphasised. Passionate
leadership is starting to take form since quality has been highly emphasised during 2008 by top
management. One obvious indication of the rising value of quality in the top management is the
recruiting of a vice president of quality, a new established position in the Global Leadership Team.
Maybe this also will result in that the company will adapt a clear quality definition that can guide the
now fairly autonomous business areas in a common direction.
The work with processes in Tetra Pak has been in position for some while but the status of the global
core processes is still low since the functional organisation bonds are strong. Therefore the processes
lies outside these borders and the process managers act more as white-space managers to connect
the functional organisations.
The total quality department at SCO-CE work more according to Crosby’s definition of quality, with
focus on non-conformances. Two areas that are well covered by the TQ department are the inbound
quality from suppliers, as well as the quality of the assembly done at Tetra Pak. Both of these areas
correspond to conformance. The presence of Total Quality in the product design differs between the
70
product platforms. In the Carton Bottle platform with high emphasis on product development the
Total Quality Manager work more with design than in other platforms. However quality management
is seldom involved in quality related re-design events.
One large problem of the Total Quality department is that central Tetra Pak functions seldom reach
further than the market companies and therefore quality problems created at market companies as
well as quality problems based on the different quality viewpoints between the market companies
and the product platforms, lies outside Total Quality’s jurisdiction. The issue of how to combine the
product-based and production-based quality view with the user based quality view and make them
work together is one important issue that have to be dealt with.
5.2 Quality Costing
First, no definition of quality costing exists at Tetra Pak. The authors have chosen to use Cost of Poor
Quality (COPQ) instead of Cost of Quality (COQ) since the first term better describes and highlights
the problem, namely the poor quality, as well as the COPQ has proven to have better impact on Tetra
Pak top management.
One-shot studies conducted by strategy consultants at Tetra Pak conclude that a lot of money is lost
because of quality issues. However no permanent quality costing system exists today to capture
these costs. Some quality costs are categorised as claims and Non-conformities but even in these
areas only a few of the costs are actually captured. Other areas of quality costs are not covered at all.
One general conclusion is that the closer to the customer the quality costs lie the lesser information
about the costs exist.
The collection of quality cost data is supported by more and more IT-tools, like further add-ons to
SAP, but the main quality cost system have only been in service since 1st January 2008 and new
functions to capture costs closer to customer was implemented during December 2008.
5.2.1 The authors’ quality costing model
The PAF model works good as a tool to make people understand quality costs but its obvious
drawback is its inability to capture intangible and hidden costs as well as the model is naturally more
connected of Crosby’ definition of quality as “conformance to requirements” and therefore it can
lead to a narrow number of quality costs. The terms internal failure costs and external failure costs
are also confusing terms and based on their descriptions the terms in reality should be called cost of
internal discovered failures and cost of external discovered failures since the terms do not have to do
about where the failure is made, only where it is discovered. However since the definitions are
universally used the authors will keep the original PAF-terms. Another unclear definition of the PAF-
model is corrective actions. Corrective actions according to Juran & Gryna would be classified as
failure costs and not preventive costs however the corrective action can be a solution to both an
internal failure as well as an external failure and can therefore be both internal failure and external
failure at the same time. To solve this problem the authors have added a fifth category in the PAF-
model called corrective action cost as seen in Figure 41.

71
Figure 41: The author’s modified PAF-model
The process model on the other hand has the disadvantage of being to time consuming and creating
too complex process models. Even Goulden & Rawlins hybrid model with flowcharts is very time
consuming when used on all company processes and at a large company like Tetra Pak this would
make up hundred of flowcharts. The authors instead used the PAF-model together with the quality
dimension table (Table 9) to create a matrix in which to find events that would drive quality costs of
each type. The authors instead used the PAF-model together with the quality dimension table (Table
9) to create a matrix in which to find events that would drive quality costs of each type. This matrix
(Table 10) summaries the events driving quality costs at Tetra Pak.
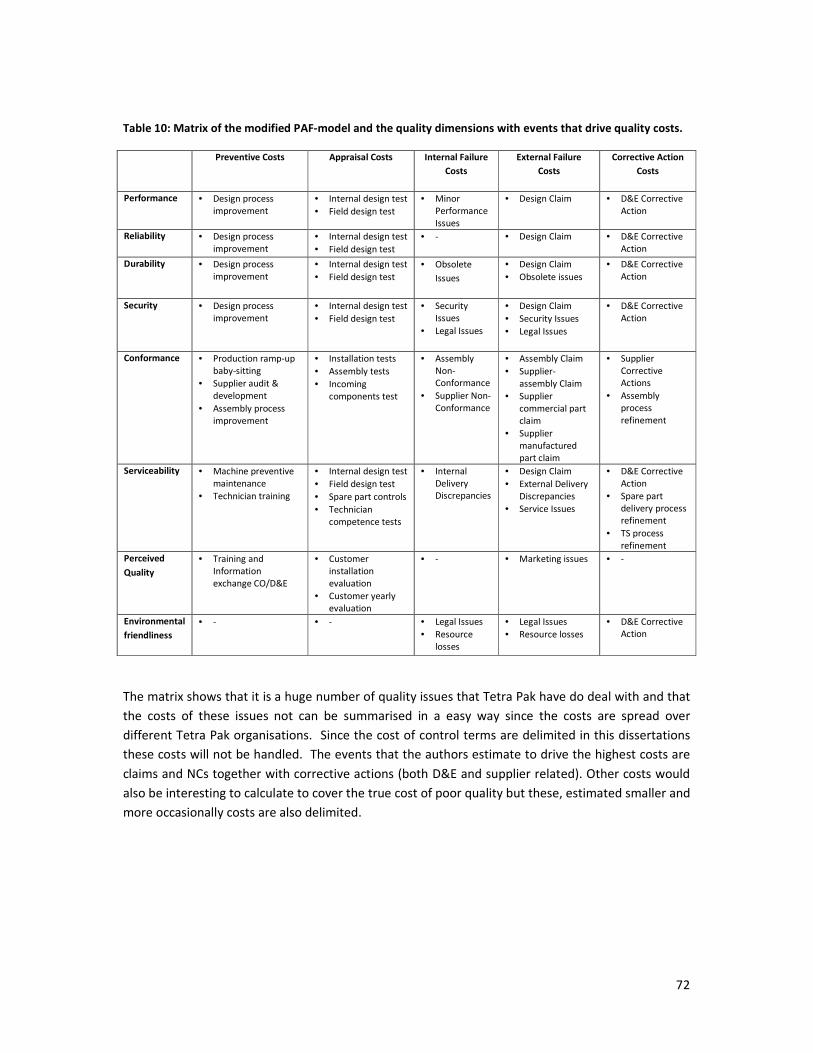
72
Table 10: Matrix of the modified PAF-model and the quality dimensions with events that drive quality costs.
Preventive Costs Appraisal Costs Internal Failure
Costs
External Failure
Costs
Corrective Action
Costs
Performance • Design process improvement
• Internal design test • Field design test
• Minor Performance Issues
• Design Claim • D&E Corrective Action
Reliability • Design process improvement
• Internal design test • Field design test
• - • Design Claim • D&E Corrective Action
Durability • Design process improvement
• Internal design test • Field design test
• Obsolete
Issues
• Design Claim • Obsolete issues
• D&E Corrective Action
Security • Design process improvement
• Internal design test • Field design test
• Security Issues
• Legal Issues
• Design Claim • Security Issues • Legal Issues
• D&E Corrective Action
Conformance • Production ramp-up baby-sitting
• Supplier audit & development
• Assembly process improvement
• Installation tests • Assembly tests • Incoming
components test
• Assembly Non-Conformance
• Supplier Non-Conformance
• Assembly Claim • Supplier-
assembly Claim • Supplier
commercial part claim
• Supplier manufactured part claim
• Supplier Corrective Actions
• Assembly process refinement
Serviceability • Machine preventive maintenance
• Technician training
• Internal design test • Field design test • Spare part controls • Technician
competence tests
• Internal Delivery Discrepancies
• Design Claim • External Delivery
Discrepancies • Service Issues
• D&E Corrective Action
• Spare part delivery process refinement
• TS process refinement
Perceived
Quality
• Training and Information exchange CO/D&E
• Customer installation evaluation
• Customer yearly evaluation
• - • Marketing issues • -
Environmental
friendliness
• - • - • Legal Issues • Resource
losses
• Legal Issues • Resource losses
• D&E Corrective Action
The matrix shows that it is a huge number of quality issues that Tetra Pak have do deal with and that
the costs of these issues not can be summarised in a easy way since the costs are spread over
different Tetra Pak organisations. Since the cost of control terms are delimited in this dissertations
these costs will not be handled. The events that the authors estimate to drive the highest costs are
claims and NCs together with corrective actions (both D&E and supplier related). Other costs would
also be interesting to calculate to cover the true cost of poor quality but these, estimated smaller and
more occasionally costs are also delimited.

73
The different claims in the matrix are split into:
o Design claim
o Assembly Claim
o Supplier-related claim
� Supplier assembly claim
� Supplier commercial part claim
� Supplier manufactured part claim
Non-Conformances are split into:
o Supplier Non-Conformance
o Assembly (Internal) Non-Conformance
To calculate to the costs of these events a similar flowchart suggested by Goulden & Rawlins have
been used but this event flowchart now only represent the non-conformance route described in the
hybrid model. This has made the flowchart significantly smaller than what would have been the case
otherwise.
The flowcharts were created at a department level and these charts can be found in Appendix 1:
Process charts over the claims process & Appendix 2: Process charts over the NC process. The process
charts found here do not look exactly as Goulden and Rawlins describe their integrated flowchart in
Figure 15 in page 29 since the only activities described are those concerning the non-conformance
route. In the process charts the controlling parameters and resources used have not been drawn. The
resources used are instead described in the ABC-analysis, and the control parameters are laws and
contracts towards the customers and suppliers and PM9820.10 within Tetra Pak.
From these process charts the authors created a model on functional level (Shown early in the report
in Figure 1 in page 5 & Figure 2 in page 5). This model is created with a supply chain perspective to
cover up all actors in the chain that can be covered within this dissertation. Based on these models,
costs could be separated at the different corporate functions and organisations. The calculation of
the costs has been conducted in different ways dependent on the actual organisations part in the
process. The calculations of the financial transfers have mainly been done by statistical data through
SAP R/3. The calculations of the organisations have been done by a top-down calculation based at
financial information at the functions and a bottom-up calculation based on the created department
level flowcharts.
The bottom-up calculation was created as an ABC-table based on the flowcharts. The intent with this
was to be able to find the cost drivers connected to different activities and by this understand what
resources is used in the process. In the case of claims and NCs the process is considered to be
assigned to external and internal failures at identifying the process and because of this there is no
need to have a column for PAF category assigning. The same reasoning is used when it comes to the
column “Value- or non value-added” that Tsai’s model describe (see Table 5). All the processes that
are described in dissertation are failure cost and due to this non value adding. It could be discussed
that the information that is collected in the process is value adding, but since the main goal for the

74
processes is to get the machine back to a steady state where the machine is conforming to its
specifications, this thought has been rejected. A column has been added in order to make the table
compatible with the hybrid model. This column is called the “cost bearer organisation” and the aim
with this column is to assign costs to the resources originating in different organisations that the
processes pass.
5.3 Claims
All claims are different and the cost related to some part of the process differs more than other.
Therefore different, more or less, standard cases have been constructed for the customer and the
administrative costs associated to Tetra Pak. With the process maps in Appendix 1: Process charts
over the claims process and the explaining text in chapter 4.3, five cases with different actors
involved came forth. The cases are built on how far into the company the claim goes. These cases are
shown in Table 11 together with percentage of how often the cases occur. The codes displayed are
the search words from SAP R/3 that is used to filter the cases. The percentage of case 1,2 and 3 are
drawn directly from the numbers found in SAP R/3, but the system do not capture how many claims
are forwarded to suppliers correctly, why the percentages in case 4 and 5 are estimates from
interviews.
Table 11: Five different cases of claim and how often they occur
Case % Illustration of the case
1. Rejected by MC
(CLAR)
2%
2. Accepted and Kept
by MC
(CLAA)
6%
3. Accepted by MC,
rejected by
Platform/SCO-CE
(CLAA CPAR)
16%
4. Accepted by MC &
Platform/SCO-CE
(CLAA CPAA)
66%
5. Accepted by MC,
Platform/SCO-CE
& Forwarded to
supplier
(CLAA CPAA TVE)
10%
MC CustomerPlatformSupplier
SCO
1234
MC CustomerPlatform
SCO
123
MC CustomerPlatform
SCO
123
MC Customer
12
MC Customer
12
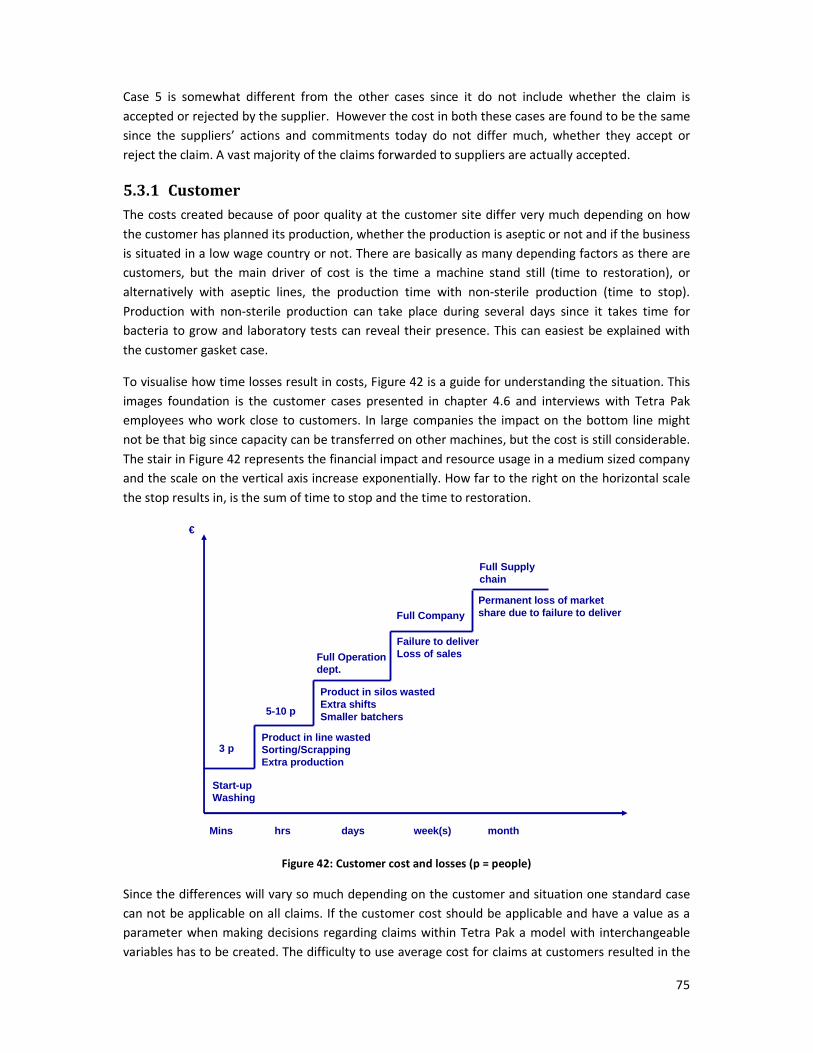
75
Case 5 is somewhat different from the other cases since it do not include whether the claim is
accepted or rejected by the supplier. However the cost in both these cases are found to be the same
since the suppliers’ actions and commitments today do not differ much, whether they accept or
reject the claim. A vast majority of the claims forwarded to suppliers are actually accepted.
5.3.1 Customer
The costs created because of poor quality at the customer site differ very much depending on how
the customer has planned its production, whether the production is aseptic or not and if the business
is situated in a low wage country or not. There are basically as many depending factors as there are
customers, but the main driver of cost is the time a machine stand still (time to restoration), or
alternatively with aseptic lines, the production time with non-sterile production (time to stop).
Production with non-sterile production can take place during several days since it takes time for
bacteria to grow and laboratory tests can reveal their presence. This can easiest be explained with
the customer gasket case.
To visualise how time losses result in costs, Figure 42 is a guide for understanding the situation. This
images foundation is the customer cases presented in chapter 4.6 and interviews with Tetra Pak
employees who work close to customers. In large companies the impact on the bottom line might
not be that big since capacity can be transferred on other machines, but the cost is still considerable.
The stair in Figure 42 represents the financial impact and resource usage in a medium sized company
and the scale on the vertical axis increase exponentially. How far to the right on the horizontal scale
the stop results in, is the sum of time to stop and the time to restoration.
€
Mins hrs days week(s) month
Start-upWashing
Product in line wastedSorting/ScrappingExtra production
Product in silos wastedExtra shiftsSmaller batchers
Failure to deliverLoss of sales
Permanent loss of market share due to failure to deliver
3 p
5-10 p
Full Operation dept.
Full Company
Full Supply chain
Figure 42: Customer cost and losses (p = people)
Since the differences will vary so much depending on the customer and situation one standard case
can not be applicable on all claims. If the customer cost should be applicable and have a value as a
parameter when making decisions regarding claims within Tetra Pak a model with interchangeable
variables has to be created. The difficulty to use average cost for claims at customers resulted in the

76
notion that cases should be built from claim to claim on what impact a specific article has for
customers. Therefore a model was created that is supposed to aid in the cost revelation.
In Figure 43 the structure for the customer claim-related cost model (CCRCM) can be seen and for a
more detailed overview, see Appendix 3: Customer claim-related cost model (CCRCM). This model is
based on five basic topics. The first topic holds instructions for which cells to fill out and some central
parameters that will be used in several places in the model further down. On top of the central
parameters the cost of personnel is filled in. Then, following the analysis above the next two
numbers are the time to stop and time to restoration. In the CCRCM model they are though called
“Hours of planned production lost” and “Hours of defect production”. As stated above, even long
stops do not have to result in overtime production if the utilisation of machines is low from the start.
That is why the last row is called “Hours of consequential overtime production”. In the case in Figure
43, Tetra Pak, D&E finance facts has provided numbers for what can be expected costs for machine
operators in Europe and China.
Instructions:
Cost base Europe 09 China 09
Filling Machine Model X X
Man cost operator [money/h] 0,00 0,00
Man cost technician [money/h] 0,00 0,00
Man cost administration [money/h] 0,00 0,00
Man cost extra testing [money/h] 0,00 0,00
Hours of planned production lost [h] 0 0
Hours of defect production (from issue to stop) [h] 0 0
Hours of consequential overtime production [h] 0 0
Total Cost of claim 0,0 0,0
Sum of monetary transfers with Tetra Pak 0,0 0,0
Direct costs 0,0 0,0
Indirect costs 0,0 0,0
CUSTOMER CLAIM-RELATED COST MODEL
Figure 43: Customer claims-related cost model (CCRCM)
The “Total cost of claim” is just a summarisation of three sections below where “Sum of monetary
transfers with Tetra Pak” is made out of the costs the customer has for the primary, collateral
damaged parts and Tetra Pak technician subtracted with what get reimbursed from Tetra Pak. This
number should ideally be the same and the sum therefore zero.
The direct costs are made up of the following components that are summarisations of sub levels, not
shown in this public thesis, that are considered the main drivers of primary functions cost:
77
• Cost of extra washing. These costs come if extra washing is required due to the stop. For
aseptic machines stops on only a few seconds can create this cost.
• Cost of customer technician. Sometimes customers have machine operators that handle
technical issues on machines, but most often diaries has specialists appointed for service and
maintenance.
• Cost for product in line wasted. Some products, like low fat yoghurts, have to be packed
within a few hours if not to be sour. Therefore stops in production can result in that
unpacked product of high value must be destroyed.
• Cost of sorting pallets. When the packed production has faults like in the cap applicator case,
much work is required to check and sort to see which finished products can be sold.
• Cost of scrapping products. The amount and cost of finished products or damaged packages
that have to be destroyed.
• Cost for extra product testing. Often testing equipment has to be rented and extra laboratory
testing conducted if there is any risk for personal hazards. This can also include costs for
testing the machine before restarting production.
• Cost of production stop. Even though the machine is not operational there are operators
standing by driving cost, and there is a capital cost for the equipment that adds up whether it
is running or not.
The indirect costs that the claim result in but seen as secondary are the following:
• Cost of administrating claim. Claims always mean administrative work, both in the different
interactions with Tetra Pak and in finding people for overtime production and so forth.
• Cost of consequential overtime production. If the customer’s production is tightly planned so
that the production schedule can not be caught up on ordinary time, overtime production,
that is more costly than normal, is required.
• Cost of raw material consequential loss. With long stops where packing can not be done by
additional capacity, raw material might have to be destroyed due to short lifetime or extra
transportation is required in order to use extra capacity elsewhere.
• Cost of lost sales. For each litre of product waster there is a loss of profit for the packages
that could be filled and sold.
• Cost of fines for inability to deliver. In some countries the diaries have high demands and
strict contracts with the wholesalers.
• Cost of marketing loss. With long stop there is always risks that the spot in the store shelves
will be filled with other brands or products if the producer is unable to deliver. In this
category also lost sales to end customer due to badwill reasons as the case were with the
cap applicator. These costs are naturally very difficult to put a price tag on and will have to
be assessed very carefully by the user of this CCRCM model.

78
From these notions basic cases can be elaborated to show different levels of impact on the customer.
The authors have used the model on several different cases and the outcome of these shows that it
is waste of product in line and scrapping of finished goods, together with the cost of lost sales that
are the largest cost drivers.
5.3.2 Market Company
The MCs within Tetra Pak have very high autonomy and they are working in very different cultural,
legal and social contexts. These circumstances are very important to bear in mind when analysing the
claims handling. This is one reason that all claims do not get reported to the platform. Another big
reason is the language barrier. If the field service engineer on site is not able to give a clear
description of the problem and the claim engineer or administrator at the MC is not able to translate
in correct technical English, the vital information that is the foundation for the claim loses its value. It
can be the case that claims that should have been accepted gets rejected because the information
gets misinterpreted or does not reach the requirements in PM 9820.10. Having a higher rejection
rate worsen the MC KPI and make the MC more reluctant to send information to platforms by claims.
The cultural differences also present a similar risk. It can in some cultures be difficult and insulting to
handle a rejection.
When articles with low reimbursement value break down there is an imminent risk that a claim will
not be filed. This is partially due to the problem stated above and partially due to the fact that the
administration to file a claim is essential independent on the claim value. This can be represented
with claim case 1 where the claim is not even sent to the platform. Many parts on a machine, like
gaskets, springs or screws, do not cost more than a few Euros. The administration cost many times
more than what can be claimable, and are therefore very unprofitable for the MC to file. There
probably exist many more claims that never get filed due to the administrative costs. These types of
costs are calculated below with a top-down and bottom-up approach.
Top-down cost calculation
The outcome of the process charts of claims have shown that the cost at Market Companies is mainly
the reimbursements paid to the customer (described in chapter 4.3.2), the administrative actions and
the shipping of parts. However no global data on claims administration and shipping extracted from
other costs exist and therefore a proper top-down analysis can not be conducted. Instead an analysis
has been done at Market Area Nordics and then these numbers has been extrapolated to a global
level. In this study all persons fully dedicated to claims have been included and the average global
cost per capita is based on the fact that 66% of the claims come from high salary clusters while the
other 34% come from low salary clusters.
Even at local company level it was hard to find shipping costs however a local claim cost system at
Market Company Italy made it possible to find transportation cost. However Market Company Italy is
not representative globally since many of their transports go from MC site in Rubiera to Platform site
Modena, a trip of 10km. On the other hand, has MC Italy more transports then the average Market
Company. MC Italy have a low cost/transport but the since the percentage of claims shipped back to
platforms is high the cost/claim is not far from the global estimation on transport costs. The cost of
the top-down analysis can be seen in Table 12.

79
Table 12: Market Company costs per claim
Hrs/claim
Administration
cost/claim
Transportation
cost/ claim
Total
Cost/claim
10,38 1 062₮ 102₮ 1 165₮
Bottom-up cost calculations
The bottom-up calculations was made as an ABC-calculation as described in the authors quality
costing model (5.2.1). In Appendix 4: Activity Based Cost Model for CE Claims the ABC-calculation is
shown.
The bottom-up calculations have been combined for both MC, Platform/SCO-CE and supplier
calculations since the different activities at MC, Platform/SCO-CE and Supplier are dependant on
what type of claim that is handled. The cases used are the same as described in the beginning of
chapter 5.3.
The ABC-models has been developed together with Market Company representatives. The hourly
cost used in the model is based on the same average as in the top-down case above. The hourly cost
is also added with an overhead of 50% to compensate for time lost for training and other indirect
related activities that not is included in the ABC-model. Based on the different activities performed in
the different cases and the distribution of the cases the cost for MC could be calculated. In Table 13
the average cost and time per claim is shown for the different cases used.
Table 13: The average cost and time per claim in the different cases
Cost MC Time MC
Case 1 486,40₮ 183
Case 2 771,84₮ 295
Case 3 1 045,44₮ 363
Case 4 1 045,44₮ 363 Case 5 1 045,44₮ 363
The average cost and time at the Market Companies based on the case distribution of the claims is
1019₮ and 430 min.
Conclusion Market Company costs
When comparing the two calculations, the cost in the top-down calculation is slightly higher than the
average value from the bottom-up. The reason why the bottom-up is lower could be explain with
that it hard to estimate how much time is spent on short activities and the time spent on these are
often underestimated. One other explanation could be that the 50% overhead used in the bottom-up
calculation is not enough in this case to cover all related but not included activities. The real cost at
MC would be somewhere between the bottom-up and the top-down. The average would be 1093₮.
However we will keep the results from the bottom-up since these are split on the different type of
cases in comparison the top-down.

80
5.3.3 Platform / SCO-CE
At the platform and the SCO-CE it is the information about a technical issue that counts. What get
reimbursed or not is seldom a big matter, even for budget responsible managers. This is though as
long as the information that is received holds good technical information. This result in what the
claim handlers perceive as pointless haggling over money.
Another point where the discussion has been intense is between the platform and SCO-CE. It might
often be difficult to make sure if an issue has arisen due to poor design or non-conforming
performance from the supplier. The way this has been handled is to change name on the issue owner
to lead investigator, to use a new code where claims can be placed on hold for an investigator to find
it interesting and pick it up for observation. In one way this is a reasonable way to handle the large
amount of incoming claims. After all, almost 50% of the claims during a year only come once and
then it might not be reasonable to use resources on these since they might not reoccur anyway. On
the other hand Tetra Pak does not have as high claimed base they could have and this might result in
that claims that maybe have apparent quick solutions and create high costs for several customers is
not handled. As example the gasket case can be used. This article had only been claimed a few times
and would not have ended up high in the prioritisation tools due to its low value, if it would even
have entered the tool. Instead it was, thanks to good handling from claim handlers and managers at
the SCO-CE who realised that large customer costs could be saved with little effort. There is a danger
that these types of quick fixes might be more difficult to find if the claims are hidden behind a
common bin, shared between the platforms and SCO-SE.
Top-down cost calculation
The top-down calculation is based on the number of full time claims handling employments per
platform. The claim coordinators at SCO-CE are added to the platforms as an overhead dependent on
the platform’s percentage of total claims. This gives a time per claim in different platforms and out of
this the cost per claim at different platforms is calculated. An average cost is calculated dependent
on the platform’s percentage of total claims and finally the transportation cost is added. This is
shown in Table 14.
Table 14: Top-down calculation of claim handling at different platforms
Cost % of claims hrs/claim cost per claim
CB 7,4% 9,47 1 151₮
CV 83,5% 5,67 689₮
CE 3,4% 8,97 1 091₮
CGT 5,8% 9,27 1 128₮
TOT 100,0% 6,27 762₮
cost per claim Transportation
costs 32₮
Total cost per claim 794₮
The average cost per claim at the platform and SCO-CE is then 794₮.
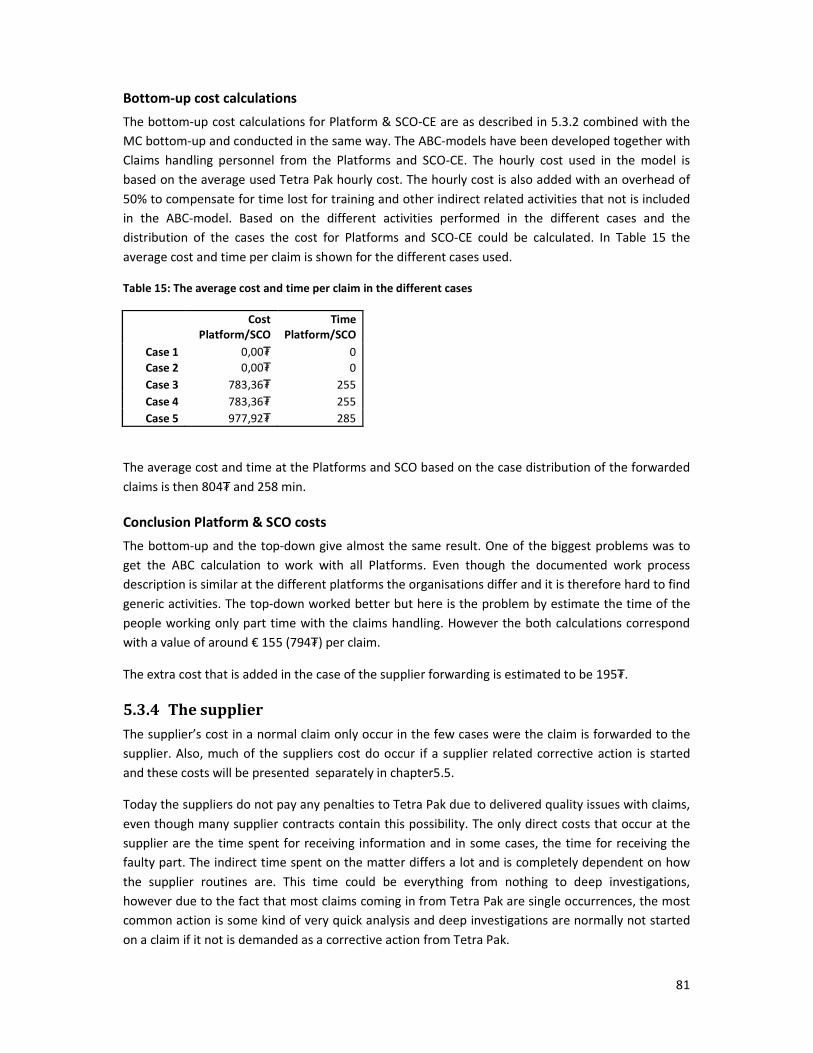
81
Bottom-up cost calculations
The bottom-up cost calculations for Platform & SCO-CE are as described in 5.3.2 combined with the
MC bottom-up and conducted in the same way. The ABC-models have been developed together with
Claims handling personnel from the Platforms and SCO-CE. The hourly cost used in the model is
based on the average used Tetra Pak hourly cost. The hourly cost is also added with an overhead of
50% to compensate for time lost for training and other indirect related activities that not is included
in the ABC-model. Based on the different activities performed in the different cases and the
distribution of the cases the cost for Platforms and SCO-CE could be calculated. In Table 15 the
average cost and time per claim is shown for the different cases used.
Table 15: The average cost and time per claim in the different cases
Cost
Platform/SCO
Time
Platform/SCO
Case 1 0,00₮ 0 Case 2 0,00₮ 0
Case 3 783,36₮ 255
Case 4 783,36₮ 255
Case 5 977,92₮ 285
The average cost and time at the Platforms and SCO based on the case distribution of the forwarded
claims is then 804₮ and 258 min.
Conclusion Platform & SCO costs
The bottom-up and the top-down give almost the same result. One of the biggest problems was to
get the ABC calculation to work with all Platforms. Even though the documented work process
description is similar at the different platforms the organisations differ and it is therefore hard to find
generic activities. The top-down worked better but here is the problem by estimate the time of the
people working only part time with the claims handling. However the both calculations correspond
with a value of around € 155 (794₮) per claim.
The extra cost that is added in the case of the supplier forwarding is estimated to be 195₮.
5.3.4 The supplier
The supplier’s cost in a normal claim only occur in the few cases were the claim is forwarded to the
supplier. Also, much of the suppliers cost do occur if a supplier related corrective action is started
and these costs will be presented separately in chapter 5.5.
Today the suppliers do not pay any penalties to Tetra Pak due to delivered quality issues with claims,
even though many supplier contracts contain this possibility. The only direct costs that occur at the
supplier are the time spent for receiving information and in some cases, the time for receiving the
faulty part. The indirect time spent on the matter differs a lot and is completely dependent on how
the supplier routines are. This time could be everything from nothing to deep investigations,
however due to the fact that most claims coming in from Tetra Pak are single occurrences, the most
common action is some kind of very quick analysis and deep investigations are normally not started
on a claim if it not is demanded as a corrective action from Tetra Pak.
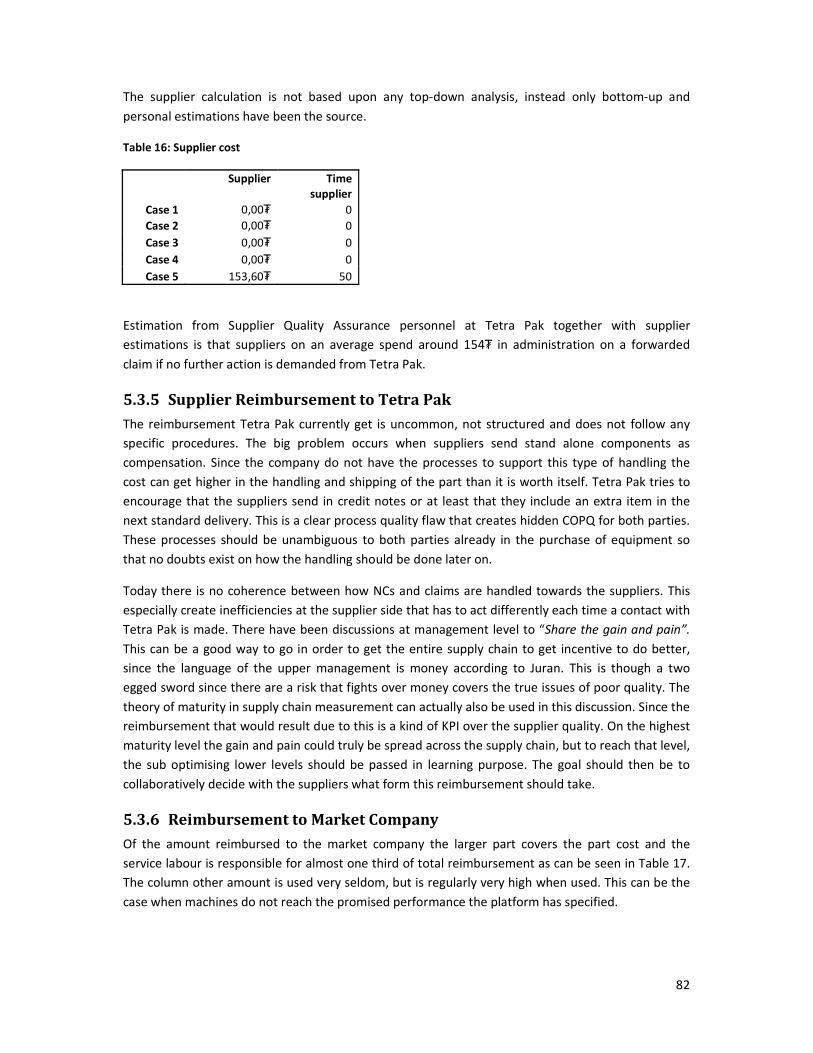
82
The supplier calculation is not based upon any top-down analysis, instead only bottom-up and
personal estimations have been the source.
Table 16: Supplier cost
Supplier Time
supplier
Case 1 0,00₮ 0
Case 2 0,00₮ 0
Case 3 0,00₮ 0
Case 4 0,00₮ 0
Case 5 153,60₮ 50
Estimation from Supplier Quality Assurance personnel at Tetra Pak together with supplier
estimations is that suppliers on an average spend around 154₮ in administration on a forwarded
claim if no further action is demanded from Tetra Pak.
5.3.5 Supplier Reimbursement to Tetra Pak
The reimbursement Tetra Pak currently get is uncommon, not structured and does not follow any
specific procedures. The big problem occurs when suppliers send stand alone components as
compensation. Since the company do not have the processes to support this type of handling the
cost can get higher in the handling and shipping of the part than it is worth itself. Tetra Pak tries to
encourage that the suppliers send in credit notes or at least that they include an extra item in the
next standard delivery. This is a clear process quality flaw that creates hidden COPQ for both parties.
These processes should be unambiguous to both parties already in the purchase of equipment so
that no doubts exist on how the handling should be done later on.
Today there is no coherence between how NCs and claims are handled towards the suppliers. This
especially create inefficiencies at the supplier side that has to act differently each time a contact with
Tetra Pak is made. There have been discussions at management level to “Share the gain and pain”.
This can be a good way to go in order to get the entire supply chain to get incentive to do better,
since the language of the upper management is money according to Juran. This is though a two
egged sword since there are a risk that fights over money covers the true issues of poor quality. The
theory of maturity in supply chain measurement can actually also be used in this discussion. Since the
reimbursement that would result due to this is a kind of KPI over the supplier quality. On the highest
maturity level the gain and pain could truly be spread across the supply chain, but to reach that level,
the sub optimising lower levels should be passed in learning purpose. The goal should then be to
collaboratively decide with the suppliers what form this reimbursement should take.
5.3.6 Reimbursement to Market Company
Of the amount reimbursed to the market company the larger part covers the part cost and the
service labour is responsible for almost one third of total reimbursement as can be seen in Table 17.
The column other amount is used very seldom, but is regularly very high when used. This can be the
case when machines do not reach the promised performance the platform has specified.

83
Table 17: Average reimbursment per claim to market companies Jan-Nov -08
Service Labour Cost Material Amount Other Amount SUM
1 434,93₮ 3 002,71₮ 255,74₮ 4 693,38₮
31% 64% 5% 100%
The market companies get reimbursed by the platforms in fictive money if the platforms accept the
claim and in Figure 44 the number of incoming CE claims from customer are displayed and the lower
part in the left column correspond to how many of the customer claims that get rejected by the MC
instantly. The following column show how many claims are held internally by the MC in the white
field and how many forwarded claims that has gotten rejected by Platform/SCO-CE in the dark field
in the middle column. The lower part of the mid column is the share of claims accepted by the
Platform/SCO-CE and this part also make the baseline and sum for what get reimbursed to the MCs.
The last field show what platform the accepted cost correspond to. Here the cost reimbursement
relation (CRR) show that one claim from the value platform gets reimbursed with ten percent less
than the average. Carton Bottle claims in average get reimbursed with 34% higher value than the
total average. This is probably since it is a relatively new platform that still is in the beginning of the
product life cycle and is mainly sold to countries with high service costs. Carton Economy gives an
interesting aspect since their average claim is so high. One reason can be that these machines are
mostly sold to countries that has low claiming frequency which result in that a claims is only filed if it
makes a large impact, and that low value claims in these countries never end up as claims. Gable Top
claims are very close to average but a surprising number can be found in the group Missing category
& other. This group is fairly small, but the big question is why these high costs do not get associated
to a specific platform, when the cost is so high.
Claims & disc taken by MC6%
Claims covered by MC
Rejected claims by Platform/SCO-CE 22%16%
CV ClaimAccepted claims by MC Accepted claims by Platform/SC O-CE 62%
98% 76%
Cost reimbursmet relation (CRR) CRR 0,901,00
CB 5%CRR 1,34CE 3%CRR 1,29CGT 4%CRR 1,01Missing cat & Other 1%CRR 3,78
Rejected claims by MC2%
Customer Claims Market Company claims Associated to Platform/MC100% 98% 98%
Figure 44: Acceptance share and reimbursement relation during Q1-Q3 2008 for CE claims

84
When compensation to MCs has been brought up during the interviews no one has been solely
positive to the monetary transfers, even though it is not real money but rather numbers in the
internal management accounting. A bit simplified the dispute can be described as on one side there
is the MC people who claim that the platform/SCO-CE do not understand the true cost the MC has to
stand for and that they are very protective over what gets reimbursed or not. The magnitude of this
increase since the claim handlers at the platforms seems to have there own individual principles over
what is supposed to be accepted or not. At the platform/SCO-CE on the other hand the opinion is
that, at least some of the MCs, only care about the compensation and do not care about what
information that is being entered in the system.
5.3.7 Reimbursement to customer
It is hard to present an average number for how much reimbursement the customer get since there
is no common way to register the different types of cost reimbursements. Each MC has its own
method and it can for example be done as a credit note, free of charge declaration or through an
invoice from the customer. Some fields exist in SAP R/3 to fill in customer compensation, but until
now, no common process to fill these in exists. This divergence results in that there are different
interpretations of how the fields in SAP R/3 should be filled out and the reports that can be produced
risks to be misleading. Some of these transactions could even be PM gifts. This problem is though
about to be corrected with an update of SAP R/3 and a common process. One problem today is that
not even the MC has control over its own customer compensation costs.
Instead the specific reimbursement for some MCs has been reviewed. It should though be noted that
it is easy for customer compensations to be lost in the system since the economic system does not
have one specific account that customer compensation should be assigned to. Besides the normal
reimbursement for parts and for service technicians, customers sometimes want compensation for
direct losses that they have suffered due to resulting stops in production or other consequential
losses. This does not happen very often but when it does values are high. On the MCs, revised by the
authors, the costs that the MC has to pay out additionally to what they get reimbursed from the
platforms range between 10000₮ and 15000₮ per claim. This means that the mark-up is around 200-
300%. The authors believe that this is valid for most of the European MC and since these claims make
up for the larger part of the total number of claims this range is probably not far from the truth in a
global aspect. In further calculations the lower value above will be used since it has better reliability
than the higher one.
One of the most important arguments Tetra Pak use in their marketing is that they sell entire systems
that will produce reliable and high output. When these arguments are compared to the dimensions
of quality in Table 9, one can see that the company relies heavily on performance, reliability and
durability. Naturally the most important will always be security due to that the company is in the
food industry, which can lead to big scandals if the quality is not sufficient in these areas. When it
comes to reimbursement to customers it is apparent that it is in the areas mentioned above that the
compensation is the highest. The cases when this occurs are not frequent, but the average customer
compensation for under-performing equipment is many times higher than for customer
compensation regarding normal claims. This is probably the reason that it has been difficult to find
reliable information about customer compensation, since the sales personnel give promises to
customer, that can not entirely be backed up by the platform. Some of the reimbursements can also
be a result of goodwill arrangements to unsatisfied key customers. In both these cases and others

85
where the MC reimburse the customer with more than they can get from the platform/SCO-CE there
has not, until now, been any systematic way to capture these costs and they have been hidden from
the management accounting outside the MC.
5.3.8 Cost of poor quality regarding claims
When the cost of claims is revised and compared to Sörqvists representation in Figure 12 in page 25
the image shown below in Figure 45 appears. This image represents what is visible within Tetra Pak.
At the platforms where the actual resolving and solution of root cause problems take place the only
costs that are visible are these above the water level. Since the costs that are actually paid to
customers are not entered into the books in a common way in the different MCs, and there is often
not even consistency in the claims accounting within the MCs. This results in that the only
management tool for understanding claims costs currently is the realignment report which is the
platform cost. These are the traditional COPQ that can be seen above the water level in the model.
All claims that could be reported by the MCs are not registered. Especially low value claims do not
reach the platform. Those who do reach the platform do not reflect the true cost for the customer.
This is some of the main reasons to why the customer view in the claims process currently is low.
At the MC there is a more natural understanding of the costs that affect the customer, but since the
routines and supporting tools have not existed, this understanding have not been transferred into
the company. The recent update of SAP R/3 is made so that the MC can show, and see for
themselves, what the customer claimed and what they actually paid out. There are though large
parts of the iceberg that the MC still do not see and that are probably not seen by any other part of
the organisation. One cost that is the result of poor quality is the inventory cost for all extra
inventories along the supply chain that is required, in order to assure that material can be delivered
when parts break down. The Tetra Pak spare part organisation make good money on this business,
which in the long run risks to sub optimise the organisation with conflicting profit goals.

86
TP time spent on inspection repair and recovery
Material cost
Customer compensation
Platform/SCO-CE Reimbursement
Hidden costs
Socioeconomic costs
TP Lost revenue
Customer costs
Cost of ClaimsWhat costs are associated with claims?
Environmental losses, discharges,
loss of food
Loss of potential project, loss of PM sales
Production stop, raw material losses, unsatisfied
customers, badwill
Compensation for customer direct costs
Administrative costs, transportation costs
Figure 45: The Iceberg of claim costs
One aspect that can be criticised with Sörqvists theoretical representation is that it does not take the
suppliers cost in consideration. The supplier will naturally not incur costs in the same magnitude as
Tetra Pak and their customer, but due to lacks in quality from Tetra Pak in designing components the
cost affecting the suppliers should not be neglected.
The cost calculations for claims will not use the two lower levels of the iceberg since they are hard to
estimate and would really not make sense to a singular claim but rather in a larger perspective.
The costs from the above headlines have been inserted into the five cases. Based on the cases and
their percentage occurrence the average Tetra Pak cost for a claim has been calculated and is shown
in Figure 46.

87
Figure 46: Tetra Pak cost for an average claim
The customer compensation is still the major part of the Tetra Pak claim related cost with 61% while
the material and the service labour is 28% and 10% is administration. This also shows that the
Platform and SCO-CE only cover 26% of the total claim related costs while the MC have to cover the
other 74%. Most importantly it shows that the material and service labour which often inside Tetra
Pak is regarded as the cost of claims actually only is a small part and to get the total cost of claim this
cost has almost to be four-doubled.
With the former study, that indicates that the customer cost can be four times those of Tetra Pak, it
becomes apparent that the cost for an average claim causes huge cost for the actors involved. In
Figure 47 the customer costs are also added which results in that the cost of the supply chain is over
73 000₮.

88
Figure 47: Supply chain cost for an average claim
5.4 Non Conformities
Since Tetra Pak has no quality control of incoming goods, the final assembly and testing of machines
has taken its place. This methodology seems to be working fine and internally proper processes are in
place. The big problem with the NC flow is that the distribution equipment assemblers do not deliver
any information about the lacks in quality that their component- and sub-suppliers has caused. This
leads to that there are lacks in the statistics and supplier evaluation can therefore not be done as
properly as possible. Another problem is that the internal NCs are not captured by any common
system, which results in that only supplier related NCs can be included in the statistics. In difference
to claims the process for NC are though much more similar for all NCs and that make it easier to
evaluate. In Appendix 5: Activity Based Cost Model for NCs the bottom up calculations for NCs can be
seen.
Two scenarios can take place with NCs. The first possibility is that the supplier refuses to take
responsibility for the problem and therefore do not reimburse Tetra Pak. The second take place
when the supplier accepts responsibility.

89
Table 18: The two different cases of NCs and how often they occur
Case % Illustration of the case
1. Rejected by
Supplier
(TVER)
7%
2. Accepted by the
supplier
(TVEA)
93%
5.4.1 Platform /SCO-CE
Even though the system and process for NCs are good and clear there might be issues that never get
registered. This is so because when the production engineers discover a failure that they can fix
themselves, for example if something is mounted upside down it might take more time for them to
fill in the required paper work for an NC than the correction of the problem. This can result in that
the supplier does not change routines that could save time for Tetra Pak in the future.
At the platform the main costs arisen can be found in the troubleshooting and reparation of an issue.
The administration is only a small part and the NC analysis is normally very straight forward. For NC
no top-down analysis has been conducted due to the fact that there are no people that work
especially with the reparation and troubleshooting and therefore no head count could be done for
the amount of work that is spent on every NC. Since Tetra Pak get reimbursed for the time spent on
these activities and the time consumption is therefore well specified, the need for the top down
analysis is not that important. The result from the bottom up analysis can be seen in Appendix 5:
Activity Based Cost Model for NCs reveal the following:
Table 19: Average platform cost per NC
5.4.2 The supplier
In contrast with claims the module supplier is always required to do an RCA. Most often this RCA is
performed quicker than the 8-10 hours that Rockwell Automation claimed is the industry standard.
This is probably because of that many of the NCs is a result of human errors. This leads to that the
more time consuming part will be to figure out how to prevent the issue from reoccurring. Since
there are structured processes for NC handling with the module suppliers, a more reliable suppliers
Administration
cost/NC
Transportation
cost/NC
Total
Cost/NC
Case 1 1 874₮ 255₮ 2 123₮
Case 2 1 951₮ 255₮ 2 206₮
SCOMod supp
Platform
12
SCOMod supp
Platform
12
SCOMod supp
Platform
12
SCOMod supp
Platform
12
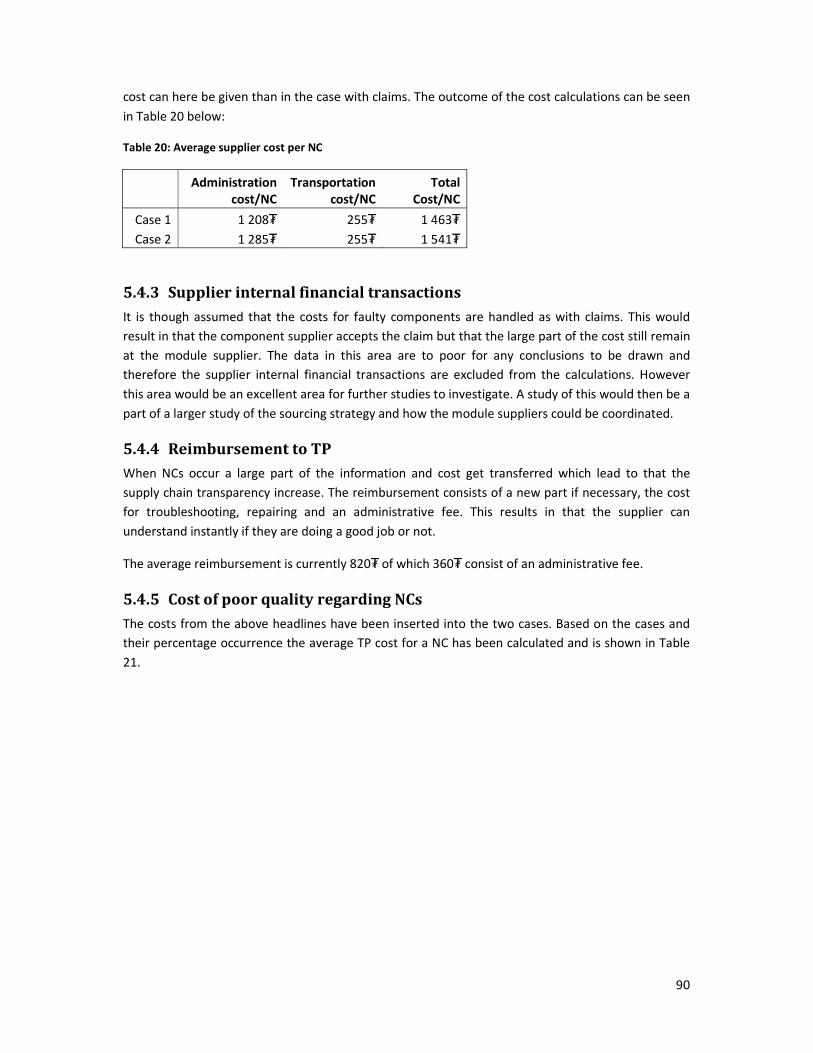
90
cost can here be given than in the case with claims. The outcome of the cost calculations can be seen
in Table 20 below:
Table 20: Average supplier cost per NC
Administration
cost/NC
Transportation
cost/NC
Total
Cost/NC
Case 1 1 208₮ 255₮ 1 463₮
Case 2 1 285₮ 255₮ 1 541₮
5.4.3 Supplier internal financial transactions
It is though assumed that the costs for faulty components are handled as with claims. This would
result in that the component supplier accepts the claim but that the large part of the cost still remain
at the module supplier. The data in this area are to poor for any conclusions to be drawn and
therefore the supplier internal financial transactions are excluded from the calculations. However
this area would be an excellent area for further studies to investigate. A study of this would then be a
part of a larger study of the sourcing strategy and how the module suppliers could be coordinated.
5.4.4 Reimbursement to TP
When NCs occur a large part of the information and cost get transferred which lead to that the
supply chain transparency increase. The reimbursement consists of a new part if necessary, the cost
for troubleshooting, repairing and an administrative fee. This results in that the supplier can
understand instantly if they are doing a good job or not.
The average reimbursement is currently 820₮ of which 360₮ consist of an administrative fee.
5.4.5 Cost of poor quality regarding NCs
The costs from the above headlines have been inserted into the two cases. Based on the cases and
their percentage occurrence the average TP cost for a NC has been calculated and is shown in Table
21.

91
Table 21: Tetra Pak average NC related cost
Administration 1049₮ 1049₮
Repair and
Troubleshooting
1075₮ 1075₮
Supplier
compensation to TP 762₮ -762₮ 0₮
Supplier
administration & 5-
Why
1536₮ 1536₮
New material 0₮
TOTAL 2298₮ 1363₮ 3660₮
Interesting points from the summarised NC shows that even though 93% of the NCs are accepted by
suppliers only 36% of Tetra Pak costs are covered by the supplier penalties. However the supplier
costs for at NC found at Tetra Pak is nearly the double of Tetra Pak’s own cost because of this
penalty.
5.5 Corrective actions
It is in the corrective actions that the different stages of the industry lifecycle from Table 3 in page 16
truly interact. The claims can be found in the last stage (installation and service) of the cycle and the
NCs in sixth (Mechanical inspection and functional test). The information that enters the company
from the Claim and NC processes is the main feedback to all the other stages. Hence it is one of the
most important tools for TQM. But this information is not really used in full as long as it does not
enter a position on the prioritisation tool where a corrective action can be considered.
The project manager for the Servo Motor on the TT/3 1700 case presented in chapter 4.6.3 felt that
it was difficult to justify the cost of the project and the resulting rebuilding kit with the calculations
that were normally used. Management decided that the project should have a go anyway since they
realised that the issue was a big problem for the customers. The initial calculations was conducted
with only a revision of the part cost savings that could be avoided for Tetra Pak and did not consider
service labour cost, administration or the customers cost since none of these were available for the
project leader. When the CCRCM was used and the actual costs for administration and the true
reimbursable costs were added, the payback time decreased to around 1,3 years. This was the case
SCOMod supp
Platform
12
SCOMod supp
Platform
12

92
when the last years incoming claims were counted and the main part of the sold motors were
expected to be sold due to the problem, so the customer cost was added. This resulted in that over a
hundred breakdowns were included. This way of calculating can be discussed since the actual claims
where less than a third of the servo motors broken down during the time, but if the customers are
supposed to come first the authors claim that this is the way to calculate the payback. After all, this is
what affects the customer due to poor design from Tetra Pak. There are also two winners in the
supply chain with this problem. The manufacturer of the motor make good money when the
company constantly has to buy new ones, or even when diaries send their motors direct to the
manufacturer for repair while installing another motor from stock.
The cost for solution and implementation of the case studied above was fairly high and is expected to
be just over 3 100 000 ₮. In average the CE and CB platform estimates that the cost for conducting a
corrective action is somewhere around 2 300 000 ₮. The number of corrective actions conducted
that is related to claims divided by the number of claims the Economy platform has result in a high
cost per claim. Normally one action is conducted to eradicate 20-30 claims. This high cost per
eradicated claim and the fact that only 20% of the started corrective actions at the platforms come
from claims result in that an action started from a claim has to be very expensive for Tetra Pak to be
started. By this it will be difficult to make quick wins by starting easy actions that may not have that
high value or that many claims, but might save much unnecessary cost for the supply chain in the
long run.
The corrective actions in the SCO-CE come from claims in a much higher degree that what is the case
at the platforms and the cost to initiate an action is much lower. A bottom up calculation of the costs
was initiated but gave no good result since all actions are so different. The top down calculation
though reviled that the average cost to eradicate a claim a yearly basis is 3 400₮. Thanks to this the
SQAs can make more of those quick fixes that are difficult to accomplish at the platforms. As the case
with the gasket show, issues that might never be able to go through the traditional prioritisation, can
make a short cut into a corrective action if management believe that much money can be saved in
the supply chain and customer satisfaction can increase with relatively small means. The same
arguments can be used to justify the SQAs. With the here calculated cost for a claim, the SQAs do not
have to prevent many claims in order to earn their salary. In other words, the corrective actions done
to prevent new claims save Tetra Pak much COPQ.
If the CCRC-model was used to develop standard cases for what costs the customer incur when a
specific type of articles break down, like hydraulics or electronics, better prioritisation could be done.
In this way the customers cost would be much more apparent than what is done today. When the
customer is brought into the prioritisation like this the customer view would grow much stronger in
the company.
5.6 Cost of failure of control compared to cost of control
Tetra Pak is a highly innovative company and their customers expect much from their products. This
creates a pressure from the sales personnel to release new machines fast to the market or at least to
let their customer have a machine installed for field tests. This has created a situation where many
changes have to be done on machines when they are already released to customers and in use. This
causes high costs to the organisation. As described in chapter 5.5 the engineering of the solution
currently use 16 % and the rest of the resources of a project are dedicated to the deployment. In this

93
calculation the customer cost for the deployment is not added. The customers will, in most cases,
have to stop there production in order to implement the solution and therefore the cost of the
supply chain to deploy the solution is much higher than 84 %. This confirms the theory in Figure 7 on
page 22. In Figure 48 below the relative Tetra Pak cost for making changes in different steps of
development is shown.
Develop
ment
Plann
ing
Productio
n
In us
e
1
10
100
1000
Time
Relative cost for changes
(Logarithmic scale)
Engineering
Solution
(16%)
Deploying
solution
(84%)
Figure 48: Cost for making changes within corrective actions
The cost of claims is more than ten times higher than the cost of NCs for Tetra Pak. If this also is
adapted to the relative cost that is created in different steps of development the image in Figure 49
below is created. If better test models can be created that capture more potential claims, a lot of
money can be saved. Since most of the claims occur early after installation this should not be
impossible. As we have seen the cost for the customer is, most often, much higher than for Tetra
Pak. This means that if more claims could be found earlier and therefore become NCs, the supply
chain would save more than tenfold the cost of these claims.
Develop
ment
Plann
ing
Productio
n
In us
e
1
10
100
1000
Time
Relative cost for quality issues
(Logarithmic scale)
NC
Claims
Figure 49: Cost of failure of control in different stages of the development in Tetra Pak (compare to Figure 7)

94
In the figure above the cost for corrective actions has not been included since they are not as easy to
compare piece by piece. These though almost only arise due to issues from when the machines are in
use at customers. Only about 20 % of the corrective actions have come to be due to claims and since
the main part of the claims only arise less than the ten times during eight months, which is required
to be entered in the prioritisation tool, many changes that could improve the quality of the machines
never come to be.
Much of the quality work in Tetra Pak is currently aimed at reactive work when issues arise after a
long period where management expected that quality was inherent in the walls of the company and
was not needed to give much attention. Recently efforts with World Class Manufacturing and
projects in the TQ department are though aimed at shifting the resources to a more proactive work.
These efforts will result in that Tetra Pak ends up with higher prevention and appraisal costs but with
the effect that the much more costly external failures will decrease. These efforts should therefore
be further elaborated in order to decrease the cost for external failures.
5.7 Supply chain transparency
Greater Middle East
North America
Sub Sahara Africa
Central & South America
East Europe & Central Asia
South & Southeast Asia
North Europe
Greater China
South Europe
North East Asia & Oceania
Central Europe
-0,80
-0,60
-0,40
-0,20
0,00
0,20
0,40
0,60
0,80
1,00
1,20
Figure 50: Clusters relative claim frequency compared to average
In Figure 50, the relative frequencies the Clusters send in claims are compared to the average
frequency. It is evident that Central Europe sends in more than 100 % more claims than average, and
here it is mainly Germany that has a very professional and intense claims handling. If the claim
frequency would be at Germany’s level globally, the total number of claims would almost rise
threefold. When this number is seen it is not hard to understand that the platforms miss out on a lot
of information about technical issues. Probably some of this information takes other routes into the
company, like with e-liaison or through technical support employees. The fact is though that much of
the problems that result in COPQ are a result of bad information flows. Figure 50 is, just like Figure

95
31 in page 50, sorted with the cluster with the highest installed base to the left, which indicate that
there are big losses of information from especially Greater China and Greater Middle East. These
Clusters are claiming more than 50 % compared to the average and has a big installed base.
The cost created at the customer due to poor quality is most often not visible to those deciding on
what corrective actions to start. Some calculations can be done in the prioritisation tool and at the
SCO-CE a subjective variable has been added that is intended to give a feeling for how severe
problems that is created because of the issue. The interviews conducted have though shown that the
influence of these types of parameters could be much higher. The main variable used is number of
claims. This variable can though be misleading, especially on new model that are just entering the
market. If there are found four claims of a specific kind on a new machine with an installed base of
20 it might be more urgent to handle than eight similar claims from an established machine with an
installed base of 200.
There are many, more or less complicated, ways to increase the visibility in the supply chain and
increase customer satisfaction. One of the simpler could be that the claim administrator tags a field
in SAP R/3 if the customer indicates that they want additional compensation for consequential losses
they have suffered due to a claim. It has been shown above that it is when the customers require
additional compensation the costs for Tetra Pak sky rockets and it also shows that the customer are
truly dissatisfied with the machine performance. If several similar claims that are tagged have
entered the system, it is a clear sign that a corrective action should be started urgently.
Other ways to increase the transparency could be for someone close to the customers to describe
that customer impact on a claim with a three or five stage scale. Preferably this should be done by a
Tetra Pak technician that could see the impact with their own eyes or, in the cases when this is not
possible, it should be done by the claim administrator that receives the claim. A scale like this will
always be subjective, but it must have clear guidelines for what prerequisites should be fulfilled for
each step of the scale in order to increase the objectivity.
Field service engineers are actually a goldmine for Tetra Pak and a resource that should be used as
much as possible. They should be the ears at the customer and transfer the knowledge they get into
the company much more than the case is today.
5.8 KPI
The Tetra Pak BSC is build with the frames set by Kaplan & Norton. The documents from when the
concept was introduced in the company indicate that the guidelines that were reviewed in the theory
were used. The strategic objectives used by Tetra Pak are though today different than they were at
the BSC introduction, since they were renewed during the fall 2008. The new objectives that are
presented in this dissertation have been inserted in the strategy map, but from what is visible in the
internal information the insertion seem more cosmetic than strategic. Since the objectives are new
the strategic map and BSC probably will be more aligned not long from now. If not, this is an issue
that need to be handled soon so that it is clear to the organisation how the strategy is transformed to
operational measurements.
What gets described in Figure 17 in page 32 (what get measured gets done) can clearly be seen in the
Tetra Pak MCs. Unfortunately it is a performance measurement gone bad that make this example.
The MC is measured on the number of claims they are responsible for and how many claims they

96
send in that get rejected by the Platform/SCO-CE and the claim handling time. The simplest way to
get top score on all these measures is, not to send in any claims at all. The thought behind the
measures are honourable. The aim to measure the number of claims is aimed at getting better
quality in all routines and processes that involve customers in one way or another. The number of
rejected claims aims to improve the quality of information sent in. Finally, the time until the
customer is compensated seeks to promote rapid customer handling. If a MC has little claims and
large language problems there are large risks that the claim will be rejected and that the MC will not
get any reimbursement anyway.
If the phases for development of performance measurement systems are used the measurements
are currently in the third phase of use and assessment, where the measurement is meant to be
evaluated and challenged from its validity and reliability for measuring the organisation in a good
way. The strategic assumption behind the measure Total number of claims is that the number of
incoming claims shows how satisfied customers are and how good Tetra Pak lives up to their
commitment to quality. This would probably be true if all issues that could be claimed would be
claimed. As we have seen earlier, there are large divergences in the claim frequency at different
clusters. A good base line would be if the standard deviation would be relatively close to zero in
Figure 50 in page 94, which clearly is not the case today. This results in that the base line is not
accurate and the goal to decrease the number of claims also counteracts that a better baseline is
found. The measurement should not be totally rejected though. The big problem is that the MCs
have KPIs of it since it is they that enter the claims into the system. With a proper baseline the
platform/SCO-CE could be measured with this KPI due to the fact that the only way they can
influence the number is to improve the quality from the start.
To get an easier and more accurate KPI it should be displayed as a ratio instead. The authors’
suggestion is either to use the already implemented Claims/Machine or, even better, Claims/Package
sold. The last one would give a truer image of how utilisation influences the quality of the machines.
One reason that Carton Bottle has higher claim statistics might be that the large part of the filling
machines can be found in Europe where three shift and high utilisation is more common.
In Appendix 6: KPI comparison chart, a number of possible KPIs has been examined with the
principles suggested of Neely et al. in chapter 3.8.1 as base. The ones the authors believe would
serve the strategic objective of driving operational performance the best is those trying to measure
the impact on costumers. These are decrease customer impact and Decrease downtime at customer.
The main downside with the first is that it is it is subjective and therefore would be difficult to make
stringent classifications. It would though give a much better transparency of the supply chain as was
discussed in the former chapter. As said then this measurement could be based on a scale of three to
five steps to give a hint to where quality improvements would do most good. Decrease customer
downtime is the automatic version of the same theme. There are data systems in the company that
can monitor the machine performance in real time. This would give a true image on stops in
production. The problem is that with the current system there is no possibility to track what stop or
slow down in the production that is the result of claim, coffee break or anything else. Having
performance measurements set up between Tetra Pak and their suppliers would also give them a
position higher up to the more advanced right part of in the supply chain maturity picture shown in
Figure 51 below.

97
Tetra Pak is today considered to be on their way into the third stage because of their increasing
customer focus in the balanced score card and the efforts in the supplier development era where
better monitoring and systematic measuring of suppliers are ramping up.
Figure 51: Tetra Pak’s maturity in supply chain performance measurement
In theory the KPI that is aimed at decreasing the number of Claims in favour of NCs is a good idée
considering the difference in supply chain cost for the two and the fact that a large part of the claims
come already after a few hours. Unfortunately the baseline problem can be found just like for the
total number of claims and when this KPI has been discussed people argue that it actually is not the
same issues that are found in claims and during the first time after installation. For example assembly
issues are very common in NCs and they are mostly eradicated there so that very few are found in
the field.
Ch
ange
of
par
adig
m
Ch
ange
of
par
adig
m
Supply Chain Focus Internal Focus
Investment
Ad hoc performance measurement
Continuous performance
measurement on unconnected
processes or areas
Focus on performance
measurement of inter-organisational activities/processes
Focus on performance measurements and management with
inter-organizational partners
Scope of system

98
6 Discussion & Conclusions
This chapter aims at summarising the most important learning’s from the analysis chapter. The
research questions and purpose will be answered and recommendations on how Tetra Pak CE
should proceed according to the authors are given.
It is clear that more and more focus is directed into the quality area in Tetra Pak CE. This move is vital
for the company in these days when the competitors are getting better, more cost efficient and
competition is getting more intense. In order not to fall behind like Xerox did in the seventies the
company has to strive harder for customer satisfaction and use the knowledge in the supply chain
better. One first step Tetra Pak could take to improve in this era is to adopt a clear customer focused
quality definition, using all suggested quality dimensions, on how the company should work with
quality.
One big issue with the PAF-model is the corrective actions which in Tetra Pak make up a substantial
part of the costs of poor quality. Since these actions can be a reaction to both internal and external
discovered failures these have been given a new category within the group of failure of control. To
address the problem with TQM approach on the PAF-model the quality issue matrix (Table 9) has
been created to find events and issues that drive quality costs. With a process approach on these
events rather then a functional approach, the non-conformance path has been followed and through
this, hidden COPQ have been identified. The supply chain perspective of the problem has also helped
to reach the deeper levels of Sörqvist’s COPQ model.
The accounting system at Tetra Pak shows flaws to capture other costs than the internal
realignments. And even though this system has been expanded to capture customer compensations
it will take years before the process works well and enough data is gathered to use this for analysis.
The conclusion is that the average cost for a claim in Tetra Pak CE is around 16720₮ of which the
large part (74 %) is covered by the MC, mainly in the form of customer compensation. Depending on
this and other circumstances the true cost for a claim can though have a high variability.
The most important value chain issue with the cost of claims is the customer’s costs. Therefore the
Customer claim-related cost model was developed in order to create scenarios for different claims in
different parts of the world. In the earlier conducted study, it is suggested that the customer costs
for a claim is four times the cost of Tetra Pak. This number is also confirmed by the authors’ model.
The suppliers cost has been recognised to be fairly low as long as a corrective action has not been
started. The cost of claims shows that the cost of a quality issue increase rapidly the further down
the supply chain it occurs and in the end it is the end-consumers who pay for the mistakes made.
As a project to gather quick profit and through this increase the customer focus of the organisation
the authors suggest a cross functional project directed to find the 1-2 % of claims with the highest
customer compensations to gather trends and to see what can be done to prevent these from
reoccurring.
The process for NCs puts much higher demands on the supplier than when it comes to claims.
Therefore the investigations done in this area revealed that Tetra Pak’s cost for an NC is

99
approximately 1363₮ and the supplier cost is 2298₮. This is due to the quality penalty paid by the
module supplier which makes of 33 % of the supplier’s costs.
It is evident that there are large differences in the cost of corrective actions. In D&E the cost for
conducting a corrective action project addressing 20-30 claims is estimated to 2 300 000₮ and in
SCO-CE 3 400₮ is spent per eradicated claim. A large part of the D&E cost is for deploying rebuilding
kits (84 %). Since SQA actions do not involve RKs, but merely scrapping spare parts and preventing
new defect components from entering the system, the actions from the SCO-CE is very cost effective
and gives a very rapid payback.
Due to the cost in D&E to initiate corrective actions it is natural that the rules for prioritisation have
to be strict. Today’s ´prioritisations is merely based on the number of occurrences and the cost of the
new part. To improve the prioritisation and make it more customer focused the usage of the CCRC-
model is recommended to measure customer costs and therefore also the impact on customers. This
will make the prioritisations better and help Tetra Pak become a more customer focused
organisation.
One of the obvious problems with the claims process is that people in different part of the
organisations have different expectations of the process and different views of claims. Between the
customer and the MC a claim is a customer complaint and the claim process is a way of business to
show customer focus by reimbursing the customer. Between the MC and the Platform/SCO-CE the
claim is a technical issue and the claim processes a way to gather technical information for corrective
actions. However the MCs keep the business view also in the interaction with the Platform/SCO-CE
and this, supported by misguiding KPIs creates internal Tetra Pak conflicts.
The author’s suggestion would then be to separate the business part and the technical information of
the claim. The business part should be handled closer to the customer between the MC and the
Market Cluster while only the technical information needed and the customer impact of the claim
should be forwarded to the platforms and SCO-CE. Through this Tetra Pak could be able to set up a
single system to gather all of today’s incoming information channels about quality issues. With easy
searchable information, issues can be solved faster and prioritisation can be done on better
foundations. This system could also increase the customer focus if it is possible to gather the
information of the Field Service Engineers, close to the customers, and transfer their information to
the central organisation. If the clam handling would be moved to cluster level the professionalism
would increase and the information entering the system would have higher quality. This would
especially be the case in the parts of the world where the claim frequency currently is low.
The current Quality KPIs has good intentions but contributes to the low claiming frequency that can
be seen in some clusters. Since the baseline on the key measurement, Total number of claims, has
changed so much over the years the authors question if this measurement should be used at all, as a
denominator of bonuses. If used, it should change form to a relative number measurement. To
better capture customer impact a new measurement that also would aid the prioritisation of what
claims that should result in corrective actions has been discussed. This measurement should be
captured and registered by those closest to the customer and have a clearly defined one to five scale.
When comparing the cost for claims and NCs it becomes apparent that, the sooner quality issues can
be dealt with, the lower cost the company will incur. Today Tetra Pak’s resources of time and money

100
are spent on reactive actions to correct earlier mistakes. Tetra Pak turn to its suppliers and try to
develop and increase their quality work and this is a good way to go but it is also apparent that many
of the supplier’s mistakes can be traced back to Tetra Pak. Many of these problems originate in the
product design where both the customer and the supplier involvement are too low.
It is here Tetra Pak have to do it right. And do it right the first time. Because not doing things right
the first time costs money. Huge money. Money which in the end is paid by Tetra Pak customers and
the end-consumers.

101
7 References
7.1 Literature
Alvesson, Mats & Sköldberg, Kaj (1994): Tolkning och reflektion, vetenskapsfilosofi och kvalitativ
metod, Studentlitteratur, Lund
Andersen, Ib (1998): Den uppenbara verkligheten – Val av samhällsvetenskaplig metod,
Studentlitteratur, Lund
Anthony, Robert N. & Govindarajan, Vijay (2003): Management Control Systems, 11th ed., McGraw-
Hill, New York
Bergman, Bo & Klefsjö, Bengt (2002): Kvalitet i alla led, Studentlitteratur, Malmö
Bergman, Bo & Klefsjö, Bengt (2007): Kvalitet från behov till användning, Studentlitteratur, Lund
Bell, Judith (2005): Introduktion till forskningsmetodik, 2nd ed., Studentlitteratur, Lund
Bryman, Alan & Bell, Emma (2005): Företagsekonomiska forskningsmetoder, Liber, Ljubljana
BS6143 (1981): Guide to the Determination and use of Quality Related Costs, British Standards
Institution, London
BS6143 (1992): Guide to the Determination and use of Quality Related Costs, British Standards
Institution, London
Chalmers, Alan F. (1995): Vad är vetenskap egentligen?, Nya Doxa, Otta Norge
Crosby, Philip B. (1979): Quality is free, McGraw-Hill, New York
Deming, W. Edwards (1986): Out of the crisis, Cambridge University Press, Cambridge,
Massachusetts
Feigenbaum, Armand V. (1991): Total Quality Control, 3rd ed., rev, McGraw-Hill, New York
Halvorsen, Knut (1992): Samhällsvetenskaplig metod, Studentlitteratur, Lund
Hill, Terry (2000): Manufacturing Strategy, Text and Cases, 2nd ed., Palgrave, Houndmills,
Basinstoke, Hampshire
ISO 9000:2000 (2000): Standardiseringsgruppen SIS utgåva 2,SIS Förlag AB, Stockholm
Jacobsen, Dag Ingvar (2002): Vad, hur och varför?, Studentlitteratur, Lund
Johansson, Lars-Göran (2003): Introduktion till vetenskapsteorin, Thales, Stockholm
Juran, Joseph M. & Gryna, Frank M. (1988): Juran’s Quality Control Handbook, 4th ed., McGraw-Hill,
New York

102
Kaplan, Robert S. & Cooper, Robin (1998): Cost & Effect: Using Integrated Cost System to Drive
Profitability and Performance, Harvard Business school Press, USA
Kaplan, Robert S. & Norton, David P. (1996): The balanced Scorecard, Harvard Business school Press,
USA
Kaplan, Robert S. & Norton, David P. (2001): The Strategy focused organization, Harvard Business
school Press, USA
Lehmann, Donald R. & Winer, Russel S. (2005): Analysis for Marketing Planning, 6th ed., McGraw-
Hill/Irwin, New York
Olve, Nils-Göran, Roy, Jan & Wetter, Magnus (1999): Balanced Scorecard i svensk praktik, Liber AB,
Malmö
Pyzdek, Thomas (2003): The Six Sigma Handbook: A Complete Guide for Green Belts, Black Belts, and
Managers at All Levels, McGraw-Hill Professional, New York
SIQ (2008): SIQs Modell för Kundorienterad Verksamhetsutveckling, SIQ Institutet för
kvalitetsutveckling, Göteborg
Skjøtt-Larsen, Tage, Schary, Philip B., Mikkola, Juliana H. & Kotzab, Herbert (2007): Managing the Global Supply Chain, 3rd ed., Copenhagen Business School Press, Gylling, Denmark.
Svenning, Conny (2003): Metodboken, Lorentz förlag, Eslöv
Sörqvist, Lars (2001): Kvalitetsbristkostnader – Ett hjälpmedel för verksamhetsutveckling,
Studentlitteratur, Lund
Wallén, Göran (1996): Vetenskapsteori och forskningsmetodik, Studentlitteratur, Lund
7.2 Articles
Anderson, Karen & McAdam Rodney (2005): An empirical analysis of lead benchmarking and
performance measurement: Guidance for qualitative research, The International Journal of Quality &
Reliability Management, Vol.22, No.4-5, 2005, p.345-375
Bourne, Mike, Wilcox, Mark, Neely, Andy, Platts, Ken (2000): Designing, implementing and updating
performance measurement systems, International Journal of Operations & Production Management,
Vol.20, No.7, 2000, p.754-771
Chen, Ye-Sho & Tang, Kwei (1992): A pictorial approach to poor-quality, IEEE Transactions on
Engineering Management, Vol.39, No.2, May 1992, p.149-157
Dahlgaard, Jens J., Kristensen, Kai & Kanji, Gopal K. (1992): Quality costs and total quality
management, Total Quality Management, May 2002, p.211-221
De Toni, Alberto & Tonchia, Stefano (2001): Performance measurements systems: models
characteristics and measures, International Journal of Operations & Productions Management, Vol.
21 No. 1-2, 2001, p.46-70

103
Garvin, David A. (1984): What does product quality really mean?, Sloan Management Review, Vol.26,
Fall 1984, p.25-43
Giakatis, Georgios, Enkawa, Takao & Washitani, Kazuhiko (2001): Hidden quality costs and the
distinction between quality cost and quality loss, Total Quality Management, Vol.12, Iss.2, March
2001, p.179-190
Goulden, Clive & Rawlins, Louise (1995): A hybrid model for process quality costing, International
Journal of Quality and Reliability Management, Vol.12, No.8, 1995, p.32-47
Juran, Joseph M. (1993): Made in the U.S.A.: A renaissance in quality, Harvard Business Review;
Vol.71, No.4, 1993, p.42-49
Lockamy III, Archie & McCormack, Kevin (2004): The development of a supply chain management
process maturity model using the concepts of business process orientation, Supply Chain
Management: An International Journal, Vol.9, No.4, 2004, p.272-278
Marsh, John (1989): The role of process modelling, Total Quality Management, Nov. 1989, p.285-288
Neely, Andy, Gregory, Mike & Platts, Ken (1995): Performance measurement system design – A
literature review and research agenda, International Journal of Operations & Production
Management, Vol.15, No.4, 1995, p.80-116.
Neely, Andy, Mills, John, Platts, Ken, Richards, Huw, Gregory, Mike, Bourne, Mike, Lane, Mill &
Kennerley, Mike (2000): Performance measurement system design: developing and testing a process-
based approach, International Journal of Operations & Production Management, Vol.20, No.10,
2000, p.1119-1145.
Plunkett, J.J. & Dale, Barrie G. (1987): A review of the literature on quality-related costs, Quality
Assurance, Vol. 12, No. 2, p.40-52
Porter, Leslie J. & Rayner, Paul (1992): Quality costing for total quality management, International
Journal of Production Economics, Vol. 27 1992 p.69-81
Reichheld, Frederick F. & Sasser, W. Earl Jr. (1990): Zero defections: Quality comes to services,
Harvard Business Review, September/October 1990, p.105
Ross, Douglas T. (1977): Structured Analysis (SA): A language for communicating ideas, IEEE
Transactions on Software Engineering, Vol. SE-3 No.1 Jan 1977, p.16-34
Schiffauerova, Andrea & Thomson, Vince (2006): A Review of Research on Cost of Quality Models
and Best Practices, International Journal of Quality and Reliability Management, Vol.23, No.4, 2006,
p.647-669
Srivastava, Samir K. (2008): Towards estimating Cost of Quality in supply chains, Total Quality
Management, Vol.19, No.3-4, March-April 2008, p.193-208
Tsai, Wen-Hsien (1998): Quality cost measurement under activity-based costing, International
Journal of Quality and Reliability Management, Vol.15, No.6, p.718-752

104
Yang, Ching-Chow (2008): Improving the definition and quantification of quality costs, Total Quality
Management, Vol.19, No.3-4, March-April 2008, p.175-191
7.3 Interviewees
Anderberg, Mats - Quality Assurance
Andersson, Henrik - Business Controller, Technical Service
Axelsson, Mikael - Responsible for quality towards Tetra Pak
Bacchelli, Roberta - Claims Process Manager & Process Driver
Barr, Justin - Supplier Quality Assurance Manager
Bengtsson, Fredrik - Manager, SM team
Berggren, Göran - Manager Equipment Lines Specification
Borgström, Thomas - Manager, Technical Support
Botström, Elin - Total Quality Manager
Bromage, Alexander - Supply Development Engineer
Buzzega, Daniela - Claims Coordinator, TQ
Böök, Agneta - Specialist, Claims
Carlsson, Clara - Manager, TQ Supplier Mgment
Düberg, Anders - Global Process Driver
Eldhe, Sofia - Factory Manager
Faella, Franscesco - Product Platform Director
Hammar, Tim - Liaison/Technical support
Hanzon, Niclas - Claims Engineer
Helmbring, Stina - Claims Coordinator, TQ
Holmquist, Christer - Platform Controller D/E, SCO
Incenti, Sergio - Production Technician
Ingby, Jonas - WCM Champion
Jacobsson, Kenth - Coordination manager, FACTS
Jensen, Niclas - Supply Development Engineer
Juhlin, Christina - Responsible, Product Maintenance

105
Karlström, Fredrik - Global Process Driver
Kraft, Peter - Manager, Maintenance & Claims
Kuylenstierna, Fredrik - Specialist, System Competitiveness
Leifsdotter, Pernilla - Specialist, Claims
Lucchesini, Danila - Claims Coordinator, TQ
Montanari, Marco - PLC Project Administration
Nilsson, Marcus - Supplier Quality Assurance Manager
Nordgren, Lars - TQM Manager
Olsson, Evert - Specialist, Claims
Olsson, Mikael - Development Manager A
Pernås, Anna - Claims Coordinator, TQ
Persson, Ulf C - KAM for Tetra Pak
Reis, Monica - Manager, Supplier Quality Assurance
Ricci, Raffaella - Product Life Cycle Project Manager
Ringsten, Thomas - Supplier Quality Assurance Manager
Rosenius, Anne - Manager, Maintenance Support
Rydén, Lisa - Total Quality Manager
Simonini, Carlo - External Supply Manager
Skoog, Per - Development Manager B
Smith, Adam - Director TQM
Stridsberg, Håkan - Project Coach
Virgilio, Mike – Total Quality Manager
Westphal, Susan - Process Super User
Wiese, Thomas - Test Engineer B
106
7.4 Abbreviations and definitions
BSC – Balanced Score Card CB – Platform Carton Bottle, Tetra Pak CE – Capital Equipment, Tetra Pak CE – Platform Carton Economy, Tetra Pak CGT – Platform Carton Gable Top, Tetra Pak CLA – Claim opened by MC CLAA – Claim Accepted by MC CLAR – Claim Rejected by MC CO – Commercial Operations, Tetra Pak COC – Cost of Conformance CONC – Cost of Non-Conformance COPQ – Cost of Poor Quality COQ – Cost of Quality CPA – Claim opened by platform/SCO-CE CPAA – Claim Accepted by platform/SCO-CE CPAR – Claim Rejected by platform/SCO-CE CRE – Customer Responsible Engineer CV – Platform Carton Value, Tetra Pak D&E - Development and Engineering, Tetra Pak DE – Distribution Equipment ERP – Enterprise Resource Planning FM – Filling Machine FSE – Field Service Engineer IML – Department of Industrial Management and Logistics, Lund University ISO – International Standardisation Organisation KAM – Key Account Manager KPI – Key Performance Indicator LTH – Lunds Tekniska Högskola - Faculty of Engineering, Lund University MA – Market Area, Tetra Pak MC – Market Company, Tetra Pak NC – Non-conformity OPI – Operation Performance Indicator PAF – Prevention, Appraisal, Failure PLC – Product Life Cycle PM – Packaging Materials, Tetra Pak POC – Price of Conformance PONC – Price of Non-conformance PSC – Part Supply Chain at Tetra Pak RC – Root Cause RCA – Root Cause Analysis RQA – Request for Quality Action SAP R/3 – ERP System from German SAP AG built in three layers SCO – Supply Chain Operations, Tetra Pak SDE – Supplier Development Engineering SM – Supplier Management, Tetra Pak SQA – Supplier Quality Assurance TOM – Technical Operations Manager TQ – Total Quality

107
TQM – Total Quality Management TQM – Total Quality Manager, Tetra Pak TS – Technical Services, Tetra Pak WCM – World Class Manufacturing Claim - A formal notification with reference to contractual obligations to a Manufacturer to
investigate and initiate a corrective action, including an expectation of financial compensation.
Claim Realignment report – An extract from SAP R/3 that display all claims accepted and closed at
the platforms/SCO-CE during a specified time period with the earliest date 2008-01-01.
Corrective action - Measures taken to eliminate root cause of product nonconformity, thereby
preventing the problem from reoccurring
Collateral Damage - Parts/Material/Product damaged by the incident, but not directly the cause of
the failure
Consequential Damage - Customer damage incurred indirectly by the customer due to non-
performance caused by a claim, e.g. spoiled liquid product
Discrepancy claim - Claim regarding a logistic failure
NC - Failure that is found before a machine reach the customer
Platform - Packaging Solutions platforms: Carton Value, Carton Economy, Carton Bottle and Carton
Gable Top
PM 9820.10 - Document that defines the rules for how claims should be handled in order to be
reimbursed
Rebuilding kits - Product released to eradicate a root cause to product performance gap
Root Cause - True reason for product performance gap
Root Cause Analysis - An investigation, which clearly establishes the root cause of a product
performance gap. This must be re-producible and verifiable
Root Cause eradication - Activity to eliminate the root cause of product performance gap, thereby preventing the problem from reoccurring

1
Appendix 1: Process charts over the claims process

2

3
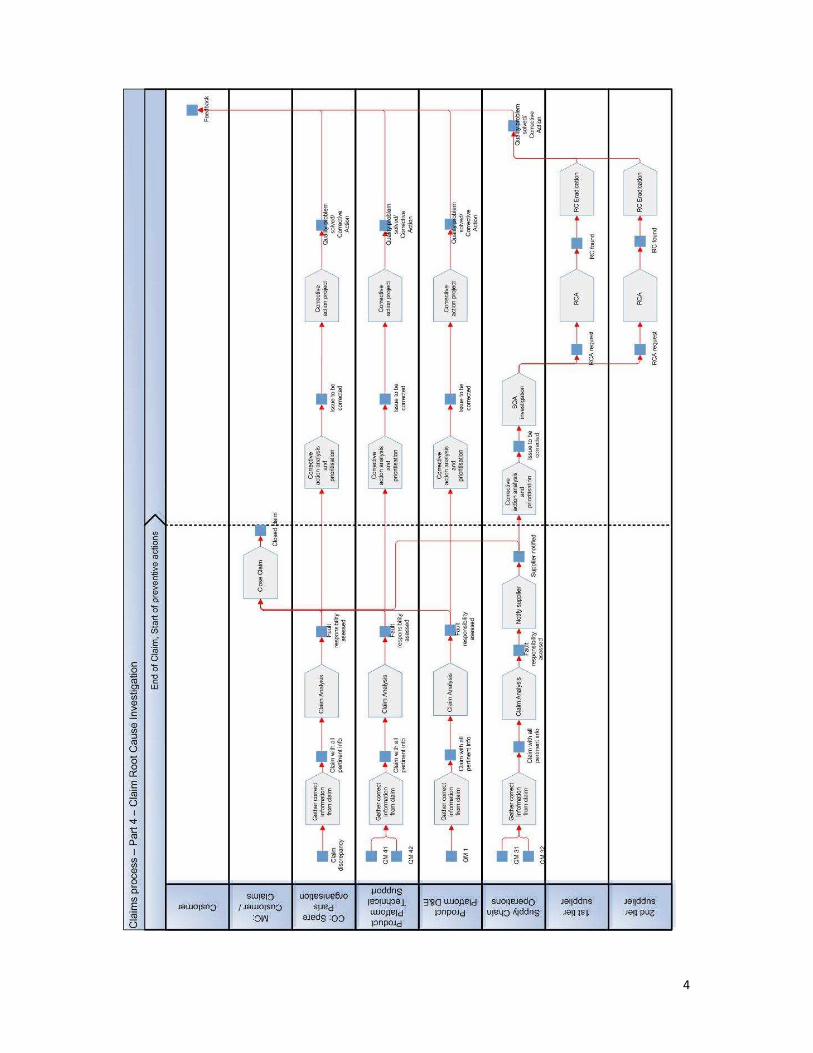
4

5
Appendix 2: Process charts over the NC process

6

7
Appendix 3: Customer claim-related cost model (CCRCM)
Instructions:
Cost base Europe 09 China 09
Filling Machine Model X X
Man cost operator [money/h] 0,00 0,00
Man cost technician [money/h] 0,00 0,00
Man cost administration [money/h] 0,00 0,00
Man cost extra testing [money/h] 0,00 0,00
Hours of planned production lost [h] 0 0
Hours of defect production (from issue to stop) [h] 0 0
Hours of consequential overtime production [h] 0 0
Total Cost of claim 0,0 0,0
Sum of monetary transfers with Tetra Pak 0,0 0,0
Direct costs 0,0 0,0
+ Cost of extra washing [money] 0,0 0,0
+ Cost of customer technician [money] 0,0 0,0
+ Cost for product in line wasted [money] 0,0 0,0
+ Cost of sorting pallets [money] 0,0 0,0
+ Cost of scrapping products [money] 0,0 0,0
+ Cost for extra product testing [money] 0 0
+ Cost of production stop [money] 0,0 0,0
Indirect costs 0,0 0,0
+ Cost of administrating claim [money] 0,0 0,0
+ Cost of consequential overtime production [money] 0,0 0,0
+ Cost of raw material consequentials loss [money] 0,0 0,0
+ Cost of lost sales [money] 0 0
+ Cost of fines for inability to deliver [money] 0 0
+ Cost of marketing loss [money] 0 0
Summarisation
CUSTOMER CLAIM-RELATED COST MODEL
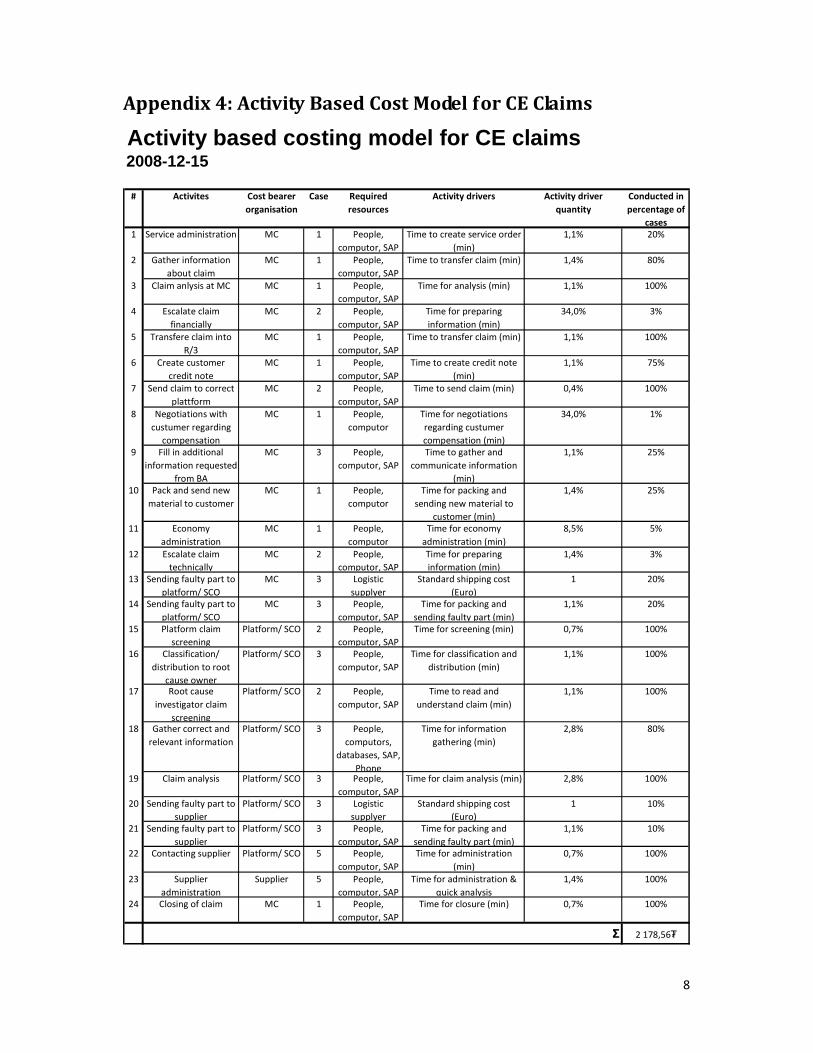
8
Appendix 4: Activity Based Cost Model for CE Claims
# Activites Cost bearer
organisation
Case Required
resources
Activity drivers Activity driver
quantity
Conducted in
percentage of
cases
1 Service administration MC 1 People,
computor, SAP
Time to create service order
(min)
1,1% 20%
2 Gather information
about claim
MC 1 People,
computor, SAP
Time to transfer claim (min) 1,4% 80%
3 Claim anlysis at MC MC 1 People,
computor, SAP
Time for analysis (min) 1,1% 100%
4 Escalate claim
financially
MC 2 People,
computor, SAP
Time for preparing
information (min)
34,0% 3%
5 Transfere claim into
R/3
MC 1 People,
computor, SAP
Time to transfer claim (min) 1,1% 100%
6 Create customer
credit note
MC 1 People,
computor, SAP
Time to create credit note
(min)
1,1% 75%
7 Send claim to correct
plattform
MC 2 People,
computor, SAP
Time to send claim (min) 0,4% 100%
8 Negotiations with
custumer regarding
compensation
MC 1 People,
computor
Time for negotiations
regarding custumer
compensation (min)
34,0% 1%
9 Fill in additional
information requested
from BA
MC 3 People,
computor, SAP
Time to gather and
communicate information
(min)
1,1% 25%
10 Pack and send new
material to customer
MC 1 People,
computor
Time for packing and
sending new material to
customer (min)
1,4% 25%
11 Economy
administration
MC 1 People,
computor
Time for economy
administration (min)
8,5% 5%
12 Escalate claim
technically
MC 2 People,
computor, SAP
Time for preparing
information (min)
1,4% 3%
13 Sending faulty part to
platform/ SCO
MC 3 Logistic
supplyer
Standard shipping cost
(Euro)
1 20%
14 Sending faulty part to
platform/ SCO
MC 3 People,
computor, SAP
Time for packing and
sending faulty part (min)
1,1% 20%
15 Platform claim
screening
Platform/ SCO 2 People,
computor, SAP
Time for screening (min) 0,7% 100%
16 Classification/
distribution to root
cause owner
Platform/ SCO 3 People,
computor, SAP
Time for classification and
distribution (min)
1,1% 100%
17 Root cause
investigator claim
screening
Platform/ SCO 2 People,
computor, SAP
Time to read and
understand claim (min)
1,1% 100%
18 Gather correct and
relevant information
Platform/ SCO 3 People,
computors,
databases, SAP,
Phone
Time for information
gathering (min)
2,8% 80%
19 Claim analysis Platform/ SCO 3 People,
computor, SAP
Time for claim analysis (min) 2,8% 100%
20 Sending faulty part to
supplier
Platform/ SCO 3 Logistic
supplyer
Standard shipping cost
(Euro)
1 10%
21 Sending faulty part to
supplier
Platform/ SCO 3 People,
computor, SAP
Time for packing and
sending faulty part (min)
1,1% 10%
22 Contacting supplier Platform/ SCO 5 People,
computor, SAP
Time for administration
(min)
0,7% 100%
23 Supplier
administration
Supplier 5 People,
computor, SAP
Time for administration &
quick analysis
1,4% 100%
24 Closing of claim MC 1 People,
computor, SAP
Time for closure (min) 0,7% 100%
Σ 2 178,56₮
Activity based costing model for CE claims2008-12-15

9
Appendix 5: Activity Based Cost Model for NCs
Activity based costing model for NCs
# Activites Cost bearer
organisation
Case Required
resources
Activity drivers Activity
driver
quantity
Conducted in
percentage of
cases
1 NC filling Form (from
production)
Platform 1 People Time to fill in NC form
(min)
3,6% 100%
2 Quality investigation Platform 1 People, analysis
equipment, tools
Time to investigate NC
(min)
10,2% 70%
3 Data registration
(Data Base)
Platform 1 People, computor,
SAP
Time to register NC in
database (min)
1,2% 100%
4 Send email to the
Supplier
Platform 1 People, computor Time to send email (min) 1,2% 100%
5 Archive
documentation
Platform 1 People, computor Time to create
documentation (min)
0,5% 100%
6 Mail to the purchaser
for reintegration of
damaged part
Platform 1 People, computor Time to mail purchaser
(min)
0,6% 50%
7 Purchasing activities Platform 1 People, computor Time to order new part
(min)
0,6% 50%
8 Handling part in
warehouse
Supplier 1 People, computor Time to handle part (min) 1,8% 50%
9 Transportation of
part
Supplier 1 Transportation
system
Cost to send part (Euro) 1 50%
10 Handling receiving
part in warehouse
Platform 1 People, computor,
SAP
Time to handle part (min) 3,6% 50%
11 Return damaged part
to the Supplier
Platform 1 People Time to send part (min) 1,2% 50%
12 Transportation of
part
Platform 1 Transportation
system
Cost to send part (Euro) 1 50%
13 Sending
administration invoice
Platform 2 People, computor Time to create invoice
(min)
2,4% 100%
14 Handling
administration invoice
Supplier 2 People, computor Time to recieve and pay
invoice (min)
2,4% 100%
15 Trouble Shooting Platform 1 People, tools Time to trouble shoot (min) 15,8% 100%
16 Repairing Time Platform 1 People, tools Time to repair (min) 18,2% 100%17 5-Why analysis Supplier 1 People, computor Time to analyse NC (min) 36,5% 100%
Σ 3 672₮
2008-12-15

10
Ap
pe
nd
ix 6
: KP
I co
mp
ar
iso
n c
ha
rt
KPI
Criteria
Deals with business
processes but is used
as a Customer focus
KPI
Would drive process
focus as total claims
but related to FM
usage
Would drive process
focus as total claims
but related to FM
available
Would drive business
processes to increase
number of NC
Would drive customer
focus and SC
transparency
Would drive customer
focus and SC
transparency
Would drive customer
focus and more
rigorous maintenance
Would drive TP focus
on expensive claims,
not customer focus
Yes Yes Yes YesDepends on
formulationYes Yes No
Suitable for D&E, not
for MC since it does
not give incentives to
report claims.
Suitable for D&E,
more suitable for MC
than current measure
but does not give
incentives to report
claims.
Suitable for D&E,
more suitable for MC
than current measure
but does not give
incentives to report
claims.
Suitable for TQ, Order
Fulfilment and
Supplier managers.
Does not give
incentives to report
claims
If downtime can be
tracked accuratly �
Can result in higher
Global customer
focus
If downtime can be
tracked accuratly �
Can result in higher
Global customer
focus
Suitable for TS and
D&E. More of a
complement to claim
KPI
Suitable for
Platform/SCO
N/A N/A N/A N/A N/A N/A N/A N/A
Yes Yes Yes Yes
Depends on
possibility to measure
impact
Depends on
possibility to measure
downtime
Yes Yes
Yes Yes Yes
Delay from NC is
found until
correlating claims are
found
Yes Yes Yes Yes
Does not drive
behaviour to file all
claims. Does
therefore not drive
continuous
improvements
Does not drive
behaviour to file all
claims. Does
therefore not drive
continuous
improvements
Does not drive
behaviour to file all
claims. Does
therefore not drive
continuous
improvements
Drive behaviour to
develop better
internal failure finding
processes
True customer impact
will drive behaviour
that adds value for
customers
True customer
downtime will drive
behaviour that adds
value for customers
To decrease
unplanned service
time will drive
behaviour that adds
value for customers
Does not drive
behaviour to file all
claims. Does
therefore not drive
continuous
improvements
No Yes Yes Yes No No Yes Yes
As long as MC has the
possibility not to file
all claim � lower
objectivity
As long as MC has the
possibility not to file
all claim � lower
objectivity
As long as MC has the
possibility not to file
all claim � lower
objectivity
As long as MC has the
possibility not to file
all claim � lower
objectivity
Probably subjective
If downtime can be
tracked automatically
� High objectivity
If service time can be
tracked automatically
� High objectivity
As long as
Platform/SCO has the
possibility not to
accept claims �
lower objectivity
Extra. Use ratio based
criteria instead of total
number
Extra. Use objective
instead of subjective
measures
4. It should be
acknowledged that
measures change as
circumstances do
5. The measures should
be simple and easy to
use
6. The measures should
provide fast feedback
7. The measures should
be designed so that they
stimulate continuous
improvement rather
than simply monitor
1. The measures should
be directly related to the
firms manufacturing
strategy
2. Non-financial
measures should be
adopted
3. It should be
recognised that
measures vary between
locations – one measure
is not suitable for all
departments or sites
Decrease total
number of claims
Decrease ratio
claims/packages sold
Increase ratio
NC/Claims
Decrease ratio
claims/installed base
Decrease customer
impact
Decrease downtime
at customer
Increase
Planned/Unplanned
service time
Decrease average
cost per claim for BA