coppoer deposits
TRANSCRIPT

8/8/2019 Coppoer Deposits
http://slidepdf.com/reader/full/coppoer-deposits 1/20
THEMATIC RESEARCH
October 11, 2
GOLD/COPPER DEPOSITS "The New Darlings"
The purpose of this report is to review the major gold/copper deposits
around the world as these assets have become "in vogue." Gold companies
are looking to acquire these types of deposits as they provide exposure to
gold (and significant size to reserves and resources), add to mine life as
they generally have longer mine lives than gold only projects, and also come
with low cash costs (especially if by-product accounting is used with coppe
revenue deducted from the operating costs). Furthermore, these types of
deposits provide gold companies with some commodity diversification.
Turning to these gold/copper deposits, it is important to first highlight that themajority are located in Chile, Canada, Australasia and Asia. A closer look a
these deposits shows that their average gold production is in excess of
350,000 oz, with copper production averaging 300 mln pounds per annum
Operating costs are generally under $400/oz for gold (GFMS global cash
cost is currently at $535/oz) or under $0.85/lb for copper. Mine lives of these
deposits are usually greater than 20 years. Capital costs to build these
assets are extensive, commonly more than $2 billion.
These significant deposits are lower grade in nature, with the average gold
grade under 0.5 g/t gold (1.3 g/t gold equivalent) and copper under 0.5% fo
reserves. Looking at the ratio of the gold value to copper value (at current
metal prices of $1,300/oz and $3.50/lb copper), the average for these
deposits is 0.71x for reserves and 0.67x for resources.
The top five senior producers have stated that part of their growth strategy
includes acquiring or adding further exposure to gold/copper deposits. These
companies have already been active in acquiring exposure to these types o
deposits. In general, purchase prices have been about $45/oz for gold
equivalent reserves and $25/oz for gold equivalent resources in 2010 (based
on gold/copper prices at the time of acquisition announcement).
This report focuses on the technical/geological characteristics of these
deposits; however, location, infrastructure support, political jurisdictions and
environmental permitting are also important in determining the ultimate
economic value of these deposits.
All dollar amounts in US$ unless otherwise noted.Industry Rating (Precious Metals): Overweight (NBF Economics & Strategy Group)
Tanya Jakusconek, M.Sc. Applied 416.869.6766 [email protected]
Associate: Joanne van Ballegooie 416.869.6767 [email protected]
Associate: Christopher Martino 416.869.6517 [email protected]
Associate: Greg Chu, CFA 416.869.8042 [email protected]

8/8/2019 Coppoer Deposits
http://slidepdf.com/reader/full/coppoer-deposits 2/20

8/8/2019 Coppoer Deposits
http://slidepdf.com/reader/full/coppoer-deposits 3/20
GOLD/COPPER DEPOSITS "THE NEW DARLINGS" OCTOBER 11, 2010
TANYA JAKUSCONEK 1
TABLE OF CONTENTS
All NBF research mentioned in this document is available at www.nbfinancial.com
THE FRENZY FOR GOLD ASSETS 2
“Gold/Copper Deposits in Vogue” 2
THE LATEST PURCHASES 3
WHAT TO LOOK FOR… 6
CONCLUSION 13

8/8/2019 Coppoer Deposits
http://slidepdf.com/reader/full/coppoer-deposits 4/20
GOLD/COPPER DEPOSITS "THE NEW DARLINGS" OCTOBER 11, 2010
TANYA JAKUSCONEK 2
THE FRENZY FOR GOLD ASSETS
“Gold/Copper Deposits in Vogue”
Gold companies are having a difficult time replacing reserves. This has especially been
the case for the senior gold producers over the last decade. Despite significant dollars
being spent in exploration, fewer and fewer discoveries are being made.
The senior gold companies today, with their significantly higher production levels than a
decade ago, are looking to replace and grow reserves annually. Concurrently, these
companies are attempting to maintain or grow their annual production profiles. Where
pure gold assets were the initial targets, gold companies are now focusing on gold/
copper deposits. The appeal of these deposits is that they not only provide exposure to
gold (with significant gold reserves and resources), have long mine lives (greater than
gold only deposits), the copper exposure also provides companies with lower cash
costs. Furthermore, the copper revenue provides some commodity diversification; with
gold companies generally keeping gold revenues greater than 70% (due to gold assets
being higher valued than non-gold).
Table 2 on page 4 shows the top 40 gold/copper deposits around the world. The table
is divided into producing assets, feasibility stage projects and earlier stage projects. It is
important to first highlight that the majority are located in Chile, Canada, Australasia and
Asia.
A closer look at these deposits shows that the average annual gold production is in
excess of 350,000 oz of gold and 300 mln pounds of copper. Operating costs are
generally under $400/oz for gold (GFMS global cash cost is currently at $535/oz) or
under $0.85/lb for copper. Mine lives of these deposits are greater than 20 years (versus
the average gold mine life of approximately 15 years). Capital costs to build these assets
are extensive, generally more than $2 billion. Looking at this number on a gold
equivalent basis (based on $1,300/oz gold price and $3.50/lb copper price), the average
capital cost is about $85/oz for gold equivalent reserves and $50/oz for gold equivalent
resources.
These significant deposits are lower grade in nature, with the average gold grade under
0.5 g/t gold (1.3 g/t gold equivalent) and copper under 0.5% for reserves. For overall
resources, the average grade is 0.4 g/t gold (1.2 g/t gold equivalent) and copper at
0.43%. Looking at the ratio of the gold value to copper value (at current metal prices of
$1,300/oz gold and $3.50/lb copper), the average for these deposits is 0.71x for reserves
and 0.67x for resources.

8/8/2019 Coppoer Deposits
http://slidepdf.com/reader/full/coppoer-deposits 5/20
GOLD/COPPER DEPOSITS "THE NEW DARLINGS" OCTOBER 11, 2010
TANYA JAKUSCONEK 3
THE LATEST PURCHASES
The main senior producers have stated that part of their growth strategy includes acquiring
or adding further exposure to gold/copper deposits. These include Barrick, Goldcorp,
Newmont, Gold Fields and AngloGold Ashanti.
These companies have already been active in acquiring exposure to these types of deposits.In general, the purchase price has been about $30-$55/oz for gold equivalent reserves
and $20-$40/oz for gold equivalent resources in 2010 (based on gold/copper prices at
time of the acquisition announcement). Some of the acquisitions in this space are
included in Table 1 below.
September 2010: Far Southeast (Philippines) GFI has the right to purchase a 60%
interest in this deposit for a total purchase price of $340 mln (gold price at $1,274/oz
and copper at $3.50/lb at time of announcement). Based on these prices, GFI paid $49/
oz equivalent reserves and $19/oz for equivalent resources.
September 2010: Xietongmen (China) Continental Minerals is being acquired by
Jinchuan for its Xietongmen project for $418 mln or Cdn$432 mln (gold price at $1,274and copper price at $3.50/lb). Based on these prices, Jinchuan paid $49/oz for equivalent
reserves and $17/oz for equivalent resources.
July 2010: Mount Milligan (Canada) Thompson Creek acquired a 100% interest in
the Mount Milligan deposit by acquiring Terrane Metals for $626 mln or Cdn$650 mln
(gold price at $1,208/oz and copper at $3.02/lb). Based on these prices, Thompson
Creek paid $55/oz for equivalent reserves and $42/oz for equivalent resources.
March 2010: Cerro Casale (Chile) Kinross sold its 25% interest in Cerro Casale to
Barrick for $474 mln (gold price $1,119/oz and copper at $3.22/lb). Based on these
prices, ABX paid $47/oz for equivalent reserves and $35/oz for equivalent resources.
January 2010: El Morro (Chile) Goldcorp acquired a 70% interest in the El Morro
deposit from Xstrata for $513 mln (gold price at $1,130/oz and copper at $3.40/lb).
This sale is being contested by Barrick Gold. Based on these prices, G paid $31/oz for
equivalent reserves and $24/oz for equivalent resources.
TABLE 1: PURCHASE PRICE FOR GOLD/COPPER ASSETS
Source: Company reports, NBF
DateProject
Name
Purchase
Price
($ mln)
Interest
(%)
Gold
Price
($/oz)
Copper
price
($/lb)
AuEq Reserve -
company share
(mln oz)
AuEq Resource -
company share
(mln oz)
Purchase Price
per AuEq
Reserve ($/oz)
Purchase Price
per AuEq
Resource ($/oz)
Sep-10 Far Southeast 340 60% 1,274 3.50 6.96 18.10 48.84 18.79
Sep-10 Xietongmen 418 100% 1,274 3.50 8.59 25.07 48.64 16.67Jul-10 Mount Milligan 626 100% 1,208 3.02 11.34 14.89 55.23 42.04
Mar-10 Cerro Casale 474 25% 1,119 3.22 9.98 13.69 47.48 34.63
Jan-10 El Morro 513 70% 1,130 3.40 16.79 21.66 30.56 23.69
Average 46.15 27.16

8/8/2019 Coppoer Deposits
http://slidepdf.com/reader/full/coppoer-deposits 6/20

8/8/2019 Coppoer Deposits
http://slidepdf.com/reader/full/coppoer-deposits 7/20

8/8/2019 Coppoer Deposits
http://slidepdf.com/reader/full/coppoer-deposits 8/20
GOLD/COPPER DEPOSITS "THE NEW DARLINGS" OCTOBER 11, 2010
TANYA JAKUSCONEK 6
WHAT TO LOOK FOR…
On the following pages, we have charted various important characteristics of these gold/
copper deposits that gold companies are likely to focus on when considering acquisition
targets. This includes gold and gold equivalent reserves, overall resources, grade, capital per
ounce to build and gold content value versus copper value. Location, of course, is another
criterion as both political risk (although individual companies hold varying views on politicalrisk and their own political risk profiles) and infrastructure availability play a role.
Environmental permitting is also another parameter of importance when considering the
ultimate economics of a project, but it is hard to quantify. The following can be highlighted:
Based on proven and probable gold reserves, Grasberg stands out as having the largest
gold reserves at more than 70 mln oz. KSM is second at just over 30 mln oz and Cerro
Casale third at more than 20 mln oz.
Based on gold equivalent reserves, Grasberg again stands out with reserves over 200 mln
oz gold. Sarcheshmeh and Los Pelambres have over 50 mln oz of gold equivalent.
Reserve gold grade shows the Far Southeast Project having the highest grade at about
1.5 g/t and Grasberg at 0.86 g/t. The average reserve gold grade is about 0.45 g/t.
Gold equivalent reserve grade shows the Far Southeast having the highest grade at
almost 3.0 g/t. Grasberg is second at 2.7 g/t. The average gold equivalent grade is 1.29
g/t.
Based on overall gold resources (2P, M&I and Inferred), Grasberg again stands out
having the largest gold resources followed by Pebble and KSM.
Based on overall gold equivalent resources (2P, M&I and Inferred), Grasberg is the
largest, followed by Pebble and Oyu Tolgoi.
Resource gold grade shows the Far Southeast project at over 1.6 g/t and Silangan and
Skouries at just over 0.80 g/t. The average resource gold grade is about 0.39 g/t. Gold equivalent resource grade shows the Far Southeast deposit at over 3.0 g/t with the
Silangan deposit the second highest at about 2.36 g/t. The average gold equivalent grade
is about 1.19 g/t.
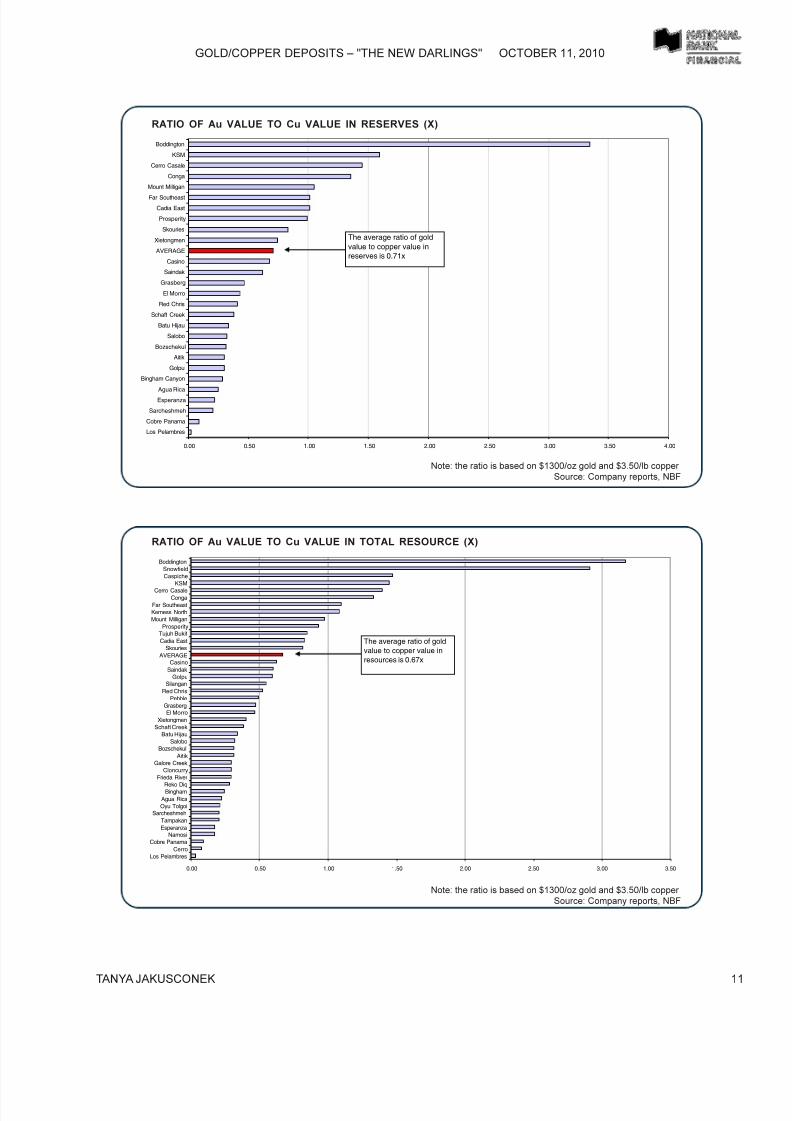
Looking at the ratio of gold value to copper value in reserves, Boddington stands out at
3.35x, followed by KSM and Cerro Casale. The average gold to copper ratio average is
about 0.71x.
Looking at the ratio of gold value to copper value in the total resource, Boddington
stands out at 3.17x, followed by Snowfield and Caspiche. The average gold to copper
ratio average being about 0.67x.
Looking at the initial capital cost to build a project, the average is about $85/oz gold
equivalent reserve. The highest development cost per equivalent ounce is Golpu, followed
by Schaft Creek.
Looking at the initial capital cost to build a project, the average is about $50/oz gold
equivalent resource. The highest development cost per equivalent ounce is Galore Creek,
followed by Conga both over $100/oz.

8/8/2019 Coppoer Deposits
http://slidepdf.com/reader/full/coppoer-deposits 9/20
GOLD/COPPER DEPOSITS "THE NEW DARLINGS" OCTOBER 11, 2010
TANYA JAKUSCONEK 7
0 50 100 150 200 250
Saindak
Golpu
Red Chris
Xietongmen
SkouriesFar Southeast
Mount Milligan
Aitik
Bingham Canyon
Casino
Schaft Creek
Conga
El Morro
Prosperity
Esperanza
Boddington
Agua Rica
Bozschekul
Batu Hijau
Cerro Casale
Cadia East
KSM
Salobo
Cobre Panama
Los Pelambres
Sarcheshmeh
Grasberg
AuEq Reserves (Mln oz)
0 10 20 30 40 50 60 70 80
Saindak
Golpu
Los Pelambres
Red Chris
Aitik
Xietongmen
Skouries
Esperanza
Bingham Canyon
Cobre Panama
Schaft Creek
Far Southeast
Agua Rica
Mount Milligan
El Morro
Bozschekul
Casino
Batu Hijau
Sarcheshmeh
Prosperity
Conga
Salobo
Cadia East
Boddington
Cerro Casale
KSM
Grasberg
Gold Reserves (Mln oz)
GOLD RESERVE (MLN oz)
Source: Company reports, NBF
GOLD EQUIVALENT RESERVES (MLN oz)
Source: Company reports, NBF

8/8/2019 Coppoer Deposits
http://slidepdf.com/reader/full/coppoer-deposits 10/20
GOLD/COPPER DEPOSITS "THE NEW DARLINGS" OCTOBER 11, 2010
TANYA JAKUSCONEK 8
0.00 0.20 0.40 0.60 0.80 1.00 1.20 1.40 1.60
Los Pelambres
Cobre Panama
AitikBozschekul
Schaft Creek
Esperanza
Agua Rica
Batu Hijau
Bingham Canyon
Casino
Red Chris
Sarcheshmeh
Mount Milligan
Prosperity
AVERAGE
Salobo
El Morro
Saindak
KSM
Cerro Casale
Cadia East
GolpuXietongmen
Conga
Boddington
Skouries
Grasberg
Far Southeast
Au Grade (g/t)
The average reserve gold
grade is 0.45 g/t
RESERVE GOLD GRADE (g/t)
Source: Company reports, NBF
RESERVE GOLD EQUIVALENT GRADE (g/t)
Source: Company reports, NBF
0.00 0.50 1.00 1.50 2.00 2.50 3.00 3.50
Aitik
Casino
Mount Milligan
Schaft Creek
Cobre Panama
Prosperity
Bozschekul
Boddington
Red Chris
KSM
Batu Hijau
Cerro Casale
Bingham Canyon
Conga
Agua Rica
Cadia East
Los Pelambres
Esperanza
AVERAGE
Saindak
Xietongmen
El Morro
Sarcheshmeh
Skouries
Salobo
Golpu
Grasberg
Far Southeast
AuEq Grade (g/t)
The average reserve
gold equivalent grade is
1.29 g/t

8/8/2019 Coppoer Deposits
http://slidepdf.com/reader/full/coppoer-deposits 11/20
GOLD/COPPER DEPOSITS "THE NEW DARLINGS" OCTOBER 11, 2010
TANYA JAKUSCONEK 9
0 20 40 60 80 100 120 140
NamosiEsperanza
Cerro ColoradoCloncurrySilanganSaindak
Kemess NorthXietongmen
Los PelambresMount Milligan
BozschekulBingham
Schaft CreekAitik
SkouriesEl Morro
Galore CreekCasino
Tujuh BukitAgua Rica
SarcheshmehCobre Panama
Batu HijauRed ChrisProsperity
SaloboFrieda River
CongaGolpu
Far SoutheastTampakanCaspiche
Cerro Casale
BoddingtonCadia EastSnowfieldReko Diq
Oyu TolgoiKSM
PebbleGrasberg
Gold Resources (Mln oz)
GOLD RESOURCES (ALL CATEGORIES)
Source: Company reports, NBF
GOLD EQUIVALENT RESOURCES (ALL CATEGORIES)
Source: Company reports, NBF
0 50 100 150 200 250 300 350 400
Kemess North
Mount MilliganSilanganSaindak
SkouriesTujuh BukitXietongmen
Cloncurry
CasinoConga
Prosperity
El MorroFar Southeast
Schaft Creek
BozschekulRed Chris
Aitik
EsperanzaNamosi
Bingham
Galore Creek
GolpuBoddington
CaspicheSnowfield
Batu HijauCerro Casale
Agua RicaSalobo
Sarcheshmeh
Frieda River
Cadia EastCerro Colorado
KSMTampakan
Cobre PanamaReko Diq
Los Pelambres
Oyu TolgoiPebble
Grasberg
AuEq Resources (Mln oz)

8/8/2019 Coppoer Deposits
http://slidepdf.com/reader/full/coppoer-deposits 12/20
GOLD/COPPER DEPOSITS "THE NEW DARLINGS" OCTOBER 11, 2010
TANYA JAKUSCONEK 10
0.00 0.50 1.00 1.50 2.00 2.50 3.00 3.50
AitikKemess North
CasinoSchaft Creek
Cobre PanamaMount Milligan
SnowfieldCaspiche
BoddingtonProsperity
BozschekulXietongmen
Cerro CasaleKSM
Batu HijauNamosiPebble
Cadia EastAgua RicaEsperanza
Reko DiqConga
Los PelambresBingham
Galore CreekTujuh BukitAVERAGE
CerroRed ChrisTampakanCloncurry
SaindakFrieda River
El MorroSarcheshmeh
SkouriesSaloboGolpu
Grasberg
Oyu TolgoiSilangan
Far Southeast
AuEq Grade (g/t)
The average resource
AuEq grade is 1.19 g/t
0.00 0.20 0.40 0.60 0.80 1.00 1.20 1.40 1.60 1.80
Los PelambresCobre PanamaCerro Colorado
AitikNamosi
EsperanzaSchaft Creek
Agua RicaBozschekul
BinghamReko Diq
TampakanCasino
Batu HijauXietongmen
Galore CreekSarcheshmeh
CloncurryKemess North
PebbleFrieda River
Mount MilliganOyu TolgoiAVERAGEProsperity
Cadia EastRed Chris
El MorroSalobo
CaspicheSaindak
Cerro CasaleTujuh Bukit
SnowfieldKSM
CongaBoddington
GrasbergGolpu
SkouriesSilangan
Far Southeast
Au Grade (g/t)
The average resourcegold grade is 0.39 g/t
RESOURCE GOLD GRADE (g/t)
Source: Company reports, NBF
RESOURCE GOLD EQUIVALENT GRADE (g/t)
Source: Company reports, NBF
8/8/2019 Coppoer Deposits
http://slidepdf.com/reader/full/coppoer-deposits 13/20
GOLD/COPPER DEPOSITS "THE NEW DARLINGS" OCTOBER 11, 2010
TANYA JAKUSCONEK 11
0.00 0.50 1.00 1.50 2.00 2.50 3.00 3.50
Los Pelambres
Cerro
Cobre Panama
Namosi
Esperanza
Tampakan
Sarcheshmeh
Oyu Tolgoi
Agua Rica
BinghamReko Diq
Frieda River
Cloncurry
Galore Creek
Aitik
Bozschekul
Salobo
Batu Hijau
Schaft Creek
Xietongmen
El Morro
Grasberg
Pebble
Red Chris
Silangan
Golpu
Saindak
Casino
AVERAGE
Skouries
Cadia East
Tujuh Bukit
Prosperity
Mount Milligan
Kemess North
Far Southeast
CongaCerro Casale
KSM
Caspiche
Snowfield
Boddington
The average ratio of gold
value to copper value in
resources is 0.67x
RATIO OF Au VALUE TO Cu VALUE IN RESERVES (X)
Note: the ratio is based on $1300/oz gold and $3.50/lb copper Source: Company reports, NBF
RATIO OF Au VALUE TO Cu VALUE IN TOTAL RESOURCE (X)
Note: the ratio is based on $1300/oz gold and $3.50/lb copper Source: Company reports, NBF
0.00 0.50 1.00 1.50 2.00 2.50 3.00 3.50 4.00
Los Pelambres
Cobre Panama
Sarcheshmeh
Esperanza
Agua Rica
Bingham Canyon
Golpu
Aitik
Bozschekul
Salobo
Batu Hijau
Schaft Creek
Red Chris
El Morro
Grasberg
Saindak
Casino
AVERAGE
Xietongmen
Skouries
Prosperity
Cadia East
Far Southeast
Mount Milligan
Conga
Cerro Casale
KSM
Boddington
The average ratio of gold
value to copper value in
reserves is 0.71x

8/8/2019 Coppoer Deposits
http://slidepdf.com/reader/full/coppoer-deposits 14/20
GOLD/COPPER DEPOSITS "THE NEW DARLINGS" OCTOBER 11, 2010
TANYA JAKUSCONEK 12
0 20 40 60 80 100 120 140
Red Chris
Kemess North
Skouries
Oyu Tolgoi
Reko Diq
Xietongmen
Cadia EastProsperity
Golpu
Salobo
Cobre Panama
Agua Rica
KSM
Frieda River
AVERAGE
Tampakan
Bozschekul
Mount Milligan
Esperanza
Snowfield
Cerro Casale
Casino
El Morro
Schaft CreekConga
Galore Creek
US$/oz
The average CapitalExpenditure per AuEqResource is $50/oz
CAPITAL EXPENDITURES / AuEq oz OF RESERVE ($/oz)
Source: Company reports, NBF
CAPITAL EXPENDITURES / AuEq oz OF RESOURCE ($/oz)
Source: Company reports, NBF
0 50 100 150 200 250
Red Chris
Salobo
Skouries
Prosperity
Cadia East
Bozschekul
KSM
Xietongmen
Agua Rica
Mount Milligan
Cobre Panama
AVERAGE
Casino
Cerro Casale
Esperanza
El Morro
Conga
Schaft Creek
Golpu
US$/oz
The average CaptialExpenditure per AuEqReserve is $85/oz

8/8/2019 Coppoer Deposits
http://slidepdf.com/reader/full/coppoer-deposits 15/20
GOLD/COPPER DEPOSITS "THE NEW DARLINGS" OCTOBER 11, 2010
TANYA JAKUSCONEK 13
CONCLUSION
Many of the senior producers have stated that part of their growth strategy includes
acquiring or adding further exposure to gold/copper deposits. From our analysis the
following can be noted:
Size:Gold companies want large gold reserves and resources.
Target is over 5 mln oz
gold equivalent with the average content value of gold higher than copper.
Grade: Average gold reserve grade in these deposits are 0.45 g/t and about 1.29 g/t
equivalent. On the resource front, it is 0.39 g/t and 1.19 g/t, respectively. We believe
companies are looking at grades above 0.5 g/t on a reserve basis.
Capital Cost: Capital to build these deposits is extensive, generally more than $2 billion.
We think a minimum cost target of at least $100/oz equivalent reserve is required
to build a project.
Acquisition Cost: In this environment, about $45/oz for gold equivalent reserves
is being paid for these assets. Intangible factors are hard to quantify: These include political risk (different
companies have different risk profiles based on the jurisdiction in which they operate).
In general, deposits in Canada, Chile and Australia bode well on the political risk front.
Permitting represents another factor with various deposits facing permitting challenges.
Finally, infrastructure and regional challenges are other factors that individual companies
will need to assess.
In short; the following projects stand out:
Grasberg (Freeport McMoRan Copper & Gold) stands out as one of the worlds
largest gold/copper deposits. Although it contains a lot of gold, its value is greater incopper.
Pebble (Northern Dynasty), KSM (Seabridge) and Oyu Tolgoi (Ivanhoe) deposits
stand out with significant resources. However, the gold equivalent resource grades are
below average for Pebble and KSM. Oyu Tolgoi has more copper value than gold (Rio
Tinto owns about 34% of Ivanhoe). Rio Tinto also owns almost 20% of Northern
Dynasty (Pebble Project).
Overall, the Skouries deposit (European Goldfields) shows well in grade and value of
gold versus copper; and it is of a large size at over 8 mln oz gold equivalent.
Of note, Mount Milligan (Thompson Creek) and Prosperity (Taseko Mines) haveboth sold gold streams to Royal Gold and Franco-Nevada, respectively. As a result they
are less likely to be of interest to gold companies.
Agua Rica (Yamana Gold) has made public statements that it would like to surface
value in its Agua Rica gold/copper project in Argentina. It is open for joint venturing,
sale or partial sale of the asset.
With the recent acquisition of Red Back by Kinross, we believe Kinross will likely sell
its remaining 25% interest in Cerro Casale (joint venture ABX). The likely buyer is
ABX with its right of first refusal.

8/8/2019 Coppoer Deposits
http://slidepdf.com/reader/full/coppoer-deposits 16/20
GOLD/COPPER DEPOSITS "THE NEW DARLINGS" OCTOBER 11, 2010
TANYA JAKUSCONEK 14
Several deposits in British Colombia (Canada) stand out in size. This includes KSM
(Seabridge), Snowfield (Silver Standard Resources), Galore Creek (Nova Gold/
Teck), Schaft Creek (Copper Fox) and Red Chris (Imperial Metals), which are
located within 150km-200km of each other. Infrastructure costs are high.
Casino (Western Copper) is located in the Yukon (about 100 km from White Gold
which was recently acquired by Kinross). Its grade is below average for both gold and
gold equivalent grade (reserve and resources) but average on gold value to copper value.
Caspiche (Exeter) has over 25 mln oz in gold resources and close to 50 mln in gold
equivalent resources. It has a lower than average gold equivalent resource grade but the
project is located close to other company projects (Cerro Casale ABX/K;
Maricunga K).
Tujuh Bukit (Intrepid Mines) deposit is in Indonesia. Its inferred resources show 10
mln oz of gold or 22 mln oz gold equivalent with an above average gold resource grade
and has an average gold equivalent grade. In addition, it has above average gold to
copper value.

8/8/2019 Coppoer Deposits
http://slidepdf.com/reader/full/coppoer-deposits 17/20
GOLD/COPPER DEPOSITS "THE NEW DARLINGS" OCTOBER 11, 2010
TANYA JAKUSCONEK 15
DISCLOSURES
Ratings And What They Mean:
PRIMARY STOCK RATING: NBF has a three-tiered rating system that is relative to the coverage universe of the particular analyst.
Here is a brief description of each: Outperform The stock is expected to outperform the analysts coverage universe over the next
12 months;
Sector Perform The stock is projected to perform in line with the sector over the next 12 months; Underperform The stock is
expected to underperform the sector over the next 12 months.
SECONDARY STOCK RATING: Under Review - Our analyst has withdrawn the rating because of insufficient information and is
awaiting more information and/or clarification; Tender - Our analyst is recommending that investors tender to a specific offering for
the companys stock; Restricted - Because of ongoing investment banking transactions or because of other circumstances, NBF
policy and/or laws or regulations preclude our analyst from rating a companys stock.
INDUSTRY RATING: NBF has an Industry Weighting system that reflects the view of our Economics & Strategy Group, using itssector rotation strategy. The three tiered system rates industries as Overweight, Market Weight and Underweight, depending on the
sectors projected performance against broader market averages over the next 12 months.
RISK RATING: NBF utilizes a four-tiered risk rating system, Low, Average, Above Average and Speculative. The system attempts to
evaluate risk against the overall market. In addition to sector-specific criteria, analysts also utilize quantitative and qualitative criteria
in choosing a rating. The criteria include predictability of financial results, share price volatility, credit ratings, share liquidity and
balance sheet quality.
General
National Bank Financial (NBF) is an indirect wholly owned subsidiary of National Bank of Canada. National Bank of Canada is a
public company listed on Canadian stock exchanges.
The particulars contained herein were obtained from sources which we believe to be reliable but are not guaranteed by us and may
be incomplete. The opinions expressed are based upon our analysis and interpretation of these particulars and are not to beconstrued as a solicitation or offer to buy or sell the securities mentioned herein .
Research Analysts
The Research Analyst(s) who prepare these reports certify that their respective report accurately reflects his or her personal opinion
and that no part of h is/her compensation was, is, or will be directly or indirectly related to the specific recommendations or views as
to the securities or companies.
NBF compensates its Research Analysts from a variety of sources. The Research Department is a cost centre and is funded by the
business activities of NBF including, Institutional Equity Sales and Trading, Retail Sales, the correspondent clearing business, and
Corporate and Investment Banking. Since the revenues from these businesses vary, the funds for research compensation vary. Noone-business line has a greater influence than any other for Research Analyst compensation.
Canadian Residents
In respect of the distribution of this report in Canada, NBF accepts responsibility for its contents. To make further inquiry related to
this report, Canadian residents should contact their NBF professional representative. To effect any transaction, Canadian residents
should contact their NBF Investment advisor.
U.S. ResidentsNBF Securities (USA) Corp., an affiliate of NBF, accepts responsibility for the contents of this report, subject to any terms set out
above. Any U.S. person wishing to effect transactions in any security discussed herein should do so only through NBF Securities(USA) Corp.
UK Residents
In respect of the distribution of this report to UK residents, NBF has approved this financial promotion for the purposes of Section21(1) of the Financial Services and Markets Act 2000. NBF and/or its parent and/or any companies within or affiliates of the National
Bank of Canada group and/or any of their directors, officers and employees may have or may have had interests or long or short
positions in, and may at any time make purchases and/or sales as principal or agent, or may act or may have acted as market
maker in the relevant securities or related financial instruments discussed in this report, or may act or have acted as investment
and/or commercial banker with respect thereto. The value of investments can go down as well as up. Past performance will not
necessarily be repeated in the future. The investments contained in this report are not available to private customers. This report
does not constitute or form part o f any offer for sale or subscription of or solicitation of any offer to buy or subscribe for the securities
described herein nor shall it or any part of it form the basis of or be relied on in connection with any contract or commitment
whatsoever.
This information is only for distribution to non-private customers in the United Kingdom within the meaning of the rules of the
Regulated by the Financial Services Authority.
Copyright
This report may not be reproduced in whole or in part, or further distributed or publ ished or referred to in any manner whatsoever,
nor may the information, opinions or conclusions contained in it be referred to without in each case the prior express written consentof National Bank Financial.
NBF is a member of CIPF
NBF quarterly ratings summary and the total ratings by month can be found on our website under Research and Analysis/
Equities/About NBF Research/Quarterly Ratings Summary (link attached) http://www.nbcn.ca/cmst/site/index.jhtml?navid=803&templateID=249
The NBF Research Dissemination Policy is available on our website under Legal/Research Policy (link attached) http://www.nbcn.ca/cmst/site/index.jhtml?navid=712&templateid=243

8/8/2019 Coppoer Deposits
http://slidepdf.com/reader/full/coppoer-deposits 18/20
GOLD/COPPER DEPOSITS "THE NEW DARLINGS" OCTOBER 11, 2010
TANYA JAKUSCONEK 16
ADDITIONAL COMPANY RELATED DISCLOSURES
If a company specific disclosure is not found herein for a listed company, NBF at this time does not provide research coverage
or stock rating for the company in question
CG
In the past 12 months NBF acted as financial advisor, fiscal agent, or underwriter to the company that is the subject of this report andreceived remuneration for its services.
NBF is an indirect wholly owned subsidiary of the National Bank of Canada. From time to time the National Bank of Canada may enter into lending or financia l arrangements with companies that are the subject of NBF Research Reports. At the date of this report, National
Bank of Canada is not a lender to the company which is the subject of this report.
NBF and/or its Affiliates may have a position in the securities mentioned herein and may make purchases and/or sales of these securities
from time to time in the open market or otherwise. On the last day of the month preceding the date of this report, NBF and its Affiliates
held in the aggregate less than 1% of the outstanding shares (of any class of equity securities) of this issuer.
NBF is a Registered Trader on the Toronto Stock Exchange for the company that is the subject of this report. (1)
RGL
In the past 12 months NBF acted as financial advisor, fiscal agent, or underwriter to the company that is the subject of this report and
received remuneration for its services.
NBF is an indirect wholly owned subsidiary of the National Bank of Canada. From time to time the National Bank of Canada may enter
into lending or financia l arrangements with companies that are the subject of NBF Research Reports. At the date of this report, National
Bank of Canada is not a lender to the company which is the subject of this report.
NBF and/or its Affiliates may have a position in the securities mentioned herein and may make purchases and/or sales of these securities
from time to time in the open market or otherwise. On the last day of the month preceding the date of this report, NBF and its Affiliatesheld in the aggregate less than 1% of the outstanding shares (of any class of equity securities) of this issuer. (2)
AEM, FNV
In the past 12 months NBF has not acted as financial advisor, fiscal agent or underwriter for the company that is the subject of this report.
NBF may act in such a capacity in the future and receive, or expect to receive, compensation for such activities. NBF is an indirect wholly
owned subsidiary of the National Bank of Canada. From time to time the National Bank of Canada may enter into lending or financialarrangements with companies that are the subject of NBF Research Reports. At the date of this report, National Bank of Canada is a
lender to the company which is the subject of this report.
NBF and/or its Affiliates may have a position in the securities mentioned herein and may make purchases and/or sales of these securities
from time to time in the open market or otherwise. On the last day of the month preceding the date of this report, NBF and its Affiliates
held in the aggregate less than 1% of the outstanding shares (of any class of equity securities) of this issuer. (14)
LGG
In the past 12 months NBF has not acted as financial advisor, fiscal agent or underwriter for the company that is the subject of this report.
NBF may act in such a capacity in the future and receive, or expect to receive, compensation for such activities. NBF is an indirect wholly
owned subsidiary of the National Bank of Canada. From time to time the National Bank of Canada may enter into lending or financial
arrangements with companies that are the subject of NBF Research Reports. At the date of this report, National Bank of Canada is not a
lender to the company which is the subject of this report.
NBF and/or its Affiliates may have a position in the securities mentioned herein and may make purchases and/or sales of these securities
from time to time in the open market or otherwise. On the last day of the month preceding the date of this report, NBF and its Affiliates
held in the aggregate less than 1% of the outstanding shares (of any class of equity securities) of this issuer.
NBF is a Registered Trader on the Toronto Stock Exchange for the company that is the subject of this report. (9)
GOLD,HW, ELD, IMG, RBI, YRI
In the past 12 months NBF has not acted as financial advisor, fiscal agent or underwriter for the company that is the subject of this report.
NBF may act in such a capacity in the future and receive, or expect to receive, compensation for such activities. NBF is an indirect wholly
owned subsidiary of the National Bank of Canada. From time to time the National Bank of Canada may enter into lending or financial
arrangements with companies that are the subject of NBF Research Reports. At the date of this report, National Bank of Canada is not a
lender to the company which is the subject of this report.
NBF and/or its Affiliates may have a position in the securities mentioned herein and may make purchases and/or sales of these securities
from time to time in the open market or otherwise. On the last day of the month preceding the date of this report, NBF and its Affiliates
held in the aggregate less than 1% of the outstanding shares (of any class of equity securities) of this issuer. (10)

8/8/2019 Coppoer Deposits
http://slidepdf.com/reader/full/coppoer-deposits 19/20
RESEARCH ANALYSTS
METALS & MINING
Senior GoldsTanya Jakusconek 416.869.6766 Associate: Joanne van Ballegooie 416.869.6767 Associate: Christopher Martino 416.869.6517
Junior GoldsTara Hassan 416.869.7118 Associate: Brian Szeto 416. 869.6538
REAL ESTATE & HOSPITALITY
Jimmy Shan 416.869.802 Associate: Tanya Bouchard 416.869.793
Heather Kirk 514.390.786 Associate: Marco Giurleo 514.390.798
SPECIAL SITUATIONS
Hugues Bourgeois 514.879.257 Associate: Frederic Tremblay 514.879.249
Trevor Johnson 416.869.851 Associate: Keegan McCormick 416.869.780
TECHNOLOGY
Clean TechRupert Merer 416.869.8008 Associate: Jeremy Mersereau 416.869.6768
Comm Equipment, Broadband & Wireless
Kris Thompson 416.869.8049 Associate: Manik Verma 416.869.749
Software & IT Services
Kris Thompson 416.869.8049 Associate: Nikhil Thadani 416.869.793
TELECOMMUNICATIONS & CABLE
Greg MacDonald 416.869.6775 Associate: Kevin Krishnaratne 416.869.6585
Ihor Danyliuk 416.869.7522Director of Research
Caroline Jukes, 416.869.8039Administrative Manager
ECONOMICS AND STRATEGYStéfane Marion, 514.879.3781Chief Economist & Strategist
Yanick Desnoyers, 514.879.3140 Assistant Chief Economist
Benoit Mayer-Godin 514-879-2378Quantitative Strategist
Paul-André Pinsonnault, 514.879.3795Senior Fixed Income Economist
Marc Pinsonneault, 514.879.2589Senior Economist
Marco Lettieri, 514.879.3195
Economist Matthieu Arseneau, 514.879.5149Economist
DERIVATIVES & STRUCTURED PRODUCTSPat Chiefalo 416.869.7931 Associate: Daniel Straus 416.869.8020
TECHNICAL ANALYSISDennis Mark 416.869.7427
BIOTECH & PHARMACEUTICALSHari Sambasivam 416.869.7801 Associate: Jing Feng 416.869.6515
ENERGY
Energy ServicesBrian Purdy 403.290.5448 Associate: Ian Thies 403.290.5628
Energy Infrastructure, Pipelines & UtilitiesPatrick Kenny 403.290.5451 Associate: Anthony Sze 403.290.5445 Associate: Scott Russell 403.290.5102
Oil and Gas Seniors/IntergratedsPeter Ogden 403.290.5629 Associate: Steve Murray 403.290.5621
Research Publications
Vanda BrightManager, Publishing Services 416.869.7141
Publishing Associate: Maria Cojan 514.879.5357
National Bank Financial (the Firm) is an indirect wholly owned subsidiary of National Bank of Canada.The particulars contained herein were obtained from sources which we believe reliable but are not guaranteed by us and may be incomplete. The opinions expressed are based upon our analysis andinterpretation of these particulars and are not to be construed as a solicitation or off er to buy or sell t he securities mentioned herein. The Firm may act as financial advisor, fiscal agent or underwriterfor certain of the companies mentioned herein and may receive a remuneration for its services. The Firm and/or its officers, directors, representatives, associates, may have a position in the securitiesmentioned herein and may make purchases and/or sales of these securities from time to time in the open market or otherwise.To U.S. residents: NBF Securities (USA) Corp., an affiliate of the Firm, accepts responsibility for the contents of this report, subject to any terms set out above. Any U.S. person wishing to effecttransactions in any security discussed herein should do so only through NBF Securities (USA) Corp.This report may not be reproduced in whole or in part, or further distributed or published or referred to in any manner whatsoever nor may the information, opinions or conclusions contained in it bereferred to without in each case the prior express consent of National Bank Financial.
Oil and GasGrant Hofer 403.290.5436 Associate: Dale Lewko 403.290.5446
Dan Payne 403.290.5441
Matthew Taylor 403.290.5625
Oil and Gas Intermediates/TrustsMenal Patel 403.290.5622 Associate: Jeremy McCrea 403.290.5627 Associate: Gilbert Bong 403.290.5624
FERTILIZERS
Hari Sambasivam 416.869.7801 Associate: Jing Feng 416.869.6515
FINANCIAL SERVICES
Banking & InsurancePeter Routledge 416.869.7442 Associate: Grant Connor 416.869.6420
Diversified FinancialsShubha Rahman Khan 416.869.6425 Associate: Sunny Singh 416.869.8045
INFRASTRUCTURE AND ENGINEERING
Benoit Caron 514.879.5230 Associate: Andrew Moussa 514.879.2543
COMMUNICATIONS & MEDIA
Adam Shine 514.879.2302 Associate: Peter Stusio 514.879.2564
MERCHANDISING & CONSUMER PRODUCTS
James Durran 416.869.7930 Associate: Robert McKee 416.869.7572 Associate: Hussein Sunderji 416.869.7116
Marie-Noël KorcazFrench Translation 514.879.2492
Zuhair (Kash) KashmeriChief Research Editor 416.869.7535

8/8/2019 Coppoer Deposits
http://slidepdf.com/reader/full/coppoer-deposits 20/20
Arborg315 Main StreetArborg MB R0A 2A0204.376.2673
Baie-Comeau337, boulevard LasalleBaie-Comeau QC G4Z 2Z1418.296.8838
Beauce11505, 1re Avenue estBureau 100St-Georges de Beauce QCG5Y 7X3418.227.0121
BrandonUnit B-1212 18th StreetBrandon MB R7A 5C3204.725.3933
Burnaby206-3815 Sunset StreetBurnaby BC V5G 4W4604.541.8500
CalgarySuite 2800, 450 - 1 St SWCalgary AB T2P 5H1403.531.8400
Chatham380 St. Clair StreetChatham ON N7L 3K2519.351.7645
Chicoutimi1180, boulevard Talbot, Ste 201Chicoutimi QC G7H 4B6418.549.8888
Drumheller365 Centre StreetDrumheller AB T0J 0Y0403.823.6857
Drummondville150, rue Marchand, Bureau 401Drummondville QC J2C 4N1819.477.5024
EdmontonManulife Place10180-101st Street, Ste. 3500Edmonton AB T5J 3S4780.412.6600
Gatineau920 St-Joseph, Bureau 100Gatineau, QC J8Z 1S9
819.770.5337Granby150, rue St-JacquesBureau 202Granby QC J2 G 8V6450.378.0442
Grand-Mère602, 6e AvenueGrand-Mère QC G9T 2H5819.538.8628
Greenfield Park2120, rue Victoria, Bureau 150Greenfield Park QC J4V 1M9450.923.8255
HalifaxPurdys Wharf Tower II1969 Upper Water StreetSuite 1601Halifax NS B3J 3R7902.496.7700
Joliette40, rue Gauthier sudBureau 3500
Joliette QC J6E 4J4450.760.9595
Kelowna1632 Dickson Avenue, Ste 500Kelowna BC V1Y 7T2250.717.5510
Kentville402 Main StreetKentville NS B4N 3X7902.679.0077
Laval2500, boulevard Daniel-JohnsonBureau 610Laval QC H7T 2P6450.686.5700
Lethbridge404, 6th Street SouthLethbridge AB T1J 2C9403.388.1900
London333 Dufferin AvenueLondon ON N 6B 1Z3519.439.6228
Longueuil101, boulevard Roland-TherrienBureau 100Longueuil QC J4 H 4B9450.646.9900
Medicine Hat548 2nd Street SEMedicine Hat AB T1A 0C6403.488.5695
Mississauga350 Burnhamthorpe Road WestSuite 603,Mississauga ON L5B 3J1905.272.2799
Moncton735 Main Street, Suite 300Moncton NB E1C 1E5506.857.9926
Montréal1, Place Ville-Marie, Bureau1805Montréal QC H3B 4A9514.879.5200514.871.9000
1, Place Ville-MarieBureau 2201Montréal QC H 3B 3M4514.879.2509
Édifice Sun Life1155, rue MetcalfeMontréal QC H3B 4S9514.879.2222
Mont-St-Hilaire279, boul. Laurier Mont-St-Hilaire QC J3H 3N8450.467.4770
North Bay680 Cassells Street, Suite 101North Bay ON P1B 4A2705.476.6360
Oak Bay211-2186 Avenue Oak BayVictoria BC V8R 1G3250.953.8400
OttawaMetLife Centre50 OConnor StreetSuite 1602Ottawa ON K1P 6L2613.236.0103
360 Albert Street,Suite 1020Ottawa ON K1R 7X7613.235.3303
Penticton305 - 399, Main StreetCity Center BuildingPenticton BC V2A 5B7250.487.2600
Pointe-Claire1, rue Holiday, Tour estBureau 145Pointe-Claire QC H9R 5N3514.426.2522
Portage La Prairie2 - 602, Saskatchewan Ave E.Portage la Prairie MB R1N 0K5204.857.4749
Québec900, boul. René Lévesque estBureau 640Québec QC G1R 2B5418.649.2525
5500, boul. des Galeries,bureau 105Québec QC G2K 2E2418.627.5777
Québec - Everest2875, boul. Laurier Bureau A 515Québec QC G1V 2M2418.651.0680
Repentigny534, rue Notre-DameBureau 201Repentigny QC J6A 2T8450.582.7001
Rimouski180, rue des GouverneursBureau 004Rimouski QC G5L 8GL418.721.6767
Rivière-du-Loup10, rue BeaubienRivière-du-Loup QCG5R 1H7418.867.7900
Saskatoon410-22nd Street EastSuite 420Saskatoon SK S7K 5T6306.683.1400
Sherbrooke455, rue King ouestBureau 600Sherbrooke QC J1H 6E9819.566.7212
Sidney2537, Beacon Ave. Suite 205Sidney BC V8L 1Y3
250.657.2200Sorel26, Pl. Charles-de-MontmagnySorel QC J3P 7E3450.743.8474
St-Bruno1307, rue RobervalSt-Bruno QC J3V 5J1(450) 441-3300
St-Hyacinthe1355, rue Johnson Ouest, Ste 4100St-Hyacinthe QC J2S 8W7450.774.5354
Ste-FoyPlace de la Cité2600, boulevard Laurier, Ste 700Ste-Foy QC G1V 4W2418.654.2323
St-Lambert - Everest594, rue Victoria, 1er étageSt-Lambert QC J4P 2J6450.465.1393
St-Sauveur-des-Monts11, rue Robert,St-Sauveur-des-Monts QC J0R 1R6450.227.2777
Steinbach102-344 Main StreetSteinbach MB R5G 1Z1204.320.9536
Sudbury10 Elm Street, 5th Floor Sudbury ON P3C 1S8705.671.1160
TorontoThe Exchange Tower 130 King St. W., 4th Floor Podium,Toronto, Ontario M5X 1J9416.869.3707
121 King Street WestSuite 600
Toronto ON M5H 3T9416.865.7400
The Exchange Tower 130 King Street WestSuite 3030Toronto ON M5X 1J9416.869.8840
Toronto - Aquilon280 King Street EastToronto ON M5A1K7416.363.3050
Trois-Rivières7200, rue MarionTrois-Rivières QC G9A 0A5819.379.0000
Val d’Or647, 3e AvenueVal dOr QC J9P 1S7819.824.3687
VancouverPark Place666 Burrard Street, Suite 3300Vancouver BC V6C 2X8
604.623.6777Vernon3100 - 30th Avenue, Suite 101Vernon BC V1T 2C2250.260.4580
Victoria700-737 Yates StreetVictoria BC V8W 1L6250.953.8400
Victoriaville650, rue Jutras EstBureau 150Victoriaville QC G6S 1E1819.758.3191
WaterlooAllen Square180 King Street SouthSuite 340Waterloo ON N2J 1P8519.742.9991
Whistler8649 Forest Ridge Drive RR8Whistler BC V0N 1B8604.649.4510
White Rock1688 - 152nd StreetSuite 108South Surrey BC V4A 4N2604.541.4925
Windsor1 Riverside Drive WestSuite 600Windsor ON N9A 5K3519.258.5810
Winnipeg801-400 St. Mary AvenueWinnipeg MB R3C 4K5204.946.0297
International New York65 East 55th Street, 31st Floor New York, NY 10022Tel.: 212.632.8610
London (NBF Securities UK)(Regulated by The Financial Services Authority)71 Fenchurch Street, 11th floor London, England EC3M 4HDTel.: 44 (0) 20.7680.9370
Geneva (NBF INTERNATIONAL S.A.)15 rue du Cendrier CH-1201 Geneva, SwitzerlandTel.: 41.22.716.4747
Member Investment Dealers Association of Canada Canadian Investor Protection Fund
Winnipeg Commodities Exchange Securities Industry Association
Montreal Exchange Toronto Stock Exchange
National Bank of CanadaFinancial Inc.
New York65 East 55th Street, 34th Floor New York, NY 10022Tel.: 212.546.7500
Boston1 Federal Street, 25th Floor Boston, MA 02110Tel.: 617.357.5757