copies of slides for webcast brambles limited · pdf filestrategy implementation tom gorman,...
TRANSCRIPT

Brambles LimitedABN 89 118 896 021
Level 40 Gateway 1 Macquarie PlaceSydney NSW 2000 Australia
GPO Box 4173 Sydney NSW 2001Tel +61 2 9256 5222 Fax +61 2 9256 5299
www.brambles.com
16 February 2012 The Manager - Listings Australian Securities Exchange Limited Exchange Centre 20 Bridge Street SYDNEY NSW 2000
Via electronic lodgement Dear Sir COPIES OF SLIDES FOR WEBCAST At 10.15 am AEDT today, Tom Gorman, Chief Executive Officer and Greg Hayes, Chief Financial Officer, will webcast a presentation of Brambles’ results for the half-year ended 31 December 2011. The slides for that webcast presentation are enclosed. The slides and webcast will be available on the Brambles’ website at www.brambles.com. Yours faithfully Brambles Limited Robert Gerrard Group Company Secretary
{RNG 00076028}


First-Half Results Presentation
16 February 2012
2
Tom Gorman, CEOStrategy Implementation
Greg Hayes, CFOResults Analysis & Outlook
Tom Gorman, CEOBusiness Update & Results Highlights
Agenda

Business Update & Results Highlights
Tom Gorman, CEO
4
Key discussion points
Business update• Organisation restructure completed successfully• Delivering on growth and efficiency programs• FY12 Group Underlying profit guidance tightened:
US$1,050 million to US$1,080 million1
• Recall divestment process outcome expected by 31 March 2012
1H12 highlights• Continued turnaround in CHEP USA performance• Europe sales resilient; actions to address cost pressures in Pallets• RPCs, Containers and emerging markets growing as forecast• New business wins and sales growth in all Pallets regions
Business Update & Results Highlights
1 Group Underlying profit comprises Underlying profit, plus profit from Discontinued operations before finance costs, tax and Significant items; forecast provided at 30 June 2011 FX

Business Update
6
1 Forecast provided at 30 June 2011 FX
Strategy scorecard
Business Update & Results Highlights
US$160M of capex in 1H12 reflects growth momentum
US$550M1 growth capex program over FY12 and FY13
Progressing as planned; FY12 targets expected to be delivered
US$100M1 of synergies and efficiencies by FY15
Delivering sales growth targets communicated at FY11 results
Business expansion in RPCs, Containers and emerging markets
PROGRESSKEY INITIATIVE

7
Recall update
• Robust operating performance– Strong first-half result delivered
– Annualised first-half net new business US$45M
– On track for FY12 guidance
• Divestment process– Strong bidder interest
– Shortlist in place
– Outcome expected by 31 March 2012
Business Update & Results Highlights
Results Highlights

9
Key financial outcomes
14%
23%
21%
34%
Continuing operations
US$385MUnderlying profit
US$372MOperating profit
14.2 US¢Basic EPS
US$2,366MSales revenue
Business Update & Results Highlights
1 Pro forma figures assume Brambles had owned businesses acquired since 1 July 2010 for all of the prior corresponding period; pro forma Underlying profit growth is calculated by adjusting prior corresponding period results for amortisation expense arising from acquired identifiable intangible assets and changes to depreciation policies in acquired businesses
Sales revenue up 9% and Underlying profit up 8% on a pro forma basis1
Dividends per share unchanged at 13.0 Australian cents
10
Continued market-share growth
2615Pallets – EMEA
65Pallets - Asia-Pacific
141Containers
10556Total Pooling Solutions
1315RPCs
7840Total Pallets
4620Pallets – Americas
Net annualised new businessNet new business1(US$M)
Business Update & Results Highlights
1 Net new business wins based on pro forma figures, which assume Brambles had owned businesses acquired since 1 July 2010 for all of the prior corresponding period

11
• Integration of IFCO Pallet Management Services
• Paramount Pallet acquisition in Canada
• Sales revenue up 28% to US$984M (pro forma1 up 6%)
• Growth in all CHEP regions, especially strong in Latin America
• Key customer wins/extensions: PepsiCo (USA & Brazil); La Costeña (Mexico); Unilever (Chile)
• Underlying profit up 29% to US$158M (pro forma1 up 23%)
• Better Everyday efficiencies delivered in CHEP USA
• Improved CHEP USA customer and pricing mix
Pallets – Americas: turnaround continues
Business Update & Results Highlights
1 Pro forma figures assume Brambles had owned businesses acquired since 1 July 2010 for all of the prior corresponding period; pro forma Underlying profit growth is calculated by adjusting prior corresponding period results for amortisation expense arising from acquired identifiable intangible assets in acquired businesses
12
Pallets – EMEA: resilient sales, cost pressure
• Sales revenue up 5% to US$673M
• Market weakness in Iberia, UK & Ireland and France
• Continued growth elsewhere in Western Europe, Middle East & Africa and Central & Eastern Europe
• Key customer wins/extensions: Garcia Baquero (Spain); Danone Waters (Poland); Nestlé Waters and Kimberly-Clark (Turkey)
• Underlying profit down 8% to US$136M
• Inflationary pressure and quality costs in Western Europe
• Ongoing investment in eastward expansion
• Actions being taken to deliver incremental cost improvement
Business Update & Results Highlights

13
Measures to address EMEA cost
Planned increase in quality spending
Development costs/sales mix impacts from eastward expansion
High general inflation, fuel and lumber costs
1H12 CHALLENGE & IMPACT
US$5M
US$4M
US$14M
• US$5M increase in 2H12 vs. 2H11; stabilisation expected in FY13
• Increased plant and logistics efficiencies identified
• Improved pricing to start to flow through in 2H12
• Targeted actions being taken to reduce overheads
ACTIONS
Business Update & Results Highlights
14
Pallets Asia-Pacific: solid result
• Sales revenue up 15% to US$187M
• Increased sales volumes in Australia & New Zealand
• Strong new business growth in Asia
• Key customer wins: Colgate-Palmolive, Murray-Goulburn and Pacific Brands (Australia); Danone Waters and Midea (China); Reckitt Benckiser, Reliance Retail and ITC (India)
• Underlying profit up 17% to US$36M
• Improving profitability in Asia
• CHEP China on track for run-rate breakeven in 2H12
Business Update & Results Highlights

15
RPCs: delivering strong growth
• IFCO performing well; integration of CHEP Europe business
• Pro forma1 sales revenue up 18% to US$387M
• Growth in all regions from business expansion
• Increased penetration, new customers, new products
• Key retailer wins/extensions: Loblaw’s (Canada), Brookshire’s (USA),Cercosud (Argentina), Sonda (Brazil)
• Amortisation costs from identified intangible assets as previously announced
• One-off impact of alignment of depreciation policy
• Pro forma1 Underlying profit up 10% to US$54M
• Impact of set-up costs on new sales
Business Update & Results Highlights
1 Pro forma figures assume Brambles had owned businesses acquired since 1 July 2010 for all of the prior corresponding period; pro forma Underlying profit growth is calculated by adjusting prior corresponding period results for amortisation expense arising from acquired identifiable intangible assets and changes to depreciation policies in acquired businesses
16
Containers: investing in growth
Business Update & Results Highlights
• Sales revenue up 30% to US$135M
• New business wins driving growth
• Key wins/extensions: Automotive – Brilliance and CFMA (China), Continental, Valeo and Cummins (India); IBCs - Unilever Food Solutions, Dr Pepper Snapple Group and Kroger (USA); Aerospace Solutions - SAS
• Underlying profit up 4% to US$16M
• Profitable growth in established Catalyst & Chemical and EMEA Auto operations
• US Auto and IBC expansion progressing
• Launch of CHEP Aerospace Solutions

17
Recall: strong first-half performance
Business Update & Results Highlights
• Sales revenue up 9% to US$418M
• Robust volume increase in Document Management Solutions
• Carton volumes now in excess of 100 million
• Strong new business wins in Americas and Europe
• Operating profit excluding Significant items up 21% to US$71M
• Restructuring savings drive margin improvement
Results Analysis & Outlook
Greg Hayes, CFO

19
372 385453 471
1867
13
Operating
profit from
Continuing
operations
Significiant
items from
Continuing
operations
Underlying
profit
Discontinued
operations ex.
Significant
items
Group
Underlying
profit
FX adustment Group
Underlying
profit at 30
June 2011 FX
First-half 2012: summary profit reconciliation
Results Analysis & Outlook
(US$M)
20
First-half 2012 result
Results Analysis & Outlook
22%313.7382.1385.1Underlying profit
23%511.5628.6636.1Underlying EBITDA
32%1,762.52,328.82,365.5Sales revenue
20%306.8367.5371.7Operating profit
18%177.6209.4209.8Profit after tax
Constant FXActual FX
14%249.6285.1287.9Profit before tax
Continuing operations
Change (%)1H111H121H12(US$M)

21
Sales revenue growth: continuing operations
Results Analysis & Outlook
417
2,329
1,763
2667
56
1H11 Price/mix Organic growth Net new wins 1H12
(US$M)1
1 Constant FX basis2 Pro forma figures assume Brambles had owned businesses acquired since 1 July 2010 for all of the prior corresponding period
2,180
Pro forma2
22
Pallets: results summary
Results Analysis & Outlook
-18191818Margin (%)
6307.7302.1325.8330.2Underlying profit
Constant FXActual FX
17
316.0
(9.8)
510.8
1,821.0
173.7
662.7
984.6
1H12
474.4518.3Underlying EBITDA
-(8.5)Significant items
302.1321.7Operating profit
1917Margin (%)
51,733.41,574.41,843.6Sales revenue
7162.3162.3187.0Asia-Pacific
3642.1642.1672.8EMEA
6929.0770.0983.8Americas
Change (%)1H11 pro forma11H111H12(US$M)
1 Pro forma figures assume Brambles had owned businesses acquired since 1 July 2010 for all of the prior corresponding period; pro forma Underlying profit growth is calculated by adjusting prior corresponding period results for amortisation expense arising from acquired identifiable intangible assets
23
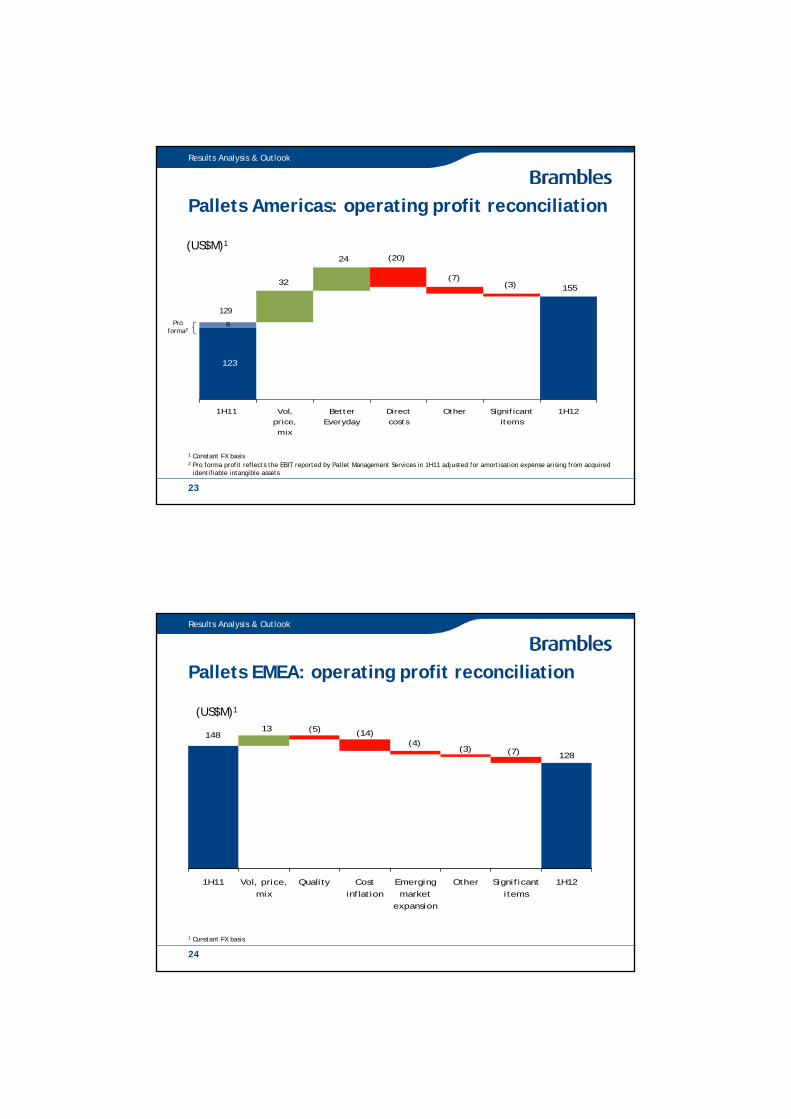
Pallets Americas: operating profit reconciliation
6
155
123
(7)
(20)
(3)
24
32
1H11 Vol,price,mix
BetterEveryday
Directcosts
Other Significantitems
1H12
(US$M)1
Results Analysis & Outlook
1 Constant FX basis2 Pro forma profit reflects the EBIT reported by Pallet Management Services in 1H11 adjusted for amortisation expense arising from acquired
identifiable intangible assets
129Pro
forma2
24
148
128
(5)
(7)(3)(4)
(14)13
1H11 Vol, price,mix
Quality Costinflation
Emergingmarket
expansion
Other Significantitems
1H12
Results Analysis & Outlook
Pallets EMEA: operating profit reconciliation
(US$M)1
1 Constant FX basis

25
3331
(3)(2)7
1H11 Vol,price,mix
Directcosts
Other 1H12
Results Analysis & Outlook
Pallets Asia-Pacific: operating profit reconciliation
1 Constant FX basis
(US$M)1
26
RPCs: results summary
Results Analysis & Outlook
Constant FXActual FX
12
46.8
(5.2)
14
52.0
98.9
376.7
49.6
12.4
70.1
244.6
1H12
1859.5-70.1North America
1910.40.812.6South America
845.845.851.8ANZ & South Africa
16
13.2
-
16
13.2
25.6
83.9
37.3
1H11
15
49.3
326.7
211.0
1H11 pro forma1 Change (%)1H12(US$M)
(5.2)Significant items
102.1Underlying EBITDA
554.2Underlying profit
15386.7Sales revenue
(1)pp14Margin (%)
49.0Operating profit
13Margin (%)
16252.2Europe
1 Pro forma figures assume Brambles had owned businesses acquired since 1 July 2010 for all of the prior corresponding period; pro forma Underlying profit growth is calculated by adjusting prior corresponding period results for amortisation expense arising from acquired identifiable intangible assets and changes to depreciation policies in acquired businesses

27
47
13
36
(2) (5)
(5)10
1H11 Vol,price,mix
Directcosts
Other Significantitems
1H12
Results Analysis & Outlook
RPCs: operating profit reconciliation
(US$M)1
49
1 Constant FX basis2 Pro forma profit reflects the EBIT reported by IFCO RPCs in 1H11 adjusted for amortisation expense arising from acquired
identifiable intangible assets and changes to depreciation policies in acquired businesses
Pro forma2
28
Containers: results summary
Results Analysis & Outlook
Constant FXActual FX
12%
16.3
30.5
131.1
16.1
18.7
19.2
77.1
1H12
15%
15.7
28.5
104.2
5.1
14.0
17.1
68.0
1H11
3319.3IBCs
21617.6Aerospace Solutions
Change (%)1H12(US$M)
731.0EBITDA
416.4Operating profit
26135.2Sales revenue
(3)12%Margin (%)
1219.6CCC
1378.7Automotive

29
1616
(3)(2)5
1H11 Vol,price,mix
Directcosts
Expansioninvestment
1H12
Results Analysis & Outlook
Containers: operating profit reconciliation
(US$M)1
1 Constant FX basis
30
Recall: results summary
Results Analysis & Outlook
0.5(19.0)(20.0)Significant items
2pp151717Margin (%)
1558.867.671.2Underlying profit1
Constant FXActual FX
12
48.6
98.1
405.6
117.9
105.9
181.8
1H12
15
59.3
84.5
384.7
116.7
93.8
174.2
1H11
1126.5Rest of World
Change (%)1H12(US$M)
16102.4Underlying EBITDA1
(18)51.2Operating profit
5417.5Sales revenue
(3)pp12Margin (%)
13109.1Europe
4181.9Americas
1 Brambles defines Underlying profit as profit from Continuing operations before finance costs, tax and Significant items; Underlying profit for Recall has been included to facilitate comparison with earnings guidance issued prior to Recall being reported within Discontinued operations

31
49
59
(3)(19)
(5)1
13
1H11 Vol,price,mix
Directcosts
Other Significantitems
1H12
Results Analysis & Outlook
Recall: operating profit reconciliation
(US$M)1
1 Constant FX basis
Cash Flow & Financing

33
Reconciliation: EBITDA to cash flow
0.4(13.5)(13.1)Significant items from continuing operations
(21.8)13.1(8.7)Cash flow from discontinued operations (incl. Significant items)
(26.3)(15.2)(41.5)Provisions/other
(144.3)276.5132.2Cash flow from continuing operations
2.552.755.2IPEP expense
(69.5)(6.2)(75.7)Working capital movement
(3.0)39.236.2Proceeds from disposals
(172.6)(305.5)(478.1)Capital expenditure
124.6511.5636.1EBITDA
(96.6)(103.8)(200.4)Dividends paid
(291.8)(3.4)(295.2)Free cash flow after dividends
(195.2)100.4(94.8)Free cash flow
(29.5)(175.7)(205.2)Financing costs and tax
(165.7)276.1110.4Cash flow from operations (incl. Significant items)
Change1H111H12(US$M) Actual FX
Results Analysis & Outlook
34
Capital expenditure trend
Results Analysis & Outlook
Note: Capital expenditure on property, plant and equipment (accruals basis) for Continuing operations
214 230 245
355301
70
70 160
1H10 2H10 1H11 2H11 1H12
Other Growth projects
315
425461
(US$M) Actual FX

35
Financial metrics
1 Gearing defined as net debt to net debt plus equity2 For the purposes of this calculation, EBITDA includes operating profit from both Continuing and Discontinued operations, after adding
back depreciation, amortisation and Significant items outside ordinary activities
55.0%57.6%Gearing1 (%)
(Actual FX) December 11 June 11
Net debt (US$M) 3,173.9 2,998.8
(Actual FX) 1H12 1H11 Covenants
EBITDA2/net finance costs (x) 8.8 10.4 3.5 (min)
Net debt/EBITDA2 (x) 2.2 1.4 3.5 (max)
Results Analysis & Outlook
• Undrawn committed credit facilities: US$873M
Outlook

37
Guidance for FY12
• Subject to unforeseen circumstances and economic uncertainty
• Sales revenue growth in constant FX from all segments
• Group Underlying profit1 guidance confirmed within tighter range: US$1,050M to US$1,080M
– 30 June 2011 FX2
– Assumes full-year contribution from Recall of US$180M to US$195M
– Prior to Significant items
• Net finance costs approximately US$170M3
• Tax rate approximately 29%
Results Analysis & Outlook
1 Includes Continuing and Discontinued operations; includes ~US$24M from amortisation of identified intangible assets from IFCO acquisition2 FY11 comparable Underlying profit is US$882M; 1H12 comparable Underlying profit is US$471M3 At 30 June 2011 FX rates
Strategy Implementation
Tom Gorman, CEO

39
1 Forecast provided at 30 June 2011 FX
Strategy scorecard
US$160M of capex in 1H12 reflects growth momentum
US$550M1 growth capex program over FY12 and FY13
Progressing as planned; FY12 targets expected to be delivered
US$100M1 of synergies and efficiencies by FY15
Delivering sales growth targets communicated at FY11 results
Business expansion in RPCs, Containers and emerging markets
PROGRESSKEY INITIATIVE
Strategy implementation
40
Scorecard: synergies and efficiencies
USA Pallets network andlogisticsoptimisation
US$5MOn track for
deliveryUS$35M by FY14
Global Pallets operations & logistics efficiencies
US$10M US$60M by FY15
US$5MEuropeanRPC network optimisation
Complete in FY12
FULL TARGETPROGRESSFY12 TARGETPROJECT AREA
1 Targets at 30 June 2011 FX
Strategy implementation

41
Scorecard: sales revenue expansion
Up 258% to US$25M
Up 15% to US$387M
Up 20% to US$225M
1H12 RESULT1AUG 11 TARGET1GROWTH AREA
At least 15% in each of FY12, FY13
Pallets - emerging markets
To double at least in each of FY12, FY13
Containers - new markets (US Auto, US IBC, Aerospace Solutions)
About 15% (pro forma) in each of FY12, FY13
RPCs
1 Sales growth at constant FX
Strategy implementation
42
Scorecard: Growth capex program
ForecastActual
550300250160140Total growth programs
30 June 2011 FXActual FX
70
10
80
1H12
100
101
301
FY11
Pallets - emerging markets growth
Containers – US Auto/IBC, Aerospace Solutions
RPCs – new business
Initiatives
20011090
1208040
Total FY12/13FY13FY12
110120 230
1 FY11 capex includes contribution from acquired businesses from the point of acquisition only; FY11 pro forma RPCs growth capex, including a full 12-month contribution from IFCO, would have been approximately US$100M
Strategy implementation

Summary
44
Key discussion points
Business update• Organisation restructure completed successfully• Delivering on growth and efficiency programs• FY12 Group Underlying profit guidance tightened:
US$1,050 million to US$1,080 million1
• Recall divestment process outcome expected by 31 March 2012
1H12 highlights• Continued turnaround in CHEP USA performance• Europe sales resilient; actions to address cost pressures in Pallets• RPCs, Containers and emerging markets growing as forecast• New business wins and sales growth in all Pallets regions
Summary
1 Group Underlying profit comprises Underlying profit, plus profit from Discontinued operations before finance costs, tax and Significant items; forecast provided at 30 June 2011 FX

First-Half Results Presentation
16 February 2012
46
Disclaimer
The release, publication or distribution of this presentation in certain jurisdictions may be restricted by law and therefore persons in such jurisdictions into which this presentation is released, published or distributed should inform themselves about and observe such restrictions.This presentation does not constitute, or form part of, an offer to sell or the solicitation of an offer to subscribe for or buy any securities, nor the solicitation of any vote or approval in any jurisdiction, nor shall there be any sale, issue or transfer of the securities referred to in this presentation in any jurisdiction in contravention of applicable law.Persons needing advice should consult their stockbroker, bank manager, solicitor, accountant or other independent financial advisor. Certain statements made in this presentation are forward-looking statements.These forward-looking statements are not historical facts but rather are based on Brambles’ current expectations, estimates and projections about the industry in which Brambles operates, and beliefs and assumptions. Words such as "anticipates," "expects," "intends," "plans," "believes," "seeks,” "estimates," and similar expressions are intended to identify forward-looking statements.These statements are not guarantees of future performance and are subject to known and unknown risks, uncertainties and other factors, some of which are beyond the control of Brambles, are difficult to predict and could cause actual results to differ materially from those expressed or forecasted in the forward-looking statements. Brambles cautions shareholders and prospective shareholders not to place undue reliance on these forward-looking statements, which reflect the view of Brambles only as of the date of this presentation.The forward-looking statements made in this presentation relate only to events as of the date on which the statements are made. Brambles will not undertake any obligation to release publicly any revisions or updates to these forward-looking statements to reflect events, circumstances or unanticipated events occurring after the date of this presentation except as required by law or by any appropriate regulatory authority.
47
Investor Relations contacts
Cathy PressGroup Vice President, Capital Markets
+61 2 9256 5241
+61 419 290 745
James HallSenior Director, Investor Relations & Corporate Affairs
+61 2 9256 5262
+61 401 524 645
Appendices

49
Appendix 1: Glossary of terms and measures
Appendices
Profit after tax, minority interests and Significant items, divided by shares in issue.EPS
Continuing operations refers to Pallets, RPCs, Containers and Brambles HQ.
Discontinued operations refers primarily to the Recall business. In addition, there were net adjustments to divestment provisions made in prior years.
Continuing operations
Discontinued operations
Constant currency results are presented by translating both current and comparable period foreign currency results into US dollars at the actual monthly exchange rates applicable in the comparable period, so as to show relative performance between the two periods before the translation impact of currency fluctuations.
Constant currency
Cash flow generated after net capital expenditure but excluding Significant items that are outside the ordinary course of business.
Cash flow from operations
Except where noted, common terms and measures used in this document are based upon the following definitions:
Brambles Value Added (BVA) represents the value generated over and above the cost of the capital used to generate that value.
It is calculated using fixed June 2011 exchange rates as: • Underlying profit; plus • Significant items that are part of the ordinary activities of the business; less • Average capital invested, adjusted for accumulated pre-tax Significant items that are part of the ordinary activities of the business, multiplied by 12%.
Brambles Value Added (BVA)
Unless otherwise stated, capital expenditure is presented on an accruals basis and excludes intangible assets, investments in associates and equity acquisitions. It is shown gross of any fixed asset disposals proceeds.
Capital expenditure (capex)
In the statutory financial statements, Brambles translates foreign currency results into US dollars at the applicable actual monthly exchange rates ruling in each period.
Actual rates
50
Appendix 1: Glossary of terms and measures (continued)
Appendices
Group Underlying profit is Underlying profit, plus profit from Discontinued operations before finance costs, tax and Significant items.
Group Underlying profit
Brambles defines net new business wins as the change in sales revenue in the reporting period resulting from business won or lost in that period and the previous financial year. The revenue impact of net new business wins is included across reporting periods for a total of 12 months from the date of the win or loss and calculated on a constant currency basis. Brambles defines net annualised new business as the implied sales revenue in 12 months from net new business won during the reporting period.
New business wins
Operating profit is profit before finance costs and tax, as shown in the statutory financial statements.Operating profit
Pallet Management Services, a division of IFCO operating in the USA.PMS
Cash flow generated after net capital expenditure, finance costs and tax, but excluding the net cost of acquisitions and proceeds from business disposals.
Free cash flow
Reusable plastic crate, used to transport fresh produce.RPC
Excludes revenues of associates and non trading revenue.Sales revenue
Except where noted, common terms and measures used in this document are based upon the following definitions:
Underlying profit is profit from Continuing operations before finance costs, tax and Significant items.Underlying profit
Significant items are items of income or expense which are, either individually or in aggregate, material to Brambles or to the relevant business segment and: • Outside the ordinary course of business (e.g. gains or losses on the sale or termination of operations, the cost of significant reorganisations or restructuring); or • Part of the ordinary activities of the business but unusual due to their size and nature.
Significant items
Based on weighted average shares in issue of 1,479.7M in 1H12; 1,425.4M in 1H11.Shares in issue

51
Appendices
43.1
46.2
202.4
GBP
1,328.6
102.2
643.6
EUR
1H12 currency mix at actual FX
(52.8)101.51,753.53,173.9Net debt1
100.220.1103.0371.7Operating profit
477.5203.2838.82,365.5Sales revenue
OtherAUDUSDTotal(US$M)
1 Net debt shown after adjustments for impact of financial derivatives
Appendix 2: Currency mix – Continuing operations
52
28.8%
72.0
249.6
Statutory
27.1%
78.1
287.9
Statutory
1H111H12
(US$M) Actual FX
73.083.1Tax expense
27.6%
301.3
Underlying
Effective tax rate
Profit before tax
28.5%
256.5
Underlying
Appendices
Appendix 3: Effective tax rate - Continuing operations

53
Appendix 4: Significant items – Continuing operations
-(5.8)Pension costs
-(7.9)Restructuring & IFCO integration costs
-1.7Foreign exchange gain on capital repatriation
(6.9)(13.4)Subtotal
Significant items:
(6.9)(1.4)Acquisition-related costs
306.8371.7Operating profit
313.7385.1Underlying profit
1H111H12(US$M) Actual FX
Appendices
54
Appendices
Appendix 5: Discontinued operations
59.1
0.3
58.8
-
58.8
1H11
47.9
(19.5)
67.4
(3.8)
71.2
1H12
Other Discontinued operations
Subtotal
Significant items
Profit before tax and significant items:
Recall
Profit before tax from Discontinued operations
(US$M) Actual FX
55
0.2
-
-
-
-
-
0.2
Uncommitted facilities
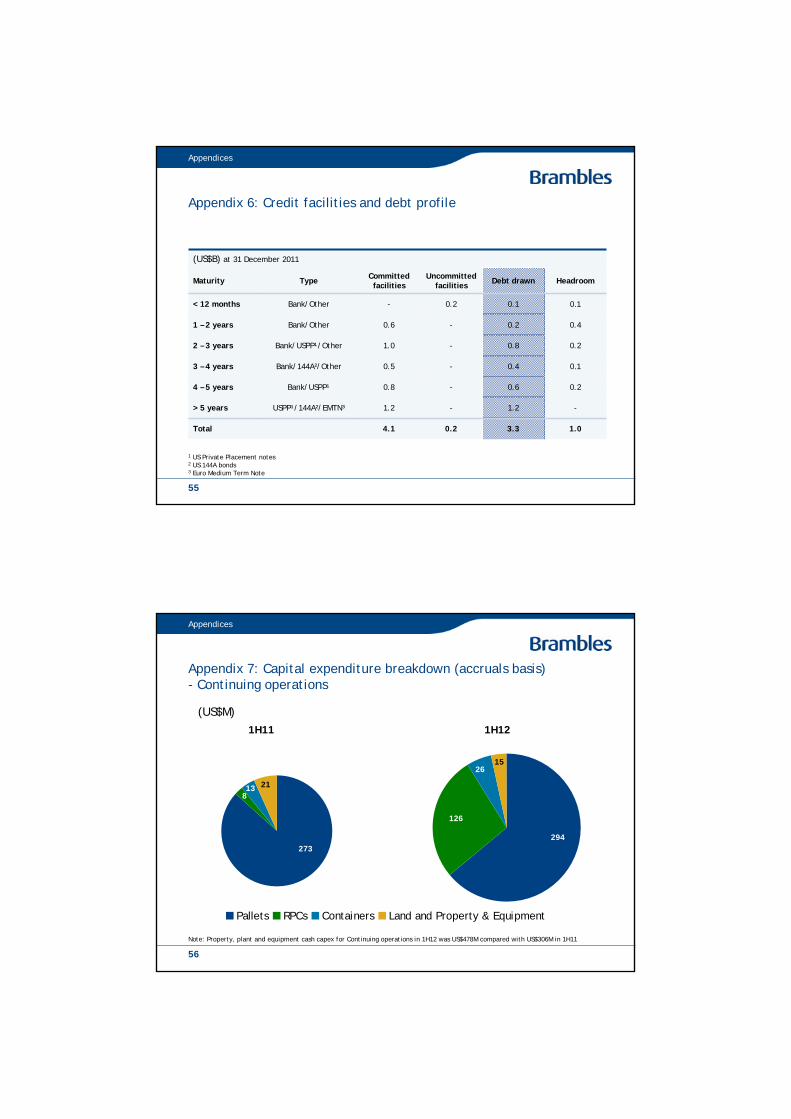
1.03.34.1Total
(US$B) at 31 December 2011
-1.21.2USPP¹/144A²/EMTN³> 5 years
0.20.60.8Bank/USPP¹4 – 5 years
0.10.40.5Bank/144A²/Other3 – 4 years
0.20.81.0Bank/USPP¹/Other2 – 3 years
0.40.20.6Bank/Other1 – 2 years
0.10.1-Bank/Other< 12 months
HeadroomDebt drawnCommitted facilitiesTypeMaturity
Appendices
1 US Private Placement notes2 US 144A bonds3 Euro Medium Term Note
Appendix 6: Credit facilities and debt profile
56
Appendix 7: Capital expenditure breakdown (accruals basis)- Continuing operations
Appendices
(US$M)1H11
Note: Property, plant and equipment cash capex for Continuing operations in 1H12 was US$478M compared with US$306M in 1H11
1H12
294
126
2615
Pallets RPCs Containers Land and Property & Equipment
273
21138

57
Appendices
15%RPCs1
26%Containers
7%Pallets - Asia-Pacific
3%Pallets – EMEA
6%Pallets – Americas1
Growth vs. 1H11
(US$M)
Appendix 8: Pooling Solutions 1H12 sales revenue by segment
1 Pro forma assumes Brambles owned businesses acquired since 1 July 2010 for all of the prior corresponding period; constant FX basis
Americas, 984
Asia-Pacific, 187
EMEA, 673
387
135
58
Appendix 9: Pallets 1H12 sales revenue by Customer Business Unit
1%Western Europe
33%Central & Eastern Europe
6%Other
0%France
9%Pallet Management Services1
6%LeanLogistics
18%Latin America
6%Canada
3%USA
3%Australia & NZ
53%Asia
14%Middle East & Africa
(4)%Iberia
1%UK & Ireland
Growth vs 1H11
Appendices
1 Pro forma assumes Brambles owned businesses acquired since 1 July 2010 for all of the prior corresponding period; constant FX basis
(US$M)
Other Western Europe, 184
France, 84
173
26 68
168
19
571
120
112
9
UK & Ireland, 176
Iberia, 134

59
158.38.5149.8Underlying profit
983.8172.7811.1Sales
17%
1,759.7
18%
Pallets -Americas (excluding PMS)(US$M) Actual FX
2,086.1326.4Average capital invested
5%
5%
PMS
Return on capital invested1
Underlying profit margin
15%
16%
Pallets -Americas
Appendices
Appendix 10: Analysis of PMS 1H12 impact on Pallets - Americas
1 Underlying profit for PMS includes US$1.5M relating to amortisation of acquired non goodwill intangibles. Average capital invested includes goodwill on acquisition of US$288.6M and acquired non goodwill intangibles.
60
Appendix 11: CHEP USA pallet rejections
Appendices
0.2%
0.3%
0.4%
0.5%
0.6%
0.7%
Jul-07 Jan-08 Jul-08 Jan-09 Jul-09 Jan-10 Jul-10 Jan-11

61
Appendix 12a: CHEP USA pallet plant operations and transportation trends
20%
25%
30%
35%
40%
45%
FY02 FY03 FY04 FY05 FY06 FY07 FY08 FY09 FY10 FY11 1H12
16%
20%
24%
28%
32%
FY02 FY03 FY04 FY05 FY06 FY07 FY08 FY09 FY10 FY11 1H12
Appendices
Plant cost ratio (Plant costs/sales)
Transportation cost ratio(Transportation costs/sales)
62
Appendix 12b: CHEP USA pallet productivity trends
90%
95%
100%
105%
FY02 FY03 FY04 FY05 FY06 FY07 FY08 FY09 FY10 FY11 1H12
0%
2%
4%
6%
8%
10%
FY02 FY03 FY04 FY05 FY06 FY07 FY08 FY09 FY10 FY11 1H12
Appendices
Control ratio(Returns + recoveries/total issues)
New equipment issue ratio(Pallets purchased/total issues)

63
Appendix 13a: CHEP Europe pallet plant operations and transportation trends
20%
22%
24%
26%
28%
30%
32%
FY02 FY03 FY04 FY05 FY06 FY07 FY08 FY09 FY10 FY11 1H12
20%
22%
24%
26%
28%
30%
FY02 FY03 FY04 FY05 FY06 FY07 FY08 FY09 FY10 FY11 1H12
Appendices
Plant cost ratio(Plant costs/sales)
Transportation cost ratio(Transportation costs/sales)
64
Appendix 13b: CHEP Europe pallet productivity trends
90%
92%
94%
96%
98%
100%
FY02 FY03 FY04 FY05 FY06 FY07 FY08 FY09 FY10 FY11 1H12
0%
2%
4%
6%
8%
10%
FY02 FY03 FY04 FY05 FY06 FY07 FY08 FY09 FY10 FY11 1H12
Appendices
Control ratio(Returns + recoveries/total issues)
New equipment issue ratio(Pallets purchased/total issues)

65
Appendix 14: RPCs 1H12 sales revenue by region
Appendices
(US$M)
16%Europe
8% ANZ & South Africa
19%South America
18%North America
Pro forma growth1 vs 1H11
1 Pro forma assumes Brambles owned businesses acquired since 1 July 2010 for all of the prior corresponding period; constant FX basis
52
70
252
13
66
Appendix 15: Containers 1H12 sales revenue by sector
20
19
18
79
Appendices
(US$M)
13%Automotive
12%CCC
33%IBCs
216%Aerospace
Growth1 vs 1H11
1 Growth is at constantFX