coordination of transmission and generation...
TRANSCRIPT
1
Coordination of Transmission and Generation Investments
Hung-po Chao and Robert Wilson*
The Economics of Energy Markets Toulouse School of Economics
Toulouse, France January 17-18, 2013
* ISO New England and Stanford University. The opinions expressed in the presentation are solely of our own based on our joint paper and do not represent the positions of ISO New England or any other organizations.
2
Outline
• The problem
• Economic framework
• Policy scenarios – Efficient coordination – Merchant investment – Sequential coordination
• Concluding remarks
3
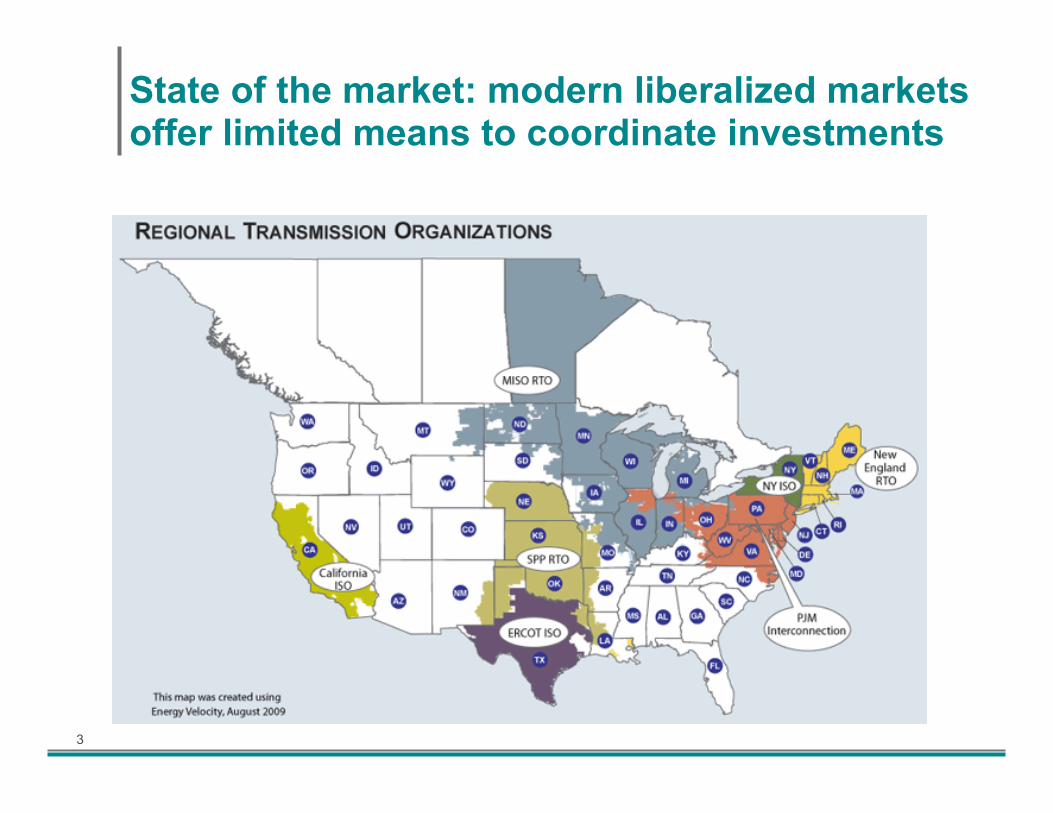
State of the market: modern liberalized markets offer limited means to coordinate investments
4
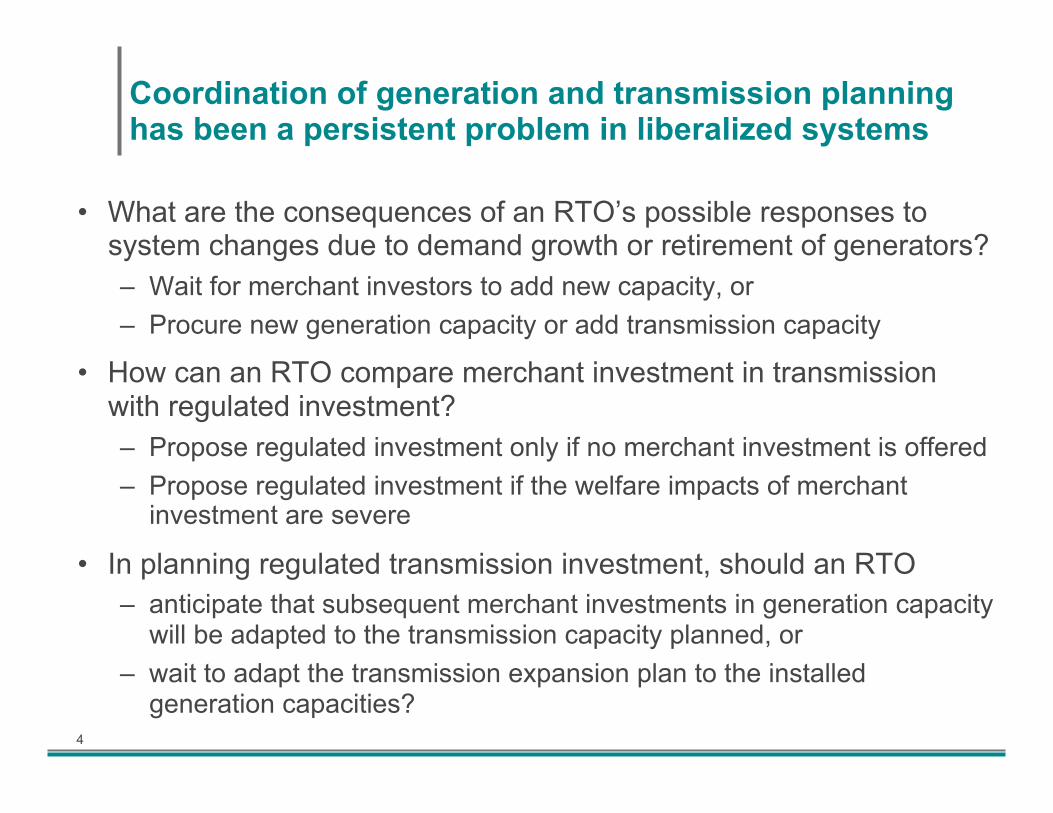
Coordination of generation and transmission planning has been a persistent problem in liberalized systems
• What are the consequences of an RTO’s possible responses to system changes due to demand growth or retirement of generators? – Wait for merchant investors to add new capacity, or – Procure new generation capacity or add transmission capacity
• How can an RTO compare merchant investment in transmission with regulated investment? – Propose regulated investment only if no merchant investment is offered – Propose regulated investment if the welfare impacts of merchant
investment are severe
• In planning regulated transmission investment, should an RTO – anticipate that subsequent merchant investments in generation capacity
will be adapted to the transmission capacity planned, or – wait to adapt the transmission expansion plan to the installed
generation capacities?
5
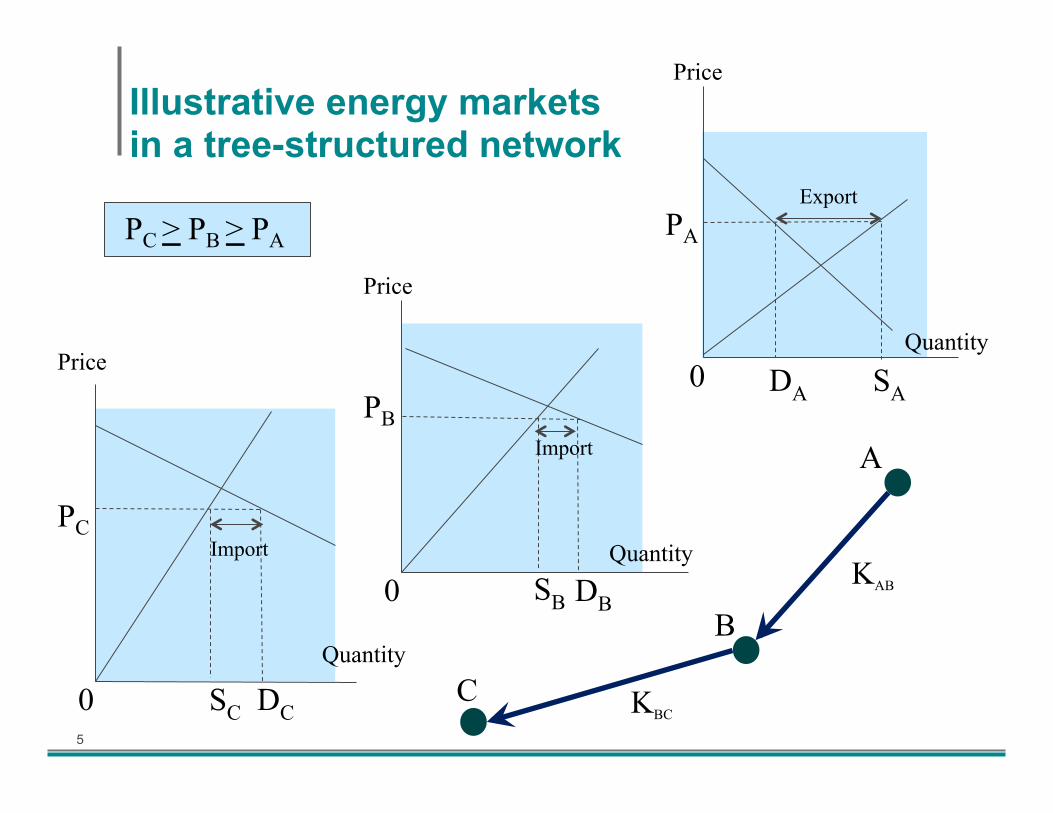
Illustrative energy markets in a tree-structured network
A
B
C KBC
KAB
0
PA
DA
Export
Price
SA
Quantity
0
PB Import
Price
SB DB
Quantity
0
PC Import
Price
SC DC
Quantity
PC > PB > PA
6
Conundrums of coordinating transmission planning with merchant generation investments
• Which goes first, generation or transmission?
• Which should it be, generation or transmission? and
• How might regulated projects be financed?

7
An integrated economic framework
• A two-stage sequential decision framework with lumpy transmission investments
• Constrained optimization: – Maximizing social welfare and measuring distributional
effects on consumers and producers – System balancing and competitive equilibrium in energy
markets with efficient nodal prices
• Modeling assumptions for illustrative scenarios – A three-node tree network – Peak and off-peak periods – Affine linear transmission investment cost functions I(K):
– Constant demand and supply elasticities
8
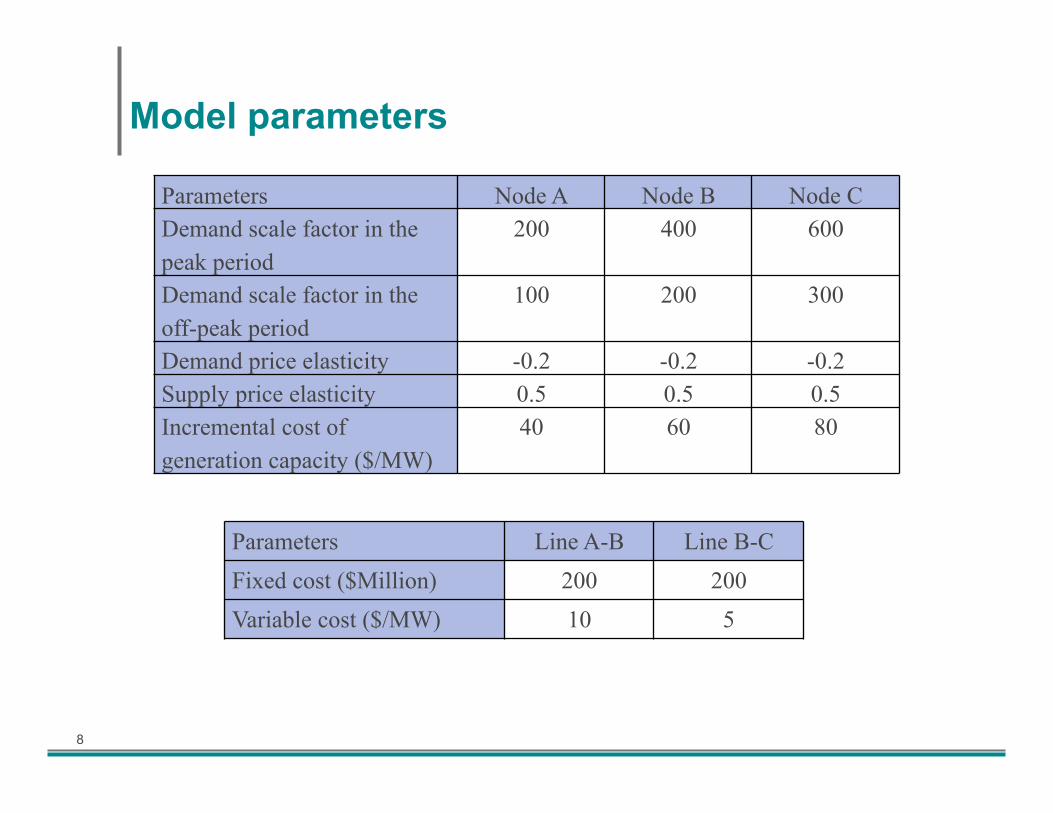
Model parameters
Parameters Node A Node B Node C Demand scale factor in the peak period
200 400 600
Demand scale factor in the off-peak period
100 200 300
Demand price elasticity -0.2 -0.2 -0.2 Supply price elasticity 0.5 0.5 0.5 Incremental cost of generation capacity ($/MW)
40 60 80
Parameters Line A-B Line B-C Fixed cost ($Million) 200 200 Variable cost ($/MW) 10 5
9
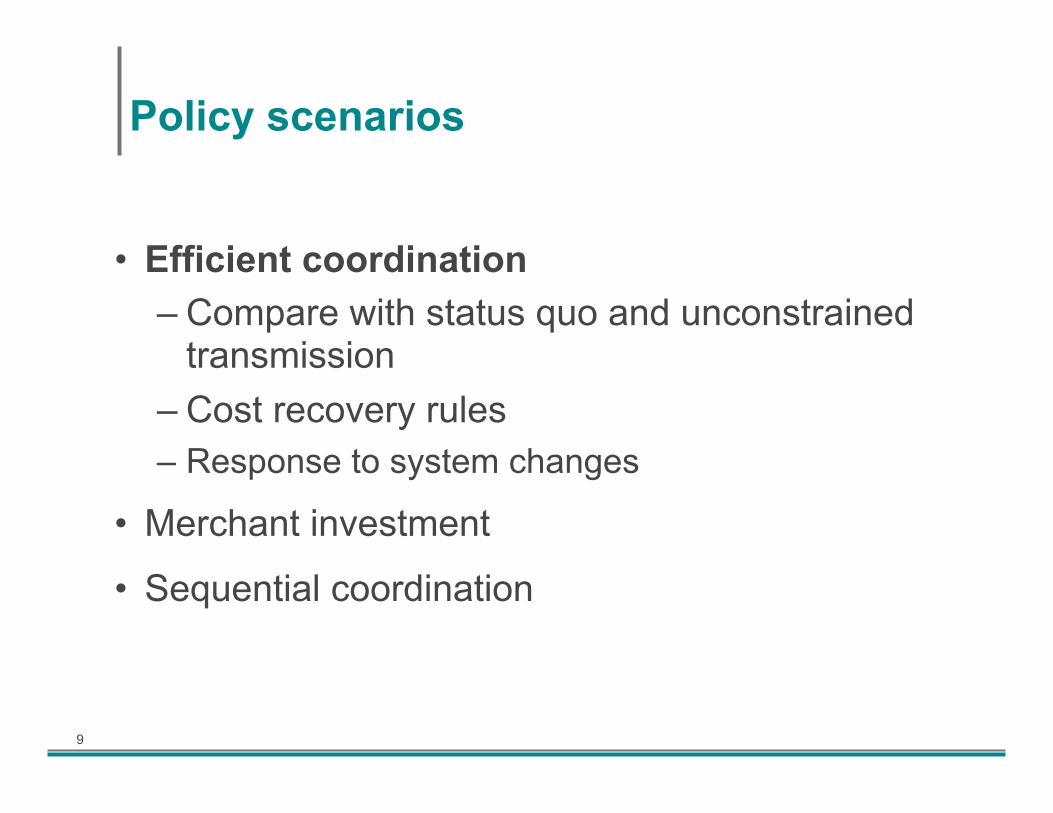
Policy scenarios
• Efficient coordination – Compare with status quo and unconstrained
transmission – Cost recovery rules – Response to system changes
• Merchant investment
• Sequential coordination

10
Transmission and generation capacity investments
Status Quo Efficient Coordination
Uncongested Transmission
Transmission Capacity (MW)
Line A-B 0 66 105 Line B-C 0 53 76
Generation Capacity (MW)
Node A 106 191 237 Node B 181 189 183 Node C 241 242 241
Transmission Investment ($Million) - 1,324 1,837 Generation Investment ($Million) - 19,111 19,706 Total Investment ($Million) - 20,434 21,542

11
Energy market prices (in $/MWh)
Period Node
Status Quo
Efficient Coordination
Uncongested Transmission
Peak A 67 64 68 B 91 74 68 C 112 79 68
Off Peak
A 25 27 25 B 34 27 25 C 42 27 25
12
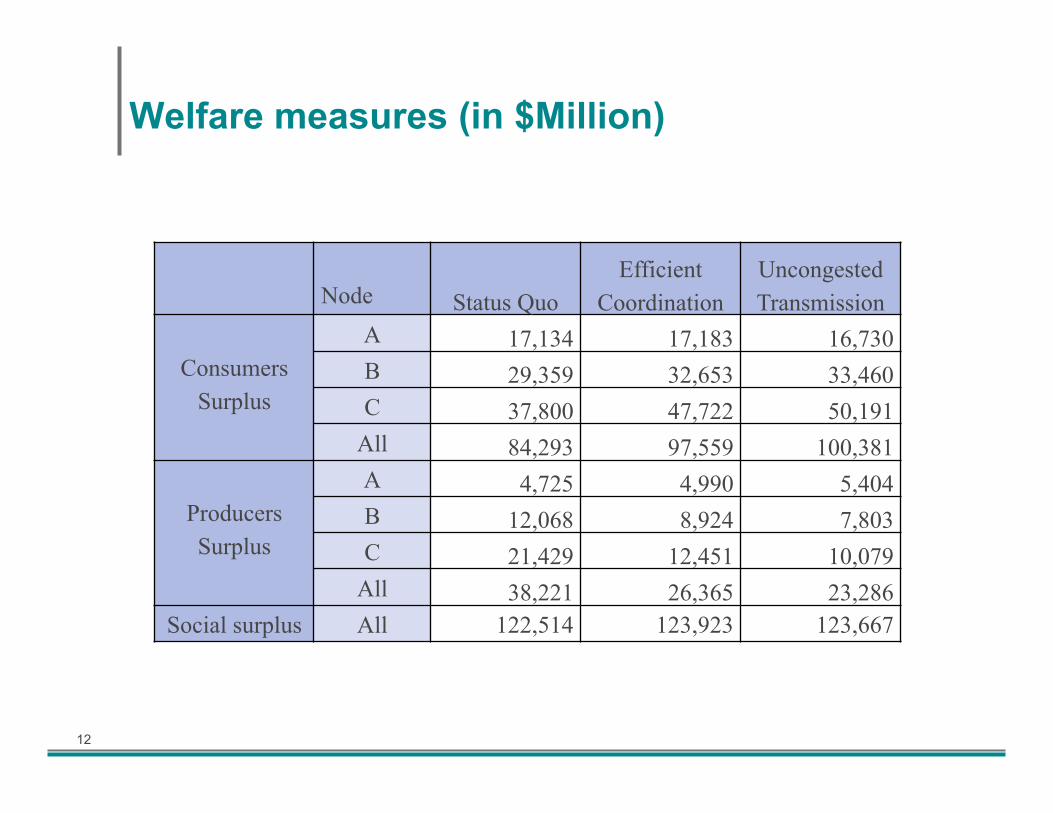
Welfare measures (in $Million)
Node Status Quo Efficient
Coordination Uncongested Transmission
Consumers Surplus
A 17,134 17,183 16,730 B 29,359 32,653 33,460 C 37,800 47,722 50,191
All 84,293 97,559 100,381
Producers Surplus
A 4,725 4,990 5,404 B 12,068 8,924 7,803 C 21,429 12,451 10,079
All 38,221 26,365 23,286 Social surplus All 122,514 123,923 123,667
13
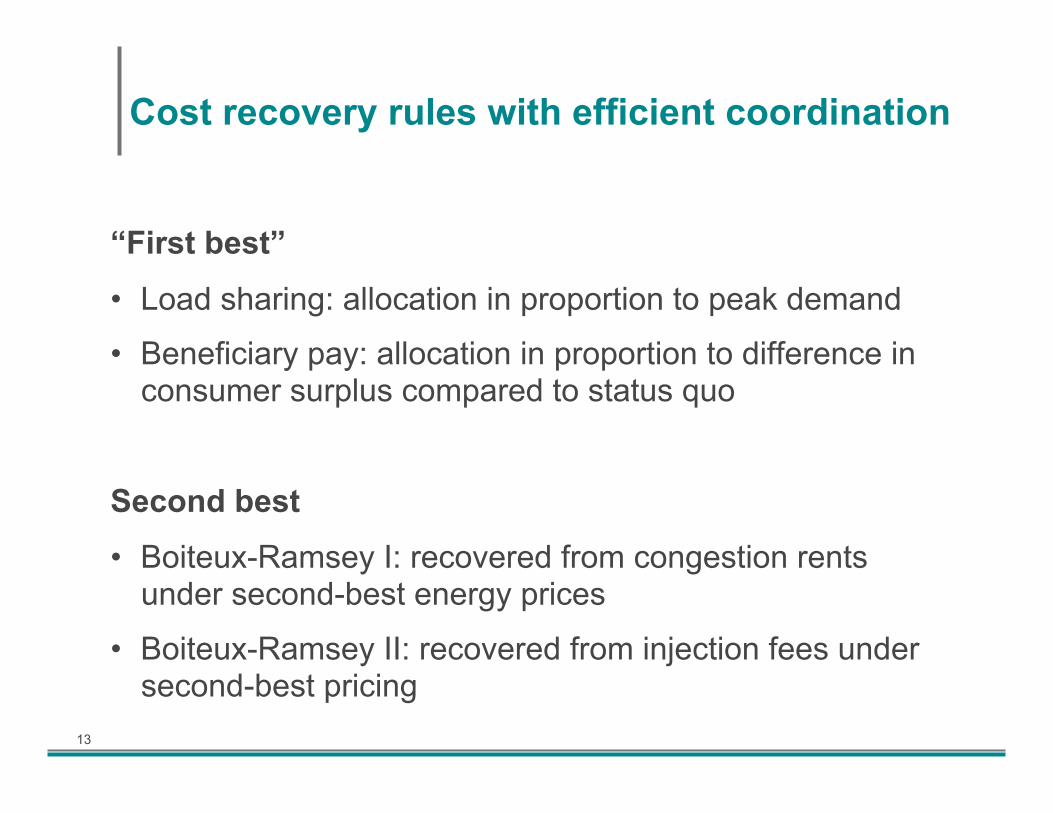
Cost recovery rules with efficient coordination
“First best”
• Load sharing: allocation in proportion to peak demand
• Beneficiary pay: allocation in proportion to difference in consumer surplus compared to status quo
Second best
• Boiteux-Ramsey I: recovered from congestion rents under second-best energy prices
• Boiteux-Ramsey II: recovered from injection fees under second-best pricing

14
Energy market prices (in $/MWh)

15
Welfare effects under alternative cost recovery rules (compared to status quo)
Node “First best” Second best Load
Sharing Beneficiary
Pay Boiteux-Ramsey I
Boiteux-Ramsey II
Consumers Surplus
A 48 113 451 65 B 3,295 3,328 3,560 3,319 C 9,922 9,825 9,322 9,993
All 13,265 13,265 13,332 13,377 Producers Surplus
A 266 266 (329) 229 B (3,144) (3,144) (3,265) (3,180) C (8,978) (8,978) (8,347) (9,018)
All (11,856) (11,856) (11,940) (11,968) Social
Surplus All 1,409 1,409 1,392 1,409

16
Welfare effects under alternative cost recovery methods
• The Boiteux-Ramsey I rule yields the lowest social surplus
• The Boiteux-Ramsey II rule yields a social surplus virtually identical to that with efficient coordination, suggesting that it is nearly as efficient as the first-best efficient plan.
• The welfare impacts of both Boiteux-Ramsey rules are more favorable to consumers and less favorable to generators in comparison with the two administrative rules.
• The Boiteux-Ramsey II rule produces patterns of welfare impacts measured in consumers and producers surpluses similar to those with the efficient plan using the beneficiaries-pay cost sharing rule.

17
Response to Retirement of 9.1 MW Generation at Node B (MW)
Efficient Plan
Transmission Response
Generation Response
Coordinated Response
Line A-B (MW) 66 73 66 77
Line B-C (MW) 53 53 53 53
Generation at A (MW) 84 84 85 98
Generation at B (MW) 8 8 16 10
Generation at C (MW) 1 1 1 1

18
Energy Market Prices (in $/MWh) – Generation Retirement at Node B
Period Node Efficient Plan
Transmission Response
Generation Response
Coordinated Response
Peak A 64 69 64 65 B 74 79 78 75 C 79 79 79 79
Off Peak A 27 28 28 27 B 27 28 28 27 C 27 28 28 27
19
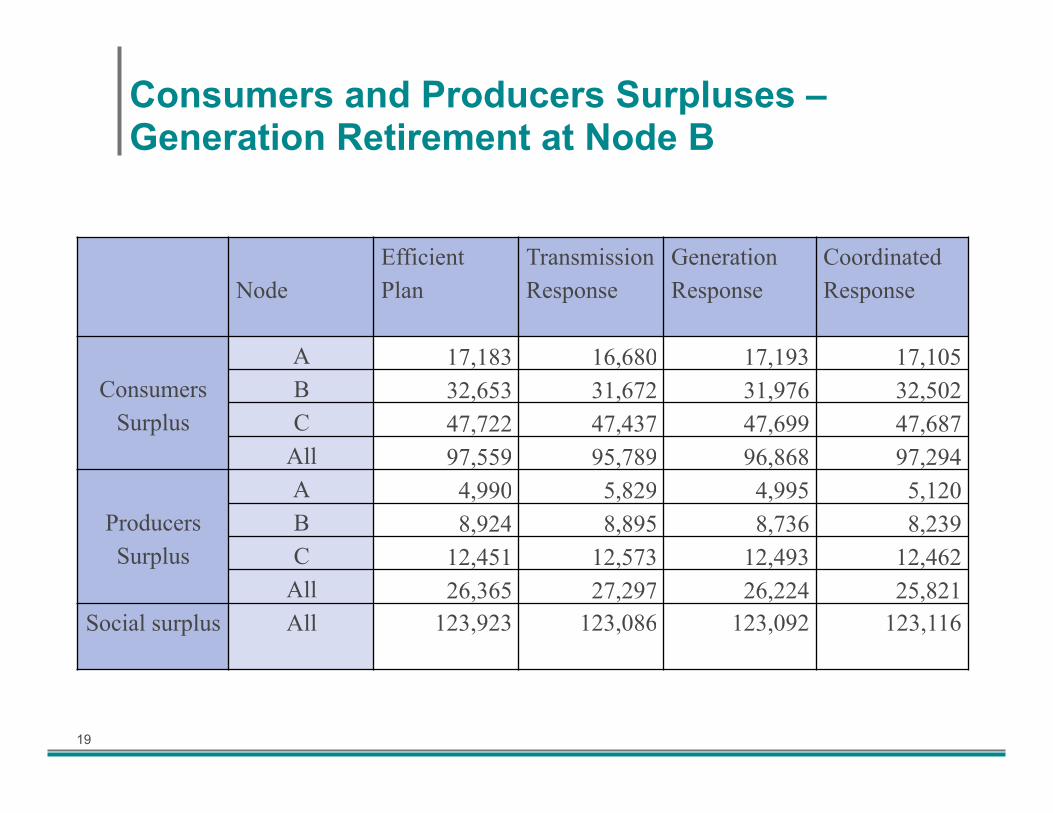
Consumers and Producers Surpluses – Generation Retirement at Node B
Node Efficient Plan
Transmission Response
Generation Response
Coordinated Response
Consumers Surplus
A 17,183 16,680 17,193 17,105 B 32,653 31,672 31,976 32,502 C 47,722 47,437 47,699 47,687
All 97,559 95,789 96,868 97,294
Producers Surplus
A 4,990 5,829 4,995 5,120 B 8,924 8,895 8,736 8,239 C 12,451 12,573 12,493 12,462
All 26,365 27,297 26,224 25,821 Social surplus All 123,923 123,086 123,092 123,116

20
Summary of efficient coordination
• Efficient transmission and generation capacity investments are determined jointly
• The efficient plan eliminates congestion only during the off-peak period and results in a uniform nodal price
• In an efficient plan, the nodal prices vary during the peak period (though less pronounced than the status quo) and the congestion rent covers the variable transmission investment costs
• There are gains and losses among individual participants – As a group, consumers gain from greater competition afforded
by transmission expansion, but producers tend to lose – Transmission expansion tends to lower the price in an import
region but raise the price in an export region
• Coordinated response to system changes improves system efficiency to the benefits of consumers

21
Policy scenarios
• Efficient coordination
• Merchant investment – Transmission company (TransCo) – Alliance between TransCo and Generator A (TG-A) – Alliance between TransCo and Utility C (TU-C) – Alliance of TransCo, Generator A and Utility C
(TGU-AC)
• Sequential coordination
22
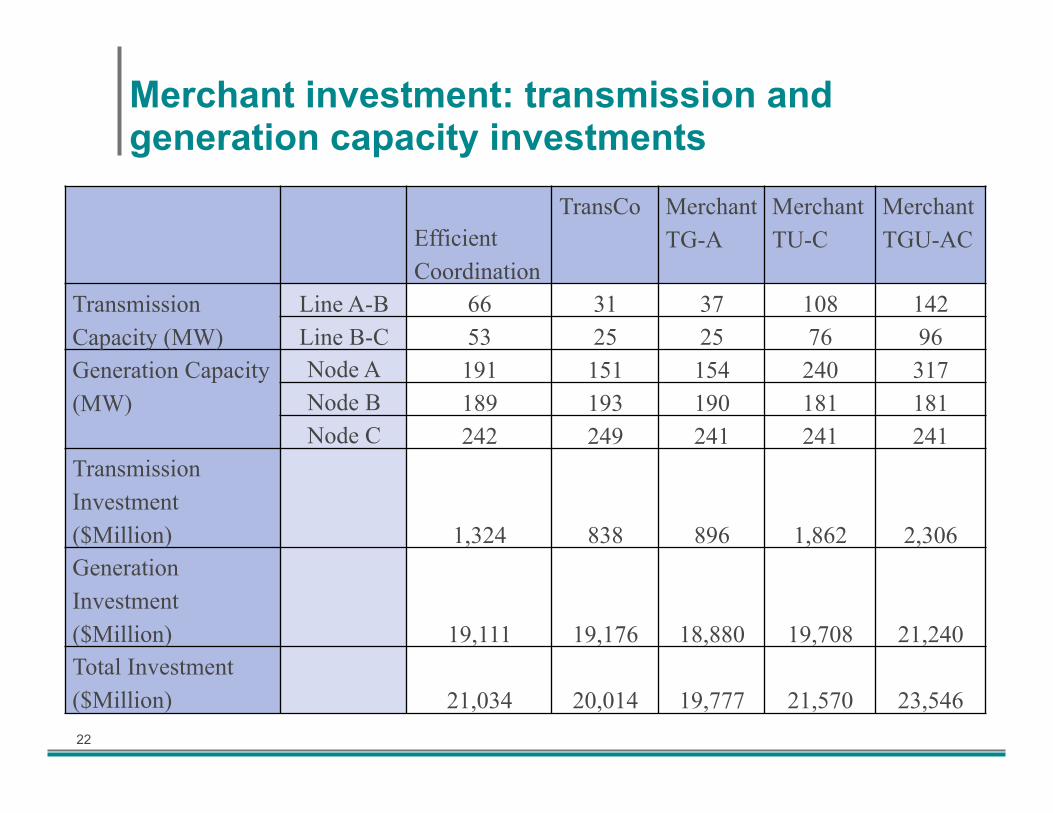
Merchant investment: transmission and generation capacity investments
Efficient Coordination
TransCo Merchant TG-A
Merchant TU-C
Merchant TGU-AC
Transmission Capacity (MW)
Line A-B 66 31 37 108 142 Line B-C 53 25 25 76 96
Generation Capacity (MW)
Node A 191 151 154 240 317 Node B 189 193 190 181 181 Node C 242 249 241 241 241
Transmission Investment ($Million) 1,324 838 896 1,862 2,306 Generation Investment ($Million) 19,111 19,176 18,880 19,708 21,240 Total Investment ($Million) 21,034 20,014 19,777 21,570 23,546

23
Merchant investment: energy market prices ($/MWh)
Period
Node Efficient
Coordination
TransCo Merchant TG-A
Merchant TU-C
Merchant TGU-AC
Peak A 64 60 63 68 59 B 74 76 74 68 59 C 79 91 96 68 59
Off Peak
A 27 28 28 25 22 B 27 28 28 25 22 C 27 30 32 25 22

24
Merchant investment: welfare measures ($Million)
Node Efficient Coordination
TransCo Merchant TG-A
Merchant TU-C
Merchant TGU-AC
Consumers Surplus
A 17,183 17,553 17,302 17,025 17,478 B 32,653 32,404 32,668 34,049 34,957 C 47,722 44,608 43,086 51,074 52,435
All 97,559 94,564 93,056 102,147 104,870
Producers Surplus
A 4,990 4,531 4,884 5,430 2,711 B 8,924 9,284 9,034 7,807 6,309 C 12,451 15,208 16,462 10,103 8,165
All 26,365 29,023 30,380 23,340 17,185 Congestion
revenue 0 79 164 (1,862) (2,306) Social surplus All 123,923 123,665 123,601 123,626 119,749

25
Summary of merchant investment
• TransCo’s investment is less expansive than the efficient plan. This strategy hurts the consumers and benefits the producers in general.
• The alliance of Merchant TG-A is stable because no one would be better off leaving the alliance unilaterally. However, GenCo A is better off under regulated transmission investment with efficient coordination.
• Merchant TU-C exploits the benefits from the complementarities between transmission and generation capacities to such a degree that an uncongested transmission system results – The congestion revenue is zero. – To sustain the merchant alliance, an internal transfer payment
must be made to cover the transmission investment cost incurred by TransCo.
• Merchant TGU-AC is both inefficient and unsustainable.

26
Policy scenarios
• Efficient coordination
• Merchant investments
• Sequential coordination – transmission leads generation – generation leads transmission

27
Sequential coordination: transmission and generation capacity investments
Efficient Coordination
Transmission Leads Generation
Generation Leads Transmission
Transmission Capacity (MW)
Line A-B 66 66 105 Line B-C 53 53 76
Generation Capacity (MW)
Node A 191 153 237 Node B 189 193 183 Node C 242 242 241
Transmission Investment ($Million)
1,324 1,324 1,837 Generation Investment ($Million)
19,111 18,883 19,706 Total Investment ($Million) 20,434 20,206 21,542
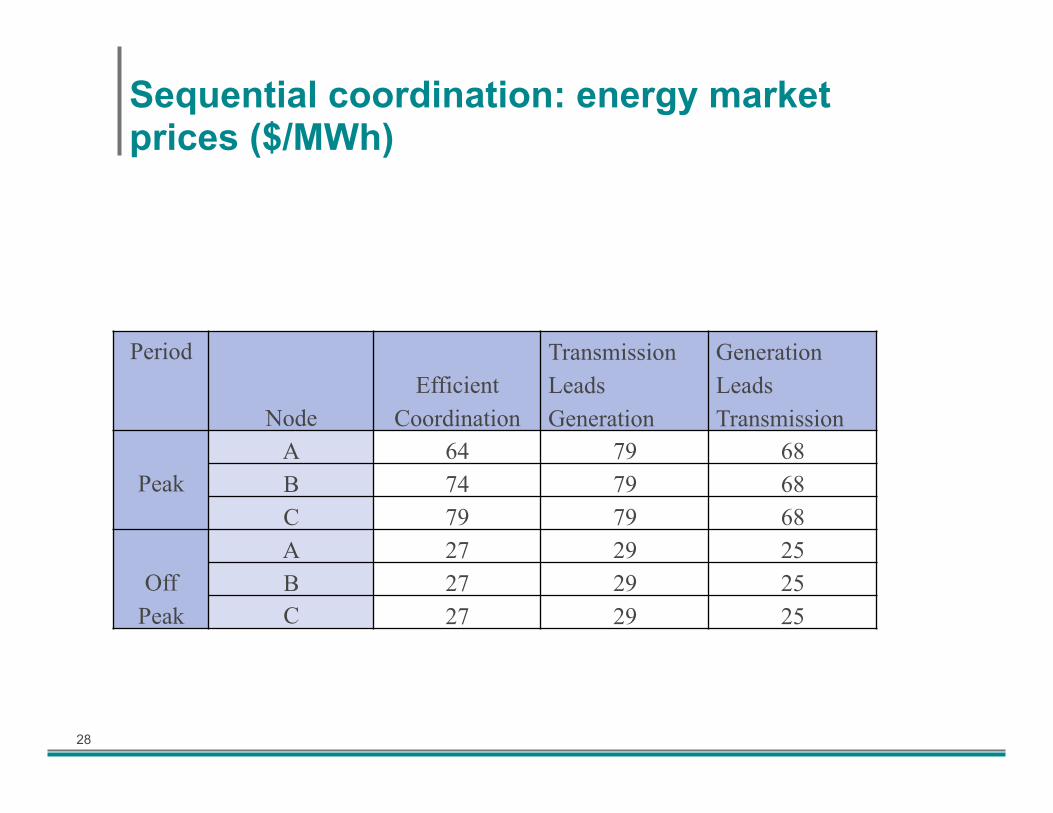
28
Sequential coordination: energy market prices ($/MWh)
Period
Node Efficient
Coordination
Transmission Leads Generation
Generation Leads Transmission
Peak A 64 79 68 B 74 79 68 C 79 79 68
Off Peak
A 27 29 25 B 27 29 25 C 27 29 25

29
Sequential coordination: welfare measures ($Million)
Node Efficient Coordination
Transmission Leads Generation
Generation Leads Transmission
Consumers Surplus
A 17,247 16,022 17,046 B 32,687 31,449 33,590 C 47,625 46,418 49,745
All 97,559 93,889 100,381
Producers Surplus
A 4,990 7,088 5,404 B 8,924 9,932 7,803 C 12,451 12,692 10,079
All 26,365 29,712 23,286 Social surplus All 123,923 123,601 123,667

30
Summary of sequential coordination
• When transmission leads generation – the transmission investment is set at the efficient level,
but Cournot competition yields lower generation investments and higher prices than the efficient plan
– Cournot equilibrium yields zero congestion rents
• When generation leads transmission, – unfettered competition within an uncongested
transmission network results in greater generation investments and uniform energy prices
• The coordination strategy of generation-leads-transmission yields higher consumers surplus and lower producers surplus than that of transmission-leads-generation

31
Concluding Remarks
• Efficient coordination requires an integrated economic framework as an adjunct for evaluating transmission and generation capacity expansion plans – Distributional effects on benefits, costs and incentives are
often larger than the aggregate welfare impacts – Injection charge may be considered an effective second-best
cost recovery tool based on Boiteux-Ramsey pricing
• Merchant investments based on the complementarities between transmission and generation supplements regulated investments without requiring cost recovery rules
• A sequential coordination strategy of generation-leads-transmission promotes competition and further leverages the complementarities between transmission and generation – When transmission leads generation, generators could capture
the entire transmission rents in Cournot equilibrium

32
Thank You