coordinated forecast - portland state university › prc › sites › › files ›...
TRANSCRIPT

Curry County Urban Growth Boundaries (UGB) & Area Outside UGBs
Through
2015
2065
Coordinated Population Forecast

1
Coordinated Population Forecast for Curry County, its Urban Growth Boundaries (UGB), and
Area Outside UGBs 2015-2065
Prepared by
Population Research Center
College of Urban and Public Affairs
Portland State University
March, 2015
Final Report to be issued June 30, 2015
2
Project Staff:
Xiaomin Ruan, Population Forecast Program Coordinator
Risa S. Proehl, Population Estimates Program Manager
Jason R. Jurjevich, PhD. Assistant Director, Population Research Center
Kevin Rancik, GIS Analyst
Janai Kessi, Research Analyst
Carson Gorecki, Research Assistant
David Tetrick, Research Assistant
The Population Research Center and project staff wish to recognize and thank those
who contributed to the development of these forecasts by answering questions, lending
insight, providing data, or giving feedback.

3
How to Read this Report
This report should be read with reference to the documents listed below—downloadable on the
forecast program website (http://www.pdx.edu/prc/opfp).
Specifically, the reader should refer to the following documents:
Methods—Provides a detailed description and discussion of the forecast methods employed. This
document also describes the assumptions that feed into these methods and determine the forecast
output. (Available for download with Final Report, June 30, 2015)
Supporting Information—Provides a complete copy of all survey results as well as any other
information gleaned from local planning documents, city officials, etc. (Available for download with
Final Report, June 30, 2015)
Forecast Tables—Provides complete tables of population forecast numbers by county and all sub-
areas within each county for each five-year interval of the forecast period (i.e., 2015-2065).

4
Table of Contents
Executive Summary ....................................................................................................................................... 6
Historical Trends ........................................................................................................................................... 8
Births ......................................................................................................................................................... 8
Deaths ..................................................................................................................................................... 10
Migration ................................................................................................................................................ 10
Historical Trends in Components of Population Change ........................................................................ 11
Housing and Households ........................................................................................................................ 12
Assumptions for Future Population Change ............................................................................................... 14
Assumptions for the County and Larger Sub-Areas ................................................................................ 14
Assumptions for Smaller Sub-Areas ........................................................................................................ 15
Forecast Trends ........................................................................................................................................... 16
Forecast Trends in Components of Population Change ......................................................................... 17
Glossary of Key Terms ................................................................................................................................. 21

5
Table of Figures Figure 1. Historical and Forecast Populations, and Average Annual Growth Rates (AAGR) for Curry
County and its Sub-Areas .............................................................................................................................. 7
Figure 2. Curry County and Oregon—Total Fertility Rates (2000 and 2010) ................................................ 8
Figure 3. Curry County—Age Specific Fertility Rate (2000 and 2010) .......................................................... 9
Figure 4. Curry County and Oregon—Age Specific Fertility Rate (2000 and 2010) ...................................... 9
Figure 5. Curry County and Sub-Areas—Total Births (2000 and 2010) ...................................................... 10
Figure 6. Curry County—Total Deaths (2000 and 2010) ............................................................................. 10
Figure 7. Curry County and Oregon—Five-year Migration Rates (2000-2010) .......................................... 11
Figure 8. Curry County—Components of Population Change (2000-2010) ................................................ 12
Figure 9. Curry County and Sub-Areas—Total Housing Units (2000 and 2010) ......................................... 13
Figure 10. Curry County and Sub-Areas—Persons per Household (PPH) and Occupancy Rate ................. 13
Figure 11. Curry County—Total Forecast Population by Five-year Intervals (2015-2065) ......................... 16
Figure 12. Curry County and Larger Sub-Areas—Forecast Population and AAGR ...................................... 17
Figure 13. Curry County and Smaller Sub-Areas—Forecast Population and AAGR .................................... 17
Figure 14. Curry County—Age Structure of the Population (2015, 2035, and 2065) ................................. 19
Figure 15. Curry County—Components of Population Change, 2015-2065 ............................................... 20

6
Executive Summary
Historical
Different growth patterns occur in different parts of the County and these local trends within the UGBs
and the area outside UGBs collectively influence population growth rates for the county as a whole.
Curry County’s population as a whole has grown slowly since 2000; with an average annual growth rate
of less than one percent between 2000 and 2010 (Figure 1); however some of its sub-areas experienced
more rapid population growth during the 2000s. Gold Beach posted the highest average annual growth
rate at one percent during the 2000 to 2010 period.
Curry County’s positive population growth in the 2000s was the direct result of sporadic net in-
migration. Meanwhile an aging population not only led to more deaths, but also resulted in a smaller
proportion of women in their childbearing years and a consequent smaller number of births. The larger
number of deaths relative to births left natural increase—the difference between births and deaths—
negative in every year from 2000 to 2014. While periods of net in-migration outweighed natural
decrease during the last decade, the gap between these two numbers shrank during the later years—
bringing population decline from 2009 to 2012.
Forecast
Total population in Curry County as a whole will more than likely grow at a faster pace in the first 20
years of the forecast period (2015 to 2035), and slow in the last 30 years (Figure 1). The tapering of
growth rates is largely driven by an aging population—a demographic trend which will lead to declining
natural increase (births minus deaths). As natural increase declines population growth will become
increasingly reliant on net in-migration. For the area outside UGBs this will more than likely lead to
population decline during the last 30 years of the forecast period. The remaining sub-areas are expected
to see population increase over this same time period.
Even so, Curry County’s total population will increase by nearly 3,900 over the next 20 years (2015-2035)
and by more than 4,700 over the entire 50-year forecast period (2015-2065). Sub-areas that showed
strong population growth in the 2000s will experience similar rates of population growth during the
forecast period.

7
Figure 1. Historical and Forecast Populations, and Average Annual Growth Rates (AAGR) for Curry County and its Sub-Areas
2000 2010
AAGR
(2000-2010) 2015 2035 2065
AAGR
(2015-2035)
AAGR
(2035-2065)
Curry County 21,137 22,364 0.6% 22,521 26,419 27,286 0.8% 0.1%
Brookings1 10,634 11,199 0.5% 11,414 12,998 14,850 0.7% 0.4%
Gold Beach 2,837 3,141 1.0% 3,261 4,044 5,575 1.1% 1.1%
Port Orford 1,755 1,807 0.3% 1,837 2,052 2,373 0.6% 0.5%
Outside UGBs 5,911 6,217 0.5% 6,009 7,326 4,488 1.0% -1.6%
Sources: U.S. Census Bureau, 2000 and 2010 Censuses; Forecast by Population Research Center (PRC).
1 For simplicity each UGB is referred to by its primary city's name.
Historical Forecast

8
Historical Trends Different growth patterns occur in different parts of the County. Each of Curry County’s sub-areas was
examined for any significant demographic characteristics or changes in population or housing growth
that might influence their individual forecasts. Factors that were analyzed include age composition of
the population, ethnicity and race, births, deaths, migration, and number of housing units as well as the
occupancy rate and persons per household (PPH). It should be noted that population trends of individual
sub-areas often differ from those of the county as a whole. However, in general, population growth
rates for the county are collectively influenced by local trends within its sub-areas.
Births
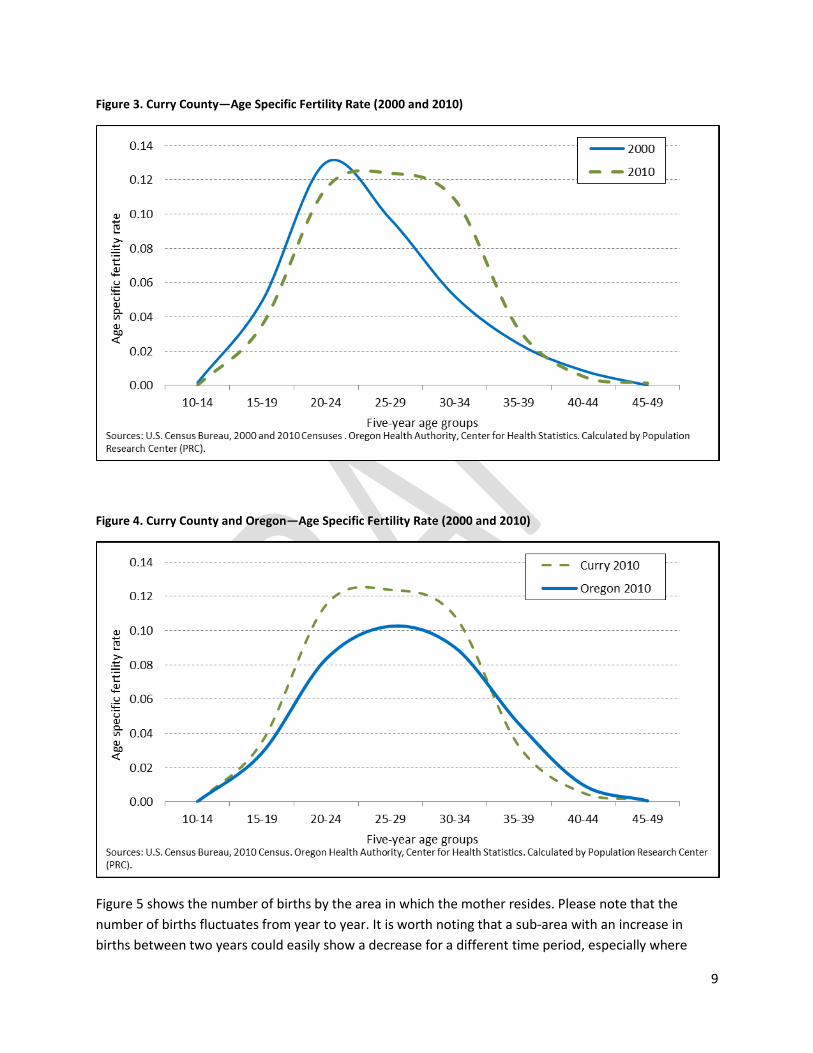
Historical fertility rates for Curry County don’t mirror the decline in total fertility observed for Oregon
overall (Figure 2). Furthermore, fertility for younger women in Curry County has remained at a much
higher level than for younger women statewide (Figure 3 and Figure 4). Even so, as Figure 3 illustrates,
fertility rates for younger women in Curry County are higher in 2010 compared to 2000, and women are
choosing to have children at older ages. While the decrease in fertility among younger women largely
mirrors statewide changes, county fertility changes are distinct from those of the state in two ways.
First, while fertility among younger women did decrease within the county, the drop was less
pronounced than for younger women statewide. Second, the increase in total fertility in Curry County
during the 2000s runs contrary to the statewide decline during this same period. In addition Curry
County’s total fertility remains above replacement fertility.
Figure 2. Curry County and Oregon—Total Fertility Rates (2000 and 2010)
2000 2010
Curry County 1.81 2.11
Oregon 1.98 1.79Sources: U.S. Census Bureau, 2000 and 2010 Censuses.
Oregon Health Authority, Center for Health Statistics.
Calculations by Population Research Center (PRC).
9
Figure 3. Curry County—Age Specific Fertility Rate (2000 and 2010)
Figure 4. Curry County and Oregon—Age Specific Fertility Rate (2000 and 2010)
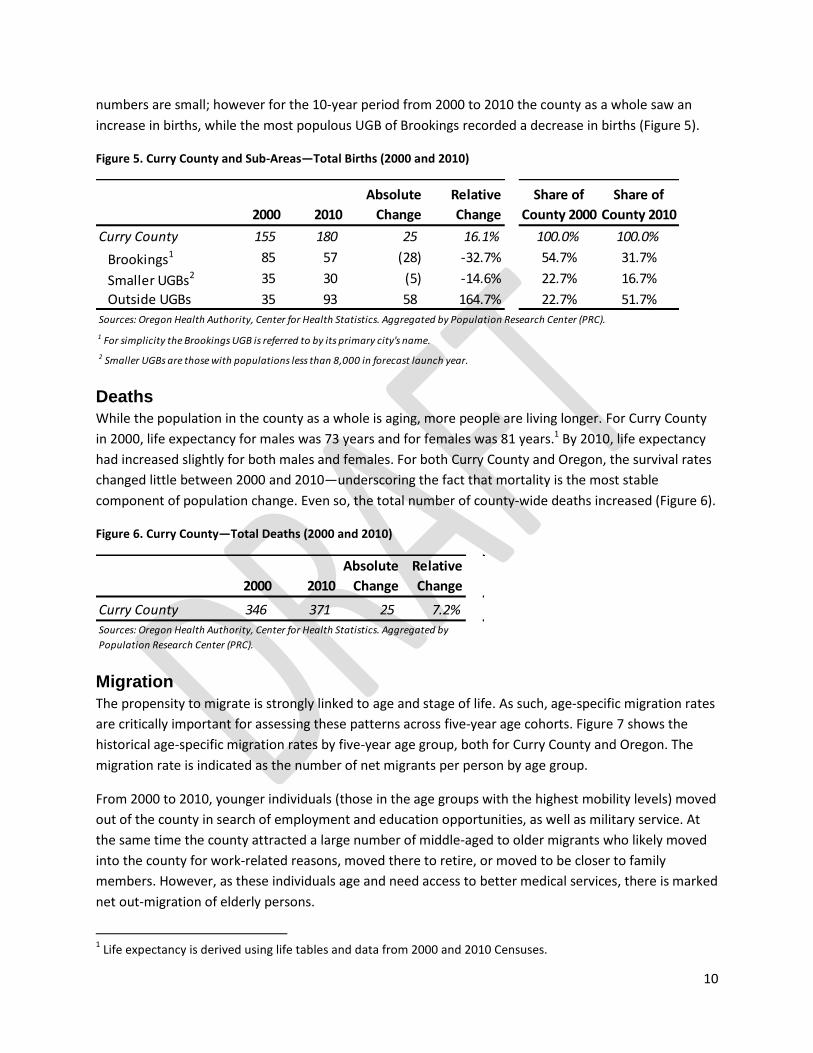
Figure 5 shows the number of births by the area in which the mother resides. Please note that the
number of births fluctuates from year to year. It is worth noting that a sub-area with an increase in
births between two years could easily show a decrease for a different time period, especially where
10
numbers are small; however for the 10-year period from 2000 to 2010 the county as a whole saw an
increase in births, while the most populous UGB of Brookings recorded a decrease in births (Figure 5).
Figure 5. Curry County and Sub-Areas—Total Births (2000 and 2010)
Deaths
While the population in the county as a whole is aging, more people are living longer. For Curry County
in 2000, life expectancy for males was 73 years and for females was 81 years.1 By 2010, life expectancy
had increased slightly for both males and females. For both Curry County and Oregon, the survival rates
changed little between 2000 and 2010—underscoring the fact that mortality is the most stable
component of population change. Even so, the total number of county-wide deaths increased (Figure 6).
Figure 6. Curry County—Total Deaths (2000 and 2010)
Migration
The propensity to migrate is strongly linked to age and stage of life. As such, age-specific migration rates
are critically important for assessing these patterns across five-year age cohorts. Figure 7 shows the
historical age-specific migration rates by five-year age group, both for Curry County and Oregon. The
migration rate is indicated as the number of net migrants per person by age group.
From 2000 to 2010, younger individuals (those in the age groups with the highest mobility levels) moved
out of the county in search of employment and education opportunities, as well as military service. At
the same time the county attracted a large number of middle-aged to older migrants who likely moved
into the county for work-related reasons, moved there to retire, or moved to be closer to family
members. However, as these individuals age and need access to better medical services, there is marked
net out-migration of elderly persons.
1 Life expectancy is derived using life tables and data from 2000 and 2010 Censuses.
2000 2010
Absolute
Change
Relative
Change
Share of
County 2000
Share of
County 2010
Curry County 155 180 25 16.1% 100.0% 100.0%
Brookings1 85 57 (28) -32.7% 54.7% 31.7%
Smaller UGBs2 35 30 (5) -14.6% 22.7% 16.7%
Outside UGBs 35 93 58 164.7% 22.7% 51.7%
1 For simplicity the Brookings UGB is referred to by its primary city's name.
Sources: Oregon Health Authority, Center for Health Statistics. Aggregated by Population Research Center (PRC).
2 Smaller UGBs are those with populations less than 8,000 in forecast launch year.
2000 2010
Absolute
Change
Relative
Change
Curry County 346 371 25 7.2%
Sources: Oregon Health Authority, Center for Health Statistics. Aggregated by
Population Research Center (PRC).

11
Figure 7. Curry County and Oregon—Five-year Migration Rates (2000-2010)
Historical Trends in Components of Population Change
In summary, Curry County’s positive population growth in the 2000s was the direct result of sporadic net
in-migration (Figure 8). Meanwhile an aging population not only led to more deaths, but also resulted in
a smaller proportion of women in their childbearing years and a consequent smaller number of births.
The larger number of deaths relative to births left natural increase—the difference between births and
deaths—negative in every year from 2000 to 2014. While periods of net in-migration outweighed
natural decrease during the last decade, the gap between these two numbers shrank during the later
years—bringing population decline from 2009 to 2012.

12
Figure 8. Curry County—Components of Population Change (2000-2010)
Housing and Households
The total number of housing units in Curry County increased rapidly during the middle years of the
2000s, but this growth slowed with the onset of the national recession in 2007. Over the entire 2000 to
2010 period, the total number housing units increased by about 11 percent county-wide; this was more
than 1,200 new housing units (Figure 9). Gold Beach captured the largest share of the growth in total
housing units, with the area outside UGBs also seeing a large share of the county-wide housing growth.
In terms of relative housing growth Gold Beach grew the most during the 2000s, its total housing units
increased more than 24 percent (374 housing units) by 2010.
The rates of increase in the number of total housing units in the county, UGBs, and area outside UGBs
are similar to the growth rates of their corresponding populations. The growth rates for housing may
slightly differ than the rates for population because the numbers of total housing units are smaller than
the numbers of persons, or the UGB has experienced changes in the average number of persons per
household or in occupancy rates. However, the pattern of population and housing change in the county
is relatively similar.

13
Figure 9. Curry County and Sub-Areas—Total Housing Units (2000 and 2010)
Occupancy rates fluctuate more than PPH. This is particularly true in smaller UGB areas where fewer
housing units allow for larger changes—in relative terms—in occupancy rates. From 2000 to 2010 the
occupancy rate in Curry County declined slightly; this was most likely due to slack in demand for housing
as individuals experienced the effects of the Great Recession and net-migration slowed. A slight drop in
occupancy rates was mostly uniform across all sub-areas, but for Brookings, the most populous UGB,
where there was a slight increase in the occupancy rate.
Average household size, or PPH, in Curry County was 2.1 in 2010, down from 2.2 in 2000 (Figure 10).
Curry County’s PPH in 2010 was lower than for Oregon as a whole, which had a PPH of 2.5. PPH varied
across sub-areas, with all of them falling between 1.9 and 2.2 persons per household. In 2010 the
highest PPH was in Brookings with 2.2 and the lowest in Port Orford at 1.9.
Figure 10. Curry County and Sub-Areas—Persons per Household (PPH) and Occupancy Rate
2000 2010
AAGR
(2000-2010)
Share of
County 2000
Share of
County 2010
Curry County 11,406 12,613 1.0% 100.0% 100.0%
Brookings 5,652 5,938 0.5% 49.6% 47.1%
Gold Beach 1,538 1,912 2.2% 13.5% 15.2%
Port Orford 987 1,168 1.7% 8.7% 9.3%
Outside UGBs 3,229 3,595 1.1% 28.3% 28.5%
Sources: U.S. Census Bureau, 2000 and 2010 Censuses
2000 2010
Change
2000-2010 2000 2010
Change
2000-2010
Curry County 2.2 2.1 -3.2% 83.7% 82.6% -1.1%
Brookings 2.2 2.2 -0.5% 84.7% 85.1% 0.4%
Gold Beach 2.2 2.0 -7.0% 82.7% 80.0% -2.7%
Port Orford 2.1 1.9 -6.8% 86.5% 80.2% -6.3%
Outside UGBs 2.2 2.1 -4.6% 81.4% 80.6% -0.9%
Persons Per Household (PPH) Occupancy Rate
Sources: U.S. Census Bureau, 2000 and 2010 Censuses. Calculated by Population Research Center (PRC)

14
Assumptions for Future Population Change Evaluating past demographic trends provides clues about what the forecast for the future will look like,
and helps determine the realm of likely possibilities. Past trends explain the dynamics of population
growth particular to local areas. Relating recent and historical population change to events that
influenced the change serves as a gauge for what might realistically occur in a given area over the long
term.
Assumptions about fertility, mortality, and migration were developed for Curry County’s population
forecast as well as the forecasts for larger sub-areas.2 The assumptions are derived from observations
based on life course events, as well as trends unique to Curry County and its larger sub-areas. Population
change in the smaller sub-areas is determined by the change in the number of total housing units and
PPH. Assumptions for housing unit growth, as well as for occupancy rates, are derived from observations
of historical building patterns and current plans for future housing development. In addition
assumptions for PPH are based on observed historical patterns of household demographics—for
example the average age of householder. The forecast period is 2015-2065.
Assumptions for the County and Larger Sub-Areas
During the forecast period, as the population in Curry County is expected to continue to age, birth rates
will begin to decline in the near term and continue on this path throughout the forecast period. Total
fertility in Curry County is also forecast to decrease, but very slightly, from 2.1 children per woman in
2015 to 2.0 children per woman by 2065. Similar patterns of declining fertility are expected within the
county’s larger sub-areas.
Changes in mortality and life expectancy are more stable compared to fertility and migration. One
influential factor affecting mortality and life expectancy is the advances in medical technology. The
county and larger sub-areas are projected to follow the statewide trend of increasing life expectancy
throughout the forecast period—progressing from a life expectancy of 77 years in 2010 to 85 years in
2060. However, in spite of increasing life expectancy and the corresponding increase in survival rates,
Curry County’s aging population and large population cohort reaching later stages of life will increase
the overall number of deaths throughout the forecast period. The larger sub-areas within the county will
experience a similar increase in deaths as their population ages, as well.
Migration is the most volatile and challenging demographic component to forecast due to the many
factors influencing migration patterns. Economic and social factors—such as employment, educational
opportunities, housing availability, family ties, cultural affinity, and natural amenities—occurring both
inside and outside the study area can affect both the direction of migration and its volume. Net
migration rates will change in line with historical trends unique to Curry County. Net out-migration of
younger persons and net in-migration of older individuals will persist throughout the forecast period.
2
County sub-areas with populations greater than 8,000 in the forecast launch year were forecast using the cohort-component method. County sub-areas with populations less than 8,000 in forecast launch year were forecast using the housing-unit method. See Glossary of Key Terms at the end of this report for a brief description of these methods or refer to the Methods document for a more detailed description of these forecasting techniques.

15
County-wide average annual net migration is expected to increase from 221 net in-migrants in 2015 to
389 net in-migrants in 2035. Over the last 30 years of the forecast period average annual net migration
is expected to be steadier, but dropping slightly to 383 net in-migrants by 2065. With natural increase
diminishing in its potential to contribute to population growth, net in-migration will become an
increasingly important component of population growth.
Assumptions for Smaller Sub-Areas
Rates of population growth for the smaller UGBs are assumed to be determined by corresponding
growth in the number of housing units, as well as changes in housing occupancy rates and PPH. The
change in housing unit growth is much more variable than change in housing occupancy rates or PPH.
Occupancy rates are assumed to stay relatively stable over the forecast period, while PPH is expected to
decline slightly. Smaller household size is associated with an aging population in Curry County and its
sub-areas.
In addition, for sub-areas experiencing population growth, we assume a higher growth rate in the near-
term, with growth stabilizing over the remainder of the forecast period. If planned housing units were
reported in the surveys, then we account for them being constructed over the next 5-15 years. Finally,
for county sub-areas where population growth has been flat or declined, and there is no planned
housing construction, we hold population growth mostly stable with little to no change.

16
Forecast Trends Under the most-likely population growth scenario in Curry County, county-wide and sub-area
populations are expected to increase through 2055 and decline slightly over the remainder of the
forecast period. The county-wide population growth rate is forecast to peak in 2025 and then decline
throughout the forecast period. Forecasting tapered population growth is largely driven by an aging
population, which will contribute to an increase in deaths, as well as a decrease in births—fewer women
within childbearing years (ages 10 to 49). The aging population will in turn contribute to declining
natural increase over the forecast period. Net migration is expected to remain relatively steady
throughout the forecast period, not fully offsetting the decline in natural increase. The combination of
these factors will most likely result in a declining population growth rate as time progresses through the
forecast period.
Curry County’s total population is forecast to grow by almost 6,000 persons (21 percent) from 2015 to
2065, which translates into a total county-wide population of 27,286 in 2065 (Figure 11). The population
is forecast to grow at the highest rate—approximately 1.1 percent per year—in the near-term (2015-
2025). This anticipated population growth in the near-term is based on two core assumptions: 1) Curry
County’s economy will continue to strengthen in the next five years, and; 2) an increasing number of
Baby Boomers will retire to the county. The single largest component of growth in this initial period is
net in-migration. More than 4,700 net in-migrants are forecast for the 2015 to 2025 period.
Figure 11. Curry County—Total Forecast Population by Five-year Intervals (2015-2065)
The Brookings UGB will increase by nearly 1,600 persons from 2015 to 2035, growing from a total
population of 11,414 in 2015 to more than 12,998 in 2035. Growth will occur more slowly for Brookings
17
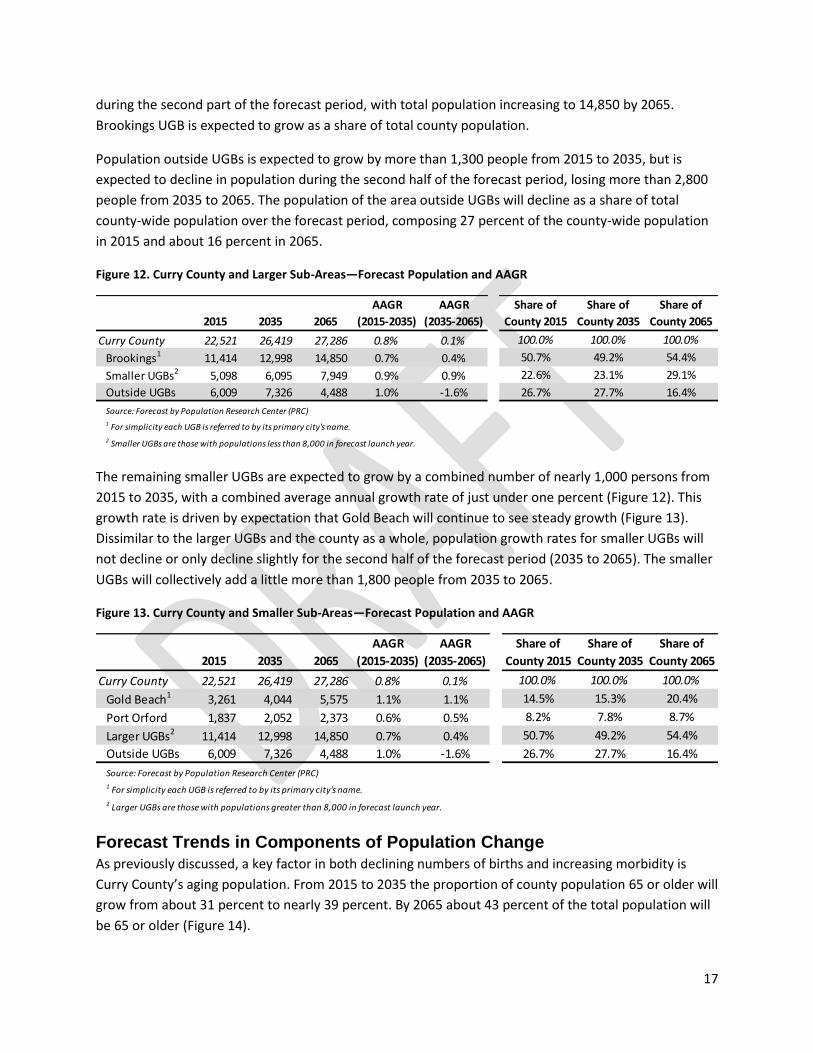
during the second part of the forecast period, with total population increasing to 14,850 by 2065.
Brookings UGB is expected to grow as a share of total county population.
Population outside UGBs is expected to grow by more than 1,300 people from 2015 to 2035, but is
expected to decline in population during the second half of the forecast period, losing more than 2,800
people from 2035 to 2065. The population of the area outside UGBs will decline as a share of total
county-wide population over the forecast period, composing 27 percent of the county-wide population
in 2015 and about 16 percent in 2065.
Figure 12. Curry County and Larger Sub-Areas—Forecast Population and AAGR
The remaining smaller UGBs are expected to grow by a combined number of nearly 1,000 persons from
2015 to 2035, with a combined average annual growth rate of just under one percent (Figure 12). This
growth rate is driven by expectation that Gold Beach will continue to see steady growth (Figure 13).
Dissimilar to the larger UGBs and the county as a whole, population growth rates for smaller UGBs will
not decline or only decline slightly for the second half of the forecast period (2035 to 2065). The smaller
UGBs will collectively add a little more than 1,800 people from 2035 to 2065.
Figure 13. Curry County and Smaller Sub-Areas—Forecast Population and AAGR
Forecast Trends in Components of Population Change
As previously discussed, a key factor in both declining numbers of births and increasing morbidity is
Curry County’s aging population. From 2015 to 2035 the proportion of county population 65 or older will
grow from about 31 percent to nearly 39 percent. By 2065 about 43 percent of the total population will
be 65 or older (Figure 14).
2015 2035 2065
AAGR
(2015-2035)
AAGR
(2035-2065)
Share of
County 2015
Share of
County 2035
Share of
County 2065
Curry County 22,521 26,419 27,286 0.8% 0.1% 100.0% 100.0% 100.0%
Brookings1 11,414 12,998 14,850 0.7% 0.4% 50.7% 49.2% 54.4%
Smaller UGBs2 5,098 6,095 7,949 0.9% 0.9% 22.6% 23.1% 29.1%
Outside UGBs 6,009 7,326 4,488 1.0% -1.6% 26.7% 27.7% 16.4%
Source: Forecast by Population Research Center (PRC)
1 For simplicity each UGB is referred to by its primary city's name.
2 Smaller UGBs are those with populations less than 8,000 in forecast launch year.
2015 2035 2065
AAGR
(2015-2035)
AAGR
(2035-2065)
Share of
County 2015
Share of
County 2035
Share of
County 2065
Curry County 22,521 26,419 27,286 0.8% 0.1% 100.0% 100.0% 100.0%
Gold Beach1 3,261 4,044 5,575 1.1% 1.1% 14.5% 15.3% 20.4%
Port Orford 1,837 2,052 2,373 0.6% 0.5% 8.2% 7.8% 8.7%
Larger UGBs2 11,414 12,998 14,850 0.7% 0.4% 50.7% 49.2% 54.4%
Outside UGBs 6,009 7,326 4,488 1.0% -1.6% 26.7% 27.7% 16.4%
Source: Forecast by Population Research Center (PRC)
1 For simplicity each UGB is referred to by its primary city's name.
2 Larger UGBs are those with populations greater than 8,000 in forecast launch year.
18
As the county-wide population ages—which means a slow-growing population of women in the age
groups associated with peak fertility—total fertility in Curry County is expected to decline over the
forecast period. This decline is in line with the forecast trend for the state. Average annual births are
expected to hold relatively steady over the forecast period; this combined with the rising number of
deaths will lead to a natural decrease. The total numbers of deaths county-wide are expected to
increase more rapidly in the near-term, followed by slower growth during the later years of the forecast
period. This pattern of initial growth in the numbers of deaths is explained by the relative size and aging
patterns of the Baby Boom and Baby Boom Echo generations. For example, in Curry County, deaths will
begin to increase significantly during the 2025-2035 period as Baby Boomers succumb to morbidity, and
peak again in the 2045 as children of Baby Boomers (i.e. the Baby Boom Echo) experience morbidity.

19
Figure 14. Curry County—Age Structure of the Population (2015, 2035, and 2065)

20
As the increase in the numbers of deaths outpaces births, population growth in Curry County will
become increasingly reliant on net in-migration; and in fact positive net in-migration is expected to
persist throughout the forecast period. The majority of these net in-migrants are expected to be middle-
aged and older individuals.
In summary, declining natural increase and steady net in-migration will result in population growth
reaching its peak in 2025 and then tapering through the remainder of the forecast period (Figure 15). An
aging population will not only lead to an increase in deaths, but a smaller proportion of women in their
childbearing years will almost certainly result in a long-term decline in births. Net migration is expected
to remain relatively steady throughout the middle years of the forecast period, but will begin to decline
slightly during the later years, and therefore will not fully offset the decline in natural increase.
Figure 15. Curry County—Components of Population Change, 2015-2065

21
Glossary of Key Terms
Cohort-Component Method: Predicts future populations based on likely changes in births, deaths, and
migration over time.
Coordinated population forecast: A population forecast adopted by all levels of government for the
entire county, including urban growth boundary (UGB) areas, as well as areas outside UGBs within the
county. A population forecast prepared concurrently for the county and for its city UGB areas and non-
UGB unincorporated area.
Housing unit: A house, apartment, mobile home or trailer, group of rooms, or single room that is
occupied or is intended for occupancy.
Housing-Unit Method: Predicts future populations based on changes in housing unit counts, vacancy
rates, and the average numbers of persons per household (PPH).
Occupancy rate: The proportion of total housing units that are occupied by an individual or group of
persons. If the individual or group is absent on Census Day (April 1), but will be returning soon, the
housing unit is still considered occupied.
Persons per household (PPH): The average household size (i.e. the average number of persons per
occupied housing unit for a particular geographic area).
Replacement Level Fertility: The average number of children each woman needs to bear in order to
replace the population (to replace each male and female) under current mortality conditions in the U.S.

Photo Credit: The beach in the evening near Hunter Creek just south of Gold Beach. (Photo No. curD0026) Gary Halvorson, Oregon State Archives. http://arcweb.sos.state.or.us/pages/records/local/county/scenic/curry/8.html