coopers - trimis · 2015-07-03 · coopers integrated project d15 - ir 7100/7200/7300/7400 report...
TRANSCRIPT

COOPERS integrated project
COOPERS Co-operative Networks for Intelligent Road Safety
WP7000
D15 - IR 7100/7200/7300/7400 Report on common result assessment
Version
0.3
Status Date
Draft 18.06.2010
Reviewed
Approved
Release Function Approval Robert Kölbl Name
Vienna University of Technology
Organisation
+43 1 58801 23120 Phone +43 1 588 01 23199 Fax
[email protected] E-Mail
COOPERS integrated project
D15 - IR 7100/7200/7300/7400 Report on common result assessment
Page 2 of 191
Contract Number:
FP6-2004-IST-4 Nr. 026814
Acronym:
COOPERS
Title:
Co-operative Networks for Intelligent Road Safety
Distribution:
Part.-Nr.
short name
Participant name Nationality
1 ATE AustriaTech – Gesellschaft des Bundes für technologiepolitische Maßnahmen Austria 2 HIT Vereinigung High Tech Marketing Austria 3 ARS ARS Traffic and Transport Technology B.V. Netherlands 4 SWA Swarco Europe GmbH Austria 5 EYI Ernst and Young Financial – Business Advisors S.p.A. Italy 6 ASF ASFINAG - Autobahnen- und Schnellstraßen-Finanzierungs- Aktiengesellschaft Austria 7 ORF Österreichischer Rundfunk Austria 8 - Left intentionally blank 9 TUW Technische Universität Wien Austria 10 ASC Ascom Switzerland Ltd Switzerland 11 TRG University of Southampton United Kingdom 12 PWP pwp-systems GmbH Germany 13 OBB Oberste Baubehörde im Bayerischen Staatsministerium des Innern Germany 14 DOR Dornier Consulting GmbH Germany 15 GEW GEWI Hard- und Software Entwicklungsgesellschaft mbH Germany 16 BRE Autostrada del Brennero Italy 17 VEG VEGA Informations-Technologien GmbH Germany 18 - Left intentionally blank 19 LOD Politechnika Lodzka Poland 20 TRA TRANSVER GmbH Germany 21 FHG Fraunhofer-Gesellschaft zur Förderung der angewandten Forschung E.V. Germany 22 EFM EFKON Germany GmbH Germany 23 EFK EFKON AG Austria 24 VTI Statens väg- och transportforsknings-institutet Sweden 25 KTH Kungliga Tekniska Högskolan Sweden 26 NET TeamNet International S.A. Romania 27 INO INESC Inovação – Instituto de Novas Tecnologias Portugal 28 APP LGAI Technological Center S.A. Spain 29 ICI National Institute for Research Development in Informatics Romania 30 TUC Technical University of Crete Greece 31 KYB Kybertec, s.r.o. Czech Republic 32 JAS JAST Sàrl Switzerland 33 BMW Bayerische Motoren Werke Aktiengesellschaft Germany 34 NAV Navteq B.V. Netherlands 35 - tbd1 36 - TBD2 37 ARC Austrian Research Centers GmbH Austria 38 ASA ASFA – Association professionelle des Sociétés Françaises concessionnaires ou
exploitantes d’Autoroutes ou d’ouvrages routiers France
39 TSB TSB – FAV, Technologiestiftung Berlin – Forschungs- und Anwendungsverbund Germany

COOPERS integrated project
D15 - IR 7100/7200/7300/7400 Report on common result assessment
Page 3 of 191
Verkehrssystemtechnik Berlin 40 MIZ MIZAR Automazione Italy 41 TEL TELARGO d.o.o., Informacijske rešitve v prometu in tranportu Slovenia 42
Document History:
Version Date Released by Description 0.1 15.01.2010 Koelbl Document content drafted 0.15 02.02.2010 Koelbl Input from Partners - WS agreements Results site 1, data and preview 0.2 16.03 Koelbl Various chapters revised, transmission
times I2V inserted, preliminary results site 3, local test´s site 4,
0.22 21.04 Partners Results according to WS 14.04 discussion 0.24 17.05 Koelbl Results added according to speed, lane
change, distances 0.26 03.06 Partners Various capters updated, WS 1.2.06 0.3 18.06 Koelbl Full document revision, draft status

COOPERS integrated project
D15 - IR 7100/7200/7300/7400 Report on common result assessment
Page 4 of 191
Table of Contents
1 Introduction 21
1.1 Overview 21
1.2 Aim and Hypothesis 21
1.3 Methods 21
1.4 Outline of the Report 22
1.5 Conclusions 22
2 COOPERS communications system 23
3 User Acceptance Questionnaire Results 28
3.1 User Acceptance Questionnaire Results 28
3.1.1 Combined Results Test sites Innsbruck, Trento and Berlin 28
3.1.1.1 Age 28
3.1.1.2 Gender 29
3.1.1.3 Driving Experience 29
3.1.1.4 Perceived Usefulness/Performance Expectancy 30
3.1.1.5 Perceived Ease of Use/Effort Expectancy 31
3.1.1.6 Attitude 33
3.1.1.7 Social Influence 34
3.1.1.8 Facilitating Conditions 35
3.1.1.9 Self-Efficacy/Anxiety 36
3.1.1.10 Behavioural Intention 38
3.1.1.11 Perceived Enjoyment 39
3.1.1.12 Confirmation 40
3.1.1.13 Overall Satisfaction 41
3.1.1.14 Willingness to Pay 42
3.1.1.15 Service Preference 44
3.1.1.16 Results of the open questions 45

COOPERS integrated project
D15 - IR 7100/7200/7300/7400 Report on common result assessment
Page 5 of 191
3.1.2 Results Test site Innsbruck 47
3.1.2.1 Age 47
3.1.2.2 Gender 48
3.1.2.3 Perceived Usefulness/Performance Expectancy 48
3.1.2.4 Perceived Ease of Use/Effort Expectancy 49
3.1.2.5 Attitude 50
3.1.2.6 Behavioural Intention 51
3.1.3 Results Test site Trento 52
3.1.3.1 Age 52
3.1.3.2 Gender 53
3.1.3.3 Perceived Usefulness/Performance Expectancy 54
3.1.3.4 Perceived Ease of Use/Effort Expectancy 54
3.1.3.5 Attitude 55
3.1.3.6 Behavioural Intention 56
3.1.4 Results Test site Berlin 56
3.1.4.1 Age 57
3.1.4.2 Gender 57
3.1.4.3 Perceived Usefulness/Performance Expectancy 58
3.1.4.4 Perceived Ease of Use/Effort Expectancy 59
3.1.4.5 Attitude 59
3.1.4.6 Behavioural Intention 60
3.2 In-depth interviews 61
3.3 Comparison of field test and simulator study results 64
3.3.1 Perceived Usefulness 64
3.3.2 Perceived Ease of Use 65

COOPERS integrated project
D15 - IR 7100/7200/7300/7400 Report on common result assessment
Page 6 of 191
3.3.3 Behavioural Intention 66
3.4 Comparison of field test results between groups 67
3.4.1 Gender 67
3.4.2 Age 68
3.5 Conclusions 69
4 Physiological Measures Results 71
4.1 Eye tracking results 71
4.2 Heart rate results 71
4.3 Comparison of simulator study and field tests 72
4.4 Conclusions 72
5 Traffic and Safety Performance 73
5.1 Austria 73
5.1.1 Comparison of general traffic conditions with COOPERS ON / OFF 75
5.1.2 Speed and acceleration profiles (COOPERS ON/ COOPERS OFF) 78
5.1.3 Lane- changing behavior (COOPERS ON/ OFF) 92
5.1.4 Combining driver behaviour with physiological measurements 98
5.1.5 Combining driver behaviour with user acceptance 98
5.1.6 Implications for safety and traffic performance 99
5.1.7 Conclusions 99
5.2 Italy 100
5.2.1 Introduction 100
5.2.2 Speed and acceleration profiles (before/ after) 102
5.2.2.1 Speed profiles 102
5.2.2.2 Acceleration profiles 106
5.2.3 Lane- changing behaviour 110
5.2.4 Combining driver behaviour with physiological measurements 112
5.2.5 Combining driver behaviour with user acceptance 113

COOPERS integrated project
D15 - IR 7100/7200/7300/7400 Report on common result assessment
Page 7 of 191
5.2.6 Implications for safety and traffic performance 116
5.2.7 Conclusions 116
5.3 Berlin 118
5.3.1 Overview 118
5.3.2 Aim and Hypothesis 119
5.3.2.1 Research Approach 119
5.3.2.2 Analyzing approach 122
5.3.3 General traffic conditions 124
5.3.4 Speed and acceleration profiles 125
5.3.4.1 Sample test 131
5.3.4.2 Summary 132
5.3.5 Lane behavior 132
5.3.5.1 Summary 135
5.3.6 Distance behavior 135
5.3.6.1 Summary 140
5.3.6.2 Summary Statistics 141
5.3.7 Combining driver behavior with physiological measurements 144
5.3.8 Combining driver behavior with user acceptance 144
5.3.9 Implications for safety and traffic performance 144
5.4 Conclusions 146
6 Recommentations on safety legislation 148
6.1 Introduction 148
6.2 Liability issues with introduction of I-V cooperative systems 148
6.2.1 Introduction 148
6.2.2 Potential Impacts of I-V cooperative systems on liability 148
6.2.2.1 Findings from other studies 148

COOPERS integrated project
D15 - IR 7100/7200/7300/7400 Report on common result assessment
Page 8 of 191
6.2.2.2 Findings from COOPERS 150
6.2.3 Existing Safety Legislation and Standards 153
6.2.3.1 Road Operators Liability 153
6.2.3.2 System manufacturers 153
6.2.3.3 Driver’s liability 154
6.2.4 Summary, conclusions and recommendations 154
6.3 Privacy and data ownership issues with the introduction of I-V cooperative systems155
6.3.1 Introduction 155
6.3.2 Background on current legislation 155
6.3.2.1 Law regarding infrastructure and transportation 156
6.3.2.2 Motor Vehicle Law 158
6.3.2.3 Data Protection 158
6.3.2.4 Liability questions 161
6.3.3 Summary 163
6.3.3.1 Community Law 163
6.4 Distraction and information overload issues with the introduction of I-V cooperative systems 164
6.4.1.1 Distraction 164
6.4.1.2 Information overload 165
6.4.2 Findings from COOPERS 165
Findings from other studies 167
Existing safety legislation and standards 174
6.4.2.1 Transport Canada 174
6.4.2.2 ISO International Standards 175
6.4.2.3 The European Statement of Principles on Human-Machine Interface 177
6.4.2.4 The European eSafety Forum 177

COOPERS integrated project
D15 - IR 7100/7200/7300/7400 Report on common result assessment
Page 9 of 191
Action Plan for the Deployment of ITS in Europe 181
6.4.3 Proposal for an ITS DIRECTIVE 183
It is clear that COOPERS can help in shaping the Directive. 185
Summary and conclusions 185
6.4.4 Summary 185
6.4.4.1 Liability issues 185
6.4.4.2 Privacy and data ownership 186
6.4.4.3 Driver distraction and overload 186
7 Annex A Speed and accelerations 188
8 References 190

COOPERS integrated project
D15 - IR 7100/7200/7300/7400 Report on common result assessment
Page 10 of 191
List of Figures
Figure 1: Number of test drivers within age groups (all test drivers) ...............................................................................29
Figure 2: Number of female and male drivers (all test drivers) .......................................................................................29
Figure 3: Number of test drivers with low, medium and high experience in driving on motorways (all test drivers).......30
Figure 4: Perceived usefulness (all test drivers)........................................................................................................31
Figure 5: Perceived ease of use (all test drivers) ............................................................................................................33
Figure 6: Attitude towards using the COOPERS system (all test drivers).......................................................................34
Figure 7: Social influence (all test drivers) ......................................................................................................................35
Figure 8: Facilitating Conditions (all test drivers) ............................................................................................................36
Figure 9: Self efficacy (all test drivers) .......................................................................................................................37
Figure 10: Anxiety (all test drivers) ..................................................................................................................................38
Figure 11: Behavioural Intention (all test drivers)............................................................................................................39
Figure 12: Perceived Enjoyment (all test drivers)............................................................................................................40
Figure 13: Confirmation (all test drivers) .........................................................................................................................41
Figure 14: Overall satisfaction (all test drivers) ...............................................................................................................42
Figure 15: Willingness to pay (all test drivers).................................................................................................................43
Figure 16: Price for investing once (all test drivers) ........................................................................................................43
Figure 17: Payment monthly basis (all test drivers) ........................................................................................................44
Figure 18: Ranking of services (all test drivers) ........................................................................................................45
Figure 19: Number of test drivers in age groups (Innsbruck)..........................................................................................48
Figure 20: Number of female and male drivers (Innsbruck)............................................................................................48
Figure 21: Perceived usefulness (Innsbruck) ..................................................................................................................49
Figure 22: Perceived ease of use (Innsbruck).................................................................................................................50
Figure 23: Attitude towards using the system (Innsbruck) ..............................................................................................51

COOPERS integrated project
D15 - IR 7100/7200/7300/7400 Report on common result assessment
Page 11 of 191
Figure 24: Behavioural intention (Innsbruck)...................................................................................................................52
Figure 25: Number of test drivers in age groups (Trento) ...............................................................................................53
Figure 26: Number of female and male drivers (Trento) .................................................................................................53
Figure 27: Perceived usefulness (Trento) .......................................................................................................................54
Figure 28: Perceived Ease of use (Trento) .....................................................................................................................55
Figure 29: Attitude towards using the system (Trento)....................................................................................................56
Figure 30: Behavioural Intention (Trento)........................................................................................................................56
Figure 31: Number of test drivers in age groups (Berlin) ................................................................................................57
Figure 32: Number of female and male drivers (Berlin) ..................................................................................................58
Figure 33: Perceived Usefulness (Berlin) ........................................................................................................................58
Figure 34: Perceived ease of use (Berlin) .......................................................................................................................59
Figure 35: Attitude towards using the system (Berlin).....................................................................................................60
Figure 36: Behavioural Intention (Berlin) .........................................................................................................................61
Figure 37: Comparison Perceived Usefulness - Field test and Simulator.......................................................................65
Figure 38: Perceived Ease of Use - Field test and Simulator .........................................................................................66
Figure 39: Behavioural Intention - Field Test and Simulator ...........................................................................................67
Figure 40: Attitude (gender comparison).........................................................................................................................68
Figure 41: Attitude (age group comparison)....................................................................................................................69
Figure 42: Behavioural intention to use (age group comparison) ...................................................................................69
Figure 43: Comparison of the heart rates with Coopers OFF versus ON over all drivers with the off – on sequence. ..72
Figure 5-1: Austrian demonstration site ..........................................................................................................................73
Figure 5-2: Gender distribution........................................................................................................................................74
Figure 5-3: Age distribution .............................................................................................................................................74
Figure 5-4: Traffic Speed and Occupancy on: (a) Lane-1; (b) Lane-2, at the time of driving for Driver 02 (Austria) ......77
Figure 5-5: Impact of COOPERS on driver 02 behaviour: (a) Speed profile; (b) Acceleration profile ...........................79

COOPERS integrated project
D15 - IR 7100/7200/7300/7400 Report on common result assessment
Page 12 of 191
Figure 5-6: Impact of COOPERS on the speed behaviour of driver 42 ..........................................................................80
Figure 5-7: Impact of COOPERS on the speed behaviour of driver 34 ..........................................................................81
Figure 5-8: Average speed profile of all drivers with COOPERS ON and OFF ..............................................................83
Figure 5-9: Average Speed of Drivers below 30 years of Age ........................................................................................84
Figure 5-10: Average Speed of Drivers with Age (30 - 44 years) ...................................................................................85
Figure 5-11: Average Speed of Drivers with Age (45 - 59 years) ...................................................................................86
Figure 5-12: Average Speed of Drivers with Age (60 - 69 years) ...................................................................................87
Figure 5-13: Male driver with COOPERS ON and OFF ..................................................................................................89
Figure 5-14: Female driver with COOPERS ON and OFF..............................................................................................89
Figure 5-15: Impact of the sequence of driving on the effect of COOPERS (a) OFF-ON sequence; (b) ON-OFF sequence ..................................................................................................................................................................90
Figure 5-16: Driving speed frequency distribution...........................................................................................................91
Figure 5-17: Acceleration noise for COOPERS ON and OFF for each driver ................................................................92
Figure 5-18: Lane changing behaviour with COOPERS ON and OFF for driver 02 .......................................................93
Figure 5-19: Lane changing behaviour with COOPERS ON and OFF for driver 42 – congestion of messages ............94
Figure 5-20: Lane changing behaviour with COOPERS ON and OFF for driver 34 – No complete date.......................94
Figure 5-21: Lane-changing frequency of male drivers...................................................................................................96
Figure 5-22: Lane-changing frequency of female drivers................................................................................................96
Figure 23-4 : construction site [2] (picture front camera) ..............................................................................................119
Figure 24: COOPERS Stakeholders and User Groups................................................................................................151
Figure 25: The methodology and elements of COOPERS............................................................................................156
����������� ������������������������������� ...............................................................................................................166

COOPERS integrated project
D15 - IR 7100/7200/7300/7400 Report on common result assessment
Page 13 of 191
List of Tables Table 5-1: Summary of the general traffic conditions comparison between COOPERS ON /OFF ................................77
Table 5-2: Summary of the average driving speed for all drivers....................................................................................81
Table 5-3: Age group's categories...................................................................................................................................82
Table 5-4: Comparison of average speed .......................................................................................................................83
Table 5-5: Comparison of the average speed of all drivers with COOPERS ON/ OFF ..................................................84
Table 5-6: Comparison of the average speed of drivers below 30 years old with COOPERS ON/ OFF........................84
Table 5-7: Comparison of the average speed of drivers with age (30-44 years) with COOPERS ON/ OFF..................85
Table 5-8: Comparison of the average speed of drivers with age (45-59 years) with COOPERS ON/ OFF..................86
Table 5-9: Comparison of the average speed of drivers with age (60-69 years) with COOPERS ON/ OFF..................87
Table 5-10: Comparison of Average speed according to age and gender of the drivers................................................88
Table 5-11: Average driving speed for male and female for COOPERS ON/OFF .........................................................89
Table 5-12: Frequency of lane-changing behaviour........................................................................................................94
Table 5-13: Comparison of the frequency of lane-changes according to age and gender of the drivers .......................95
Table 5-14: Average frequency of lane-changing for male and female for COOPERS ON/OFF ...................................96
Table 5-15: Result of regression analysis (DV: Driving Speed) ......................................................................................97
Table 5-16: Drivers with good and poor acceptance of the COOPERS system/ Austria................................................98
Table 17: ITS Action Plan: Detailed actions bearing on COOPERS.............................................................................183

COOPERS integrated project
D15 - IR 7100/7200/7300/7400 Report on common result assessment
Page 14 of 191
Abbreviations
3G 3rd Generation Networks
4G 4th Generation Networks
AADT Annual Average Daily Traffic
AASHTO American association of state and highway transportation officials
AB Abbiege-Unfall
ABS Antilock Braking Systems
ACC Automated Cruise Control
ADAS Advanced Driver Assistance Systems
AETR European Agreement Concerning the Work of Crews of Vehicles Engaged in International Road Transport
AG Aktiengesellschaft
AIDE adaptive integrated driver-vehicle interface
AIDER Innovative Vehicle-Infrastructure Telematics for Rescue Operations
AIS Abbreviated Injury Scale
AIS/ISS Abbreviated Injury Scale/Injury Severity Scores
AKTIV Adaptive und Kooperative technologien für den Intelligenten Verkehr
AP Action Point
API application programming interface
ART Article
ARTS Advanced Road Telematics in the South-West
ASRB automotive safety restraints bus
ASV Advanced Safety Vehicle
AUTOSAR Automotive Open System Architecture
AVCSS Advanced Vehicle Control and Safety Systems
AVI Automatic Vehicle Identification
BASt Bundesanstalt für Straßenwesen
BMVBW Bundesministerium für Verkehr, Bau- und Wohnungswesen
BMVIT Bundesministerium für Verkehr, Innovation und Technologie
BS British Standard
BSI Bundesamt für Sicherheit in der Informationstechnologie
CA Collision Avoidance
CA Consortium Agreement
CALM Communication Air-interface Long and Medium range
CALM M5 Continuous Air interfaces - Long and Medium Range - Microwave 5 GHZ
CAN CAN-Bus (Controller Area Network)
CARE Community database on Accidents on the Roads in Europe
CAREPLUS Citizens Active in Reading Education Plus CARTALK-2000
Safe and comfortable driving based upon inter-vehicle communication
CCTV Closed Circuit Television
CDC Collision Deformation Classification
CDMA Code division multiple access
CDRG Centrally Determined Route Guidance
CE Communauté Européenne
CEN European Committee for Standardisation

COOPERS integrated project
D15 - IR 7100/7200/7300/7400 Report on common result assessment
Page 15 of 191
CENELEC European Committee for Electro technical Standardisation
CENTRICO Central European region transport telematics implementation co-ordination CHAMEL-EON Pre-crash application all around the vehicle
CICAS Cooperative Intersection Collision Avoidance Systems
CO Coordinator
COOPERS Co-operative systems for Intelligent Road Safety
CORBA Common Object Request Broker Architecture
CORVETTE Co-ordination and validation of the deployment of advanced transport telematic systems in the Alpine area
COST Coopération européenne dans le domaine de la recherche scientifique et technique
CPU Central Processing Unit
CRC Cyclic Redundancy Check
CS Cost statement
CSMA/CA Carrier Sense Multiple Access - Collision Avoidance
CT Communication Tool
CVIS Cooperative Vehicle-Infrastructure Systems
CW Collision Warning
D Deliverables
D&E Dissemination and exploitation
DAB Digital Audio Broadcasting
DAB/ DVB Digital audio broadcasting/ digital video broadcasting
DARC Data Radio Channel
DART Dutch Accident Research Team
DATEX Data exchange
DC Dissemination committee
DG Direction General
DG INFSO Directorate General Information Society and Media
dGPS Differential Global Positioning System
DIS Driver Information System
DML Demonstration management leader
DOT departments of transportation
DSRC Dedicated Short-Range Communication
DVB Digital video broadcasting
DVR Deutscher Verkehrssicherheitrat
e.g. for example
E/E/PE Electrical/Electronic/Programmable Electronic
EASIS Electronic architecture and system engineering for integrated safety systems
EC European Commission
eCall emergency Call
ECE Economic Commission for Europe
ECU electronic control unit
EDIFACE Electonic Data Interface
EEA European Environment Agency
EEC European Economic Community
EEG Electroencephalogram
EES Equivalent energy speed
EFC Electronic Fee Collection

COOPERS integrated project
D15 - IR 7100/7200/7300/7400 Report on common result assessment
Page 16 of 191
EFCD Enhanced floating car data
EFTA European Free Trade Association
EK Einbiegen-/Kreuzen-Unfall
EMC Electromagnetic Compatibility
E-MERGE European Mountain lake Ecosystems: Regionalisation, diaGnostics and socio-economic Evaluation
EMI Electromagnetic Interference
EN European Norm
ERI Electronic Registration Identification
ESA European Space Agency
ESC Electronic Stability Control
ESP Electronic stability program
ESS Environmental Sensor Stations
ETA Estimated time of arrival
ETSI European Telecommunications Standards Institute
EU European Union
EUC Equipment Under Control
EVTA Event tree analysis
EWG Environmental Working Group
FCD Floating Car Data
FM Frequency Modulation
FMEA Failure Mode and Effects Analysis
FMECA Failure Modes, Effects, and Criticality Analysis
FMSCA Federal Motor Carrier Safety Administration
FP Framework Programme
FRAME Framework architecture made for Europe
FStrAbG Fernstraßenausbaugesetz
FSV Forschungsgemeinschaft Strasse und Verkehr
FTA Fault Tree Analysis
FTDMA Flexible Time Division Multiple Access - bandwidth partitioning by time slicing
G generation
GDF Geographic Data Files
GHR Gazis-Herman-Rothery
GIS Geographical information system
GM General Motors
GNSS Global Navigation Satellite System
GPRS General Packet Radio Service
GPS Global Positioning System
GSM Global system for mobile communications
GSSF Galileo system simulation facility
GST Global System for Telematics
HANNIBAL High Altitude Network for the Needs of Integrated Border-Crossing Applications and Links
HAZOP Hazard and Operability analysis
HGV Heavy Goods Vehicles
HL high level
HMI Human Machine Interface
HOV High Occupancy Vehicle
HUDs Head-Up Displays

COOPERS integrated project
D15 - IR 7100/7200/7300/7400 Report on common result assessment
Page 17 of 191
HW+SW Hardware + Software
I Infrastructure
I/O input/output
I2V Infrastructure to Vehicle
ICD International Classification of Diseases
ICT Information and Communications Technology
ICTSB ICT Standard Board
ID Identification
IEC International Electronical Commission
IEEE Institute of Electrical and Electronics Engineers
INS Institut national de Statistique
INVENT Infrastructure for Virtual Enterprises
IOG Infrastructure operator group
IP Integrated project
IR Internal report
IRTAD International Road Traffic and Accident Database
ISA Intelligent Speed Adaptation
ISDN Integrated services digital network
ISO International Organization for Standardization
ISP Industry and Component Suppliers Panel
IST Information society technologies
ISTAT Istituto Centrale di Statistica
IT Information Technology
ITS Intelligent Transport Systems
ITSSG Intelligent Transport Systems Steering Group
ITU-T International telecommunication Union – Terminals for telematic services
IVHW Inter Vehicle Hazard Warning
IVI Intelligent vehicle infrastructures
J2EE Java 2 platform enterprise edition
J2SE Java 2 platform standard edition
JK Jahreskarte
KAREN Keystone architecture required for European networks
KD Unfallkostendichte
KFV Kuratorium für Verkehrssicherheit
KL Unfallsbelastungskosten
KPI Key performance indicators
KR Unfallkostenrate
kW kiloWatt
LACOS Large Scale Correct Systems
LAN Local area network
LATERAL-SAFE Lateral driver assistance applications
LCS Line Control Systems
LDRG Locally Determined Route Guidance
LDW/A Lane Departure Warning/Avoidance
LDWS Lane Departure Warning Systems
LED Light Emitting Diode
LIN Local interconnect network

COOPERS integrated project
D15 - IR 7100/7200/7300/7400 Report on common result assessment
Page 18 of 191
LOS Level of Service
LV Unfall durch Längsverkehr
LVD Low Voltage Directive
M Milestone
MALSO Manoeuvring Aids for Low Speed Operation
MOST- Bus Media oriented systems transport bus
MOT Multimedia object transfer protocol
MT Management team
MTM Methods Time Measurement
NGOs Non-Governmental Organizations
OBU Onboard Unit
OEM Original Equipment Manufacturer/Manufacturing
OSGi open services gateway initiative
PAC Policy advisory panel
PAD Portable Application Description
PATH Program for Advanced Transit and Highway
PC Project Coordinator
PCI peripheral component interconnection
PCMCIA personal computer memory card international association
PDA Personal digital assistant
PDAC plan-do-act-control
PDT Peripheral Detection Task
PM Person months
PMT Project Management Team
PPP Public private partnership
PReVENT Preventive and Active Safety Applications
PROSPER Project for Research on Speed adaptation Policies on European Roads
PSAPs Public Safety Answering Points
PT public transport
PTPS Public Transportation Priority System
R Reports
R&D Research & development
RACM Reasonably available control measures
RAMSS Reliability, Availability, Maintainability, Safety & Security
RDCW Road Departure Crash Warning
RDS Radio Data Systems
RDS-TMC Radio Data System - Traffic Message Channel
RFID Radio Frequency Identification Device
RMI Road monitoring infrastructure
RM-ODP Reference Model – Open Distributed Processing
RPN Risk Priority Number
RPU Robust Positioning Unit
RRS Road Restraint Systems
RSE roadside equipment
RSU roadside unit
RTA Road Traffic Advisor
RTD Round trip delay

COOPERS integrated project
D15 - IR 7100/7200/7300/7400 Report on common result assessment
Page 19 of 191
RTLX Raw Task Load indeX
RTTT Road Transport and Traffic Telematics
RV Unfall durch ruhenden Verkehr
RX Receiver
SA System architecture
SAE System Architecture Evolution
SAE Society of Automotive Engineers
SAFELANE Situation Adaptive system For Enhanced LANE keeping support
SafeSpot Cooperative vehicles and road infrastructure for road safety
SARTRE Social Attitudes to Road Traffic Risk in Europe
SBAS Satellite Based Augmentation System
SCB Statistics Sweden
SCOM Steering committee
SERTI Southern European Road Telematic Implementations
SIG Special Interest Group
SIKA Statens Institut för KommunikationsAnalys
SIL Safety Integrity Level
SMS Short message service
SNRA Swedish National Road Administration
SO Sonstiger Unfall
SRA Swedish Road Administration
SRB Safety research board
STRADA Swedish Traffic Accident Data Acquisition STREETWISE
Seamless Travel EnvironmEnt for the Western Isles of Europe
STVO Straßenverkehrsordnung
StVUnfStatG Straßenverkehrsunfallstatistikgesetz
SVD Selective Vehicle Detection
SWOV Stichting Wetenschappelijk Onderzoek Verkeersveiligheid
SWP Sub Work Package
SWPL Sub-work package leaders
TCC Traffic Control Centres
TCT Technical co - ordination team
TDMA Time Division Multiple Access - bandwidth partitioning by time slicing
TEN Trans European network
TEN-MIP Trans European network-multi annual programme
TEU Traffic eye universal
TIC Traffic Information Centre
TICS Traffic Information and Control Systems
TISP Traffic information service provider
TIWS Traffic Impediment Warning Systems
TLT Thematic leader team
TMC Traffic Message Channel
TMIC Traffic management and information centres
TMT Thematic leader teams
TNO Nederlandse Organisatie voor Toegepast Natuurwetenschappelijk Onderzoek
TPEG Transport Protocol Experts Group
TRMM Trunk Road Maintenance Manual

COOPERS integrated project
D15 - IR 7100/7200/7300/7400 Report on common result assessment
Page 20 of 191
TTI Tactical traffic image
TTI Traffic and Traveller Information
TTP(/C) Time-Triggered Protocol (/ Dependability Level C)
TX Transmitter
U Unfälle
UD Unfalldichte
UDP user datagram protocol
UL Unfallbelastung
UML Unified modelling language
UMTRI University of Michigan Transportation Research Institute
UMTS Universal mobile telecommunications system
UR Unfallrate
US United States
ÜS Überschreiten-Unfall
USDOT United States department of transportation
UTMS Universal Traffic Management Society
V Vehicle
V2I vehicle to infrastructure
V2V Vehicle to Vehicle
VAS Value added service
VEESA vehicle e-safety architecture
VII vehicle infrastructure integration
VIKING Co-ordination of ITS implementation in northern Europe
VMS Variable Message Sign
VMT Vehicle mile traveled
VRUs Vulnerable Road Users
VSL Variable Speed Limit
VTPI Voorhees Transportation Policy Institute
VTTI Virginia Tech Transportation Institute
WBS Work breakdown structure
WBT Web based training
WILLWARN Wireless Local Danger Warning
WLAN Wireless local area network
WP Work Package
WPL Work Package Leader
WüStV Wiener Übereinkunft über den Straßenverkehr
XFCD Extended Floating Car Data
XGDF eXtended Geographic Data Files
XML eXtensible Markup Language
ZIP Zone Improvement Plan

COOPERS integrated project
D15 - IR 7100/7200/7300/7400 Report on common result assessment
Page 21 of 191
1 Introduction
This document is an early draft of the COOPERS results of the demonstrations as elaborated from the data of the more than 130 demonstration drives on the sites and is based on the fully analysed numerical data sets from the single drives as far as available.
As the time from conclusion of data collection to elaboration of this report was short this report includes the main findings of the research work but not all the consequences coming from this findings.
Also a balanced discussion of the single findings between all partners involved has been started in several workshops in the elaboration but was not conclusive up to now.
1.1 Overview
Number of demonstration drives completed and validated for full data availability is more than 130.
The methodology used to compare demonstration drives between the demonstration sites and simulator results is confirmed and the data very promising.
Overall limitation of data availability from demonstration site 2 is valid also for this report.
1.2 Aim and Hypothesis
The scope of this document is to elaborate the scientific foundations for the analysis and conclusions of the various aspects of the IP COOPERS from technical point of view, the user reactions point of view and the system level abstractions point of view. For these areas the working assumptions and hypothesis will be made explizit in the single chapters of the report
1.3 Methods
The methods used in COOPERS are documented in the report of SWP2300 Evaluation of demonstration sites/ methodology, and have been followed during the whole project cycle with adaptations of the local research agenda, for technical test´s and additional topics, e.g like theimpact on distraction levels tested for drivers which are not used to drive with navigation systems.

COOPERS integrated project
D15 - IR 7100/7200/7300/7400 Report on common result assessment
Page 22 of 191
1.4 Outline of the Report
Following the introduction this report outlines the performance of the communication technologies used in COOPERS first and compares techical parameters of the sites. It will than elaborate the user acceptance parameters of the COOPERS system at the various sites and define the relations to in depth interviews and Physiological measurements, e.g eye tracking.
The following chapter will explain the results of the traffic and safety performance during the demonstrations and the concluding element will be recommendations on safety legislation.
1.5 Conclusions
To be added.

COOPERS integrated project
D15 - IR 7100/7200/7300/7400 Report on common result assessment
Page 23 of 191
2 COOPERS communications system
Egbert Althammer (AIT) and Christoph Mecklenbräuker (TU Wien). Raw report (v1).
Statistical analysis of the latencies of messages from the COOPERS Service Center (CSC) to the Auto PC (APC) at Testsite 3B (Berlin)
Wireless Technology: Digital Audio Broadcast Terrestrial (DAB-T)
Observation interval: March 5 – April 29, 2010.
SQL Query: Test site 3B WP7000_latency csc apc.sql
SQL Query carried out on Tuesday, May 11, 2010 (afternoon).
Note: the CSC uses local time without Daylight Saving Time (UTC+1) and the APC uses Universal Coordinated Time (UTC) in timestamps.
We define the latency time for entries in the database by (arrivetime – sendtime).
3894 messages were decoded successfully at the APC in total during the observation interval.
In the database, the first set of entries after the startup of the DAB-T transmitter is not relevant due to the transient behaviour of the resulting large latency times: Messages have been created before the DAB-T transmitter was up and this results in outliers in the latency data. For this reason, we censor the latency data.
After censoring the latency data by the restriction „(MINUTE >= 0) and (MINUTE <=30)“, we get the following histogram of latencies:

COOPERS integrated project
D15 - IR 7100/7200/7300/7400 Report on common result assessment
Page 24 of 191
After censoring the latency data by the restriction „(MINUTE >= 0) and (MINUTE <=30)“, we get the following latency statistics:
����� � ����� �� ����� ��!� ��������
�����������"�������� �##��� �� ����� �$� ��������
������� � %��&� �� ����� ��� ��������
$'�(�����)�� �!��&� �� ����� ��� ��������
#&'�(�����)�� !�#�&� �� ����� %��� ��������
#�'�(�����)�� %�%&�$� �� ����� %�!� ��������

COOPERS integrated project
D15 - IR 7100/7200/7300/7400 Report on common result assessment
Page 25 of 191
After censoring the latency data by the restriction <= 120 seconds, we get the following histogram:
After censoring the latency data by the restriction <= 120 seconds, we get the following statistics:
����� � $��&� �� ����� %�� ��������
�����������"�������� �!� �� ����� &��� ��������
������� � $�&� �� ����� %��� ��������
$'�(�����)�� !!�&� �� ����� %��� ��������
#&'�(�����)�� %&!�&� �� ����� %�!� ��������
#�'�(�����)�� %%��&� �� ����� %�#� ��������

COOPERS integrated project
D15 - IR 7100/7200/7300/7400 Report on common result assessment
Page 26 of 191

COOPERS integrated project
D15 - IR 7100/7200/7300/7400 Report on common result assessment
Page 27 of 191

COOPERS integrated project
D15 - IR 7100/7200/7300/7400 Report on common result assessment
Page 28 of 191
3 User Acceptance Questionnaire Results
3.1 User Acceptance Questionnaire Results
In order to predict the usage of a new system and the adopted level of technological sophistication it is important to identify and to measure users' perceptions towards a new system. (Kamel 1997). In case of heavy investments required before systems can be implemented, it becomes a requirement to take user acceptance considerations into account already in early development phases, thus, setting the best preconditions for later broad adoption and intensive use of the system.
For this reason user acceptance for the COOPERS system has been measured in the field tests in Innsbruck, Trento and Berlin.
3.1.1 Combined Results Test sites Innsbruck, Trento and Berlin
The following section gives an overview on the overall results gained on the test sites in Austria, Trento and Berlin. The overall sample of test participants involved 133 male and female test drivers. After describing the sample in more detail, results regarding the different categories of user acceptance are presented.
3.1.1.1 Age
Five age groups have been tested (up to 29; 30-44; 45-59; 60-69; 70+). The group of 30-44 year old people comprised 58 participants and was therefore the largest participant group. The second largest group with 36 test drivers was build by the group of 45-59 year old drivers. Besides that majority of test drivers between 30 and 59 years, the tests in Innsbruck, Trento and Berlin considered as well the group of younger (up to 29) and older drivers (60+). Thus results of user acceptance measuring are based on a representative sample.
The following graph illustrates the participants per age group. The x-axis shows age groups and the y-axis illustrates the number of participants.

COOPERS integrated project
D15 - IR 7100/7200/7300/7400 Report on common result assessment
Page 29 of 191
Figure 1: Number of test drivers within age groups (all test drivers)
3.1.1.2 Gender
The sample tested in Innsbruck, Trento and Berlin comprised the following gender distribution. About two thirds of test drivers were male (88 test drivers) and about one third female (45 test drivers). Although less women were participating at the tests on the three test sites the user acceptance measuring involved female test drivers of all age groups. The x-axis shows the gender of participants, the y-axis the number of participants per gender group.
Figure 2: Number of female and male drivers (all test drivers)
3.1.1.3 Driving Experience
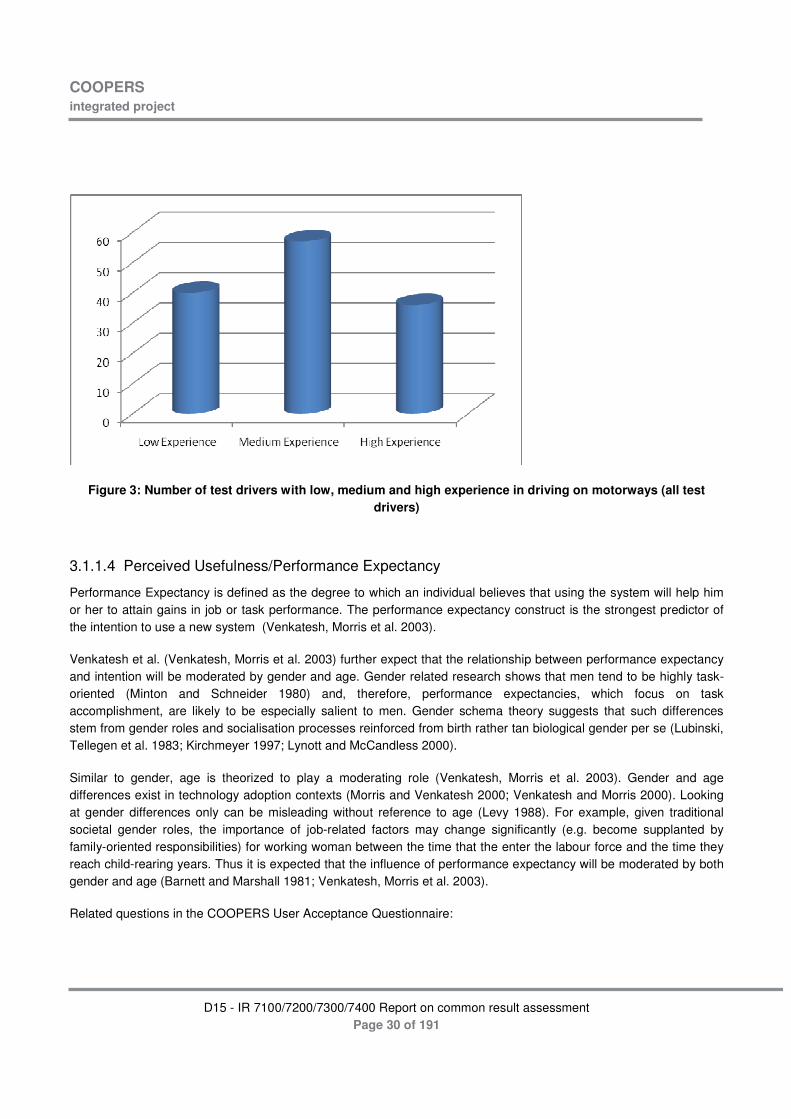
In order to show the driving experience of the test participants, an Experience Score was calculated. The Experience Score was derived from answers to the questions B1: How regularly are you driving on motorways, B2: How many kilometres are you actively driving on motorways per year and B4: Do you use a navigation system in your car. It revealed three driver classes, the drivers with low experience, drivers with medium experience and drivers with high experience. The following figure illustrates that most of the drivers had at least a medium or a high level of experience with driving on motorways. The x-axis shows the experience of participants, the y-axis the number of participants per experience group.
COOPERS integrated project
D15 - IR 7100/7200/7300/7400 Report on common result assessment
Page 30 of 191
Figure 3: Number of test drivers with low, medium and high experience in driving on motorways (all test drivers)
3.1.1.4 Perceived Usefulness/Performance Expectancy
Performance Expectancy is defined as the degree to which an individual believes that using the system will help him or her to attain gains in job or task performance. The performance expectancy construct is the strongest predictor of the intention to use a new system (Venkatesh, Morris et al. 2003).
Venkatesh et al. (Venkatesh, Morris et al. 2003) further expect that the relationship between performance expectancy and intention will be moderated by gender and age. Gender related research shows that men tend to be highly task-oriented (Minton and Schneider 1980) and, therefore, performance expectancies, which focus on task accomplishment, are likely to be especially salient to men. Gender schema theory suggests that such differences stem from gender roles and socialisation processes reinforced from birth rather tan biological gender per se (Lubinski, Tellegen et al. 1983; Kirchmeyer 1997; Lynott and McCandless 2000).
Similar to gender, age is theorized to play a moderating role (Venkatesh, Morris et al. 2003). Gender and age differences exist in technology adoption contexts (Morris and Venkatesh 2000; Venkatesh and Morris 2000). Looking at gender differences only can be misleading without reference to age (Levy 1988). For example, given traditional societal gender roles, the importance of job-related factors may change significantly (e.g. become supplanted by family-oriented responsibilities) for working woman between the time that the enter the labour force and the time they reach child-rearing years. Thus it is expected that the influence of performance expectancy will be moderated by both gender and age (Barnett and Marshall 1981; Venkatesh, Morris et al. 2003).
Related questions in the COOPERS User Acceptance Questionnaire:

COOPERS integrated project
D15 - IR 7100/7200/7300/7400 Report on common result assessment
Page 31 of 191
Performance Expectancy: B 5.1., B 5.2., B 5.3., B 5.4., B 5.5., B 5.6., B 5.7., B 5.8. in the “before system use questionnaire”, respectively A 12.1., A 12.2., A 12.3., A 12.4., A 12.5., A 12.6., A 12.7., A 12.8. in the “after system use questionnaire”.
The following graph depicts the single questions that were asked to the test drivers and shows the likert-scale, where respondents had to rank their answers in a continuum between “strongly agree” and “strongly disagree”. The blue line indicates the average ranking of the pre-questionnaire, the red line the average ranking of the post questionnaire. The figure illustrates that test person had very positive expectations towards the COOPERS system already before they actually experienced it. The figure shows as well, that the actual COOPERS system experience did not outperformed the test driver’s expectations, but test drivers are of the opinion that with the COOPERS system they can better conform to traffic rules.
���*+� �,-������.���/��������-�)�����������"���
���*+� �,-������������.���/��������0)��������� ��+)��.����"�������1�������2�� 1)/
���*+� �,-������������.���/������� ��������/����"�����-��/
���*+� �,-������������.���/���������� �������/ .�� ����-�+)��������/����"����������--� ����)/
���*+� �,-������������.���/������� �����"��-����3���4������2�� 1)/
���*+� �,-������������.���/������� ���0������ ��-���������--� ���)��
���*+� �,-������������.���/�������5�))���6�/���+��"�����"���� ��"����� �
���*+� �,-������������.���/�������.�"����+��"����-����������0��������� ���������
Figure 4: Perceived usefulness (all test drivers)
3.1.1.5 Perceived Ease of Use/Effort Expectancy
Effort expectancy is defined as the degree of ease associated with the use of the system. Effort expectancy is a significant predictor of usage intention, however only during the first time period of system use, becoming non-significant over periods of extended and sustained usage (Davis 1989; Thompson, Higgins et al. 1991; Agarwal and Prasad 1997; Agarwal and Prasad 1998; Venkatesh, Morris et al. 2003). Effort-oriented constructs are expected to be more salient in the early stages of a new behaviour, when process issues represent hurdles to be overcome, and later become overshadowed by instrumentality concerns (Davis, Bagozzi et al. 1989; Venkatesh, Morris et al. 2003). Venkatesh and Morris (Venkatesh and Morris 2000) suggest that effort expectancy is more salient for woman than for
Strongly agree Strongly disagree
------ pre- questionnaire ------post-questionnaire

COOPERS integrated project
D15 - IR 7100/7200/7300/7400 Report on common result assessment
Page 32 of 191
men. Increased age is associated with difficulty in processing complex stimuli and allocating attention to information on the job (Plude and Hoyer 1985) both of which may be necessary when using the COOPERS system. Prior research shows that the constructs related to effort expectancy will be stronger determinants for woman (Venkatesh and Morris 2000) and for older people (Venkatesh and Davis 2000). Thus, it is proposed, that effort expectancy will be most salient for woman, particularly those who are older and with relatively little experience.
Related questions in the COOPERS user acceptance questionnaire:
Effort Expectancy: B 6.1., B 6.2., B 6.3., B 6.4., B 6.5. in the “before system use questionnaire”, respectively A 13.1., A 13.2., A 13.3., A 13.4., A 13.5. in the “after system use questionnaire”.
Figure 5 shows the results of the pre- (blue) and after- (red) questionnaire concerning the construct “Perceived ease of use”. Ease of use is besides usefulness the strongest indicator of technology acceptance. The figure illustrates that every single question that was asked relating to how easy the system is perceived was already connected to quite high expectations of the users in the pre-questionnaire. In average the test persons stated that they strongly agree that the interaction with the system was clear and understandable and that they find the system easy to use. Although the display used in the test drives was very large, test drivers had problems to read the signs and the text. That could be a possible reason, why question “I expect /found the signs on the screen to be easily readable” was rated more negative after experiencing the COOPERS system.

COOPERS integrated project
D15 - IR 7100/7200/7300/7400 Report on common result assessment
Page 33 of 191
���*+� �,-������/������� �����5��.��.��/�����5�))�0�� )�������������������0)�
���*+� �,-��������5�))�0�����/�-��������0� �����1�)-�)�������������������.�
�/����
���*+� �,-�������5�))�-�����.���/��������/������
���*+� �,-������.������������.��� �������0������)/� ��+��.����0)�
���*+� �,-������.������������.��� �������0������)/������0)�
Figure 5: Perceived ease of use (all test drivers)
3.1.1.6 Attitude
Attitude toward using technology is defined as an individual’s overall affective reaction to using a system (Venkatesh, Morris et al. 2003). Empirically, the attitude construct is seen indifferent. In some cases, the attitude construct is the strongest predictor of behavioural intention, while in other cases the construct was not significant (Venkatesh, Morris et al. 2003). Venkatesh et al. (Venkatesh, Morris et al. 2003) note, that the attitudinal constructs are significant only when specific cognitions – in this case, constructs related t performance and effort expectancies – are not included in the model. Given, that a strong relationship in UTAUT is expected between performance expectancy and intention, and between effort expectancy and intention, attitude toward using technology is hypothesized to not have a direct or interactive influence on intention.
Related questions in the COOPERS User Acceptance Questionnaire:
Attitude: B 7.1., B 7.2. B 7.3., B 7.4. in the “before system use questionnaire”, respectively A 14.1., A 14.2., A 14.3., A 14.4. in the “after system use questionnaire”.
Strongly agree Strongly disagree
------ pre- questionnaire ------post-questionnaire

COOPERS integrated project
D15 - IR 7100/7200/7300/7400 Report on common result assessment
Page 34 of 191
This figure shows again, that even before experiencing the system expectations towards the COOPERS system were high. These expectations have not been outperformed by using the system, but test drivers found that the system makes driving more interesting and that they liked to drive with the COOPERS system.
���*+� �,-�����.���/����
��1������"�������
�����������
���*+� �,-�������"����5��.��.��/�����5�))�0�
-��
���*+� �,-�������)�1�����"���
5��.��.���/����
Figure 6: Attitude towards using the COOPERS system (all test drivers)
3.1.1.7 Social Influence
Social Influence is defined as the degree to which an individual perceives that important others believe he or she should use the new system (Venkatesh, Morris et al. 2003). Social influence has an impact on individual behaviour through three mechanisms: compliance, internalization, and identification (Warshaw 1980; Venkatesh and Davis 2000). While the latter two relate to altering an individual’s belief structure and/or causing an individual to respond to potential social status gains, the compliance mechanism causes and individual to simply alter his or her intention in response to the social pressure – i.e., the individual intends to comply with the social influence.
Theory suggests that woman tend to be more sensitive to others’ opinions and therefore find social influence to be more salient when forming an intention to use new technology (Miller 1976; Venkatesh, Morris et al. 2000), with the effect declining with experience (Venkatesh and Morris 2000). As in the case of performance and effort expectancies, gender effects may be driven by psychological phenomena embodied within socially-constructed gender roles (Lubinski, Tellegen et al. 1983). Rhodes’ (Rhodes 1983) meta-analytic review of age effects concluded that affiliation needs increases with age, suggesting that older people are more likely to place increased salience on social influences, with the effect declining with experience.
----- pre questionnaire ----- post questionnaire
Strongly disagree Strongly agree

COOPERS integrated project
D15 - IR 7100/7200/7300/7400 Report on common result assessment
Page 35 of 191
���+)��5.���-)��� ���/
0�.�"������.��1�.������.��)����������7"�.� )�
��-���������/����
���+)��5.�������+���������
����.��1��.�����.��)��������
��7"�.� )���-��������
�/����
Related questions in the COOPERS User Acceptance Questionnaire:
Social Influence: B 8.1., B 8.2., in the “before system use questionnaire”, respectively A 15.1., A 15.2.. in the “after system use questionnaire”.
As Figure 7 illustrates, questions concerning the social influence are ranked in the middle/ more negative field. The results of the pre- and post questionnaire are very similar.
Figure 7: Social influence (all test drivers)
3.1.1.8 Facilitating Conditions
Facilitating conditions are defined as the degree to which an individual believes that an organizational and technical infrastructure exists to support use of the system. Organizational psychologists have noted that older workers attach more importance t receiving help and assistance on the job. This is further underscored in the context of complex IT use given the increasing cognitive and physical limitations associated with age (Venkatesh, Morris et al. 2003). These arguments are in line with empirical evidence from Morris and Venkatesh (Morris and Venkatesh 2000). Thus, when moderated with age, facilitating conditions will have a significant influence on usage behaviour.
Related questions in the COOPERS User Acceptance Questionnaire:
Facilitating Conditions: B 9.1., B 9.2. B 9.3., B 9.4. in the “before system use questionnaire”, respectively A 16.1., A 16.2., A 16.3., A 16.4. in the “after system use questionnaire”.
----- pre-questionnaire ----- post questionnaire
Strongly disagree Strongly agree

COOPERS integrated project
D15 - IR 7100/7200/7300/7400 Report on common result assessment
Page 36 of 191
Figure 8 illustrates that test drivers were of the opinion to have the necessary resources and knowledge to use the COOPERS system. This is confirmed due to the positive ranking in the pre- and post questionnaire. Concerning the compatibility with other systems used test drivers have concerns. After using the COOPERS system test drivers stated that the COOPERS system is not compatible with other system.
���*+� �����.�"���.�������� ����� �����/��������.���/����
���*+� �����.�"���.��1��5)������� �����/��������.���/����
���*+� ���.���/������������ ��+���0)��5��.��.����/�����������
���*+� �����+� �-� �+������8�������+9�5�))�0��"��)�0)��-����������� ��5��.��/����
��--� �)����
Figure 8: Facilitating Conditions (all test drivers)
3.1.1.9 Self-Efficacy/Anxiety
Previous research (Venkatesh 2000) has shown self-efficacy and anxiety to be conceptually and empirically distinct from effort expectancy. Self-efficacy and anxiety have been modeled as indirect determinants of intention fully mediated by performance expectancy (Venkatesh 2000). Consistent with this Venkatesh et al. (Venkatesh, Morris et al. 2003) found that self-efficacy and anxiety appear to be significant determinants of intention -i.e., without controlling for the effect of effort expectancy. Therefore it is to be expected that self-efficacy and anxiety behave similarly, that is. to be distinct from effort expectancy and to have no direct effect on intention above and beyond effort expectancy.
Related questions in the COOPERS User Acceptance Questionnaire:
----- pre-questionnaire ----- post questionnaire
Strongly disagree Strongly agree
COOPERS integrated project
D15 - IR 7100/7200/7300/7400 Report on common result assessment
Page 37 of 191
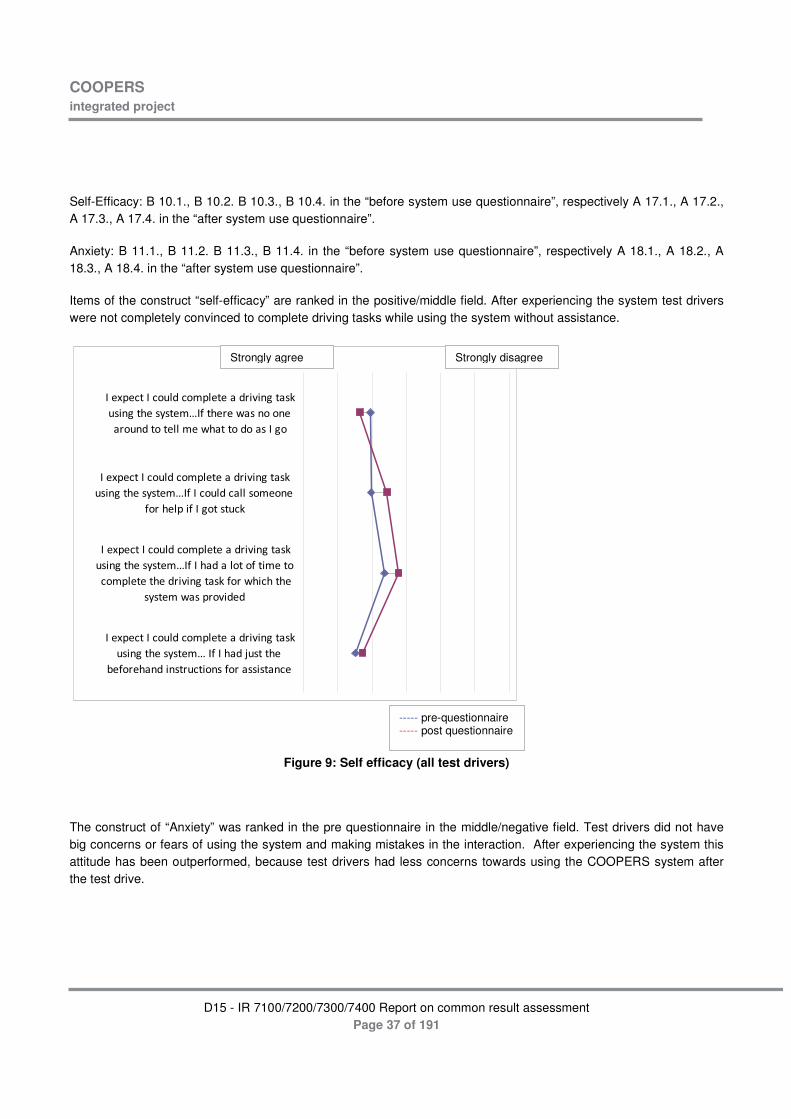
Self-Efficacy: B 10.1., B 10.2. B 10.3., B 10.4. in the “before system use questionnaire”, respectively A 17.1., A 17.2., A 17.3., A 17.4. in the “after system use questionnaire”.
Anxiety: B 11.1., B 11.2. B 11.3., B 11.4. in the “before system use questionnaire”, respectively A 18.1., A 18.2., A 18.3., A 18.4. in the “after system use questionnaire”.
Items of the construct “self-efficacy” are ranked in the positive/middle field. After experiencing the system test drivers were not completely convinced to complete driving tasks while using the system without assistance.
���*+� ���� ��)�� ��+)���������"�������1�������.���/����:�-��.����5���������������������))����5.����������������
���*+� ���� ��)�� ��+)���������"�������1�������.���/����:�-��� ��)�� �))��������
-���.�)+��-���������� 1
���*+� ���� ��)�� ��+)���������"�������1�������.���/����:�-���.�����)����-�������� ��+)�����.�����"�������1�-���5.� .��.�
�/�����5���+��"����
���*+� ���� ��)�� ��+)���������"�������1�������.���/����:��-���.���6�����.�
0�-���.���������� ������-����������� �
Figure 9: Self efficacy (all test drivers)
The construct of “Anxiety” was ranked in the pre questionnaire in the middle/negative field. Test drivers did not have big concerns or fears of using the system and making mistakes in the interaction. After experiencing the system this attitude has been outperformed, because test drivers had less concerns towards using the COOPERS system after the test drive.
----- pre-questionnaire ----- post questionnaire
Strongly disagree Strongly agree

COOPERS integrated project
D15 - IR 7100/7200/7300/7400 Report on common result assessment
Page 38 of 191
3���������� ����� ��))/��"��)�0)��������������������.���/���������.����*���
����.3���������� ����� ��))/��"��)�0)�����+���� ����5��)�������.���/���������.��
��*��%�����.3���������� ����� ��))/��"��)�0)�����+)�����������.���/���������.����*����
����.
��5��)���� ��������/�-���������������.���/����
��5��)��0�/��.���/�����5.��� ����� ��))/��"��)�0)�
�-���.������/�������5��)��������
�-���.����.���/�������5��)����6�����/����"������/)������.���� ��������������-�
�. �
1 2 3 4 5 6 7
12
34
56
7
��-��)��++��.����"���0�����������.���/����
���� ������������.��1��.����� ��)��)������)���-���-����������������.���/����������5����
5�/
��.����������������.���/�����-���-�����-��1���������1����� ������ ���� �
���*+� ���.���/��������0������5.��������������������
Figure 10: Anxiety (all test drivers)
3.1.1.10 Behavioural Intention
Consistent with the underlying theory for all of the intention models discussed, it is to expect that behavioural intention will have a significant positive influence on technology usage.
Related questions in the COOPERS User Acceptance Questionnaire:
Behavioural Intention: B 12.1., B 12.2. B 12.3., B 12.4. , B 12.5, B 12.6, B 12.7. in the “before system use questionnaire”, respectively A 19.1., A 19.2., A 19.3., A 19.4., A 19.5., A 19.6., A 19.7. the “after system use questionnaire”.
The ranking of questions concerning the behavioral intention to use or buy the COOPERS system shows, that test drivers would use the system if they had
----- pre-questionnaire ----- post questionnaire
Strongly disagree Strongly agree
Strongly a

COOPERS integrated project
D15 - IR 7100/7200/7300/7400 Report on common result assessment
Page 39 of 191
one and would recommend the system to friends, but hesitate to buy the system. Test drivers also would adjust the driving style to the recommendations to the system.
Figure 11: Behavioural Intention (all test drivers)
3.1.1.11 Perceived Enjoyment
This concept is defined as the extent to which the activity of using the computer is perceived to be enjoyable in its own right, apart from any performance consequences that may be anticipated (Davis, Bagozzi et al. 1992).
For mobile technologies, Perceived Enjoyment is an intrinsic belief that is likely to maximize use of the device for users that expect immersing and playful interactions with the device. This suggests that unique features or components that increase playfulness will generate positive feelings that motivate usage behaviour (Wakefield and Dwayne 2006). Furthermore, the marketing or positioning of a mobile device may have implications for its frequency of use. For example, promoting a device as purely utilitarian is likely to hinder use of the device for users that are more playful toward technology; whereas positioning the device as fun and enjoyable to use may maximize use. The generation of positive affect may be crucial to optimize the acceptance and use of predominantly functional mobile devices (Wakefield and Dwayne 2006).
Related questions in the COOPERS User Acceptance Questionnaire:
Perceived Enjoyment: B 14.1., B 14.2. B 14.3., B 14.4., B 14.5. in the “before system use questionnaire”, respectively A 22.1., A 22.2., A 22.3., A 22.4., A 22.5. in the “after system use questionnaire”.

COOPERS integrated project
D15 - IR 7100/7200/7300/7400 Report on common result assessment
Page 40 of 191
The ranking of the pre-questionnaire and the post-questionnaire shows a very similar result. The attitude towards the system is ranked in the middle field.
Figure 12: Perceived Enjoyment (all test drivers)
3.1.1.12 Confirmation
When consumers consider buying a product, they utilize prior purchasing experiences or external information to form internal standards of comparison, which are used in forming their expectations (Olson and Dover 1979). Expectation is conceptualized as the aggregation of individual belief elements in a consumer’s cognitive structure (Olson and Dover 1979), and is a precursor in predicting a variety of phenomena involved in buying behaviours and subsequent perceptions (McKinney, Yoon et al. 2002).
Disconfirmation is defined as consumer subjective judgments resulting from comparing their expectations and their perceptions of performance received (McKinney, Yoon et al. 2002). This definition is similar to the concept of expectation congruency suggested by Spreng et al. (Spreng, MacKenzie et al. 1996). Specifically, once consumers form their expectations, they compare their perceptions of product performance (based on their purchasing experience) to the pre-established levels of expectation. Disconfirmation occurs when consumer evaluations of product performance are different from their pre-trial expectations about the product (Olson and Dover 1979).
The constructs of expectation/confirmation are only measured in the “after system use questionnaire”. Ex post expectation is especially important for products or services where expectation may change with time, as is often the case with IS use (Bhattacherjee 2001).
Related questions in the COOPERS User Acceptance Questionnaire:
Disgusting
Dull
Unpleasant
Not fun
Enjoyable
Exciting
Pleasant
Fun
----- pre-questionnaire ----- post questionnaire

COOPERS integrated project
D15 - IR 7100/7200/7300/7400 Report on common result assessment
Page 41 of 191
/��*+����� �5��.��.���/����5���0�������.����
�*+� ���
;.�����"� ��)�"�)+��"�����0/��.�
�/�����5���0������.������*+� ���
�"���))��������-�/��*+� �������-�����.���/����5���� ��-�����
Expectation Confirmation: A 21.1., A 21.2., A 21.3. in the “after system use questionnaire”.
The confirmation result shows that test drivers perceive the COOPERS system and the services provided as better than expected. Almost all expectation related to the COOPERS system have been confirmed.
Figure 13: Confirmation (all test drivers)
3.1.1.13 Overall Satisfaction
Based on Mc Kinney et al. (McKinney, Yoon et al. 2002) we define overall satisfaction as an affective state representing an emotional reaction to the entire system use experience. This definition focuses on the process evaluation associated with the purchase behaviour as opposed to the outcome-oriented approach, which emphasizes the buyer’s cognitive state resulting from the consumption experience.
Related questions in the COOPERS User Acceptance Questionnaire:
Satisfaction: A 23.1., A 23.2., A 23.3., A 23.4., A 23.5., A 23.6. in the “after system use questionnaire”.
The ranking of all items illustrates that test drivers neither tend to the positive nor to the negative side of the ranking. All items are ranked in the middle field.
disagree

COOPERS integrated project
D15 - IR 7100/7200/7300/7400 Report on common result assessment
Page 42 of 191
"��/���������-����7�"��/������-���
"��/����+)������7�"��/�+)�����
-����������7� ��������
�����0)��7���)��.���
��"����� ��������������/�-������7���-�����)/�� ��������������/�-������
��"����������������7���-�����)/�������������
Figure 14: Overall satisfaction (all
test drivers)
3.1.1.14 Willingness to Pay
Test drivers also have been asked in the post questionnaire regarding to their willingness to pay. Concerning the willingness to pay test drivers have been confronted with several options. Test participants could choose between investing once, a monthly payment or not buying the system at all. Most of the drivers decided for investing ones when buying the system. Two smaller groups would chose a monthly payment or not buying the system at all. The x-axis shows the payment options and the y-axis the number of test drivers.
Strongly disagree Strongly agree

COOPERS integrated project
D15 - IR 7100/7200/7300/7400 Report on common result assessment
Page 43 of 191
Figure 15: Willingness to pay (all test drivers)
When it comes to the price that test drivers would pay one time, prices rank between € 0-250 and € 251-500. Some test drivers would pay higher prices as Figure 16 illustrates. The x-axis shows the different price options and the y-axis the number of participants.
&�
%&%�&��&���&��
Figure 16: Price for investing once (all test drivers)
When it comes to a payment on a monthly basis most of the test drivers would prefer a price up to 30€. The x-axis shows again the different price options and the y-axis the number of participants.

COOPERS integrated project
D15 - IR 7100/7200/7300/7400 Report on common result assessment
Page 44 of 191
&
%
�
�
�
< &7%& < %%7& < %7�& < �%7�& < �%7�& < �%7& =�< %
Figure 17: Payment monthly basis (all test drivers)
3.1.1.15 Service Preference
Test drivers have been also asked to rank the single services/messages according to their individual importance. Therefore participants had to allocate 10 points to the COOPERS services (i.e. 10 points to 1 service, 5 points to 2 services, 3 points to 3 services and 1 point to 1 service, etc.). Figure 18 illustrates the average points (y-axis) participants allocated to the services and shows that the safety related service accident/ incident warning, congestion warning and roadwork information are considered as the most important service. The services weather condition warning, lane utilisation information and in-vehicle speed limit have been as well perceived important. Due to the fact that safety and convenience has been considered as important COOPERS bonus it is not completely clear, whether this services have been ranked important because of the effect on safety or because of the convenience aspect. But due to the fact, that test drivers considered the estimated travel time as less important, it is possible that the safety aspect has been the main driver.

COOPERS integrated project
D15 - IR 7100/7200/7300/7400 Report on common result assessment
Page 45 of 191
0
0,5
1
1,5
2
2,5
Acciden
t/incid
ent w
arnin
g
Traffic
cong
estion
warn
ing
Roadwor
k info
rmat
ion
Weath
er co
nditio
n war
ning
Lane
utili
satio
n info
rmat
ion
In-v
ehicl
e var
. spe
ed lim
it inf.
Estim
ated jo
urney
time
Recom
men
ded ne
xt lin
k
Figure 18: Ranking of services (all test drivers)
3.1.1.16 Results of the open questions
The post questionnaire included as well open questions that test drivers were asked to answer. The following section summarises these answers.
A1: What surprised you most when driving with the system?
Answers regarding this question varied between the different test sites. Whereas especially the Austrian and Italian test drivers pointed out positive aspects, test drivers from Berlin showed a more critical attitude. Test drivers were especially surprised about the level of detail, the preciseness and the timing of the messages. Participants stated that they were surprised about the possibility to show such detailed information (i.e distance to event) and also pointed out that the messages were clear and easy to understand and the system in general easy to use. As well surprising was the large display and that signs were readable. Test drivers from Italy were especially surprised about the consistency of information on VMS and on the COOPERS system and that the system is not intrusive and does not influence the driving behaviour. Negative aspects regarding the system were the distraction caused by the system, messages that were not conform with the real traffic situation, the mass of information, the lack of sound and missing recommendations by the system.
A2: What did not work (negative experience)?
Test drivers especially considered the test equipment as negative. Especially the equipment of physiological measuring (i.e. ear clip and cap) and the large size and position of the COOPERS display was perceived as

COOPERS integrated project
D15 - IR 7100/7200/7300/7400 Report on common result assessment
Page 46 of 191
disturbing. As well especially perceived negative was the fact that messages did not go conform with the real traffic situation (weather message “rain” while sun was shining, obsolete road work information), the lack of sound, the small size of letters, and that the street displayed on the HMI was to fine. Especially test drivers from Berlin stated that the mass of information and the fact that the same messages were displayed several times was disturbing and irritating.
A3: What was working best (positive experience)
In general the Coopers system has been perceived positive, due to several aspects. Especially positive was considered that the information and messages have been clear and well described and icons easy to understand. The Interface and the graphic design were rated as well positive. Warnings came in timely and were presented precisely. Services preferred were the wrong way driver warning, the roadwork information (including lane access), the congestion warning, the weather condition warning and the variable speed limit. It has been also pointed out that the system offers an additional safety effect and allows driving as usual.
A4: What could be improved?
Test drivers stated, that some improvements can be made related to the HMI (richness in contrast) and display of messages. In detail: text messages should be written larger or shorter, same messages or too much information should be avoided or better arranged and services should be in general accompanied by a sound or a voice. In addition messages should be coloured according to priority. Some interviewees also stated that the display should be smaller or placed somewhere else not to limit the field of view.
A5: Are there any features not needed?
Some test drivers stated that the mass of information should be limited or at least better priorised. The speed limit could be completely excluded and the weather condition warning should be shown earlier and not shortly before passing the affected stretch. In general test drivers reacted positive on the features given and would not change a lot. The map is considered as less important and could be switched off optionally.
A6: Are there any features missing?
Participant stated that an acoustical signal or vocal recommendations are necessary. Additional features that should be given are recommendations on different routes in case of congestion, weather condition warning, etc., information on the distance to the vehicle ahead, the driving direction, information on service or gas stations, the temperature and a signal if speed limit is exceeded.
A7: How did the design of the graphical (acoustic) interface meet/not meet your expectations?
The graphical design has been perceived ok, but ordinary. The display was perceived again too large and a sound or acoustical support is considered necessary.
Thus the display is divided into two halfs (map/ messages) the map half could be enlarged in case of no messages, because otherwise this half is displayed grey. In addition more colour and a richer contrast could be used. Some test drivers would also prefer an optional zoom.

COOPERS integrated project
D15 - IR 7100/7200/7300/7400 Report on common result assessment
Page 47 of 191
A8: How did the design in general meet/meet not your expectations?
The majority of test drivers perceived the design in general positive, but some participants stated that the design is boring, to less colourful and that it should be richer in contrast. Messages displayed were perceived clear and understandable, but text messages should be written in larger letters. The display was considered too large and limited the field of view and should be therefore smaller or placed somewhere else.
A9: How did the messages displayed meet/meet not your expectations?
Messages displayed were rated in general positive. Changes should be made in the number of messages through a clearer priorisation or limitation to the most important services. Text messages should be shortened otherwise some participants would perceive the COOPERS system as distractive while driving.
A10: How did the performance of the system meet/not meet your expectations?
Test drivers perceived the performance of the COOPERS system very positive. The messages were provided timely and clear enough. COOPERS is considered as s supportive system for taking decisions in traffic. Negative aspects have been the contrast of the display, the inconsistencies between messages on VMS and the COOPERS System, missing recommendations on driving behaviour and the lack of sound.
A11: Is the information given too much while driving?
The majority of test drivers rated the given level of information as positive. However some test drivers wished less information because of distraction aspects. Especially in Berlin, were the density of traffic was very high, test drivers stated that messages became irrelevant if shown several times. However other test drivers would prefer more information. The various different preferences of test drivers can be overcome through a possible individual configuration.
3.1.2 Results Test site Innsbruck
The following section gives an overview on the results of the test drives in Innsbruck. The sample of test participants involved 48 test drivers. After describing the sample more detailed results regarding the different categories concerning user acceptance are given.
3.1.2.1 Age
Five age groups have been tested (up to 29; 30-44; 45-59; 60-69; 70+). The group of 23-44 year old people comprised 18 participants and was therefore the largest group. The second largest group with 14 participants was build by the group of 45-59 year old test drivers. Besides that majority of test drivers between 30 and 59 years old the user acceptance sample considered as well the group of younger and older drivers. The x-axis shows the age of participants, the y-axis the number of participants per age group.

COOPERS integrated project
D15 - IR 7100/7200/7300/7400 Report on common result assessment
Page 48 of 191
Figure 19: Number of test drivers in age groups (Innsbruck)
3.1.2.2 Gender
The sample tested in Innsbruck comprised the following gender distribution. One half of test drivers were male (24 test drivers) the other half female (24 test drivers). The x-axis shows the gender of participants, the y-axis the number of participants per gender group.
Figure 20: Number of female and male drivers (Innsbruck)
3.1.2.3 Perceived Usefulness/Performance Expectancy
The following figure illustrates that the test person had very positive expectations towards the COOPERS system already before they actually experienced it. The figure shows as well, that the actual COOPERS system experience

COOPERS integrated project
D15 - IR 7100/7200/7300/7400 Report on common result assessment
Page 49 of 191
outperformed the test driver’s expectations: in average they found with the system they have improved information about the traffic situation, that they can better conform to traffic rules when using the COOPERS system and that the system enhances the drivers safety. In case of the question “using the system I can move from A to B more quickly” and “using the system enables me to accomplish driving tasks more quickly” the system did not outdo the test driver's expectations.
���*+� �,-������.���/��������-�)�����������"���
���*+� �,-������������.���/��������0)���������� ��+)��.����"�������1�������2�� 1)/
���*+� �,-������������.���/������� ��������/����"������-��/
���*+� �,-������������.���/���������� �������/� .�� ����-�+)��������/����"����������--� ����)/
���*+� �,-������������.���/������� �����"��-����3����4������2�� 1)/
���*+� �,-������������.���/������� ���0������ ��-����������--� ���)��
���*+� �,-������������.���/�������5�))���6�/���+��"������"���� ��"����� �
���*+� �,-������������.���/�������.�"����+��"�����-����������0��������� ���������
Figure 21: Perceived usefulness (Innsbruck)
3.1.2.4 Perceived Ease of Use/Effort Expectancy
The figure shows that every single question that was asked in connection with how easy the system is perceived was already connected to quite high expectations of the users. In average, the test persons stated that they strongly agree that the interaction with the system was clear and understandable and that they find the system easy to use.
----- pre-questionnaire ----- post questionnaire
Strongly disagree Strongly agree

COOPERS integrated project
D15 - IR 7100/7200/7300/7400 Report on common result assessment
Page 50 of 191
���*+� �,-������/������� �����5��.��.���/�����5�))�0�� )�������������������0)�
���*+� �,-��������5�))�0�����/�-���������0� �����1�)-�)�������������������.��
�/����
���*+� �,-�������5�))�-�����.���/��������/�������
���*+� �,-������.������������.��� ��������0������)/� ��+��.����0)�
���*+� �,-������.������������.��� ��������0������)/������0)�
Figure 22: Perceived ease of use (Innsbruck)
3.1.2.5 Attitude
This figure shows again, that even before experiencing the system expectations towards the COOPERS system were high. These expectations have been confirmed by using the system. In average test drivers found that the system makes driving more interesting and that they liked to drive with the system.
----- pre-questionnaire ----- post questionnaire
Strongly disagree Strongly agree

COOPERS integrated project
D15 - IR 7100/7200/7300/7400 Report on common result assessment
Page 51 of 191
���*+� �,-������.���/�������1������"��������������������
���*+� �,-��������"����5��.��.���/�����5�))�0��-��
���*+� �,-��������)�1�����"����5��.��.���/����
Figure 23: Attitude towards using the system (Innsbruck)
3.1.2.6 Behavioural Intention
The ranking of questions concerning the behavioral intention to use or buy the COOPERS system shows that test drivers would use the system if they had one and would recommend the system to friends. However test drivers still hesitate to buy the system.
----- pre-questionnaire ----- post questionnaire
Strongly disagree Strongly agree
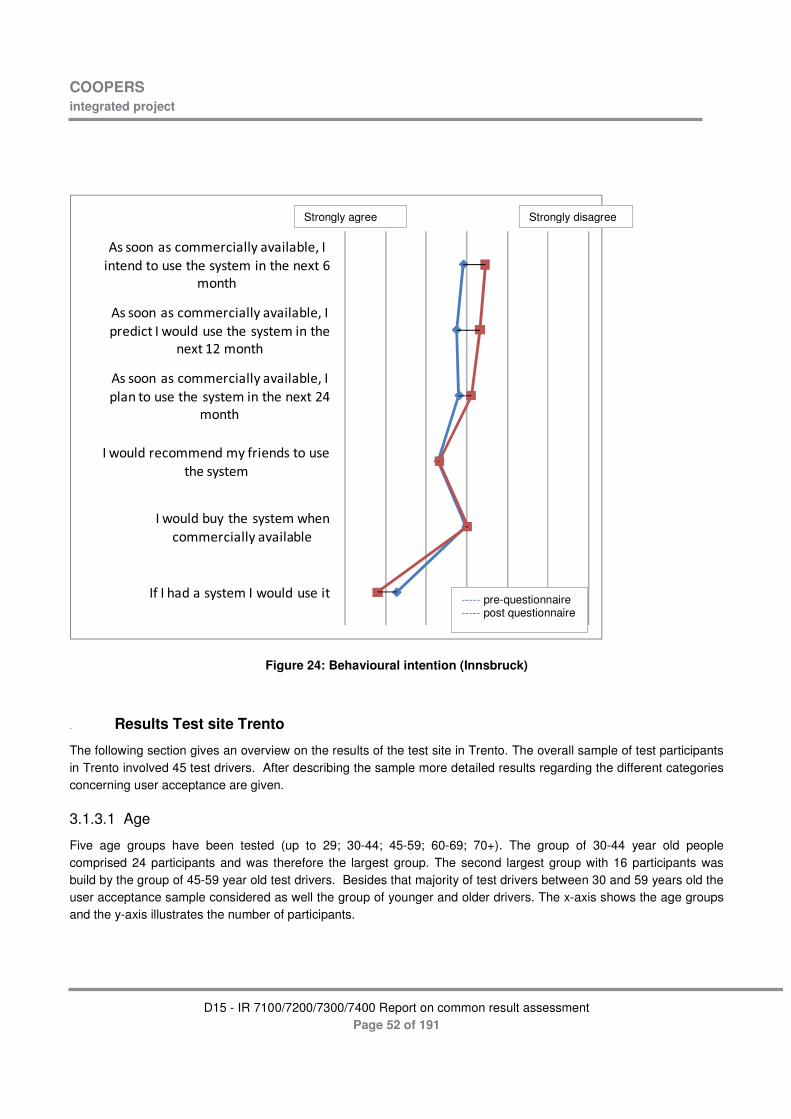
COOPERS integrated project
D15 - IR 7100/7200/7300/7400 Report on common result assessment
Page 52 of 191
3���������� ����� ��))/��"��)�0)��������������������.���/���������.����*���
����.
3���������� ����� ��))/��"��)�0)�����+���� ����5��)�������.���/���������.��
��*��%�����.
3���������� ����� ��))/��"��)�0)�����+)�����������.���/���������.����*����
����.
��5��)���� ��������/�-���������������.���/����
��5��)��0�/��.���/�����5.��� ����� ��))/��"��)�0)�
�-���.������/�������5��)��������
Figure 24: Behavioural intention (Innsbruck)
3.1.3 Results Test site Trento
The following section gives an overview on the results of the test site in Trento. The overall sample of test participants in Trento involved 45 test drivers. After describing the sample more detailed results regarding the different categories concerning user acceptance are given.
3.1.3.1 Age
Five age groups have been tested (up to 29; 30-44; 45-59; 60-69; 70+). The group of 30-44 year old people comprised 24 participants and was therefore the largest group. The second largest group with 16 participants was build by the group of 45-59 year old test drivers. Besides that majority of test drivers between 30 and 59 years old the user acceptance sample considered as well the group of younger and older drivers. The x-axis shows the age groups and the y-axis illustrates the number of participants.
----- pre-questionnaire ----- post questionnaire
Strongly disagree Strongly agree

COOPERS integrated project
D15 - IR 7100/7200/7300/7400 Report on common result assessment
Page 53 of 191
Figure 25: Number of test drivers in age groups (Trento)
3.1.3.2 Gender
Regarding the gender, about two third of test drivers were male (32 test drivers) and about one third female (13 Test drivers). Although less women were participating at the tests in Trento the user acceptance testing involved female test drivers of all age groups. The x-axis shows the gender groups and the y-axis illustrates the number of participants.
Figure 26: Number of female and male drivers (Trento)

COOPERS integrated project
D15 - IR 7100/7200/7300/7400 Report on common result assessment
Page 54 of 191
3.1.3.3 Perceived Usefulness/Performance Expectancy
The following figure illustrates that the test person had very positive expectations towards the COOPERS system already before they actually experienced it. The figure shows as well, that the actual COOPERS system experience outperformed some of the test driver’s expectations: in average they found with the system they have improved information about the traffic situation, that they can better conform to traffic rules when using the COOPERS system and that the system enhances the drivers convenience. In case of the question “using the system I can move from A to B more quickly”, “using the system enables me to accomplish driving tasks more quickly” and “using the system increases my driving safety” the system did not outdo the test driver's expectations.
���*+� �,-������.���/��������-�)�����������"���
���*+� �,-������������.���/��������0)���������� ��+)��.����"�������1�������2�� 1)/
���*+� �,-������������.���/������� ��������/����"������-��/
���*+� �,-������������.���/���������� �������/� .�� ����-�+)��������/����"����������--� ����)/
���*+� �,-������������.���/������� �����"��-����3����4������2�� 1)/
���*+� �,-������������.���/������� ���0������ ��-����������--� ���)��
���*+� �,-������������.���/�������5�))���6�/���+��"������"���� ��"����� �
���*+� �,-������������.���/�������.�"����+��"�����-����������0��������� ���������
Figure 27: Perceived usefulness (Trento)
3.1.3.4 Perceived Ease of Use/Effort Expectancy
The figure shows that every single question that was asked in connection with how easy the system is perceived was already connected to quite high expectations of the users. In average, the test persons stated after experiencing the COOPERS system that they strongly agree that the interaction with the system was clear and understandable and that they find the system easy to use.
----- pre-questionnaire ----- post questionnaire
Strongly disagree Strongly agree

COOPERS integrated project
D15 - IR 7100/7200/7300/7400 Report on common result assessment
Page 55 of 191
���*+� �,-������/������� �����5��.��.���/�����5�))�0�� )�������������������0)�
���*+� �,-��������5�))�0�����/�-���������0� �����1�)-�)�������������������.��
�/����
���*+� �,-�������5�))�-�����.���/��������/�������
���*+� �,-������.������������.��� ��������0������)/� ��+��.����0)�
���*+� �,-������.������������.��� ��������0������)/������0)�
Figure 28: Perceived Ease of use (Trento)
3.1.3.5 Attitude
This figure shows again, that even before experiencing the system expectations towards the COOPERS system were high. These expectations have been confirmed by using the system. In average test drivers found that the system makes driving more interesting and that they liked to drive with the system.
���*+� �,-������.���/�������1������"��������������������
���*+� �,-��������"����5��.��.���/�����5�))�0��-��
���*+� �,-��������)�1�����"����5��.��.���/����
----- pre-questionnaire ----- post questionnaire
Strongly disagree Strongly agree
----- pre-questionnaire ----- post questionnaire
Strongly disagree Strongly agree

COOPERS integrated project
D15 - IR 7100/7200/7300/7400 Report on common result assessment
Page 56 of 191
Figure 29: Attitude towards using the system (Trento)
3.1.3.6 Behavioural Intention
The ranking of questions concerning the behavioral intention to use or buy the COOPERS system shows, that test drivers would use the system if they had one and would recommend the system to friends, but hesitate to buy the system.
3���������� ����� ��))/��"��)�0)��������������������.���/���������.����*���
����.
3���������� ����� ��))/��"��)�0)�����+���� ����5��)�������.���/���������.��
��*��%�����.
3���������� ����� ��))/��"��)�0)�����+)�����������.���/���������.����*����
����.
��5��)���� ��������/�-���������������.���/����
��5��)��0�/��.���/�����5.��� ����� ��))/��"��)�0)�
�-���.������/�������5��)��������
Figure 30: Behavioural Intention (Trento)
3.1.4 Results Test site Berlin
The following section gives an overview on the overall results of the test site in Berlin. The sample of test participants involved 40 test drivers. After describing the sample more detailed results regarding the different categories concerning user acceptance are presented.
----- pre-questionnaire ----- post questionnaire
Strongly disagree Strongly agree

COOPERS integrated project
D15 - IR 7100/7200/7300/7400 Report on common result assessment
Page 57 of 191
3.1.4.1 Age
Five age groups have been tested (up to 29; 30-44; 45-59; 60-69; 70+). The group of up to 29 year old and the group of 30-44 year old people and comprised both 16 participants and were therefore the largest groups. The group of 45-59 year old test drivers comprised 6 participants. Besides that majority of test drivers up to 44 years old the user acceptance sample considered as well the group of older drivers.
Figure 31: Number of test drivers in age groups (Berlin)
3.1.4.2 Gender
Regarding the gender, about three quarters of test drivers were male (32 test drivers) and about one quarter female (8 test drivers). Although less women were participating at the tests in Berlin the user acceptance testing involved female test drivers of all age groups.

COOPERS integrated project
D15 - IR 7100/7200/7300/7400 Report on common result assessment
Page 58 of 191
�
Figure 32: Number of female and male drivers (Berlin)
3.1.4.3 Perceived Usefulness/Performance Expectancy
The following figure illustrates that the test person had very positive expectations towards the COOPERS system already before they actually experienced it. But the figure shows as well, that the actual COOPERS system experience did not outperformed the test driver’s expectations: in average all items have been ranked less positive in the post-questionnaire. Compared to the ranking in Trento and Innsbruck, this negative rating is possibly connected to the high traffic density on the test site and to the fact that same services have been displayed several times. Positive can be seen, that test drivers in Berlin still found, that with the system they can better conform to traffic rules and that they have improved information about the road condition.
���*+� �,-������.���/��������-�)�����������"���
���*+� �,-������������.���/��������0)���������� ��+)��.����"�������1�������2�� 1)/
���*+� �,-������������.���/������� ��������/����"������-��/
���*+� �,-������������.���/���������� �������/� .�� ����-�+)��������/����"����������--� ����)/
���*+� �,-������������.���/������� �����"��-����3����4������2�� 1)/
���*+� �,-������������.���/������� ���0������ ��-����������--� ���)��
���*+� �,-������������.���/�������5�))���6�/���+��"������"���� ��"����� �
���*+� �,-������������.���/�������.�"����+��"�����-����������0��������� ���������
Figure 33: Perceived Usefulness (Berlin)
----- pre-questionnaire ----- post questionnaire
Strongly disagree Strongly agree

COOPERS integrated project
D15 - IR 7100/7200/7300/7400 Report on common result assessment
Page 59 of 191
3.1.4.4 Perceived Ease of Use/Effort Expectancy
The figure shows that every single question that was asked in connection with how easy the system is perceived was already connected to quite high expectations of the users. The ranking of the post questionnaire showed a similar picture. However every single item has been ranked less positive than in the pre questionnaire. Compared to the ranking in Trento and Innsbruck, this more negative rating is possibly connected to the high traffic density on the test site and to the fact that same services have been displayed several times. Concluding it can be mentioned, that test drivers still found the COOPERS system clear and understandable and easy to use.
���*+� �,-������/������� �����5��.��.���/�����5�))�0�� )�������������������0)�
���*+� �,-��������5�))�0�����/�-���������0� �����1�)-�)�������������������.��
�/����
���*+� �,-�������5�))�-�����.���/��������/�������
���*+� �,-������.������������.��� ��������0������)/� ��+��.����0)�
���*+� �,-������.������������.��� ��������0������)/������0)�
Figure 34: Perceived ease of use (Berlin)
3.1.4.5 Attitude
This figure shows that before experiencing the system expectations towards the COOPERS system were ranked in the middle field. These expectations have been not confirmed by using the system. In average test drivers found that the system makes driving less interesting, that they less liked to drive with the system and that driving with the system is less fun. Compared to the ranking in Trento and Innsbruck, this negative rating is possibly connected to the high traffic density on the test site and to the fact that same services have been displayed several times.
----- pre-questionnaire ----- post questionnaire
Strongly disagree Strongly agree

COOPERS integrated project
D15 - IR 7100/7200/7300/7400 Report on common result assessment
Page 60 of 191
���*+� �,-������.���/�������1������"��������������������
���*+� �,-��������"����5��.��.���/�����5�))�0��-��
���*+� �,-��������)�1�����"����5��.��.���/����
Figure 35: Attitude towards using the system (Berlin)
3.1.4.6 Behavioural Intention
The ranking of questions concerning the behavioral intention to use or buy the COOPERS system shows that test drivers rated the system less positive in the post questionnaire. In average every single item has been ranked less positive. Compared to the ranking in Trento and Innsbruck, this negative rating is possibly connected to the high traffic density on the test site and to the fact that same services have been displayed several times. Test drivers would not recommend the system to friends and would not buy the system.
----- pre-questionnaire ----- post questionnaire
Strongly disagree Strongly agree

COOPERS integrated project
D15 - IR 7100/7200/7300/7400 Report on common result assessment
Page 61 of 191
3���������� ����� ��))/��"��)�0)��������������������.���/���������.����*���
����.
3���������� ����� ��))/��"��)�0)�����+���� ����5��)�������.���/���������.��
��*��%�����.
3���������� ����� ��))/��"��)�0)�����+)�����������.���/���������.����*����
����.
��5��)���� ��������/�-���������������.���/����
��5��)��0�/��.���/�����5.��� ����� ��))/��"��)�0)�
�-���.������/�������5��)��������
Figure 36: Behavioural Intention (Berlin)
3.2 In-depth interviews
In addition to the questionnaires inquiry interviews with test drivers from Germany, Austria and Italy have been conducted. Due to the fact that in a personal conversation aspects can be discussed in more detail and additional information can be gained, interviews have been considered as adequate method to complement the questionnaire approach. A group of 25 test drivers has been interviewed. Two thirds of the interviewees were male, one third female. Regarding the age distribution the majority of interview partners were between 20 and 49. The following section gives an overview on the different aspects discussed within these interviews.
Street coverage
All interviewees stated that they prefer one solution with a full coverage including urban streets and rural roads. The coverage of rural roads is especially of importance in case of congestions and weather condition warning when another route is needed for continuing the trip. Urban streets are of interest when it comes to the choice of optimal route during different day times. Precondition for the additional coverage of urban and rural roads is the data quality, to avoid time losses because of wrong information. Information about rerouting options should include the estimated journey time information on real time basis.
----- pre-questionnaire ----- post questionnaire
Strongly disagree Strongly agree

COOPERS integrated project
D15 - IR 7100/7200/7300/7400 Report on common result assessment
Page 62 of 191
Advantages of COOPERS
COOPERS is considered as a useful driver supporting system that offers navigational aspects as well as a safety enhancing warning function. Especially considered positive is the early information about incidents on the stretch ahead and the offered amount and level of detail of information. Current information systems like VMS have to be passed to know what is happening on the stretch ahead. COOPERS offers information as soon as an event is happening. Additionally positive rated was the fact that information is longer available on the display and cannot be overlooked as easy as installed traffic signs or VMS. Further the display showing how many meters are left to the event is considered as an advantage that supports the driver in taking decisions according to the time left.
The combination of early safety related information with navigational rerouting functions and the estimated journey time services has been rated advantageous over existing navigation systems or traffic information via radio. It supports in route planning and gives early and precise information about events that the driver has to expect.
Advantages/disadvantages of COOPERS over Variable message signs (VMS)
Comparing the two systems opinion of test drivers vary. The majority considers COOPERS as advantageous, because of the earlier and more detailed information, offered without passing a VMS. However some test drivers stated that the COOPERS System is disturbing, especially in high traffic conditions and VMS can be better perceived while concentrating on driving. This opinion based especially on new COOPERS icons and the offered text, which has been perceived to long. In connection with the distraction aspect test drivers are of the opinion that after a familiarization phase the interaction with the system will be clearer (i.e. icons) and thus less disturbing.
Test drivers considered the COOPERS System as better supporting system when referring to trip planning, because of VMS regional limitation. The earlier and more detailed information about road conditions has been considered as advantage over VMS, especially when it comes to weather condition and congestion warnings. Another advantage that test drivers perceive is the fact, that it is not necessary to pass a VMS to be informed, but to have the information as soon as possible and permanently in the car.
Especially the display of the current speed limit has been seen as advantageous, because such information can be easily overlooked on VMS or forgotten.
Some test drivers stated that they would prefer a combination of both systems, if displayed icons and information are conform. If the two systems display different information, test drivers would believe that the COOPERS messages are incorrect, because the trust in VMS is at the moment higher than in the new COOPERS technology.
Disadvantages of COOPERS
Test drivers stated that the display in the test drive situation was too big and limiting the field of view. Further some of the test drivers found the amount of services displayed and the level of detail distracting. To avoid information overload a clear priorisation of services is needed and text messaged should be shortened.
Further especially text messages have been rated as negative because of the size of letters. Some elements have been rated nearly unreadable and therefore distracting, because it took to long to read the full message. Some

COOPERS integrated project
D15 - IR 7100/7200/7300/7400 Report on common result assessment
Page 63 of 191
COOPERS icons shown did not go conform with icons shown on VMS. To avoid misunderstandings they should be more similar.
Concerning the level of detail some information, for example the length of congestion has been considered as irrelevant. In this case the COOPERS system should decide if choosing another route is the better option.
Some interviewees stated that they would prefer an individual adjustment of the COOPERS system to avoid an information overload. If this would be possible every driver could configure the level of information detail or a different coloring of services according to priority.
Additionally some test drivers would like to hear a sound when a new message, especially a safety critical message pops up. In critical situations (wrong way driver) some test participants considered auditive instructions by the COOPERS system as useful.
Concluding there are still some aspects of the COOPERS system that have been rated negative. The priorisation of information and the size of the display as well as letters written have to stronger met the requirements of future users.
Privacy concerns
The majority of test drivers is not aware of privacy security or did not have concerns regarding privacy issues. A minority group of test drivers were aware of privacy issues and data security, but stated that they consider COOPERS not as critical as long as driver data is treated anonymously.
Level of detail
The majority of test drivers found the level of detail presented during the test adequate. About one third of the participants stated that the level of detail was too high and should be reduced or limited to the necessary minimum. This concerned especially the text messages, which have been considered too long and written in too small letters. Particular drivers would prefer more information, especially advices and instruction (i.e. keep right) regarding the wrong way driver and roadwork information. Additional information could be offered optional and in auditive form.
Timing of information
The timing of service provision was considered as adequate by the majority of test drivers. Some participants stated that in relation with congestions the timing of provision could be earlier. It was considered as important to be able to chose another route if necessary. Therefore some drivers would prefer to get the information 20 km before the congestion and another time before passing the last exit. One test person suggested to adapt the timing to the speed of the vehicle.
Comprehension of services
The majority of test drivers had no problems concerning the understanding of services and considered the system as self explaining. Some test drivers had problems to read the text and others to understand the icons. About a third of test drivers stated that a clearer priorisation of services would facilitate the system understanding and interaction.
Optical and acoustical Information

COOPERS integrated project
D15 - IR 7100/7200/7300/7400 Report on common result assessment
Page 64 of 191
The system was tested with and without acoustical signal, when new messages popped up. In case of test drives with sound, this sound was rated positive as long as optional and especially connected to safety critical information or traffic rule violations. In case of test drives without sound the sound was considered as missing. The majority of participants found it necessary that if a new message comes in, a sound or a small piep should be given to lead the attraction to the new message displayed. Whereas some participants considered a sound, even a piep, as not necessary, some would like to have additional a voice that informs about new events on the road and gives advices and instruction (i.e. critical situation (wrong way driver) and routing (turn left)). Therefore an optional solution according to the individual driver needs is recommended.
Most important messages
The majority of test drivers rated the wrong way driver, congestion warning and accident incident warning as most important COOPERS Services. Further of importance was the information about the speed limit, which is especially on new stretches interesting, and about about construction sites. The weather warning was also regarded as important and should consider the weather condition (black ice, rain, fog, etc.) on the route especially at the beginning of the trip. Concerning the navigational part of COOPERS the estimated journey time was considered as interesting service.
Participants were also asked to think of new services not yet offered by COOPERS. This ideas are not focused on I2V communication and include as well V2V.
Relating to this idea some participants would like to have some information about the distance to the vehicle ahead, about emergency service vehicles that are approaching, about the driving direction, about the next service or gas station. Some participant would like to be supported during the search of parking spaces. The COOPERS system should therefore consider the length and the height of vehicle. Other test drivers would prefer to get a message to clear the right lane like if someone is accelerating the motorway in this moment.
3.3 Comparison of field test and simulator study results
In April 2008 COOPERS carried out a simulator study at VTI (Swedish National Road and Transport Research Institute) with 48 Swedish test drivers (24 men and 24 women) which drove 40 km with the COOPERS system and 40 km without it, while being exposed to road safety critical and some less critical events.
The following section compares the results of the most important user acceptance constructs (perceived usefulness, perceived ease of use and behavioral intention) of the simulator study with the field test.
3.3.1 Perceived Usefulness
Comparing the construct Perceived Usefulness from the simulator and the field test following picture is given. Both results are positive, thus both ranked in the positive field. The result of the simulator study is even more positive, because almost all items (i.e.”I found the system useful during driving”, “the system enables me to accomplish driving tasks more quickly”, “the system increases my driving safety”, “with the system I enjoy improved driving convenience”) except “using the system I can move from A to B more quickly” and “using the system I can better conform to traffic rules”, have been ranked more positive after experiencing the COOPERS System. The very positive rating of the

COOPERS integrated project
D15 - IR 7100/7200/7300/7400 Report on common result assessment
Page 65 of 191
���*+� �,-������.���/��������-�)�����������"���
���*+� �,-������������.���/��������0)���������� ��+)��.����"�������1�������2�� 1)/
���*+� �,-������������.���/������� ��������/����"������-��/
���*+� �,-������������.���/���������� �������/� .�� ����-�+)��������/����"����������--� ����)/
���*+� �,-������������.���/������� �����"��-����3����4������2�� 1)/
���*+� �,-������������.���/������� ���0������ ��-����������--� ���)��
���*+� �,-������������.���/�������5�))���6�/���+��"������"���� ��"����� �
���*+� �,-������������.���/�������.�"����+��"�����-����������0��������� ���������
simulator study can be referred to the test conditions in a simulated environment. The result of the post questionnaire in the field test showed a similar, but also different picture. Almost all items have been ranked less positive after experiencing the system. However the rating of the field test is also positive. Interesting is that test drivers of the field test found that they can better conform to traffic rules when using the COOPERS System, but were not convinced of this in the simulator study.
���*+� �,-������.���/��������-�)�����������"���
���*+� �,-������������.���/��������0)��������� ��+)��.����"�������1�������2�� 1)/
���*+� �,-������������.���/������� ��������/����"�����-��/
���*+� �,-������������.���/���������� �������/ .�� ����-�+)��������/����"����������--� ����)/
���*+� �,-������������.���/������� �����"��-����3���4������2�� 1)/
���*+� �,-������������.���/������� ���0������ ��-���������--� ���)��
���*+� �,-������������.���/�������5�))���6�/���+��"�����"���� ��"����� �
���*+� �,-������������.���/�������.�"����+��"����-����������0��������� ���������
Figure 37: Comparison Perceived Usefulness - Field test and Simulator
3.3.2 Perceived Ease of Use
Comparing the results of the construct Perceived Ease of use from the simulator and the field test the following picture is given. Both results are again positive (ranked between strongly agree and somewhat agree) and very similar. Almost all items have been ranked more or similar positive after experiencing the system. Test drivers of the field test and the simulator study are of the opinion that the COOPERS is very clear and understandable and easy to use. The only difference is the ranking of the item “I found the signs on the screen easily readable” which was rated more negative in the post questionnaire of the field test.
Strongly agree Strongly disagree Strongly disagree Strongly agree
Field Test Simulator
------ pre- questionnaire ------post-questionnaire

COOPERS integrated project
D15 - IR 7100/7200/7300/7400 Report on common result assessment
Page 66 of 191
Figure 38: Perceived Ease of Use - Field test and Simulator
3.3.3 Behavioural Intention
Comparing the construct Behavioral Intention from the simulator and the field test following picture is given. Both results show again a positive rating. Whereas most of the items have been ranked slightly more negative after experiencing COOPERS in the field test, the result of the simulator study is very positive, because all items have been ranked more positive after experiencing the COOPERS System. As already mentioned the result of the post questionnaire in the field test showed a positive, but slightly different picture. All items concerning the purchase of the COOPERS System have been ranked more negative after experiencing the system. However the result of the field test can be considered as well positive. Test drivers would use the COOPERS System if they had one, adjust their driving style to the recommendations of the system and would recommend it to friends.
���*+� �,-������/������� �����5��.��.��/�����5�))�0�� )�������
�����������0)�
���*+� �,-��������5�))�0�����/�-��������0� �����1�)-�)�������������������.�
�/����
���*+� �,-�������5�))�-�����.���/�������/�������
���*+� �,-������.������������.��� �������0������)/� ��+��.����0)�
���*+� �,-������.������������.��� �������0������)/������0)�
���*+� �,-������/������� �����5��.��.���/�����5�))�0�� )�������������������0)�
���*+� �,-��������5�))�0�����/�-���������0� �����1�)-�)�������������������.��
�/����
���*+� �,-�������5�))�-�����.���/��������/�������
���*+� �,-������.������������.��� ��������0������)/� ��+��.����0)�
���*+� �,-������.������������.��� ��������0������)/������0)�
1 2 3 4 5 6 7
12
34
5
Strongly agree Strongly didsagree Strongly didsagree Strongly agree
Field Test Simulator
------ pre- questionnaire ------post-questionnaire

COOPERS integrated project
D15 - IR 7100/7200/7300/7400 Report on common result assessment
Page 67 of 191
Figure 39: Behavioural Intention - Field Test and Simulator
3.4 Comparison of field test results between groups
The following section compares the results of the most important user acceptance constructs (perceived usefulness, perceived ease of use and behavioral intention) between female and male participants as well as between age groups.
3.4.1 Gender
The most important user acceptance constructs were compared between the female and male participants of the field tests.
In the constructs perceived usefulness, perceived ease of use or behavioral intention it was not possible to show any differences worth mentioning.
However, when analyzing the attitude it became obvious, that male respondents tend to have a worse attitude towards the system compared to female respondents.
3���������� ����� ��))/��"��)�0)�������������������.���/���������.����*�������.
3���������� ����� ��))/��"��)�0)����+���� ����5��)�������.���/���������.����*�
%�����.
3���������� ����� ��))/��"��)�0)�����+)����������.���/���������.����*��������.
��5��)���� ��������/�-���������������.��/����
��5��)��0�/��.���/�����5.��� ����� ��))/�"��)�0)�
�-���.������/�������5��)��������
�-���.����.���/�������5��)����6�����/���"������/)������.���� ��������������-
�.���/����
3���������� ����� ��))/��"��)�0)��������������������.���/���������.����*���
����.3���������� ����� ��))/��"��)�0)�����+���� ����5��)�������.���/���������.��
��*��%�����.3���������� ����� ��))/��"��)�0)�����+)�����������.���/���������.����*����
����.
��5��)���� ��������/�-���������������.���/����
��5��)��0�/��.���/�����5.��� ����� ��))/��"��)�0)�
�-���.������/�������5��)��������
�-���.����.���/�������5��)����6�����/����"������/)������.���� ��������������-�
�.���/����
Strongly agree Strongly disagree Strongly disagree Strongly agree
Field Test Simulator
------ pre- questionnaire ------post-questionnaire
1 2 3 4 5 6 7
12
34
56
7
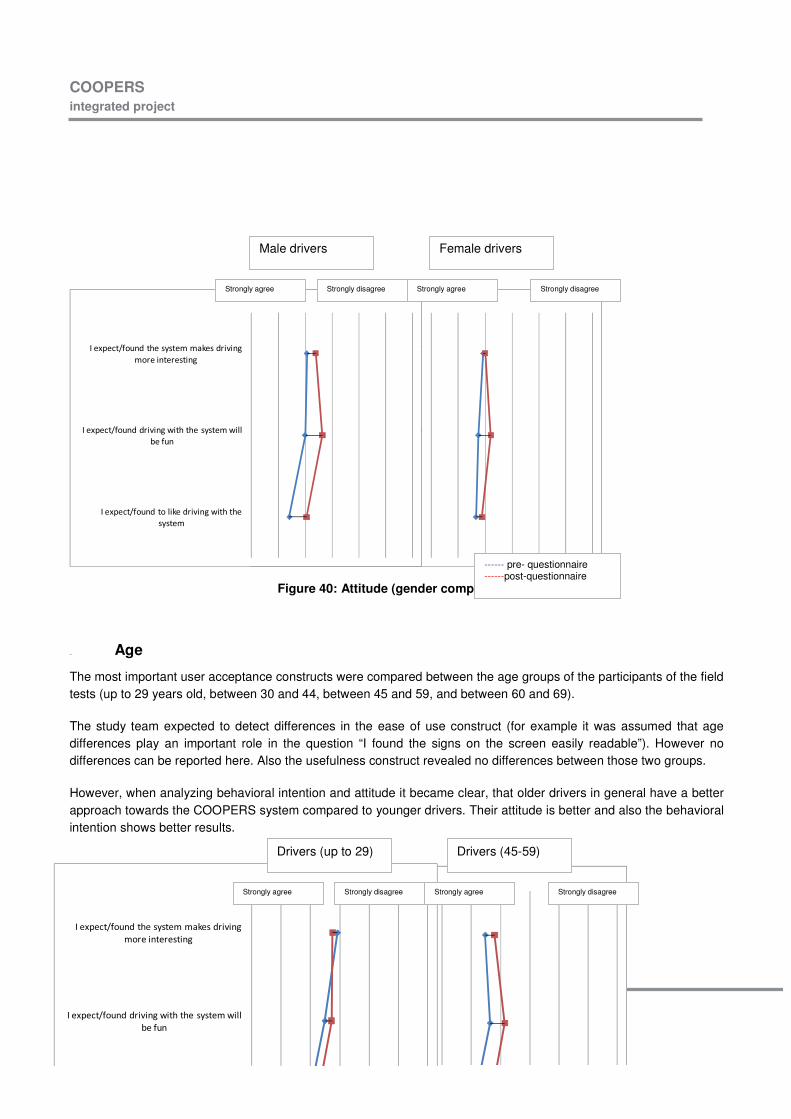
COOPERS integrated project
D15 - IR 7100/7200/7300/7400 Report on common result assessment
Page 68 of 191
���*+� �,-������.���/�������1������"��������������������
���*+� �,-��������"����5��.��.���/�����5�))�0��-��
���*+� �,-������.���/�������1������"��������������������
���*+� �,-��������"����5��.��.���/�����5�))�0��-��
Figure 40: Attitude (gender comparison)
3.4.2 Age
The most important user acceptance constructs were compared between the age groups of the participants of the field tests (up to 29 years old, between 30 and 44, between 45 and 59, and between 60 and 69).
The study team expected to detect differences in the ease of use construct (for example it was assumed that age differences play an important role in the question “I found the signs on the screen easily readable”). However no differences can be reported here. Also the usefulness construct revealed no differences between those two groups.
However, when analyzing behavioral intention and attitude it became clear, that older drivers in general have a better approach towards the COOPERS system compared to younger drivers. Their attitude is better and also the behavioral intention shows better results.
���*+� �,-������.���/�������1������"��������������������
���*+� �,-��������"����5��.��.���/�����5�))�0��-��
���*+� �,-��������)�1�����"����5��.��.���/����
���*+� �,-������.���/�������1������"��������������������
���*+� �,-��������"����5��.��.���/�����5�))�0��-��
���*+� �,-��������)�1�����"����5��.��.���/����
Strongly agree Strongly disagree Strongly disagree Strongly agree
Male drivers Female drivers
------ pre- questionnaire ------post-questionnaire
Strongly agree Strongly disagree Strongly disagree Strongly agree
Drivers (up to 29) Drivers (45-59)

COOPERS integrated project
D15 - IR 7100/7200/7300/7400 Report on common result assessment
Page 69 of 191
Figure 41: Attitude (age group comparison)
Figure 42: Behavioural intention to use (age group comparison)
3.5 Conclusions
Technology acceptance studies have proven a valid lead-indicator for future use of new telematics and IT-based systems. The COOPERS approach to acceptance measurement uses this standard approach. The measurement instrument was developed in a stepwise approach integrating the COOPERS simulator study in Sweden 2008 as well as several pre-tests. The questionnaire was complemented by additional 25 in-depths interviews. This acceptance measurement questionnaire was finally presented to all drivers of the COOPERS test cars at the various test sites before and after the actual test drive.
3���������� ����� ��))/��"��)�0)��������������������.���/���������.����*�������.
3���������� ����� ��))/��"��)�0)�����+���� ����5��)�������.���/���������.����*��
%�����.
3���������� ����� ��))/��"��)�0)�����+)�����������.���/���������.����*��������.
��5��)���� ��������/�-���������������.���/����
��5��)��0�/��.���/�����5.��� ����� ��))/��"��)�0)�
�-���.������/�������5��)��������
�-���.����.���/�������5��)����6�����/����"������/)������.���� ��������������-�
�.���/����
Strongly agree Strongly disagree Strongly disagree Strongly agree
Drivers (up to 29) Drivers (60-69)
------ pre- questionnaire ------post-questionnaire

COOPERS integrated project
D15 - IR 7100/7200/7300/7400 Report on common result assessment
Page 70 of 191
Within this version of the report measurement results from COOPERS field test in Innsbruck, Trento and Berlin are taken into account. Overall, this user acceptance assessment with 133 participants of all age groups shows a very positive perception of the COOPERS system. The results gained from real world driving at the test sites confirm the results from the simulator study 2008 in Sweden. All statistical constructs have nicely shown that test drivers have liked the experience with the COOPERS system.
The questionnaire results showed that the test drivers consider the system useful during driving and are of the opinion that with the system they have improved information on road conditions and can better conform to traffic rules (perceived usefulness).
A second interesting result regarding the perceived ease of use shows that the system is considered clear and understandable and easy to use. In addition test drivers would recommend the COOPERS system to friends, would use the system if they had one and would adjust their driving style to the recommendations of the system. When it comes to the purchase of the COOPERS system test drivers hesitate to buy the system at the moment. However test drivers consider services, like the congestion warning, the incident/accident warning (i.e. ghost driver warning) and road work information as useful services that complete the current information offer for vehicle drivers.
It has to be mentioned that the sample of field tests with 133 participants was small and therefore the COOPERS system should be further tested. Nevertheless the results from the different test sites taking different cultural driver specific aspects into account are very similar, thus rather confirming each other.
The detailed analysis of the HMI was not part of this study, however, some feedback and hints can be found in the answers of the questionnaire and in-depth interviews.
Although COOPERS acceptance is rated rather high the open question section of the questionnaire as well as the 25 in-depth interviews with participants after the test procedure revealed issues for further improvement of the OBU as well as specific services. Obviously this has not been the focus of the acceptance study. It is neither surprising nor entirely clear why some drivers who rated COOPERS extremely positive are at the same time the source of a plentitude of ideas for further improvement. As a consequence the user interface should be adjustable to individual preferences of drivers. These adjustments concern mainly the different services provided, the level of detail and timing of information, individual display configurations including an optional acoustical information provision.
Concluding the technology acceptance of test drivers from the field test in Innsbruck, Trento and Berlin is generally high, which sets promising preconditions for later broad adoption and intensive use of the system.

COOPERS integrated project
D15 - IR 7100/7200/7300/7400 Report on common result assessment
Page 71 of 191
4 Physiological Measures Results
4.1 Eye tracking results
Austria
4.2 Heart rate results
Austria.

COOPERS integrated project
D15 - IR 7100/7200/7300/7400 Report on common result assessment
Page 72 of 191
������������ ������
Figure 43: Comparison of the heart rates with Coopers OFF versus ON over all drivers with the off – on sequence.
4.3 Comparison of simulator study and field tests
4.4 Conclusions
From the comparison of the average heart rates it can be seen that the heart rate is lower with the COOPERS system on than without. From these plots it can be seen that the drivers are calmer when driving with COOPERS.

COOPERS integrated project
D15 - IR 7100/7200/7300/7400 Report on common result assessment
Page 73 of 191
5 Traffic and Safety Performance
5.1 Austria
The main objective of this chapter is to analyze and study the impact of COOPERS (CO-OPerative SystEms for Intelligent Road Safety) on driver behaviour (i.e.: driving speed, lane-changing frequency, car-following) and to combine driver behaviour measures with physiological measurements and with user acceptance questionnaire results for the examination of significant correlations. Finally, to assess the implications of the use of COOPERS on traffic safety and traffic flow.
The demonstration test site that is considered in this analysis is the Austrian test site, a 4-lane road section, of a total length of 17 kilometers was used for the test runs as presented in below:
Figure 5-1: Austrian demonstration site
50 drivers were planned to participate in the driving tests, however because of some technical reasons and problems in the CAN log data files such as: some test drivers (40, 46) did not drive (so there is no data at all), sometimes the CAN detection system was not available (so there is just no CAN data available), sometimes the previous version of the CAN software was used (so there is CAN data available but in the wrong format). As a result, valid data was available for 35 drivers. Figure 5-2 and Figure 5-3 present the distribution of drivers according to their gender and age.
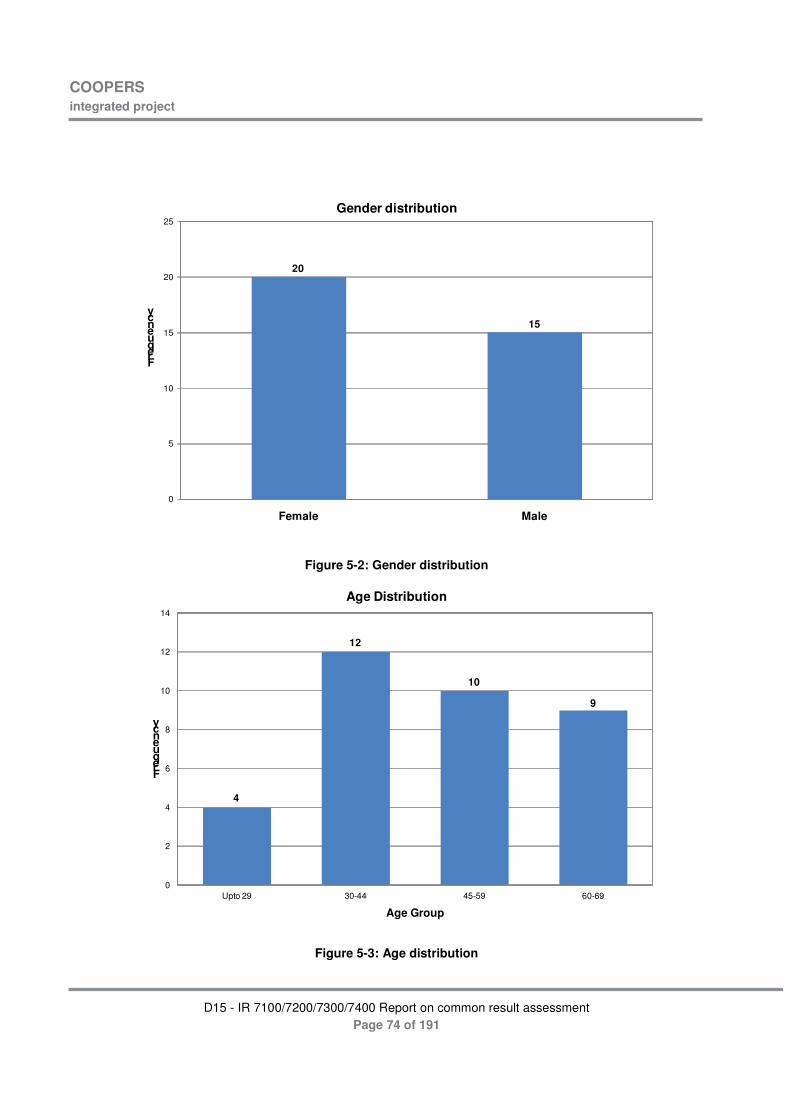
COOPERS integrated project
D15 - IR 7100/7200/7300/7400 Report on common result assessment
Page 74 of 191
20
15
0
5
10
15
20
25
Female Male
Frequency
Gender distribution
Figure 5-2: Gender distribution
4
12
10
9
0
2
4
6
8
10
12
14
Upto 29 30-44 45-59 60-69
Frequency
Age Group
Age Distribution
Figure 5-3: Age distribution

COOPERS integrated project
D15 - IR 7100/7200/7300/7400 Report on common result assessment
Page 75 of 191
The following sections analyses the CAN, HMI, and TCC log files results of the drive runs of the 35 drivers when COOPERS was activated and when it was deactivated.
5.1.1 Comparison of general traffic conditions with COOPERS ON / OFF
An important issue that needs to be considered in advance of the analysis of the results is whether the traffic conditions were similar in both trips: with COOPERS ON and with COOPERS OFF. For analyzing the general traffic conditions when COOPERS’ system was ON versus when it was OFF and using the available data provided in the TCC log files, the traffic conditions during each trip over time and space are displayed. To illustrate this we have plotted the iso-occupancy and iso-speed plots in time space diagrams. In these diagrams the x-axis is the elapsed time (min) and the y-axis is the travelled distance (km.). The different colors demonstrate different speed/ occupancy levels as presented on the scale on the right of each iso-diagram.
Figure 5-4(a) illustrates the general traffic conditions (average speed and occupancy) on lane 1 when the COOPER’s system was ON and when it was OFF. Figure 5-4(b) illustrates the general traffic conditions on lane 2 when the COOPER’s system was ON and when it was OFF. For this driver, assuming that his path is along the diagonal line, we can see that the general traffic conditions were similar for the trip with COOPERS ON versus the trip with COOPERS OFF. Note that the scales of the y-axis in the figures might differ sometimes between the ON case and the OFF case. This should be taken into consideration during the comparison. Appendix A summarizes the results of the general traffic condition comparison for each driver when COOPERS was ON versus when it was OFF for lane 1 and lane 2.

COOPERS integrated project
D15 - IR 7100/7200/7300/7400 Report on common result assessment
Page 76 of 191
(a) Traffic speed and occupancy for lane-1 with COOPERS ON and OFF
(b) Traffic speed and occupancy for lane-2 with COOPERS ON and OFF

COOPERS integrated project
D15 - IR 7100/7200/7300/7400 Report on common result assessment
Page 77 of 191
Figure 5-4: Traffic Speed and Occupancy on: (a) Lane-1; (b) Lane-2, at the time of driving for Driver 02 (Austria)
Table 5-1 below summarizes the average traffic speed and occupancy for each driver when COOPERS is ON versus COOPERS OFF.
Table 5-1: Summary of the general traffic conditions comparison between COOPERS ON /OFF
������������ ����������� �����>������?��
���� �?� ���� �?�
� %&@� %&@%� �@�� �@!#�
�� %&!@&$� %&@#� �@#� �@#!�
�� %&&@$%� %&%@#!� �@%� �@%�
$� %&@�$� %&$@� �@�#!� �@�%�
!� %&$@&#� %&$@!!� 4.63 �@&#�
#� %&�@!%� %&�@&� �@#� �@�!�
%&� %&@!� %&&@%� �@�!� �@%#�
%%� !�@�� %&&@%%� #@$%� �@%�
%� %&@#$� %&%@&&�� �@$� �@!%�
%�� %&@�#$� %&�@�%� �@�!� �@!$�
%�� %&&@%� %&&@%!� �@��� �@!#�
%� %&@%�� %&$@$� �@$�� �@%#!�
%$� ##@$� %&%@#!� �@%%� �@!#�
%!� ##@�%� %&%@�#!� �@�#� �@�&�
%#� %&&@�!� %&%@� �@$%� �@#$�
&� #�@�� #@!#$� @��� @%�
%� %&�@!� #!@##� @&%� �@!��
�� !@�� #@��� #@$� @#%�
�� %&@� %&�@� �@%#� �@&��
$� %&%@%$� %&&@%&�� �@�� �@�#�
!� %%@%�� %%%@�#� �@��� �@�%�
#� %&�@#� %&@#�� �@� �@##�
�&� %&�@� %&@&%� �@$� �@$%�
�� ##@!%� %&&@��� �@�� �@&%�
��� #$@�� ##@$�� @� @&#!�
�� %&�@$� %&�@%#� �@#�� �@%��
�$� %&%@#%� %&&@!� �@!� @�
�!� %&&@!�� %&&@�!� �@�!� �@���
�� #!@%!� #$@�� @��� @�%�
��� %&&@�� %&&@!!� �@$�� �@%�
��� #$@!� ##@!� �@��� �@�!�
��� %&&@� ##@%�� �@!� �@!#�

COOPERS integrated project
D15 - IR 7100/7200/7300/7400 Report on common result assessment
Page 78 of 191
�!� %&@�� %&�@%�� �@%$� �@�
�#� ##@$#� %&�@�� �@#�� �@!%�
�&� #!@!� %&&@%� �@$� �@��
Regarding the average traffic conditions it can be seen that for most drivers (except for drivers 11, 24, 49) the average traffic conditions were almost similar when COOPERS was ON versus when it was OFF. This indicates that change in the driver behavior when COOPERS was ON versus when it was OFF will not be attributed to other factors than the average traffic conditions.
5.1.2 Speed and acceleration profiles (COOPERS ON/ COOPERS OFF)
Driving speed and acceleration are important factors and indicators for safety and traffic flow. Therefore, speed and acceleration profiles were created for each driver in both drives (COOPERS ON and COOPERS OFF). Figure 5 illustrates an example of the results for driver 2:
(a) Speed profile with COOPERS ON and OFF

COOPERS integrated project
D15 - IR 7100/7200/7300/7400 Report on common result assessment
Page 79 of 191
(b) Acceleration profile with COOPERS ON and OFF
Figure 5-5: Impact of COOPERS on driver 02 behaviour: (a) Speed profile; (b) Acceleration profile Figure 5-5(a) is the speed profile of driver 02 along the road when the COOPER’s system was ON (red line) and when it was OFF (blue line). It can be noticed that when COOPERS is ON the driver’s speed is lower on average. The figure also includes the type of messages that were sent to the driver and the exact distance when it was shown on the on-board unit. This is illustrated by vertical line in the figure. Therefore, information regarding the change in the driving speed after the message was received on the on board unit can be also achieved from this figure. However, it should be noted that since there was no audio tone from the on board unit when a new message was displayed, it is difficult to identify when exactly the driver saw the message. With respect to Figure 5-5(b), the acceleration profile, it was rather difficult to make conclusions, and therefore, further analysis was suggested by considering calculating the acceleration noise for COOPERS ON and OFF.
It can be noticed that driver 2 decreased his driving speed when COOPERS was activated and in other words COOPERS had positive impact on the driver behavior. Appendix B includes the speed profiles for each driver.
The speed profile analysis revealed that some files of some drivers were corrupted; Figure 5-6 and Figure 5-7 illustrate some of these problems.

COOPERS integrated project
D15 - IR 7100/7200/7300/7400 Report on common result assessment
Page 80 of 191
Figure 5-6: Impact of COOPERS on the speed behaviour of driver 42
In Figure 6 it can be seen that there was a congestion of messages toward the end of the trip, and in Figure 7 we see that there is no complete data for the case when COOPERS was ON.

COOPERS integrated project
D15 - IR 7100/7200/7300/7400 Report on common result assessment
Page 81 of 191
Figure 5-7: Impact of COOPERS on the speed behaviour of driver 34
Table 5-2 summarizes the average driving speed and the standard deviation of speed for each driver when COOPERS was ON versus when it was OFF:
Table 5-2: Summary of the average driving speed for all drivers
������������ �������>���������>������?�� A����� ����
���� �?� ���� �?�� ����)�� �� %%@� %&�@�!� %@�%� !@���� �)�� � %%&@!�� %&@!#� %@�� %%@�
�� ����)�� �� %&�@&� %&�@$� �@#�� �@���
$� �)�� � %&�@�$� %%@%%� %$@� !@#!�
!� ����)�� � %%�@�&� %%@!!� %@� %�@&!�
#� �)�� � %&&@��� %&�@%!� @%%� �@��
%&� �)�� � #!@#�� %%@�� �@�� %@&!�
%%� �)�� � %&%@�� %&%@!� �@#�� �@�$�
%� �)�� �� !$@#!� #�@�%� �@%#� @��
%�� ����)�� � %&&@�%� %&@$$� #@�%� $@%!�
%�� ����)�� �� #!@��� #%@!$� �@�� @�
%� ����)�� %� %�@�!� %%%@&$� %�@$�� %@�#�
%$� ����)�� � ##@$� %&$@&� $@�%� #@&�
%!� ����)�� �� #�@�� #@� $@�&� !@�
%#� ����)�� %� ##@$� #!@�� �@$!� @&��

COOPERS integrated project
D15 - IR 7100/7200/7300/7400 Report on common result assessment
Page 82 of 191
Where the age groups were defined as described in Table 5-3:
Table 5-3: Age group's categories
Age Groups
Group 1 Up to 29
Group 2 30-44
Group 3 45-59
Group 4 60-69
Group 5 70 or older
According to the results in Table 5-2 for some drivers we can see a positive effect of COOPERS by the fact that those drivers reduced their driving speed (driver 2, 15, 28). However, for others we can see almost no effect of COOPERS on their driving speeds (examples: driver 5, 18, 29).
Table 5-2 previously presented a brief summary of speed behaviour of the whole test track in Austria for each driver. If we take the average speed of all the drivers then we will observe a slight reduction in driving speed with COOPERS ON (average speed with COOPERS ON = 99.28 Km/hr and with COOPERS OFF = 101.42 Km/hr), although t-statistics indicates that the difference is not significant at 95% confidence level (see Table 5-4).
&� ����)�� �� #@��� #�@!%� !@&#� �@!$�
%� �)�� �� #�@�$� #%@&#� %%@#� !@%$�
�� �)�� �� ##@�%� %&%@�%� @!� �@%#�
�� ����)�� � %&%@��� #$@$$� �@�!� �@&%�$� �)�� �� #@$�� #�@&&� �@&�� �@���
!� ����)�� �� %&!@��� #$@��� %%@�%� $@&��
#� ����)�� �� %&&@%� %&&@#�� @$�� !@#&�
�&� �)�� �� #@&�� #�@$� @!&� �@$��
�� �)�� �� #!@$&� %&&@�#� �@#�� �@�
��� ����)�� %� %&�@&�� %&&@$!� @&�� $@�
�� ����)�� � ##@�� #@&� �@!$� %%@&%�
�$� �)�� �� ##@%%� #@$�� @&&� @�%�
�!� �)�� %� %&�@��� #!@&� %�@#� @���
�� ����)�� �� #�@%�� $@#&� @!� ��@�%�
��� �)�� �� #�@�!� #@��� �@##� �@��
��� ����)�� � %&@&� ##@�$� #@��� $@$�
��� ����)�� � #@�� #@��� �@�� �@&�
�!� �)�� �� %&$@�� !!@!� @#%� @�$�
�#� ����)�� �� #$@#%� #@$� �@%$� �@�!�
�&� ����)�� �� #$@%$� #@&!� �@&� �@$�

COOPERS integrated project
D15 - IR 7100/7200/7300/7400 Report on common result assessment
Page 83 of 191
Table 5-4: Comparison of average speed
Average Speed
COOPERS OFF COOPERS ON t-statistic Traffic speed 101.41 Km/hr 102.16 Km/hr -0.72
Driver Speed 101.42 Km/hr 99.28 Km/hr 1.75
t-statistics 0.008 -2.045 -
�
It is obvious from Table 5-4 that the average driving speed for COOPERS ON reduced to 99.28 Km/hr although the general traffic speed increased to 102.16 Km/hr, whereas no significant change is found between average driving speed and traffic speed with COOPERS OFF. The results of this table are based on the calculated average speed for the whole section for each driver (total 35 observations for COOPERS ON and 35 observations for COOPERS OFF).
The analysis would be more accurate if we treat the average speed in small segments of the road instead of considering the whole road section. For this analysis, the 17 km test track is divided to small segments of only 250 meters length. The average speed along each segment is calculated for all the drivers. Then depending on the nature of analysis, the average speed in each segment was calculated for each sub-group of drivers depending on the gender and age categories. Therefore the variation of speed throughout the test track will be easily understood from the figures shown below. Figure 5-8 shows the average speed of the drivers along the whole length of the road segment with COOPERS ON and OFF.
Figure 5-8: Average speed profile of all drivers with COOPERS ON and OFF

COOPERS integrated project
D15 - IR 7100/7200/7300/7400 Report on common result assessment
Page 84 of 191
It is apparent from this figure that average driving speed reduces all along the road section with COOPERS ON and according to the results in Table 5-5, this difference is significant at the 95% confidence level:
Table 5-5: Comparison of the average speed of all drivers with COOPERS ON/ OFF
Average Speed COOPERS OFF COOPERS ON t-statistic P- value Traffic speed 101.41 Km/hr 102.16 Km/hr -0.72 0.4769 Driver Speed 101.84 Km/hr 100.03 Km/hr 9.89 9.76E-15
For further analysis we have categorised the drivers according to their gender and age to observe any difference in speed and lane changing behaviour. The results are shown in Figure 5-9 to Figure 5-12 and Table 5-6 to Table 5-9.
Figure 5-9: Average Speed of Drivers below 30 years of Age
Table 5-6 presents the t-test and P-value results of the comparison:
Table 5-6: Comparison of the average speed of drivers below 30 years old with COOPERS ON/ OFF
Average driving speed (km/hr)
Gender COOPERS OFF COOPERS ON t-statistic P-value
Male 108.67 98.39 9.366 8.47E-14
Female 109.48 103.82 10.541 7.25E-16
�
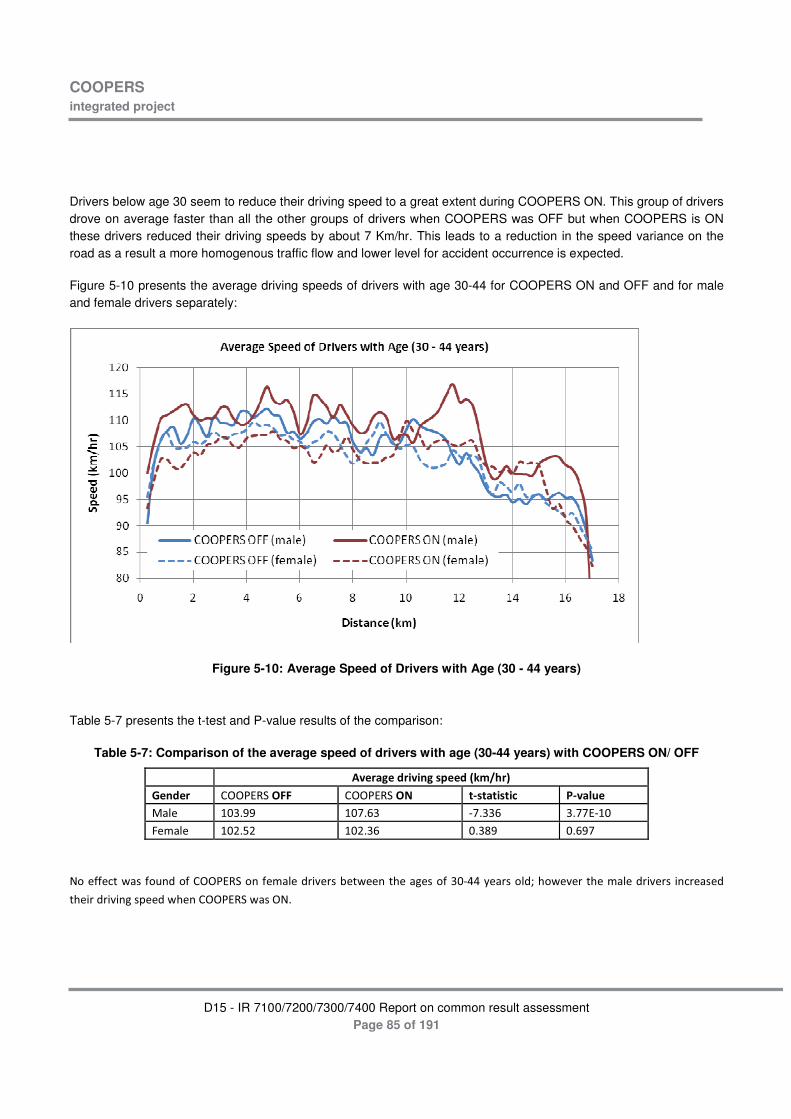
COOPERS integrated project
D15 - IR 7100/7200/7300/7400 Report on common result assessment
Page 85 of 191
Drivers below age 30 seem to reduce their driving speed to a great extent during COOPERS ON. This group of drivers drove on average faster than all the other groups of drivers when COOPERS was OFF but when COOPERS is ON these drivers reduced their driving speeds by about 7 Km/hr. This leads to a reduction in the speed variance on the road as a result a more homogenous traffic flow and lower level for accident occurrence is expected.
Figure 5-10 presents the average driving speeds of drivers with age 30-44 for COOPERS ON and OFF and for male and female drivers separately:
Figure 5-10: Average Speed of Drivers with Age (30 - 44 years)
�
Table 5-7 presents the t-test and P-value results of the comparison:
Table 5-7: Comparison of the average speed of drivers with age (30-44 years) with COOPERS ON/ OFF
� ���������������������������
A������ ������������� ���������?�� ������������� ����� ��� �)��� %&�@##�� %&$@��� 7$@��� �@$$�7%&������)�� %&@��� %&@��� &@�!#�� &@#$��
�
����--� ��5���-������-������������-���)�����"����0��5�����.��������-��&7���/������)�B�.�5�"����.����)�����"���� �� �������
�.�������"�����+����5.�����������5�����@��

COOPERS integrated project
D15 - IR 7100/7200/7300/7400 Report on common result assessment
Page 86 of 191
�
Figure 5-11: Average Speed of Drivers with Age (45 - 59 years)
Table 5-8 presents the t-test and P-value results of the comparison:
Table 5-8: Comparison of the average speed of drivers with age (45-59 years) with COOPERS ON/ OFF
Average driving speed (km/hr)
Gender COOPERS OFF COOPERS ON t-statistic P-value
Male 100.98 93.86 10.262 2.22E-15
Female 103.12 98.25 12.822 1.06E-19
Noticeable improvement is found for driver of age group 3 (45-59 years) i.e. middle aged drivers as their driving speed is reduced when driving with COOPERS ON.

COOPERS integrated project
D15 - IR 7100/7200/7300/7400 Report on common result assessment
Page 87 of 191
Figure 5-12: Average Speed of Drivers with Age (60 - 69 years)
Table 5-9 presents the t-test and P-value results of the comparison:
Table 5-9: Comparison of the average speed of drivers with age (60-69 years) with COOPERS ON/ OFF
Average driving speed (km/hr)
Gender COOPERS OFF COOPERS ON t-statistic P-value
Male 94.93 96.57 -3.343 0.001
Female 98.48 95.95 2.930 0.004
According to the results depicted in Table 5-9 a reduction in the driving speed was observed for the female drivers and an increase of the driving speed for the male drivers. These results were found to be significant at the 95% confidence level.
Table 5-10 summarizes the results of the comparison of drivers’ average driving speed according to drivers’ age and gender and whether COOPERS was ON or OFF.

COOPERS integrated project
D15 - IR 7100/7200/7300/7400 Report on common result assessment
Page 88 of 191
Table 5-10: Comparison of Average speed according to age and gender of the drivers
Average driving speed (km/hr) COOPERS OFF COOPERS ON (t-statistic)
Age group All Drivers
Up to 29 109.28 102.46 12.453 30-44 103.25 104.99 -4.903 45-59 102.06 96.05 14.783 60-69 96.71 96.26 0.846 Male Drivers Up to 29 108.67 98.39 (9.366) 30-44 103.99 107.63 (-7.336) 45-59 100.98 93.86 (10.262) 60-69 94.93 96.57 (-3.343) Female Drivers Up to 29 109.48 103.82 (10.541) 30-44 102.52 102.36 (0.389) 45-59 103.12 98.25 (12.822) 60-69 98.48 95.95 (2.930)
It is noticeable from Table 5-10 that the average driving speed reduces for all age groups except for group 2 (30-44 years of age). It should be noticed that we cannot expect from the driver using COOPERS to reduce his driving speed to a large extent since he should also adapt his behaviour to the average traffic speed because it might be risky to drive much great below the traffic stream speed. Rather the driving profile should be smooth compared to COOPERS OFF i.e. less number of lane changing should be observed and the acceleration or deceleration are expected to be smoother since the driver has advance information of the situation in front of him. It is expected that COOPERS will have different impacts for different penetration levels of COOPERS’ system in the traffic.
Further analysis is done to see the gender effect on driving speed profile and the results are shown below in Figure 5-13 and Figure 5-14.

COOPERS integrated project
D15 - IR 7100/7200/7300/7400 Report on common result assessment
Page 89 of 191
Figure 5-13: Male driver with COOPERS ON and OFF
Figure 5-14: Female driver with COOPERS ON and OFF
From Figure 5-13 and Figure 5-14 it is obvious that female drivers gave more attention to COOPERS’ messages and drove slower as the driving speed reduced with COOPERS ON. The results presented in Table 5-11 summarize the average driving speeds for male versus females when COOPERS was ON versus OFF:
Table 5-11: Average driving speed for male and female for COOPERS ON/OFF
Average driving speed (km/hr) Gender
COOPERS OFF COOPERS ON t-statistic
Male 100.08 99.84 (0.874)
Female 103.17 100.18 (14.281)

COOPERS integrated project
D15 - IR 7100/7200/7300/7400 Report on common result assessment
Page 90 of 191
From Table 5-11 it is clear again that female drivers gave more attention to COOPERS’ messages and drove consistently as their driving speed reduced with COOPERS ON.
Another interesting aspect is the impact of the sequence of runs. Some drivers drove first when COOPERS was deactivated and then when it was activated, and other drivers had the opposite sequence of runs. Figure 5-15 presents the results.
$&�&&
$��&&
!&�&&
!��&&
#&�&&
#��&&
%&&�&&
%&��&&
%%&�&&
%%��&&
%&�&&
& � ! %& % %� % %!
���������������� ���!"�������?���# ��������>������
���+������� ���+������
8�9 3"�������+����-��������������7�����2��� ���-����"����
$&�&&
$��&&
!&�&&
!��&&
#&�&&
#��&&
%&&�&&
%&��&&
%%&�&&
%%��&&
%&�&&
& � ! %& % %� % %!
���������������� ���!"���?�������# ��������>������
���+������� ���+�������
809 3"�������+����-�������������7������2��� ���-����"����
Figure 5-15: Impact of the sequence of driving on the effect of COOPERS (a) OFF-ON sequence; (b) ON-OFF sequence
It can be seen that there is an impact of the sequence of driving conditions (COOPERS activated/ deactivated) on the average driving speed. The general traffic conditions were compared to see whether the traffic conditions were different for both sequences of runs, however no significant differences were found.

COOPERS integrated project
D15 - IR 7100/7200/7300/7400 Report on common result assessment
Page 91 of 191
Figure 5-16 present the driving speed frequency distribution for both conditions, COOPERS ON and OFF. The average driving speed is the average speed combining all the drivers throughout the whole section As can be noticed when COOPERS is ON the distribution is shifted to the left indicating a reduction of the driving speeds of drivers when the COOPERS system is ON. Also it can be noted that more drivers are now driving close to the speed limit. This leads to a reduction in the speed variability on the road and therefore an increase in safety and traffic homogeneity.
0
5
10
15
20
25
30
80 82 84 86 88 90 92 94 96 98 100 102 104 106 108 110 More
Frequency Distribution
Driving Speed (Km/hr)
COOPERS OFF
COOPERS ON
Figure 5-16: Driving speed frequency distribution
Earlier studies demonstrate that acceleration noise is a useful traffic parameter for evaluating traffic flow and that it is a parameter that might be employed to characterize the driver-car-road complex under various conditions (Herman et al., 1959). Acceleration noise, or standard deviation of the acceleration, is defined as the root mean square deviation of the acceleration of the car. The definition can be formulated as follows (Jones and Potts, 1962):
� � � � � � � � � 8%9�
Figure 5-17 illustrates the results of the acceleration noise for each driver calculated for the whole trip when COOPERS was activated and when it was deactivated.

COOPERS integrated project
D15 - IR 7100/7200/7300/7400 Report on common result assessment
Page 92 of 191
0%
10%
20%
30%
40%
50%
60%
70%
80%
90%
100%
Acceleration Noise
Drivers
ACN_on
ACN_off
Male Drivers(Young ----> Old)
Female Drivers(Young ----> Old)
�
Figure 5-17: Acceleration noise for COOPERS ON and OFF for each driver
As can be seen from Figure 5-17 there is almost no trend in the acceleration noise of male and females, young or old when COOPERS was ON versus when it was OFF.
5.1.3 Lane- changing behavior (COOPERS ON/ OFF)
Lane-changing profiles were created for each driver in both drives (COOPERS ON and COOPERS OFF). Figure 5-18 illustrates the results for driver 2:

COOPERS integrated project
D15 - IR 7100/7200/7300/7400 Report on common result assessment
Page 93 of 191
�
Figure 5-18: Lane changing behaviour with COOPERS ON and OFF for driver 02
The red line in Figure 5-18 presents the lane-changing behavior when the COOPER’s system was ON and the blue line is when it was OFF. As shown when the COOPERS system is ON the frequency of lane-changing maneuvers was lower for this driver. Again, the figure with COOPERS ON, shows also when the messages were received at the on-board unit.
The lane-changing profile analysis revealed also that some log files for some drivers were corrupted; Figure 5-19 and Figure 5-20 illustrate some of these problems.

COOPERS integrated project
D15 - IR 7100/7200/7300/7400 Report on common result assessment
Page 94 of 191
Figure 5-19: Lane changing behaviour with COOPERS ON and OFF for driver 42 – congestion of messages
Figure 5-20: Lane changing behaviour with COOPERS ON and OFF for driver 34 – No complete date
Table 5-12 summarizes the frequency of lane-changing for each driver when COOPERS was ON and when it was OFF. Appendix C contains the lane-changing profiles for each driver.
Table 5-12: Frequency of lane-changing behaviour
No of Lane change No of Lane change Driver No Gender Age
OFF ON Driver No Gender Age
OFF ON
2 Female 3 10 4 25 Female 2 2 6 3 Male 2 12 12 27 Male 4 6 4 5 Female 4 8 4 28 Female 3 6 2
7 Male 2 4 8 29 Female 3 6 2 8 Female 2 12 12 30 Male 4 0 2
9 Male 2 6 6 32 Male 3 10 6
10 Male 2 4 8 33 Female 1 12 10 11 Male 2 6 10 36 Female 2 8 4 12 Male 4 0 2 37 Male 4 10 8 13 Female 2 6 2 38 Male 1 6 4
15 Female 3 6 4 42 Female 4 6 4 16 Female 1 4 8 43 Male 4 4 2
17 Female 2 4 6 44 Female 2 8 6 18 Female 3 6 4 45 Female 2 4 8 19 Female 1 4 4 48 Male 3 12 6
20 Female 4 6 6 49 Female 3 2 4

COOPERS integrated project
D15 - IR 7100/7200/7300/7400 Report on common result assessment
Page 95 of 191
According to the results in Table 5-12 for some drivers we can see a positive effect of COOPERS by the fact that those drivers reduced their lane- changing frequencies (driver 2, 15, 28). However, for some other drivers we can see almost no effect of COOPERS on their lane- changing frequencies or even sometimes an increase of the lane-changing frequency.
Table 5-13 summarizes the results of the comparison of drivers’ lane-changing frequency according to drivers’ age and gender and whether COOPERS was ON or OFF. To test the significance of the differences the Wilcoxon Signed Rank Tests was used.
Table 5-13: Comparison of the frequency of lane-changes according to age and gender of the drivers
Average no. of lane-change COOPERS OFF COOPERS ON Test-statistic Sig.
Age group All Drivers
Up to 29 6.5 6.5 30-44 6.33 7.33 45-59 6.6 4.4 60-69 5.11 3.78 Male Drivers Up to 29 6.00 4.00 - - 30-44 6.40 8.80 (-1.73) 0.083 45-59 8.67 5.33 (-1.34) 0.180 60-69 4.33 3.33 (-1.0) 0.317 Female Drivers Up to 29 6.67 7.33 (-0.447) 0.655 30-44 6.29 6.29 (0.00) 1.000 45-59 5.71 4.00 (-1.20) 0.23 60-69 6.67 4.67 (-1.34) 0.18
According to the results presented in Table 5-13 a reduction was noticed in the lane-changing frequency for the older age groups (45-59 and 60-69) for both male and female drivers, however these differences were not statistically significant. It should be indicated that the frequency for the lane-changing behaviour was considered for the whole section and not for the subsection. Future analysis will consider the lane-changing behaviour for each sub-section and examine if the comparison between COOPERS ON and OFF become significant.
Figure 5-21 and Figure 5-22 summarize the results of the lane changing frequency when COOPERS was ON versus when it was OFF for male and female drivers separately and for different age groups. It can be noticed that for the two groups of the older drivers (45-59 and 60-69) there was a reduction in the average lane changing frequency, however for the younger groups, there was even sometimes increase in the frequency of lane changing behaviour. However, most of these differences were not found to be statistically significant at the 95% level of confidence except for the group of female of age between 60 and 69 (see Table 5-13 above).
21 Male 3 4 4 50 Female 3 4 8
24 Male 4 6 2

COOPERS integrated project
D15 - IR 7100/7200/7300/7400 Report on common result assessment
Page 96 of 191
Figure 5-21: Lane-changing frequency of male drivers
Figure 5-22: Lane-changing frequency of female drivers
Table 5-14 presents the t-test and P-value results of the comparison of the lane-changing frequency when COOPERS was ON versus when it was OFF for the different age and gender groups:
Table 5-14: Average frequency of lane-changing for male and female for COOPERS ON/OFF
Average frequency of lane-change Gender
COOPERS OFF COOPERS ON t-statistic

COOPERS integrated project
D15 - IR 7100/7200/7300/7400 Report on common result assessment
Page 97 of 191
Male 6.0 5.6 (0.319)
Female 6.2 5.4 (0.919)
No Significant differences of the Average frequency of lane-changing for male and female for COOPERS ON/OFF were found.
Regression Analysis
To find the effect of all the factors like traffic stream speed, occupancy, age, gender and COOPERS messages on driver behaviour, we conducted a regression analysis. To have a reasonable analysis, we have divided the road section to 4 sub-sections and calculated average driven speed and traffic stream speed for each section and for each individual driver. Therefore we have four times more data for running the regression analysis; moreover the speed variation will have little effect on the model because of small section size. In the analysis, average speed of the driver is kept as the dependent variable (DS) and the explanatory variables are
� Traffic stream speed
� Occupancy
� Age of the driver (inputs are 1,2,3 and 4 for the respective age groups as in Table 5-3)
� Gender (Male = 0 and Female = 1)
� COOPERS (COOPERS OFF = 0 and COOPERS ON = 1)
After running the stepwise linear regression with above parameter, the obtained results are presented below.
Table 5-15: Result of regression analysis (DV: Driving Speed)
Variable Coefficients t statistic P-value
Constant 89.413 8.33 0.000
Age -2.955 -5.645 0.000
Traffic speed (TS) 0.239 2.699 0.007
Coopers ON or OFF (COOPERS) -2.324 -2.28 0.023
Occupancy (Occ.) -0.914 -1.979 0.049
Adjusted R Square = 0.19 Dependent variable: Driving Speed
From the result of regression analysis as presented in Table 5-15, we can come to some conclusions:
T-statistics as shown in the parenthesis represents that all the coefficients are significantly different from zero at 95% confidence level.
The sign of the coefficients are also reasonable.

COOPERS integrated project
D15 - IR 7100/7200/7300/7400 Report on common result assessment
Page 98 of 191
Age: the negative sign indicates lower driving speeds for older drivers.
Traffic speed: If the general traffic speed increases then the subject driver speed should also increase and the positive coefficient represents the exact same thing in the model.
Occupancy: the negative sign represents less speed for higher occupancy.
COOPERS ON or OFF: The coefficient is negative (-2,324) and it is significant. It indicates that COOPERS has a reasonable effect on driving speed. If COOPERS is ON then the driving speed will be reduced.
Gender: It is found that gender has no significant effect on driving speed; therefore it is removed from the stepwise regression analysis.
From this it can be concluded that providing dynamic and updated traffic information to drivers by COOPERS have a significant impact on the driver speed behaviour. Again, we cannot expect from the driver using COOPERS to change his driving behaviour (reduce speed and conduct lane-changing) to a large extent since he should also adapt his behaviour to the average traffic behaviour otherwise a sharp change might cause for an increase of the risk to be involved in critical situations.
5.1.4 Combining driver behaviour with physiological measurements
To be completed.
5.1.5 Combining driver behaviour with user acceptance
The main purpose of this section is to analyze whether there is correlation between the drivers’ acceptance of the COOPERS system and their driving behaviour. Previously section 2.1.2 gave an overview on the results of the test drives in Innsbruck (Austria). The sample of the test participants involved 48 test drivers. The results of the user acceptance questionnaire illustrates that the test person had very positive expectations towards the COOPERS system already before they actually experienced it. As well, that the actual COOPERS system experience outperformed the test driver’s expectations: in average they found with the system they have improved information about the traffic situation, that they can better conform to traffic rules when using the COOPERS system and that the system enhances drivers safety.
A list of the drivers that have a really bad acceptance towards the system and those that were found to have a very positive acceptance of the system was provided based on the results of section 2.1.2 of this report. Table 5-16 summarizes the results.
Table 5-16: Drivers with good and poor acceptance of the COOPERS system/ Austria
Drivers id with Good Acceptance 2 11 16 29 30 34 43 50
Drivers id with Poor Acceptance 8
As can be seen in Table 4-16 only one driver had really poor acceptance of the COOPERS system in Austria site.

COOPERS integrated project
D15 - IR 7100/7200/7300/7400 Report on common result assessment
Page 99 of 191
List of drivers that answered “yes” to the question “do you use a navigation system in your car” was also provided.
5.1.6 Implications for safety and traffic performance
From the planned 50 drivers after the full check of all the data from the demonstration drives and the various sources 35 have been confirmed as fully valid for all analysis aspects, some data sets were only partially available and therefore have been used if respective data were complete.
From the methodology point of view no significant changes have been found dependent from the sequence of the drives, that means if the drivers have first driven with the system ON and than without it, OFF or the other way first with system OFF and than with ON. This was confirmed as an independent variable.
5.1.7 Conclusions
Regarding the average traffic conditions of the drives on demonstration site 1 it can be seen that for most drivers (except for drivers 11, 24, 49) the average traffic conditions were almost similar when COOPERS was ON versus when it was OFF. This indicates that the change of behaviour can be attributed to the messages received during the ON drives.
It can be noticed that drivers decreased their driving speed when COOPERS was activated and in other words COOPERS had positive impact on the driver behavior.
For the analysis of average speed analysed in segments of 250 meter length on the whole section of the demonstration track.
It is apparent from this figure that average driving speed reduces all along the road section with COOPERS ON and according to the results in Table 5-5, this difference is significant at the 95% confidence level:
Drivers below age 30 seem to reduce their driving speed to a great extent during COOPERS ON. This group of drivers drove on average faster than all the other groups of drivers when COOPERS was OFF but when COOPERS is ON these drivers reduced their driving speeds by about 7 Km/hr. This leads to a reduction in the speed variance on the road as a result a more homogenous traffic flow and lower level for accident occurrence is expected.
Noticeable improvement is found for driver of age group 3 (45-59 years) i.e. middle aged drivers as their driving speed is reduced when driving with COOPERS ON. (93.68 km/h with system ON compared to 100.98 km/h with system off)
�

COOPERS integrated project
D15 - IR 7100/7200/7300/7400 Report on common result assessment
Page 100 of 191
5.2 Italy
5.2.1 Introduction
The field tests in Italy were undertaken on Brenner Motorway (A22) between Trento and Ala-Avio (from km 144 to km 179). During the test, two extensive roadworks were being conducted in the sector between Rovereto Sud and Ala-Avio (from 167.7km to 171.7km, and from 177km to 179.2km). Real messages were provided to test drivers to inform/warn of the roadworks and other abnormal conditions (e.g. S3 - roadwork, S4a - lane ban, S5 - speed limit).
The 10 gantries between km 145 and km 165 were equipped with CALM-IR transceivers on all 3 lanes (2 lanes + dynamic hardshoulder/driving lane). The roadworks were located after the section equipped with the CALM-IR transceivers, but as the messages generated by the roadworks were of static nature, they could be transmitted by the preceding IR-transceivers without loss of accuracy / timeliness (more details about the Italian test can be found COOPERS deliverable of IR6200)
For each drivers, two test drives were undertaken in the test, one is with COOPERS in-vehicle information services and one is without. The road section between the tolling station Trento Centro (km 136) to the beginning of the test segment (at km 145) serves as familiarization drive.

COOPERS integrated project
D15 - IR 7100/7200/7300/7400 Report on common result assessment
Page 101 of 191
Figure 4.1: Illustration of the test route and location of the roadworks
The tests were undertaken in February 2010 and 48 people participated in the test driving. During the test, data relating to vehicle performance, driver behaviour and messages received were logged for analysis. Table 4.1 shows list of drivers with their test data being successfully logged.
Table 4.1: List of drivers with logged data
CAN data CAN data OFF ON
Note
001 �� �� �002 � � 003 � � 004 � � 005 � � 006 � � 007 � � �008 � � 009 � � 010 � � ������� ��������� 011 � � 012 � � 013 � � ������� ����������014 � � 015 � � 016 � � 017 � � 018 � � 019 � � �020 � � 021 � � 022 � � 023 � � 024 � � 025 � � �026 � � 027 � � ������� ����������028 � � 029 � � 030 � � 031 � � �032 � � 033 � � 034 � � 035 � � 036 � � 037 � � �038 � � 039 � � 040 � � 041 � � 042 � � 043 � � �

COOPERS integrated project
D15 - IR 7100/7200/7300/7400 Report on common result assessment
Page 102 of 191
044 � � 045 � � 046 � � 047 � � 048 � �
Of the 48 drivers participated in the test, 10 are without CAN data (missing ON/OFF or both). In addition, CAN data recorded were discontinued for three drivers. Only 35 drivers are with both OFF and ON data for analysis.
5.2.2 Speed and acceleration profiles (before/ after)
5.2.2.1 Speed profiles
Results in Table 4.2 show the mean and standard deviation of the speed of the vehicles before they reached RW zone 1 (22.9km). Except for driver 006, 020, and 035, there were no incidents occurred and normal speed restrictions was applied (i.e. 130km/h). For the 32 drivers with normal speed limit of 130km/h, the average of their mean speed in the OFF drive is 125.14 km/h, compared to 123.94 in the ON drive. According to Wilcoxon signed-rank test, the difference in the speeds between the OFF and On drives are not significant (z=-1.32, p=0.18, r=-0.23). Therefore no significant difference were found in mean speeds between the OFF and ON drives.
Table 4.2: Speeds in conditions of no speed restriction
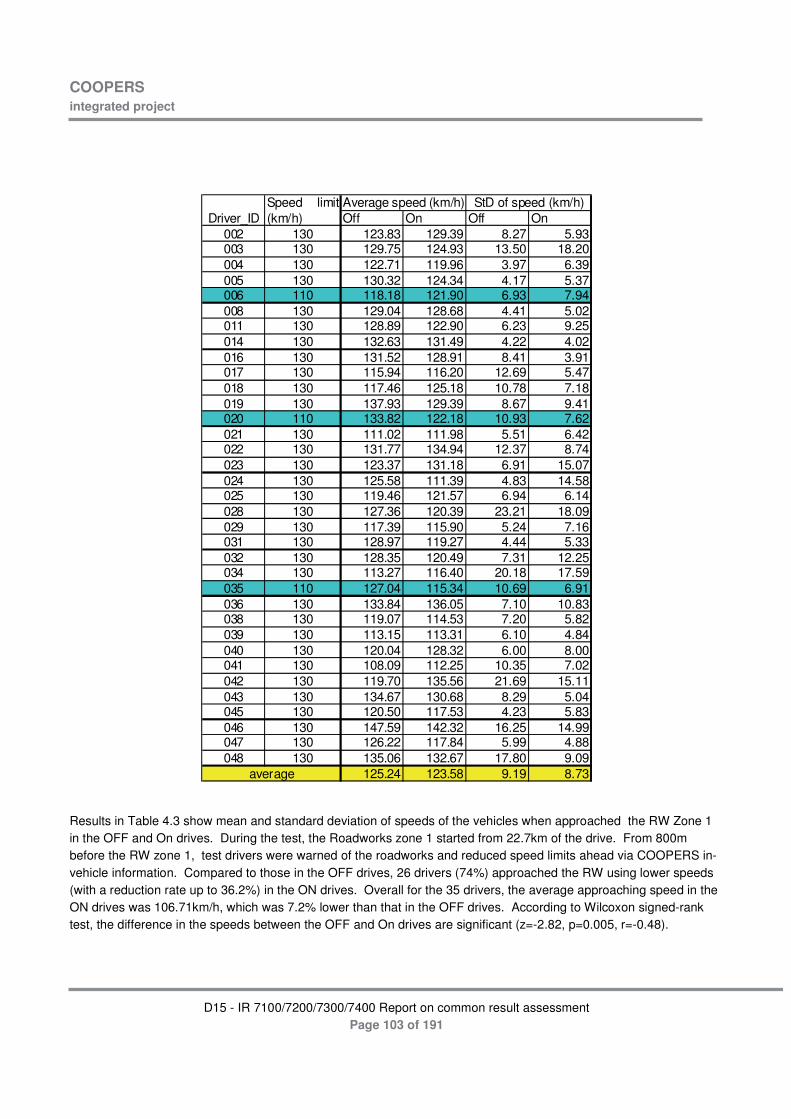
COOPERS integrated project
D15 - IR 7100/7200/7300/7400 Report on common result assessment
Page 103 of 191
Off On Off On002 130 123.83 129.39 8.27 5.93003 130 129.75 124.93 13.50 18.20004 130 122.71 119.96 3.97 6.39005 130 130.32 124.34 4.17 5.37006 110 118.18 121.90 6.93 7.94008 130 129.04 128.68 4.41 5.02011 130 128.89 122.90 6.23 9.25014 130 132.63 131.49 4.22 4.02016 130 131.52 128.91 8.41 3.91017 130 115.94 116.20 12.69 5.47018 130 117.46 125.18 10.78 7.18019 130 137.93 129.39 8.67 9.41020 110 133.82 122.18 10.93 7.62021 130 111.02 111.98 5.51 6.42022 130 131.77 134.94 12.37 8.74023 130 123.37 131.18 6.91 15.07024 130 125.58 111.39 4.83 14.58025 130 119.46 121.57 6.94 6.14028 130 127.36 120.39 23.21 18.09029 130 117.39 115.90 5.24 7.16031 130 128.97 119.27 4.44 5.33032 130 128.35 120.49 7.31 12.25034 130 113.27 116.40 20.18 17.59035 110 127.04 115.34 10.69 6.91036 130 133.84 136.05 7.10 10.83038 130 119.07 114.53 7.20 5.82039 130 113.15 113.31 6.10 4.84040 130 120.04 128.32 6.00 8.00041 130 108.09 112.25 10.35 7.02042 130 119.70 135.56 21.69 15.11043 130 134.67 130.68 8.29 5.04045 130 120.50 117.53 4.23 5.83046 130 147.59 142.32 16.25 14.99047 130 126.22 117.84 5.99 4.88048 130 135.06 132.67 17.80 9.09
125.24 123.58 9.19 8.73
Driver_IDAverage speed (km/h) StD of speed (km/h)Speed limit
(km/h)
average
Results in Table 4.3 show mean and standard deviation of speeds of the vehicles when approached the RW Zone 1 in the OFF and On drives. During the test, the Roadworks zone 1 started from 22.7km of the drive. From 800m before the RW zone 1, test drivers were warned of the roadworks and reduced speed limits ahead via COOPERS in-vehicle information. Compared to those in the OFF drives, 26 drivers (74%) approached the RW using lower speeds (with a reduction rate up to 36.2%) in the ON drives. Overall for the 35 drivers, the average approaching speed in the ON drives was 106.71km/h, which was 7.2% lower than that in the OFF drives. According to Wilcoxon signed-rank test, the difference in the speeds between the OFF and On drives are significant (z=-2.82, p=0.005, r=-0.48).

COOPERS integrated project
D15 - IR 7100/7200/7300/7400 Report on common result assessment
Page 104 of 191
Several reasons could contribute to this including COOPERS in-vehicle information and traffic conditions (e.g. following a slower vehicle). In order to very this, video data are needed to understand the interactions between the test vehicle and the vehicle in front. Although traffic conditions were videoed during the test in Trento, such video data were not available to verify this at the time when this report is being prepared.
Table 4.3: Speed when approaching RW zone1 (-800m)
Off On Off On002 116.66 106.87 5.10 6.43003 121.34 109.44 5.15 3.68004 101.83 103.67 12.20 5.81005 110.90 110.45 8.26 1.76006 115.87 115.23 8.29 3.66008 124.84 114.94 2.40 3.09011 105.78 106.66 2.09 1.13014 131.18 113.08 0.16 2.06016 127.78 122.62 1.84 2.84017 118.39 102.56 3.78 3.44018 121.47 107.53 1.48 5.35019 117.96 117.73 8.14 2.70020 100.27 96.75 10.86 7.49021 102.94 100.82 4.39 11.97022 100.85 100.09 8.70 2.44023 123.75 104.71 0.75 3.60024 109.13 88.77 5.19 3.77025 102.06 111.23 3.75 2.00028 122.15 117.45 5.27 0.69029 101.16 106.57 4.74 1.67031 121.07 93.63 2.58 9.01032 90.57 109.43 2.49 5.71034 102.02 94.38 11.13 8.43035 124.24 99.09 2.94 6.08036 122.03 122.36 4.88 11.21038 111.48 86.65 7.86 3.30039 85.41 104.69 1.00 1.29040 116.43 100.31 0.97 8.90041 84.96 90.32 4.48 2.89042 112.43 134.09 8.04 2.77043 136.36 109.87 1.86 9.42045 114.32 107.59 5.02 1.20046 127.99 124.13 3.33 4.74047 128.80 82.21 2.34 5.66048 131.03 119.06 6.45 2.66
average 113.87 106.71 4.80 4.54
Driver_IDAverage speed (km/h) StD of speed (km/h)
Table 4.4 shows the mean and standard deviation of the vehicle speed within the RW zone 1. Compared to 105.26 km/h in the OFF drives, the average of the mean speed of the 35 drivers/vehicles was 99.96km/h in the ON drives, which show a reduction in speed by 5.0%. In terms of compliance with the reduced speed limits, the ON drives were

COOPERS integrated project
D15 - IR 7100/7200/7300/7400 Report on common result assessment
Page 105 of 191
better than OFF drives According to Wilcoxon signed-rank test, the difference in the speeds between the OFF and On drives are significant (z=-2.72, p=0.007, r=-0.46).
Several reasons could contribute to this including COOPERS in-vehicle information and traffic conditions (e.g. followed a slower vehicle). In order to very this, video data are needed to understand the interactions between the test vehicle and the vehicle in front. Although traffic conditions were videoed during the test, such video data were not available to verify this at the time when this report is being prepared.
Table 4.4: Average speed within RW zone 1
Off On Off On002 113.85 105.50 3.41 6.24003 111.05 113.24 4.81 6.44004 83.25 87.85 7.21 5.35005 99.91 104.60 8.72 4.46006 100.55 105.64 6.71 5.97008 111.44 97.43 4.42 10.16011 102.80 100.24 5.90 2.96014 120.63 114.85 12.45 14.06016 120.55 115.73 4.12 5.55017 108.24 95.60 5.35 3.76018 115.38 98.14 3.59 10.62019 124.36 115.77 4.89 5.40020 97.06 85.01 6.85 5.03021 99.25 85.49 2.11 3.23022 90.95 93.66 5.82 6.47023 115.64 113.82 3.60 14.54024 106.40 89.38 7.25 3.51025 81.72 93.79 7.30 5.64028 115.16 117.83 11.24 4.45029 87.16 84.95 4.22 4.68031 117.66 96.13 3.02 6.98032 112.77 112.78 7.41 6.42034 101.19 89.99 9.07 6.13035 110.18 94.95 5.81 6.45036 113.96 107.85 7.20 6.87038 105.32 78.42 5.98 7.45039 86.61 86.67 3.55 10.68040 98.71 103.10 10.65 5.42041 84.82 91.41 4.87 11.28042 123.42 120.25 20.26 11.92043 89.95 106.17 12.26 11.23045 105.18 103.17 6.81 6.43046 107.74 101.70 9.63 9.56047 110.08 90.97 3.18 10.85048 111.13 96.55 6.05 12.94
average 105.26 99.96 6.73 7.40
Driver_IDAverage speed (km/h) StD of speed (km/h)

COOPERS integrated project
D15 - IR 7100/7200/7300/7400 Report on common result assessment
Page 106 of 191
Figure 4.2 show an example of comparison of speed profiles (driver 002). As can be seen the driver’s speeds were lower in the ON driver than those in the OFF drive when approaching and moving in the RW zone1.
Driver 002
0
20
40
60
80
100
120
140
160
5 6 7 8 9 10 11 12 13 14 15 16 17 18 19 20 21 23 24 25 26 27 28 29 30 31 32 33 34
Distance (km)
Sp
eed
(km
/h)
Speed(off)
Speed(on)
Speed Limit
Figure 4.2: Comparison of speed profiles in the OFF and ON drives
5.2.2.2 Acceleration profiles
Results in Table 4.5 show the mean and standard deviations of accelerations in approaching RW zone. Overall for the 35 drivers, the average of the mean acceleration was 0.33 m/s2 in the ON drivers, compared to 0.32 m/s2 in the OFF drives. According to Wilcoxon signed-rank test, the difference in acceleration between the OFF and On drives are not significant (z=-0.583, p=0.56, r=-0.1).

COOPERS integrated project
D15 - IR 7100/7200/7300/7400 Report on common result assessment
Page 107 of 191
Table 4.5: Accelerations when approaching RW zone 1
Driver_ID Off On Off On002 0.34 0.30 0.24 0.21003 0.33 0.34 0.25 0.25004 0.31 0.23 0.25 0.16005 0.34 0.28 0.24 0.22006 0.30 0.31 0.21 0.21008 0.36 0.43 0.25 0.40011 0.31 0.29 0.22 0.24014 0.37 0.40 0.28 0.27016 0.34 0.43 0.24 0.43017 0.30 0.24 0.21 0.18018 0.33 0.31 0.22 0.24019 0.41 0.40 0.29 0.28020 0.33 0.26 0.25 0.19021 0.23 0.19 0.18 0.15022 0.26 0.32 0.22 0.31023 0.34 0.43 0.24 0.30024 0.30 0.20 0.22 0.15025 0.25 0.29 0.20 0.27028 0.40 0.34 0.30 0.24029 0.20 0.21 0.15 0.16031 0.36 0.36 0.26 0.27032 0.39 0.37 0.29 0.27034 0.31 0.26 0.23 0.21035 0.43 0.43 0.29 0.32036 0.40 0.35 0.31 0.25038 0.28 0.22 0.20 0.17039 0.24 0.25 0.17 0.19040 0.35 0.33 0.33 0.24041 0.23 0.33 0.17 0.23042 0.53 0.52 0.39 0.40043 0.33 0.36 0.28 0.26045 0.30 0.28 0.23 0.21046 0.43 0.35 0.32 0.29047 0.31 0.30 0.23 0.28048 0.34 0.28 0.25 0.23
average 0.33 0.32 0.25 0.25
Average acc StD of acc
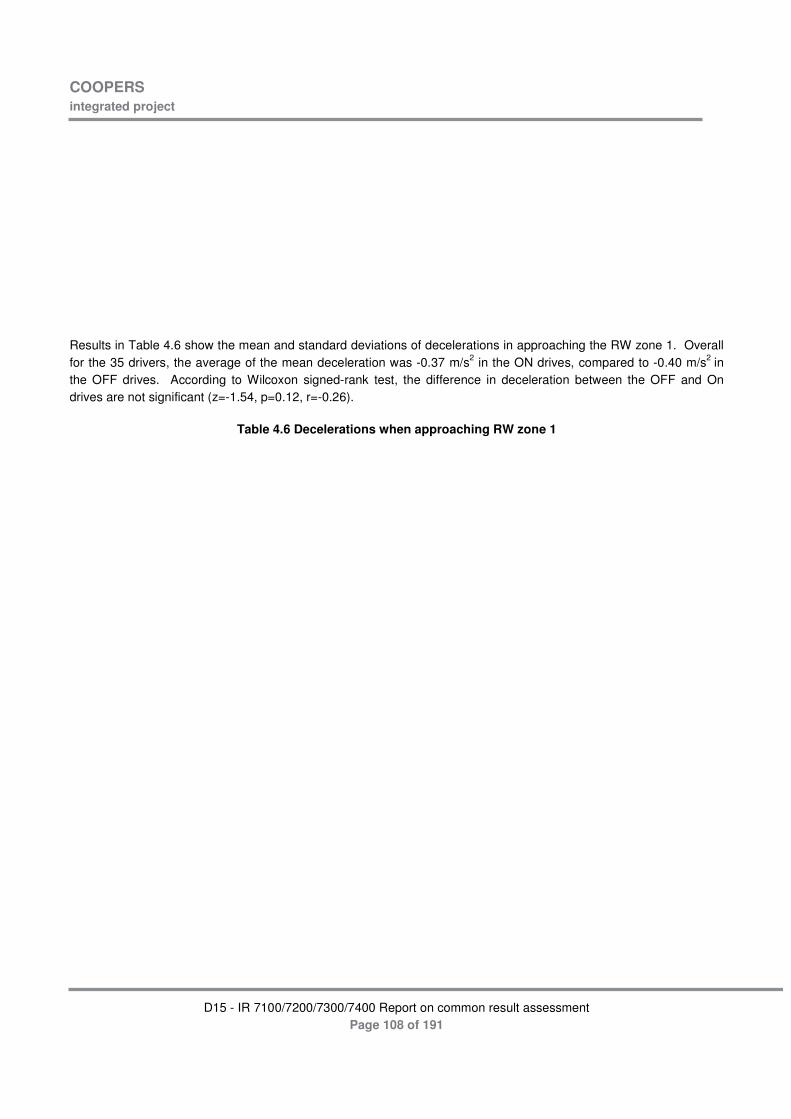
COOPERS integrated project
D15 - IR 7100/7200/7300/7400 Report on common result assessment
Page 108 of 191
Results in Table 4.6 show the mean and standard deviations of decelerations in approaching the RW zone 1. Overall for the 35 drivers, the average of the mean deceleration was -0.37 m/s2 in the ON drives, compared to -0.40 m/s2 in the OFF drives. According to Wilcoxon signed-rank test, the difference in deceleration between the OFF and On drives are not significant (z=-1.54, p=0.12, r=-0.26).
Table 4.6 Decelerations when approaching RW zone 1

COOPERS integrated project
D15 - IR 7100/7200/7300/7400 Report on common result assessment
Page 109 of 191
Average dec StD of decOff On Off On
002 -0.43 -0.47 0.30 0.36003 -0.45 -0.29 0.32 0.24004 -0.54 -0.38 0.37 0.30005 -0.41 -0.32 0.29 0.24006 -0.54 -0.46 0.44 0.42008 -0.39 -0.38 0.31 0.24011 -0.29 -0.31 0.23 0.23014 -0.29 -0.38 0.22 0.29016 -0.40 -0.29 0.31 0.21017 -0.37 -0.29 0.25 0.24018 -0.29 -0.38 0.21 0.26019 -0.57 -0.40 0.36 0.28020 -0.56 -0.37 0.44 0.23021 -0.36 -0.42 0.26 0.37022 -0.41 -0.29 0.26 0.22023 -0.33 -0.37 0.22 0.29024 -0.39 -0.22 0.29 0.17025 -0.29 -0.34 0.21 0.26028 -0.47 -0.30 0.33 0.21029 -0.31 -0.33 0.25 0.28031 -0.35 -0.41 0.27 0.29032 -0.28 -0.40 0.24 0.32034 -0.46 -0.43 0.28 0.31035 -0.50 -0.37 0.40 0.26036 -0.47 -0.57 0.34 0.41038 -0.36 -0.23 0.26 0.16039 -0.19 -0.27 0.14 0.19040 -0.39 -0.46 0.26 0.35041 -0.29 -0.31 0.22 0.22042 -0.63 -0.44 0.60 0.33043 -0.33 -0.44 0.26 0.31045 -0.38 -0.28 0.26 0.20046 -0.43 -0.49 0.36 0.33047 -0.37 -0.51 0.31 0.62048 -0.42 -0.36 0.27 0.33
average -0.40 -0.37 0.30 0.28
Driver_ID
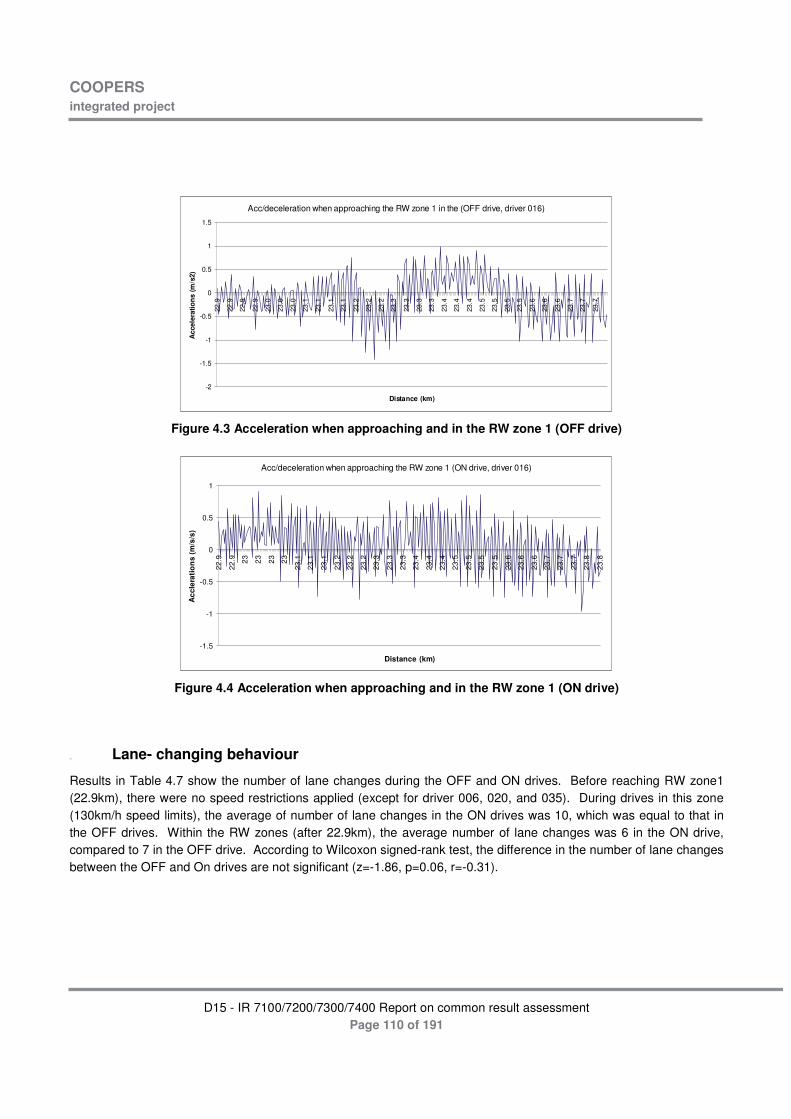
COOPERS integrated project
D15 - IR 7100/7200/7300/7400 Report on common result assessment
Page 110 of 191
Acc/deceleration when approaching the RW zone 1 in the (OFF drive, driver 016)
-2
-1.5
-1
-0.5
0
0.5
1
1.522
.9
22.9
22.9
22.9
23.0
23.0
23.0
23.1
23.1
23.1
23.1
23.2
23.2
23.2
23.3
23.3
23.3
23.3
23.4
23.4
23.4
23.5
23.5
23.5
23.5
23.6
23.6
23.6
23.7
23.7
23.7
Distance (km)
Acc
eler
atio
ns
(m/s
2)
Figure 4.3 Acceleration when approaching and in the RW zone 1 (OFF drive)
Acc/deceleration when approaching the RW zone 1 (ON drive, driver 016)
-1.5
-1
-0.5
0
0.5
1
22.9
22.9 23 23 23 23
23.1
23.1
23.1
23.2
23.2
23.2
23.3
23.3
23.3
23.4
23.4
23.4
23.5
23.5
23.5
23.5
23.6
23.6
23.6
23.7
23.7
23.7
23.8
23.8
Distance (km)
Acc
lera
tio
ns
(m/s
/s)
Figure 4.4 Acceleration when approaching and in the RW zone 1 (ON drive)
5.2.3 Lane- changing behaviour
Results in Table 4.7 show the number of lane changes during the OFF and ON drives. Before reaching RW zone1 (22.9km), there were no speed restrictions applied (except for driver 006, 020, and 035). During drives in this zone (130km/h speed limits), the average of number of lane changes in the ON drives was 10, which was equal to that in the OFF drives. Within the RW zones (after 22.9km), the average number of lane changes was 6 in the ON drive, compared to 7 in the OFF drive. According to Wilcoxon signed-rank test, the difference in the number of lane changes between the OFF and On drives are not significant (z=-1.86, p=0.06, r=-0.31).

COOPERS integrated project
D15 - IR 7100/7200/7300/7400 Report on common result assessment
Page 111 of 191
Table 4.7: Number of lane changes
Off On Off On Off On002 14 14 12 11 2 3003 25 13 11 11 14 2004 15 12 8 6 7 6005 18 13 10 11 8 2006 22 14 9 8 13 6008 21 17 17 10 4 7011 17 16 12 13 5 3014 13 15 4 9 9 6016 20 16 12 11 8 5017 10 18 5 11 5 7018 15 25 11 14 4 11019 22 20 16 10 6 10020 17 15 14 11 3 4021 15 19 9 14 6 5022 18 16 13 12 5 4023 22 13 11 8 11 5024 18 14 12 11 6 3025 18 28 10 18 8 10028 14 12 7 9 7 3029 17 9 12 8 5 1031 29 18 24 16 5 2032 16 14 9 7 7 7034 18 14 10 8 8 6035 26 20 11 9 15 11036 16 22 6 12 10 10038 21 18 12 14 9 4039 8 10 4 7 4 3040 19 27 10 10 9 17041 13 20 10 13 3 7042 8 8 1 1 7 7043 18 22 9 11 9 11045 19 17 8 11 11 6046 22 12 11 9 11 3047 23 14 14 8 9 6048 10 15 5 7 5 8
average 17 16 10 10 7 6
Before RW zonesWhole test drive Within RW zonesDriver_ID

COOPERS integrated project
D15 - IR 7100/7200/7300/7400 Report on common result assessment
Page 112 of 191
Driver 41 (OFF)
-1000
0
1000
2000
3000
4000
5000
5 6 7 7 8 9 10 11 12 13 14 15 16 17 18 19 20 21 22 23 23 24 25 26 26 27 28 29 30 30 31 32 33 34 34
Distance (km)
Lef
t Mar
kin
g(m
m)
Figure 4.5: An example of lane change profile of test drivers (OFF)
Driver 41 (ON)
-1000
0
1000
2000
3000
4000
5000
5 6 7 8 8 9 10 11 12 13 13 14 15 16 17 17 18 19 20 21 22 22 23 24 24 25 26 26 27 28 29 29 30 31 32 33 33 34 35
Distance (km)
Lef
t mar
kin
g (m
m)
Figure 4.6: An example of lane change profile of test drivers (ON)
5.2.4 Combining driver behaviour with physiological measurements
To be completed

COOPERS integrated project
D15 - IR 7100/7200/7300/7400 Report on common result assessment
Page 113 of 191
5.2.5 Combining driver behaviour with user acceptance
In the Trento test, 45 drivers participated in the questionnaire (both before and post). Gender and sex distribution of the participants are shown in Table 4.8:
Table 4.8: Age, gender and sex distributions of the participants
M F M F M F M F M F M F1 F Italian 33 X 25 M Italian 36 X2 F German 42 X 26 M Italian 54 X3 M German 57 X 27 F Italian 35 X4 M Italian 43 X 28 F Italian 35 X5 M Italian 52 X 29 M Italian 37 X6 M Italian 37 X 30 M Italian 34 X7 M Italian 62 X 31 F Italian 25 X8 M Italian 54 X 32 F Italian 56 X9 F Italian 44 X 33 M Italian 39 X10 M Italian 30 X 34 F German 34 X11 M Italian 44 X 35 M Italian 46 X12 36 M Italian 55 X13 M German 59 X 37 M Italian 35 X14 M Italian 30 X 38 M Italian 48 X15 F Italian 52 X 39 F Italian 31 X16 M Italian 42 X 40 M Italian 59 X17 F Italian 30 X 41 M Italian 48 X18 M Italian 43 X 42 M Italian 45 X19 F Italian 43 X 43 M Italian 45 X20 M German 39 X 44 M Italian 59 X21 M Italian 27 X 45 F Italian 34 X22 M German 22 X 46 M Italian 46 X23 M Italian 51 X 47 M Italian 34 X24 F Italian 45 X 48 M Italian 36 X
Id SexLanguage
AgeUser Profile1 2 3 Id Sex
Language
AgeUser Profile1 2 3
A question was asked how the test driver responded to the COOPERS warning about the roadworks ahead. Of the 45 drivers participated in the questionnaire, 32 (71%) answered that they slow down after having received the warning. Table 4.9 show the observed speeds of the test drivers/vehicles when approaching the RW zone 1 and their reported reactions to the COOPERS warning of roadworks ahead (post questionnaire). As can be seen, for most drivers, their slowdown actions were confirmed by the speeds logged in the test.

COOPERS integrated project
D15 - IR 7100/7200/7300/7400 Report on common result assessment
Page 114 of 191
Table 4.9: Approaching speeds to RW zone 1 and reported reactions in the post questionnaire
Off On Changes(%)002 116.66 106.87 -8.4% Slowdown 003 121.34 109.44 -9.8% 0004 101.83 103.67 1.8% Change lane005 110.90 110.45 -0.4% Slowdown 006 115.87 115.23 -0.6% Slowdown 008 124.84 114.94 -7.9% Slowdown 011 105.78 106.66 0.8% Slowdown 014 131.18 113.08 -13.8% Slowdown 016 127.78 122.62 -4.0% Increase alertness017 118.39 102.56 -13.4% Slowdown 018 121.47 107.53 -11.5% 0019 117.96 117.73 -0.2% Slowdown 020 100.27 96.75 -3.5% 0021 102.94 100.82 -2.1% Slowdown 022 100.85 100.09 -0.8% Slowdown 023 123.75 104.71 -15.4% Slowdown 024 109.13 88.77 -18.7% Slowdown 025 102.06 111.23 9.0% Slowdown 028 122.15 117.45 -3.9% Slowdown 029 101.16 106.57 5.3% Slowdown 031 121.07 93.63 -22.7% Slowdown 032 90.57 109.43 20.8% Change lane034 102.02 94.38 -7.5% Slowdown 035 124.24 99.09 -20.2% Slowdown 036 122.03 122.36 0.3% Slowdown 038 111.48 86.65 -22.3% Slowdown 039 85.41 104.69 22.6% Slowdown 040 116.43 100.31 -13.8% Slowdown 041 84.96 90.32 6.3% Slowdown 042 112.43 134.09 19.3% Slowdown 043 136.36 109.87 -19.4% Slowdown 045 114.32 107.59 -5.9% Slowdown 046 127.99 124.13 -3.0% Slowdown 047 128.80 82.21 -36.2% Increase alertness048 131.03 119.06 -9.1% Slowdown
Driver_ID
Average speed (km/h) Answer to the question of how did yourespond to the COOPERS warning ofroadwrks ahead in the post questionaire

COOPERS integrated project
D15 - IR 7100/7200/7300/7400 Report on common result assessment
Page 115 of 191
In the test route, information about the roadworks was provided in multiple ways including COOPERS in-vehicle information services, variable message signs and temporary roadside signs. According to post questionnaire, 25 out of 39 test drivers became aware of the roadwrosk first via the COOPERS in-vehicle information. In terms of timeliness of the message provided, 36 out of 45 drivers agreed or strongly agreed that COOPERS in-vehicle information was provided at a more appropriate timing/location than the roadside signs (fixed or variable).
In answering the question of “Do you believe that the COOPERS message about the roadworks had an effect on your behaviour in handling the situation?”, 29 out of 39 drivers answered “Yes”. In terms of positive effects, 10 out of 29 answered that they perceived some support for decisions that had to be taken in relation to the roadworks informed, and 18 out of 29 drivers answered that they were calmed after receiving the information about the upcoming roadworks beforehand. In terms of adverse effects, only 1 driver reported that he was stressed by the COOPERS in-vehicle information service, and no other negative effects were reported.
In the post questionnaire, divers were asked what features they like most with the COOPERS in-vehicle information services. The following options were provided:
1) Indicate the distance from current driving location to the site of the of hazard/incident
2) Improved clarity of the messages
3) Provide messages at more appropriate timing/locations
4) Both visual and audio messages
5) Other: _____________________________________________
Of the 45 drivers answered the questions, 20 drivers chose option 1, 4 drivers chose option 2, 11 drivers chose option 3, and 10 drivers chose option 4. As can be seen, indicating the distance to the incident site is the most welcome features of the COOPERS in-vehicle information services.
What would you like to recommend for implementation of the COOPERS in-vehicle information systems on motorways? (45 respondents)
0%
65%
31%
4% 1. To replace roadside message signs
2. To complement to roadside variable message signs
3. To implement the roadside and the in-vehicleinformation systems with equal importance
4. Not to implement the COOPERS in-vehicleinformation systems at all
COOPERS integrated project
D15 - IR 7100/7200/7300/7400 Report on common result assessment
Page 116 of 191
5.2.6 Implications for safety and traffic performance
One of the key findings of this analysis is that drivers slowdown early after receiving the COOPERS in-vehicle information. This can be seen an indication of increased awareness and alertness of the event ahead (a key objective of COOPERS services/systems developed and tested). It is expected that driving with COOPERS services/systems will make driver better informed/warned of events ahead and increase safety.
From traffic perspective, drivers in the ON drives were seen better complying with the speed limits than in the OFF drives. If large number of vehicles is equipped with COOPERS systems, it would result in better control of traffic and increase effectiveness of traffic control and management.
5.2.7 Conclusions
During the test in Trento, there were two roadworks along the test route. COOPERS in-vehicle information services were tested on the basis of real event and real messages. Apart from the roadworks, other services were also tested including weather condition warning, and variable speed limits. Analysis reported in this section was focused on test with the roadworks warning and variable speed limits. Based on analysis of the test results, the following conclusions can be drawn:
• In the ON drive, the average speeds were found to be 6.3% and 5.0% lower than those in the OFF drive when the vehicle approached the RW zone and moved in the RW zone.
• In terms of accelerations and decelerations, no significant changes were found between the OFF and ON drives.
• In terms of number of lane changes, no significant changes were found between the OFF and ON drives.
• According to questionnaire results, drivers liked COOPERS services/systems, particularly the feature of indicating distance to the event site warned in the messages provided. No major adverse effects were reported by the test drivers.
Although some reductions in speeds were found in the ON drives in approaching and moving in the RW zones, many factors may contribute to this including COOPERS systems and traffic conditions. For example, the test driver may follow a slower vehicle (more likely in conditions of reduced speed limits). This needs to be clarified by checking with video data which are able to show the presence of the proceeding vehicle. In the Trento test, traffic conditions were videoed (both forward and backward).

COOPERS integrated project
D15 - IR 7100/7200/7300/7400 Report on common result assessment
Page 117 of 191

COOPERS integrated project
D15 - IR 7100/7200/7300/7400 Report on common result assessment
Page 118 of 191
5.3 Berlin
5.3.1 Overview
$������������������������������.�� �+���)���������-�4��)��@�;.��-� ����-��.��4��)�����������������)��������.��������-�$�����)�3�����4���� ���� 8$349���� ���������-� ���/���� ��-��/� ��)����� ���--� � ��-��������� ��� �� "��/� ������ ���--� ����������@�;.������������ .�����.�������5�/�3%&&�������-��.�������-��2������������5�/���������+��5��.��0����%#&@&&&�"�.� )���+�����/���������"���))�)����.��-��0����%$�1�@��
�������� ����� �.�� ���--� � ���������� �.�� .��.5�/� ���
�2��++��� 5��.� ������ ���� ������ ���� ����� )��+��
���� ��7 �))��� ;�C�� 8;��--� � �/�� C��"����)9� 0�����
�����+����"����-��������������/����@���������������
������� ������ -��� ��"���������)� ����� �*���@� ;.��
����)�������-����--� ���������0/����--� ������+����)��
-��� "����0)�� �����)�������� �-� )���� �))� �������
��*������+���������� ����0�)��/��-��)�+������@����
����� �� ������ ����� ����� ���--� � ��-��������� ���
�"��)�0)�� �"��/� &&�@� 3))� ����� ��� �������� �))/�
�����-������ ��� �.�� �;7�/����� �-� �.�� ;��@� � ;.��
;��--� � ������)� �������� 8;��9� ��� 4��)��� 8D�E� ���
���)+�� -���4������0�����DF�E� ���4��)��9�� 2������
���� ���)/��� �.���� ��5� ����� �-� �.�� ���� ����
����"����)� ���--� ������������ �/�����@� ;.�� ;����
8D E7� 4��)��� ;��--� � ���������� ������9� �����
�.�����������0�������� �.��������� �����.�� ���
5��.��.�����5������������@�
Test �������
The overall length of the demonstration route was about 17.100 m1 starting from: AS Seestraße [GPS: 52° 31,5529' | 013° 16,8852'] and ending: AS Gradestraße [GPS: 52° 27,7097' | 013° 24,3846']. Figure 4-2 presents the scheme of the test route with its specifics. There is a construction site [1]:
a. from the beginning of the test drive b. blocked lane in driving direction (from Seestraße to Gradestraße) c. traffic is routed on opposite direction
1 The length was determined by recorded kinematic data of the trial vehicle
Figure 4-1: Overview of the Test Site 3 - Berlin

COOPERS integrated project
D15 - IR 7100/7200/7300/7400 Report on common result assessment
Page 119 of 191
Figure 4-2 : Scheme of test route (in driving direction)
Figure 4-3 : construction site [1] (picture front camera)
Another construction site [2] is in the area of junction AS Kaiserdamm, with a closed junction with no access to and from the motorway.
Figure 23-4 : construction site [2] (picture front camera)
�
5.3.2 Aim and Hypothesis
5.3.2.1 Research Approach
COOPERS integrated project
D15 - IR 7100/7200/7300/7400 Report on common result assessment
Page 120 of 191
The research approach of the Berlin test site laid on the user behaviour analysis, the existing COOPERS services were analysed regarding its effects on road safety and efficiency transport management. Based on several hypotheses how the driver is supposed to react, different assessment objectives have been found. In the field tests these objectives were be analysed by a combined approach. That means different examination methods to collect reliable data were be used. A common data base were allow a driver and time allocation to realize a comprehensive driver behaviour profile. Additionally the focus of the analysis is on user acceptance. With the method of user questionnaire different issues regarding socio economic questions were restudied. Finally a comprehensive overview of the driver behaviour and their respective compliance can be given.
Exemplified following approach was chosen:
Three-Steps
In a first step the research category should be defined. The analysis of the impact of COOPERS services is the main objective. Here the focus should lie on user behaviour and user distraction which leads to the hypothesis:
- Drivers are expected to respond safely when approaching the accident
In a second step the hypothesis were breaked down to following assessment objectives which are defined as following:
- Drivers adjust (reduce) their driving speed when receiving an incident warning
- Drivers adjust (increase) their headway when receiving an incident warning
- Drivers adjust (reduce) their driving speed when approaching the location of an incident (hazard)
- Drivers adjust (increase) their headway when approaching the location of an incident (hazard)
- Drivers increase their awareness level when receiving an incident warning
- Drivers react earlier (immediately) to a request for a lane change
- The number of safety-relevant driving errors decreases
- The driver is focusing the HMI less than 1 sec
- The service presentation is a significant distraction to the driver
- The drivers has the ability to be in full control of the vehicle

COOPERS integrated project
D15 - IR 7100/7200/7300/7400 Report on common result assessment
Page 121 of 191
The third step of the research analysis is the definition of data types which are necessary to test the assessment objectives. A detailed examination of the data is an important for a sufficient evaluation. Following data provide a value for the evaluation:
- Time of event, indication – a time stamp allows the timely comparability
- Speed limit - allows to compare the current speed of the subject vehicle with the allowed speed limit
- Number of lanes – provides information regarding lane changing and speed behaviour
- Distance between lead and subject vehicle – allows comparing the distance behaviour before and after receiving a COOPERS servicing and provides feedback of the type of driver
- Speed of subject vehicle – see above
- Subject vehicle acceleration – allows to provide a statement regarding the acceleration profile and safety relevant feedback
- Subject vehicle break activity – see above
- Vision – is a parameter which is related to the almost all data types
- Reaction time – allows to get feedback on
- Driving violation – provides information regarding mistakes in service presentation and regarding driver profile
- Driving mistake – see above
In this case of the COOPERS approach the tests grasp on different examination methods which covering the wide range of the hypothesis. The vehicle behaviour analysis provides a detailed view on the driver´s activities before and after receiving a COOPERS service. All relevant vehicle parameter were recorded during the tests. The driver observation approach allowed to aggregate the influence of traffic information of the driver behaviour. A second research approach to evaluate certain issues is the questionnaire. With this approach information about the user acceptance can be achieved. Furthermore the vehicle behaviour analysis and the driver observation method can be validated. In the FINAL EVALUATION REPORT IR6400 a detailed description of the evaluation method and the field survey approach is given.
The Berlin research approach was a classical with-and-without-analysis of a selected number of volunteers (also regarding driving experience, age, and sex). The approach of analysing the driver behaviour would be carried out at defined sections and/or just when a message appears. Then an in-depth analysis of 10 sec in advanced and 30 sec after the incoming message has been conducted. A comparison with the test drives without the COOPERS system at the same defined section present tendencies of a driving behaviour but no significant conclusion.

COOPERS integrated project
D15 - IR 7100/7200/7300/7400 Report on common result assessment
Page 122 of 191
5.3.2.2 Analyzing approach
The data recording and storage process needs to be conducted very carefully. The test site data collection structure (see Figure 4-6) is divided in sub-folders regarding the number of drivers which have been surveyed. Every driver received at the beginning a ID and in this regard each single subfolder is labelled. Within the sub-folder another folder shows the primary data from each test driver with all relevant data from the test drive. These data are additionally separated into sub-folder, based on the different measurement method. Based on the primary data the 3-step-approach of the analysis is separated in folder Secondary data.
In Step 1 the first data cleaning and conversation process starts with changing the data format of time as well as the change from the time dependency to the distance dependency. In Step 2 the different profiles of each driver with regard to the research approach has been carried out. In parallel the information from the questionnaire were gathered to validate and compare the ID which each other. The 3rd Step is focusing on a very detailed statistical analysis of the overall number of usable driver sets. The overall useable data set have been 35 test drivers. Due to system failures and traffic situation, several tests drives could not be considered for the analysis. The set of data for the 35 driver show a high quality which allows a first funded statistical analysis.
The information received was then integrated in the current evaluation report.

CO
OP
ER
S
inte
gra
ted
pro
ject
D
15 -
IR 7
100/
7200
/730
0/74
00 R
epor
t on
com
mon
res
ult a
sses
smen
t P
age
123
of
191
Fig
ure
4-5
: F
old
er S
tru
ctu
re a
nd
An
alys
is A
pp
roac
h o
f th
e te
st t
rial
s
P
rob
an
d
CA
N
VID
EO
Qu
es
tio
nn
air
TA
P
Sp
ee
d
La
ne
Pro
file
Dis
tan
ce
Te
st
Str
etc
h
Pro
ba
nd
P
rim
ary
D
ata
PM
E
Ste
p
0-
Org
anis
atio
n of
m
easu
rem
ent
data
in
Se
co
nd
ary
Dri
ve
r P
rofi
les
7 �3
���
����
2�����
;����-���
����
7 ;�������������
��
Ste
p
2
-
7 ��)��
����
��-�
����
����
7 ��
����-���
�����
����
���
�"� ��
�7
��������
�)�3��
)/����
Ste
p
3
-
Ste
p 1
- C
alc
ula
tio
n
Co
nv
ers
ati
on
La
ne
HM
I
Qu
es
tio
nn
air
7 3 �+
���
��

COOPERS integrated project
D15 - IR 7100/7200/7300/7400 Report on common result assessment
Page 124 of 191
5.3.3 General traffic conditions
Considering the general traffic conditions when analyzing the driving behaviour, is a crucial part which allows better a comparison between both drives (with-and-without COOPERS). Figure 4-6 presents three examples of the daily traffic volume on the test stretch between 8:00 a.m. and 8:00 p.m per hour. It is obvious that the number of vehicles exceeds the capacity for free flowing traffic in several hours.
Figure 4-6: Traffic volume per hour
Figure 4-7 gives an overview of the traffic volume of 12 hours on the test stretch at three different days. The average daily traffic load was calculated on the basis of the countered measures regarding the German HBS (Handbuch für die Bemessung von Straßenverkehrsanlagen). Concerning the red lined maximum capacity the data have tob e trated carefully since the motorway A100 is special due to ist high number of intersections within a short distance <1000m (21 on the test strech) and the existing road works on the route.
Considering the both directions for 12h an 24h, there are about 75.000 v/12h on the existing six-lanes, what is approx. 110.000 v/24h. That means, the tests had to deal with a very dense traffic situation and a very high lane occupancy. That is also reflected in the analysis of the driving behaviour of the different volunteers.

COOPERS integrated project
D15 - IR 7100/7200/7300/7400 Report on common result assessment
Page 125 of 191
Figure 4-7: Traffic volume per day (12h)
5.3.4 Speed and acceleration profiles
For the analyzing process it seemed adequate to divide the test stretch into 14 different sections. This approach allows to realize a better detailed view of the data and avoids falsifications. In the sections 1, 2 and 3 two constructions sites are situated. Therefore the speed values are reduced than in the following sections. The section 14 contains finally the exit of the test site. Normally the driver reduced the speed and keeps the first lane to turn into the exit lane. That value was not considered in the comprehensive analyzing.
Table 4-1: Overview Section Partition
Sec 1
Sec 2
Sec 3
Sec 4
Sec 5
Sec 6
Sec 7
Sec 8
Sec 9
Sec 10
Sec 11
Sec 12
Sec 13
Sec 14
Length in m
1720
1040
1570
1620
940 1480
1220
1430
1020
1390
1270
1160
1100
140
Figure 4-8 presents the average speed profile of the driver with COOPERS system on and off.
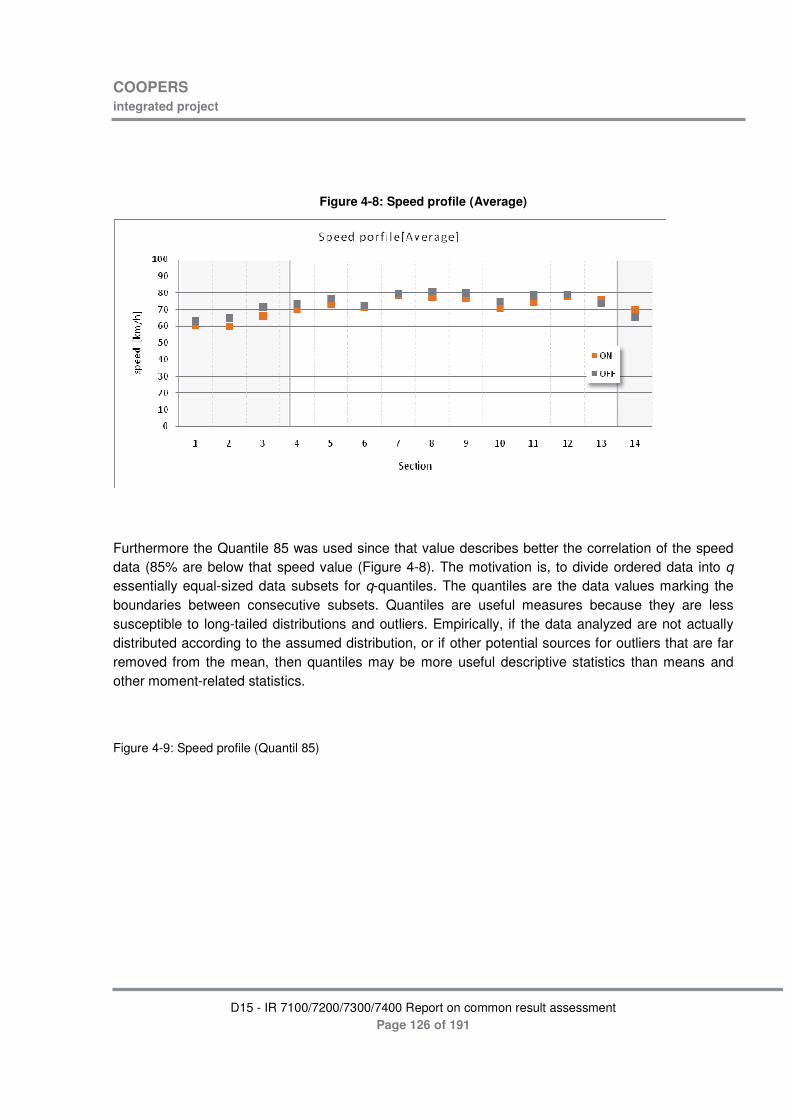
COOPERS integrated project
D15 - IR 7100/7200/7300/7400 Report on common result assessment
Page 126 of 191
Figure 4-8: Speed profile (Average)
Furthermore the Quantile 85 was used since that value describes better the correlation of the speed data (85% are below that speed value (Figure 4-8). The motivation is, to divide ordered data into q essentially equal-sized data subsets for q-quantiles. The quantiles are the data values marking the boundaries between consecutive subsets. Quantiles are useful measures because they are less susceptible to long-tailed distributions and outliers. Empirically, if the data analyzed are not actually distributed according to the assumed distribution, or if other potential sources for outliers that are far removed from the mean, then quantiles may be more useful descriptive statistics than means and other moment-related statistics.
Figure 4-9: Speed profile (Quantil 85)

COOPERS integrated project
D15 - IR 7100/7200/7300/7400 Report on common result assessment
Page 127 of 191
Figure 4-9 represents a driver example which makes the minor difference to the quantile obvious. In Figure 4-10 the absolute difference between the average and the quantile can be seen.
Figure 4-10: Example of Speed profile of ID 16 and total speed quantile.

COOPERS integrated project
D15 - IR 7100/7200/7300/7400 Report on common result assessment
Page 128 of 191
Figure 4-10 shows the minimal deviation between the speed profile with and without COOPERS. Since both values are close together the quality of data is approved. The deviation is calculated by the speed with system on minus speed with system off.
Figure 4-11: Absolute difference between average and quantile 85
To get an overview of the range of speed deviations within the different day-times, Figure 4-11 presents the quantile 85 speed with regard to the time of the conducted test trials.
Figure 4-12: Speed profile in correlation with daytime
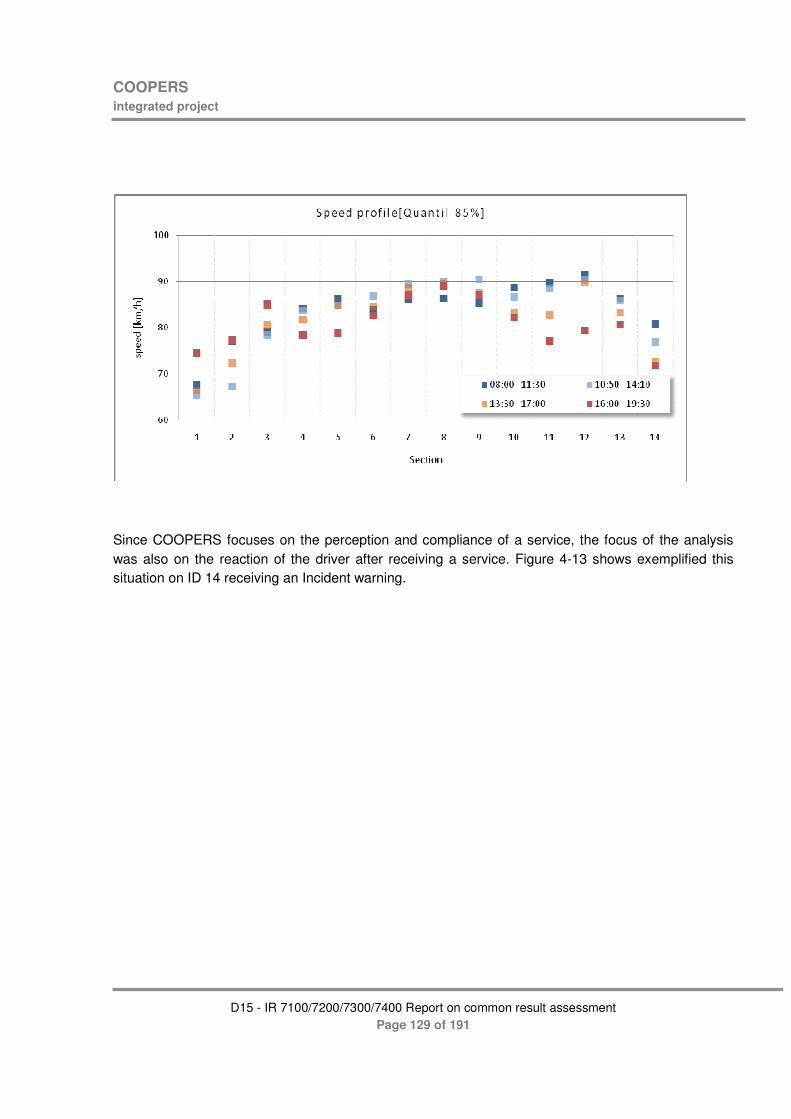
COOPERS integrated project
D15 - IR 7100/7200/7300/7400 Report on common result assessment
Page 129 of 191
Since COOPERS focuses on the perception and compliance of a service, the focus of the analysis was also on the reaction of the driver after receiving a service. Figure 4-13 shows exemplified this situation on ID 14 receiving an Incident warning.

COOPERS integrated project
D15 - IR 7100/7200/7300/7400 Report on common result assessment
Page 130 of 191
Figure 4-13:
&
%&
&
�&
�&
�&
&
$&
!&
#&
%&&
%@�&& %@&& %@$&& %@!&& %@#&& %$@&&&
�+�����G1�,.H
����� ��G�H
�+����+ �� - � )� ��- � ����� ������� ��"� ��%
�
���
���"� � �++����
In Figure 4-14 the speed with COOPERS is remaining after the incoming message. After 1 km the proband has reduced its speed to 10 km/h. There is no clear indication of reaction assigned to the message displayed at the HMI.
Figure 4-14: Speed profile after incoming Service 1a (Incident Warning)
&
%&
&
�&
�&
�&
&
$&
!&
#&
%&&
%&@�&& %&@$&& %&@#&& %%@%&& %%@�&& %%@�&& %%@$&& %%@#&&
�+�����G1�,.H
����� ��G�H
�+��� �+ �� - � ) ���- � ���� � ������� �� "� ��% �
����"� � �++����
���--� �2��)��/� )�5

COOPERS integrated project
D15 - IR 7100/7200/7300/7400 Report on common result assessment
Page 131 of 191
5.3.4.1 Sample test
As a consequence of the minor changes it is recommend proofing both samples (ON / OFF) of driving behavior on significance of speed deviation. Therefore a “T-Test with dependent samples” is chosen. The 35 valid kinematic data are available for the comparison (normally distributed samples can be assumed, limit: >30). Not included in the tests were inconsistent data (i.e. system failure, only the test drive with COOPERS is recorded, but not the test drive without COOPERS). It is not possible to create a value pair and therefore the data of that driver ID were not included in the sample analysis. The chosen 35 valid samples depend on each other, because every driver participated on both samples. Every driver runs the test drive with Coopers as well as without Coopers. Two hypotheses were posted:
�@ �/+��.�����&���� .�����������"����0�.�"����8�+����0�.�"���9�0��5����� ��"��������� ��"���������@�b. �/+��.�����%���.�����������"����0�.�"������%�=��&�����H0 < w. That means if t is smaller than the
critical value, than H0 (or H0 may not objected). As a results Table 4-2 presents clearly the received values. Even the variances with system on are higher than with system off.
Two-sample test for depended samples (paired comparison test) were conducted.
Table 4-2: Statistical Analysis
OFF ON
Average 73,1343278 70,7662574
Variance 33,6339764 46,4291114
Number of observations 35 35
Pearson Correlation 0,33594224
Hypothetical deviation of averages 0,95
Degree of freedom (df) 34
t-Statistic 1,14684672
P(T<=t) one-lateral 0,12972592
Critical value for unilateral t-test 1,6909242
COOPERS integrated project
D15 - IR 7100/7200/7300/7400 Report on common result assessment
Page 132 of 191
P(T<=t) bilateral 0,25945184
Critical value for unilateral t-test bilateral t-Test 2,0322445
Cause of t = -2,293 < t(0,950; 35) = 1,14 the hypothesis 0 has to be accepted. The t-statistic is far under the critical value for a significant data set.
5.3.4.2 Summary
Summarizing the speed profile analysis of the tests with and without COOOPERS system, minor changes of about 5km/h between test drives are recognizable. Most parts of the test stretch with a reduced speed of 2 km/h instead of test drives without COOOPERS. For a more precise analysis, both statistical values (average and quantile) were considered within that analysis. Only minor deviation between average and quantile values could be determined. That shows the authenticity of the speed data.
Finally no major differences between both test situations can be revealed. The detailed analysis of the compliance regarding the services added no significant results. There is no evidence for a changing in driving behavior.
5.3.5 Lane behavior
The approach of a standardized lane behavior describes the behavior of the vehicle within the lane. A camera system continuously detects the lane marking in front of the vehicle. So the lane width and the distance of the vehicle to the side lines can be detected. More information regarding the measurement system applied to the vehicle can be gathered from FINAL EVALUATION REPORT IR6400.
The standardisation allows to compare one test run to other test runs. The values oscillate around 0,5 (value 0,5 = middle of the lane). The extreme values are lane changes. The safety relevant zone is defined in the German Guideline RAA (Guideline for the design of motorways). To the left and to the right marking 0,25 m/each should be available. That means, if there is a lane width of 3,5 m – 1,8 m (car) – 0,25 m (left side) – 0,25 m (right side), the overall width to balance irregularities like curves etc. is about 1,2 m. The driver reaches the safety critical zone, if the test vehicle enters the 25 cm to the side line. Then the lane behaviour is safety critical as a driving mistake occurs. Figure 4-15 presents the lane profile of the median during the on-off-tests. There is no significance in the change of lane behaviour between both situations remarkable.

COOPERS integrated project
D15 - IR 7100/7200/7300/7400 Report on common result assessment
Page 133 of 191
Figure 4-15: Lane behavior
&�&
&�%
&�
&��
&��
&��
&�
&�$
&�!
&�#
%�&
% � � � $ ! # %& %% % %� %�
)���
�����
*�G�H
�� ����
I��� �0�.�"��� � G �����H
� ���
������ ��������� 6�� ����
�� ���� �) )������ ����
The secondarily conducted analysis with the Average showed the same characteristics of the Median. The comparison with the average had no additional value for the analysis.
Figure 4-16: Lane Deviation
7&�
7&�%
&�&
&�%
&�
% � � � $ ! # %& %% % %� %�
)���
�����
*���
"������
�� ����
I��� ���"������
�����
3"�����
������ ��������� 6�� ����

COOPERS integrated project
D15 - IR 7100/7200/7300/7400 Report on common result assessment
Page 134 of 191
Since the lane behavior also includes the number of lane changes, one part of the analysis focused on the difference of both situations. Figure 4-17 presents the number of lane changes depending on the test trial with-or-without-COOPERS system. As a result no clear difference can be observed.

COOPERS integrated project
D15 - IR 7100/7200/7300/7400 Report on common result assessment
Page 135 of 191
Figure 4-17: Number of Lane Changes
5.3.5.1 Summary
Summarizing the conducted analysis, no difference between both rides could be found. Driver with COOPERS-on drive not safer or changing the lanes less than drivers without a system.
5.3.6 Distance behavior
Generally, the compliance of the safety distance along the city motorway in Berlin is very uncommon. That is due to the very dense traffic condition. The analysis of the safe distance is therefore aligned to difficulties which allow not a clear statement regarding the behaviour after receiving a COOPERS message. The expected objective of the COOPERS services should have been that the test drivers enlarge their distance to the vehicles in front of the test car after receiving the service.
For the analysis, data of driver who were partly involved in a traffic congestion were only considered outside this situation. For the behaviour analysis a length of 250 m before ( 11,25s by 80 km/h) and 750 m (33,75s) after the event was focused on. That is a total time of 45s of considered data of one test driver.

COOPERS integrated project
D15 - IR 7100/7200/7300/7400 Report on common result assessment
Page 136 of 191
General information about the graphs:
At the position of the red line the COOPERS service is received and displayed whereas the bright blue dotted graph shows the distance which 85 percent of the drivers which have an object in front of their vehicle.
The blue short lined graph shows the distance of 50 percent of the drivers which have an object in front of them.
The blue short lined and dotted graph shows the average distance of the test drivers to the object in front of the test vehicle.
Because of the field recognition of the LIDAR and of the curves on the test stretch some of the graphs are broken for a small period of time, an example is shown at the graph of driver 15 during the COOPERS service 3.

COOPERS integrated project
D15 - IR 7100/7200/7300/7400 Report on common result assessment
Page 137 of 191
Figure 4-18: Distance behavior after incoming service
Figure 4-18 shows the behavior of test driver number 8 and the general graphs (distance_85, distance_50, average distance) of all drivers. The distance to the vehicle in front enhanced but at the same time the speed of the subject vehicle remains the same. That means, obviously the vehicle in front enhanced its speed.
Considering the fact that it is not possible to give clear information when all drivers have passed the Incident (because every COOPERS service of every driver is different to the service of another driver (length, distance to event and so on), it is just possible to have a look on the behaviour and distance profile after receiving a message.
According to the blue graph (average distance of all drivers) there is no significant change of the distance. In fact the contrary situation is observable: the average distance reduces after the service is displayed. This may be caused by the small number of test driver which had the COOPERS service 1 event. With regard to the average speed (black graph), no significant difference can be seen after receiving the message.
Figure 4-19: Distance profile ID 14 and 15 – Service 1a: Incident Warning

COOPERS integrated project
D15 - IR 7100/7200/7300/7400 Report on common result assessment
Page 138 of 191
This graph shows the behavior of two different test drivers. Test driver number 14 (dark grey graph) starts enhancing the distance to the vehicle in front before the COOPERS service is displayed. After receiving the COOPERS service the safe distance enhanced further.
Test driver number 15 (bright grey graph) is approaching another vehicle before the service is displayed. Then, the Lidar lost the focused object, which is shown on the deep falling distance whereas the grey graph brakes at 200m. The reason might be a curve where the vehicle in front is not in the field of the LIDAR anymore.
According to the graph of the average distance there is no change of the distance to the vehicles in front before and after the message is displayed.
Figure 4-20: Distance profile ID 6 – Service 6: Congestion Warning
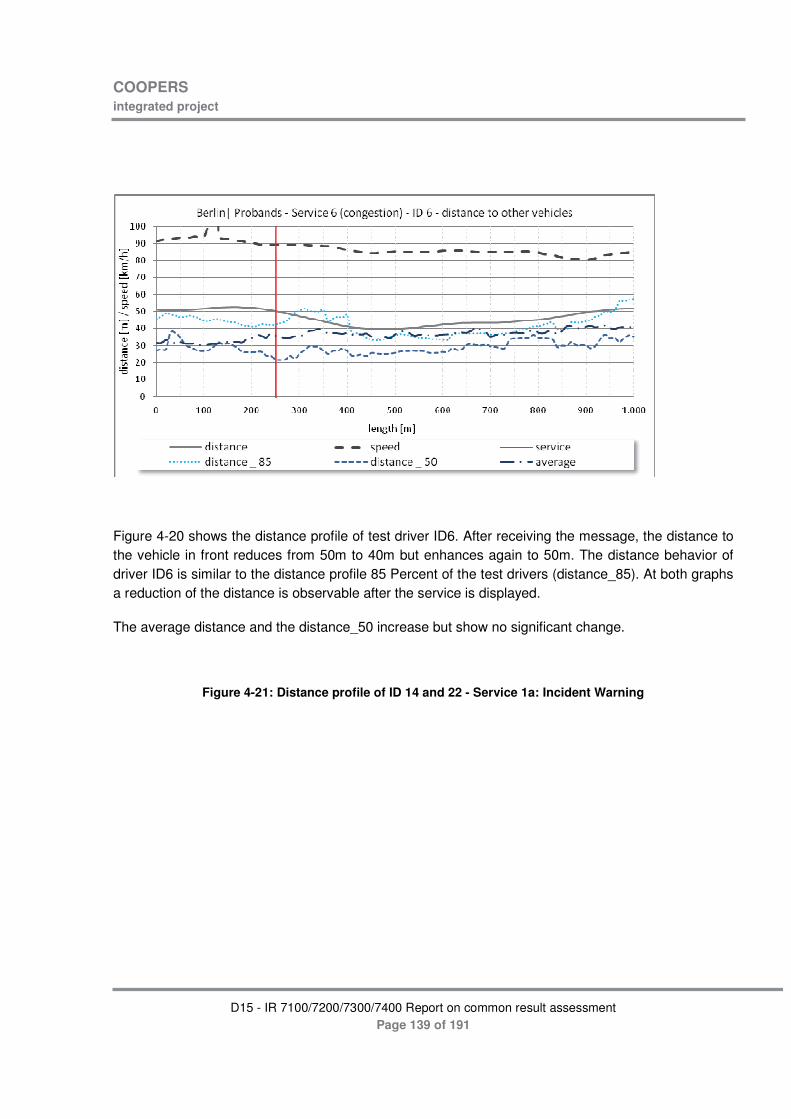
COOPERS integrated project
D15 - IR 7100/7200/7300/7400 Report on common result assessment
Page 139 of 191
Figure 4-20 shows the distance profile of test driver ID6. After receiving the message, the distance to the vehicle in front reduces from 50m to 40m but enhances again to 50m. The distance behavior of driver ID6 is similar to the distance profile 85 Percent of the test drivers (distance_85). At both graphs a reduction of the distance is observable after the service is displayed.
The average distance and the distance_50 increase but show no significant change.
Figure 4-21: Distance profile of ID 14 and 22 - Service 1a: Incident Warning

COOPERS integrated project
D15 - IR 7100/7200/7300/7400 Report on common result assessment
Page 140 of 191
The Figure 4-21 shows the behavior of two test drivers, whereas test driver number 14 (dark grey graph) is a negative example and shows that the COOPERS service doesn’t influence the behavior significantly. The distance to the vehicle in front reduces after the service is displayed (200m).
Test driver 22 (bright grey graph) is a positive example because of the enhanced distance after receiving the COOPERS service. The distance_85 graph shows that the distance to the vehicle in front reduces after the service is shown; this might be caused by the traffic situation in Berlin. The average distance of all drivers shows no significant change after receiving the COOOPERS service. The distance is between 35 and 40 meters before and also after the service.
5.3.6.1 Summary
There is no significant change of the distance behavior before and after the service is displayed. Some of the drivers are positive examples for showing the system objective (influence the driver) but some of the drivers show exactly the opposite behavior.
With regard to the distance_50 of the analyzed COOPERS services, there is no evident change in the driving behavior with-and-without the system.
The analysis of the distance_85 value of COOPERS S1a and COOPERS S3 showed no clear change in the distance behavior. Instead COOPERS S6 and COOPERS S1b the distance_85 reduces after the service is displayed.
COOPERS integrated project
D15 - IR 7100/7200/7300/7400 Report on common result assessment
Page 141 of 191
One reason might be the traffic situation in Berlin. Because the traffic situation on the motorway is often partly bounded and distances which represent the half speedometer safe distance are used by other drivers to change their lane.
5.3.6.2 Summary Statistics
;����"������"��"��5��-� �.�� ��-������������.�����-�����.������)��� ��0)���7����"������������� �)� �����.�� ����� �.��
�))� ������ �-� �������� ���� ���� ����)� ����� �� ������� �+���� ���� )���� +��-�)�@��--������ �������� �)� "�)����5����
�������������+���-�+����0)���������� �)�"����� ��@�;.�������������������� �"�)�����+���������.��.��.���.�)-��-���
���+)��-�����.��)�5���.�)-@��

CO
OP
ER
S
inte
gra
ted
pro
ject
D
15 -
IR 7
100/
7200
/730
0/74
00 R
epor
t on
com
mon
res
ult a
sses
smen
t P
age
142
of
191

CO
OP
ER
S
inte
gra
ted
pro
ject
D
15 -
IR 7
100/
7200
/730
0/74
00 R
epor
t on
com
mon
res
ult a
sses
smen
t P
age
143
of
191
Tab
le
4-3:
O
verv
iew
S
tatis
tics

COOPERS integrated project
D15 - IR 7100/7200/7300/7400 Report on common result assessment
Page 144 of 191
5.3.7 Combining driver behavior with physiological measurements
5.3.8 Combining driver behavior with user acceptance
The analysis of the questionnaires (chapter 2: User Acceptance) illustrate that the expectations towards the COOPERS system were very positive but the COOPERS system could not predominately meet the test driver’s expectations. These results in a driving behaviour which did not changed significantly. The participants experienced COOPERS but could not realize additional value of the system functionality. There is no evidence in speed reduction, the number of lane changes or critical behaviour within a lane. Also the distance profile did not show clear difference between driving with-and-without the system. This negative rating is based on several categories of reasons, from which
A.Traffic Condition
B. Quality of HMI
C. Quality of the messages/service
are the essential ones. Positive statements were made regarding perceived usefulness. The volunteers found, that they can better conform to traffic rules with the system than without. They additionally felt better informed about the road condition. Although the system was lacking in quality and design, test drivers still found the COOPERS system clear and understandable and easy to use.
�������J�����.����-��������K�����.�����-�����.��2�������������������.��2���������"���������.��+���� �+������*+� ������5��������"���"����)����������0��0��������-�������0�����.�����--� ����������������������.���+�������@���� ����.���/�����-�� �����)��/������.���+� ��)����--� ���������������.��4��)��������5�/� ��)������ ��"�� ���.��+���� �+����@�3� ���������)/���+��"�������-��.��2��)��/�������0���������+����������.��.������������5�/��5��.�����)��������0����-����"� ������ �� ��)�-����.���� �����-� �7�+�����"���/�����@�
5.3.9 Implications for safety and traffic performance
Since COOPERS has no significant effect on driving behaviour, it is difficult to demonstrate an impact regarding safety and traffic performance. Hence, minor changes could be detected between both situations although not all drivers showed the expected behaviour. Table 4-4 summarizes the proof of the set aim and hypothesis. As stated in the former sections the research goals and its hypothesis could not be verified.

COOPERS integrated project
D15 - IR 7100/7200/7300/7400 Report on common result assessment
Page 145 of 191
Table 4-4: Summarized implications for safety and traffic performance
�/+��.�����3�����������06� ��"��
���� ����� ����������������-� �� ��
���������
Drivers adjust (reduce) their driving speed
�+����)��� ��� �
Drivers adjust (increase) their headway
����� �������������B��+����)���
��� �Increasing awareness/alertness of the congestion ahead in order to enable drivers to approach the road sections more safely
Drivers increase their awareness level
- Speed limit
- Distance between lead and subject vehicle
- Speed of Subject Vehicle
- Subject vehicle acceleration
- Subject vehicle break activity
- Reaction time
��)���-��2��� /������/��"������
;0 � �
Drivers adjust (reduce) their driving speed when receiving an variable speed limit information
�+����)��� ��� �
Drivers comply better to variable speed limits
����� �������������B��+����)����(�������������
��� �
Variable Speed limits informs drivers of the start and end of limit zone in a more timely way
The variance in the recorded speed profile is lower
- Speed limit
- Distance between lead and subject vehicle
- Speed of Subject Vehicle
��)���-��2��� /������/��"������
;0 � �
Drivers are expected to
Drivers adjust (reduce) their
�+����+��-�)�B�3 �)��������+��-�)��
�+����)��� ��� �
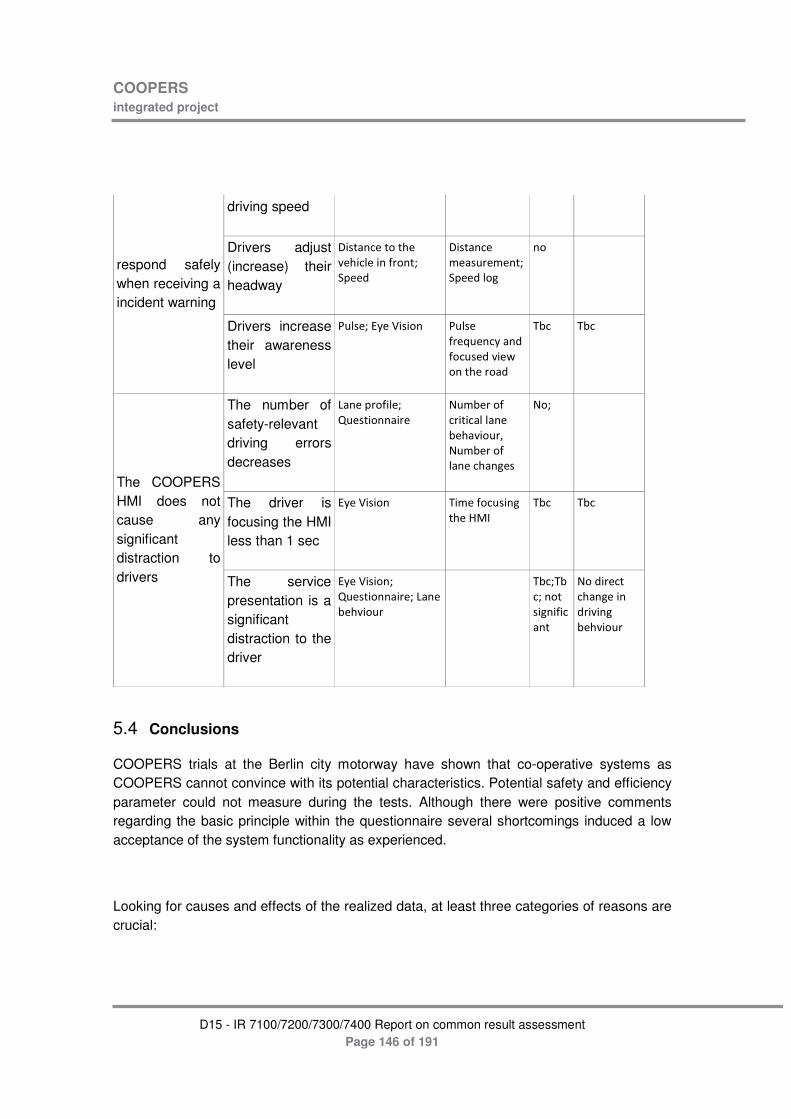
COOPERS integrated project
D15 - IR 7100/7200/7300/7400 Report on common result assessment
Page 146 of 191
driving speed
Drivers adjust (increase) their headway
����� ������.��"�.� )�����-����B��+����
����� �������������B��+����)���
��� �
respond safely when receiving a incident warning
Drivers increase their awareness level
��)��B��/��D������ ��)���-��2��� /�����-� �����"��5�����.�������
;0 � ;0 �
The number of safety-relevant driving errors decreases
I����+��-�)�B�(�������������
��0����-� ���� �)�)����0�.�"��������0����-�)���� .������
�B�� �
The driver is focusing the HMI less than 1 sec
�/��D������ ;����-� �������.��� ��
;0 � ;0 �
The COOPERS HMI does not cause any significant distraction to drivers The service
presentation is a significant distraction to the driver
�/��D�����B�(������������B�I����0�."�����
� ;0 B;0 B����������-� �����
������ �� .�����������"����0�."�����
5.4 Conclusions
COOPERS trials at the Berlin city motorway have shown that co-operative systems as COOPERS cannot convince with its potential characteristics. Potential safety and efficiency parameter could not measure during the tests. Although there were positive comments regarding the basic principle within the questionnaire several shortcomings induced a low acceptance of the system functionality as experienced.
Looking for causes and effects of the realized data, at least three categories of reasons are crucial:

COOPERS integrated project
D15 - IR 7100/7200/7300/7400 Report on common result assessment
Page 147 of 191
3@ ;��--� ������������The special traffic conditions on test site Berlin A100 with its very high traffic density, its road works and additionally the already existing VMS, have a essential effect on the driver behaviour.
Drivers are much more concentrated on the traffic, than on the HMI to avoid risky situations. The driver is forced to “swim” within the traffic flow. A clear reduction of speed and/or changes of lane are very limited. In most of the cases no clear independent driving option was available. Additional the speed limit is predominately at 80 km/h. The observed minor speed difference between COOPERS on/off may also be a consequence of the first time experience of the system (HMI). That means the behaviour is not caused by incoming services but rather a consequence of the test assignment (1. The task of the proband: “look at the HMI” 2. Questions/facts in the pre questionnaire will be unconsciously compared with the real system).
B. Quality of the messages/service
Most of the incoming messages contain the same service or information on the Berlin demonstratoin site. That is caused by the special road infrastructure and road sensor equipment for each VMS-bridges (high number of 44 vm´s !) which is corresponding also to the current situation of installations on the route.
There is no additional information or recommendation, which forces the volunteers to pay more attention to a significant driving action.
Most of the messages contained the service Incident Warning, because of dense traffic. Additional services were Road Work information and Travel Time information.
However, the possibility of a raised awareness level exists but could not be significantly validated in the analysis.
C. Quality of the HMI
While concentrating on the traffic situation respectively driving assignment, and a high number of similar messages during one drive most of the appearing messages are not or later recognized. The missing oral information makes it difficult to assign a COOPERS service to a special behaviour or reaction by the driver. Additionally most of the volunteers own navigation devices and are familiar with the functionality and options. They expect from new systems the same functionality as for already existing systems. Most volunteers noted during the tests missing features of that device. That statement can also be consulted in the results of the user acceptance part.

COOPERS integrated project
D15 - IR 7100/7200/7300/7400 Report on common result assessment
Page 148 of 191
6 Recommentations on safety legislation
6.1 Introduction
This is part of the work of COOPERS, an integrated project funded by the European Commission under the 6th Framework Programme. The key objective of COOPERS is to make road traffic safer, more predictable and more controllable in terms of the individual driver behaviour through development and implementation of co-operative services.
This report presents the key results of COOPERS SWP7600. The main objective of SWP7600 is to analyse the results of the studies and the demonstration and will - on the basis of existing European road safety legislation and safety standards – make recommendations that enable the introduction of safety technology in a way that is in the interest of all stakeholders, including the road users, the road operators and the automotive industry.
This report focuses on identification of barriers for introducing the COOPERS system, especially on the following three aspects
i. Liability and institutional issues
ii. Privacy and data ownership
iii. Distraction and information overload
6.2 Liability issues with introduction of I-V cooperative systems
6.2.1 Introduction
It can be seen that the scope of work of this topic area is wide. In this report we have sought to address as many aspects of our work plan as possible, given the time available and the progress that has been made in the technical sub-projects which has a significant bearing on the work on risks and liability. Due to different time constraints, mainly caused by delayed demonstrations, the results of this report are predominately focused on literature research.
6.2.2 Potential Impacts of I-V cooperative systems on liability
6.2.2.1 Findings from other studies
A first trial of mapping the liability exposure of stakeholders involved in I-V cooperative system has been made, using specific use cases as a base. It is necessary; however, to research the area of individual stakeholder liability in more depth to ensure that all stakeholders have been addressed and that, as far as possible, all aspects of joint and several liabilities are researched.

COOPERS integrated project
D15 - IR 7100/7200/7300/7400 Report on common result assessment
Page 149 of 191
The results of the CVIS liability analysis [1, p.21] have been taken into account and need not be repeated. Though, to present the distinction made a short overview seems appropriate. CVIS identified a number of risks and threats which range from crucial to negligible risks but the benefit of it is that it contains all the risks identified.
The Inventory of Significant External Risks and Threats ([1], Appendix 4) captures the main areas of risk as being related to:
� Cost � Data ownership and Privacy issues � Poor Business/Deployment Planning � Human Machine Interface (HMI) � Political Legal/Regulatory � Security � Environmental � External Technology � Criminal Acts The Costs category is of significant importance. For system implementation it is imperative that costs need to be transparent, warranted, cost-effective and affordable, not only during the implementation phase but also beyond in the operation to the end-user.
The category Data ownership and privacy issues reflects one of the most important issues in co-operative systems. Considering the transfer and storage process of co-operative systems it is clear that a mass of data will be generated which will include personal information. That means, if the system aims at a successful implementation, the data handling has to be organized carefully. The access to the vehicle specific information and, what is more important, the data fusion of vehicle and personal data which allows tracking and tracing needs to be clearly regulated and protected. Otherwise that would undoubtedly assist enforcement agencies and insurers to determine the activities leading up to an accident and assist in determining fault. The deployment of a mass market product could then be limited.
The Poor Business/Deployment Planning category is rated by the CVIS project with the largest number of controls or actions to reduce massive risk of failing. Creating a valid business plan for co-operative systems and a business case for potential actors and stakeholders is most important to overcome potential deployment barriers.
Another category of risks and threats is the processing of data and its transfer to the driver, called HMI issues. That is an important issue since the system must be user-friendly and reliable by providing useful and appropriate information to the driver. The user must be sure of the reliability in a way that enables him/her to act upon it and not be confused by it. COOPERS applications are being developed to increase road safety and provide information and recommendations to the driver to support informed decisions. Inconsistent or unstructured information would confuse and overload the driver and potentially lead to an accident.
The legal and regulatory risks focus closely on the need for transparency of the legal liabilities attaching to the various stakeholders. For successful implementation a user friendly political

COOPERS integrated project
D15 - IR 7100/7200/7300/7400 Report on common result assessment
Page 150 of 191
framework is crucial. Potential deployment barriers like political risks through changed political goals have to be reduced to a minimum by contractual arrangements. These are being effected between road operators and the private sector as well as guarantees from the political site to ensure that each party carries out its relevant commitments to bring the system to the market.
Security of the system will need to be ensured and robust stress testing will need to be undertaken to prevent criminal acts such as terrorism, sabotage, blackmail, extortion and data hacking. If any of these acts were to affect co-operative systems like COOPERS, public confidence in the system would be shaken and might significantly slow down or even stop deployment.
Additionally the environmental risk or impact of any new product or system needs to be considered and monitored, including its power consumption. Though, the impacts of new systems often do not have a direct influence on the environment.
Finally, any of the above-mentioned significant external risks and threats could, if left unaddressed, create a potential risk for a successful market roll out. But considering the list of risks and threats, it is a snapshot of the current analysis which can change as a result of existing risks being minimized or disappearing or as a result of new risks being identified after the demonstration. Consequently, the risk analysis needs to be continually monitored and updated.
6.2.2.2 Findings from COOPERS
6.2.2.2.1 Identifying Stakeholders
The liability issues within COOPERS play an important role in identifying external risks and threats to deployment and ensuring that any significant risks are mitigated or eliminated during or beyond the project lifetime. It is important that the demonstration results bring insight into risks which are related to deployment and especially the operation after market rollout. Therefore an analysis beforehand is crucial to identify possible stakeholders and try to realise a risk allocation.
Possible stakeholders have already been identified within the project work package 2600/2700. A distinction was made between public and private organizations actively involved into the provision of a COOPERS service. The extent of involvement in the provision of a COOPERS service varies between the different stakeholders. Figure 24 gives an overview on the environment of stakeholders, where the COOPERS user groups are embedded [2]. On the one hand the different stakeholders are presented i.e. Car Manufacturers, Component Suppliers, Safety Research Groups, Telecoms and others. It also distinguishes between the different user groups, End-User and Intermediate Users.

COOPERS integrated project
D15 - IR 7100/7200/7300/7400 Report on common result assessment
Page 151 of 191
Figure 24: COOPERS Stakeholders and User Groups
The stakeholders are involved in various ways in the communication process. The Traffic Control Centre (TCC) and the Infrastructure Operator are responsible for the data collection and data processing where they need original data (e.g. for traffic monitoring and weather conditions), the Traffic Information Service Provider (TISP) is responsible for the service generation and the data transmission process. Real time data is needed to provide traffic information to various users or customers (private drivers, professional drivers, emergency services) with special interest in pre/on-trip planning applications.
6.2.2.2.2 Handling of significant risks and threats in COOPERS
6.2.2.2.2.1 HMI-specific results of the COOPERS GUI-tests
Not only during the demonstration but especially during the implementation of co-operative systems the Human Machine Interface (HMI) is one of the key elements for the success of the demonstration evaluation. In the German DIN EN ISO 9241-110 the term User Interfaces is defined as „All parts of an interactive system (SW and HW), which allocate information and control devices, which are important for the user to realize a certain task with an interactive system”. Additionally several design guidelines have been elaborated to define the requirements of a user interface [3]; from the user´s point of view the design of the graphical user interface (GUI) affects acceptance of the information especially if the quality of the received information is good.
Traffic Information Service Provider
(TISP)
Traffic Control Centre (TCC)/ Infrastructure
Operator
Intermediate users
End users
Emergency Services
Individual Drivers
Private Drivers
Professional Drivers
Stakeholders
Telecoms
Position / Map
Public Authorities Component
Supplier
Car Manufacturer
Safety Research
Group
Individual Organisations
&

COOPERS integrated project
D15 - IR 7100/7200/7300/7400 Report on common result assessment
Page 152 of 191
The Automotive PC (APC) software including the GUI was double-checked by WP 5x00 and 6x00 (5x=2..5 and 6x=2...6) which is in the responsibility of the individual Test sites. Besides the technical functionality, the usability of the GUI related to the user was the main interest.
The alternative system was subject to field tests; first on all three sections of demonstration site 1, where it performed very well after improving several flaws which had been discovered during the technical tests. Due to the limited time available, the demonstration drives with test users had to start in January; therefore, part of the bug-fixing activities overlapped with the first demonstration drives. Nevertheless, the demonstrations on site 1 took place successfully and without negative effects from the above-mentioned timing conflict.
On site 3, the extremely limited remaining time and the conditions of urban traffic with frequent and only real messages were comparably demanding for the field test process. COOPERS did not have full control of the TPEG message loop at the DAB transmitter; this caused for instance outdated messages being sent with the same message ID as current messages. Unfortunately, message filtering was disabled on the APC due to a configuration error. Moreover, resource scarcity hampered the timely start of technical tests before the demonstration drives. As a result, demonstrations had to be performed in the presence of several software problems, which had consequences for user acceptance and driving behaviour of the test participants.
For demonstration site 4, technical functionality has been widely proven in the presentations at the Common Mobility Showcase in Amsterdam, where part of the demonstrated services used the French CSC and where the COOPERS APC showed its GPRS capabilities. (CSC is the Coopers Service Centre - a server which relays the messages from the (official) traffic control centre (of the road operator) to the respective wireless transmission channel. In addition, the CSC offers a facility for inserting simulated TPEG messages for test purposes). For the French test site itself, however, technical field tests are still outstanding due to delays in the integration activities.
6.2.2.2.2.2 Legal and regulatory risks
Co-operative systems have to deal with several potential legal liabilities attaching to the various actors not identified or poorly defined and/or understood.
In addition there is an inability to comply with regulations as a result of lack of consistent standards and requirements (technical and regulatory) across EU member states. There is a case for introducing co-operative rules for traffic management.
COOPERS has to make recommendations about the standards that must be created and enforced for co-operative systems to be implemented in a consistent manner across the whole of the EU – and hopefully beyond, since CVIS is an area in which Europe is at the forefront of developments worldwide.

COOPERS integrated project
D15 - IR 7100/7200/7300/7400 Report on common result assessment
Page 153 of 191
6.2.2.2.2.3 Data Ownership and Privacy Issues
The high value of data ownership and privacy is ranked as very critical if synchronization of information among users is realized. European legislation has been developed to address specific privacy issues which are formulated in several directives [6,7,8,9] The scope of the Directive includes that member states cannot restrict or prohibit the free flow of personal data between member states even for reasons connected with the protection of personal data.
The issue of data ownership and privacy issues is extensively dealt with in Chapter 3.
6.2.3 Existing Safety Legislation and Standards
The issue of legislation and standards has been discussed intensively in the EU project ADVISORS [9]. Workshops and interviews were conducted to realize well funded information about the critical issues of Advanced Driver Assistent Systems (ADAS). The summarized results are presented in the next section.
The COOPERS system is supporting the driver in their primary driving task. COOPERS provides information and warns the driver in case of an incident. The system assists (as opposed to taking over) during the driving task. An overridable or non-overridable system is not in the focus of COOPERS. Hence, the driver is clearly responsible for the driving task.
The liability of the driver versus the system manufacturers, including insurance companies, car manufacturers, system developers, etc. is likely to be looked upon on a case by case basis. The following sections reflect the results of the ADVISORS survey with different experts in several workshops.
6.2.3.1 Road Operators Liability
The liability of road operators in the ADVISORS questionnaire response was in general divided. No conclusive answer on the authorities’ responsibility was given.
Several examples were given on alternative driving behaviour that would have lead to the accident’s avoidance and would further burden the driver. Since the information and service provision is in the hand of the road operators, the quality assurance of the service should have highest priority.
6.2.3.2 System manufacturers
In general the manufacturers of Advanced Driver Assistance Systems are not held liable in most cases. The situations where the ADAS manufacturer can be considered liable are those when the system does not perform according to its specifications, including the case of complete failure of the system. In these cases the liability is shared between the driver and the manufacturer. In all other cases the manufacturer is not to be held liable, unless there is an issue of defective product specifications or lack of appropriate warnings and instructions. At this point it would be worth initiating further examination on what would be the effects on the verdict when the system is obligatorily imposed, by an EU policy for example.

COOPERS integrated project
D15 - IR 7100/7200/7300/7400 Report on common result assessment
Page 154 of 191
6.2.3.3 Driver’s liability
The responsibility of the driver is in all cases found higher than any other factor, when the driver is not unanimously held liable. In fact ADAS are supposed to be advisory systems and as such they cannot substitute for the driver’s duty of alertness. The functionality of informative systems like COOPERS is intended to be advisory systems. As such, they cannot replace the driver’s duty for alertness in the driving task.
The research of ADVISOR adduced, that there are basically no systems that completely excuse the driver’s unsatisfying performance. Nevertheless it should be underlined that as long as intervening systems are involved, the experts questioned found more reasons to absolve the driver from part of her/his liability.
6.2.4 Summary, conclusions and recommendations
Co-operative systems, especially I2V and V2V, have to deal with a serious problem. The extraordinary quantity of data from different data sources and various qualities makes it necessary to integrate several steps of quality approval within the data chain. Critical problems during operation will be caused, if misinformation is delivered to the driver. While there are numerous possible causes of misinformation, such as collection of traffic data, the number of stakeholders in the service generation process and the data transmission process, data quality assurance is of major importance. Optimization of quality and reliability of traffic control and traffic information applications and accordingly of future COOPERS services should be reached by different data fusion steps.
According to section 2.2.2.1 the user groups are operating with different types of applications and therefore it is essential to determine the type of data and thus the methods of quality measures and the thresholds for evaluating the quality of data. Beside the existing five fundamental measures as identified in [10, 11, 12, 13]:
7 Accuracy 7 Completeness 7 Validity 7 Timeliness 7 Coverage
additional appropriate quality acceptance thresholds have to be defined with respect to the above mentioned measures.
The above-mentioned issues reflect the current situation. The liability of the involved stakeholders regarding the quality of the service is essential for the success of co-operative systems. If a sufficient quality is not assured the user acceptance will suffer. If the driver is involved in accidents because of misinterpretation or simply wrong messages the potential for a market success will decrease rapidly.
Another crucial point is the penetration rate of vehicles and infrastructure equipped with co-operative systems. The modeling of different penetration rates by TU Berlin [14] concluded that for traffic management and efficiency criteria an equipment rate of only 20 percent is better than if no control were applied. Other different equipment penetration rates have not been considered in terms of the

COOPERS integrated project
D15 - IR 7100/7200/7300/7400 Report on common result assessment
Page 155 of 191
safety impact. Here, additional research is crucial for determining the different penetration rates during the implementation phase of co-operative systems. The overall potential of safety improvement through COOPERS services was also analyzed by TU Berlin [15] as about 25 percent. To utilize the potential a parallel approach of distributing services to the driver in various ways is therefore necessary.
6.3 Privacy and data ownership issues with the introduction of I-V cooperative systems
6.3.1 Introduction
The development and implementation of so the so-called “Intelligent Transport Systems” (ITS-Systems), which includes “Advanced Driver Assistance System” (ADAS), is considered a global challenge. In regard to specific details of planned European measures, the Commission’s Communication [Com(2008) 886 final] (European Commission 2008a) as well as the proposal for a Directive of the European Parliament and the European Council [COM(2008) 887 final (European Commission 2008b)] should be considered.
“COOPERS” – Co-Operative Systems for Intelligent Road Safety – System has set out to develop a communication and service information system, which should inform motorists via automatic communications between road infra-structure and the moving vehicle on European highways about accidents, traffic jams or other road hazards on the motorway to increase road safety.
The system will be based on currently existing data (for instance traffic control and information systems) and on the other hand, on new sources of information which combine information (among others) on induction loops, video and radar analysis and the so called Floating Car Data (FCD), in which vehicles transmit data regarding the vehicle’s current position and current traffic data in an anonymous form. Also, data from electronic systems on highways, like changing road signs, shall be included in such information. The Traffic Control Centre filters such information and combines it with geo-data (GPS-Data) and generates news feeds of COOPERS-services in TPEG-format. The generated data will be retransmitted to the relevant vehicles and the information will be displayed on the onboard unit (or other audio-visual formats), for example, in terms of road signs.
6.3.2 Background on current legislation
From an overall perspective, the question arises, what are the legal requirements for a possible implementation on the European and national level, and which legal provisions would have to be amended or changed. In the light of the current status and the complex linkages between the different elements, as shown in Figure 24, this legal report can nevertheless provide a legal overview in regard to COOPERS.

COOPERS integrated project
D15 - IR 7100/7200/7300/7400 Report on common result assessment
Page 156 of 191
Figure 25: The methodology and elements of COOPERS
Beginning with the technical/equipment leve, as shown in Figure 25 (where OBU=On Board Unit, TCC=Traffic Control Centre), many adjustments are required in the areas of technical standards, which have been addressed by other deliverables (e.g. COOPERS project deliverable D5-A2100) and will therefore not be covered in this section, as it would be out of the scope of this legal reflection. Albeit, on 6 October 2009 the European Commission has instructed the European standard organizations ETSI, CEN and CENELEC to compile a unified code of technical standards, specifications and guidelines in order to foster the community-wide implementation and development of ITS-Systems.
For the other levels, specific areas of law will be discussed. A detailed examination would be possible in all these fields; however, this would require an outline and definition of the legal issues in a more precise way. It should also be noted that the European Law is not directly applicable, since it would need to be transferred into the respective national legal system. In terms of this EC versus national transferability, Austria is used as an example due to the author’s expertise.
6.3.2.1 Law regarding infrastructure and transportation
3.2.1.1 According to Article 170 TFEU, the European Union shall contribute to the establishment and development of Trans-European Networks in the area of transport, telecommunications and energy infrastructures in order to achieve the objectives referred to in Article 26 and 174 TFEU and to enable citizens of the Union, economic operators and regional and local communities to enable the full benefits from the setting up of an area without internal frontiers. According to Article 171 para 1 TFEU and the respective aims, the Union should establish a series of guidelines covering the

COOPERS integrated project
D15 - IR 7100/7200/7300/7400 Report on common result assessment
Page 157 of 191
objectives, priorities and broad lines of measures it envisages on the terms of the Trans-European Networks. The framework of these guidelines shall identify projects of common interest. According to Article 171 para 2, the Member States shall, in liaison with the Commission, coordinate among them-selves the policies pursued at national level which may have a significant impact on the achievement of the objectives referred to in Article 170. The Commission may in close cooperation with the Member State take any useful initiatives to promote such coordination. On the basis of Articles 154 to 156 TEC (now Articles 170 to 172 TFEU), the European Parliament and the European Council have jointly created the basis of the development of Trans-European Transport Networks (TEN-T) by issuing the Decision on community guidelines for the development of the Trans-European Transport Network. Based on an active cooperation in the area of transport management on European, national and regional levels, the users of the European Road Networks shall be provided with a high, consistent and continuous standard in regard to road services, comfort, safety and, as already mentioned earlier, ITS.
3.2.1.1 In regard to the Austrian Law of transportation, COOPERS will affect first and foremost the Austrian Highway Code 1960 (StVO; Federal Gazette number 159/1960 as amended). Based on the assumption that the electronic transmitted data via an onboard-unit to the individual motor vehicles should also be of authoritative character (including visual symbols of the traffic signs), amendments to Section 44 Highway Code 1960 would be necessary in terms of the regulatory power of prohibitions and limits; this would also entail an amendment of Section 44 para 1a of the Highway Code concerning traffic influencing systems (such as Traffic Lights). Alternatively, the future provisions of the Highway Code could also incorporate that ITS-equipment in vehicles would be considered as part of the traffic influencing systems as already defined in Section 44 para 1 of the Highway Code.
3.2.1.3 Currently, COOPERS has been tested only on the level of the motorway network. Ac-cording to Section 2 of the Federal Road Law 1971 (Bundesstraßengesetz; Federal Gazette number 286/1971 as amended) the federal highway system consists of interstate roads (Autobahn) and expressways (Bundesschnellstraße). These types of roads are considered to be appropriate for high-speed traffic, they do not have intersections at the same level with other traffic networks and do not serve primarily local purposes. Thus, this road network would be of primary interest to the COOPERS technology.
3.2.1.4 As COOPERS requires the assistance of the road infrastructure provider, in the Austrian case that is the Austrian Interstate and Expressway Financing Cooperation (ASFINAG). ASFINAG is a company entirely owned by the Federal Government and was formed under the ASFINAG-Act 1982 (Federal Gazette 591/1982 as amended). The company’s purpose, according to Section 2 para 1 of the ASFINAG-Act is the financing, planning, construction and maintenance of federal roads, including all necessary and otherwise useful infrastructure, the collection of tolls from the road users, as well as the payment of authorized debt, as long such debt has been assumed for the planning, the construction or the maintenance of federal roads. ASFINAG is also in charge of areas that are not directly linked to traffic, as well as areas of land and buildings which have been transferred into the ownership of ASFINAG according to the Federal Act on the Discontinuation and Transfer of Federal Roads. Thus, the ASFINAG’s company purpose may be amended to the extent that ASFINAG could also conduct parts of the agenda for digital control and monitoring system of the road traffic. However, according to Section 9 para 1 of the ASFINAG-Act a change in the articles of

COOPERS integrated project
D15 - IR 7100/7200/7300/7400 Report on common result assessment
Page 158 of 191
ASFINAG would require the consent of the Federal Minister of Transportation, Innovation, Technologies as well as the Federal Minister of Finance.
6.3.2.2 Motor Vehicle Law
The implementation of COOPERS would require the mandatory installation of ITS-equipment (on board units) in the motor vehicles.
2.2.1 Based on Article 114 TFEU, the technical harmonization for motor vehicles is ensured through the system of the EC-Approval for the whole vehicle (WVTA-Whole Vehicle Type Approval). Due to this article, manufacturers of motor vehicles may certify one type of motor vehicle that meets the technical requirements in the European Community, in one Member State and consecutively market this type of vehicle in the entire European Union without further testing. The predominant legal provisions are described in the Directive 2007/46/EC of the European Parliament and of the Council “establishing a framework for the approval of motor vehicles and their trailers, systems, components and separate technical units intended for such vehicles”. This Framework Directive has already been amended by several special Directives. In the context of COOPERS it is therefore required to include the configuration of motor vehicles with ITS components and software components into the European body of rules and regulations.
2.2.2 For Austria the provisions regarding motor vehicles and trailers on public roads, including provisions about the technical attributes of the motor vehicles, their approval for traffic, are mostly to be found in the Motor Vehicles Act 1967 (Kraftfahrgesetz; Federal Gazette number 267/1967 as amended) as well as in administrative decrees, for example the Motor Vehicles Act Implementation Decree 1967 (Federal Gazette No 399/1967) which has been amended by Austrian technical standards (i.e. ÖNORM), as well as guidelines and provisions for road matters. Nationally COOPERS will require an addition to the second title of the Motor Vehicles Act 1967, in which the mandatory equipment of motor vehicles with ITS-Equipment has to be defined.
2.1.5 As COOPERS is envisaged only for the high ranking road system, the provisions of the Railroad-Intersection Decree 1961 (Eisenbahnkreuzungsverordnung; Federal Gazette No 2/1961 as amended) will not be affected, which is why the provisions of the Railroad-Intersection Decree 1961 is not considered any further.
6.3.2.3 Data Protection
As each motor vehicle under COOPERS will receive and transmit data, questions about the protection of such data arise; the flow of information is multilateral: traffic control centre – motor vehicle, motor vehicle – traffic control centre, as well as motor vehicle – motor vehicle. If such data contains personal data (such as the location of an individual motor vehicle), the legality of the processing of such data has to be examined.
2.3.1 The legal framework in the European community in regards to data protection is pre-dominately determined by the Council Directive 95/46/EC of the European Parliament and the Council dated October 24, 1995 on the protection of individuals with regard to the processing of

COOPERS integrated project
D15 - IR 7100/7200/7300/7400 Report on common result assessment
Page 159 of 191
personal data and on the free movement of such data, as well as by the Directive 2002/58/EC of the European Parliament and the Council of 12 July, 2002 concerning the processing of personal data and the protection of privacy in the electronic communications sector (Directive on Privacy and Electronic Communications).
According to the Data Protection Directive, personal data may only be processed in good faith and may only be collected for precise and lawful purposes. Furthermore, the personal data has to be correct and has to be kept up to date. The processing of personal data may only take place if the individual has expressed his consent or if the processing is necessary for good cause. As good cause the Directive enumerates – among others – the fulfilment of legal or contractual obligations as well as vital interests of the person or functions in the public interest.
Processing of personal data means any operation or set of operations which is performed upon personal data, whether or not by automatic means, such as collection, recording, organization, storage, adaptation or alteration, retrieval, consultation, use, disclosure by transmission, dissemination or otherwise making available, alignment or combination, blocking, erasure or destruction. Contrary to the national Austrian Law (see below 2.3.2), the Data Protection Directive does not make a difference between public and private processors or recipients.
The Directive on Privacy and Electronic Communications (as a supplement to the Directive on Data Protection) serves as an instrument to harmonize the provisions in the Member States, which are necessary to provide for an equal protection of the human rights and freedoms, especially the right to privacy in respect to the processing of personal data in the fields of electronic communication, as well as the free flow of such data and of communication devices and services within the European Community. This directive mandates that operators of a public communication service have to provide for technical and organizational measures in order to secure their services. The Member States have to provide the confidentiality of messages within publicly available communication networks, the communication services, the data traffic by national regulation and the deleting of data which is not required anymore.
The European Data Protection Supervisor (EDPS) has embraced the idea of the implementation of ITS in his Opinion of 22 July 2009, on the Communication from the Commission on an Action plan for the Deployment of Intelligent Transport Systems in Europe and its proposal for a Directive of the European Parliament and the Council defining the framework for the deployment of Intelligent Transport Systems in the field of road transport and for interfaces with other transport modes. However, with the proposed Directive many questions regarding the protection of privacy and the protection of personal data will arise, which will have to be addressed on the EU-level as well as on the Member State level. The EDPS recommends - amongst other things - to clearly and precisely de-fine the legal framework in order to avoid discrepancies in the data protection among and between the Member States, as well as a concept of “privacy by design” already at the conception level of ITS applications and systems, and effective security measures against the abuse of location based data.
2.3.2 The implementation of the Data Protection Directive into Austrian national law was made by the enactment of the Data Protection Act 2000 (Datenschutzgesetz; Federal Gazette No 165/1999 as amended [DSG]).

COOPERS integrated project
D15 - IR 7100/7200/7300/7400 Report on common result assessment
Page 160 of 191
The relevant provisions in regard to COOPERS are:
According to the constitutional provision of Section 1 para 1 and 2 Data Protection Act, everyone has a right to confidentiality of his personal data, insofar as there is a viable interest for protection. If the personal data is commonly available or no reference can be made to the individual, there is no such viable protection interest. Restrictions on this right to confidentiality are (unless the person has permitted the use of the data or vital interests are at stake) only possible by statutory laws, on the grounds set out in Article 8 para 2 of the European Convention for the protection of Human Rights (ECHR, Federal Gazette No 210/1958). Such laws may permit the use of data, to which there is a protective interest, only in the case of important public interests.
Such laws have to define the guarantees for the protection of the confidentiality interests of a person. If such restrictions are permitted, a constitutional right may only be affected to the minimum extent, in the public interest.
According to the definition of Section 4 no. 1 of the Data Protection Act, data are facts about a person whose identity is clear or may be found out. Data which does not enable the processor or recipient to identify the identity of a person with legal means, is considered to be indirect personal data. “Sensible data” is considered data of natural persons for example about their racial or ethnical background, political views, trade union membership, religious or philosophical beliefs, medical history or their sexual preferences, according to Section 4 no. 2 Data Protection Act.
Section 7 of the Data Protection Act sets out that data may only be processed as long as the purpose and the content of the data processing application are legally permitted for the processor and as long as they do not violate the protection interests of a person. Data may only be transmitted if it results from permitted data applications and if the recipient has assured the sender of the legality of such transmission. A data application is permitted if it is secured that the intrusion into the constitutional sphere is minimized to the required amount and the principles of Section 6 of the Data Protection Act are adhered to. According to Section 8 para 1 number 1 Data Protection Act, it constitutes no breach of confidentiality interests if the processing of the data has been permitted by law.
2.3.3 The transformation of the Directive on the Protection of Personal Data-EC (electronic communications) into national Austrian law has been accomplished by the enactment of the Austrian Telecommunications Act 2003 (Telekommunikationsgesetz; Federal Gazette No 70/2003 as amended [TKG]). According to the definition of Section 3 number 17 TKG, a public communication network is a communication network that serves entirely or mostly the purpose of publicly available communication services.
COOPERS, therefore, falls under the scope of TKG, which contains in title number 12 provisions amending the Data Protection Act 2000 regarding communication confidentiality and data protection.
According to Section 93 para 1 sentence no. 1 TKG, all data regarding the content, the traffic as well as the location of a communication, is protected by communication confidentiality. Section 96 para 1

COOPERS integrated project
D15 - IR 7100/7200/7300/7400 Report on common result assessment
Page 161 of 191
and 2 TKG set out that personal data, traffic data, location data as well as the content of communications may only be gathered or processed for the purposes of the communication service itself. The transmission of such data may only be allowed if this is necessary for the individual communication service, for which such data has been collected and/or processed and is necessary for the operator of such communication service.
6.3.2.4 Liability questions
In regards to liabilities in connection with car accidents two liability issues have to be considered: the general liability in tort where the injuring party must act at least negligently, and or the strict liability in tort (regardless of fault). In regard to a car accident, the driver, the vehicle holder, the car insurance company as well as the manufacturer (importer or supplier) – in case of defective products responsible for the accident – may be held liable.
3.2.4.1. From a European law perspective, Civil Law is a matter of the Member States of the Union with the exception of Article 81 TFEU, setting out that the union will provide for the incorporation between the Member States, on which legal decisions will be recognized in other Member States. On the basis of Article 81 TFEU several regulations of the Council have been enacted, among others the Council Regulations (EC) NO 44/2001 of 22 December 2000 on jurisdiction and the recognition and enforcement of judgements in civil and commercial matters. In regards to vehicle insurance law, reference is made to Direc-tive 2005/14/EC of European Parliament and of the Council, relating to the insurance against civil liability in respect of the use of motor vehicles, which amended previous Di-rectives of the European Council and the European Parliament.
As mentioned before, the questions at hand will also be affected by product liability regulation such as the Council Directive of July 25, 1985 on the approximation of the laws, regulations and administrative provisions of the Member States concerning liability for defective products.
3.2.4.2 In regard to Austrian law, the liability provisions being relevant for COOPERS can be broadly outlined as follows:
3.2.4.2.1 Strict liability in tort:
3.2.4.2.1.1 According to the Austrian Railroad and Motor Vehicle Liabilities Act (Federal Gazette No 48/1959 as amended [EKHG]), for motor vehicles, the vehicle holder is strictly liable for all the danger arising out of the operating of a motor vehicle. However the liability is limited to a fixed amount according to Section 15 et seq. EKHG for personal injury as well as damages to property.
According to Section 9 EKHG, there is no liability if the accident was caused by an inevitable event which was neither based on a defect in the condition of the vehicle nor in a failure of performance of the vehicle. An event is “inevitable” if it was caused by the conduct of the injured party, a third party or an animal and the driver or the car holder as well as the persons permitted by the vehicle holder have obeyed the necessary diligence.

COOPERS integrated project
D15 - IR 7100/7200/7300/7400 Report on common result assessment
Page 162 of 191
For COOPERS this means that a breakdown in the ITS equipment (onboard unit) causing a car accident, this would be interpreted as a breakdown of the vehicle equipment according to Section 9 para 1 EKHG and would therefore lead to a strict liability in tort according to EKHG.
3.2.4.2.1.2 The Product Liability Act (Federal Gazette No 99/1988 as amended [PHG]) sets out a liability regardless of fault, for damages caused by a defective product in regards to personal injury as well as damage to property. Such liability also applies vis-à-vis third persons (“innocent bystander”). If a person is killed, injured or if property other than the defective product is damaged because of the defective product, according to Section 1 para 1 of PHG the manufacturer or the importer into the Common Market are liable for such damages. If the manufacturer or the importer cannot be determined, each supplier of the product shall be treated as its producer unless he informs the injured person, within reasonable time, of the identity of the producer or person who supplied him with the product.
For malfunctioning or defects in ITS equipment (onboard unit) of a motor vehicle, therefore the manufacturer or importer (and the related suppliers) would be liable for a personal injury or property damage, regardless of fault.
3.2.4.2.2 Liability in tort
3.2.4.2.2.1 For basic liability in tort for damages, resulting from car accidents, the provisions of the Austrian Civil Code Sections 1293 et. seq. apply: according to these provisions, the injurer is liable for damages inflicted to the injured party in an adequate, causal, unlawful and culpable way. According to case law, a motorist is required to obey greater standards of diligence, including his driving skills and the necessary technical know-how.
Under these prerequisites, the (culpable) non-obeyance of ITS information would make a vehicle driver liable against the injured party.
3.2.4.2.2.2 The remarks made under 2.4.2.2.1 apply accordingly to the road infrastructure provider in case of an accident caused by misinformation via onboard unit in the vehicle. It will how-ever depend on the legislative implementation of COOPERS, if for such damages the federal or regional governments may be held liable according to the Government’s Liability Act (Federal Gazette No 20/1949 as amended [AHG]) instead of the infrastructure provider:
According to the case of law, private corporations or individuals may be vested with governmental powers from the federal or regional governments. It does not matter whether the private individual has been granted such official powers with the duty to execute such powers and therefore has the competency to act as a sovereign with free will or is simply cooperating with the competent authorities in order to assist other state organs. In any case, such vesting of a private individual (or corporation) with governmental powers will be considered as executive officer in regards to the Government Liability Act.

COOPERS integrated project
D15 - IR 7100/7200/7300/7400 Report on common result assessment
Page 163 of 191
3.2.4.2.2.3 In this regard it has to be pointed out that according to case law, a contractual disclaimer of warranty for personal injury would, regardless of the grade of negligence, be consid-ered against the public interest and would therefore be rendered as null and void.
3.2.4.2.3 Motor vehicle liability insurance
According to the Motor Vehicle Liability Insurance Act 1994 (Federal Gazette Nr. 651/1994 as amended [KHVG]) an insurance for all motor vehicles which have been approved according to the provisions of the Motor Vehicles Act 1960 [see above], or which have been approved on the basis of transit license plates is mandatory. Such insurance covers the settlement of justified claims, as well as the defense against unjustified claims which have been filed against the insured person, or other co-insured persons if by the use of the insured motor vehicle, persons have been killed or harmed, property has been damaged or financial losses have occurred. The insurance company’s obligation vis-à-vis the injured third party even applies, if the insurer would not be liable to pay against the in-sured person. The injured third party may file his claims directly against the insurance company. The insurance company and the injurer are jointly liable for the damages.
Traffic accidents which occur in connection with ITS-systems would therefore be covered by the Motor Vehicle Liability Insurance Act, if such ITS-systems have been operated in an insured motor vehicle.
6.3.3 Summary
6.3.3.1 Community Law
For the community-wide implementation of COOPERS, Directives will be necessary, which (in part) have already been proposed by the European Parliament and the Council in COM 2008/887 final. In such Directives the recommendations of the European Data Protection Supervisor should be followed in regard to the precise outlining of a legal framework for data applications in connection with ITS applications and systems, as well as security provisions against the abuse of location data. Also, the mandatory equipping of motor vehicles with ITS devices and ITS software applications in the European framework as well as a harmonization of the technical specifications and guidelines would have to be enacted.
In conclusion, the implementation of COOPERS will require many amendments and changes in numerous provisions of the law. As for the complexity of the program, such a task will pose a great interdisciplinary challenge, which can most probably only be met by a close co-operation between legal and technical experts.

COOPERS integrated project
D15 - IR 7100/7200/7300/7400 Report on common result assessment
Page 164 of 191
6.4 Distraction and information overload issues with the introduction of I-V cooperative systems
The issues of driver distraction and information overload
6.4.1.1 Distraction
Drivers are distracted when they pay attention to a second activity while driving. People cannot always safely multi-task in this way, especially if the second activity is time-consuming or complex. The second activity puts extra demands on the driver, which may reduce his or her driving standard. For example, it may cause the driver to become less observant or to make worse decisions about how to control the vehicle safely. This lower standard of driving means that a driver is more likely to fail to anticipate hazards, and means accidents can occur due to the distraction. Distraction can be either driver initiated (where the driver starts carrying out a distracting activity) or non-driver initiated (the unpredictable actions of something or someone else).
There are several types of distraction including visual distraction, cognitive distraction, biomechanical distraction, and auditory distraction.
Visual distraction occurs when a driver sees objects or events and this impairs the driver’s observations of the road environment. Concern about visual distraction is not new - when windscreen wipers were first introduced, there was concern over their potentially hypnotic effect. The way that a driver observes the area around the vehicle depends on how complex it is, and in complex environments, drivers can find it more difficult to identify the main hazards. In undemanding situations, the driver’s attention tends to wander towards objects or scenery that are not part of the driving task. Estimates of how much time drivers spend doing this varies from between 20% and 50% (Crundall et al, 2006).
Cognitive distraction occurs when a driver is thinking about something not related to driving the vehicle. Studies of drivers’ eye fixations while performing a demanding cognitive task show that their visual field narrows both vertically and horizontally – meaning that rather than scanning the road environment for hazards and they spend much more time staring ahead than usual; in other words, “tunnel vision”. This means that drivers who are cognitively impaired will spend less time checking mirrors or looking around for hazards (Recarte et al, 2000; Harbluk et al, 2007).
Biomechanical distraction occurs when a driver is doing something physical that is not related to driving, for example, reaching for something and being out of the driving position, or holding an item.
Auditory distraction is caused when sounds prevent drivers from making the best use of their hearing, because their attention has been drawn to whatever caused the sound. An activity can create multiple types of distraction – for example, using a hand-held mobile phone while driving creates a biomechanical, auditory and cognitive distraction.

COOPERS integrated project
D15 - IR 7100/7200/7300/7400 Report on common result assessment
Page 165 of 191
6.4.1.2 Information overload
"Information overload" refers to the difficulty a person can have understanding an issue and making decisions that can be caused by the presence of too much information (Yang et al 2003). The general causes of information overload include:
• A rapidly increasing rate of new information being produced
• An increase in the available channels of incoming information (e.g. telephone, instant messaging etc)
• Large amounts of historical information to dig through
• Contradictions and inaccuracies in available information
• A low signal-to-noise ratio
• A lack of a method for comparing and processing different kinds of information
• The pieces of information are unrelated or do not have any overall structure to reveal their relationships.
With the emerging vehicle-infrastructure cooperative systems, it has become possible to realize real time, high speed, and low latency communication between drivers and operation/service centres. This will greatly increase the opportunities for in-vehicle information systems to provide a wide range of ITS applications. For example, the in-vehicle information systems can be used to warn drivers of hazards ahead (e.g. a slippery road), provide dynamic route guidance, inform drivers of traffic regulations (e.g. speed limits, lane control, and access/priority control), and improve fleet management (e.g. commercial vehicles, buses, emergency vehicles). Future applications of in-vehicle information systems will become a much more complicated situation than current satellite navigation based systems in terms of the number of services being provided and the demand for information management. Concerns have been raised in recent years about driver distraction and overload due to such multiple applications. The potential negative aspects of the in-vehicle warning/advice/information could derive from the fact that the drivers may perhaps be distracted from their regular driving task by either physically looking at the display and/or by mentally allocating time towards interpreting the instructions or information that are provided. In addition, the overall level of workload involved in using an in-vehicle information service is another factor which has potential impacts on safety.
6.4.2 Findings from COOPERS
COOPERS systems are based on wireless communication technology which aims to improve communications between vehicles and operation/service centres and between vehicles. In the COOPERS project, 12 key services are defined to show the potential applications of the technology, including hazard warning, information of traffic regulations (e.g. speed limits), road

COOPERS integrated project
D15 - IR 7100/7200/7300/7400 Report on common result assessment
Page 166 of 191
charging, and dynamic route�guidance. One of the common features of COOPERS services is that they are all based on in-vehicle information. While such in-vehicle information may be helpful to drivers, it has the potential to distract drivers in several ways. These include the visual distraction when looking at the display; the auditory distraction when listening to auditory information/instructions; and also the cognitive distraction when the driver thinks about the information presented by the system. It is a concern that in-vehicle telematics devices are a threat to road safety because they increase driver distraction and distraction-related crashes. This concern is based on a substantial and mounting body of evidence indicating that using these devices impairs driving performance.
In terms of messaging functions, COOPERS HMI (Figure 26) is similar to the one used in current in-vehicle navigation systems. The main part of the display area is used to show road map as it does with a navigation function. From a design perspective, the main difference in HMI between COOPERS and navigation systems is that additional information panels are included at the left hand side and at the bottom to inform/warn drivers of incidents ahead (this means that slightly larger display area is needed for COOPERS HMI in order to maintain the same display areas as the current navigation HMI)
�
����������� ��������������������������������
Cooperative systems can support many driver information services. Drivers can access more and more information in the car, for example navigation, traffic information, news and

COOPERS integrated project
D15 - IR 7100/7200/7300/7400 Report on common result assessment
Page 167 of 191
communication. Furthermore, the car itself provides more and more information that should support drivers’ tasks, such� as speed limit warnings and parking guidance “beeps”. The consequences of providing in-car traffic management information (like route information) in combination with infotainment services (like news headlines) can be negative; distraction or high workload could adversely affect the interaction between the driver and the in-car system.
To minimise cognitive distraction (e.g. audio messages, text messages ), and to optimise the driving task, information needs to be prioritised before being presented to the driver, so that safety-critical warnings are not over-ridden or masked by less crucial information.
Consistency between roadside and in-vehicle information is important; conflicting messages lead to cognitive distraction.
Consistency between different information sources is important to minimise cognitive distraction.
Findings from other studies
The Driver Workload Metrics (DWM) project was a collaboration between government and industry intended to enhance safety in driving (Angell et al 2006). The DWM project involved the following organizations (presented alphabetically): Ford Motor Company, General Motors Corporation, Nissan Technical Center of North America, Toyota Technical Center-USA, and the United States Department of Transportation (USDOT). The DWM project was funded through the Intelligent Vehicle Initiative (IVI) Light Vehicles Enabling Research Program. It was launched in April 2001 and concluded in March 2005. In the study, driver performance data were collected in three venues: in the laboratory, on an interstate highway, and on a test track. Two hundred and thirty-four licensed drivers were recruited for participation in the study. Each driver participated in only one testing venue. The participants ranged in age from 21 to 79 and were balanced by gender. In each venue, the participants performed in-vehicle tasks under a variety of experimental conditions. Twenty-two in-vehicle tasks were examined in this study. In addition, a two-minute segment of just driving was performed under the same conditions for comparison purposes. The DWM project yielded the following insights about driver workload:
• States of driver workload which produced overload or interference with driving performance were manifest not on just one underlying dimension of performance, but on several simultaneously affected ones, confirming that workload-induced distraction is multidimensional in nature.
• There were specific patterns of effects that appeared to be interpretable as characteristic of distraction, but which will require further research to confirm. Visual-manual tasks led to more pronounced intrusion on driving than did auditory-vocal tasks. This intrusion was discriminable from just driving for both types of tasks, but much more subtle for auditory-vocal tasks.
• Different patterns of interference/degradation across the categories of performance were associated with tasks of different types (auditory-vocal versus visual-manual). However, for

COOPERS integrated project
D15 - IR 7100/7200/7300/7400 Report on common result assessment
Page 168 of 191
both types of tasks, eye glance measures and event detection measures were key in evaluating extent of intrusion on driving performance.
• Different patterns emerged for individual tasks, which were unique to the demands that each imposed on drivers, indicating that specific structural interference between concurrently performed tasks continues to be an important theoretical construct in understanding what gives rise to performance degradation.
Cell phones are the contemporary icon of driver distraction. Ranney at al (2004) made a study to examine the distraction effects of wireless phone interfaces using a driving simulator. The main objective of the research was to collect information useful in the assessment of 1) the distraction potential of wireless phone use while driving, and 2) the difference in distraction caused by the use of a hands-free wireless phone interface versus that associated with use of a hand-held interface. This research is being conducted by NHTSA using the National Advanced Driving Simulator (NADS) in collaboration with NADS staff. This preliminary report describes the development of a freeway driving scenario and associated driving and wireless phone tasks. Also provided is a brief description of the freeway pilot study and associated example data. Lessons learned during the process of developing the simulator scenario and experimental methods are outlined in hopes of benefiting other researchers involved in similar projects. Results of the main freeway experiment and details of the refined test protocol were provided in a subsequent report.
Ranney et al (2008) made a review of studies on driver distraction and claimed that driver distraction is distinct from other forms of driver inattention; it occurs when a driver’s attention is diverted away from driving by a secondary task that requires focusing on an object, event, or person not related to the driving task. Although existing data is inadequate and not representative of the driving population, it is estimated that drivers engage in potentially distracting secondary tasks approximately 30 percent of the time their vehicles are in motion. Conversation with passengers is the most frequent secondary task followed by eating, smoking, manipulating controls, reaching inside the vehicle, and cell phone use. Driver attention status is unknown for a large percentage of crash-involved drivers in the Crashworthiness Data System (CDS). However for the period between 1995 and 2003 it is estimated that 10.5 percent of crash-involved drivers were distracted at the time of their crash involvement. Approximately 70 percent of distracted drivers’ crashes were either non-collision (single-vehicle) or rear-end collisions.
A significant proportion of the existing literature is devoted to assessing the impact of cell phone use on driving performance and safety. Although not representative of the U.S. experience, the available evidence suggests that cell phone use increases drivers’ crash risk by a factor of 4 (Ranney et al 2008). Experimental studies consistently reveal driving performance degradation (primarily slowed response time) associated with cell phone use; however phone tasks used in these studies are generally unrealistic and often more complex than everyday phone conversations. Insufficient data exist to assess the distraction effects of in-vehicle information systems (IVIS), however experimental results suggest that voice-based interfaces are less distracting than those requiring manual entry (e.g., via keyboard). Standard behavioural countermeasures, including laws, enforcement, and sanctions, are considered unlikely to be effective because distraction is a broad societal problem

COOPERS integrated project
D15 - IR 7100/7200/7300/7400 Report on common result assessment
Page 169 of 191
associated with lifestyle patterns and choices. Detailed figures are not available, but it is generally believed that banning cell phone use will reduce the number of accidents.
Options for environmental (roadway) strategies are limited. Considerable activity has been devoted to the development of guidelines for IVIS interface design, resulting in some improvements. Promising future developments include large-scale naturalistic data collections to provide objective and representative data on distraction incidence and crash risk, and advanced driver assistance technologies that monitor drivers’ visual behaviour and manage the flow of information to the driver accordingly.
When using a mobile phone, drivers respond less effectively to events in the driving environment e.g. braking in response to visual stimuli (Haigney et al, 2001; Jamsom et al (2005)), taking evasive action to avoid objects, detecting lead car deceleration, and taking evasive action to a range of traffic scenarios. Haigney et al (2000) found speed reductions when taking a phone call. Jamsom et al (2005) found that drivers developed a strategy to reduce primary task load whilst performing concurrent secondary tasks. This was shown by a significant reduction in driving speed during interaction with both the auditory and visual tasks. This strategy was much more pronounced with the visual task. The success of the strategy was questionable as, in the longitudinal domain, an increase in secondary task demand was associated with a decrease in time to collision during scenarios in which a lead vehicle braked unexpectedly. The most complex IVIS tasks that required the most resource were the most detrimental to driving performance.
Regarding the lateral direction, the effects of the secondary tasks were in opposite directions. Drivers demonstrated more steering wheel corrections (reversal rate) to both increasing visual and auditory task demands. Whilst this effect was more pronounced for the visual task, again in all likelihood due to its direct interference with the visual driving task, an increase in variation of lane performance was only demonstrated with an increase in visual load. An increase in auditory load showed the opposite effect: the greater the auditory load, the less the lane variation. This improvement in steering performance has also been associated with an increase in gaze concentration towards the road centre (Engström et al, 2005).
Drivers’ self-reports showed their ability to recognise reduced primary task performance when performing concurrent secondary tasks. Furthermore, drivers appeared able to recognise further reduced driving performance whilst interacting with the visual task over the auditory task. However, there is evidence to suggest that, in reality, they under-estimate the potential severity of these distractions and continue to multi-task without fear of reduced responsiveness (White et al 2004). It is cause for concern that drivers’ over-confidence can override their own ability. There are two main practical significances of the study. Firstly, the ‘static’ performance on both secondary tasks decreased linearly with respective demand of both modalities i.e. it accurately predicted the reduction in secondary task performance with the additional demand of driving. Secondly, even though drivers attempted a strategy of reducing speed to free up resources for the secondary task, a reduction in primary task performance could still be detected, most noticeably in time to collision.
Zheng and McDonald (2008) have undertaken an on-road evaluation study of three types of voice interfaces: the traditional voice system, and two intuitive voice systems (operating on a ‘say-as-you see’ basis.) with text prompts on a central display and on a cluster display respectively. The effects
COOPERS integrated project
D15 - IR 7100/7200/7300/7400 Report on common result assessment
Page 170 of 191
of voice interfaces were evaluated based on primary driving and secondary in-vehicle task performance. The in-vehicle performance was characterized by the mean task duration and mean error rates in performing in-vehicle operations. It was found that the mean task duration was the shortest in using the intuitive voice system with cluster display and drivers made more errors when using the traditional voice system relative to intuitive voice systems; the error rates were the lowest when using intuitive voice system with cluster display. The visual distraction effects were examined in terms of glance percentage to the windscreen (road ahead) and number of glances towards the central display and the cluster display. Reductions in glance percentage to the windscreen were observed when using intuitive voice interfaces, accompanied by increases in glance percentage to the prompt display. The primary driving performance in using the three voice-activation interfaces was not significantly affected compared with the baseline car following only situation. It is concluded that intuitive voice interfaces are a viable enhancement to traditional voice interfaces whilst intuitive voice interface with cluster display has the relative advantages of good task performance and minor visual distraction.
Within the OPTIMISE project commissioned by the UK DfT, design features (such as vision, hearing and touch) of IVIS were considered and the way in which information was presented to the driver (Brook-Carter et al, 2002). A study investigated the effects of varying levels of complexity of secondary tasks on driving distraction, workload and overall driving performance. There were three main outcomes:
• The introduction of a secondary task was found to reduce performance on the primary task of driving.
• The Recognition task was found to lead to higher subjective workload and a greater reduction in driver performance than the Reading task on most measures.
• Drivers' situation awareness was not found to differ between the Reading and Recognition task.
The HASTE project (2002-2005) aimed at answering two questions: “Does greater secondary task load from an IVIS lead to an identifiably worse performance in the primary task of driving?” and “How much distraction is too much?” (Carsten et al 2005). The HASTE project attempted to differentiate between the effects of visual and cognitive (auditory) distraction, and it controlled the ‘dose’ of distraction administered at any one time. Three experimental methodologies were deployed: a laboratory set-up, advanced driving simulators, and instrumented vehicles in the field. The project also examined the reliability of the evaluation by replicating the studies across a variety of driving simulators in five different countries. One of the conclusions of the research is that visual distraction and cognitive distraction from the use of IVIS have very different impacts on the primary task of driving. Visual distraction leads, not unexpectedly, to poor steering behaviour and degradation of lateral control of the vehicle. By contrast, with cognitive distraction the major negative effect is more on longitudinal control, particularly in car following, rather on lateral control. In addition, with cognitive distraction, there was the phenomenon of an apparent ‘improvement’ in lateral control with increased cognitive task load, for example by reduction in the standard deviation of lateral position. The eye movement analysis, carried out in some of the studies, provides a possible explanation. With increased task load there was greater concentration of glances on the road straight ahead as opposed to the periphery, i.e. greater visual funnelling. This greater concentration of gaze and the

COOPERS integrated project
D15 - IR 7100/7200/7300/7400 Report on common result assessment
Page 171 of 191
accompanying ‘improvement’ in lateral control has two possible explanations. One is that it is a conscious adaptation by drivers to the presence of distraction: aware of the increased risk, they focus on road ahead to maintain stable control. The other possible explanation is that the change in the concentration of gaze is autonomic and accounts for the improved tracking in that the drivers are then subconsciously aiming for the point at which they are gazing.
Another finding is that static performance on an IVIS, i.e. performance interaction with a system as a single task, does not reliably predict dynamic performance. Generally, the studies carried out with the surrogate IVIS (S-IVIS) found that there was interaction between S-static IVIS performance across the baseline (static) and three levels of dynamic situation (i.e. the three levels of road difficulty). This suggests the HASTE approach of requiring the driving context to be considered in assessing IVIS. The HASTE study has confirmed that there would be severe problems for elderly drivers in using IVIS while driving, particularly at higher levels of task demand. “Average” drivers were not always able to manage the trade-off between primary and secondary task, and there were indications of driving performance being poorest when the secondary task demand was the highest. But elderly drivers were particularly poor at this task management, so there was more interference from IVIS use with their driving performance and safety, particularly in terms of higher-order aspects of driving such as managing interaction with pedestrians at crossing while subjected to cognitive load from an IVIS. This has important design and policy implications in that elderly drivers are unlikely to be able to handle even moderate load from an IVIS in more demanding road and traffic situations. This indicates that it is important that developers of IVIS systems take elderly drivers’ ability at task management into account.
Many studies have found a strong relationship between visual demand and reduced lane keeping (e.g. Engström et al, 2005). The lane-keeping errors resulting from visual time sharing have to be corrected by steering manoeuvres which generally are larger and more disruptive than steering movements during normal straight road driving. Steering wheel reversal rate (SRR) has been used to study the effects of secondary tasks on steering. They found that SRR is not a simple function of secondary task demand but involves a complex relationship between primary task demand, secondary task demands, driver characteristics and the effort invested in the different tasks. Another study used SRR to assess different types of displays (visual, auditory, and multimodal) and it was found that visual display complexity significantly influenced SRR, especially for older drivers. Many studies have also found that visual load results in a reduction of speed. This has been interpreted as a compensatory effect, where the driver reduces the primary task load to maintain driving performance at an acceptable level.
Anttila and Luoma (2005) described a field study using an instrumented vehicle to investigate and compare the potential or sensitivity of the selected HASTE assessment methods to reflect the effects of different surrogate IVIS on driver behaviour in an urban environment. Two types of surrogate IVIS were used: a visual one (Arrows task) and an Auditory Continuous Memory Task (ACMT). The results showed that both IVIS tasks tended to decrease the proportion of proper yielding of the right-of-way to other vehicles at urban intersections. In addition, the interaction with vulnerable road users was affected by secondary task performance. The tasks tended to produce increases in speed before the intersection in cases where there were vulnerable road users present at the urban intersection compared to driving without the secondary task. However, the cognitive task seemed more frequently to cause observed inappropriate behaviour towards vulnerable road users at urban

COOPERS integrated project
D15 - IR 7100/7200/7300/7400 Report on common result assessment
Page 172 of 191
intersections than the visual task. For both tasks, the percentage of correct responses was highest for the static situation and lowest when conducted in the urban environment, and the percentage of correct responses decreased with increasing task difficulty. In general, the results suggested that driving with a secondary task in an urban environment caused some changes in driving behaviour. This impairment in driving may be attributable to reduced mental processing available when under cognitive load. It may also be related to the “tunnel vision” induced by the cognitive task.
A study by Amado et al (2005) compared conversation with a remote person (using a hands-free phone), an in-vehicle person (passenger) and a no-conversation (baseline) condition. The task was a simple simulator measuring the accuracy and reaction time for completing two tasks: steering and detecting peripheral stimuli (lights displayed on the left and right LED peripherals). The difficulty level of the verbal task was included as a second independent variable. The results revealed that conversation resulted in slower reactions and fewer correct responses for both attention and Peripheral Detection tasks compared to no conversation. However, conversation type (remote person or passenger) did not make a significant difference. Difficulty of the verbal task affected performance on the Peripheral Detection task, but not on the attention task. These findings imply that conversation has a negative effect on attention and peripheral detection, and may be even greater with difficult conversations. The authors reported that other studies found that conversation on a mobile phone resulted in slower driving compared with conversation with a passenger. Some researchers have hypothesised that passengers can see the driving situation and regulate the conversation according to the demands of the traffic environment by slowing or stopping the conversation.
A study by Törnros and Bolling (2005) was concerned with the effects of a mobile phone conversation on simulated driving in different traffic environments: rural or urban, with varying speed limits and complexity. Performance on a peripheral detection task (PDT) presented while driving was impaired by mobile phone conversation in all environments. However, PDT performance was remarkably poor in the complex urban environment, even when the participants were not using a phone. Driving speed was reduced by conversation in all environments for handheld mode, but only in two environments for hands-free mode. The effect on speed could be interpreted as a compensatory effort for the increased mental workload.
There have been a range of estimations about the number of accidents that are caused by, or contributed to, by driver distraction. It is hard to make an accurate estimate as accident databases are generally constructed from reports following an accident and it is probable that not every driver admits to being distracted or inattentive at the time of the accident. The largest analysis of driver behaviour conducted is the 100-Car Naturalistic Study (Neale et al) in the USA, which recorded the activities of 241 drivers over the course of 12 –13 months in order to build up a picture of how drivers behaved in cars. Around 42,300 hours of driving data was collected, and in this time the vehicles covered around 2 million miles. At the end of the study, researchers also had 15 police-reported and 67 non-police reported crashes to study, as well as 761 near-crashes and 8,395 ‘incidents’. It was found that 78% of the crashes and 65% of near crashes had one form of inattention or distraction as a contributing factor – including inattention due to fatigue. Another study (McEvoy et al 2003) which examined film footage of drivers in their vehicles, found that all drivers partook in at least one distracting activity, and that altogether, drivers spent 14.5% of the time that the vehicle was in motion involved in a distracting activity. They engaged in a distracting activity once every 6 minutes on

COOPERS integrated project
D15 - IR 7100/7200/7300/7400 Report on common result assessment
Page 173 of 191
average. In a study of US crash data (Stutts et al 2001), 8.3% of drivers were distracted at the time of their crash. However, the driver’s attention status was unknown in 35.9% of crashes and so there may be under reporting.
Although there are no standard guidelines for selection and design of appropriate alarm modalities for in-vehicle systems, specific modalities may prove to be more effective depending upon the application under design. At least three types of modalities (visual, audio and tactile) and their combinations are possible for any warning/alarm design. Displays serve to communicate information and information is needed for decision making and performing the proper control action in a timely manner. However, if the visual channel is overloaded, there are obvious advantages in allocating some information to other sensory channels. Driver workload may be impacted by alarm modality. Much of the information used by drivers is presented visually; therefore, it may be preferable to use alarms that access a different modality. For example, Srinivasan and Jovanis (1997) found that performance increased, in terms of decreased reaction times, for audio over visual displays of navigation information. Stokes et al. (1990) suggest that replacing traditional visual indicators with auditory signals, such as bells, beepers and electronic tones, reduce the need for visual instrument scanning, thereby allowing the user to devote more attention to other visual tasks. As in aircraft cockpits, Bois (1982) says that automobile dashboards are also growing in complexity as the number of vehicle functions increases. In this case, auditory signals may be the most effective means of unburdening the visual channel (Doll et al. 1984). Auditory displays also have the advantage that they do not require the user, once alerted, to adjust his or her gaze in order to receive the message. Thus, they would be valuable in situations where the user must maintain his or her eye fixation at a particular point in order to perform most effectively. In slippery road conditions where a vehicle might be prone to a skid, auditory alarms would help the user keep his or her fixation on the road in what is described as an `eyes busy’ task (Scott and Kee 1987).
Auditory displays do possess certain limitations that also need to be considered. For example, the driver is concentrating hard on the driving task, he/she might not hear or at least not register an auditory message. While the use of auditory information may help to alleviate the visual clutter, auditory displays - by their very nature - can be intrusive and distracting (Stokes et al. 1990). Drivers may get startled, annoyed or both by auditory warnings especially for non-emergency situations. However, in contrast with aircraft requirements, audio alerting signals might be best suited for automobiles since an automobile driver needs virtually constant eye contact with the road in order to maintain proper lane position. In automobiles, apart from audio alarms, visual alarms such as flashing lights or messages on the dashboard are a possibility, as are tactile interfaces such as vibrations in the steering wheel. Auditory displays may be more immediately salient than visual displays; however, they may also be more disrupting or annoying to the driver, increasing the likelihood that they will be turned off. Mollenhauer et al. (1994) found that, in a system that presented road sign information to drivers either visually or aurally, drivers performed worse with auditory displays, and also felt the auditory displays were more distracting. However, instructive alarms (`brake’, `slow down’), scaled to the urgency of the situation (Dingus et al. 1998) could be provided with an auditory interface. Dingus et al. (1997) also studied alarm modality for a collision warning system and found that a combined visual and auditory system provided some advantage in terms of increasing following distance over a solely visual or auditory display, under certain traffic conditions.

COOPERS integrated project
D15 - IR 7100/7200/7300/7400 Report on common result assessment
Page 174 of 191
Compared to an auditory alarm, a tactile interface may be similarly salient with less disruption, but also may be less informative since instructive messages cannot be given. Tactile interfaces may also be preferred by drivers, as the alarms are less obvious to others in the car, and therefore less embarrassing to the driver (Dingus et al. 1998). In both cases (auditory and tactile), the alarm could be used to alert the driver to a dashboard message regarding adverse conditions and driving recommendations. Allowing the driver to choose the modality is another option (Wheeler et al. 1998). However, some experts consider tactile displays potentially confusing - they can easily be misinterpreted. In any case, tactile interfaces were not studied in COOPERS.
Navigation systems have several ways of presenting route guidance information, including visual displays and audio messages. Visual displays can be either maps or turn-by-turn instructions. Because most information needed for driving is obtained visually, it has been assumed that audio messages would be less distracting than information presented on visual displays. Srinivasan and Jovanis (1997) used a driving simulator experiment to compare different methods of information presentation, which included a map display alone, map plus visual turn-by-turn displays, map plus voice guidance, and a paper map. The voice guidance system was associated with the best driving performance, defined as the fewest navigational errors, lowest workload, and fastest speeds. Because drivers were instructed to maintain posted speeds, slower speeds were interpreted as indicating greater distraction. Use of the paper map resulted in the slowest speeds, highest workload and most navigational errors. Based primarily on these results, voice instructions are considered to be less distracting than a visual display and turn-by-turn instructions are less distracting than maps (Young et al., 2003; Trezise et al., 2006).
Existing safety legislation and standards
A number of standards and guidelines that address the safety of telematics devices have already been published or are presently in development. Appendix A describes some of the existing safety standards and guidelines relevant to in-vehicle telematics devices including ISO standards, Human Factors process standards, UK guidelines, European Statement of Principles on Human-Machine Interface, Japan Automobile Manufacturers Association Guidelines and the Alliance of Automobile Manufacturers Statement of Principles. Since a limited scientific understanding exists for the objective and accurate evaluation of driver distraction, few of these standards and guidelines attempt to set out performance-based requirements, and compliance with them is voluntary. The available guidelines and recommendations are not satisfactory at present. Many of them are unverifiable, incomplete and under-specified. Nonetheless, they offer some guidance to designers or evaluators of telematics devices and give direction for some initiatives to limit driver distraction.
6.4.2.1 Transport Canada
Transport Canada (2003) is concerned that in-vehicle telematics devices are a threat to road safety because they increase driver distraction and will cause an increase in distraction-related crashes. This was based on a substantial and mounting body of research indicating that the use of these devices impairs driving performance.

COOPERS integrated project
D15 - IR 7100/7200/7300/7400 Report on common result assessment
Page 175 of 191
Driver distraction would be less of a problem if systems were designed to support or be compatible with driving. Their document reviews some of the possible initiatives that might be taken to limit the problem and facilitate effective driver-system integration. These initiatives are not mutually exclusive and some may be complementary. The current situation is unsatisfactory and unlikely to improve without some intervention.
According to Transport Canada, public awareness campaigns might alleviate the problem, but the effect may only be temporary. To be effective, initiatives need to target the telematics devices themselves, and not just the drivers. A voluntary Memorandum of Understanding between government jurisdictions and industry is proposed as one option. It would be developed through negotiation, and would require manufacturers to agree to follow human factors guidelines for the design of in-vehicle systems and implement a design process for driver-system integration. As part of this MOU, manufacturers would enable their event data recorders to record details on the status of telematics devices at the time of collision. This would help to clarify the contribution of telematics devices to collisions. A comprehensive features list of equipment fitted to specific models of motor vehicles would also help to gauge the risk of these devices. This MOU could help to gain further commitment to develop such a comprehensive vehicle features database.
Several other variations on this MOU were discussed. One was to make a unilateral advisory to the automotive industry that the federal government expects them to follow the strictest available safety guidelines and a driver-system integration process when designing telematics devices. Another would be to take this a step further and develop a regulation that would embody the key elements of the MOU and advisory.
Regulatory initiatives disabling access to telematics devices in moving vehicles, having safer limits on visual distraction and prohibiting open-architectures were also discussed.
Transport Canada invited industry, local government, road safety interest groups and the public to comment on these issues and initiatives and to provide feedback on alternative approaches for reducing driver distraction. The hope is that initiatives can be identified, so that real progress can be made on limiting the serious problem of driver distraction from in-vehicle telematics devices.
6.4.2.2 ISO International Standards
The standards published by the International Organization for Standardization (ISO) are developed by expert committees comprised of representatives from some 140 countries, and therefore they represent a world-wide consensus on acceptable practice in a given area. In developing these standards, the views of all interested parties are taken into account, including those of industry, users, consumer groups, testing laboratories, governments, engineering professions, and research organizations.
The ISO is in the process of preparing international standards that treat different aspects of what it refers to as “transport information and control systems”. One of these standards has been accepted, two are drafts, and a fourth is still in development. Two other standards apply to telematics devices

COOPERS integrated project
D15 - IR 7100/7200/7300/7400 Report on common result assessment
Page 176 of 191
even though they were not written with the latter specifically in mind (ISO 13407 and ISO 9241-3). These ISO standards are the following:
• EN ISO 15007-1, 2002, International Standard: Road vehicles — Measurement of driver visual behaviour with respect to transport information and control systems — Part 1: Definitions and parameters
• EN ISO 17287:2003, Road vehicles - Ergonomic aspects of transport information and control systems - Procedure for assessing suitability for use while driving
• EN ISO 15006:2004, Road vehicles - Ergonomic aspects of transport information and control systems - Specifications and compliance procedures for in-vehicle auditory presentation
• EN ISO 15005:2002, Road vehicles - Ergonomic aspects of transport information and control systems - Dialogue management principles and compliance procedures
• ISO 13407, International Standard: Human-centred design processes for interactive systems;
• ISO 9241-3, International Standard: Ergonomic requirements for office work with visual display terminals (VDTs) — Part 3: Visual display requirements.
• EN ISO 15008:2009, Road vehicles - Ergonomic aspects of transport information and control systems - Specifications and test procedures for in-vehicle visual presentation
These standards, which represent good ergonomics practice for each subject covered, vary slightly depending on the topic. For instance, the draft standard on in-vehicle auditory presentation makes recommendations and sets out specific requirements, while the draft standard on assessing the suitability of telematics devices for use while driving lays out an exhaustive evaluation process. None define the specific characteristics of a safe telematics device, although the ISO 13407 usability process standard on “Human Centred Design for Interactive Systems” has some relevance to telematics devices.
The human-centred design process outlined in ISO 13407 aims to ensure that products will be effective, efficient and satisfying for users. The standard describes four activities: 1) understand and specify the context of use; 2) specify user requirements; 3) produce design solutions; 4) evaluate designs against requirements. This ergonomic standard is relevant to the design of in-vehicle telematics systems because they are interactive systems. However, ISO 13407 is insufficient because it neglects to address problems specific to the vehicle context and road safety. Thus a more specific or complementary standard is required to ensure that in-vehicle telematic systems are designed with a process that ensures the proper consideration of safety, user needs and the problems of driver distraction.
The systematic application of human factors in product development would help to ensure these telematics devices do not directly or indirectly increase the risk of collision or injury to vehicle occupants or other road users. The process would further enhance the usability and appeal of

COOPERS integrated project
D15 - IR 7100/7200/7300/7400 Report on common result assessment
Page 177 of 191
products because it would lead to the development of telematics devices that match user needs in a way that is compatible with and, suitable for, driving. A process standard would assist manufacturers in vetting the quality and safety of their suppliers’ products. Such a process would also clearly demonstrate the manufacturers’ commitment to their duty of care to produce reasonably safe products.
6.4.2.3 The European Statement of Principles on Human-Machine Interface
On December 21, 1999, the Commission of the European Communities issued a five-page recommendation that set out 35 fundamental principles for the design of safe in-vehicle information and communication systems. The principles cover the design, location, information presentation, interaction with displays and controls, system characteristics, and product information of telematics devices. They are clear, concise, and comprehensive; however, they are qualitative in nature and, therefore, lack a method for ascertaining whether a given telematics device complies with the requirements. In an attempt to provide such a method, the European Commission charged an independent expert group with expanding the principles “in sufficient detail for work to begin on procedures to test if a specific system conforms to the Principles”. The result was a 52-page document called: “Report of an Independent Expert Group on the Expansion of the Principles laid down in the Commission Recommendation of 21 December 1999 on ‘Safe and Efficient In-vehicle Information and Communication Systems’ (2000/53/EC)”. On December 22, 2006, the Commission of the European Communities issued an Update of the European Statement of Principles on human machine interface.
6.4.2.4 The European eSafety Forum
HMI
One of the 24 proposed actions adopted by the ITS Action Plan in December 2008 (see section 0 and Table 17) was “Development of a regulatory framework on a safe on-board human-machine-interface and the integration of nomadic devices, building on the European Statement of Principles…” (ESOP)
Vehicle manufacturers have a well-established process for introducing new HMI for integrated systems and can be relied on to meet a satisfactory safety standard. However after-market systems purchased by the public could create significant driver distraction as they are not integrated into the vehicle. These after-market systems are known as nomadic devices and concern over their use was reported in the following WG-HMI Report October 2009. COOPERS systems, particularly infrastructure-to-vehicle, can be supported by nomadic devices.
The WG-HMI Report chaired by Alan Stevens (TRL,UK) and Christhard Gelau (BASt, Ge), was published October 2009. It was appreciated that the Personal Navigation Devices industry was maturing and leading manufacturers appreciate the importance of good HMI. A larger concern surrounds other Nomadic Devices, particularly Smart Phones and Personal Digital Assistants, where the hardware is multi-purpose and not specifically designed for in-vehicle use but is rendered useful while driving as a result of application software. COOPERS systems will have similar issues.

COOPERS integrated project
D15 - IR 7100/7200/7300/7400 Report on common result assessment
Page 178 of 191
The Report concluded that the ESoP is essentially adequate but a substantive update could now be undertaken. There is also a need to monitor ongoing developments and the ESoP needs to be re-visited periodically. Newer technology such as voice controlled systems, HUDs and haptic elements need to be included in future updates.
LIABILITY
The EC project RESPONSE has developed a Code of Practice for Development, Validation and Market Introduction of ADAS. The Code of Practice is designed to help manufacturers to “safely” introduce new applications through an integrated perspective on human system and legal aspects.
The first classification level of ADAS systems is Information and Warning which includes the COOPERS systems. Visible and audible information is provided to the driver in order to assist careful and proper driving. The driver is therefore responsible for exercising due care when driving. However, there is a possibility that the information provided by the system may be incorrect ot inaccurate. If this is the case, the manufacturer or information provider liability should also be taken into consideration.
Depending on the possible outcome of malfunctions in various traffic situations a safety requirement has to be derived. There is no standard risk assessment at the moment. The automotive industry is currently proposing a methodology for risk assessment.
The Response Project Code of Practice will establish a specification framework to cover these issues and assist in minimising liability risk.
Data Protection
The EU Working Party on the Protection of Individuals with regard to the Processing of Personal Data has developed an approach on the transmission of personal data and issued a report “Working document on data protection and privacy implications in eCall initiative” 26 September 2006.
The aim of the working document is to outline data protection and privacy concerns arising in connection with the planned introduction of a harmonised pan-European in-vehicle emergency call “eCall” service that builds on the single European emergency number 112.
The eCall consists of two elements: a pure voice (audio) call based on 112 and a minimum Set of Data. The Minimum Set of Data (MSD) consists of the following: (i) time of incident (ii) precise location including direction of driving (iii) vehicle identification (iv) eCall qualifier giving the severity of the incident (as a minimum, an indication if eCall has been manually or automatically triggered) (v) information about a possible service provider.
The second level of service lies in adding to the exchanged “basic” information included in the MSD additional information held by a third party providing added value services e.g. insurance companies,

COOPERS integrated project
D15 - IR 7100/7200/7300/7400 Report on common result assessment
Page 179 of 191
automobile call centres, medical companies, lawyers, motor clubs etc. In case a “full set of data” is transmitted a contract between the owner of the vehicle and the service provider is required.
From a data protection point of view, an emergency call released automatically by a device or triggered manually and transmitted via mobile networks resulting in localization of the emergency event is in principle admissible, provided that there exists a respective specific legal basis and sufficient data protection safeguards are provided. However, the purposes of the emergency call system and the relevance of the data to be processed must always be taken into account, in particular if the processing involves the Full Set of Data. The progress made by the eCall system will assist in the introduction of COOPERS systems.
Summary
In terms of messaging functions, COOPERS HMI is similar to the one used in current in-vehicle navigation systems. The main part of the display area is used to show a road map as it does with a navigation function. The main difference in HMI between COOPERS and navigation systems is that additional information panels are included at the right hand side and at the bottom to inform/warn drivers of incident ahead (this means that a slightly large display area is needed for COOPERS HMI in order to achieve the same display effects as the current navigation HMI).
A regulation requiring manufacturers to limit the visual distraction from in-vehicle telematics devices should be developed by the industry. Based on the rationale that long and frequent glances away from the road are hazardous, in-vehicle information devices that require less visual attention to operate are safer than devices that demand more visual attention. For example, in-vehicle telematics tasks must require less than 10 seconds of visual attention to complete, of which no single glance shall be longer than 1.5 seconds (as suggested by Transport Canada).
In order to reduce driver information overload, a regulation requiring operators to limit the information provided to the drivers should be developed (e.g. in terms of the volume and frequency). Such legislation/regulations should be established at international level in consideration of many international travellers by cars.
Much evidence has proved that visual messages are more distracting than audio messages. A regulation should be developed to prevent abuse of visual message services.
Multifunction interfaces become a problem when there is no reasonable limit to the number of functions they can perform and the amount of information they access. A regulation should be developed to limit the number of different tasks that can be performed and the quantity of information available through multifunction interfaces.
As an alternative to an advisory regarding process requirements for driver-system integration, a regulation could be developed to embody the key elements. Process-oriented safety standards can be an effective regulatory tool, particularly when performance based standards

COOPERS integrated project
D15 - IR 7100/7200/7300/7400 Report on common result assessment
Page 180 of 191
do not yet exist. Standards for the analysis, test and validation of the human factors compatibility could also be required for in-vehicle information devices.
For providing safety related information (e.g. speed limits), some regulations should be developed to ensure consistency between different sources (e.g. between roadside and in-vehicle information)
Open communication architectures are suggested for cooperative systems (e.g. CVIS, COOPERS, and SAFESPOT). An advantage of open architecture is that it allows service providers to access the network for providing information service to drivers. The main concern with such approach is that it may allow the use of untested after-market ‘plug-and-play’ type applications. In order to prevent the installation of distracting telematics devices that are not compatible with driving, some legislation should be made to regulate this feature.
ITS Action Plan and Directive
In December 2008 the Commission published its “Action Plan for the Deployment of Intelligent Transport Systems in Europe” (European Commission (2008a), and an accompanying “Proposal for a Directive Of The European Parliament And Of The Council laying down the framework for the deployment of Intelligent Transport Systems in the field of road transport and for interfaces with other transport modes” (European Commission (2008b).
The background to these documents are a number of transport problems in Europe:
Road traffic congestion affects 10 % of the road network, and costs about 1% of the EU GDP;
Road transport accounts for 72 % of all transport-related CO2 emissions, and this percentage is increasing;
The number of road fatalities (42953 in 2006), though reducing, is still above the intended target of a 50 % reduction from the 2001 figure by 2010.
And these these problems will worsen with the forecast growth rates of 50 % for freight and 35 % for passenger transport between 2000 and 2020.
The objective is to make transport and travel cleaner, more efficient (including energy efficient), safer and more secure, and ITS has a major role to play in this. But much of the activity currently is fragmented, and the Commission’s view is that its objectives will not be achieved without EU-wide coordination. These activities cover clean and energy-efficient transport, road congestion, traffic management, road safety, security of commercial transport operations and urban mobility, and in the longer term, cooperative systems based on vehicle-to-vehicle (V2V), vehicle-to-infrastructure (V2I) and infrastructure-to-infrastructure (I2I) communication and exchange of information.
Hence the relevance of these initiatives to COOPERS.

COOPERS integrated project
D15 - IR 7100/7200/7300/7400 Report on common result assessment
Page 181 of 191
The ITS Action Plan (European Commission 2008a) and the Proposal for a Directive (European Commission 2008b) resulted from wide stakeholder consultation, including interviews with private and public sector stakeholders, workshops, an internet questionnaire, and discussions in stakeholder forums. The conclusion was that ITS deployment should be policy-led at the EU level, and that responsibilities need to be clearly identified including the role for public-private cooperation.
Action Plan for the Deployment of ITS in Europe
Six priority areas for action and related measures were identified, namely:
1. Optimal use of road, traffic and travel data.
2. Continuity of traffic and freight management ITS services on European transport corridors and in conurbations.
3. Road safety and security.
4. Integration of the vehicle into the transport infrastructure.
5. Data security and protection, and liability issues.
6. European ITS cooperation and coordination.
All of these priority areas are relevant to COOPERS, especially numbers 4 and 5; the most relevant detailed actions bearing on COOPERS are listed in Table 17.
Action
1: Optimal use of road, traffic and travel data
1.1 Definition of procedures for the provision of EU-wide realtime traffic and travel information services, addressing traffic information services, traffic regulation data and access to safety-related information and relevant public data
2010
1.2 Optimisation of the collection and provision of road data and traffic circulation plans, traffic regulations and recommended routes (in particular for heavy goods vehicles)
2012
1.4 Definition of specifications for data and procedures for the free provision of minimum universal traffic information services
2012
2: Continuity of traffic and freight management ITS services on European transport corridors and in conurbations
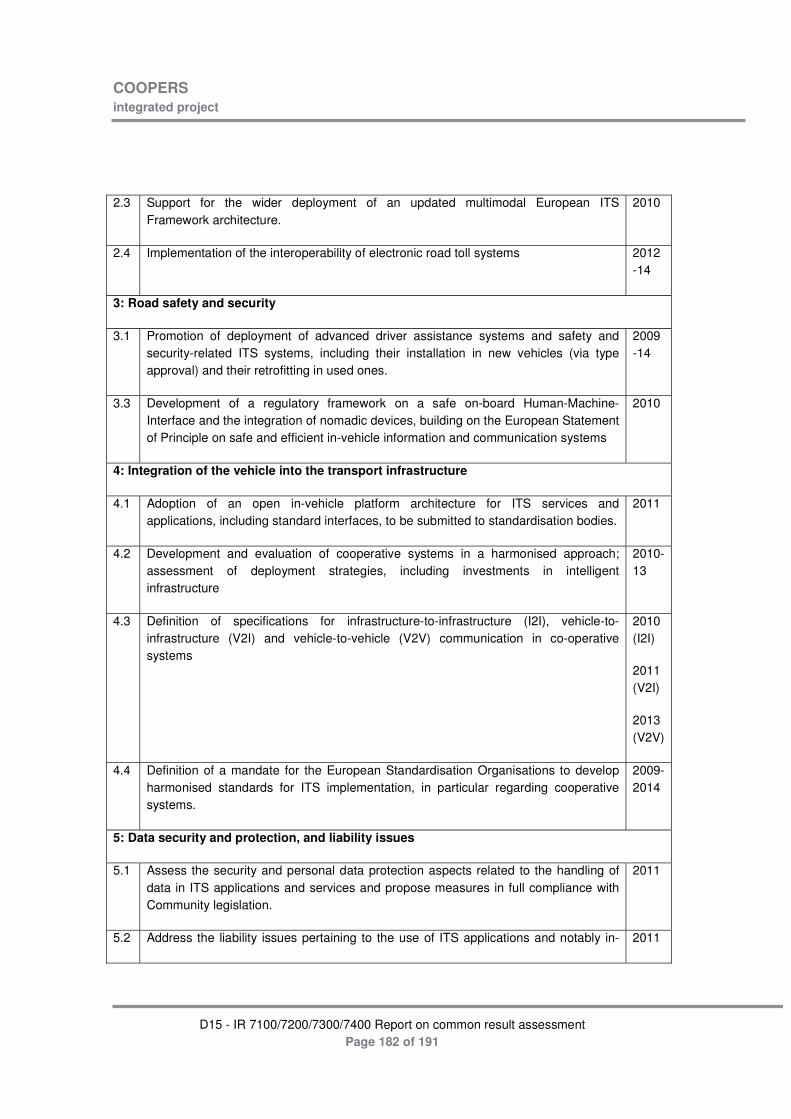
COOPERS integrated project
D15 - IR 7100/7200/7300/7400 Report on common result assessment
Page 182 of 191
2.3 Support for the wider deployment of an updated multimodal European ITS Framework architecture.
2010
2.4 Implementation of the interoperability of electronic road toll systems 2012 -14
3: Road safety and security
3.1 Promotion of deployment of advanced driver assistance systems and safety and security-related ITS systems, including their installation in new vehicles (via type approval) and their retrofitting in used ones.
2009 -14
3.3 Development of a regulatory framework on a safe on-board Human-Machine-Interface and the integration of nomadic devices, building on the European Statement of Principle on safe and efficient in-vehicle information and communication systems
2010
4: Integration of the vehicle into the transport infrastructure
4.1 Adoption of an open in-vehicle platform architecture for ITS services and applications, including standard interfaces, to be submitted to standardisation bodies.
2011
4.2 Development and evaluation of cooperative systems in a harmonised approach; assessment of deployment strategies, including investments in intelligent infrastructure
2010-13
4.3 Definition of specifications for infrastructure-to-infrastructure (I2I), vehicle-to-infrastructure (V2I) and vehicle-to-vehicle (V2V) communication in co-operative systems
2010 (I2I)
2011 (V2I)
2013 (V2V)
4.4 Definition of a mandate for the European Standardisation Organisations to develop harmonised standards for ITS implementation, in particular regarding cooperative systems.
2009-2014
5: Data security and protection, and liability issues
5.1 Assess the security and personal data protection aspects related to the handling of data in ITS applications and services and propose measures in full compliance with Community legislation.
2011
5.2 Address the liability issues pertaining to the use of ITS applications and notably in- 2011
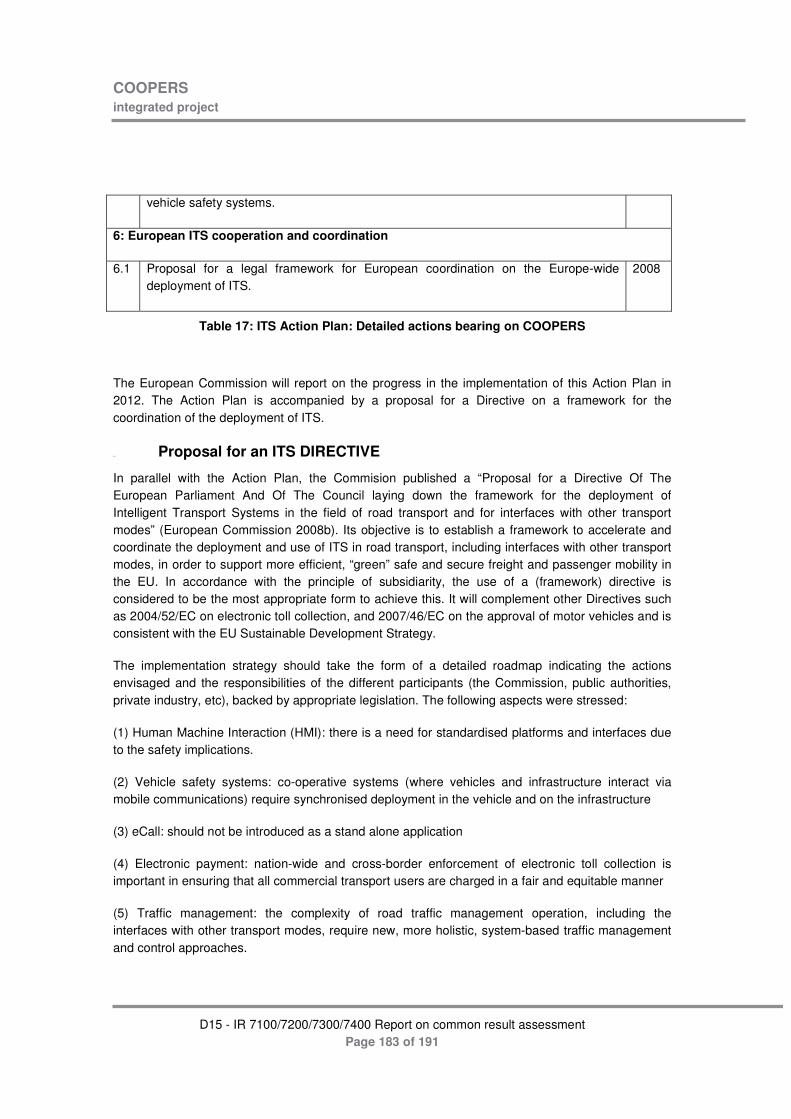
COOPERS integrated project
D15 - IR 7100/7200/7300/7400 Report on common result assessment
Page 183 of 191
vehicle safety systems.
6: European ITS cooperation and coordination
6.1 Proposal for a legal framework for European coordination on the Europe-wide deployment of ITS.
2008
Table 17: ITS Action Plan: Detailed actions bearing on COOPERS
The European Commission will report on the progress in the implementation of this Action Plan in 2012. The Action Plan is accompanied by a proposal for a Directive on a framework for the coordination of the deployment of ITS.
6.4.3 Proposal for an ITS DIRECTIVE
In parallel with the Action Plan, the Commision published a “Proposal for a Directive Of The European Parliament And Of The Council laying down the framework for the deployment of Intelligent Transport Systems in the field of road transport and for interfaces with other transport modes” (European Commission 2008b). Its objective is to establish a framework to accelerate and coordinate the deployment and use of ITS in road transport, including interfaces with other transport modes, in order to support more efficient, “green” safe and secure freight and passenger mobility in the EU. In accordance with the principle of subsidiarity, the use of a (framework) directive is considered to be the most appropriate form to achieve this. It will complement other Directives such as 2004/52/EC on electronic toll collection, and 2007/46/EC on the approval of motor vehicles and is consistent with the EU Sustainable Development Strategy.
The implementation strategy should take the form of a detailed roadmap indicating the actions envisaged and the responsibilities of the different participants (the Commission, public authorities, private industry, etc), backed by appropriate legislation. The following aspects were stressed:
(1) Human Machine Interaction (HMI): there is a need for standardised platforms and interfaces due to the safety implications.
(2) Vehicle safety systems: co-operative systems (where vehicles and infrastructure interact via mobile communications) require synchronised deployment in the vehicle and on the infrastructure
(3) eCall: should not be introduced as a stand alone application
(4) Electronic payment: nation-wide and cross-border enforcement of electronic toll collection is important in ensuring that all commercial transport users are charged in a fair and equitable manner
(5) Traffic management: the complexity of road traffic management operation, including the interfaces with other transport modes, require new, more holistic, system-based traffic management and control approaches.

COOPERS integrated project
D15 - IR 7100/7200/7300/7400 Report on common result assessment
Page 184 of 191
An “Impact assessment” identified the so-called “Option B+” as the favoured policy option. It focusses on co-ordination and synergy measures including:
(1) definition of a functional open in-vehicle platform allowing the multiple use of key components (communication technologies, positioning, processing power and Human Machine Interface);
(2) setting up of (a) a European ITS Committee, constituted of Member States representatives to assist the Commission in adopting specific measures in defined areas via a comitology procedure, and (b) an ITS Advisory Group of high level representatives from different sectors (i.e. ITS service providers, associations of users, transport and facilities operators, manufacturing industry, social partners, existing professional associations, etc…), advising the Commission on business and technical aspects and discussing provider and user requirements and priorities.;
(3) definition of a framework for optimised use of road and traffic data;
(4) development of a framework for the continuity of ITS services (e.g. interfaces between interurban and urban transport);
(5) tackling of data security and protection, privacy and liability issues.
(6) a Directive.
The Commission, assisted by the European ITS Committee and exchange of information with Member States, would decide on specific actions for:
(1) the establishment of procedures and specifications for the accelerated deployment and use of traffic and travel data, European road traffic management, continuity of ITS services for freight and passengers, road safety and security, the definition of an open in-vehicle platform for ITS Services, including a standardisation process (CEN/CENELEC/ETSI)
(2) type-approval of road-infrastructure-related ITS equipment and software, falling outside the scope of Directives 2002/24/EC, 2003/37/EC and 2007/46/EC.
Proposing secondary legislation via the comitology procedure would allow the Commission to assert effective coordination among stakeholders to remove existing bottlenecks and barriers. The positive effects anticipated on congestion, road safety and emissions will thus be reached earlier.
In the Directive the Commission will define specifications for the deployment and use of ITS, in particular in the following priority areas:
(a) optimal use of road, traffic and travel data;
(b) continuity of traffic and freight management ITS services on European Transport Corridors and in conurbations;
(c) road safety and security;

COOPERS integrated project
D15 - IR 7100/7200/7300/7400 Report on common result assessment
Page 185 of 191
(d) integration of the vehicle into the transport infrastructure. This will include the definition of measures to progress the development and implementation of cooperative (vehicle infrastructure) systems, in particular:
– The facilitation of the exchange of data and information between vehicle and vehicle, vehicle and infrastructure, infrastructure and infrastructure
– The availability to the respective parties (vehicle or road infrastructure) of the relevant data or information to be exchanged
– The use of a standardised message format for this exchange of data between the vehicle and the infrastructure
– The definition of an communication infrastructure for each type of exchange (V2V, V2I, I2I)
– The use of standardisation processes to adopt the respective architectures
It is clear that COOPERS can help in shaping the Directive.
Summary and conclusions
6.4.4 Summary
In COOPERS, cooperative systems are developed and demonstrated which are based on wireless I-V communication. The key objective of COOPERS is to make road traffic safer, more predictable and more controllable in terms of the individual driver behaviour through development and implementation of co-operative services. The main objective of this report is to review results of from COOPERS and other studies on the basis of existing European road safety legislation and safety standards, and make recommendations that enable the introduction of safety technology in a way that is in the interest of all stakeholders, including the road users, the road operators and the automotive industry. Based on the studies, the following conclusions can be drawn:
6.4.4.1 Liability issues
• There are likely to be no new inherent liability issues with the provision of in-vehicle information systems such as those provided by COOPERS which give an additional secondary level of information to that available off-vehicle and by normal driver observation and awareness. Practice may be to have a liability statement to be accepted by the driver as is common with navigation systems
• If a COOPERS system was to be developed/used to provide subtle speed control with variation of speed limits in time and space not fully supported by roadside systems, liability would change. However, such a control would be at some considerable time in the future that the underlying technology will have developed and knowledge of its performance more understood.

COOPERS integrated project
D15 - IR 7100/7200/7300/7400 Report on common result assessment
Page 186 of 191
• There are issues of application which may result in conflict, but which are not necessarily formal liability issues. These may relate to the quality of information passed between stakeholders which could be dealt with under control. Issues in which some technical or operational failure leads to, for example, two adjacent drivers receiving conflicting information, or internally provided information conflicts with that provided externally
6.4.4.2 Privacy and data ownership
• Data from COOPERS vehicles could be used only by the specific agreement of the individual drivers. This could involve procedures to ensure anonymity. This would require no new legislation, but would be addressed by the data protection acts. (Legal framework within the EC)
• If a COOPERS application becomes mandatory, such as with road user charging, legal changes may be necessary in some countries and at an EC level. As for the complexity of the program, such a task will pose a great interdisciplinary challenge, which can most probably only be met by close cooperation between legal and technical experts.
6.4.4.3 Driver distraction and overload
• Driver distraction may be caused by inappropriate HMI design. Currently several ISO standards are available which address how HMI should be designed. On December 22, 2006, the Commission of the European Communities issued an Update of the European Statement of Principles on human machine interface. The principles cover the design, location, information presentation, interaction with displays and controls, system characteristics, and product information of telematics devices. From a technology perspective, HMI requirements (e.g. visual and audio display/messaging) for COOPERS systems are very similar to that of current in-vehicle navigation systems.
• Application of COOPERS systems may influence driver distraction/information overload in several situations:
o Too much visual distraction
o Too much information from multi functions/services
o Inconsistency between roadside and in-vehicle information, and between different sources of in-vehicle information
o Open communication architectures may result in entry of distracting information services that are not compatible with driving
• Recommendations

COOPERS integrated project
D15 - IR 7100/7200/7300/7400 Report on common result assessment
Page 187 of 191
o No new legislation will be required for a non-mandatory system.
o In the long term, new legislation for mandatory use of COOPERS system could be based on levels of technical, operation and safety performance and steps must be taken to collect an evidence base as a background to such legislation
o New regulations should be developed to support provision of the COOPERS services in a safe, efficient and effective way

COOPERS integrated project
Assessment of driver behaviour, traffic performance and safety
Page 188 of 191
7 Annex A Speed and accelerations
Speed in the whole test drives
Off On Off On002 121.31 1.00 2.00 12.76003 123.40 122.00 15.62 16.00004 109.36 111.79 19.54 14.95005 123.51 119.44 12.31 10.54006 114.38 116.76 11.51 13.84008 124.83 120.81 8.78 13.44011 120.60 117.45 14.89 12.32014 129.64 125.93 8.18 12.91016 126.85 125.21 11.74 8.19017 115.55 111.52 11.34 10.71018 114.63 118.28 11.84 12.86019 130.23 126.50 15.62 10.28020 123.19 112.16 17.35 16.39021 108.47 104.29 7.93 12.73022 120.58 119.37 21.24 20.86023 120.97 127.95 9.12 16.16024 119.73 106.22 10.64 15.17025 112.46 116.43 15.85 12.79028 124.47 119.45 20.44 16.07029 108.57 105.43 14.39 15.77031 125.13 114.09 10.09 10.31032 122.66 118.52 11.98 12.64034 111.30 110.30 18.41 19.41035 122.57 110.17 12.41 11.64036 124.93 126.01 17.06 17.82038 114.66 105.70 13.54 16.27039 106.19 108.24 11.80 11.76040 114.83 121.92 11.79 13.49041 99.70 106.56 13.54 11.67042 119.60 133.23 21.23 15.45043 125.86 123.45 18.65 13.59045 116.01 114.45 10.34 8.99046 137.17 130.55 21.95 22.20047 121.16 111.15 9.27 12.83048 126.61 123.01 19.62 18.23
average 119.46 113.87 13.77 14.03
Driver_IDAverage speed (km/h) StD of speed (km/h)

COOPERS integrated project
Assessment of driver behaviour, traffic performance and safety
Page 189 of 191
Off On Off On002 117.65 108.80 8.73 6.24003 111.18 119.82 5.46 1.64004 83.22 112.21 1.19 3.69005 120.15 120.60 3.77 8.00006 120.08 109.98 3.79 6.36008 121.05 112.00 2.96 1.36011 114.91 111.46 5.50 5.79014 127.01 110.83 4.48 2.82016 99.52 118.95 5.14 1.38017 119.64 116.71 2.05 6.17018 103.44 103.96 6.73 4.89019 100.85 126.47 5.89 5.49020 118.95 109.88 4.09 6.02021 112.67 96.07 0.14 4.42022 102.64 93.58 10.06 8.66023 118.60 119.71 3.04 3.07024 107.07 97.58 4.14 1.97025 113.45 115.65 3.54 4.77028 127.54 124.81 4.53 1.96029 91.67 88.49 7.19 1.57031 122.24 114.51 1.04 1.14032 109.81 118.21 4.10 3.73034 103.66 103.88 8.75 9.05035 131.01 108.72 4.24 7.39036 115.66 108.30 10.57 12.51038 119.46 98.42 4.60 9.67039 104.24 111.88 4.39 2.54040 110.15 118.44 2.29 7.14041 86.90 96.97 3.64 3.76042 114.71 128.59 20.14 6.34043 128.27 109.95 4.02 19.17045 105.22 116.53 10.48 1.63046 124.41 127.66 1.75 7.15047 114.43 106.22 2.04 6.61048 124.66 121.84 4.97 13.15
average 112.75 111.65 5.13 5.64
Approaching RW zone 2 (-800m)
Driver_IDAverage speed (km/h) StD of speed (km/h)

COOPERS integrated project
Assessment of driver behaviour, traffic performance and safety
Page 190 of 191
8 References
[1] Cooperative Vehicles Infrastructure Systems (CVIS) (2007): D.DEPN 6.1 Risk and Liability by Marco Annoni, Rene Jacobs, Marcel Konjin, David Martin-Clark, Marion Robery and Mats Rosenquist, November
[2] COOPERS (2007): D11-B-IR_2600-2700-2_Market _and_user _assessment_v02_perr_reviewed_07032008.pdf
[3] COOPERS (2007) 2: IR2400-2 HMI HMI Guidelines for operators, automotive industry and road user interest groups
[4] D16-IR 8200/8500: Final report for disseminating the demonstration achievements, revised business development & roll out strategy”
[5] Directive 2002/58/EC concerning the processing of personal data and the protection of privacy in the electronic communications sector (Directive on privacy and electronic communications).
[6] Directive 97/66/EC concerning the processing of personal data and the protection of privacy in the telecommunications sector.
[7] Regulation (EC 45/2001 on the protection of individuals with regard to the processing of personal data by the Community institutions and bodies on the free movement of such data.
[8] Directive 95/46/EC on the protection of individuals with regard to the processing of personal data and on the free movement of such data.
[9] ADVISORS (Action for advanced Driver assistance and Vehicle control systems Implementation (2003), Standardisation, Optimum use of the Road network and Safety, Final Publishable Report
[10] http://www.its.dot.gov/jpodocs/repts_te/14058_files/index.htm
[11] Fekpe, Edward; Gopalakrishna, Deepak: Traffic data quality workshop proceedings and action plan. final report. http://ntl.bts.gov/card_view.cfm?docid=23933
[12] Traffic Data Quality Workshop Work. Order Number BAT-02-006: Defining and measuring traffic data quality http://www.its.dot.gov/JPODOCS/REPTS_TE/13767.html
[13] http://www.its.dot.gov/JPODOCS/REPTS_TE/13839.html
[14] COOPERS (2008): IR 3800 Report on new functions, requirements and algorithm for direct control and decision support
[15] ITS Europe (2008): Impact analyses of co-operative Systems on external Effects, Thomas Richter (Presentation)
[16] (COOPERS, 2010): IR 5200/5300/5400/5500/5600 "Report on test results and possible improvements, testing of I2V & V2V interfaces, testing on car network components, system validation and explored synergies"

COOPERS integrated project
Assessment of driver behaviour, traffic performance and safety
Page 191 of 191
[17] (COOPERS, 2010): IR5100-2 "Test Report Evaluations"