cooperative monitoring evaluation and research...
TRANSCRIPT

COOPERATIVE MONITORING EVALUATION AND RESEARCH 05-507
Validation of the Western Washington Riparian Desired Future Condition Performance Targets in the Washington State Forest Practice Rules with Data from Mature, Unmanaged, Conifer-
Dominated Riparian Stands.
MARCH 2005
By: Dave Schuett-Hames, Robert Conrad and Ashley Roorbach
Northwest Indian Fisheries Commission

Validation of the Western Washington Riparian
Desired Future Condition (DFC) Performance Targets
In the Washington State Forest Practices Rules With Data
From Mature, Unmanaged, Conifer-Dominated Riparian Stands
By: Dave Schuett-Hames, Robert Conrad and Ashley Roorbach
Northwest Indian Fisheries Commission Olympia
Prepared for: The Riparian Scientific Advisory Group (RSAG) of the
Cooperative Monitoring, Evaluation and Research Committee (CMER)
March 2005


Abstract The purpose of this study was to evaluate the current riparian Desired Future Condition (DFC) performance targets for riparian stands adjacent to fish-bearing streams in western Washington. The objectives were to: 1) document characteristics of mature, unmanaged conifer and mixed composition riparian stands in western Washington; 2) estimate mean basal area per acre by site class and compare the results with the current DFC performance target values; and 3) estimate values for other stand attributes and evaluate their feasibility as DFC performance target metrics. A random sample of 113 riparian stands west of the Cascade Mountain divide was selected for study. Site class (productivity) categories were sampled separately so the specific performance target for each site class could be compared with data from an equivalent set of sites. Summary statistics were estimated for stand attributes including trees per acre, quadratic mean diameter, basal area per acre, volume, Curtis’ relative density, and mean over story tree height. Mean live conifer basal area per acre (LCBAPA) was estimated by map site class (SC) for site classes II, III, IV and V and compared with the DFC performance targets. Mean LCBAPA values (ft2/acre) were 333.8 (SC II), 307.7 (SC III), 353.1 (SC IV) and 341.0 (SC V). These values were significantly greater than the DFC targets (P < 0.001). The differences ranged from 49.7 ft2/acre for SC III to 151.0 ft2/acre for SC V. The percentage of sites with LCBAPA values greater than the DFC targets ranged from 66.7% for SC II to 100% for SC IV and V. These results indicate that the current DFC targets are low for these site classes. No conclusions were reached concerning map site class I because only 1 site was available. Similar results were obtained when the data were sorted by field site class and compared with the DFC targets, supporting the conclusions of the analysis by map site class. Differences in mean LCBAPA between site class groups were not statistically significant (either by map or field site class). The data indicate that stem diameter tends to increase as site productivity increases while density (trees per acre) decreases. These factors offset one another, resulting in similar basal area values for high density, small diameter stands on poor quality sites and large diameter, low density stands on sites with higher productivity. Most site attributes explained little of the variability in LCBAPA. Of the 16 variables tested, only dominant tree species and precipitation had significant relationships with LCBAPA. The difference in mean LCBAPA between stands dominated by Douglas-fir and those dominated by western hemlock were statistically significant. A discrepancy was observed between the site class indicated on maps and site class estimates from field measurements. The map and field site class calls were in agreement less than half of the time, and in the majority of the cases where they disagreed, the field estimates indicated higher productivity than the map site classes. Although this study was not designed to evaluate the accuracy of site class maps, it provides an indication of possible inaccuracies that may affect their utility as a framework for riparian management. A suite of alternative target metrics were evaluated on the basis of their ability to characterize stand structure, variability, biological/ecological significance and cost/feasibility. None were clearly superior to basal area per acre as a DFC target metric but several better distinguished differences in stand structure associated with site productivity. Volume appears to provide the most information about the stand because it incorporates tree density, diameter and height and directly relates to potential LWD recruitment.
Final Report March 3, 2005 i
Table of Contents ABSTRACT ..................................................................................................................................................................i TABLE OF CONTENTS ...........................................................................................................................................II INTRODUCTION .......................................................................................................................................................1 STUDY DESIGN .........................................................................................................................................................2
PURPOSE....................................................................................................................................................................2 STUDY APPROACH.....................................................................................................................................................2 SAMPLING STRATEGY................................................................................................................................................3
METHODS...................................................................................................................................................................5 DATA COLLECTION....................................................................................................................................................5 DATA ANALYSIS........................................................................................................................................................6
STUDY SITES .............................................................................................................................................................9 RESULTS...................................................................................................................................................................12
DFC PERFORMANCE TARGET VALIDATION.............................................................................................................12 Mean Basal Area by Map Site Class vs. the DFC Performance Targets ...........................................................12 Map Site Class Verification ...............................................................................................................................14 Mean Basal Area by Field Site Class vs. the DFC Performance Targets..........................................................15 Relationship Between Stand Density, Quadratic Mean Diameter and Basal Area/Acre ...................................16 Factors That Explain Variation in Basal Area per Acre....................................................................................18
PRELIMINARY EVALUATION OF ALTERNATIVE RIPARIAN DFC METRICS................................................................20 DISCUSSION.............................................................................................................................................................22 REFERENCES ..........................................................................................................................................................25 APPENDIX A: OTHER STAND ATTRIBUTES..................................................................................................27
ACKNOWLEDGEMENTS We would like to acknowledge and thank the following people and organizations for their contributions to the project: Members of RSAG’s DFC Project Oversight Group for support, guidance and review, including Eric Beach, Jeff Grizzel, Richard Haight, Mark Hunter, Steve McConnell, Joseph Murray, Blake Rowe. Loveday Conquest, Charlie Halpern and Eric Turnblom for study design review and suggestions. Eric Beach, Denise Forbes (Lizee), Dan Ingram, Marc McCalmon, Myla McGowan, Chris Mendoza (Aquatic Resource Consultants), Allen Pleus and Tami Stout for site selection and screening. Helga Christiansen, Paula James, Marilu Koschak and Pat McNeil for assistance with maps and aerial photos. DNR Central Region, DNR Olympic Region, DNR Northwest Region, DNR South Puget Region, Gifford Pinchot National Forest, Green Crow Co., Mt. Baker/Snoqualmie National Forest, Olympic National Forest and Washington State Parks for access to sites. Duck Creek Associates (Janet Arendall, Bart Baenziger, and Mark White) and Integrated Resource Management (Marc Barnes, Jeremy Grose, and Les Thomas) for data collection. Doug Couvelier and Richard Haight for quality assurance. Pam Goodman and Anita Headley for data analysis and database assistance. Jan Henderson and Robin Lesher for mature stand data from Mt. Baker/Snoqualmie National Forest. We also thank the many people and organizations who provided information and suggestions for potential sites.
Final Report March 3, 2005 ii
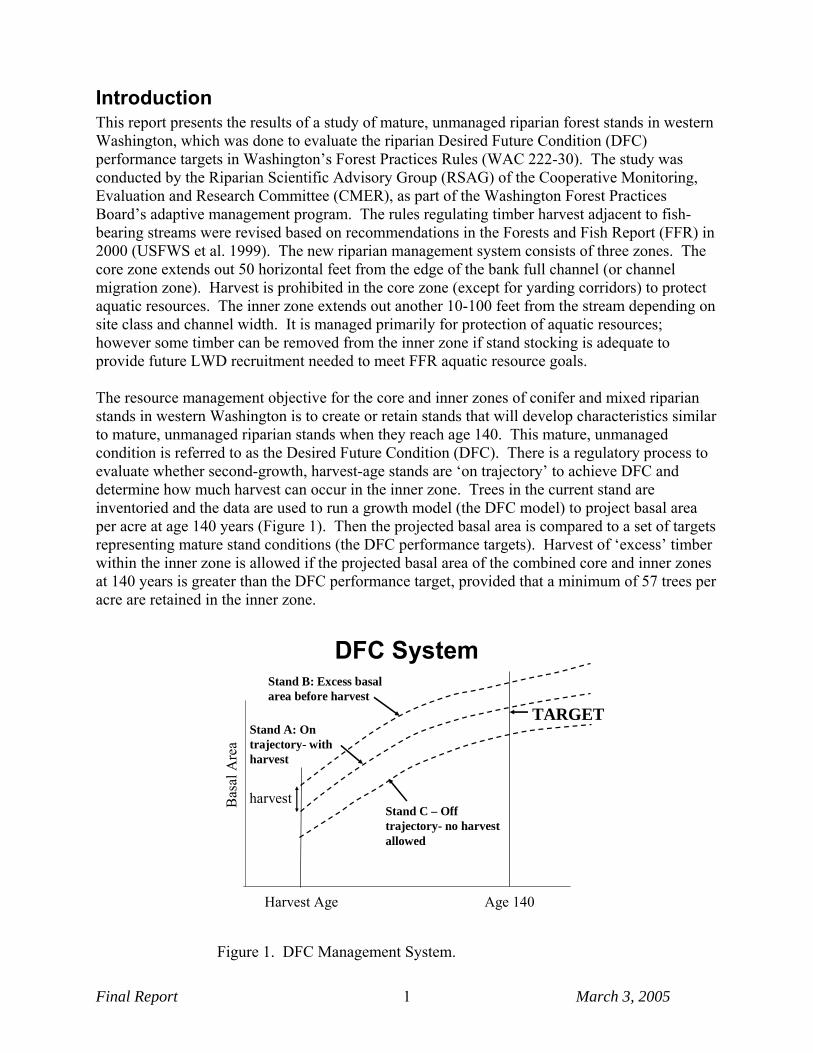
Introduction This report presents the results of a study of mature, unmanaged riparian forest stands in western Washington, which was done to evaluate the riparian Desired Future Condition (DFC) performance targets in Washington’s Forest Practices Rules (WAC 222-30). The study was conducted by the Riparian Scientific Advisory Group (RSAG) of the Cooperative Monitoring, Evaluation and Research Committee (CMER), as part of the Washington Forest Practices Board’s adaptive management program. The rules regulating timber harvest adjacent to fish-bearing streams were revised based on recommendations in the Forests and Fish Report (FFR) in 2000 (USFWS et al. 1999). The new riparian management system consists of three zones. The core zone extends out 50 horizontal feet from the edge of the bank full channel (or channel migration zone). Harvest is prohibited in the core zone (except for yarding corridors) to protect aquatic resources. The inner zone extends out another 10-100 feet from the stream depending on site class and channel width. It is managed primarily for protection of aquatic resources; however some timber can be removed from the inner zone if stand stocking is adequate to provide future LWD recruitment needed to meet FFR aquatic resource goals. The resource management objective for the core and inner zones of conifer and mixed riparian stands in western Washington is to create or retain stands that will develop characteristics similar to mature, unmanaged riparian stands when they reach age 140. This mature, unmanaged condition is referred to as the Desired Future Condition (DFC). There is a regulatory process to evaluate whether second-growth, harvest-age stands are ‘on trajectory’ to achieve DFC and determine how much harvest can occur in the inner zone. Trees in the current stand are inventoried and the data are used to run a growth model (the DFC model) to project basal area per acre at age 140 years (Figure 1). Then the projected basal area is compared to a set of targets representing mature stand conditions (the DFC performance targets). Harvest of ‘excess’ timber within the inner zone is allowed if the projected basal area of the combined core and inner zones at 140 years is greater than the DFC performance target, provided that a minimum of 57 trees per acre are retained in the inner zone.
DFC System
Bas
al A
rea
Age 140
harvest
TARGET
Harvest Age
Stand C – Off trajectory- no harvest allowed
Stand B: Excess basal area before harvest
Stand A: On trajectory- with harvest
Figure 1. DFC Management System.
Final Report March 3, 2005 1
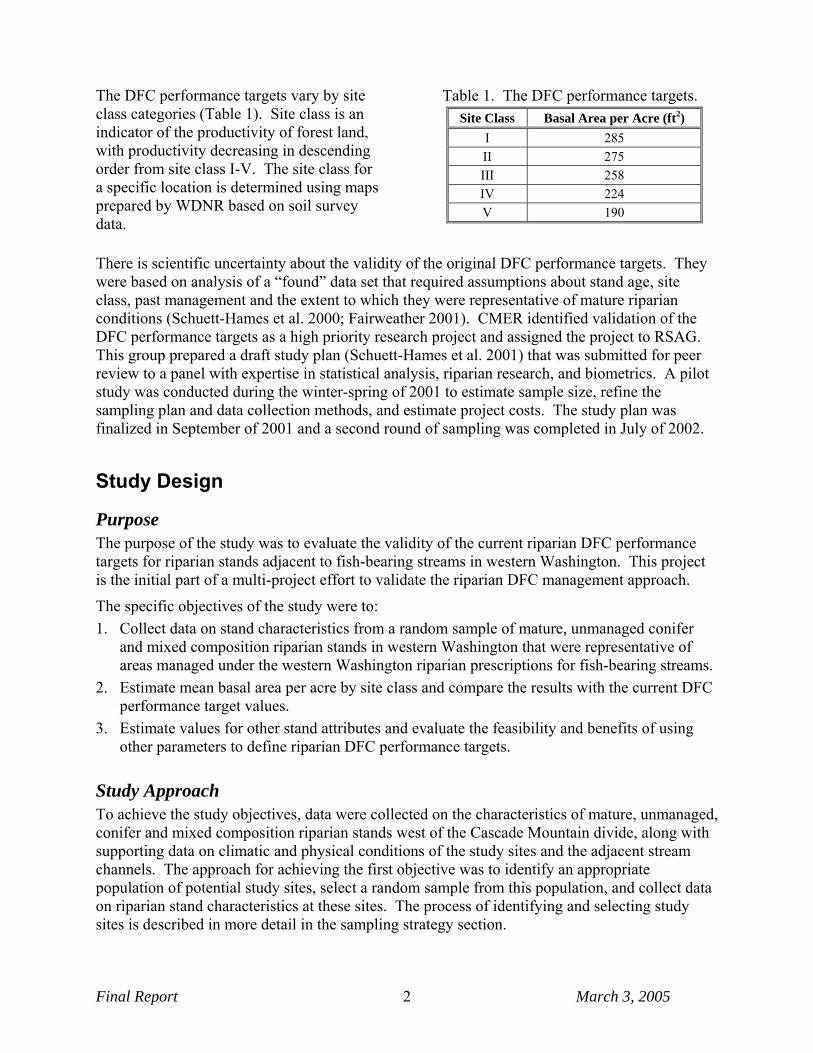
The DFC performance targets vary by site class categories (Table 1). Site class is an indicator of the productivity of forest land, with productivity decreasing in descending order from site class I-V. The site class for a specific location is determined using maps prepared by WDNR based on soil survey data.
Table 1. The DFC performance targets. Site Class Basal Area per Acre (ft2)
I 285 II 275 III 258 IV 224 V 190
There is scientific uncertainty about the validity of the original DFC performance targets. They were based on analysis of a “found” data set that required assumptions about stand age, site class, past management and the extent to which they were representative of mature riparian conditions (Schuett-Hames et al. 2000; Fairweather 2001). CMER identified validation of the DFC performance targets as a high priority research project and assigned the project to RSAG. This group prepared a draft study plan (Schuett-Hames et al. 2001) that was submitted for peer review to a panel with expertise in statistical analysis, riparian research, and biometrics. A pilot study was conducted during the winter-spring of 2001 to estimate sample size, refine the sampling plan and data collection methods, and estimate project costs. The study plan was finalized in September of 2001 and a second round of sampling was completed in July of 2002.
Study Design
Purpose The purpose of the study was to evaluate the validity of the current riparian DFC performance targets for riparian stands adjacent to fish-bearing streams in western Washington. This project is the initial part of a multi-project effort to validate the riparian DFC management approach.
The specific objectives of the study were to: 1. Collect data on stand characteristics from a random sample of mature, unmanaged conifer
and mixed composition riparian stands in western Washington that were representative of areas managed under the western Washington riparian prescriptions for fish-bearing streams.
2. Estimate mean basal area per acre by site class and compare the results with the current DFC performance target values.
3. Estimate values for other stand attributes and evaluate the feasibility and benefits of using other parameters to define riparian DFC performance targets.
Study Approach To achieve the study objectives, data were collected on the characteristics of mature, unmanaged, conifer and mixed composition riparian stands west of the Cascade Mountain divide, along with supporting data on climatic and physical conditions of the study sites and the adjacent stream channels. The approach for achieving the first objective was to identify an appropriate population of potential study sites, select a random sample from this population, and collect data on riparian stand characteristics at these sites. The process of identifying and selecting study sites is described in more detail in the sampling strategy section.
Final Report March 3, 2005 2
The approach for achieving the second objective was to sort the data by site class and estimate mean live conifer basal area per acre (LCBAPA) for each site class, along with the variance of the mean and a 95% confidence interval for each site class. The estimated mean LCBAPA for each site class derived from the sample data (b) was then compared to the DFC performance targets in the forest practices rules. A standard t-test was used to test the two-sided null hypothesis:
target: DFCbH o = ; target: DFCbH A ≠ .
The approach for achieving the third objective was to sort the data by site class and estimate the mean values for a suite of stand attributes, including: total live basal area per acre, live conifer trees per acre, total live trees per acre, live conifer quadratic mean diameter, total live quadratic mean diameter, mean over-story tree height, total live volume per acre, and relative density. The suitability of alternative metrics was evaluated on the basis of their utility in describing mature stand conditions, variability, ecological/biological relevance and cost/feasibility. A more detailed description of procedures for parameter estimation and statistical analysis is presented in the data analysis section.
Sampling Strategy The riparian prescriptions and DFC performance targets are applied to conifer and mixed stands adjacent to fish-bearing streams in western Washington. The DFC performance targets are intended to represent conditions in unmanaged stands near the mid-point (140 years) of the mature age range (80-200 years). Consequently, the sampling strategy involved identifying a population of mature, unmanaged west-side riparian stands of similar to the stands where the riparian prescriptions and DFC performance targets are applied. The study was not designed or intended to sample from all stand types, stream types, management histories, or age categories. Stands that had been thinned or selectively harvested, were dominated by broad-leafs, were not adjacent to fish-bearing streams, or were outside of the mature age range were excluded from the population sampled. Since the DFC performance targets differ by site class, each site class was sampled separately so the performance target for each site class category could be compared with data from an equivalent set of mature stands. Based on the pilot study results, it was estimated that approximately 24-26 study sites for each site class would be needed to estimate mean basal area per acre with a relative precision of +/- 10% at the 95% confidence level. Consequently, an attempt was made to sample a minimum of 26 sites per site class. The pilot study indicated that a very limited number of unmanaged riparian stands with trees of suitable age were available to sample in western Washington, and that most of these were located on state or federal land. The spatial distribution of suitable stands was patchy due to past patterns of stand-initiating disturbance events which created stands of the appropriate age, as well as past patterns of timber harvest that eliminated many mature stands. To avoid collecting a sample that was spatially skewed due to regional differences in site availability due to timber harvest patterns, the sampling strategy was to sort potential sites by to EPA level III eco-region (Omernik and Gallant 1986) and randomly select an equal proportion of sites were from each of four western Washington eco-regions (Coast Range, Puget Lowlands, Cascades, and North Cascades).
Final Report March 3, 2005 3
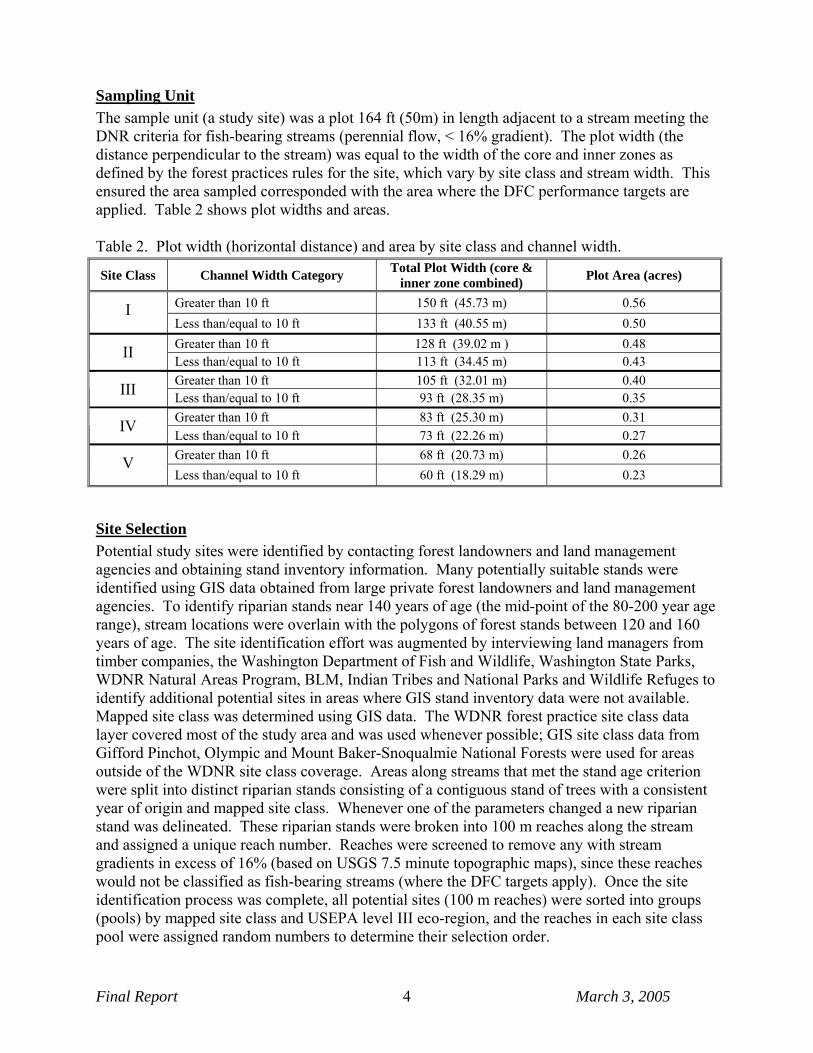
Sampling Unit The sample unit (a study site) was a plot 164 ft (50m) in length adjacent to a stream meeting the DNR criteria for fish-bearing streams (perennial flow, < 16% gradient). The plot width (the distance perpendicular to the stream) was equal to the width of the core and inner zones as defined by the forest practices rules for the site, which vary by site class and stream width. This ensured the area sampled corresponded with the area where the DFC performance targets are applied. Table 2 shows plot widths and areas. Table 2. Plot width (horizontal distance) and area by site class and channel width.
Site Class Channel Width Category Total Plot Width (core & inner zone combined) Plot Area (acres)
Greater than 10 ft 150 ft (45.73 m) 0.56 I Less than/equal to 10 ft 133 ft (40.55 m) 0.50 Greater than 10 ft 128 ft (39.02 m ) 0.48 II Less than/equal to 10 ft 113 ft (34.45 m) 0.43 Greater than 10 ft 105 ft (32.01 m) 0.40 III Less than/equal to 10 ft 93 ft (28.35 m) 0.35 Greater than 10 ft 83 ft (25.30 m) 0.31 IV Less than/equal to 10 ft 73 ft (22.26 m) 0.27 Greater than 10 ft 68 ft (20.73 m) 0.26 V Less than/equal to 10 ft 60 ft (18.29 m) 0.23
Site Selection Potential study sites were identified by contacting forest landowners and land management agencies and obtaining stand inventory information. Many potentially suitable stands were identified using GIS data obtained from large private forest landowners and land management agencies. To identify riparian stands near 140 years of age (the mid-point of the 80-200 year age range), stream locations were overlain with the polygons of forest stands between 120 and 160 years of age. The site identification effort was augmented by interviewing land managers from timber companies, the Washington Department of Fish and Wildlife, Washington State Parks, WDNR Natural Areas Program, BLM, Indian Tribes and National Parks and Wildlife Refuges to identify additional potential sites in areas where GIS stand inventory data were not available. Mapped site class was determined using GIS data. The WDNR forest practice site class data layer covered most of the study area and was used whenever possible; GIS site class data from Gifford Pinchot, Olympic and Mount Baker-Snoqualmie National Forests were used for areas outside of the WDNR site class coverage. Areas along streams that met the stand age criterion were split into distinct riparian stands consisting of a contiguous stand of trees with a consistent year of origin and mapped site class. Whenever one of the parameters changed a new riparian stand was delineated. These riparian stands were broken into 100 m reaches along the stream and assigned a unique reach number. Reaches were screened to remove any with stream gradients in excess of 16% (based on USGS 7.5 minute topographic maps), since these reaches would not be classified as fish-bearing streams (where the DFC targets apply). Once the site identification process was complete, all potential sites (100 m reaches) were sorted into groups (pools) by mapped site class and USEPA level III eco-region, and the reaches in each site class pool were assigned random numbers to determine their selection order.
Final Report March 3, 2005 4

As reaches were randomly selected from each pool, they were screened using aerial photos and field data to verify they met the site selection criteria. To ensure that the sites were adjacent to streams meeting the criteria for fish-bearing streams, the streams had to have a defined channel with a bank full width ≥ 2 ft and a gradient ≤ 16% (two sites were included that averaged slightly over 16%, but were within the measurement error of the clinometer). To ensure that the stands being sampled were representative of mature, unmanaged mixed or conifer riparian stands, each stand had to be immediately adjacent to the stream channel (or channel migration zone), be within the mature age range, have a conifer or mixed composition (≥ 30% of site occupied by crowns of dominant/co-dominant conifers between 80-200 years of age) and show no evidence of past harvest activity. Approximately 88% of the reaches evaluated were eliminated during screening due to factors such as lack of a defined stream channel, high stream gradient, evidence of past harvest, unsuitable stand age or composition, or conditions unsuitable for tree growth (rock outcrops, talus slopes, landslide scarps or standing water). When a reach was eliminated during screening, the next reach on the random selection list for that pool was screened until an adequate number of suitable sites were accepted for data collection. In several cases the pool of potential sites within a site class/eco-region pool was exhausted before the sample size goal was achieved. In these cases, additional reaches with the same site class designation were randomly selected from the remaining, unselected reaches available from the other eco-regions.
Methods
Data Collection Data collection methods and procedures were developed by CMER staff and RSAG (Roorbach et al. 2002). Plots were 164 ft (50 m) in length, oriented parallel to the stream. Plot widths varied, matching the combined core and inner zones width for each map site class/channel width category (Table 2). Channel migration zones (CMZs) were not included in the plot boundaries because the DFC targets are not applicable to CMZs. Within each plot, all trees (living or dead) with a diameter at breast height (dbh) ≥ 3.9 inches (10 cm) were marked with a permanent, numbered tag. The species, dbh, condition, canopy class, crown type, decay class (if dead) and distance from the bank full channel were recorded for each tree. Tree locations were assigned to one of four landforms (Rot 1995; Rot et al. 2000): floodplains (< 3.28 ft [1m] above bank full channel height); low terraces (3.28-9.84 ft [1-3m]); high terraces (> 9.84 ft [3m]); or slopes (slope ≥ 20% for at least 49.2 ft; [15m] of slope distance). Height measurements and increment cores were taken from two trees from each species/canopy class group and from 10 additional site trees selected using the WDNR site tree selection procedures (WDNR 1996). Heights of the selected trees were measured with a laser rangefinder/hypsometer. Breast-height tree age was estimated by counting annual rings after core samples were mounted. Field measurements of site attributes included channel gradient, channel width, valley width, plot aspect, and side-slope gradient. GIS data and topographic maps were used to identify eco-region (Omernik and Gallant 1986), elevation, and annual precipitation zone (Miller et al. 1973). Plot data were collected by two-person crews experienced in forest stand sampling techniques who were working on contract. Each crew received training in the survey methodology and was required to pass a quality assurance inspection prior to being approved for work on the project. The quality assurance procedure consisted of a replicate survey of an entire plot performed by an independent quality assurance team. Data received from contractors were inspected for errors
Final Report March 3, 2005 5

and omissions by a CMER staff member at NWIFC prior to being entered into the database developed for the project data.
Data Analysis
Parameter Estimation Table 3 shows the stand attribute parameters that were estimated for each study site. Table 3. Stand attributes and abbreviations Attribute Abbreviation Live Conifer Basal Area per Acre LCBAPA Total Live Basal Area per Acre TLBAPA Snag Basal Area per Acre SBAPA Live Conifer Trees per Acre LCTPA Total Live Trees per Acre TLTPA Snag Trees per Acre STPA Live Conifer Quadratic Mean Diameter LCQMD Total Live Quadratic Mean Diameter TLQMD Snag Quadratic Mean Diameter SQMD Mean Over-story Tree Height MOTH Total Live Volume per Acre TLVOL Relative Density RD Mean age of co-dominant canopy class CAGE Dominant tree species (by basal area) DTS
The basal area (BA) of each tree in ft2 was calculated using the formula: BA = 0.005454dbh2. LCBAPA and TLBAPA (in ft2) were calculated by summing the basal area for live trees (conifer or total, respectively) in the plot and dividing by the plot area in acres. LCTPA and TLTPA were calculated by summing the number of live trees (conifer or total, respectively) in the plot and dividing by the plot area. SBAPA and STPA were calculated in the same manner using snag (dead tree) data. LCQMD, TLQMD and SQMD in inches were calculated as:
)( indbh = 005454.0
BA for live conifer, total live trees, and snags, respectively.
MOTH in feet was calculated by averaging the height measurements of all live dominant and co-dominant trees at each site. TLVOL (cubic feet/acre) was generated as output from the Forest Vegetation Simulator model (FVS) using inventory data from each site (Donnelly and Johnson 1997 a, b). RD was calculated by dividing TLBAPA by the square root of TLQMD for each site (Curtis 1982). CAGE (an indicator of stand age) was calculated by averaging the ages of all live co-dominant trees at each site. The DTS was determined by identifying the species with the greatest live basal area on the site after sorting and summing the basal area for each species present.
Final Report March 3, 2005 6
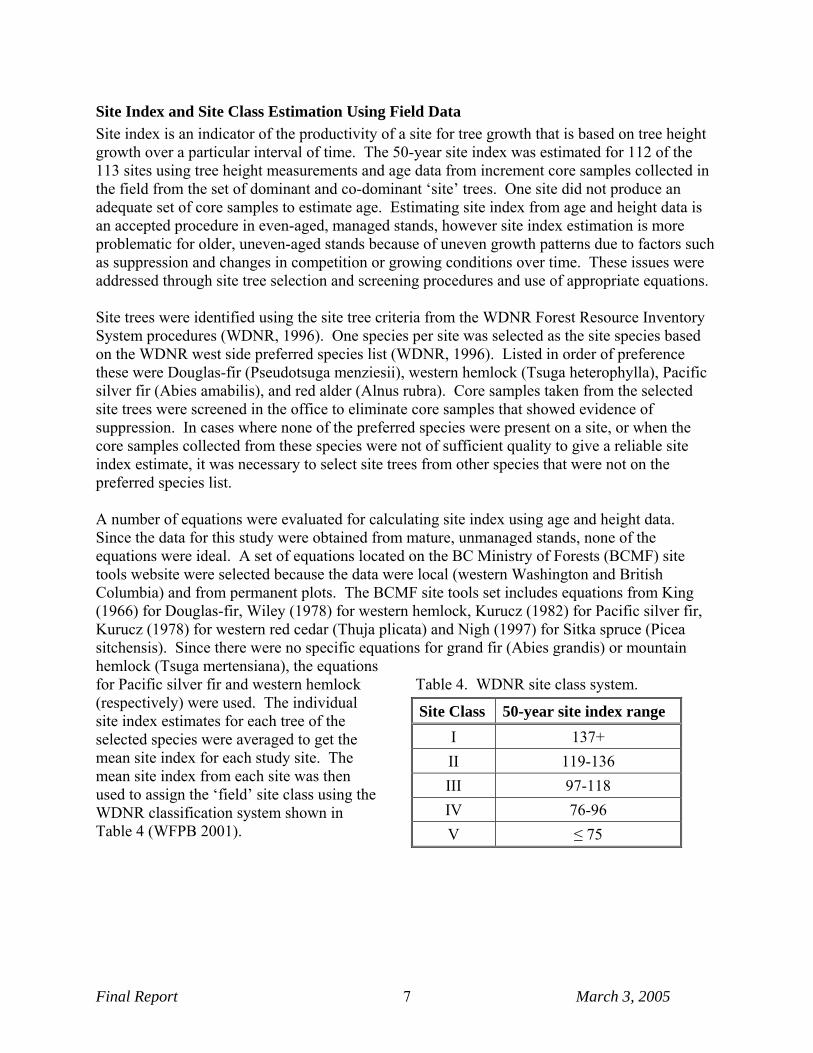
Site Index and Site Class Estimation Using Field Data Site index is an indicator of the productivity of a site for tree growth that is based on tree height growth over a particular interval of time. The 50-year site index was estimated for 112 of the 113 sites using tree height measurements and age data from increment core samples collected in the field from the set of dominant and co-dominant ‘site’ trees. One site did not produce an adequate set of core samples to estimate age. Estimating site index from age and height data is an accepted procedure in even-aged, managed stands, however site index estimation is more problematic for older, uneven-aged stands because of uneven growth patterns due to factors such as suppression and changes in competition or growing conditions over time. These issues were addressed through site tree selection and screening procedures and use of appropriate equations. Site trees were identified using the site tree criteria from the WDNR Forest Resource Inventory System procedures (WDNR, 1996). One species per site was selected as the site species based on the WDNR west side preferred species list (WDNR, 1996). Listed in order of preference these were Douglas-fir (Pseudotsuga menziesii), western hemlock (Tsuga heterophylla), Pacific silver fir (Abies amabilis), and red alder (Alnus rubra). Core samples taken from the selected site trees were screened in the office to eliminate core samples that showed evidence of suppression. In cases where none of the preferred species were present on a site, or when the core samples collected from these species were not of sufficient quality to give a reliable site index estimate, it was necessary to select site trees from other species that were not on the preferred species list. A number of equations were evaluated for calculating site index using age and height data. Since the data for this study were obtained from mature, unmanaged stands, none of the equations were ideal. A set of equations located on the BC Ministry of Forests (BCMF) site tools website were selected because the data were local (western Washington and British Columbia) and from permanent plots. The BCMF site tools set includes equations from King (1966) for Douglas-fir, Wiley (1978) for western hemlock, Kurucz (1982) for Pacific silver fir, Kurucz (1978) for western red cedar (Thuja plicata) and Nigh (1997) for Sitka spruce (Picea sitchensis). Since there were no specific equations for grand fir (Abies grandis) or mountain hemlock (Tsuga mertensiana), the equations for Pacific silver fir and western hemlock (respectively) were used. The individual site index estimates for each tree of the selected species were averaged to get the mean site index for each study site. The mean site index from each site was then used to assign the ‘field’ site class using the WDNR classification system shown in Table 4 (WFPB 2001).
Table 4. WDNR site class system.
Site Class 50-year site index range I 137+ II 119-136 III 97-118 IV 76-96 V ≤ 75
Final Report March 3, 2005 7
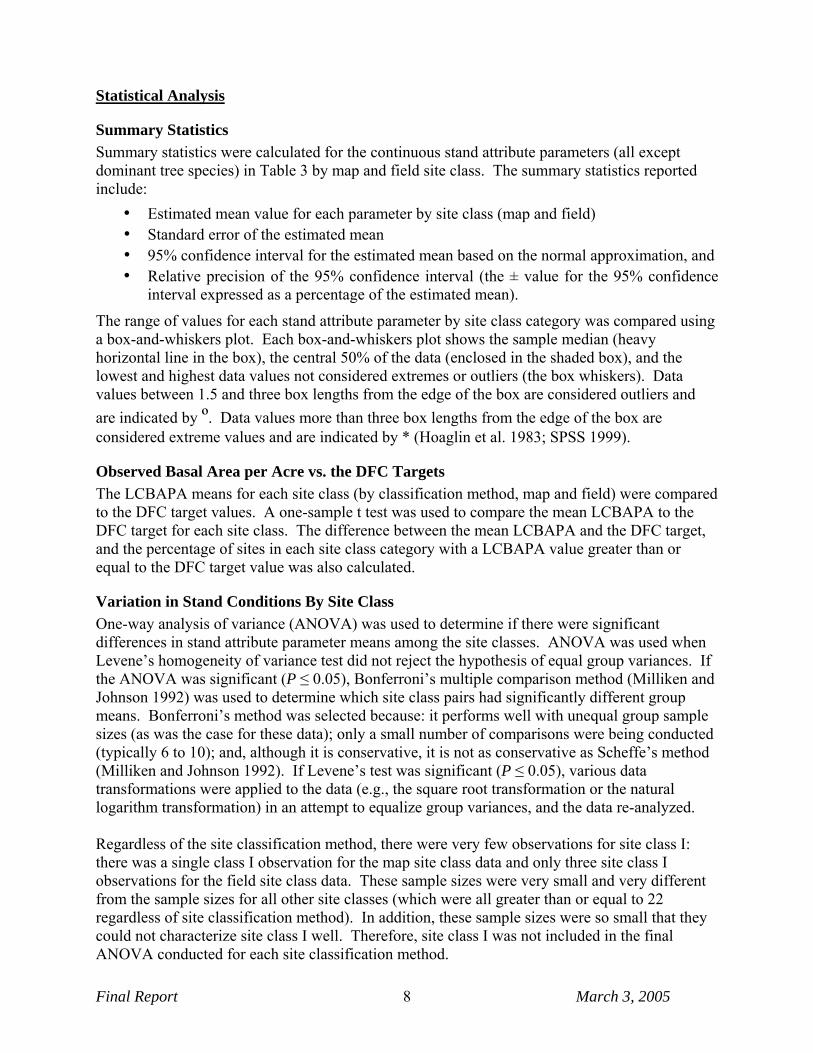
Statistical Analysis
Summary Statistics Summary statistics were calculated for the continuous stand attribute parameters (all except dominant tree species) in Table 3 by map and field site class. The summary statistics reported include:
• Estimated mean value for each parameter by site class (map and field) • Standard error of the estimated mean • 95% confidence interval for the estimated mean based on the normal approximation, and • Relative precision of the 95% confidence interval (the ± value for the 95% confidence
interval expressed as a percentage of the estimated mean).
The range of values for each stand attribute parameter by site class category was compared using a box-and-whiskers plot. Each box-and-whiskers plot shows the sample median (heavy horizontal line in the box), the central 50% of the data (enclosed in the shaded box), and the lowest and highest data values not considered extremes or outliers (the box whiskers). Data values between 1.5 and three box lengths from the edge of the box are considered outliers and are indicated by º. Data values more than three box lengths from the edge of the box are considered extreme values and are indicated by * (Hoaglin et al. 1983; SPSS 1999).
Observed Basal Area per Acre vs. the DFC Targets The LCBAPA means for each site class (by classification method, map and field) were compared to the DFC target values. A one-sample t test was used to compare the mean LCBAPA to the DFC target for each site class. The difference between the mean LCBAPA and the DFC target, and the percentage of sites in each site class category with a LCBAPA value greater than or equal to the DFC target value was also calculated.
Variation in Stand Conditions By Site Class One-way analysis of variance (ANOVA) was used to determine if there were significant differences in stand attribute parameter means among the site classes. ANOVA was used when Levene’s homogeneity of variance test did not reject the hypothesis of equal group variances. If the ANOVA was significant (P ≤ 0.05), Bonferroni’s multiple comparison method (Milliken and Johnson 1992) was used to determine which site class pairs had significantly different group means. Bonferroni’s method was selected because: it performs well with unequal group sample sizes (as was the case for these data); only a small number of comparisons were being conducted (typically 6 to 10); and, although it is conservative, it is not as conservative as Scheffe’s method (Milliken and Johnson 1992). If Levene’s test was significant (P ≤ 0.05), various data transformations were applied to the data (e.g., the square root transformation or the natural logarithm transformation) in an attempt to equalize group variances, and the data re-analyzed. Regardless of the site classification method, there were very few observations for site class I: there was a single class I observation for the map site class data and only three site class I observations for the field site class data. These sample sizes were very small and very different from the sample sizes for all other site classes (which were all greater than or equal to 22 regardless of site classification method). In addition, these sample sizes were so small that they could not characterize site class I well. Therefore, site class I was not included in the final ANOVA conducted for each site classification method.
Final Report March 3, 2005 8

A variance components analysis was conducted following procedures outlined by Sokal and Rohlf (1969, page 169) to estimate the amount of variation in LCBAPA explained by site class (either map or field) and by dominant species. Because of the small number of sites classified as site class I by either classification method, only site classes II, III, IV and V were used for these analyses.
Site and Stand Factors vs. Basal Area per Acre Exploratory data analysis was conducted to identify site or stand factors that explain significant variation in LCBAPA values. A one-way analysis of variance (ANOVA) was performed with LCBAPA as the response variable and six independent categorical variables (dominant tree species, field site class, dominant landform, eco-region, channel confinement category and plot aspect). A correlation analysis was conducted between LCBAPA and a set of continuous independent variables (precipitation, site index, stand age, side-slope gradient, channel gradient, valley width, channel width, channel confinement ratio, valley form, and elevation). When the data were “clustered”, a correlation analysis using the natural-logarithm transformation was performed.
Study Sites A total of 113 sites were sampled. Table 5 shows the number of sites sampled, the number of reaches rejected during screening, and the total number of reaches available as potential study sites, by “map” site class (i.e., the site class indicated on the WDNR and USFS maps). The target sample size of 26 was obtained for site classes II, II, IV and V. Only one site class I site was suitable for sampling; the others were eliminated during the site screening process.
Table 5. Number of sites sampled by map site class. Map Site
Class Number of Sites
Sampled Number of Reaches
Rejected During Screening Total Number of
Reaches Available I 1 10 11 II 27 226 377 III 29 263 1,188 IV 28 136 1,707 V 28 228 1,488
Total 113 863 4,771 Figure 2 shows the locations of study sites and their distribution across western Washington. The majority of the sites were located on federal land. Fifty-two sites were in Gifford-Pinchot National Forest (GPNF), 21 were in Olympic National Forest (ONF), 15 were in Mt. Baker/Snoqualmie National Forest (MBSNF), 15 were on land managed by the Washington State Department of Natural Resources (WDNR), nine were in Washington State Parks, and one was on private timber land.
Final Report March 3, 2005 9

Figure 2. Locations and distribution of study sites in western Washington.
Figure 3 shows the distribution of sites by EPA level III eco-regions. The sampling plan called for proportional sampling across western Washington eco-regions by site class; however fewer suitable sites were obtained in the Puget Lowlands and Coast Range because site availability was limited due to extensive human disturbance of forests in the region. More sites were sampled in the Cascades eco-region (west slope of Cascades south of Snoqualmie Pass) because suitable sites were most
Frequency by Eco-Region
2115
24
53
0
20
40
60
80
CoastRange
PugetLowlands
Cascades NorthCascades
EPA Level III Eco-Region
Num
ber o
f Site
s
Figure 3. Number of sites by EPA eco-region.
Final Report March 3, 2005 10

abundant in this area. Figure 4 shows the distribution of sites by annual precipitation as shown on NOAA precipitation frequency maps (Miller et al. 1973). Map estimates of mean annual precipitation ranged from 29 to 155 inches, and the estimated mean annual precipitation for most sites ranged from 70 to 100 inches per year. (Actual precipitation patterns may differ locally from the map values in mountainous areas due to topography and other factors). The elevation of study sites ranged from 40 to 4,840 feet above sea level; most were below 2,000 feet (Figure 5).
Frequency by Precipitation
1 0 1
96
2225
19
911
9
1
05
1015202530
20-30
30-40
40-50
50-60
60-70
70-80
80-90
90-100
100-110
110-120
120-130
>130
Annual Precipitation Zone (inches)
Num
ber o
f Site
s
Figure 4. Number of sites by precipitation zone.
Frequency by Elevation
10
20
14
8
3
15
9
24
28
05
101520253035
0-500 500-1000
1000-1500
1500-2000
2000-2500
2500-3000
3000-3500
3500-4000
4000-4500
4500-5000
Elevation (feet)
Num
ber o
f Site
s
Figure 5. Number of sites by elevation band. The dominant landform for the site was the one that supported the greatest total basal area. Slopes were the most common dominant landform (46) followed by low terraces (37) and high terraces (30). No sites were dominated by floodplains. This landform is typically associated with channel migration zones, which were not sampled. The side-slope gradient (slope of the land perpendicular to the stream) ranged from 0 to 96%; about half the sites had side slopes less than 20% (Figure 6). The full range of plot aspect categories were represented (Figure 7).
Frequency by Side-slope Gradient
33
2319 17
610
1 2 1 1
0
10
20
30
40
0-10 10-20 20-30 30-40 40-50 50-60 60-70 70-80 80-90 90-100
Side-slope Gradient (%)
Num
ber o
f Site
s
Figure 6. Frequency by side-slope gradient.
Frequency by Plot Aspect
11 12 1315
1316
13
20
0
5
10
15
20
25
N NE E SE S SW W NW
Aspect
Num
ber o
f Site
s
Figure 7. Frequency by aspect of the plot.
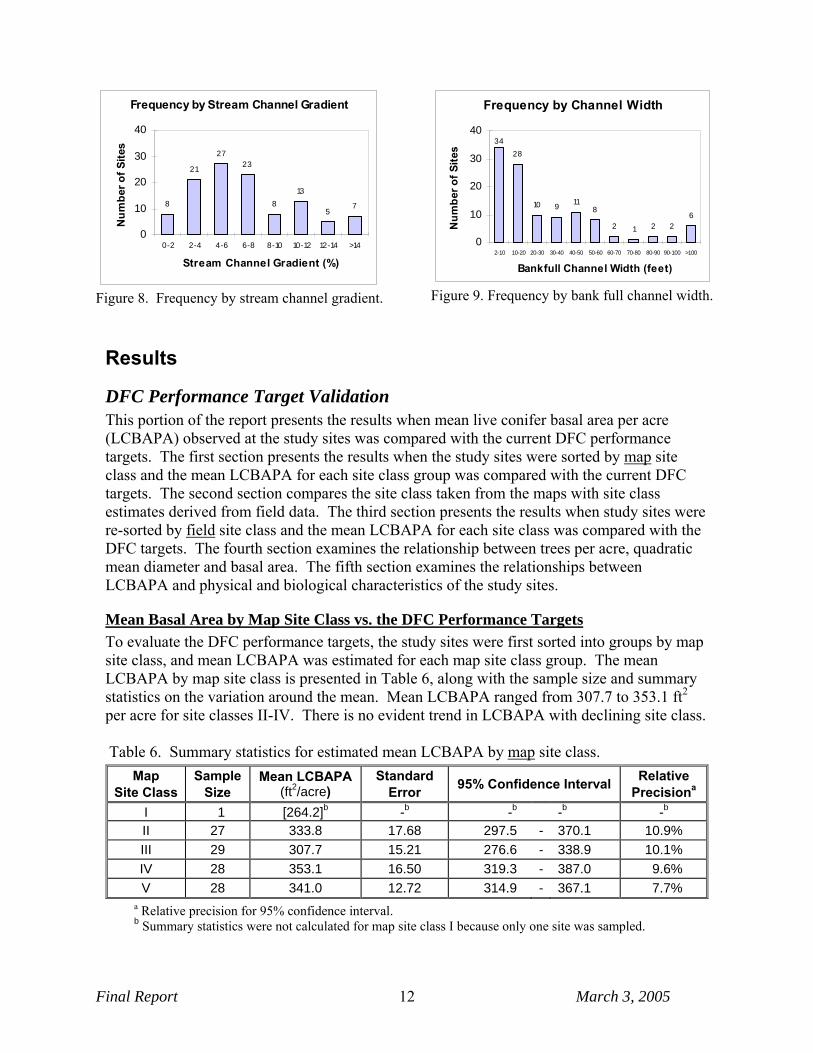
Stream gradients were mostly between 2 and 8 percent (Figure 8) and bank full channel width at most sites was less than 20 feet (Figure 9). Sites were also classified by channel confinement (valley width divided by channel width) (WFPB, 1995). Fifty-two sites were moderately confined (valley width equals 2-4 channel widths), 40 sites were confined (valley width <2 channel widths) and 20 sites were unconfined (valley width >4 channel widths).
Final Report March 3, 2005 11
Frequency by Stream Channel Gradient
8
21
2723
813
57
0
10
20
30
40
0-2 2-4 4-6 6-8 8-10 10-12 12-14 >14
Stream Channel Gradient (%)
Num
ber o
f Site
s
Figure 8. Frequency by stream channel gradient.
Frequency by Channel Width
28
10 9 118
2 1 2 26
34
0
10
20
30
40
2-10 10-20 20-30 30-40 40-50 50-60 60-70 70-80 80-90 90-100 >100
Bankfull Channel Width (feet)
Num
ber o
f Site
s
Figure 9. Frequency by bank full channel width.
Results
DFC Performance Target Validation This portion of the report presents the results when mean live conifer basal area per acre (LCBAPA) observed at the study sites was compared with the current DFC performance targets. The first section presents the results when the study sites were sorted by map site class and the mean LCBAPA for each site class group was compared with the current DFC targets. The second section compares the site class taken from the maps with site class estimates derived from field data. The third section presents the results when study sites were re-sorted by field site class and the mean LCBAPA for each site class was compared with the DFC targets. The fourth section examines the relationship between trees per acre, quadratic mean diameter and basal area. The fifth section examines the relationships between LCBAPA and physical and biological characteristics of the study sites.
Mean Basal Area by Map Site Class vs. the DFC Performance Targets To evaluate the DFC performance targets, the study sites were first sorted into groups by map site class, and mean LCBAPA was estimated for each map site class group. The mean LCBAPA by map site class is presented in Table 6, along with the sample size and summary statistics on the variation around the mean. Mean LCBAPA ranged from 307.7 to 353.1 ft2 per acre for site classes II-IV. There is no evident trend in LCBAPA with declining site class. Table 6. Summary statistics for estimated mean LCBAPA by map site class.
Map Site Class
Sample Size
Mean LCBAPA (ft2/acre)
Standard Error 95% Confidence Interval Relative
Precisiona
I 1 [264.2]b -b -b -b -b
II 27 333.8 17.68 297.5 - 370.1 10.9% III 29 307.7 15.21 276.6 - 338.9 10.1% IV 28 353.1 16.50 319.3 - 387.0 9.6% V 28 341.0 12.72 314.9 - 367.1 7.7%
a Relative precision for 95% confidence interval. b Summary statistics were not calculated for map site class I because only one site was sampled.
Final Report March 3, 2005 12
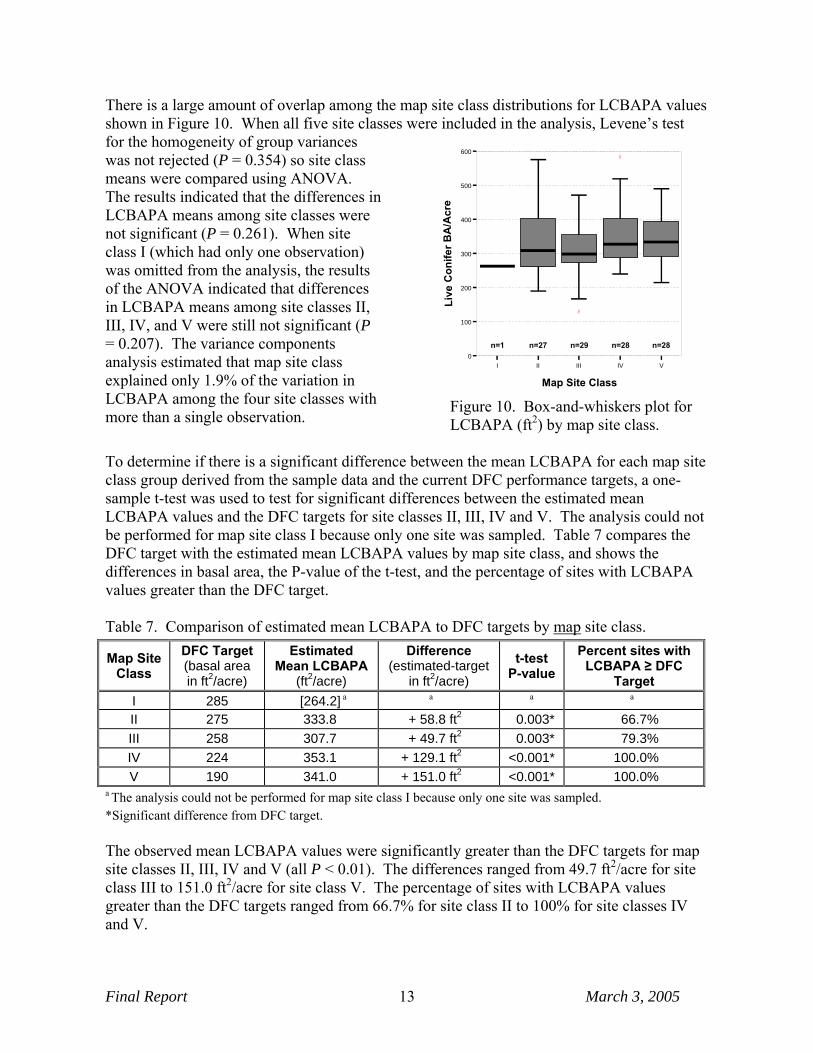
There is a large amount of overlap among the map site class distributions for LCBAPA values shown in Figure 10. When all five site classes were included in the analysis, Levene’s test for the homogeneity of group variances was not rejected (P = 0.354) so site class means were compared using ANOVA. The results indicated that the differences in LCBAPA means among site classes were not significant (P = 0.261). When site class I (which had only one observation) was omitted from the analysis, the results of the ANOVA indicated that differences in LCBAPA means among site classes II, III, IV, and V were still not significant (P = 0.207). The variance components analysis estimated that map site class explained only 1.9% of the variation in LCBAPA among the four site classes with more than a single observation.
I II III IV V
Map Site Class
0
100
200
300
400
500
600
Live
Con
ifer B
A/A
cre
n=1 n=27 n=29 n=28 n=28
Figure 10. Box-and-whiskers plot for LCBAPA (ft2) by map site class.
To determine if there is a significant difference between the mean LCBAPA for each map site class group derived from the sample data and the current DFC performance targets, a one-sample t-test was used to test for significant differences between the estimated mean LCBAPA values and the DFC targets for site classes II, III, IV and V. The analysis could not be performed for map site class I because only one site was sampled. Table 7 compares the DFC target with the estimated mean LCBAPA values by map site class, and shows the differences in basal area, the P-value of the t-test, and the percentage of sites with LCBAPA values greater than the DFC target. Table 7. Comparison of estimated mean LCBAPA to DFC targets by map site class.
Map Site Class
DFC Target (basal area in ft2/acre)
Estimated Mean LCBAPA
(ft2/acre)
Difference (estimated-target
in ft2/acre) t-test
P-value Percent sites with
LCBAPA ≥ DFC Target
I 285 [264.2] a a a a
II 275 333.8 + 58.8 ft2 0.003* 66.7% III 258 307.7 + 49.7 ft2 0.003* 79.3% IV 224 353.1 + 129.1 ft2 <0.001* 100.0% V 190 341.0 + 151.0 ft2 <0.001* 100.0%
a The analysis could not be performed for map site class I because only one site was sampled. *Significant difference from DFC target. The observed mean LCBAPA values were significantly greater than the DFC targets for map site classes II, III, IV and V (all P < 0.01). The differences ranged from 49.7 ft2/acre for site class III to 151.0 ft2/acre for site class V. The percentage of sites with LCBAPA values greater than the DFC targets ranged from 66.7% for site class II to 100% for site classes IV and V.
Final Report March 3, 2005 13
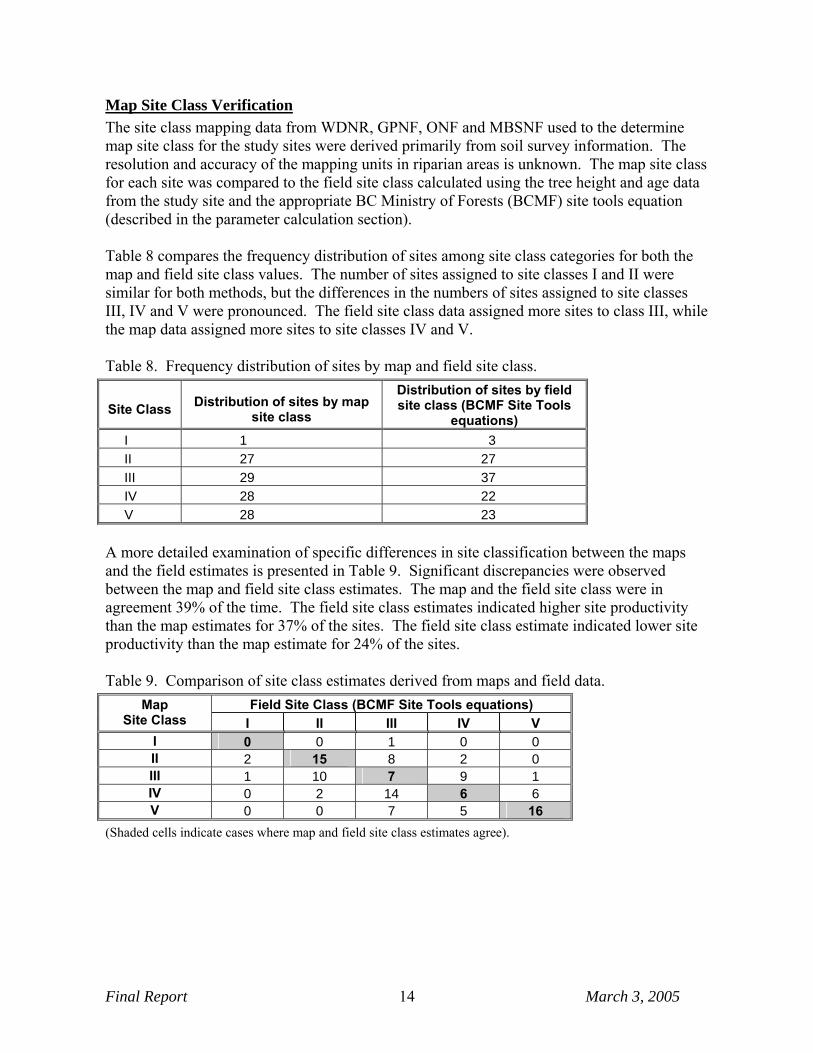
Map Site Class Verification The site class mapping data from WDNR, GPNF, ONF and MBSNF used to the determine map site class for the study sites were derived primarily from soil survey information. The resolution and accuracy of the mapping units in riparian areas is unknown. The map site class for each site was compared to the field site class calculated using the tree height and age data from the study site and the appropriate BC Ministry of Forests (BCMF) site tools equation (described in the parameter calculation section). Table 8 compares the frequency distribution of sites among site class categories for both the map and field site class values. The number of sites assigned to site classes I and II were similar for both methods, but the differences in the numbers of sites assigned to site classes III, IV and V were pronounced. The field site class data assigned more sites to class III, while the map data assigned more sites to site classes IV and V. Table 8. Frequency distribution of sites by map and field site class.
Site Class Distribution of sites by map site class
Distribution of sites by field site class (BCMF Site Tools
equations) I 1 3 II 27 27 III 29 37 IV 28 22 V 28 23
A more detailed examination of specific differences in site classification between the maps and the field estimates is presented in Table 9. Significant discrepancies were observed between the map and field site class estimates. The map and the field site class were in agreement 39% of the time. The field site class estimates indicated higher site productivity than the map estimates for 37% of the sites. The field site class estimate indicated lower site productivity than the map estimate for 24% of the sites. Table 9. Comparison of site class estimates derived from maps and field data.
Field Site Class (BCMF Site Tools equations) Map Site Class I II III IV V
I 0 0 1 0 0 II 2 15 8 2 0 III 1 10 7 9 1 IV 0 2 14 6 6 V 0 0 7 5 16
(Shaded cells indicate cases where map and field site class estimates agree).
Final Report March 3, 2005 14

Mean Basal Area by Field Site Class vs. the DFC Performance Targets Due to the differences between the map and field site class determinations, the study sites were re-sorted by their field site class and the mean LCBAPA for each field site class group was compared to the DFC performance targets. Table 10 shows summary statistics for the mean LCBAPA by field site class. The mean LCBAPA values for site class II and III are similar to each other (348.2 and 345.2, respectively) and greater than the values for site classes I, IV and V.
Table 10. Summary statistics for mean LCBAPA by field site class. Field
Site Class Sample
Size Mean LCBAPA
(ft2/acre) Standard
Error 95% Confidence
Interval Relative
Precisiona
I 3 312.5 45.43 117.0 - 507.9 62.5% II 27 348.2 17.65 311.9 - 384.5 10.4% III 37 345.2 14.83 315.1 - 375.3 8.7% IV 22 318.9 15.44 286.8 - 351.0 10.1% V 23 313.5 14.77 282.9 - 344.1 9.8%
a Relative precision for 95% confidence interval.
The distributions of LCBAPA values by field site class are shown in Figure 11. When all five site classes were included in the analysis, Levene’s test for the homogeneity of group variances was not rejected (P = 0.218) so site class means were compared using ANOVA. The results indicated that the differences in LCBAPA means among site classes were not significant (P = 0.445). When site class I (which had only three observations) was omitted from the analysis, Levene’s test for the homogeneity of group variances was still not rejected (P = 0.132). The ANOVA results indicated that differences in LCBAPA means among field site classes II, III, IV, and V were not significant (P = 0.320). Similarly to the map site class plot for LCBAPA, there is a large amount of overlap among the field site class distributions (Figure 11). The variance components analysis found that field site class explained 15.5% of the variation in LCBAPA among the four site classes with more than three observations, a higher percentage than map site class (1.9%).
I II III IV V
Field Site Class
0
100
200
300
400
500
600
Live
Con
ifer B
A/A
cre
n=3 n=27 n=37 n=22 n=23
Figure 11. Box-and-whiskers plot for LCBAPA (ft2) by field site class.
A one-sample t-test was used to test for significant differences between the mean LCBAPA values for each field site class group and the DFC performance targets. The estimated mean LCBAPA values were significantly greater than the DFC targets for site classes II, III, IV and V (P < 0.001). The magnitude of the differences ranged from 73.2 - 123.5 ft2/acre (Table 11). The difference between mean LCBAPA for field site class I and the DFC target was not significant; however this may be due in part to the small sample size for field site class I (3
Final Report March 3, 2005 15

sites). The percentage of sites with BAPA values greater than the DFC targets ranged from 66.7 % for site class I to 95.7 % for site class V. The results of the analysis by field site class are similar to those of the previous analysis by map site, and support the conclusion that estimated mean LCBAPA is significantly higher than the DFC performance targets for site classes II, III, IV and V. Table 11. Comparison of estimated LCBAPA means to DFC targets, by field site class.
Field Site Class
DFC Target (Basal Area in ft2/acre)
Estimated Mean LCBAPA
(ft2/acre)
Difference (Estimated-
Target in ft2/acre)
t-test P-value
Percent of Sites with BAPA ≥ DFC Target
I 285 312.5 + 27.5 0.607 66.7% II 275 348.2 + 73.2 <0.001* 81.5% III 258 345.2 + 87.2 <0.001* 86.5% IV 224 318.9 + 94.9 <0.001* 81.8% V 190 313.5 + 123.5 <0.001* 95.7%
*Significant difference from DFC target. An issue with inconsistent plot width and area occurred in the analysis by field site class. Re-sorting data by field site class instead of map site class meant that plots with different widths and areas were combined. This is because plot widths for this study were established so that they matched the dimensions prescribed by the current forest practices rules, and vary by map site class and stream width (Table 2). The site class from field data often differed from the map site class, so when data were re-sorted by field site class, there was variation in plot width within field site class groups. Grouping data collected from plots of different widths has the potential for introducing bias into LCBAPA estimates. There was no means to determine whether bias exists in LCBAPA estimates by field site class due to differences in plot size, other than collecting additional data out to a consistent width across all plots. Collecting this additional data remains an option for a follow-up study.
Relationship Between Stand Density, Quadratic Mean Diameter and Basal Area/Acre The lack of a clear trend in LCBAPA in response to changes in site class (both map and field) and the absence of significant differences in LCBAPA between the different site class categories were not anticipated. This result does not support unique basal area targets for different site classes, raising questions about the rationale for using site class as a framework for setting basal area targets. Since basal area per acre is a function of tree density and diameter, an exploratory analysis was conducted to examine the relationships between these two parameters, and to determine if their relationship varied with changes in site quality (site class). Table 12 shows the mean trees per acre, quadratic mean diameter, and basal area values for live conifers by both map and field site class. There is a tendency for stand density to increase and quadratic mean diameter to decrease as site quality decreases.
Final Report March 3, 2005 16

Table 12. Mean LCTPA, LCQMD and LCBAPA by map and field site class. Map Site Class Mean LCTPA Mean LCQMD (in) Mean LCBAPA (ft2)
Ia 30.1 40.1 264.2 II 114.6 23.5 333.8 III 146.3 19.9 307.7 IV 231.4 17.5 353.1 V 268.8 16.5 341.0
Field Site Class Mean LCTPA Mean LCQMD (in) Mean LCBAPA (ft2) Ib 148.2 19.8 312.5 II 132.0 22.8 348.2 III 158.0 20.9 345.2 IV 174.3 18.9 318.9 V 325.3 14.1 313.5
a sample size = 1 b sample size = 2 The curvilinear relationship between LCQMD and LC TPA is shown in Figures 12 and 13, by map and field site class, respectively. The points for each of the five site classes tend to fall along certain portions of the curve, although there is considerable overlap between the distributions. Higher quality sites (site classes I and II) tend to fall on the upper left portion of the curve (larger diameter and low density), low quality sites (site class V) fall on the lower right section of the curve (small diameter, high density), and intermediate quality sites (II-IV) tend to fall in between. This relationship explains why the differences in basal area observed between site classes was not as great as expected, since the increase in the number of trees per acre as site quality declined compensates for the decrease in stem diameter.
0 100 200 300 400 500 600 700
Live Conifer TPA
0
10
20
30
40
50
Live
Con
ifer Q
MD
Map Site ClassIIIIIIIVV
Figure 12. Stand density (LCTPA) vs. LCQMD by map site class.
0 100 200 300 400 500 600 700
Live Conifer TPA
0
10
20
30
40
50
Live
Con
ifer Q
MD
Field Site ClassIIIIIIIVV
Figure 13. Stand density (LCTPA) vs. LCQMD by field site class.
Final Report March 3, 2005 17

Factors That Explain Variation in Basal Area per Acre Exploratory data analysis was conducted to determine the relationship between various site and stand attribute parameters and the variation in LCBAPA. Note that this analysis combined data from sites with differences in plot width and area, introducing the possibility of bias. A one-way analysis of variance (ANOVA) was performed with LCBAPA as the response variable and six independent categorical variables. The results of this analysis are shown in Table 13. Dominant species was the only categorical variable that had a significant relationship with LCBAPA. (Two species, Sitka spruce and subalpine fir (Abies lasiocarpa), were eliminated from the analysis because only one site was dominated by each of these species.
Table 13. Relationship between LCBAPA and six categorical variables.
Variable F-statistic P-value Dominant tree species 4.95 0.001*
Dominant landform 0.962 0.385 Eco-region 1.006 0.393 Site class (field) 0.938 0.445 Channel confinement category 0.338 0.798
Plot aspect 0.293 0.830
*statistically significant relationship (P ≤ 0.05)
A correlation analysis was conducted between LCBAPA and 10 continuous independent variables. When the data were “clustered”, a correlation analysis using the natural-logarithm transformation was performed. The results of this analysis, including r (correlation coefficient), R2 and the P-value are shown in Table 14. Precipitation was the only continuous variable with a significant relationship with LCBAPA; however precipitation explained little of the variability in live conifer BAPA as indicated by the low R2 value (0.0647). Table 14. Relationships between LCBAPA and 10 continuous variables.
Variable r R2 P-value Precipitation 0.254 0.0647 0.007* Site index (field) 0.181 0.0329 0.055 Stand age (map) 0.121 0.0146 0.211 Side-slope gradient 0.112 0.0125 0.238 Channel gradient 0.109 0.0119 0.255 Valley width (log) 0.094 0.0089 0.322 Channel width (log) 0.075 0.0056 0.429 Channel confinement ratio (log) 0.047 0.0022 0.626 Valley form 0.044 0.0020 0.643 Elevation 0.041 0.0017 0.666 *statistically significant relationship (P ≤ 0.05)
Basal Area vs. Dominant Species The dominant species of the stand (species with the greatest basal area) was the parameter with the strongest relationship to LCBAPA. Dominant species therefore shows some prospect for serving as an alternative to, or in conjunction with, site class as a framework for setting DFC targets that address site specific differences in stand characteristics. Additional analyses were performed to identify and evaluate differences in LCBAPA between the various
Final Report March 3, 2005 18

dominant species groups. Table 15 provides summary statistics for mean LCBAPA data by dominant species. Table 15. Summary statistics for mean LCBAPA by dominant species of the stand.
Dominant Species
Sample Size
Estimated Mean LCBAPA (ft2/acre)
Standard Error
95% Confidence Interval
Relative Precisiona
W. Red Cedar 8 357.9 20.44 309.5 - 406.2 13.5% Douglas-fir 55 361.2 11.51 338.2 - 384.3 6.4% Pac. Silver Fir 17 317.0 17.06 280.9 - 353.2 11.4% W. Hemlock 27 293.4 14.11 264.4 - 322.4 9.9% Grand Fir 4 253.4 28.87 161.6 - 345.3 36.3% Sitka Spruce 1 264.2 -b -b -b -b
Subalpine Fir 1 315.8 -b -b -b -b
a Relative precision for 95% confidence interval. b the analysis could not be done due to only one observation. Figure 14 depicts the 95% confidence interval error bars for mean LCBAPA by dominant species group. Levene’s test for the homogeneity of group variances was not rejected (P = 0.183) so ANOVA was performed to determine if the apparent differences in mean LCBAPA between dominant species groups were significant. The results indicated that significant differences existed between the means (P=0.001). Next the Bonferroni and Scheffe multiple comparison test was conducted to evaluate specific differences between Douglas-fir, Pacific silver fir and western hemlock pairings. (The other dominant species groups were not tested because of the low sample sizes). There was a significant difference in mean LCBAPA between sites dominated by Douglas-fir and those dominated by
Error Bars show 95.0% Cl of Mean
Silv er FirGrand Fir
Subalpine FirSpruce
Douglas FirRed Cedar
Western Hemlock
Dominant Species
0
50
100
150
200
250
300
350
400
450
Live
Con
ifer B
A/A
cre
n= 17
n= 4
n= 1
n= 1
n= 55n= 8
n= 27
Figure 14. Plot of 95% confidence interval error bars around mean LCBAPA (ft2) by dominant species.
western hemlock (P < 0.001). These two groups had the largest sample sizes (55 and 27 observations, respectively). Differences between each of these two groups and Pacific silver fir were not significant, possibly due to the smaller sample size for the Pacific silver fir group (n=17). The variance components analysis found that dominant species explained 17.2% of the difference in mean LCBAPA among the three groups. Differences in LCBAPA by dominant species may prove useful in prescribing management to address current stand conditions. The value of dominant species as a framework for setting management targets is questionable because past disturbance and management often influence current stand composition, and a useful framework for DFC targets should focus on site potential rather than current composition.
Final Report March 3, 2005 19

Preliminary Evaluation of Alternative Riparian DFC Metrics Data on a suite of other stand attributes collected at the study sites are presented and analyzed by map and field site class in Appendix A. Trees per acre, quadratic mean diameter and basal area per acre are reported for live conifer trees, total live trees and snags. Volume, relative density (RD), dominant species, mean over story tree height and mean co-dominant tree age are reported for live trees only. A sub-set of these stand attributes were examined to determine their suitability as metrics to characterize mature riparian stands and establish DFC performance targets. A preliminary evaluation of these stand attributes was performed on the basis of their: 1) ability to characterize mature stand conditions; 2) variability; and 3) ecological and biological relevance, and 4) cost and feasibility.
Ability to Characterize Mature Stand Conditions To provide a meaningful target under the Desired Future Condition (DFC) paradigm for management of western Washington riparian stands on fish-bearing streams, the metric used should address both the density and size or structural characteristics of trees in mature stands. Three of the parameters being evaluated, trees per acre (TPA), quadratic mean diameter (QMD) and mean over story tree height (MOTH) are not suitable as stand-alone parameters to characterize DFC because they do not describe both the number and size of the trees present in mature stands. For example, TPA describes the density of the stand, but does not provide information on the diameter or height of the trees needed to differentiate mature stands from younger stands. Conversely, the QMD and MOTH describe the size of trees but do not provide information on the density. Basal area per acre (BAPA), total volume per acre (TLVOL) and relative density (RD) are more suitable metrics that incorporate both tree size and density. TLVOL is a particularly descriptive metric because it integrates density, diameter and height and differentiates between site classes. In addition, the curve describing the relationship between TPA and QMD (Figures 12 and 13) is useful for describing variation in mature stand structure by site class.
Ecological and Biological Relevance All of the parameters being evaluated have ecological and biological relevance to the aquatic resource management goals of the FFR riparian prescriptions. The foundation of the DFC management approach is the assumption that stands managed to emulated mature, unmanaged riparian forests will provide similar ecological functions that support aquatic resources, (particularly the recruitment of large woody debris [LWD] that creates complex aquatic habitat, as well as canopy to provide shade and nutrient inputs). The parameters that describe both stand density and tree size are relevant to LWD recruitment (BAPA, volume, RD and the TPA/QMD curve). Volume is often used to quantify LWD recruitment and loading so it is particularly relevant. Measures of tree diameter such as QMD relate to the stability and function of wood after it is recruited to the stream channel. RD provides an index of stocking levels and impending stress or mortality due to competition. It is often used to guide the magnitude and timing of thinning prescriptions to maintain rapid tree growth. Its utility as a mature stand condition indicator related to competition, future mortality and potential LWD recruitment may merit further examination. Finally, MOTH is relevant to the number of stems potentially available for recruitment since the distance from which stems can reach the channel (and hence the number of stems potentially available for LWD recruitment) is dependent on the height of the trees.
Final Report March 3, 2005 20

Variability Establishing a meaningful management target based on the central tendency of a metric with substantial variability is problematic. Consequently, the variability of potential DFC target metrics was evaluated. Relative precision (the half width of 95% CI divided by the mean) was used as the measure of variability, with lower values indicating less variability. The relative precision values for BAPA, QMD, MOTH, TLVOL and RD ranged from 3.8% -5.8%, a level of variability that should not confound their utility in setting targets. Variability was twice as great for LCTPA and TLTPA (10.4 and 9.9% respectively), reducing their suitability as target metrics.
Cost and Feasibility Most of these alternative metrics could be used with little or no increase in cost or effort above the current procedures, which requires landowners to perform a complete inventory of the core and inner zones to document the number, type (conifer or hardwood) and diameter of the trees. These data are used in turn to run the DFC model, which predicts future basal area per acre at 140 years. The current inventory and modeling procedures appear adequate to determine TPA, QMD and RD. If the current inventory data were input into a model, such as the Forest Vegetation Simulator model, future TPA, QMD, TLVOL, RD and MOTH could be projected. Consequently, it appears feasible to implement these alternative metrics at little additional cost, with accuracy and precision similar to that of the current procedures.
Summary of Alternative DFC Parameter Evaluation Metrics that integrate tree size and stand density such as BAPA, TLVOL and RD are superior to stand alone values for QMD, TPA and MOTH as potential DFC metrics. However, the use of QMD, TPA or MOTH conjunction with one another can provide a potentially useful metric, as demonstrated by the TPA/QMD curve. All of the parameters evaluated have relevance to LWD recruitment, the primary ecological process of concern, and could be implemented using the data collection procedures currently in use. Several metrics would require changes in model output, including TLVOL, RD, MOTH, and the TPA/QMD curve. While this evaluation identifies possible alternatives to BAPA, it does not provide a strong justification for replacing BAPA. BAPA satisfies the four evaluation criteria discussed above and has been widely accepted by participants in the FFR management system. Perhaps the main weakness of BAPA as a DFC target metric is that it does not adequately describe or differentiate between stands that are quite different in structure. The study data indicate that poor quality sites support mature riparian stands that tend to be relatively dense, with trees that are relatively short and small in diameter, while higher quality sites support more widely spaced stands of taller, larger diameter trees. However the mean LCBAPA values for both types of stands (and intermediate stand conditions) are not significantly different. In the future, as the understanding of the pathways of stand development from young managed stands to mature stands increases, more descriptive target metrics that incorporate stand density, diameter, volume and perhaps other structural characteristics such as snags, may be useful in developing site-specific prescriptions.
Final Report March 3, 2005 21
Discussion
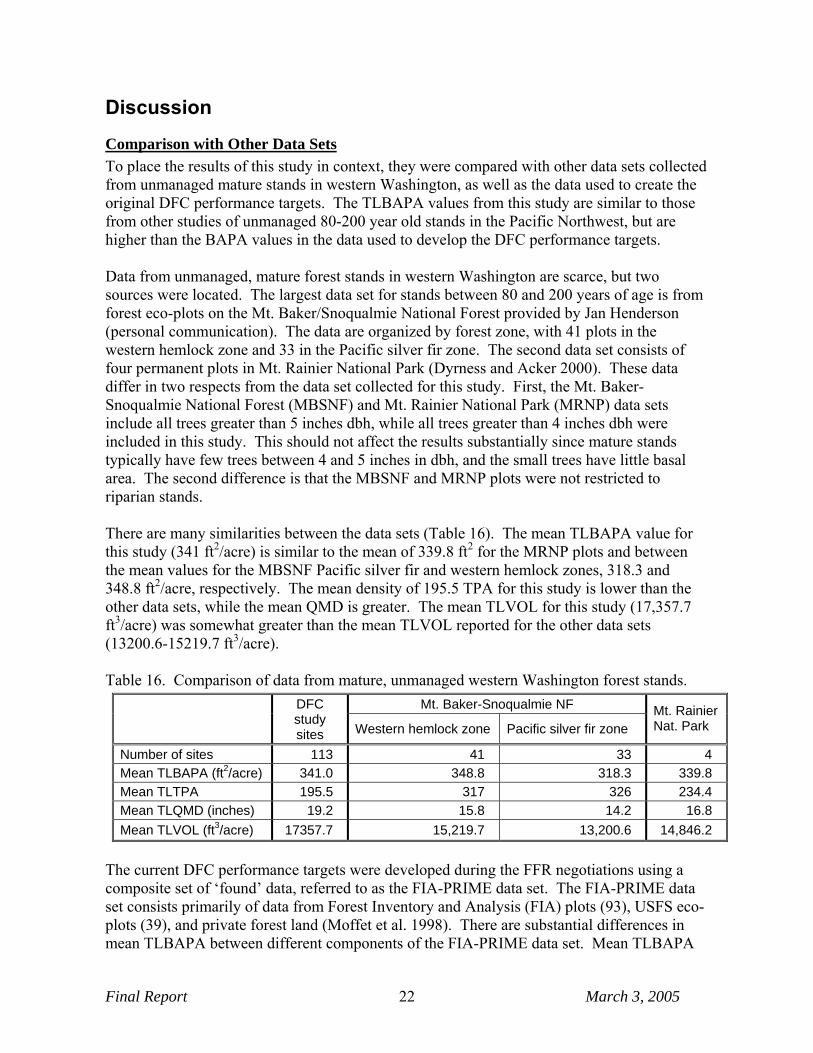
Comparison with Other Data Sets To place the results of this study in context, they were compared with other data sets collected from unmanaged mature stands in western Washington, as well as the data used to create the original DFC performance targets. The TLBAPA values from this study are similar to those from other studies of unmanaged 80-200 year old stands in the Pacific Northwest, but are higher than the BAPA values in the data used to develop the DFC performance targets. Data from unmanaged, mature forest stands in western Washington are scarce, but two sources were located. The largest data set for stands between 80 and 200 years of age is from forest eco-plots on the Mt. Baker/Snoqualmie National Forest provided by Jan Henderson (personal communication). The data are organized by forest zone, with 41 plots in the western hemlock zone and 33 in the Pacific silver fir zone. The second data set consists of four permanent plots in Mt. Rainier National Park (Dyrness and Acker 2000). These data differ in two respects from the data set collected for this study. First, the Mt. Baker-Snoqualmie National Forest (MBSNF) and Mt. Rainier National Park (MRNP) data sets include all trees greater than 5 inches dbh, while all trees greater than 4 inches dbh were included in this study. This should not affect the results substantially since mature stands typically have few trees between 4 and 5 inches in dbh, and the small trees have little basal area. The second difference is that the MBSNF and MRNP plots were not restricted to riparian stands. There are many similarities between the data sets (Table 16). The mean TLBAPA value for this study (341 ft2/acre) is similar to the mean of 339.8 ft2 for the MRNP plots and between the mean values for the MBSNF Pacific silver fir and western hemlock zones, 318.3 and 348.8 ft2/acre, respectively. The mean density of 195.5 TPA for this study is lower than the other data sets, while the mean QMD is greater. The mean TLVOL for this study (17,357.7 ft3/acre) was somewhat greater than the mean TLVOL reported for the other data sets (13200.6-15219.7 ft3/acre). Table 16. Comparison of data from mature, unmanaged western Washington forest stands.
Mt. Baker-Snoqualmie NF
DFC study sites Western hemlock zone Pacific silver fir zone
Mt. Rainier Nat. Park
Number of sites 113 41 33 4 Mean TLBAPA (ft2/acre) 341.0 348.8 318.3 339.8 Mean TLTPA 195.5 317 326 234.4 Mean TLQMD (inches) 19.2 15.8 14.2 16.8 Mean TLVOL (ft3/acre) 17357.7 15,219.7 13,200.6 14,846.2
The current DFC performance targets were developed during the FFR negotiations using a composite set of ‘found’ data, referred to as the FIA-PRIME data set. The FIA-PRIME data set consists primarily of data from Forest Inventory and Analysis (FIA) plots (93), USFS eco-plots (39), and private forest land (Moffet et al. 1998). There are substantial differences in mean TLBAPA between different components of the FIA-PRIME data set. Mean TLBAPA
Final Report March 3, 2005 22
for the 39 USFS eco-plots in the FIA-PRIME data set is >300 ft2/acre; similar to the DFC sites. Mean TLBAPA for the FIA component of the data set is <250 ft2/acre, lower than any of the other datasets. The differences in mean TLBAPA between the FIA portion of the FIA-PRIME data set, and the DFC data (as well as the USFS portion of the FIA-PRIME data set) are likely due to differences in the populations of riparian sites that were sampled. The DFC data set consists of conifer-dominated sites with no evidence of past management activity that are located within the regulatory RMZ for the Type F riparian prescriptions. The FIA data include both hardwood- and conifer-dominated stands with a more extensive range of past management influences and a broader range of locations relative to the regulatory RMZ. Hardwood-dominated sites were excluded from the DFC sample because the DFC targets are not applied to hardwood-dominated stands, while the FIA data set includes hardwood-dominated plots; some with very low tree densities. The DFC sites were carefully screened in the field to exclude sites with physical evidence of selective harvest or thinning, while the FIA-PRIME sites received a less rigorous screen for past management influence that excluded only sites where thinning was reported in the last 10 years. Due to the history of widespread thinning and selective harvest observed on private, state and federal land, it is likely that some trees have been removed from many FIA plots in the past. The DFC sites were located within the area that would be included in the core and inner zone of the regulatory RMZ. The FIA sites occur within 213 ft (65m) of a stream, which likely would include a range of locations including plots in CMZs, within the regulatory RMZ, and upslope of the regulatory RMZ.
Summary of Key Results Related to the DFC Performance Target System The DFC performance target system used in FFR consists of two components. The first component is a framework for setting targets that addresses site-specific variability across the landscape. In the FFR-DFC system, five site class categories comprise the framework for setting targets. The second component of the system is the performance targets that are used to quantify resource objectives and evaluate prescription effectiveness. The DFC target metric is basal area per acre, and there is a specific target value for each of the five site classes. The focus of this study was to validate the specific basal area per acre target values for each of the five map site class categories. However, in addition to validating the target values, the study results also provided insights on the DFC performance target system. Following is a summary of some of the key study results and indications regarding the DFC performance target system. 1. Mean LCBAPA observed at the study sites was greater than the existing DFC performance targets for map site classes II, III, IV and V. These differences were all statistically significant (P < 0.001). This indicates that the current targets are too low to be supported by the study results for these four map site classes. Since there was only one study site for map site class I, no statistical tests were performed and no conclusions were drawn concerning the adequacy of the current targets for map site class I. 2. A discrepancy was observed between site class indicated on maps and site class derived from height and age measurements in the field. The map and field site class calls were in agreement less than half of the time, and in the majority of the cases where they were in disagreement, the field estimates indicated higher productivity than the map site classes. This study was not designed to evaluate the accuracy of the site class maps; however it provides an
Final Report March 3, 2005 23
indication of possible inaccuracies that could affect their utility as a framework for setting performance targets and buffer widths. An additional study specifically designed for the purpose of validating the accuracy of the site class maps is necessary to resolve this issue. 3. Due to the differences between map and field site class calls, the data were re-sorted and analyzed by field site class. The results of this analysis were similar to those obtained with the data sorted by map site class. Mean LCBAPA observed at the study sites was greater than the existing DFC performance targets for field site classes II, III, IV and V. These differences were all statistically significant (P < 0.001). These results support the results of the analysis by map site class concerning the validity of the current performance targets. 4. Differences in mean LCBAPA between the five site class groups were not statistically significant. This was true regardless of whether the data were sorted by map or field site class. The reason for this is that stem diameter tends to increase as site productivity increases while stem density (trees per acre) decreases. These two factors tend to offset one another when basal area is calculated, resulting in similar basal area values for high density, small diameter stands on poor quality sites and large diameter, low density stands on sites with higher productivity. This raises a question concerning the utility of site class (productivity) as a framework for setting basal area targets. However, since significant differences were observed between site classes for parameters such as trees per acre, quadratic mean diameter and volume, site class may be a useful framework for these alternative target metrics. 5. Most site and stand attributes explained little of the variability observed in LCBAPA. For example, map site class explained only 1.9% of the variability in mean LCBAPA. Of the 16 independent variables tested, only two (dominant tree species and precipitation) had a significant relationship with LCBAPA, and only dominant tree species appeared to have the potential as a meaningful framework for setting basal area performance targets. There were statistically significant differences in mean LCBAPA between stands dominated by Douglas-fir and those dominated by western hemlock. Sample sizes were not large enough to test for differences among the other stand types. 6. Alternative target metrics were evaluated on the basis of their ability to characterize stand structure, variability, biological/ecological significance and cost/feasibility. None of these parameters appeared to be clearly superior to LCBAPA as a DFC target metric, however TLVOL appears to provide the most information about the stand because it incorporates tree density, diameter and height. Use of a metric based on the relationship between trees per acre and quadratic mean diameter may merit further investigation, as may the incorporation of snags due to their ecological importance. In conclusion, the study results indicate that the current DFC performance targets are significantly lower than LCBAPA data from field observations. The study results also raise additional questions concerning the selection of target metrics and the framework used to address site-specific variability in stand conditions. The data presented appear adequate for use in adaptive management to adjust the existing performance targets for map site classes II, III, IV and V. Additional study will be required to address other issues raised about components of the FFR-DFC performance target system and explore possible solutions.
Final Report March 3, 2005 24
References Curtis, R.O. 1982. A simple index of stand density for Douglas-fir. Forest Science 18:92-94.
Donnelly, D.M. and R.R. Johnson. 1997(a). West Cascades variant of the forest vegetation simulator. USDA Forest Service. Western Forest Management Service Center. Fort Collins, CO.
Donnelly, D.M. and R.R. Johnson. 1997(b). Pacific Northwest Coast variant of the forest vegetation simulator. USDA Forest Service. Western Forest Management Service Center. Fort Collins, CO.
Dyrness, T. and S. Acker. 2000. Permanent Plots in the Mount Rainier National Park. Permanent Plots of the Pacific Northwest. Report Number 4. (www.fsl.orst.edu/lter/pubs/ webdocs/permplot.htm).
Fairweather, Stephen E. 2001. Westside RMZs and the DFC model: documentation of their conceptual and methodological development. TFW-RSAG 1-01-001. Washington Dept. of Natural Resources, Forest Practices Division, Olympia, WA. 24 p. plus appendices.
Henderson, Jan. US Forest Service. Mount Baker-Snoqualmie Forest. Montlake Terrace. WA.
Hoaglin, D.C., F. Mosteller and J.W. Tukey (eds). 1983. Understanding robust and exploratory data analysis. John Wiley and Sons, Inc. New York. 447 p.
King, J.E. 1966. Site index curves for Douglas-fir in the Pacific Northwest. Weyerhaeuser Forestry Paper No. 8. Weyerhaeuser Company Forest Research Center. Centralia.
Kurucz, J.F. 1978. Preliminary, polymorphic site index curves for western redcedar (Thuja plicata Donn) in coastal British Columbia. MacMillan Bloedel For. Res. Note No. 3. MacMillan Bloedel Ltd. Resource Economics Section. Woodland Services. Nanaimo, B.C.
Kurucz, J.F. 1982. Report on Project 933-3. Polymorphic site-index curves for balsam- Abies amabalis- in coastal British Columbia. MacMillan Bloedel Ltd. Resource Economics Section. Woodland Services. Rep. on Project 933-3. Nanaimo, B.C.
Miller, J.F., R.H. Frederick, and R.J. Tracey. 1973. Precipitation-frequency atlas of the Western United States. Atlas 2. U.S. Department of Commerce, National Oceanic and Atmospheric Administration.
Milliken, G.A. and D.E. Johnson. 1992. Analysis of Messy Data: Volume 1. Chapman and Hall. New York. 473 p.
Moffet, J., M. Ludwig and B. Lippke. 1998. Draft technical analysis for the Desired Future Condition Work Group. University of Washington. Seattle.
Nigh, G.D. 1997. A Sitka spruce height-age model with improved extrapolation properties. For. Chron. 73(3):363-369.
Oliver, C.D. and B.C. Larson. 1990. Forest stand dynamics. McGraw-Hill, Inc. New York.
Omernik, J.M. and A.L. Gallant. 1986. Ecoregions of the Pacific Northwest. EPA/600/3-86/033. USEPA. Environmental Research Laboratory. Corvallis.
Final Report March 3, 2005 25

Roorbach, A., D. Schuett-Hames, R. Haight and M. McGowan. 2002. Field procedures for the pilot study to validate the DFC performance targets for west-side riparian prescriptions in Washington’s Forest Practices Rules. Northwest Indian Fisheries Commission. Olympia.
Rot, B. 1995. The interaction of valley constraint, riparian landform, and riparian plant community size and age upon channel configuration of small streams of the western Cascade Mountains, Washington. MS Thesis. College of Forest Resources. University of Washington. Seattle.
Rot, B.W., R.J. Naiman and R.E Bilby. 2000. Stream channel configuration, landform and riparian forest structure in the Cascade Mountains, Washington. Can. J. Fish. Aquat. Sci. 57:699-707.
Schuett-Hames, D., M. McGowan and D.R. Berg. 2000. Briefing paper on validation of riparian prescription performance targets. Northwest Indian Fisheries Commission. Olympia.
Schuett-Hames, D., R. Conrad, A. Roorbach and M. McGowan. 2001. Study plan to validate the DFC performance targets for the west-side riparian prescriptions in Washington’s Forest Practices Rules. Northwest Indian Fisheries Commission. Olympia.
Sokal, R. and F. Rohlf. 1969. Biometry. W. H. Freeman and Co. San Francisco. 776p.
SPSS. 1999. SPSS base 10.0 applications guide. SPSS, Inc. Chicago. 426p.
US Fish and Wildlife Service and 11 other organizations. 1999. Forests and fish report. Washington Forest Protection Association. Olympia.
Washington Department of Natural Resources. 1996. Field procedures for the Forest Resource Inventory System. Washington Department of Natural Resources. Olympia, WA
Washington Forest Practices Board (WFPB). 1995. Board manual: standard methodology for conducting Watershed Analysis. Version 3.0. Washington Department of Natural Resources. Forest Practices Division. Olympia, WA.
Washington Forest Practices Board (WFPB). 2001. Washington Forest Practices Rules. Washington Department of Natural Resources. Forest Practices Division. Olympia, WA.
Wiley, K.N. 1978. Site index tables for western hemlock in the Pacific Northwest. Weyerhaeuser Forestry Paper No. 17. Weyerhaeuser Company Forest Research Center. Centralia.
Final Report March 3, 2005 26
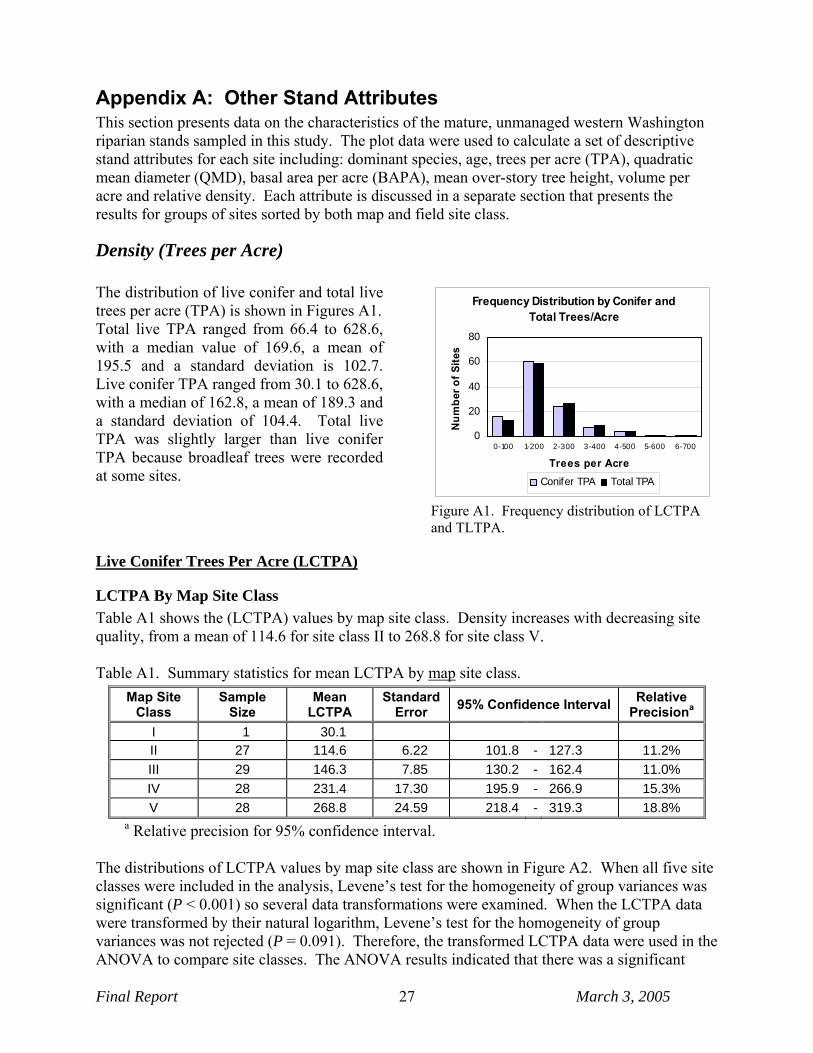
Appendix A: Other Stand Attributes This section presents data on the characteristics of the mature, unmanaged western Washington riparian stands sampled in this study. The plot data were used to calculate a set of descriptive stand attributes for each site including: dominant species, age, trees per acre (TPA), quadratic mean diameter (QMD), basal area per acre (BAPA), mean over-story tree height, volume per acre and relative density. Each attribute is discussed in a separate section that presents the results for groups of sites sorted by both map and field site class.
Density (Trees per Acre) The distribution of live conifer and total live trees per acre (TPA) is shown in Figures A1. Total live TPA ranged from 66.4 to 628.6, with a median value of 169.6, a mean of 195.5 and a standard deviation is 102.7. Live conifer TPA ranged from 30.1 to 628.6, with a median of 162.8, a mean of 189.3 and a standard deviation of 104.4. Total live TPA was slightly larger than live conifer TPA because broadleaf trees were recorded at some sites.
Frequency Distribution by Conifer and Total Trees/Acre
0
20
40
60
80
0-100 1-200 2-300 3-400 4-500 5-600 6-700
Trees per AcreN
umbe
r of S
ites
Conifer TPA Total TPA
Figure A1. Frequency distribution of LCTPA and TLTPA.
Live Conifer Trees Per Acre (LCTPA)
LCTPA By Map Site Class Table A1 shows the (LCTPA) values by map site class. Density increases with decreasing site quality, from a mean of 114.6 for site class II to 268.8 for site class V. Table A1. Summary statistics for mean LCTPA by map site class.
Map Site Class
Sample Size
Mean LCTPA
StandardError 95% Confidence Interval Relative
Precisiona
I 1 30.1 II 27 114.6 6.22 101.8 - 127.3 11.2% III 29 146.3 7.85 130.2 - 162.4 11.0% IV 28 231.4 17.30 195.9 - 266.9 15.3% V 28 268.8 24.59 218.4 - 319.3 18.8%
a Relative precision for 95% confidence interval. The distributions of LCTPA values by map site class are shown in Figure A2. When all five site classes were included in the analysis, Levene’s test for the homogeneity of group variances was significant (P < 0.001) so several data transformations were examined. When the LCTPA data were transformed by their natural logarithm, Levene’s test for the homogeneity of group variances was not rejected (P = 0.091). Therefore, the transformed LCTPA data were used in the ANOVA to compare site classes. The ANOVA results indicated that there was a significant
Final Report March 3, 2005 27

difference in LCTPA means among site classes (P < 0.001). When site class I (which had only one observation) was omitted from the analysis, the ANOVA still indicated a significant difference (P < 0.001) in LCTPA means among site classes II, III, IV, and V. The Bonferroni multiple comparison procedure indicated that site classes II and III (P = 0.110) and IV and V (P = 1.000) were not significantly different from each other. All other pair-wise comparisons were significant (all P < 0.001). In Figure A2 there is a large degree of overlap between site classes II and III and between site classes IV and V but very little overlap between these two groups. The variance components analysis estimated that map site class explained 48.3% of the variation in LCTPA among the four site classes with more than a single observation.
I II III IV V
Map Site Class
0
100
200
300
400
500
600
700
Live
Con
ifer T
PA
n=1 n=27 n=29 n=28 n=28
Figure A2. Box-and-whiskers plot for live conifer trees per acre by map site class.
LCTPA By Field Site Class Table A2 shows the mean live conifer trees per acre (LCTPA) values by field site class. Mean density tends to increase with decreasing field site class, from a mean of 132.0 for site class II to 325.3 for site class V. The mean LCTPA for field site class I (148.2) is greater than that for site class II, however this result may be influenced by the small sample size for field site class I.
Table A2. Summary statistics for mean LCTPA by field site class. Field
Site Class Sample
Size Mean
LCTPA Standard
Error 95% Confidence Interval Relative Precisiona
I 3 148.2 20.17 61.4 - 235.0 58.5% II 27 132.0 9.97 111.5 - 152.4 15.5% III 37 158.0 9.24 139.2 - 176.7 11.9% IV 22 174.3 13.35 146.5 - 202.0 15.9% V 23 325.3 27.69 267.9 - 382.8 17.7%
a Relative precision for 95% confidence interval. The distributions of LCTPA values by field site class are shown in Figure A3. When all five site classes were included in the analysis, Levene’s test for the homogeneity of group variances was significant (P < 0.001) so several data transformations were examined. When the LCTPA data were transformed by their natural logarithm, Levene’s test for the homogeneity of group variances was not rejected (P = 0.587). Therefore, the transformed LCTPA data were used in the ANOVA to compare site classes. The ANOVA results indicated that there was a significant difference in LCTPA means among site classes (P < 0.001). When site class I (which had only
Final Report March 3, 2005 28
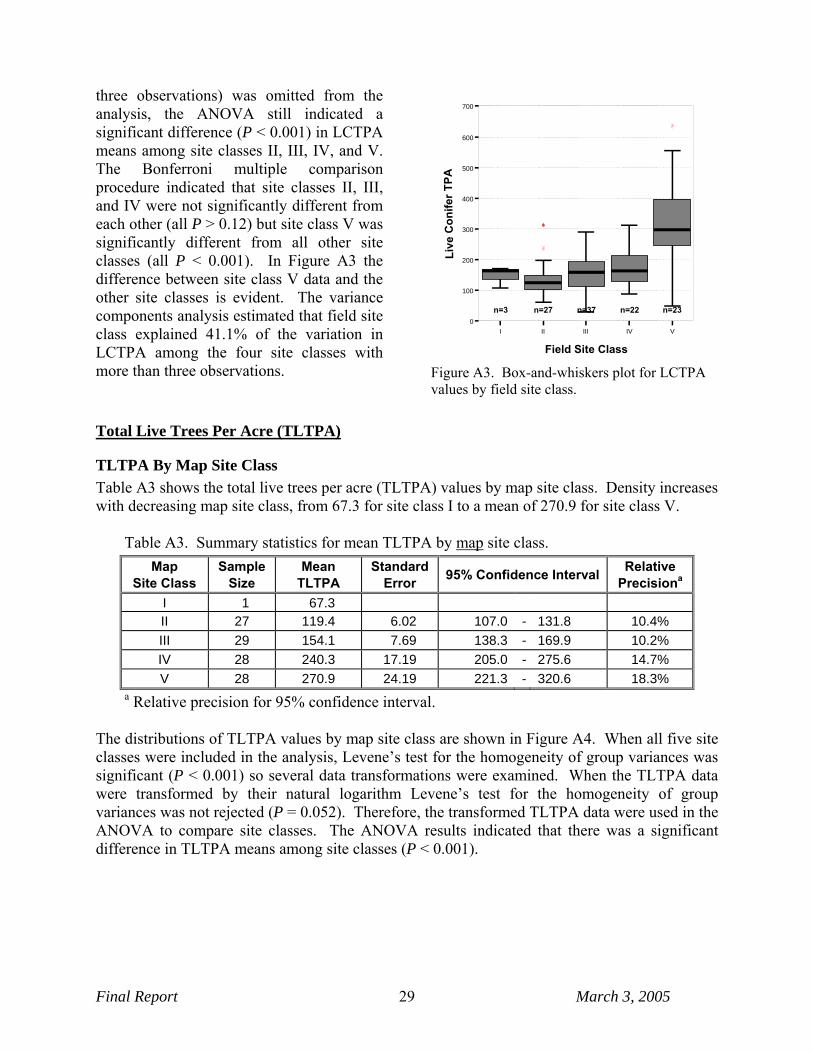
three observations) was omitted from the analysis, the ANOVA still indicated a significant difference (P < 0.001) in LCTPA means among site classes II, III, IV, and V. The Bonferroni multiple comparison procedure indicated that site classes II, III, and IV were not significantly different from each other (all P > 0.12) but site class V was significantly different from all other site classes (all P < 0.001). In Figure A3 the difference between site class V data and the other site classes is evident. The variance components analysis estimated that field site class explained 41.1% of the variation in LCTPA among the four site classes with more than three observations.
I II III IV V
Field Site Class
0
100
200
300
400
500
600
700
Live
Con
ifer T
PA
n=3 n=27 n=37 n=22 n=23
Figure A3. Box-and-whiskers plot for LCTPA values by field site class.
Total Live Trees Per Acre (TLTPA)
TLTPA By Map Site Class Table A3 shows the total live trees per acre (TLTPA) values by map site class. Density increases with decreasing map site class, from 67.3 for site class I to a mean of 270.9 for site class V.
Table A3. Summary statistics for mean TLTPA by map site class. Map
Site Class Sample
Size Mean
TLTPA Standard
Error 95% Confidence Interval Relative Precisiona
I 1 67.3 II 27 119.4 6.02 107.0 - 131.8 10.4% III 29 154.1 7.69 138.3 - 169.9 10.2% IV 28 240.3 17.19 205.0 - 275.6 14.7% V 28 270.9 24.19 221.3 - 320.6 18.3%
a Relative precision for 95% confidence interval. The distributions of TLTPA values by map site class are shown in Figure A4. When all five site classes were included in the analysis, Levene’s test for the homogeneity of group variances was significant (P < 0.001) so several data transformations were examined. When the TLTPA data were transformed by their natural logarithm Levene’s test for the homogeneity of group variances was not rejected (P = 0.052). Therefore, the transformed TLTPA data were used in the ANOVA to compare site classes. The ANOVA results indicated that there was a significant difference in TLTPA means among site classes (P < 0.001).
Final Report March 3, 2005 29
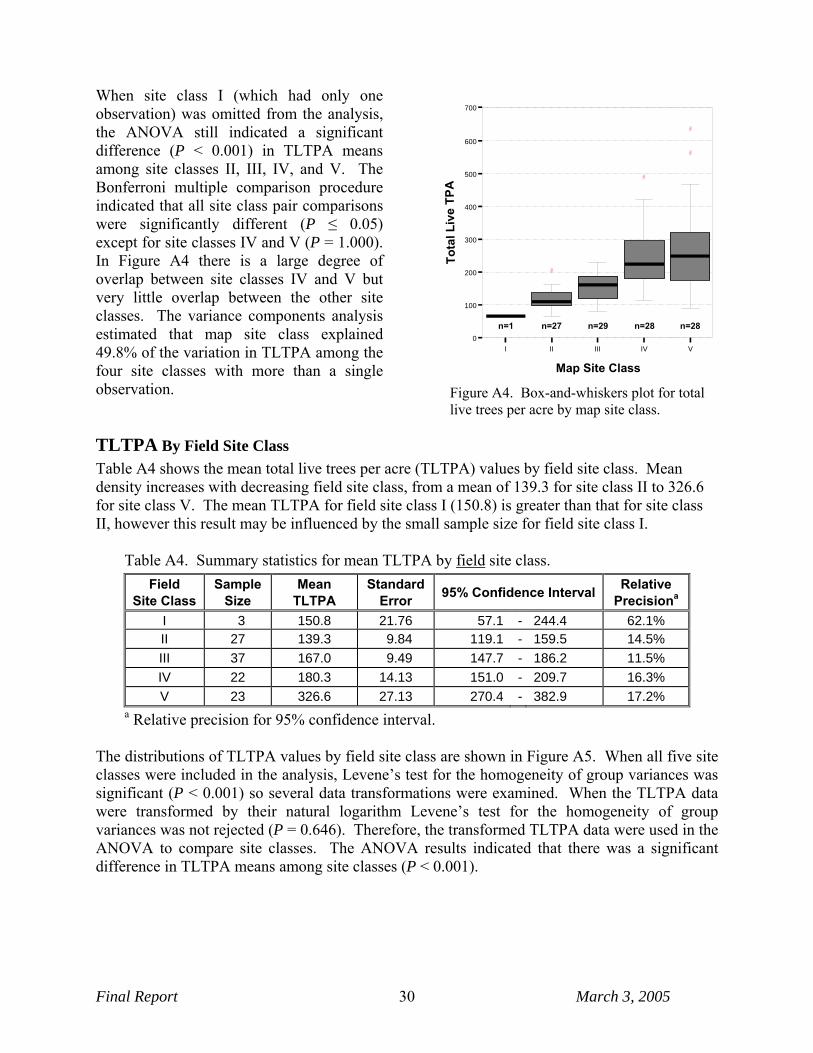
When site class I (which had only one observation) was omitted from the analysis, the ANOVA still indicated a significant difference (P < 0.001) in TLTPA means among site classes II, III, IV, and V. The Bonferroni multiple comparison procedure indicated that all site class pair comparisons were significantly different (P ≤ 0.05) except for site classes IV and V (P = 1.000). In Figure A4 there is a large degree of overlap between site classes IV and V but very little overlap between the other site classes. The variance components analysis estimated that map site class explained 49.8% of the variation in TLTPA among the four site classes with more than a single observation.
I II III IV V
Map Site Class
0
100
200
300
400
500
600
700
Tota
l Liv
e TP
A
n=1 n=27 n=29 n=28 n=28
Figure A4. Box-and-whiskers plot for total live trees per acre by map site class.
TLTPA By Field Site Class Table A4 shows the mean total live trees per acre (TLTPA) values by field site class. Mean density increases with decreasing field site class, from a mean of 139.3 for site class II to 326.6 for site class V. The mean TLTPA for field site class I (150.8) is greater than that for site class II, however this result may be influenced by the small sample size for field site class I.
Table A4. Summary statistics for mean TLTPA by field site class. Field
Site Class Sample
Size Mean
TLTPA Standard
Error 95% Confidence Interval Relative Precisiona
I 3 150.8 21.76 57.1 - 244.4 62.1% II 27 139.3 9.84 119.1 - 159.5 14.5% III 37 167.0 9.49 147.7 - 186.2 11.5% IV 22 180.3 14.13 151.0 - 209.7 16.3% V 23 326.6 27.13 270.4 - 382.9 17.2%
a Relative precision for 95% confidence interval. The distributions of TLTPA values by field site class are shown in Figure A5. When all five site classes were included in the analysis, Levene’s test for the homogeneity of group variances was significant (P < 0.001) so several data transformations were examined. When the TLTPA data were transformed by their natural logarithm Levene’s test for the homogeneity of group variances was not rejected (P = 0.646). Therefore, the transformed TLTPA data were used in the ANOVA to compare site classes. The ANOVA results indicated that there was a significant difference in TLTPA means among site classes (P < 0.001).
Final Report March 3, 2005 30
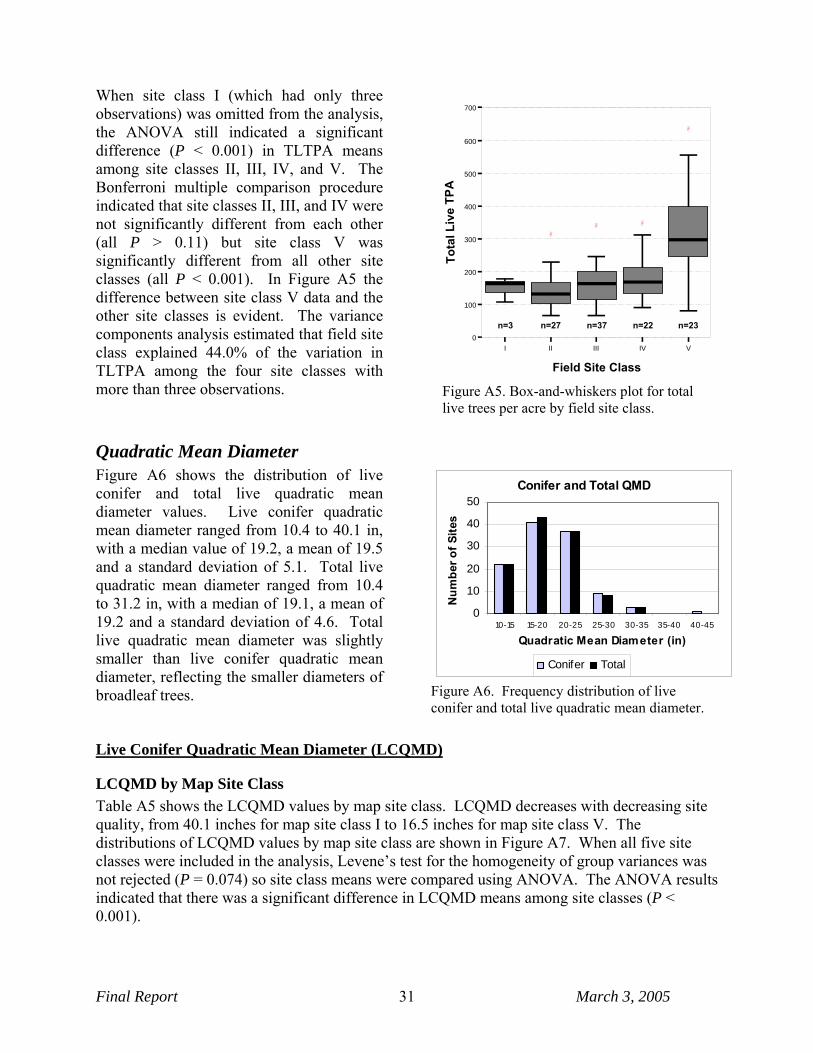
When site class I (which had only three observations) was omitted from the analysis, the ANOVA still indicated a significant difference (P < 0.001) in TLTPA means among site classes II, III, IV, and V. The Bonferroni multiple comparison procedure indicated that site classes II, III, and IV were not significantly different from each other (all P > 0.11) but site class V was significantly different from all other site classes (all P < 0.001). In Figure A5 the difference between site class V data and the other site classes is evident. The variance components analysis estimated that field site class explained 44.0% of the variation in TLTPA among the four site classes with more than three observations.
I II III IV V
Field Site Class
0
100
200
300
400
500
600
700
Tota
l Liv
e TP
A
n=3 n=27 n=37 n=22 n=23
Figure A5. Box-and-whiskers plot for total live trees per acre by field site class.
Quadratic Mean Diameter Figure A6 shows the distribution of live conifer and total live quadratic mean diameter values. Live conifer quadratic mean diameter ranged from 10.4 to 40.1 in, with a median value of 19.2, a mean of 19.5 and a standard deviation of 5.1. Total live quadratic mean diameter ranged from 10.4 to 31.2 in, with a median of 19.1, a mean of 19.2 and a standard deviation of 4.6. Total live quadratic mean diameter was slightly smaller than live conifer quadratic mean diameter, reflecting the smaller diameters of broadleaf trees.
Conifer and Total QMD
0
10
20
30
40
50
10-15 15-20 20-25 25-30 30-35 35-40 40-45
Quadratic Mean Diameter (in)
Num
ber o
f Site
s
Conifer Total
Figure A6. Frequency distribution of live conifer and total live quadratic mean diameter.
Live Conifer Quadratic Mean Diameter (LCQMD)
LCQMD by Map Site Class Table A5 shows the LCQMD values by map site class. LCQMD decreases with decreasing site quality, from 40.1 inches for map site class I to 16.5 inches for map site class V. The distributions of LCQMD values by map site class are shown in Figure A7. When all five site classes were included in the analysis, Levene’s test for the homogeneity of group variances was not rejected (P = 0.074) so site class means were compared using ANOVA. The ANOVA results indicated that there was a significant difference in LCQMD means among site classes (P < 0.001).
Final Report March 3, 2005 31

Table A5. Summary statistics for mean LCQMD by map site class. Map
Site Class Sample
Size Mean
LCQMD (in) Standard
Error 95% Confidence
Interval Relative
Precisiona
I 1 40.1 II 27 23.5 0.79 21.9 - 25.1 6.9% III 29 19.9 0.51 18.9 - 20.9 5.3% IV 28 17.5 0.78 15.9 - 19.1 9.1% V 28 16.5 0.85 14.8 - 18.3 10.6%
a Relative precision for 95% confidence interval. When site class I (which had only one observation) was omitted from the analysis, the ANOVA still indicated a significant difference (P < 0.001) in LCQMD means among site classes II, III, IV, and V. The Bonferroni multiple comparison procedure indicated that site class pairs III-IV and IV-V were not significantly different (both P > 0.14). Site class II was significantly different from all other site classes (all P ≤ 0.01) and site classes III and V were significantly different from each other (P = 0.009). The variance components analysis estimated that map site class explained 36.7% of the variation in LCQMD among the four site classes with more than a single observation.
I II III IV V
Map Site Class
0
5
10
15
20
25
30
35
40
45
Live
Con
ifer Q
MD
n=1 n=27 n=29 n=28 n=28
Figure A7. Box-and-whiskers plot for LCQMD values by map site class.
LCQMD By Field Site Class Table A6 shows the mean LCQMD values by field site class. Mean LCQMD tends to decrease with decreasing field site class, from a mean of 22.8 inches for field site class II to 14.1 inches for field site class V. The mean LCQMD for field site class I (19.8 inches) is slightly smaller than that for site classes II and III, however this result may be due to the small sample size for field site class I.
Table A6. Summary statistics for mean LCQMD by field site class. Field
Site Class Sample
Size Mean
LCQMD (in) Standard
Error 95% Confidence Interval Relative Precisiona
I 3 19.8 1.35 13.9 - 25.6 29.5% II 27 22.8 0.90 20.9 - 24.7 8.1% III 37 20.9 0.78 19.3 - 22.5 7.6% IV 22 18.9 0.63 17.6 - 20.2 6.9% V 23 14.1 0.71 12.7 - 15.6 10.5%
a Relative precision for 95% confidence interval.
Final Report March 3, 2005 32

The distributions of mean LCQMD values by field site class are shown in Figure A8. When all five site classes were included in the analysis, Levene’s test for the homogeneity of group variances was not rejected (P = 0.214) so site class means were compared using ANOVA. The ANOVA results indicated that there was a significant difference in LCQMD means among site classes (P < 0.001). When site class I (which had only three observations) was omitted from the analysis the test results were similar: Levene’s test was not significant (P = 0.167) and the ANOVA was significant (P < 0.001). The Bonferroni multiple comparison procedure indicated that site class pairs II-III and III-IV were not significantly different (both P > 0.40). Site class V was significantly different from all other site classes (all P ≤ 0.01) and site classes II and IV were significantly different from each other (P = 0.008). The variance components analysis estimated that field site class explained 41.4% of the variation in LCQMD among the four site classes with more than three observations.
I II III IV V
Field Site Class
0
5
10
15
20
25
30
35
40
45
Live
Con
ifer Q
MD
n=3 n=27 n=37 n=22 n=23
Figure A8. Box-and-whiskers plot for LCQMD by field site class.
Total Live Quadratic Mean Diameter (TLQMD)
TLQMD By Map Site Class Table A7 shows the TLQMD values by map site class. TLQMD decreases with decreasing site quality, from 30.1 inches for map site class I to 16.4 inches for map site class V.
Table A7. Summary statistics for TLQMD by map site class. Map
Site Class Sample
Size Mean
TLQMD Standard
Error 95% Confidence Interval Relative Precisiona
I 1 30.1 II 27 23.1 0.72 21.6 - 24.6 6.4% III 29 19.7 0.50 18.7 - 20.8 5.2% IV 28 17.4 0.77 15.8 - 18.9 9.1% V 28 16.4 0.82 14.7 - 18.1 10.3%
a Relative precision for 95% confidence interval. The distributions of TLQMD values by map site class are shown in Figure A9. When all five site classes were included in the analysis, Levene’s test for the homogeneity of group variances was not rejected (P = 0.055) so site class means were compared using ANOVA. The ANOVA results indicated that there was a significant difference in TLQMD means among site classes (P < 0.001). When site class I (which had only one observation) was omitted from the analysis, the
Final Report March 3, 2005 33

ANOVA still indicated a significant difference (P < 0.001) in TLQMD means among site classes II, III, IV, and V. The Bonferroni multiple comparison procedure indicated that site class pairs III-IV and IV-V were not significantly different (both P > 0.11). Site class II was significantly different from all other site classes (all P ≤ 0.01) and site classes III and V were significantly different from each other (P = 0.008). The variance components analysis estimated that map site class explained 36.7% of the variation in TLQMD among the four site classes with more than a single observation.
I II III IV V
Map Site Class
0
5
10
15
20
25
30
35
Tota
l Liv
e Tr
ee Q
MD
n=1 n=27 n=29 n=28 n=28
Figure A9. Box-and-whiskers plot for TLQMD values by map site class.
TLQMD By Field Site Class Table A8 shows the mean TLQMD values by field site class. Mean TLQMD tends to decrease with decreasing field site class, from a mean of 22.5 inches for field site class II to 14.0 inches for field site class V. The mean TLQMD for field site class I (19.7 inches) is slightly smaller than that for site classes II and III, however this result may be due to the small sample size for field site class I.
Table A8. Summary statistics for TLQMD by field site class. Field
Site Class Sample
Size Mean
TLQMD (in)Standard
Error 95% Confidence Interval Relative Precisiona
I 3 19.7 1.43 13.6 - 25.8 31.2% II 27 22.5 0.82 20.9 - 24.2 7.4% III 37 20.4 0.62 19.1 - 21.6 6.1% IV 22 18.7 0.63 17.4 - 20.0 7.1% V 23 14.0 0.67 12.6 - 15.4 9.9%
a Relative precision for 95% confidence interval. The distributions of TLQMD values by field site class are shown in Figure A10. When all five site classes were included in the analysis, Levene’s test for the homogeneity of group variances was not rejected (P = 0.302) so site class means were compared using ANOVA. The ANOVA results indicated that there was a significant difference in TLQMD means among site classes (P < 0.001). When site class I (which had only three observations) was omitted from the analysis the test results were similar. Levene’s test was not significant (P = 0.237) and the ANOVA was significant (P < 0.001).
Final Report March 3, 2005 34

The Bonferroni multiple comparison procedure indicated that site class pairs II-III and III-IV were not significantly different (both P > 0.13). Site class V was significantly different from all other site classes (all P ≤ 0.01) and site classes II and IV were significantly different from each other (P = 0.002). The variance components analysis estimated that field site class explained 46.8% of the variation in TLQMD among the four site classes with more than three observations. I II III IV V
Field Site Class
0
5
10
15
20
25
30
35
Tota
l Liv
e Tr
ee Q
MD
n=3 n=27 n=37 n=22 n=23
Figure A10. Box-and-whiskers plot for TLQMD values by field site class.
Basal Area Per Acre Figure A11 shows the distribution of live conifer basal area per acre (LCBAPA) and total live basal area per acre (TLBAPA) for the study sites. LCBAPA ranged from 124.9 to 577.5 ft2 per acre, with a median value of 320.7 ft2, a mean of 332.9 ft2and a standard deviation of 83.1. TLBAPA ranged from 152.4 to 577.5 ft2 per acre, with a median of 324.8 ft2, a mean of 341.0 ft2and a standard deviation of 83.3. TLBAPA values are only slightly larger than the LCBAPA values, indicating that broad-leafs contributed little basal area at most sites.
Basal Area
0
10
20
30
40
100-150 150-200 200-250 250-300 300-350 350-400 400-450 450-500 500-550 550-600
Basal Area/Acre (ft2)
Num
ber o
f Site
s
Conifer Basal Area/Acre Total Basal Area/Acre
Figure A11. Frequency distribution of live conifer and total live basal area per acre.
Total Live Tree Basal Area Per Acre (TLBAPA)
TLBAPA By Map Site Class The TLBAPA values by map site class are shown in Table A9. Mean TLBAPA values ranged from 319.9 ft2/acre for map site class III to 361.1 ft2/acre for map site class IV. The distributions of mean TLBAPA values by map site class are shown in Figure A12. When all five site classes were included in the analysis, Levene’s test for the homogeneity of group variances was not rejected (P = 0.583) so site class means were compared using ANOVA. The results indicated that the differences in TLBAPA means among site classes were not significant,
Final Report March 3, 2005 35
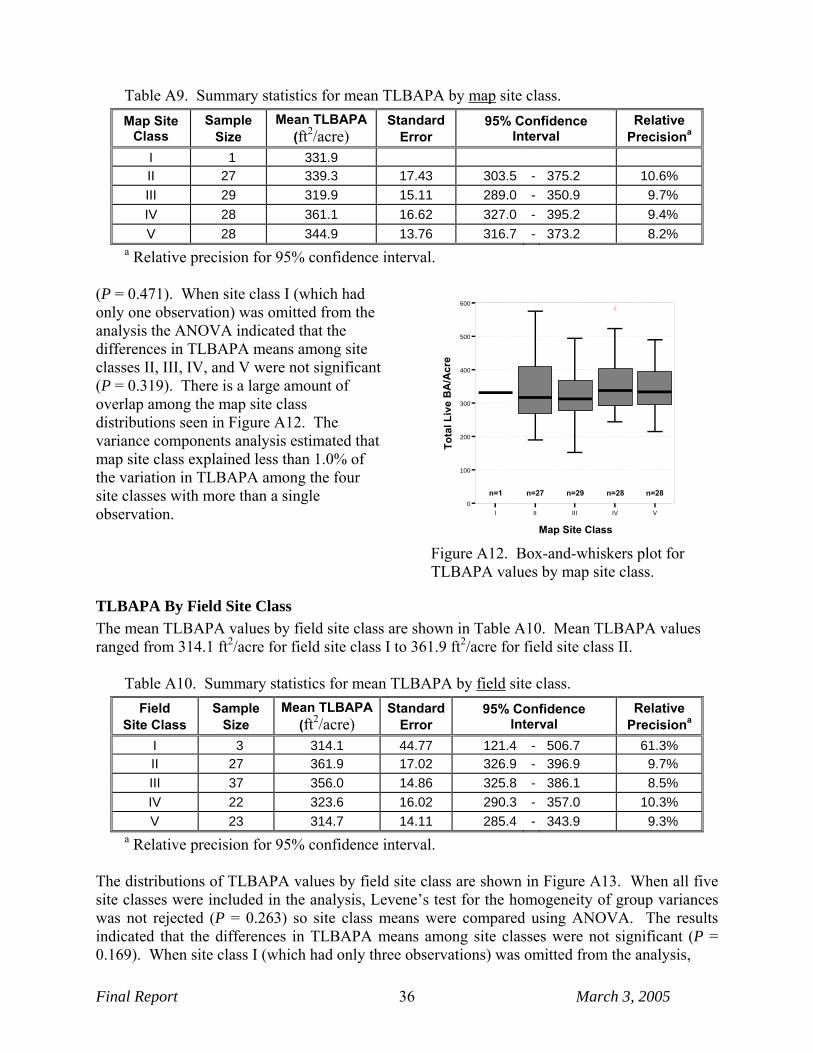
Table A9. Summary statistics for mean TLBAPA by map site class. Map Site
Class Sample
Size Mean TLBAPA
(ft2/acre) Standard
Error 95% Confidence
Interval Relative
Precisiona
I 1 331.9 II 27 339.3 17.43 303.5 - 375.2 10.6% III 29 319.9 15.11 289.0 - 350.9 9.7% IV 28 361.1 16.62 327.0 - 395.2 9.4% V 28 344.9 13.76 316.7 - 373.2 8.2%
a Relative precision for 95% confidence interval. (P = 0.471). When site class I (which had only one observation) was omitted from the analysis the ANOVA indicated that the differences in TLBAPA means among site classes II, III, IV, and V were not significant (P = 0.319). There is a large amount of overlap among the map site class distributions seen in Figure A12. The variance components analysis estimated that map site class explained less than 1.0% of the variation in TLBAPA among the four site classes with more than a single observation. I II III IV V
Map Site Class
0
100
200
300
400
500
600
Tota
l Liv
e B
A/A
cre
n=1 n=27 n=29 n=28 n=28
Figure A12. Box-and-whiskers plot for TLBAPA values by map site class.
TLBAPA By Field Site Class The mean TLBAPA values by field site class are shown in Table A10. Mean TLBAPA values ranged from 314.1 ft2/acre for field site class I to 361.9 ft2/acre for field site class II.
Table A10. Summary statistics for mean TLBAPA by field site class. Field
Site Class Sample
Size Mean TLBAPA
(ft2/acre) Standard
Error 95% Confidence
Interval Relative
Precisiona
I 3 314.1 44.77 121.4 - 506.7 61.3% II 27 361.9 17.02 326.9 - 396.9 9.7% III 37 356.0 14.86 325.8 - 386.1 8.5% IV 22 323.6 16.02 290.3 - 357.0 10.3% V 23 314.7 14.11 285.4 - 343.9 9.3%
a Relative precision for 95% confidence interval. The distributions of TLBAPA values by field site class are shown in Figure A13. When all five site classes were included in the analysis, Levene’s test for the homogeneity of group variances was not rejected (P = 0.263) so site class means were compared using ANOVA. The results indicated that the differences in TLBAPA means among site classes were not significant (P = 0.169). When site class I (which had only three observations) was omitted from the analysis,
Final Report March 3, 2005 36
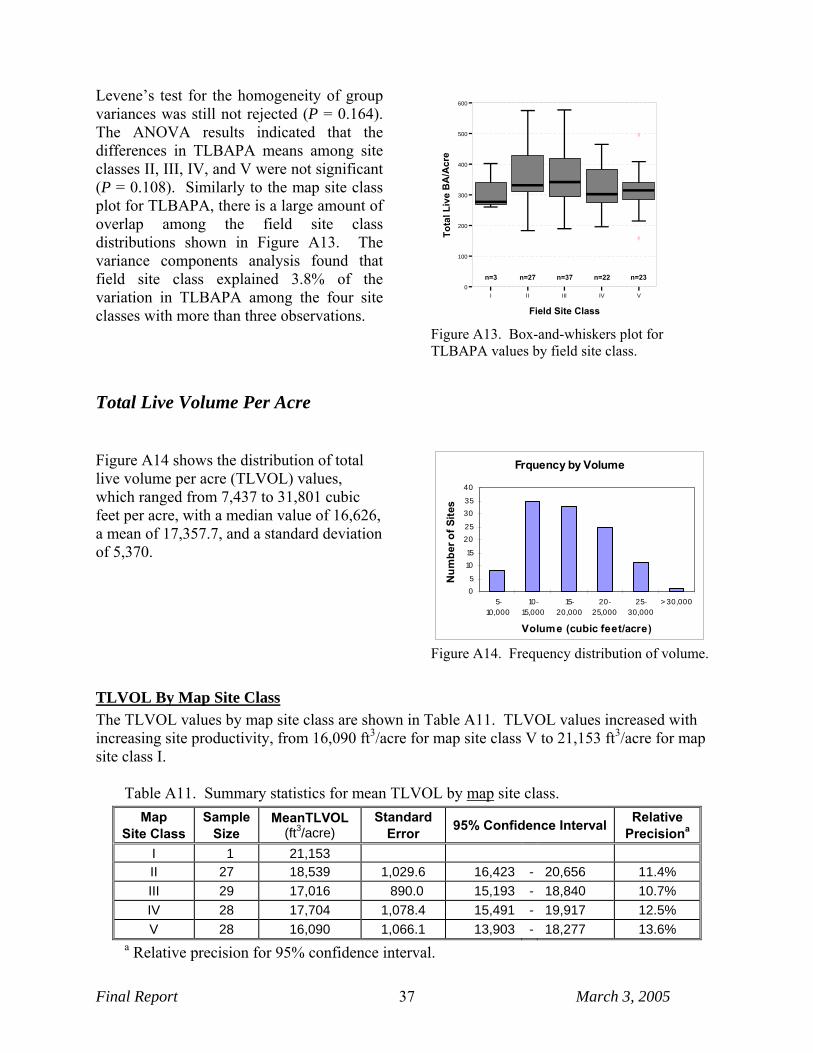
Levene’s test for the homogeneity of group variances was still not rejected (P = 0.164). The ANOVA results indicated that the differences in TLBAPA means among site classes II, III, IV, and V were not significant (P = 0.108). Similarly to the map site class plot for TLBAPA, there is a large amount of overlap among the field site class distributions shown in Figure A13. The variance components analysis found that field site class explained 3.8% of the variation in TLBAPA among the four site classes with more than three observations.
I II III IV V
Field Site Class
0
100
200
300
400
500
600
Tota
l Liv
e B
A/A
cre
n=3 n=27 n=37 n=22 n=23
Figure A13. Box-and-whiskers plot for TLBAPA values by field site class.
Total Live Volume Per Acre
Figure A14 shows the distribution of total live volume per acre (TLVOL) values, which ranged from 7,437 to 31,801 cubic feet per acre, with a median value of 16,626, a mean of 17,357.7, and a standard deviation of 5,370.
Frquency by Volume
05
1015
2025
3035
40
5-10,000
10-15,000
15-20,000
20-25,000
25-30,000
> 30,000
Volume (cubic feet/acre)
Num
ber o
f Site
s
Figure A14. Frequency distribution of volume.
TLVOL By Map Site Class The TLVOL values by map site class are shown in Table A11. TLVOL values increased with increasing site productivity, from 16,090 ft3/acre for map site class V to 21,153 ft3/acre for map site class I.
Table A11. Summary statistics for mean TLVOL by map site class. Map
Site Class Sample
Size MeanTLVOL
(ft3/acre) Standard
Error 95% Confidence Interval Relative Precisiona
I 1 21,153 II 27 18,539 1,029.6 16,423 - 20,656 11.4% III 29 17,016 890.0 15,193 - 18,840 10.7% IV 28 17,704 1,078.4 15,491 - 19,917 12.5% V 28 16,090 1,066.1 13,903 - 18,277 13.6%
a Relative precision for 95% confidence interval.
Final Report March 3, 2005 37

The distributions of TLVOL values by map site class are shown in Figure A15. When all five site classes were included in the analysis, Levene’s test for the homogeneity of group variances was not rejected (P = 0.332) so site class means were compared using ANOVA. The results indicated that the differences in TLVOL means among site classes were not significant (P = 0.469). When site class I (which had only one observation) was omitted from the analysis, the ANOVA indicated that the differences in TLVOL means among site classes II, III, IV, and V were not significant (P = 0.383). There is a large amount of overlap among the map site class distributions seen in Figure A15. The variance components analysis estimated that map site class explained less than 1.0% of the variation in TLVOL among the four site classes with more than a single observation.
I II III IV V
Map Site Class
0
5,000
10,000
15,000
20,000
25,000
30,000
35,000
Volu
me
(cub
ic f
eet)
n=1 n=27 n=29 n=28 n=28
Figure A15. Box-and-whiskers plot for TLVOL values by map site class.
TLVOL By Field Site Class The mean TLVOL values by field site class are shown in Table A12. Mean TLVOL values increase with increasing site productivity from 13,081 ft3/acre for field site class V to 19,470 ft3/acre for site class II. The mean TLVOL for field site class I (15,559 ft3/acre) is less than for site classes II, III, or IV, however this may be due to the small sample size for field site class I.
Table A12. Summary statistics for mean TLVOL by field site class. Field
Site Class Sample
Size Mean TLVOL
(ft3/acre) Standard
Error 95% Confidence
Interval Relative
Precisiona
I 3 15,569 2,748.6 3,743 - 27,395 76.0% II 27 19,470 981.5 17,452 - 21,488 10.4% III 37 19,074 865.5 17,319 - 20,830 9.2% IV 22 16,666 917.1 14,759 - 18,573 11.4% V 23 13,081 941.9 11,128 - 15,035 14.9%
a Relative precision for 95% confidence interval. The distributions of TLVOL values by field site class are shown in Figure A16. When all five site classes were included in the analysis, Levene’s test for the homogeneity of group variances was not rejected (P = 0.402) so site class means were compared using ANOVA. The ANOVA results indicated that there was a significant difference in TLVOL means among site classes (P <
Final Report March 3, 2005 38

0.001). When site class I (which had only three observations) was omitted from the analysis the test results were similar: Levene’s test was not significant (P = 0.267) and the ANOVA was significant (P < 0.001). The Bonferroni multiple comparison procedure indicated that the only site class pairs with significantly different mean values were II-V and III-V (both P < 0.01). The variance components analysis estimated that field site class explained 23.4% of the variation in TLVOL among the four site classes with more than three observations.
I II III IV V
Field Site Class
0
5,000
10,000
15,000
20,000
25,000
30,000
35,000
Volu
me
(cub
ic f
eet)
n=3 n=27 n=37 n=22 n=23
Figure A16. Box-and-whiskers plot for total TLVOL values by field site class.
Relative Density Relative density (Curtis’ RD) is a measure of the extent to which a stand occupies available growing space. Greater RD values indicate greater occupation of available growing space and increased competition for growing resources due to increasing size and/or number of trees per unit area (Oliver and Larson 1990). Figure A17 shows the distribution of RD values for the study sites. RD values ranged from 35.4 to 126.3, with a mean of 78.6 and a standard deviation of 17.5.
Frequency of Relative Density
1
13
48
35
14
2
0
10
20
30
40
50
60
<40 40-60 60-80 80-100 100-120 >120
Relative Density
Num
ber o
f Site
s
Figure A17. Frequency distribution of RD values.
RD By Map Site Class The RD values by map site class are shown in Table A13. RD values ranged from 60.5 for map site class I to 86.9 for map site class IV.
Table A13. Summary statistics for mean RD by map site class. Map
Site Class Sample
Size Mean
RD Standard
Error 95% Confidence Interval Relative Precisiona
I 1 60.5 II 27 70.4 3.04 64.1 - 76.6 8.8% III 29 72.0 3.13 65.6 - 78.4 8.9% IV 28 86.9 3.07 80.6 - 93.2 7.2% V 28 86.0 2.79 80.2 - 91.7 6.6%
a Relative precision for 95% confidence interval.
Final Report March 3, 2005 39
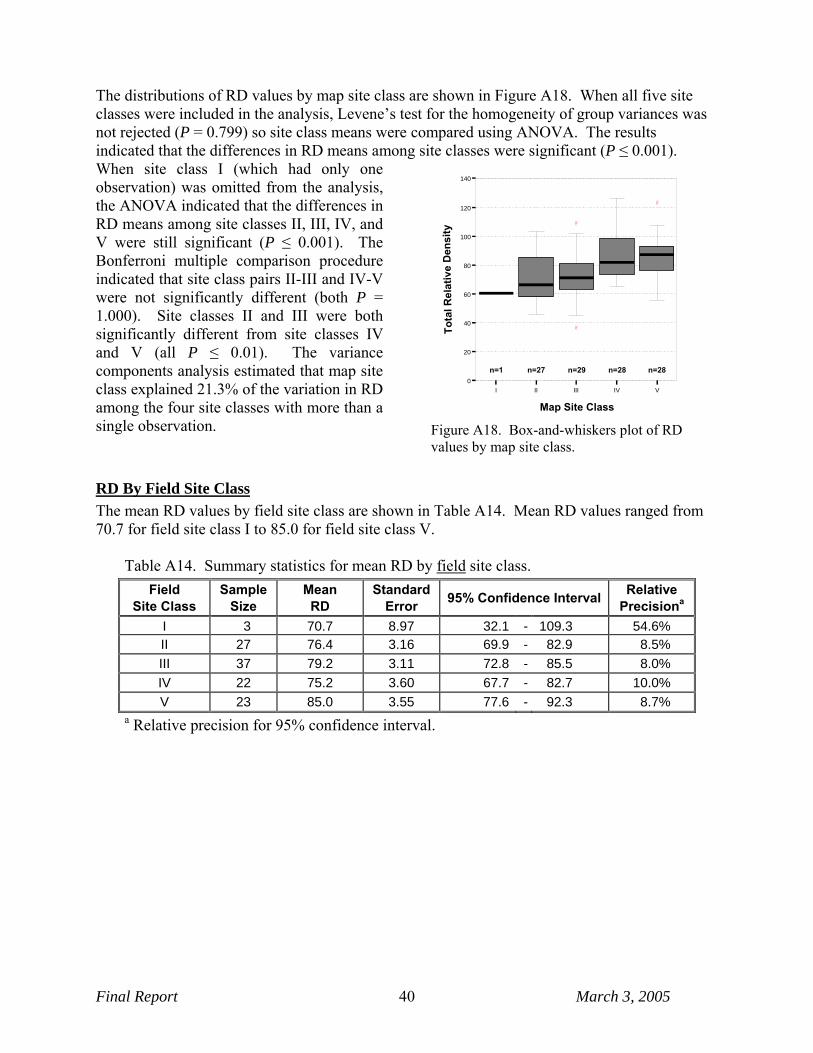
The distributions of RD values by map site class are shown in Figure A18. When all five site classes were included in the analysis, Levene’s test for the homogeneity of group variances was not rejected (P = 0.799) so site class means were compared using ANOVA. The results indicated that the differences in RD means among site classes were significant (P ≤ 0.001). When site class I (which had only one observation) was omitted from the analysis, the ANOVA indicated that the differences in RD means among site classes II, III, IV, and V were still significant (P ≤ 0.001). The Bonferroni multiple comparison procedure indicated that site class pairs II-III and IV-V were not significantly different (both P = 1.000). Site classes II and III were both significantly different from site classes IV and V (all P ≤ 0.01). The variance components analysis estimated that map site class explained 21.3% of the variation in RD among the four site classes with more than a single observation.
I II III IV V
Map Site Class
0
20
40
60
80
100
120
140
Tota
l Rel
ativ
e D
ensi
ty
n=1 n=27 n=29 n=28 n=28
Figure A18. Box-and-whiskers plot of RD values by map site class.
RD By Field Site Class The mean RD values by field site class are shown in Table A14. Mean RD values ranged from 70.7 for field site class I to 85.0 for field site class V.
Table A14. Summary statistics for mean RD by field site class. Field
Site Class Sample
Size Mean
RD Standard
Error 95% Confidence Interval Relative Precisiona
I 3 70.7 8.97 32.1 - 109.3 54.6% II 27 76.4 3.16 69.9 - 82.9 8.5% III 37 79.2 3.11 72.8 - 85.5 8.0% IV 22 75.2 3.60 67.7 - 82.7 10.0% V 23 85.0 3.55 77.6 - 92.3 8.7%
a Relative precision for 95% confidence interval.
Final Report March 3, 2005 40

The distributions of RD values by field site class are shown in Figure A19. When all five site classes were included in the analysis, Levene’s test for the homogeneity of group variances was not rejected (P = 0.803) so site class means were compared using ANOVA. The results indicated that the differences in RD means among site classes were not significant (P = 0.302). When site class I (which had only three observations) was omitted from the analysis the test results were similar: Levene’s test was not significant (P = 0.702) and the ANOVA was not significant (P = 0.240). The variance components analysis estimated that field site class explained only 1.6 % of the variation in RD among the four site classes with more than three observations.
I II III IV V
Field Site Class
0
20
40
60
80
100
120
140
Tota
l Rel
ativ
e D
ensi
ty
n=3 n=27 n=37 n=22 n=23
Figure A19. Box-and-whiskers plot of RD values by field site class.
Mean Over-story Tree Height Figure A20 shows the distribution of mean over-story tree height (MOTH) values. The mean height of over-story trees (dominant and co-dominant canopy classes) ranged from 81.3 to 206.9 feet, with a median of 148.8 feet, a mean of 147.4 feet and standard deviation of 30.0.
Overstory Mean Tree Height
1014
33 33
20
3
0
10
20
30
40
75-100 100-125 125-150 150-175 175-200 200-225
Height (ft)
Num
ber o
f Site
s
Figure A20. Frequency distribution of MOTH.
MOTH By Map Site Class The MOTH values by map site class are shown in Table A15. MOTH ranges from 118.4 ft for map site class V to 160.6 ft for map site class II.
Table A15. Summary statistics for mean over-story tree height (MOTH) by map site class. Map
Site Class Sample
Size Mean
MOTH (ft) Standard
Error 95% Confidence Interval Relative Precisiona
I 1 140.1 II 27 160.6 4.09 152.2 - 169.0 5.2% III 29 141.4 4.36 132.5 - 150.4 6.3% IV 28 125.2 4.70 115.5 - 134.8 7.7% V 28 118.4 5.64 106.8 - 129.9 9.8%
a Relative precision for 95% confidence interval.
Final Report March 3, 2005 41
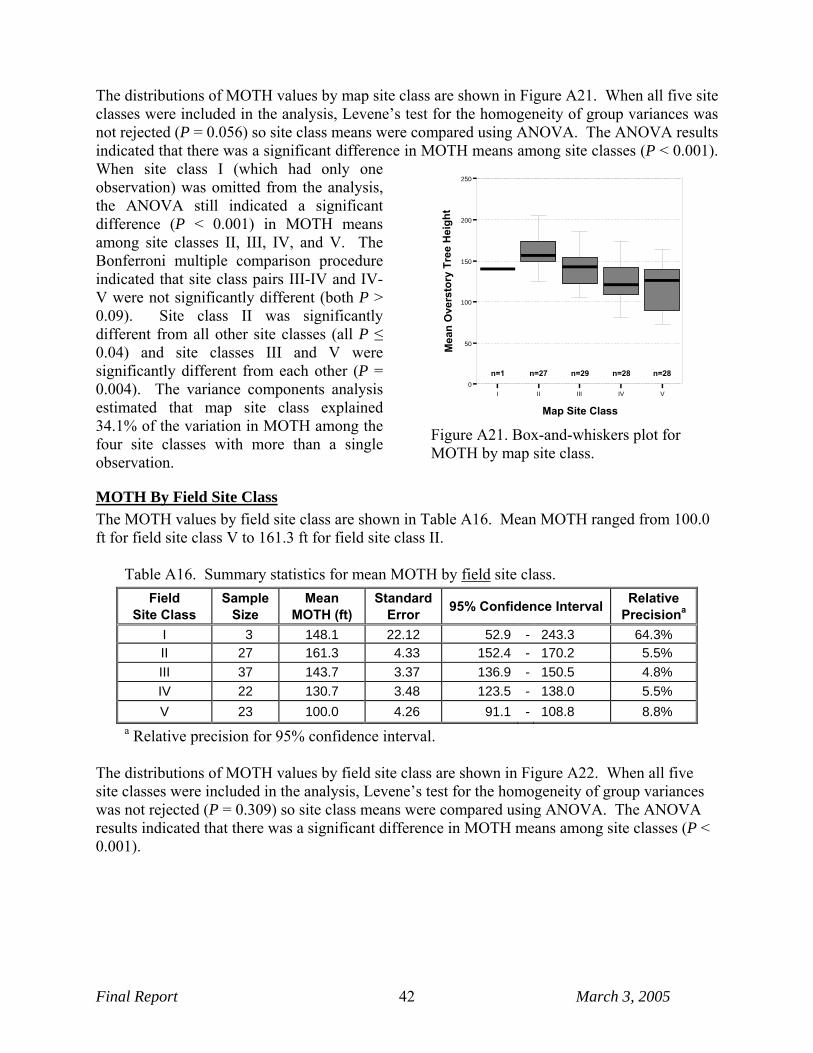
The distributions of MOTH values by map site class are shown in Figure A21. When all five site classes were included in the analysis, Levene’s test for the homogeneity of group variances was not rejected (P = 0.056) so site class means were compared using ANOVA. The ANOVA results indicated that there was a significant difference in MOTH means among site classes (P < 0.001). When site class I (which had only one observation) was omitted from the analysis, the ANOVA still indicated a significant difference (P < 0.001) in MOTH means among site classes II, III, IV, and V. The Bonferroni multiple comparison procedure indicated that site class pairs III-IV and IV-V were not significantly different (both P > 0.09). Site class II was significantly different from all other site classes (all P ≤ 0.04) and site classes III and V were significantly different from each other (P = 0.004). The variance components analysis estimated that map site class explained 34.1% of the variation in MOTH among the four site classes with more than a single observation.
I II III IV V
Map Site Class
0
50
100
150
200
250
Mea
n O
vers
tory
Tre
e H
eigh
t
n=1 n=27 n=29 n=28 n=28
Figure A21. Box-and-whiskers plot for MOTH by map site class.
MOTH By Field Site Class The MOTH values by field site class are shown in Table A16. Mean MOTH ranged from 100.0 ft for field site class V to 161.3 ft for field site class II.
Table A16. Summary statistics for mean MOTH by field site class. Field
Site Class Sample
Size Mean
MOTH (ft) Standard
Error 95% Confidence Interval Relative Precisiona
I 3 148.1 22.12 52.9 - 243.3 64.3% II 27 161.3 4.33 152.4 - 170.2 5.5% III 37 143.7 3.37 136.9 - 150.5 4.8% IV 22 130.7 3.48 123.5 - 138.0 5.5% V 23 100.0 4.26 91.1 - 108.8 8.8%
a Relative precision for 95% confidence interval. The distributions of MOTH values by field site class are shown in Figure A22. When all five site classes were included in the analysis, Levene’s test for the homogeneity of group variances was not rejected (P = 0.309) so site class means were compared using ANOVA. The ANOVA results indicated that there was a significant difference in MOTH means among site classes (P < 0.001).
Final Report March 3, 2005 42

When site class I (which had only three observations) was omitted from the analysis, the ANOVA still indicated a significant difference (P < 0.001) in MOTH means among site classes II, III, IV, and V. The Bonferroni multiple comparison procedure indicated that all site class pairs were significantly different from each other (all P < 0.01) except for site classes III and IV which were not significantly different from each other (P = 0.116). The variance components analysis estimated that field site class explained 59.6% of the variation in MOTH among the four site classes with more than a single observation.
I II III IV V
Field Site Class
0
50
100
150
200
250
Mea
n O
vers
tory
Tre
e H
eigh
t
n=3 n=27 n=37 n=22 n=23
Figure A22. Box-and-whiskers plot for MOTH values in ft by field site class.
Mean Age of Co-Dominant Canopy Class Figure A23 shows the distribution of sites by the mean age at breast height of trees in the co-dominant canopy class. This measure of stand age was used because it could be calculated consistently, however the stand year-of-origin age would be somewhat older, since the mean age of the co-dominant class includes trees germinating over a period of years following the stand-initiating disturbance. The most common age category was 120-140 years, and about 75% ofthe sites had mean co-dominant ages from 100 to160 years. The age range of individual trees varied considerably between sites. At one end of the spectrum were stands with a uniform age structure where the age of most trees was within several decades. On the other end were stands with complex age structures where individual tree ages varied by many decades. The former pattern appears to indicate rapid re-vegetation following a major stand-replacement disturbance event, while the latter appears to indicate a more complex disturbance history.
Frequency by Mean Age of Co-Dominant Class
6
13
25
37
19
82 2
0
10
20
30
40
50
<80 80-100 100-120 120-140 140-160 161-180 181-200 >200
Age
Num
ber o
f Site
s
Figure A23. Frequency by mean age of the co-dominant canopy class.
Final Report March 3, 2005 43

Mean Age of Co-Dominant Canopy Class (CAGE) By Map Site Class The mean CAGE by map site class is shown in Table A17. The mean CAGE by map site class ranged from 92 years for map site class I to 144.2 years for map site class V.
Table A17. Summary statistics for mean CAGE by map site class. Map
Site Class Sample
Size Mean
CAGE (yrs)Standard
Error 95% Confidence Interval Relative Precisiona
I 1 92.0 II 27 121.7 4.53 112.4 - 131.0 7.6% III 28 122.6 4.81 112.8 - 132.5 8.0% IV 27 131.0 7.40 115.8 - 146.2 11.6% V 28 144.2 4.89 134.1 - 154.2 7.0%
a Relative precision for 95% confidence interval.
The distributions of CAGE values by map site class are shown in Figure A24. When all five site classes were included in the analysis, Levene’s test for the homogeneity of group variances was not rejected (P = 0.416) so site class means were compared using ANOVA. The ANOVA results indicated that there was a significant difference in CAGE means among site classes (P = 0.018). When site class I (which had only one observation) was omitted from the analysis, the ANOVA still indicated a significant difference (P = 0.016) in CAGE means among site classes II, III, IV, and V. The Bonferroni multiple comparison procedure indicated that site class pairs II-V and III-V were significantly different (both P < 0.04). None of the other site class pairs were significantly different from each other (all P > 0.50). The variance components analysis estimated that map site class explained 8.6% of the variation in CAGE among the four site classes with more than a single observation.
I II III IV V
Map Site Class
0
50
100
150
200
250
300M
ean
Cod
omin
ant A
ge
n=1 n=27 n=28 n=27 n=28
Figure A24. Box-and-whiskers plot for mean CAGE by map site class.
Final Report March 3, 2005 44
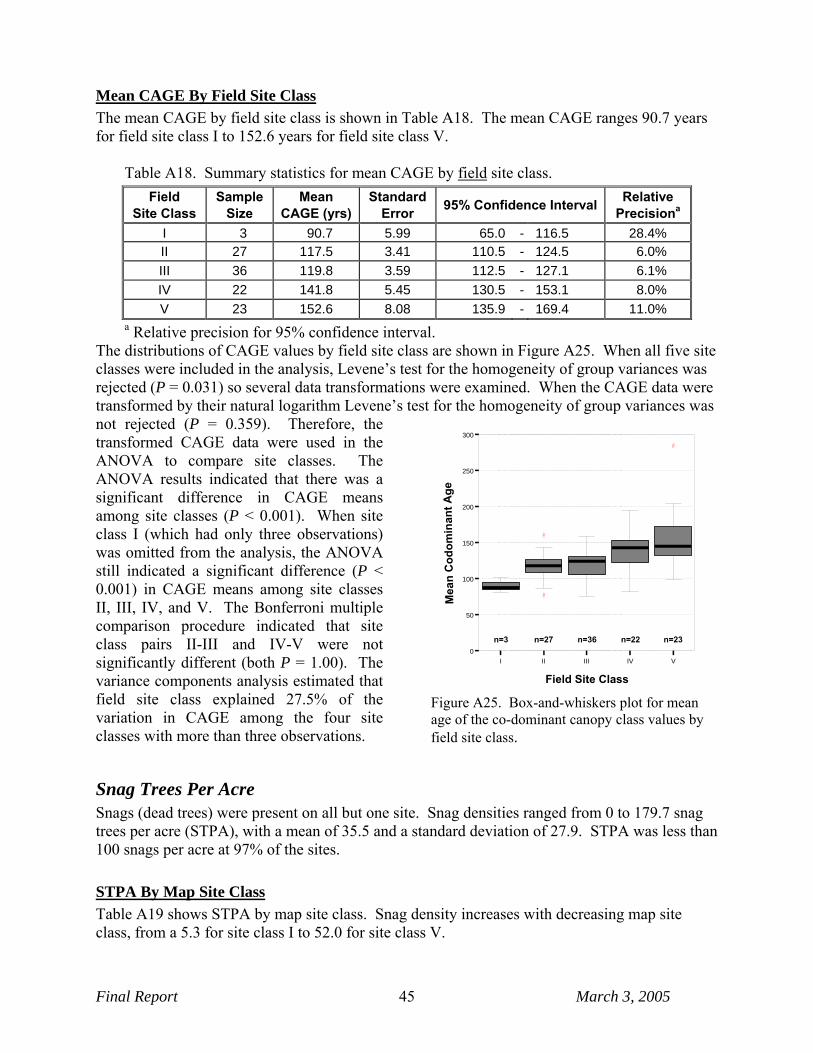
Mean CAGE By Field Site Class The mean CAGE by field site class is shown in Table A18. The mean CAGE ranges 90.7 years for field site class I to 152.6 years for field site class V.
Table A18. Summary statistics for mean CAGE by field site class. Field
Site Class Sample
Size Mean
CAGE (yrs)Standard
Error 95% Confidence Interval Relative Precisiona
I 3 90.7 5.99 65.0 - 116.5 28.4% II 27 117.5 3.41 110.5 - 124.5 6.0% III 36 119.8 3.59 112.5 - 127.1 6.1% IV 22 141.8 5.45 130.5 - 153.1 8.0% V 23 152.6 8.08 135.9 - 169.4 11.0%
a Relative precision for 95% confidence interval. The distributions of CAGE values by field site class are shown in Figure A25. When all five site classes were included in the analysis, Levene’s test for the homogeneity of group variances was rejected (P = 0.031) so several data transformations were examined. When the CAGE data were transformed by their natural logarithm Levene’s test for the homogeneity of group variances was not rejected (P = 0.359). Therefore, the transformed CAGE data were used in the ANOVA to compare site classes. The ANOVA results indicated that there was a significant difference in CAGE means among site classes (P < 0.001). When site class I (which had only three observations) was omitted from the analysis, the ANOVA still indicated a significant difference (P < 0.001) in CAGE means among site classes II, III, IV, and V. The Bonferroni multiple comparison procedure indicated that site class pairs II-III and IV-V were not significantly different (both P = 1.00). The variance components analysis estimated that field site class explained 27.5% of the variation in CAGE among the four site classes with more than three observations.
I II III IV V
Field Site Class
0
50
100
150
200
250
300
Mea
n C
odom
inan
t Age
n=3 n=27 n=36 n=22 n=23
Figure A25. Box-and-whiskers plot for mean age of the co-dominant canopy class values by field site class.
Snag Trees Per Acre Snags (dead trees) were present on all but one site. Snag densities ranged from 0 to 179.7 snag trees per acre (STPA), with a mean of 35.5 and a standard deviation of 27.9. STPA was less than 100 snags per acre at 97% of the sites.
STPA By Map Site Class Table A19 shows STPA by map site class. Snag density increases with decreasing map site class, from a 5.3 for site class I to 52.0 for site class V.
Final Report March 3, 2005 45
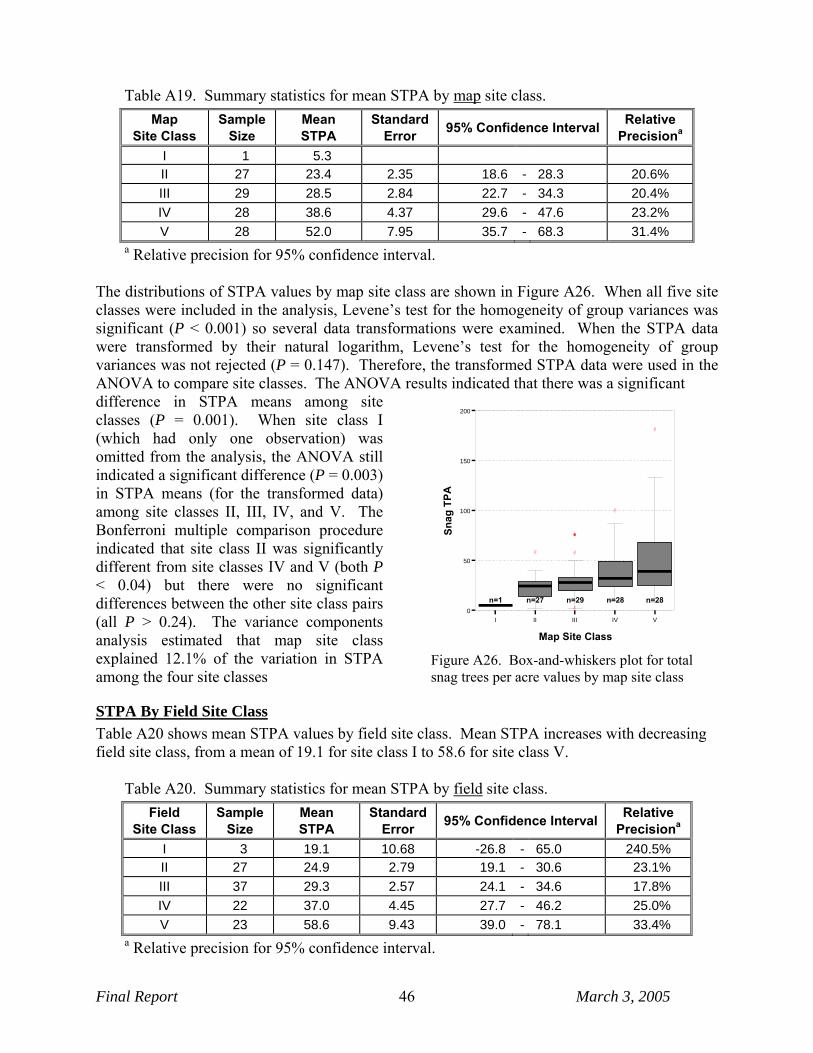
Table A19. Summary statistics for mean STPA by map site class. Map
Site Class Sample
Size Mean STPA
Standard Error 95% Confidence Interval Relative
Precisiona
I 1 5.3 II 27 23.4 2.35 18.6 - 28.3 20.6% III 29 28.5 2.84 22.7 - 34.3 20.4% IV 28 38.6 4.37 29.6 - 47.6 23.2% V 28 52.0 7.95 35.7 - 68.3 31.4%
a Relative precision for 95% confidence interval. The distributions of STPA values by map site class are shown in Figure A26. When all five site classes were included in the analysis, Levene’s test for the homogeneity of group variances was significant (P < 0.001) so several data transformations were examined. When the STPA data were transformed by their natural logarithm, Levene’s test for the homogeneity of group variances was not rejected (P = 0.147). Therefore, the transformed STPA data were used in the ANOVA to compare site classes. The ANOVA results indicated that there was a significant difference in STPA means among site classes (P = 0.001). When site class I (which had only one observation) was omitted from the analysis, the ANOVA still indicated a significant difference (P = 0.003) in STPA means (for the transformed data) among site classes II, III, IV, and V. The Bonferroni multiple comparison procedure indicated that site class II was significantly different from site classes IV and V (both P < 0.04) but there were no significant differences between the other site class pairs (all P > 0.24). The variance components analysis estimated that map site class explained 12.1% of the variation in STPA among the four site classes
I II III IV V
Map Site Class
0
50
100
150
200
Snag
TPA
n=1 n=27 n=29 n=28 n=28
Figure A26. Box-and-whiskers plot for total snag trees per acre values by map site class
STPA By Field Site Class Table A20 shows mean STPA values by field site class. Mean STPA increases with decreasing field site class, from a mean of 19.1 for site class I to 58.6 for site class V.
Table A20. Summary statistics for mean STPA by field site class. Field
Site Class Sample
Size Mean STPA
Standard Error 95% Confidence Interval Relative
Precisiona
I 3 19.1 10.68 -26.8 - 65.0 240.5% II 27 24.9 2.79 19.1 - 30.6 23.1% III 37 29.3 2.57 24.1 - 34.6 17.8% IV 22 37.0 4.45 27.7 - 46.2 25.0% V 23 58.6 9.43 39.0 - 78.1 33.4%
a Relative precision for 95% confidence interval.
Final Report March 3, 2005 46
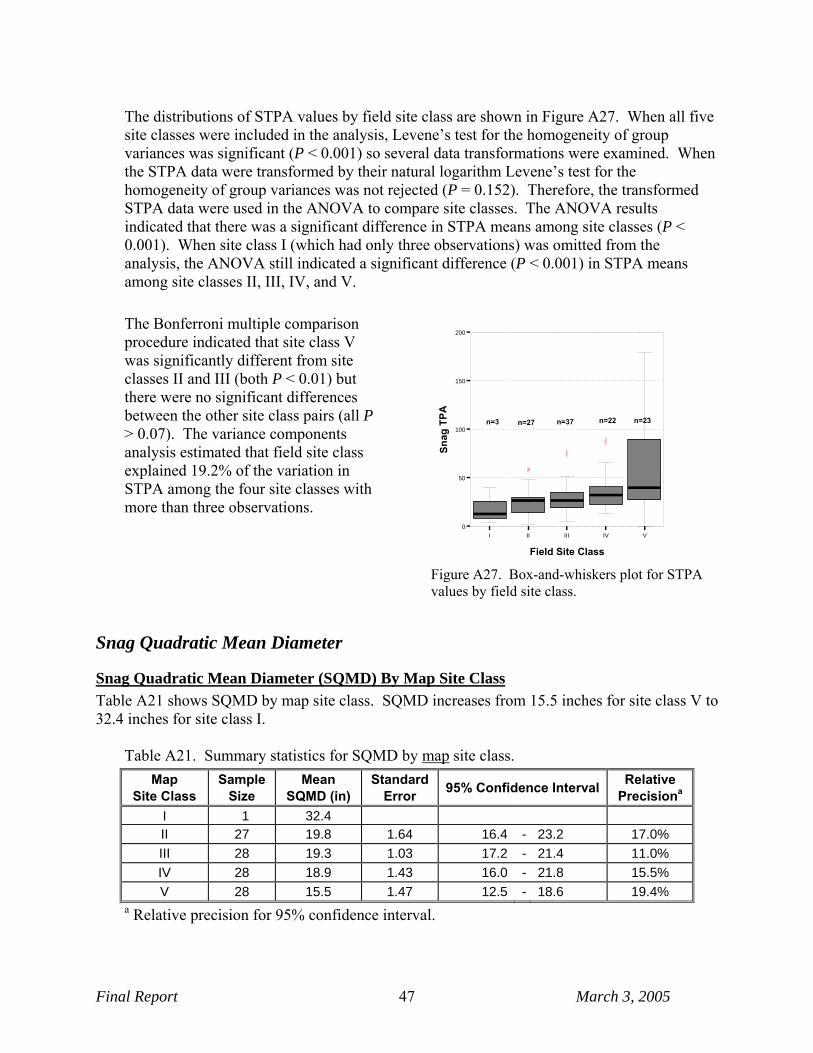
The distributions of STPA values by field site class are shown in Figure A27. When all five site classes were included in the analysis, Levene’s test for the homogeneity of group variances was significant (P < 0.001) so several data transformations were examined. When the STPA data were transformed by their natural logarithm Levene’s test for the homogeneity of group variances was not rejected (P = 0.152). Therefore, the transformed STPA data were used in the ANOVA to compare site classes. The ANOVA results indicated that there was a significant difference in STPA means among site classes (P < 0.001). When site class I (which had only three observations) was omitted from the analysis, the ANOVA still indicated a significant difference (P < 0.001) in STPA means among site classes II, III, IV, and V. The Bonferroni multiple comparison procedure indicated that site class V was significantly different from site classes II and III (both P < 0.01) but there were no significant differences between the other site class pairs (all P > 0.07). The variance components analysis estimated that field site class explained 19.2% of the variation in STPA among the four site classes with more than three observations.
I II III IV V
Field Site Class
0
50
100
150
200
Snag
TPA n=3 n=27 n=37 n=22 n=23
Figure A27. Box-and-whiskers plot for STPA values by field site class.
Snag Quadratic Mean Diameter
Snag Quadratic Mean Diameter (SQMD) By Map Site Class Table A21 shows SQMD by map site class. SQMD increases from 15.5 inches for site class V to 32.4 inches for site class I.
Table A21. Summary statistics for SQMD by map site class. Map
Site Class Sample
Size Mean
SQMD (in) Standard
Error 95% Confidence Interval Relative Precisiona
I 1 32.4 II 27 19.8 1.64 16.4 - 23.2 17.0% III 28 19.3 1.03 17.2 - 21.4 11.0% IV 28 18.9 1.43 16.0 - 21.8 15.5% V 28 15.5 1.47 12.5 - 18.6 19.4%
a Relative precision for 95% confidence interval.
Final Report March 3, 2005 47

The distributions of SQMD values by map site class are shown in Figure A28. When all five site classes were included in the analysis, Levene’s test for the homogeneity of group variances was not rejected (P = 0.630) so site class means were compared using ANOVA. The results indicated that the differences in SQMD means among site classes were not significant (P = 0.064). When site class I (which had only one observation) was omitted from the analysis, the results of the ANOVA indicated that the differences in SQMD means among site classes II, III, IV, and V were not significant (P = 0.137). The variance components analysis estimated that map site class explained only 3.1% of the variation in SQMD among the four site classes with more than a single observation.
I II III IV V
Map Site Class
0
10
20
30
40
50
Snag
QM
D
n=1 n=27 n=28 n=28 n=28
Figure A28. Box-and-whiskers plot for SQMD values by map site class.
SQMD By Field Site Class Table A22 shows mean SQMD by field site class. Mean SQMD increases with increasing site productivity, from 16.7 inches for site class V to 26.6 inches for site class I. Table A22. Summary statistics for SQMD by field site class.
Field Site Class
Sample Size
Mean SQMD (in)
Standard Error 95% Confidence Interval Relative
Precisiona
I 3 26.6 11.21 -21.7 - 74.8 181.6% II 27 19.2 1.37 16.4 - 22.0 14.6% III 37 19.2 0.94 17.3 - 21.1 9.9% IV 22 17.2 0.87 15.4 - 19.0 10.4% V 22 16.7 2.30 11.9 - 21.5 28.6%
a Relative precision for 95% confidence interval. The distributions of SQMD values by field site class are shown in Figure A29. When all five site classes were included in the analysis, Levene’s test for the homogeneity of group variances was rejected (P < 0.001) so several data transformations were examined. No satisfactory data transformation was found that equalized group variances. Therefore, the comparison of field site class means was not conducted for this attribute.
I II III IV V
Field Site Class
0
10
20
30
40
50
Snag
QM
D
n=3 n=27 n=37 n=22 n=22
Figure A29. Box-and-whiskers plot for SQMD values by field site class.
Final Report March 3, 2005 48
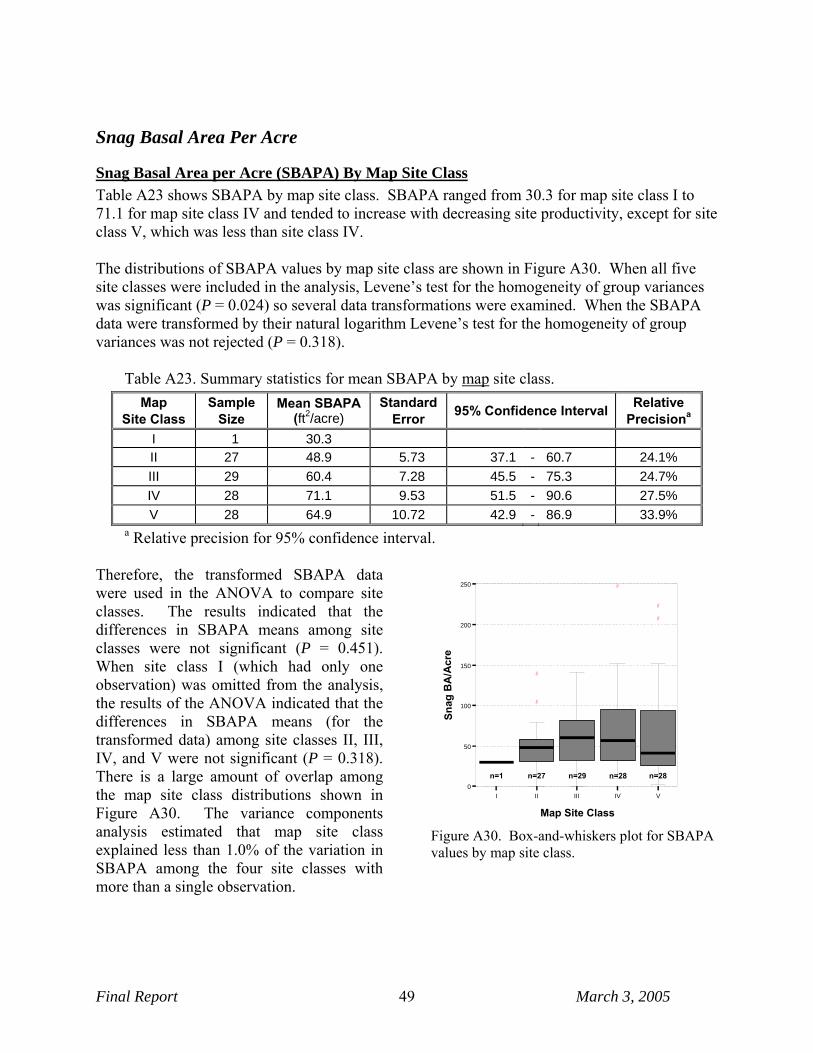
Snag Basal Area Per Acre
Snag Basal Area per Acre (SBAPA) By Map Site Class Table A23 shows SBAPA by map site class. SBAPA ranged from 30.3 for map site class I to 71.1 for map site class IV and tended to increase with decreasing site productivity, except for site class V, which was less than site class IV. The distributions of SBAPA values by map site class are shown in Figure A30. When all five site classes were included in the analysis, Levene’s test for the homogeneity of group variances was significant (P = 0.024) so several data transformations were examined. When the SBAPA data were transformed by their natural logarithm Levene’s test for the homogeneity of group variances was not rejected (P = 0.318).
Table A23. Summary statistics for mean SBAPA by map site class. Map
Site Class Sample
Size Mean SBAPA
(ft2/acre) Standard
Error 95% Confidence Interval Relative Precisiona
I 1 30.3 II 27 48.9 5.73 37.1 - 60.7 24.1% III 29 60.4 7.28 45.5 - 75.3 24.7% IV 28 71.1 9.53 51.5 - 90.6 27.5% V 28 64.9 10.72 42.9 - 86.9 33.9%
a Relative precision for 95% confidence interval. Therefore, the transformed SBAPA data were used in the ANOVA to compare site classes. The results indicated that the differences in SBAPA means among site classes were not significant (P = 0.451). When site class I (which had only one observation) was omitted from the analysis, the results of the ANOVA indicated that the differences in SBAPA means (for the transformed data) among site classes II, III, IV, and V were not significant (P = 0.318). There is a large amount of overlap among the map site class distributions shown in Figure A30. The variance components analysis estimated that map site class explained less than 1.0% of the variation in SBAPA among the four site classes with more than a single observation.
I II III IV V
Map Site Class
0
50
100
150
200
250
Snag
BA
/Acr
e
n=1 n=27 n=29 n=28 n=28
Figure A30. Box-and-whiskers plot for SBAPA values by map site class.
Final Report March 3, 2005 49

SBAPA By Field Site Class Table A24 shows mean SBAPA by field site class. Mean SBAPA ranged from 42.3 for field site class I to 74.3 for field site class IV and tended to increase with decreasing site productivity, except for site class IV, which was less than site class III.
Table A24. Summary statistics for mean total SBAPA by field site class. Field
Site Class Sample
Size Mean SBAPA
(ft2/acre) Standard
Error 95% Confidence
Interval Relative
Precisiona
I 3 42.3 13.06 -13.9 - 98.5 132.9% II 27 53.9 7.04 39.4 - 68.4 26.8% III 37 62.2 8.30 45.3 - 79.0 27.1% IV 22 58.4 6.84 44.1 - 72.6 24.4% V 23 74.3 12.01 49.4 - 99.2 33.5%
a Relative precision for 95% confidence interval. The distributions of SBAPA values by field site class are shown in Figure A31. When all five site classes were included in the analysis, Levene’s test for the homogeneity of group variances was not rejected (P = 0.158) so site class means were compared using ANOVA.The results indicated that the differences in SBAPA means among site classes were not significant (P = 0.525). When site class I (which had only three observations) was omitted from the analysis, Levene’s test for the homogeneity of group variances was still not rejected (P = 0.141). The ANOVA results indicated that the differences in SBAPA means among site classes II, III, IV, and V were not significant (P = 0.455). The variance components analysis found that field site class explained less than 1% of the variation in SBAPA among the four site classes with more than three observations.
I II III IV V
Field Site Class
0
50
100
150
200
250
Snag
BA
/Acr
e
n=3 n=27 n=37 n=22 n=23
Figure A31. Box-and-whiskers plot for SBAPA values by field site class.
Final Report March 3, 2005 50