cooperative conservation
TRANSCRIPT

Cooperative Conservation
A Report on the Implementation of Washington’s Water Use Efficiency Rule
November 6, 2012

About the Partnership for Water ConservationThe Partnership for Water Conservation (Partnership) is a
nonprofit 501(c)(3) organization dedicated to enhancing water
efficiency efforts in the state of Washington. In 2004, the
Partnership formed through a unique collaboration between
water suppliers, environmental groups, and businesses; it has
grown to approximately 85 members. The Partnership works
to ensure that water supplies meet the needs of people and
our state’s economy, while protecting fish and supporting other
environmental values that make Washington such a great place to
live and work. For more information about the Partnership, please
visit: www.partners4water.org
The current board members for the Partnership are Michael
Brent (Cascade Water Alliance), Debbie Engel (Kitsap Public
Utility District), Jeanne McNeil (Washington State Nursery and
Landscaping Association), Heather Pennington (Tacoma Public
Utilities), Gene Peterson (CH2M Hill), Emily Resch (Birch Bay
Water and Sewer District), Beau Schilz (Pace Engineers), and
Laurelin Ward (Silverdale Water District).
AcknowledgmentsThe Partnership expresses its sincere thanks to the Water Supply Forum for financial support of this project. For more information about the Water Supply Forum, please visit: www.watersupplyforum.org
The Partnership staff and volunteers, in consultation with the Partnership board and the Washington Department of Health, contributed to this report. Primary contributors included Allegra Abramo (consultant), Michael Dexel (Washington State Department of Health), Al Dietemann (Seattle Public Utilities), Julianna Mandler (Partnership), Daniel Muir (Tacoma Public Utilities), Janet Nazy (Partnership), Kristen Numata (Partnership), Debbie Rannfeldt (Woodinville Water District), Janet Sailer (Sammamish Plateau Water and Sewer District), Angie Sanchez-Vinoche (FCS Group), and Mike Wolanek (City of Arlington).
DisclaimerData for this report was obtained from water use efficiency reports and water system planning documents submitted to the Washington Department of Health (department), telephone conversations with water supplier staff, and information from water supplier websites. Every effort was made to gather factual data and objectively report the findings. This report does not represent the expressed or implied opinions, views, or policies of any state agency, local government, business, or water supplier.
2
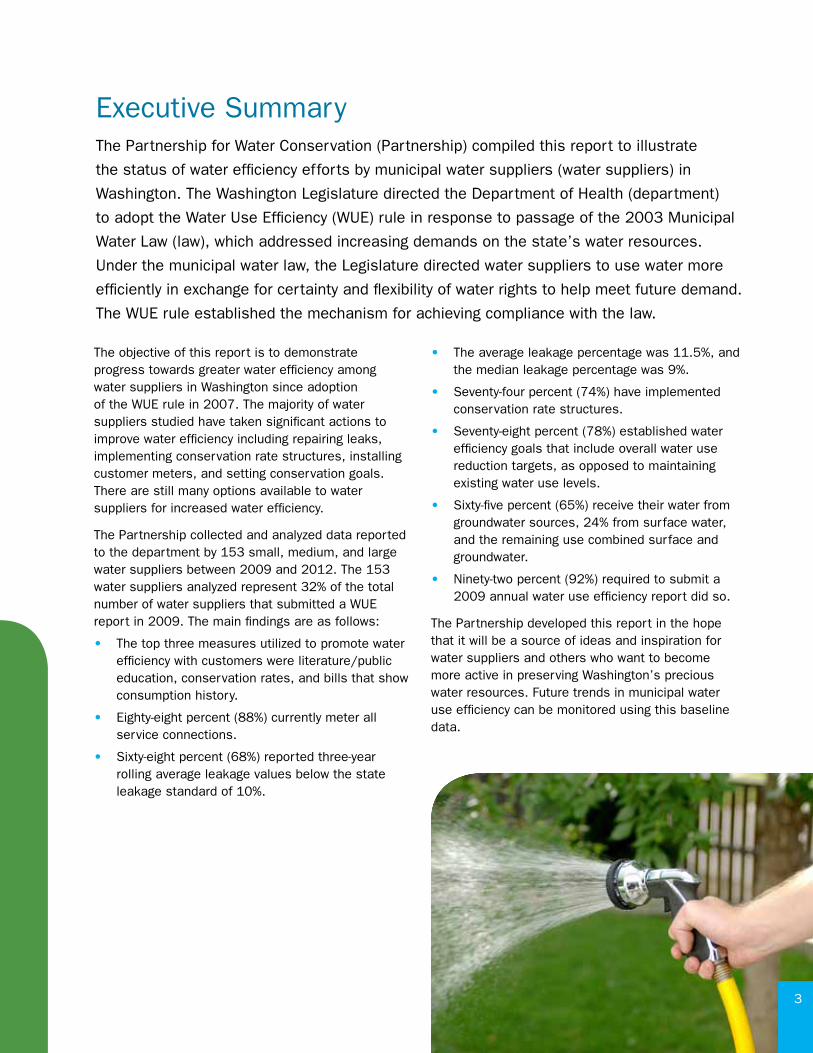
Executive SummaryThe Partnership for Water Conservation (Partnership) compiled this report to illustrate
the status of water efficiency efforts by municipal water suppliers (water suppliers) in
Washington. The Washington Legislature directed the Department of Health (department)
to adopt the Water Use Efficiency (WUE) rule in response to passage of the 2003 Municipal
Water Law (law), which addressed increasing demands on the state’s water resources.
Under the municipal water law, the Legislature directed water suppliers to use water more
efficiently in exchange for certainty and flexibility of water rights to help meet future demand.
The WUE rule established the mechanism for achieving compliance with the law.
The objective of this report is to demonstrate progress towards greater water efficiency among water suppliers in Washington since adoption of the WUE rule in 2007. The majority of water suppliers studied have taken significant actions to improve water efficiency including repairing leaks, implementing conservation rate structures, installing customer meters, and setting conservation goals. There are still many options available to water suppliers for increased water efficiency.
The Partnership collected and analyzed data reported to the department by 153 small, medium, and large water suppliers between 2009 and 2012. The 153 water suppliers analyzed represent 32% of the total number of water suppliers that submitted a WUE report in 2009. The main findings are as follows:
• The top three measures utilized to promote water efficiency with customers were literature/public education, conservation rates, and bills that show consumption history.
• Eighty-eight percent (88%) currently meter all service connections.
• Sixty-eight percent (68%) reported three-year rolling average leakage values below the state leakage standard of 10%.
• The average leakage percentage was 11.5%, and the median leakage percentage was 9%.
• Seventy-four percent (74%) have implemented conservation rate structures.
• Seventy-eight percent (78%) established water efficiency goals that include overall water use reduction targets, as opposed to maintaining existing water use levels.
• Sixty-five percent (65%) receive their water from groundwater sources, 24% from surface water, and the remaining use combined surface and groundwater.
• Ninety-two percent (92%) required to submit a 2009 annual water use efficiency report did so.
The Partnership developed this report in the hope that it will be a source of ideas and inspiration for water suppliers and others who want to become more active in preserving Washington’s precious water resources. Future trends in municipal water use efficiency can be monitored using this baseline data.
3

IntroductionThis report examines the progress of municipal water suppliers
(water suppliers) in implementing water use efficiency (WUE)
practices to meet the requirements of Washington’s WUE rule, as
defined in the Washington Administrative Code 246-290. It provides
water suppliers, policy makers, stakeholders, and the public a
glimpse of the commitments water suppliers have made across
Washington to achieve efficient water use. The report establishes a
baseline for measuring the progress and long-term trends of water
efficiency principles and practices taken by water suppliers.
4

History of Water Conservation in Washington1987 Washington experienced a prolonged drought. Water suppliers throughout the state developed management alternatives to deal with this shortage. Prior to this drought, many water suppliers had installed meters on service connections and managed leaks but rarely developed programs aimed at reducing customer demand. The 1987 drought set the stage for demand-side conservation.
1989 Changes in state building codes increased water use efficiency standards for indoor plumbing fixtures and fittings. As a result, consumers were purchasing more efficient new or replacement fixtures, leading to greater water savings.
1990 The Washington State Departments of Health and Ecology, along with the Washington Water Utility Council, developed interim guidelines for water suppliers that encouraged water use efficiency based on existing state statutes.
1992 and 2001 Additional droughts led to mandatory watering restrictions in some areas of the state. These restrictions opened a dialogue among water suppliers to establish water shortage response plans and develop voluntary water conservation programs to reduce customer demand.
1994 New federal efficiency standards for the manufacture and import of plumbing fixtures, fittings, and water-using appliances transformed the local and national marketplace. Only products meeting national water efficiency standards and state building codes could be installed in Washington. The Department of Health (department) published water conservation planning guidelines. Water suppliers followed these guidelines when completing comprehensive water system plans.
1997 The Washington Legislature allocated temporary funding to the department to provide water conservation technical assistance to water systems.
2003 The Washington Legislature passed the Municipal Water Law, leading to the adoption of the 2007 WUE rule, ultimately replacing the 1994 water conservation guidelines.
2007 The WUE rule took effect on January 22.
5

Competing Demands With the passage of the 2003 Municipal Water Law, the Washington
Legislature made water efficiency an issue of statewide importance in
a region of seemingly abundant supply. Washington’s regulatory WUE
requirements are robust and compare to states that pursue efficiency
due to limited water supplies, extreme water shortages, and drought
situations, such as California and Texas. A recent study by the Alliance
for Water Efficiency ranked Washington fourth highest in the nation for its
progressive water conservation laws and policies.
6

Figure 1: Average Water Use by Sector, 2005
Water supplies can be scarce in many areas of the state due to local and seasonal conditions. Dry summers lead to high demand for water. Washingtonians rely on water resources not only for potable supply, but also for agricultural and industrial production, hydropower, and recreation. In some watersheds, water limitations affect the needs of both people and fish, creating unique challenges to ensure the survival of the state’s threatened salmon and trout populations. The effects of climate change may also lead to greater uncertainty on future water supplies.
Implementing efficiency measures is generally less expensive than developing new sources of supply. Conservation can help control the long-term cost of water by delaying the need for new infrastructure. It can also help water suppliers reduce operating costs such as pumping and treatment. Efficient water use is a cost effective way to best utilize our valuable water supplies to ensure there is enough water to support a growing population, a vibrant economy, and a sustainable environment for generations to come.
According to Washington’s Office of Financial Management, the state population is expected to grow by about 2 million, reaching 8.8 million in
7
2040. The Water Supply Forum, a regional group of water suppliers in the Puget Sound area, has indicated the demand for water will increase by 63% in Pierce and Snohomish counties and by 47% in King County during the next 50 years. A report regarding water supply and demand in the Columbia River Basin predicts that by the year 2030, an additional 117,500 acre-feet (approximately 38 billion gallons) of water per year will be needed for private and municipal supply.
In a 2009 report, the United States Geological Survey identified the most recent water use trends in Washington. Of the 5.7 billion gallons per day of total freshwater used during 2005 in Washington, public water supply accounted for 990 million gallons per day. In contrast, an average of 3.7 billion gallons per day was used for agricultural needs. As shown in Figure 1, agricultural use (crop irrigation, livestock and aquaculture) accounted for the majority of total water use in the state (65%), while public supply accounted for 17%. The remaining 18% of water use was a combination of other uses, such as industrial, mining and thermoelectric. While other sectors may be implementing water efficiency into their operations, those efforts are not the subject of this report.
17%18%
65%
Agricultural Use
Public Supply
Other (Industry, etc.)
Source: United States Geological Survey
Washington’s Water Use Efficiency Rule The Municipal Water Law gave water suppliers added flexibility to use municipal water
rights to serve growing communities. This flexibility eliminated much of the risk of losing
municipal rights to the state due to relinquishment. In exchange, the law required that
water suppliers demonstrate efficient water use.
There are approximately 2,150 municipal water suppliers in Washington. Collectively they
serve about 85% of the state’s population and include various entities such as cities,
water districts, and privately owned water companies with 15 or greater residential
service connections. The Washington Department of Health, Office of Drinking Water,
administers the WUE rule.
8

The WUE rule requires that water suppliers accomplish the following:
9
Install meters on all water sources, interties, and customer connections to track, monitor, and record and report water consumption. • Source meters were required by January 22,
2007 and customer and intertie meters are required by January 22, 2017.
Establish measurable water efficiency goals through a public process to reduce customer demand. • Measurable water efficiency goals must be
adopted through a public process every six years. At least one demand side goal is required (e.g., reduce per capita consumption by 3% in 6 years); supply side goals (e.g., reduce leakage percentage by 5% in 3 years) are optional.
Implement conservation measures, evaluate water rates that encourage efficient use by customers, and educate customers about using water efficiently. • A measure is any water supplier initiative
designed to conserve water. Depending on the number of connections served, water suppliers must evaluate or implement between one and twelve measures to help customers use water efficiently. Systems with 1,000 or more connections must also evaluate opportunities to use reclaimed water.
Meet a standard of 10% distribution system leakage on a rolling three-year average. • Distribution system leakage is calculated on
reported production and consumption values. Any water supplier that exceeds the 10% standard must implement a water loss control action plan. Water suppliers with fewer than 500 connections may request permission from the department to use a 20% distribution system leakage standard, but the water supplier must provide justification for the request.
Report the production, consumption, and progress towards reaching WUE goals annually to both customers and the Department of Health. • Annual WUE reports compiled by water
suppliers measure water use trends, summarize the success of WUE programs, and verify compliance with the WUE requirements.
Develop and implement a WUE program. • Every water supplier must complete a
comprehensive WUE program. WUE programs encompass all aspects of supply and demand side efficiency and must be included as part of the comprehensive water system planning document.

10
Analysis of Water Use Efficiency DataThis report summarizes the water efficiency activities of 153 water suppliers.
The majority of the data was extracted from 2009 WUE reports submitted to the
department. In some cases, data from 2010, 2011, and 2012 was utilized to
supplement existing information that may have been absent in the 2009 reports.
In addition, data was collected from water system plans, rate schedules, written
conservation plans, and discussions with water supplier staff.
All of the 153 water suppliers included in this report are publicly owned water
systems. Privately owned water systems were not required to submit a WUE report
to the department until 2011 because of legal challenges to the Municipal Water
Law from 2007-10. Currently, there are approximately 2,150 public and privately
owned water suppliers in Washington that must submit annual WUE reports.
The 153 water suppliers analyzed in the report represent approximately 32% of the
nearly 500 systems that submitted a WUE report in 2009. In order to achieve the
most diverse sample, in most cases, data from the largest supplier in each county
was included, followed by a wide range of water supplier sizes within each county.

Not Fully MeteredFully Metered
1,000 or more Connections
Less than 1,000 Connections
Water Supply SourceFigure 2 illustrates the source of water supply for the 153 water suppliers.
Location of Water Suppliers Studied Sixty percent of the water suppliers in this report are located west of the Cascade Mountains, and forty percent are east of the mountains.
Water Supplier System SizeFigure 3 indicates the number of connections served by water suppliers.
Metering
Installing meters is one of the primary requirements of the WUE rule because it provides a basis for understanding water use patterns, aids in establishing measurable goals, and may be used to identify efficient versus inefficient water use. Meters provide information essential to achieving greater efficiency. Installing both production and consumption meters allow water suppliers to determine how much water is lost through leaks in the distribution system and help identify apparent losses, aiding in better water management.
Water suppliers were required to install meters on all water sources by January 22, 2007, and must install service meters by January 22, 2017. Water suppliers currently lacking service meters must document their progress of meter installation in annual WUE reports until their systems are fully metered.
Figure 4 shows that the majority of water suppliers in our sample (all publicly owned) are fully metered. However, data from the most recent 2011 WUE reports indicate that only 43% of privately-owned water systems are fully metered (not shown in Figure 4).
Figure 2: Water Supply Source for Water Suppliers
Figure 4: Publicly Owned Metered Systems
10%
24%
65%
Groundwater
Surface Water
1%
Both
Information not available
Figure 3: Water System Size
38%
62%
88%
12%
11

Leakage and Leak Detection
The WUE rule requires that water suppliers meet a leakage standard of no more than 10%. Each year by July 1, water suppliers must collect and report to the department the annual totals of all data from their sources, water purchased from other suppliers, and the authorized consumption (metered water use by customers plus any other estimated unmetered use).
Compliance with the 10% leakage standard is based on three years of reported data, as calculated on a rolling three-year average. Of the 153 water suppliers in the sample, 80 had submitted three years of data. Of those 80 water suppliers, 54 (68%) were below the 10% leakage standard, as shown in Figure 5. Water suppliers with greater than 10% leakage can demonstrate compliance with the leakage standard by completing and implementing a water loss control action plan.
The range, average, and median leakage percentages from the 2009 data are shown in Figures 6 and 7. The “Zero/Negative” category in Figure 6 represents negative leakage values (a result of poor data collection or inaccurate meters) and zero values for systems not fully metered.
Figure 6: Range of 2009 Reported Leakage Percentage
Figure 7: 2009 Average and Median Leakage Percentage
12
Figure 5: 2009 Compliance with Three-Year Average Leakage Standard
10% Leakage or Less
>10% Leakage
Insufficient Data
68%
15%17%
0 20 40 60 80 100
30.0% or more
20.0 to 29.9%
10.1 to 19.9%
0.1 to 10.0%
Zero/Negative
Number of Water Suppliers
8
14
37
82
12
12%
10%
8%
6%
4%
2%
0%Average Leakage Median Leakage
0
2
4
6
8
10
12
11.5%
9%
10% Leakage Standard

13
Case Study |Pasadena Park Irrigation District, Spokane CountyAfter conducting a water audit, managers at Pasadena Park Irrigation District in Spokane County discovered their 1940’s era water main was leaking in 240 places. The district serves approximately 2,300 connections, to a mostly residential population of about 6,000 people. Leakage ranged from 45-75% depending on the time of year, losing well over 1 million gallons a day during the highest peak. The district quickly realized water loss at this rate was leading to higher electricity costs and substantial wear and tear on infrastructure. To address the problem of leaking water mains and lost revenue, the district replaced over 5,000 feet of aging and failing water mains and began replacing old customer meters with an automated meter reading program with customer leak detection and water demand recording features. Leakage rates currently average 16.5%, recapturing as much as 800,000 gallons of water per day at an estimated value of $175,000 per year.

Conservation Based Rate Structures As part of the WUE rule, water suppliers are required to evaluate the adoption of conservation based rate structures, which encourage efficient water use by their customers. Under the WUE rule, adoption of a conservation rate structure qualifies as a water use efficiency measure.
Commonly used conservation rate structures include inclining block and seasonal rates. In an inclining block rate structure, customers pay a higher rate for water at each tier of the pricing system. In a seasonal rate structure, customers pay more for peak season usage than they do during the winter months. A uniform or declining rate structure (one in which customers pay the same amount or less per unit of water) is not considered a conservation rate structure. Likewise, flat rates are not considered conservation rates because customers pay one price for water regardless of the amount of water used.
A rate structure analysis should evaluate whether water suppliers are meeting their fixed and variable costs and accumulating cash reserves while at the same time reducing customer demand. Precise valuing of water through the use of conservation based rate structures do the following:
• Keep rates reasonable at the lower tiers for consumers who use water only for basic needs.
• Encourage customers to use water wisely and to minimize water waste, particularly with discretionary uses such as landscape irrigation.
• Help water suppliers control water usage during peak season demand.
14
Rate Structure AnalysisFor this portion of the report, only single-family residential rates for the years 2011 or 2012 were examined. As shown in Figure 8, 74% of the water suppliers had conservation based rate structures, indicating that most are encouraging their customers to use water efficiently by sending a price signal based on the amount of water used.
Figure 8: Water Rate Types for Single Family Residential Customers
Water Suppliers Implementing Conservation Based Rate Structures
Water Suppliers Implementing Non-Conservation Rate Structures
74%
26%

15
Case Study |Silverdale Water District, Kitsap CountyThe Silverdale Water District has a four-tier rate structure. During the last five years, the District has gradually increased the difference between the tiers to promote water efficiency. Each meter size has an allocated volume of water and corresponding price for each tier. In 2007, the increase between the first and fourth tier was only $1.36. The gradual five-year transition now equates to a $3.50 difference between tiers. These rate structure changes made by the District have resulted in 16.8% fewer customers reaching the fourth tier. Currently, fewer than 20% of the District’s single-family home customers use more than 330 gallons per day during the peak billing period. In addition, while total demand has decreased, revenue has slightly increased over this transition to the new rate structure.

Goal AnalysisThe report found three general categories of WUE customer goals. These categories are:
• Peak season reduction (aimed at limiting outdoor water use and reducing peak demand).
• Overall reduction (general water use reduction).
• Maintaining water usage with no proposed reduction in consumption.
Figure 9 illustrates the types of conservation goals.
16
Water Use Efficiency Goal SettingWater suppliers must establish a WUE goal that clearly identifies a water savings target over a specified time period. Goals must be established through a public process and adopted by the elected governing board or owner of the water supplier. Goal setting engages customers in a dialogue with their water suppliers to establish water efficiency programs. A goal must be established at least once every six years.

17
Figure 9: Conservation Goal Types
Figure 10: Trends in Conservation Goal Setting
• Thirty-four percent (34%) established a goal to reduce leaks
• Of the water suppliers that established overall reduction targets in water use, 60% of the targets were in the range of 1-5 % demand reduction per year.
• Twenty-two percent (22%) established goals with a six-year horizon.
Overall Reduction
Maintain Water Use Levels
Peak Season Reduction
No Goals Established
78%
12%5%
5%
0
10
20
30
40
50
60
70%
60%
50%
40%
30%
20%
10%
0%Regional
GoalParticipant
1 or MoreWUE Goals
LeakageReduction
Goal
1-5%ReductionTargets
6-YearTimeframe
Targets
Perc
enta
ge o
f S
uppl
iers
Im
plem
entin
gMost water systems (78%) established WUE goals with overall water use reduction targets. These included reductions in per capita use per day, average day demand, or other types or combinations of general reduction targets. This trend indicates a clear pattern to reduce current consumption within customer bases.
General Trends in Goal SettingThere was no notable difference in water reduction targets between Eastern and Western Washington’s water suppliers. Some of the general trends in WUE goal setting are summarized here and illustrated in Figure 10:
• About 10% of water suppliers are participating in a regional goal program, administered by a separate water supplier. The Saving Water Partnership (Seattle area), City of Everett, and Cascade Water Alliance (suburban King County) have all established regional water conservation goals for participating water suppliers in their respective areas.
• Forty-four percent (44%) of water suppliers established more than one goal to achieve water savings. This is noteworthy because the department only requires one demand reduction goal to be in compliance. Some water suppliers established two or more demand reduction goals, while others included a supply side goal to supplement the demand side goal.

MeasuresWater use efficiency measures are tools water suppliers can use to meet their goals. Measures may include water efficient devices, actions, business practices, or policies or ordinances that promote efficient water use. Water suppliers must implement mandatory measures such as installing source and service meters, performing meter calibration, or implementing a water loss control action plan (if leakage is greater than 10%), and, at least once per year, educating customers on how to use water efficiently. In addition, water suppliers must evaluate rates that encourage water efficiency, and suppliers with more than 1,000 connections must evaluate water reclamation opportunities. The number of measures that must be implemented is determined by water supplier size.
The report identified 42 measures that have been implemented by water suppliers. In addition to the top ten measures shown in Figure 11, many suppliers reported pursuing other innovative conservation actions, such as rebates for high-efficiency fixtures and appliances, peak season demand management, indoor and outdoor conservation kits, rainwater harvesting, rebates for commercial conservation programs, and a great variety of public outreach and education techniques.
Most water suppliers analyzed have made concerted efforts to meet the WUE requirements. The report revealed the most common measures are public education and rates. Hardware programs and audits are also popular with many water suppliers.
18
Figure 11: Top Ten Measures Implemented by Water Suppliers
0 10 20 30 40 50 60 700 10 20 30 40 50 60
Literature and Public Education
Conservation Rates
Bills with Consumption History
Website
School Outreach Programs
Public Outreach, Festivals and Fairs
Bill Stuffers
Water Audits
High Efficiency Showerheads
Clothes Washer Rebates
Number of Water Suppliers

19
Case Studies |Issaquah zHome, King CountyThe Issaquah zHome project is the nation’s first community of WaterSense labeled homes. zHome units have the most efficient fixtures and appliances available. Rainwater harvesting for toilets and clothes washers means that zHome residents will use, on average, only 29 gallons of municipal drinking water per person per day, compared to the Environmental Protection Agency (EPA) national average of 100 gallons per person in a typical existing home. With support from Cascade Water Alliance, all zHome units received certification through the EPA’s WaterSense New Homes Program.
Issaquah zHome, King County
Northwest University, King CountyThe Northwest University in Kirkland has a beautiful 56-acre campus, including large expanses of irrigated grass. In 2010, the University undertook a major renovation of its automatic irrigation system. The system was antiquated, prone to leaks and expensive to operate. The project included installing weather-based controllers, pressure reduction valves, flow sensors with automatic shut offs, and hundreds
of efficient sprinkler heads. The results were dramatic: total irrigation water use for 2011 showed an astounding 50% drop compared to the previous five years, from an average of 9.9 million gallons in 2010 to 4.9 million gallons in 2011, resulting in tens of thousands of dollars saved in reduced water bills. Moreover, the campus and landscape are just as beautiful as ever.

Reports Received
Reports Not Received
ReportingThe WUE rule contains an annual reporting requirement. Water suppliers must report production totals, authorized consumption, and progress toward achieving the supplier’s water saving goals to both the department and its customers.
Figure 12 indicates that the majority of water suppliers submitted their water use efficiency reports to the department in 2009.
20
Figure 12: Annual Reports Submitted to the Department by Water Suppliers, 2009
92%
8%

21

22
Future of Water Use Efficiency for Water SuppliersWashington’s water suppliers have made great strides in achieving water savings
during the past 20 years. The WUE rule provides new standards for water
suppliers, which has resulted in more effective water conservation programs
across the state. Many smaller water suppliers that historically lacked resources
and expertise now have better guidance and resources to achieve greater water
savings.
Under this new regulatory approach, water suppliers have begun to realize
the benefits of using water efficiently. This increased awareness of water use
patterns within their own communities will better prepare them for the next water
shortage, emergency, or drought situation.
With increased efficiencies, water conservation will benefit Washington in many
ways, including but not limited to the following:
• Delaying or eliminating the development of expensive new water sources.
• Leaving more water in existing water sources, thereby protecting flows in
rivers, streams, and wetlands.
• Achieving greater reliability of water supplies for future population and
economic growth.

Examples of Potential SavingsIn 2011, roughly 1,100 Washington water suppliers consumed an average of 715 million gallons per day of water. If those water suppliers achieved a combined average 5% reduction in their current water use, it would save 36 million gallons of water per day. That is enough to supply water to more than 200,000 new homes built to EPA’s WaterSense New Homes specifications.
About 900 water suppliers lost roughly 26 billion gallons of water in 2011 due to leaks and unauthorized use. If those water suppliers achieved a 1% reduction in total volume lost, it would result in 260 million gallons of water saved. This volume of water would be enough to serve the drinking water needs for the 6,000 water customers of the City of Bainbridge Island for an entire year.
Achieving these kinds of water reductions will not happen overnight, but there are approaches Washington’s water suppliers can utilize to reach greater conservation savings. There are new technologies and avenues that remain largely unexplored, including:
• Encouraging customers to purchase WaterSense labeled products.
• Research the use of advanced metering infrastructure, which provides instantaneous water use information to customers and helps water suppliers identify water use patterns in real-time.
• Utilize more effective rate structures that encourage customers to conserve.
• Promote new irrigation technologies such as weather-based “smart” controllers and efficient sprinkler heads.
• Consider alternative sources for non-potable use, such as rainwater harvesting or grey water harvesting.
Water use efficiency has a promising future in Washington. The Partnership is dedicated to helping all stakeholders, including water suppliers, businesses, and environmental groups across the state to work together to use our precious water resources wisely and create a more sustainable future.
23

References
Columbia River Basin 2011 Long Term Water Supply and Demand Forecast web page. Washington Department of Ecology Office of Columbia River, 2011. http://www.ecy.wa.gov/programs/wr/cwp/wsu_supply-demand.html
Environmental Protection Agency – WaterSense™ web page. United States Environmental Protection Agency, 2012. http://www.epa.gov/watersense/
Estimated Water Use in Washington, 2005. United States Department of the Interior, US Geological Survey Scientific Investigations Report 2009-5128, 2009 http://pubs.usgs.gov/sir/2009/5128/pdf/sir20095128.pdf
Forecast of the State Population. Washington State Office of Financial Management Report, 2011. http://www.ofm.wa.gov/pop/stfc/stfc2011/stfc_2011.pdf
Legal Challenges to the Municipal Water Law web page. Washington Department of Ecology, 2012.http://www.ecy.wa.gov/programs/wr/rights/muni_wr_archive.html
Municipal Water Law web page. Washington Department of Ecology, 2012. http://www.ecy.wa.gov/programs/wr/rights/muni_wtr.html
Municipal Water Supply – Efficiency Requirements. Second Engrossed Second Substitute House Bill 1338. 58th Legislature, 2003 1st Special Session, Effective Date September 9, 2003. http://www.doh.wa.gov/Portals/1/Documents/4200/1338_Text.pdf
Regional Data Profile, Populations and Households. Puget Sound Regional Council, 2012. http://psrc.org/data/regionalprofile/regionalprofile-pop
State of Salmon Report 2010. Washington State Governor’s Salmon Recovery Office, 2010. http://wwwtest2.rco.wa.gov/doc_pages/other_pubs.shtml#gsro
Salmon Recovery in Washington web page. Washington State Recreation and Conservation Office. www.rco.wa.gov/salmon_recovery/index.shtml
The Water Efficiency and Conservation State Scorecard: An Assessment of Laws and Policies, Alliance for Water Efficiency, 2012 http://www.allianceforwaterefficiency.org/final-scorecard.aspx
Washington Administrative Code 246-290. Group A Public Water Supplies, 2012.http://apps.leg.wa.gov/wac/default.aspx?cite=246-290
Water Supply Outlook 2009. Water Supply Forum, 2009. www.watersupplyforum.org/home/outlook/
Water Use Efficiency web page. Washington Department of Health Office of Drinking Water, 2012. http://www.doh.wa.gov/CommunityandEnvironment/DrinkingWater/WaterSystemDesignandPlanning/WaterUseEfficiency.aspx
Water Use Efficiency Guidebook. Washington State Department of Health Office of Drinking Water Publication 331-375, Third Edition, January 2011. http://www.doh.wa.gov/Portals/1/Documents/Pubs/331-375.pdf
24


Partnership for Water Conservation
Phone | 877.411.2120
Email | [email protected]
www.partners4water.org