cooperative agriculture a reference guide iiiii^'tr
TRANSCRIPT

United States ^^ Department of ii Agriculture
Forest Service
Cooperative State Research Service
Agriculture Handbook No. 646
•S. .-^^vé
_r
Spruce Budworms Handbook
, I I I i « *
Shigometry— A Reference Guide
iiiii^'tr
t-s* w
I i_
In 1977, the United States Department of Agriculture and the Canadian Department of the Environment agreed to cooperate in an expanded and accelerated research and development effort, the Canada/United States Spruce Budworms Program (CANUSA), aimed at the spruce budworm in the East and the western spruce budworm in the West. The objective of CANUSA was to design and evaluate strategies for controlling the spruce budworms and managing budworm-susceptible forests to help forest managers attain their objectives in an economically and environmentally acceptable manner. The work re- ported in this publication was wholly or partially funded by the program. This manual is one in a series on the spruce budworm.
Canada United States Spruce Budworms Program
November 1985

Contents
What Is Shigometry? 5 What Is a Shigometer? 5
How Does the Shigometer Operate in Wood? 5 How Does the Shigometer Operate in the Cambial Zone? 5
Decay in Trees 6 Heartwood and Discolored Wood 6 Decomposed Wood 6 Wetwood 6 Wood Products 6
Factors Affecting Electrical Resistance 6 Moisture 6 Temperature 6 Ions 6 Electrode Spacing and Surface Contact 6
Meter Misuse 7 How To Use Internal Electrical Resistance (1ER) Readings 8 How To Use Cambial Electrical Resistance (CER) Readings 8
Ratio Method 8 Utility Poles 9
Checklist 9 Drilling and Drill Bits 9 Bending Wire Electrodes and Other Electrode Problems 9 Meter Problems 10 Double-Needle Electrodes 10
Some Specific Uses for the Shigometer 10 Permanent Inventory Plots 10 Plantations 10 CER of City Trees 10 Hazard Trees 10 Cavity Work and Cabling and Bracing 1 Genetic Selections for 'Tough'' Trees 1 Dormancy 1 Ends of Logs 1 ER Patterns of Freshly Cut Boards 1 Wood Durability 1 Soft Rots 12
Use of the Shigometer on Spruce-Fir Sites 12 ER and Site Growth Potential 12 CER and Site Classification 12 CER Values for Spruce and Fir 13 Further Refinements Start 13 CER, Stress, and Mortality 14
Photo Guide 14 Tree Care Basics 14 The Shigometer 29 Utility Poles 36
ER Patterns 41 Selected References 45

Shîgometry: A Reference Guide by Alex L. Shigo and Walter C. Shortle*
What is Shigometry?
Shigometry is a procedure that helps determine rela- tive vigor of trees and the condition of wood—sound or decayed—by interpreting patterns of electrical re- sistance (ER) given by a pulsed-current meter, the Shigometer.® Double noninsulated needle electrodes are pushed into the bark to measure cambial electrical resistance (CER). A twisted-wire electrode is inserted into a hole drilled into a tree or wood product to measure the internal electrical resistance (1ER). CER is used to help determine relative tree vigor. 1ER is used to help determine the condition of the wood in living trees and wood products.
Wood condition is reflected in its moisture and ion concentrations, which are fairly constant in healthy tissues; and although they may change over the year, they do follow regular patterns. When a pulsed cur- rent is passed through infected tissue, the current passes with either more or less resistance than it would through healthy tissue.
This guide explains how to test the condition of living trees or wood products by use of the Shigometer and gives instructions for its use. The guide is in three parts: (1) An introduction on operating principles and applications, (2) an example of the procedure, and (3) a photo guide that gives details on the procedure and background information needed to use it.
What Is a Shigometer?
The Shigometer is a battery-operated, lightweight field ohmmeter. It generates a pulsed direct electric current and registers in thousands of ohms (kil) the resistance to the current as it passes through wood or bark.
Two models are now in use: A meter with a dial ohmmeter, model 7950, that was manufactured by Northeast Electronics Co., Concord, NH; and a newer model with a digital ohmmeter, model OZ-67, manufactured by the Osmose Wood Preserving Co., Inc., Buffalo, NY.'
How Does the Shigometer Operate in Wood?
When the temperature is above freezing and a pulsed direct electric current is passed through wood that has a moisture continuum, the resistance to the current will be directly affected by the concentration of posi- tively charged ions, or cations, in the wood.
How Does the Shigometer Operate in the Cambial Zone?
As the cambial zone—cells formed by the cambium that have not yet differentiated—increases in thick- ness, it can hold more moisture, and more moisture can hold more ions. The thicker the cambial zone, the lower the electrical resistance. The thicker the cam- bial zone, the more vigorous the tree.
'The authors are, respectively, chief scientist (retired) and research plant pathologist, USDA Forest Service, Northeastern Forest Experiment Station, Durham, NH. Alex L. Shigo is the leader of a pioneering project on discoloration and decay in trees, and Walter C. Shortle is a biochemist with that research unit.
^The use of trade, firm, or corporation names in this publication is for the information and convenience of the reader. Such use does not constitute an official endorsement or approval by the U.S. De- partment of Agriculture, or the Forest Service, of any product or service to the exclusion of others that may be suitable.
Decay in Trees Factors Affecting Electrical Resistance
The electrical procedure helps to identify the stages of the decay process, not the results of the process.
Heartwood and Discolored Wood
Before wood begins to decay, it becomes wetter and contains more ions. Early stages of whiterot are asso- ciated with increasing potassium ion concentration; brownrot, with increasing hydrogen ion concentration (decreasing pH).
The important thing to remember is that rapid ionic changes are measured as substantial differences in ER of the wood and take place before wood becomes vis- ibly decayed. This means that both decaying and de- cayed wood can be detected by electrical methods.
Decomposed Wood
In advanced stages of decay, the tips of the electrode may have intermittent contact with the wood and the ER will increase and decrease abruptly.
Wetwood
After boards are cut from logs, the wetwood retains moisture longer than sound wood. As wetwood dries in wood products, cracks and wood shrinkage will occur.
Wood Products
Many problems in wood products have their origin in the living tree. The sooner defects are detected, the better the chances are for making decisions on the best use of the wood.
In freshly cut logs, infected wood gives a much lower ER reading than that in contiguous sound wood. When the logs will be utilized for long-term products such as utility poles, use of the Shigometer can help detect unsound, but not visibly defective, wood. Low ER readings near large, open branch stubs or near the base of the tree may indicate extension of decay columns.
Electrical resistance of a pulsed current through wood or bark is affected greatly by moisture content, tem- perature, and concentration of cations or electrolytes. The physical condition of the substance may also play a part, together with distance between and type of electrodes and their degree of penetration into the wood.
Moisture
Wood in living trees will usually be above the fiber saturation point, or approximately 27 percent weight of water over weight of oven-dried wood when vol- ume is constant.
The Shigometer functions above the fiber saturation point. Regular moisture meters function below the fi- ber saturation point. Above fiber saturation, as free water increases, ions become the dominant variable in determining ER. When moisture content is near fiber saturation, moisture will be the major factor affecting ER. As moisture content exceeds 60 percent, increas- ing amounts of moisture will have very little effect on resistance readings.
Temperature
When the temperature is near freezing, small tempera- ture changes will have a great effect on ER. After temperatures reach 40 °F (5 °C), additional increases will have little effect on resistance.
Ions
Concentration of ions will have the greatest effect on resistance when temperatures are above 40 °F and moisture content is above 60 percent. In living trees, moisture content is usually above 60 percent. As wood decomposition increases, concentrations of ions usually increase.
Electrode Spacing and Surface Contact
The spacing of the electrodes affects resistance read- ings, especially if the electrodes are very far apart—more than 6.5 ft (2 m)—or if they are very close together—less than four-fifths of an inch (2 cm). Operators should keep the spacing as constant as pos- sible and well within these extremes.
Meter Misuse
The amount of electrode surface in contact with the wood or bark affects resistance readings. The opera- tor should standardize the amount of contact that the needle electrodes have in the bark by pushing them in until the wood is touched.
The shigometry procedure will not function in wood below the fiber saturation point or where decayed wood is resin soaked or dry. The procedure will not work when wetwood fluids flood the drill hole. The needle electrodes will not measure CER when they are placed into dead wood. The procedure also will not work in frozen tissues.
How To Use Internal Electrical Resistance (1ER) Readings
How To Use Cambial Electrical Resistance (CER) Readings
Shigometry can be used to determine the internal con- dition of living trees and some wood products, espe- cially inservice utility poles. In trees and poles, the operator first drills a small hole into the wood. The diameter of the hole is seven sixty-fourths of an inch (2.8 mm). The depth may be 8 to 12 inches (20.3 to 32 cm) or more, depending on the length of the drill bit. The operator next attaches a special twisted-wire electrode to the meter. The electrode has a tip that both sends and receives the electrical current.
As the operator slowly pushes the electrode into the predrilled hole, the changes in ER of the wood along the hole are shown in kil on the meter. In sound trees, the ER is lowest at the cambial zone and usual- ly increases as the electrode is pushed inward. When the electrode tip touches heartwood, there is a sudden increase in ER. When the electrode tip touches wood that is wetter than normal and has concentrations of ions greater than that in normal wood (for example, wood in the early stage of decay), there is a drop in ER. How far the ER decreases depends on the ionic condition of the wood.
Before one can use shigometry to assess wood condi- tion, the pattern of ER readings for healthy, sound trees must be determined on a species-by-species basis. For large groups of trees, the baseline ER pat- tern will be similar. For example, healthy beech, birch, maple, ash, poplar, and so on, will have similar readings. Oak, walnut, cherry, locust, and other heartwood-forming trees make up another pattern group. The pine group and the fir and spruce groups have still other patterns.
A sudden drop in ER below a typical reading of the species indicates wood with high moisture and high ion concentration. In species that usually have wet- wood, a sudden ER drop confirms its presence, espe- cially when the drilling torque does not decrease while the hole is being drilled. Wetwood fluids, which are generally darker than sap, usually flow out of such holes. To determine the internal boundary for columns of wetwood, the operator drills above the first hole in increments of two-fifths of an inch (1 cm) until the wetwood is reached.
Decreased drilling torque and changes in color of the drill shavings are good indicators of possible problems within wood or wood products.
Double, noninsulated needle electrodes are used to determine CER. The thicker the cambial zone, the lower the ER.
CER increases at the beginning of dormancy. In cold climates, CER readings from trees with high and low vigor are similar during midwinter. When tempera- tures are near freezing, however, temperature then becomes the major factor affecting resistance. When bark tissues are below freezing, shigometry will not work.
As with 1ER, operators must determine a mean CER of each species being evaluated. To determine the mean, CER is measured at two points on at least 20 healthy trees selected at random. CER readings on other trees of that species can then be compared to the mean. Trees with CER readings lower than the mean are more vigorous than those at the mean. Trees with CER readings higher than the mean are less vigorous than those at the mean.
There are two basic ways to use CER readings: 1. Accurately characterize the trees on the basis
of objective measurements. For example, choose sam- ples of trees that represent the extremes of the ob- served range of measurements. Measure the CER of the extremes to determine whether there is a statisti- cally significant difference between the two extremes. Never concentrate on the middle readings in first-time studies. Over time, or space, you may find that the middle readings are moving toward one extreme or the other.
2. Take many CER readings from a large ran- dom sample. Next, select two groups that best fit each extreme CER set. Then study the measurable characteristics of the two sets of extremes to deter- mine whether they are statistically significant. Again, stay away from the middle readings in your first stud- ies. As you learn more about the extremes, you will be able to work toward the middle.
Ratio Method
In the ratio method, the reading is divided by the mean. Trees more vigorous than the mean will have ratios less than 1, and trees less vigorous than the mean will have ratios greater than 1.
Checklist
Utility Poles
Shigometry can be helpful in determining which living trees would make the best utility poles. It can detect resin-soaked zones that sometimes develop around old wounds and stubs. These zones do not accept pre- servatives readily. And wood preservatives usually have a shorter effective time in wood that was already infected in the living tree.
For utility poles already in place, the internal decay detection procedure can be used at groundline. If wood is decaying, the wood will be above the fiber saturation point. Basic patterns of ER must be deter- mined first. Sudden drops in ER indicate higher moisture-ion content of the wood and therefore pres- ence of decay.
Here are some suggestions for operators using the Shigometer in the field. These points are amplified in the 'Thoto Guide'' section and the section on ER patterns at the end of this handbook.
Drilling and Drill Bits
• Make certain that drill bits are firmly held in drill chuck. • Guide drill in by cupping hand around the drill bit. • Do not make sudden moves. They will break drill bits. • Drill at a comfortable position that will use your arm to best advantage to push straight inward on the drill. • Make certain that reverse drill position has not been accidentally set. • Do not touch hot drill bits. • Keep tip of bit sharp. • Keep flutes at drill tip free from wood shavings. • Drill in and out several times before going inward the entire distance. • Do not waste power. Pull the drill out quickly. • Do not be afraid to push on the drill. • Learn by the sound when pressure is too great. • Recharge batteries after they have lost all power. Do not recharge batteries that still have some power. Some rechargeable batteries seem to have a ''memo- ry." It is best to run batteries down completely by holding and operating the drill in the air before re- charging. A small gasoline-powered generator is best for jobs that require many drillings.
Bending Wire Electrodes and Other Electrode Problems
The wire should fit tightly into the hole. Always clean the tips of the electrode with your fingernails and spread the tips slightly before performing each probe.
If the meter is registering kil below 500 when the electrode is in open air, the tips are dirty or stuck to- gether. Be alert for this when working with pines and trees that have a sticky or milky sap.
Look for worn insulation along the electrode shaft. This causes very erratic readings. Also, check for shorts at the plastic end of the electrode.
Some Specific Uses for the Shigometer
Meter Problems Permanent Inventory Plots
Use care when changing batteries, especially in the older dial meter. Clean the terminals before inserting new batteries. It is also wise to apply some saliva on the terminals and then roll the batteries in the termi- nal sockets. This solves many problems when batter- ies must be changed.
Be alert for accidentally turned knobs, especially when moving through the forest or from one pole to another.
Double-Needle Electrodes
On a small sample of trees in permanent inventory plots, the internal condition of the trees and the rela- tive vigor should be measured. Internal measurements show the width of sound wood in the sampled trees. The CER would show whether the trees are growing more or less vigorously than other groups of trees. The ratio method, with each reading divided by the mean reading for that species, should be used so the vigor of trees of different species can be compared in a mixed stand. This information could be put on a computer and the changes in internal defects and rela- tive vigor could be followed over time.
Older model double-needle electrodes may short. Shake wires to check for shorts in the handle and in the socket within the meter.
Needles suffer metal fatigue after heavy use. Move needles into bark and wood with a gentle up and down motion. Avoid abrupt changes in position when inserting or removing the needles.
Always carry extra needles. A plastic 35-mm film cartridge can be used as a container for the needles, and extra needles can be stuck into the ends of the container.
Plantations
CER readings help identify at an early age the very vigorous trees. The CER method makes it possible to rank the relative vigor of particular trees. By entering such data into a computer, managers could compare, for example, the CER means for plantations. The CER method is also very rapid and can save valuable time.
CER of City Trees
The CER of city trees could also be put into a compu- ter. Again, the ratio method (reading divided by mean) would be best so individual species could be observed over time.
The CER of recently planted trees can indicate early problems. One side of a tree may be very weak while the other side may be very strong. Knowledge of the weak and strong sides may help when pruning or fer- tilizing. A CER record of trees before and after fertil- ization or other treatments could also help field crews determine which trees should be treated.
The CER can be taken very quickly to determine the relative vigor of trees. This measurement can give valuable information, especially on trees that are ex- tremely important, such as the cover photo of an American elm on the lawn of the U.S. Capitol.
Hazard Trees
When crews examine what looks like a high-hazard tree, they should check the base of the tree and ex- posed roots to determine their soundness. Areas that
10
are suspect because of fungus fruiting bodies, cracks, dead bark, old wounds, insect holes, and other signs should be assessed with the meter.
When a large cavity is obvious, the operator should check the width of sound wood 1 ft (0.3 m) above the top of the cavity and on the opposite side of the trunk. The measurement will reveal the amount of sound wood present behind and above the cavity. If the tree has a great amount of sound wood at this po- sition, it usually will not be at hazard. Additional measurements should be made on suspect trees.
Cavity Work and Cabling and Bracing
Internal measurements indicate the width of sound wood in the trunk behind the cavity. If the cavity is a ''stovepipe" or only a very short hole, then treatment will differ greatly.
Hardware should never be partially put into decayed wood. If wood is decayed, put hardware or rods and bolts entirely through the trunk. Check CER of the margins of the obvious cavity to determine whether bark is alive or dead.
Genetic Selections for "Tough" Trees
Some trees within a species can resist the spread of decay much better than others. In research studies, it is often necessary to bore many large holes into trees to determine the type of wound response for the indi- vidual tree. To determine length of defect associated with wounds, it is not necessary to cut the tree.
Drill a measurement hole 4 inches (10 cm) above the wound, and a second hole 2 inches (5 cm) to the right or left of the measurement hole. With the twisted-wire electrode, measure the ER above the original wound and the ER in the control wood to the side of the wound. If the wood above the original wound is dis- colored or decayed, the ER will be lower than the ER of the control wood. If both ER readings are the same, then the defect column is less than 4 inches (10 cm) above the original wound. In some trees, it may be necessary to bore the test holes higher than 4 inches (10 cm) above the original wound.
Dormancy
As trees go into dormancy, the cambial zone begins to decrease in thickness. As the zone decreases, CER increases. The patterns of CER may be helpful in de- termining the stage of dormancy. When trees start to grow in the spring, CER usually decreases.
Ends of Logs
The needle electrode may be used to determine an ER profile at the ends of cut logs. The profile may show the difference between sound discolored wood and discolored wood with advanced decay that will cause problems in a product. End-of-log ER measurements could help greatly in fixing drying schedules, espe- cially for softwoods.
To make ER measurements in the end of a log, the log must have wood above the fiber saturation point. The defective zones in the wood will hold moisture much longer than the sound wood, and over time the differences between the ER of sound and defective wood become greater.
Establishing a profile takes only a few minutes for each log. The pattern of ER readings from the ob- viously sound logs can then be used as a baseline for assessing suspect logs. For logs that will be turned into high-value products, such measurements are ex- tremely cost effective.
ER Patterns of Freshly Cut Boards
ER readings can be taken on freshly cut boards to de- termine wetwood zones. This is especially important for softwoods. Such information can greatly help in determining drying schedules. Then boards with dif- ferent amounts of wetwood could be sorted from boards free of wetwood.
Wood Durability
The ratio of ER readings between sapwood and heart- wood may be an indicator of wood durability. Heavy amounts of extractives in heartwood lead to high ER readings. High amounts of extractives have been shown to be associated with high durability. When sapwood ER readings are low and heartwood readings are very high, durability may be high. When there is
11
Use of the Shigometer on Spruce-Fir Sites
very little difference in ER between sapwood and heartwood, durability may be low.
Soft Rots
Soft rot at the groundline in utility poles may be shown with the needle electrodes. First, the operator makes a quick series of probes around the base of the pole. The needles should be one beside the other when inserted into the pole. In sound dry wood, the needles will be very difficult to push into the wood. In suspect zones, the needles will penetrate easily. The ER of the sound areas will usually be far above 250 kil. Readings in the 50 kil range indicate soft rot or outer shell rot.
A rapid, simple, quantitative estimate of growth po- tential was needed to help assign risks to sites as a guide to management decisions about salvage opera- tions (high-risk sites), protective sprays (intermediate- risk sites), and increased monitoring (low-risk sites). A separate index value for internal decay potential also was needed to help assign risks to sites pro- ducing fir and spruce wood. A site with a low growth potential and a high decay potential has a greater risk of loss than one with low decay potential.
ER and Site Growth Potential
A preliminary evaluation of electrical methods for estimating site growth potentials using CER measure- ments was conducted in 1978 in cooperation with International Paper Company on continuous forest in- ventory plots. These 694-yd" (580-m") plots were inventoried from mid-June to mid-August. After stan- dard tree measurements had been made, the CER of each tree greater than 4.7 inches (12 cm) d.b.h. was determined using a standard procedure. The measure- ments (two per tree on opposite faces) took about 10 seconds per tree or about 8 to 10 minutes per plot de- pending on tree spacing, number of trees, and ease of walking between trees. An average CER for each ma- jor tree species on each plot could be determined as a basis for comparison to periodic growth rates deter- mined independently from diameter measurements taken on the same trees at the same position every 5 years.
At the end of the summer, the results for all plots were combined for the seven major tree species ob- served (balsam fir, red spruce, yellow and paper birch, sugar and red maple, and beech). A grand mean CER was calculated for each species. Trees on plots with CER values less than the mean were grow- ing better—had a higher periodic growth rate over the past 5 years—than those on plots with CER values greater than the mean. This was consistent with ear- lier studies done primarily on maple.
CER and Site Ciassifícation
Results from the preliminary field study and previous research studies indicated that it was possible to clas- sify sites by a rapid, simple, quantitative rating sys- tem shown in table 1.
12
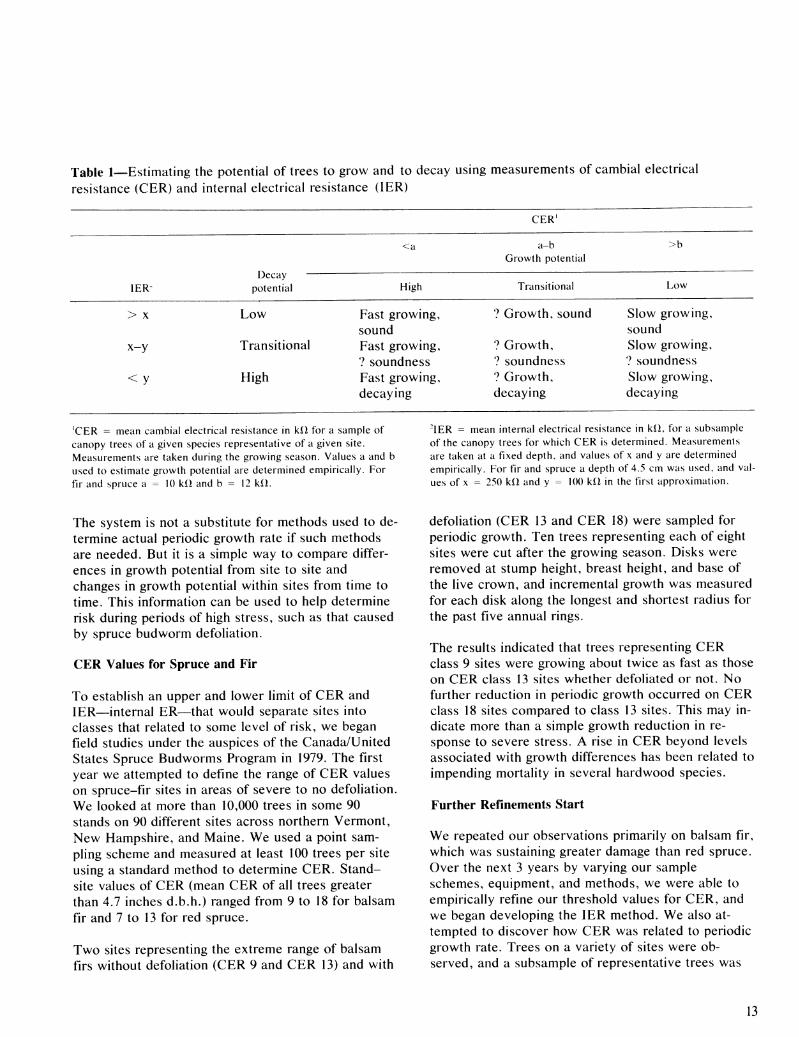
Table 1—Estimating the potential of trees to grow and to decay using measurements of cambial electrical resistance (CER) and internal electrical resistance (1ER)
CER'
<a a-b Growth potential
>b
lER- Decay
potential High Transitional Low
> X
x-y
<y
Low
Transitional
High
Fast growing, sound Fast growing, ? soundness Fast growing, decaying
? Growth, sound
? Growth, ? soundness ? Growth, decaying
Slow growing, sound Slow growing, ? soundness Slow growing, decaying
'CER = mean cambial electrical resistance in kíí for a sample of canopy trees of a given species representative of a given site. Measurements are taken during the growing season. Values a and b used to estimate growth potential are determined empirically. For fir and spruce a = 10 kil and b = 12 kii.
-1ER = mean internal electrical resistance in kil, for a subsample of the canopy trees for which CER is determined. Measurements are taken at a fixed depth, and values of x and y are determined empirically. For fir and spruce a depth of 4.5 cm was used, and val- ues of X = 250 kil and y = 100 kíi in the first approximation.
The system is not a substitute for methods used to de- termine actual periodic growth rate if such methods are needed. But it is a simple way to compare differ- ences in growth potential from site to site and changes in growth potential within sites from time to time. This information can be used to help determine risk during periods of high stress, such as that caused by spruce budworm defoliation.
CER Values for Spruce and Fir
To establish an upper and lower limit of CER and 1ER—internal ER—that would separate sites into classes that related to some level of risk, we began field studies under the auspices of the Canada/United States Spruce Budworms Program in 1979. The first year we attempted to define the range of CER values on spruce-fir sites in areas of severe to no defoliation. We looked at more than 10,000 trees in some 90 stands on 90 different sites across northern Vermont, New Hampshire, and Maine. We used a point sam- pling scheme and measured at least 100 trees per site using a standard method to determine CER. Stand- site values of CER (mean CER of all trees greater than 4.7 inches d.b.h.) ranged from 9 to 18 for balsam fir and 7 to 13 for red spruce.
Two sites representing the extreme range of balsam firs without defoliation (CER 9 and CER 13) and with
defoliation (CER 13 and CER 18) were sampled for periodic growth. Ten trees representing each of eight sites were cut after the growing season. Disks were removed at stump height, breast height, and base of the live crown, and incremental growth was measured for each disk along the longest and shortest radius for the past five annual rings.
The results indicated that trees representing CER class 9 sites were growing about twice as fast as those on CER class 13 sites whether defoliated or not. No further reduction in periodic growth occurred on CER class 18 sites compared to class 13 sites. This may in- dicate more than a simple growth reduction in re- sponse to severe stress. A rise in CER beyond levels associated with growth differences has been related to impending mortality in several hardwood species.
Further Refinements Start
We repeated our observations primarily on balsam fir, which was sustaining greater damage than red spruce. Over the next 3 years by varying our sample schemes, equipment, and methods, we were able to empirically refine our threshold values for CER, and we began developing the 1ER method. We also at- tempted to discover how CER was related to periodic growth rate. Trees on a variety of sites were ob- served, and a subsample of representative trees was
13
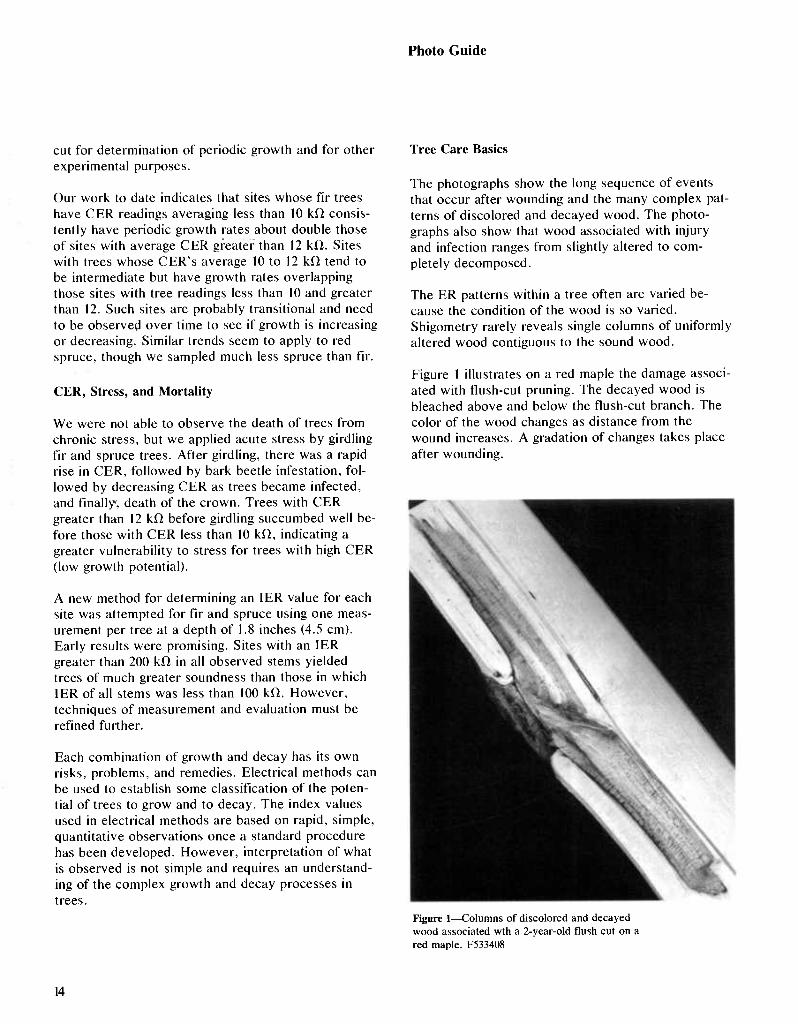
Photo Guide
cut for determination of periodic growtii and for other experimental purposes.
Our work to date indicates that sites whose fir trees have CER readings averaging less than 10 kfi consis- tently have periodic growth rates about double those of sites with average CER greater than 12 kiî. Sites with trees whose CER's average 10 to 12 kiî tend to be intermediate but have growth rates overlapping those sites with tree readings less than 10 and greater than 12. Such sites are probably transitional and need to be observed over time to see if growth is increasing or decreasing. Similar trends seem to apply to red spruce, though we sampled much less spruce than fir.
CER, Stress, and Mortality
We were not able to observe the death of trees from chronic stress, but we applied acute stress by girdling fir and spruce trees. After girdling, there was a rapid rise in CER, followed by bark beetle infestation, fol- lowed by decreasing CER as trees became infected, and finally, death of the crown. Trees with CER greater than 12 kil before girdling succumbed well be- fore those with CER less than 10 kiî, indicating a greater vulnerability to stress for trees with high CER (low growth potential).
A new method for determining an 1ER value for each site was attempted for fir and spruce using one meas- urement per tree at a depth of 1.8 inches (4.5 cm). Early results were promising. Sites with an 1ER greater than 200 kiî in all observed stems yielded trees of much greater soundness than those in which 1ER of all stems was less than 100 kfl. However, techniques of measurement and evaluation must be refined further.
Each combination of growth and decay has its own risks, problems, and remedies. Electrical methods can be used to establish some classification of the poten- tial of trees to grow and to decay. The index values used in electrical methods are based on rapid, simple, quantitative observations once a standard procedure has been developed. However, interpretation of what is observed is not simple and requires an understand- ing of the complex growth and decay processes in trees.
Tree Care Basics
The photographs show the long sequence of events that occur after wounding and the many complex pat- terns of discolored and decayed wood. The photo- graphs also show that wood associated with injury and infection ranges from slightly altered to com- pletely decomposed.
The ER patterns within a tree often are varied be- cause the condition of the wood is so varied. Shigometry rarely reveals single columns of uniformly altered wood contiguous to the sound wood.
Figure 1 illustrates on a red maple the damage associ- ated with flush-cut pruning. The decayed wood is bleached above and below the flush-cut branch. The color of the wood changes as distance from the wound increases. A gradation of changes takes place after wounding.
Figure 1—Columns of discolored and decayed wood associated wth a 2-year-old flush cut on a red maple. F533408
14

Decay in an advanced stage, resulting from animal- caused damage in the distant past, is shown in figure 2. The column is confined to the diameter of the tree at the time of injury. The lower right section shows nearly a complete cylinder of decayed wood. The lower left section shows the decayed wood developing within the cylinder of wood that was present at the time of injury. The upper section shows the decayed
and discolored wood as a smaller area, as cross cuts are made through the defect. The cylinder of wood that was present at the time of wounding is still ob- vious. The defects usually move as expanding cones within the cylinder of wood present at the time of in- jury. The wood farthest from the wound will be al- tered much less than the wood nearest the wound.
Figure 2—Column of discolored and decayed wood associated with a black-bear wound on western hemlock. F533410
15

Figure 3—Discolored and decayed wood associated with root rot caused by Armillaria melleu in red spruce. F533411
Armillaria mellea causes decay and discoloration in many softwood species (fig. 3). This section from the base of a red spruce tree shows discolored and de- cayed wood, which advanced upward from the roots. Some portions of the sample show more advanced stages of discolored and decayed wood than others.
Note the extremely eccentric early growth patterns. The ER cambial zone readings may differ for many reasons, especially when a tree is growing much faster on one side than the other.
16
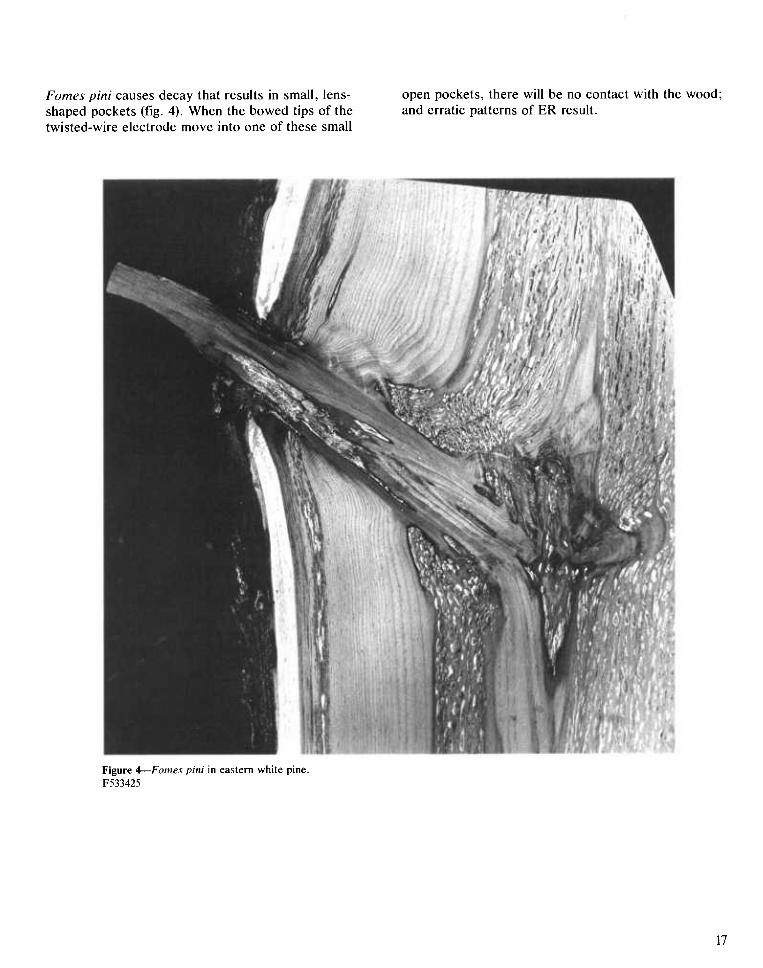
Fomes pini causes decay that results in small, lens- shaped pockets (fig. 4). When the bowed tips of the twisted-wire electrode move into one of these small
open pockets, there will be no contact with the wood; and erratic patterns of ER result.
Figure 4—Fomes pini in eastern white pine. F533425
17
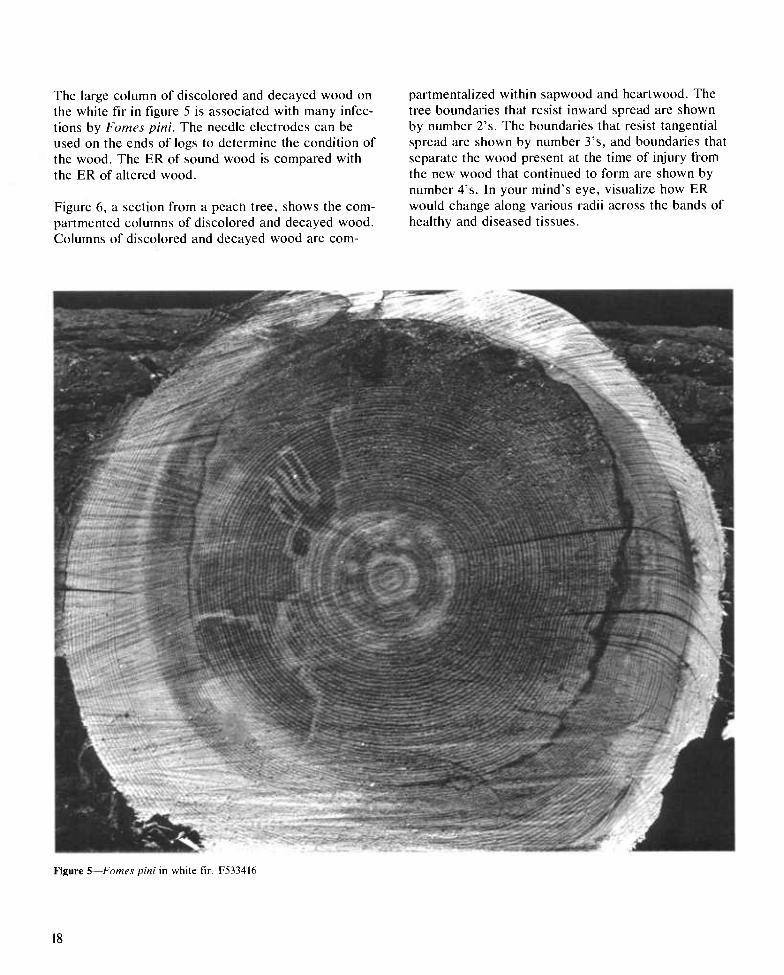
The large column of discolored and decayed wood on the white fir in figure 5 is associated with many infec- tions by Forties pini. The needle electrodes can be used on the ends of logs to determine the condition of the wood. The ER of sound wood is compared with the ER of altered wood.
Figure 6, a section from a peacn tree, shows the com- partmented columns of discolored and decayed wood. Columns of discolored and decayed wood are com-
partmentalized within sapwood and heartwood. The tree boundaries that resist inward spread are shown by number 2's. The boundaries that resist tangential spread are shown by number 3's, and boundaries that separate the wood present at the time of injury from the new wood that continued to form are shown by number 4's. In your mind's eye, visualize how ER would change along various radii across the bands of healthy and diseased tissues.
Figure 5—Fames pini in white fir. F533416
18
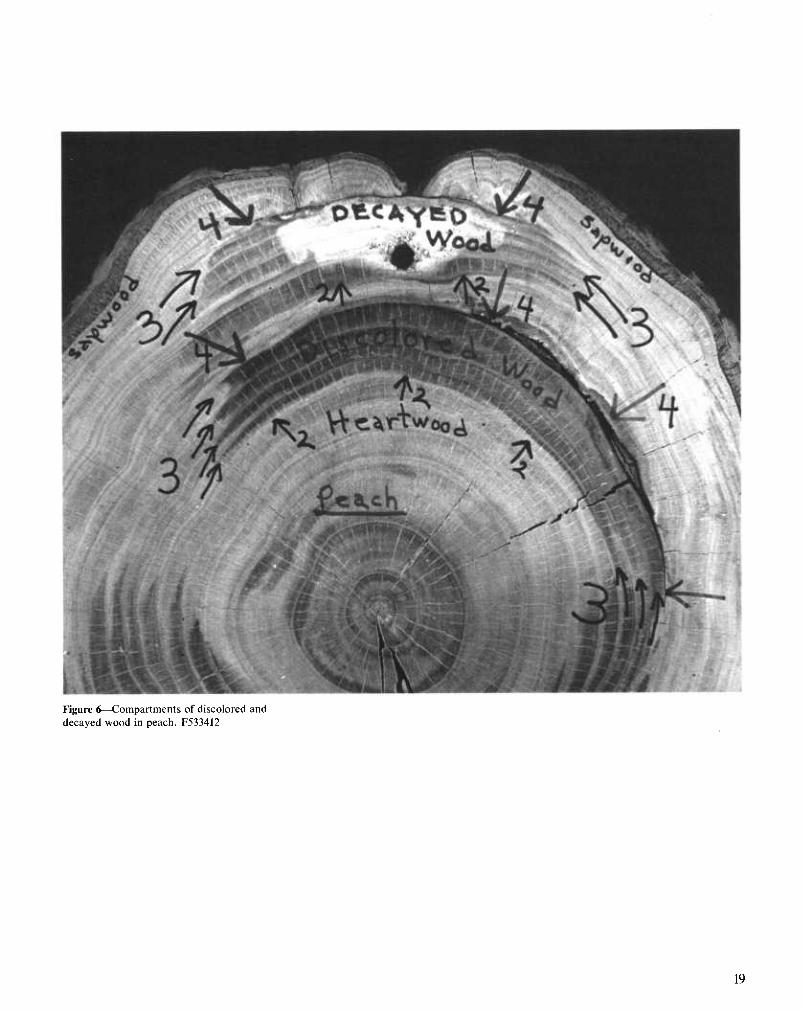
Figure 6—Compartments of discolored and decayed wood in peacli. F533412
19
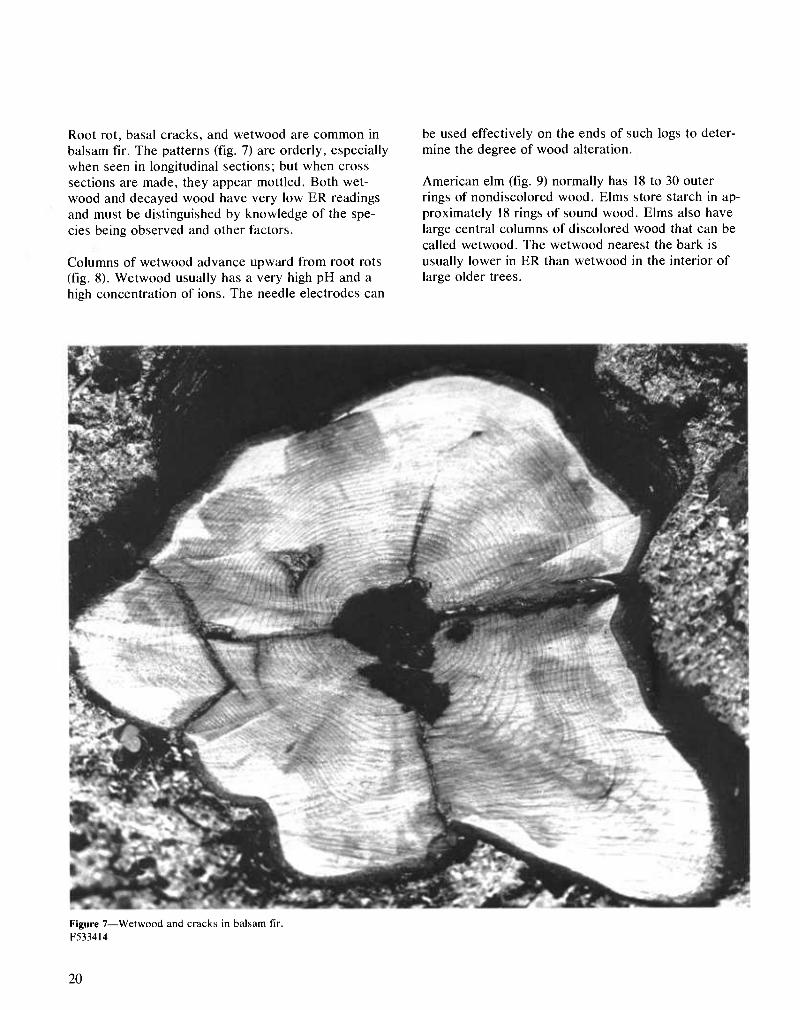
Root rot, basal cracks, and wet wood are common in balsam fir. The patterns (fig. 7) are orderly, especially when seen in longitudinal sections; but when cross sections are made, they appear mottled. Both wet- wood and decayed wood have very low ER readings and must be distinguished by knowledge of the spe- cies being observed and other factors.
Columns of wetwood advance upward from root rots (fig. 8). Wetwood usually has a very high pH and a high concentration of ions. The needle electrodes can
be used effectively on the ends of such logs to deter- mine the degree of wood alteration.
American elm (fig. 9) normally has 18 to 30 outer rings of nondiscolored wood. Elms store starch in ap- proximately 18 rings of sound wood. Elms also have large central columns of discolored wood that can be called wetwood. The wetwood nearest the bark is usually lower in ER than wetwood in the interior of large older trees.
Figure 7—Wetwood and cracks in balsam fir. F533414
20
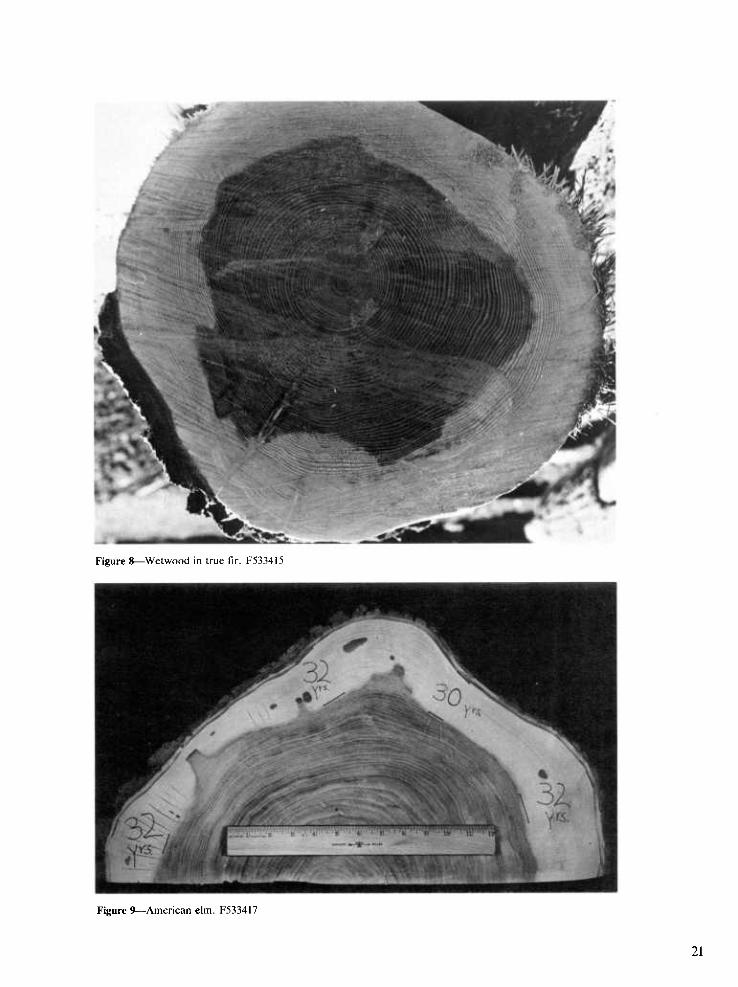
Figure 8—Wetwood in true fir. F533415
Figure 9—American elm. F533417
21
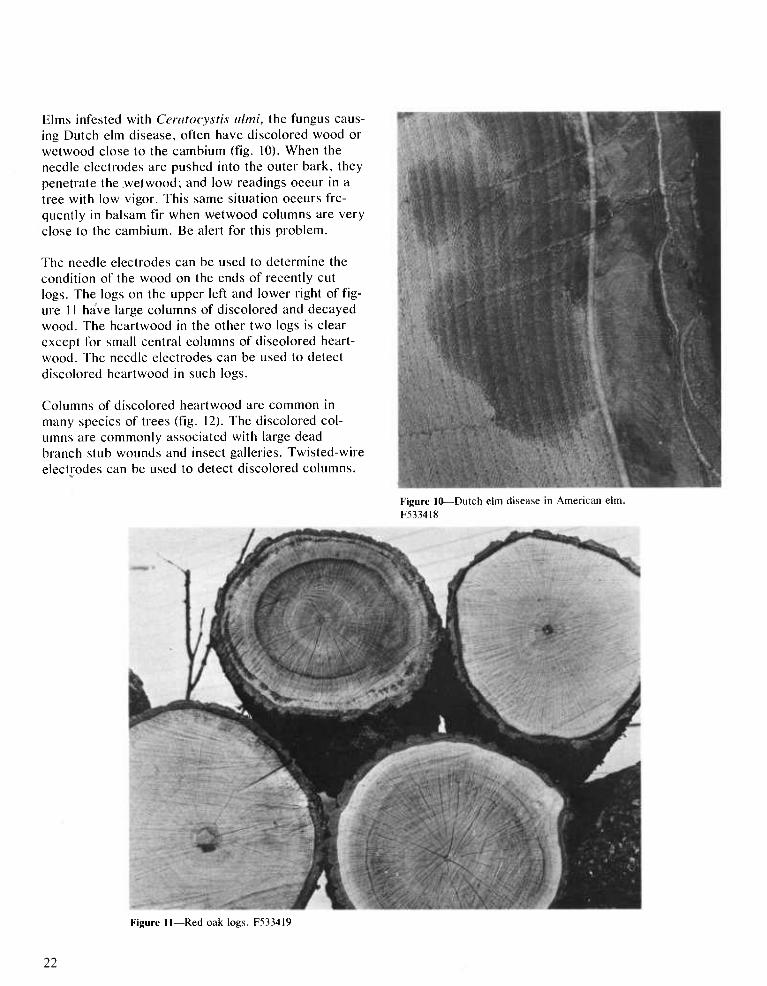
Elms infested with Ceratocystis iilmi, the fungus caus- ing Dutch elm disease, often have discolored wood or wetwood close to the cambium (fig. 10). When the needle electrodes are pushed into the outer bark, they penetrate the wetwood; and low readings occur in a tree with low vigor. This same situation occurs fre- quently in balsam fir when wetwood columns are very close to the cambium. Be alert for this problem.
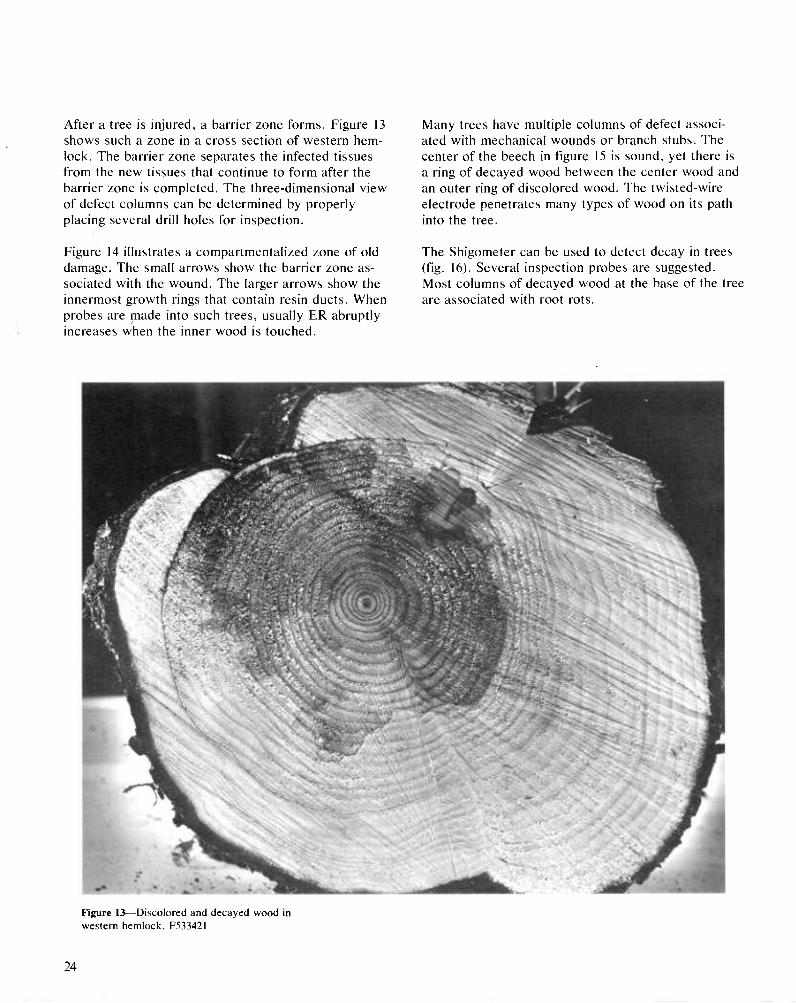
The needle electrodes can be used to determine the condition of the wood on the ends of recently cut logs. The logs on the upper left and lower right of fig- ure 11 have large columns of discolored and decayed wood. The heartwood in the other two logs is clear except for small central columns of discolored heart- wood. The needle electrodes can be used to detect discolored heartwood in such logs.
Columns of discolored heartwood are common in many species of trees (fig. 12). The discolored col- umns are commonly associated with large dead branch stub wounds and insect galleries. Twisted-wire electrodes can be used to detect discolored columns.
Figure 10—Dutch elm disease in American elm. F5334I8
Figure 11—Red oak logs. F533419
22

Figure 12—Discolored heartwood in red oak. F533420
23
After a tree is injured, a barrier zone forms. Figure 13 shows such a zone in a cross section of western hem- loci<. The barrier zone separates the infected tissues from the new tissues that continue to form after the barrier zone is completed. The three-dimensional view of defect columns can be determined by properly placing several drill holes for inspection.
Many trees have multiple columns of defect associ- ated with mechanical wounds or branch stubs. The center of the beech in figure 15 is sound, yet there is a ring of decayed wood between the center wood and an outer ring of discolored wood. The twisted-wire electrode penetrates many types of wood on its path into the tree.
Figure 14 illustrates a compartmentalized zone of old damage. The small arrows show the barrier zone as- sociated with the wound. The larger arrows show the innermost growth rings that contain resin ducts. When probes are made into such trees, usually ER abruptly increases when the inner wood is touched.
The Shigometer can be used to detect decay in trees (fig. 16). Several inspection probes are suggested. Most columns of decayed wood at the base of the tree are associated with root rots.
Figure 13—Discolored and decayed wood in western hemlock. F533421
24
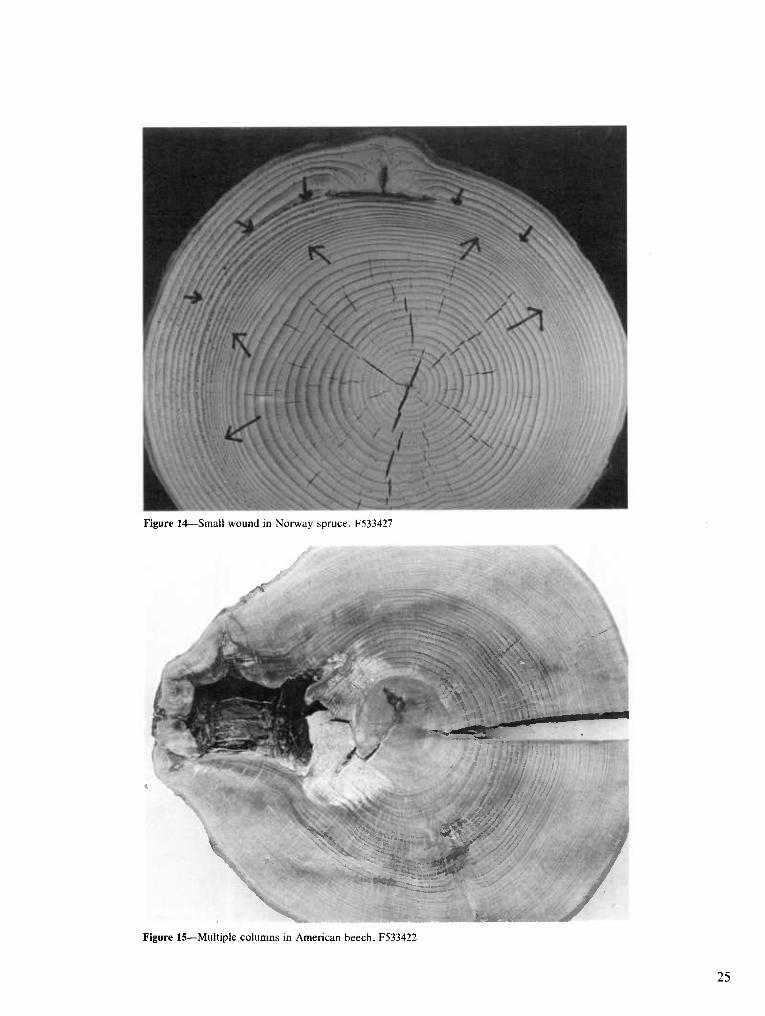
Figure 14—Small wound in Norway spruce. F533427
%, X
\
^x,. Figure IS—Multiple columns in American beech. F533422
25
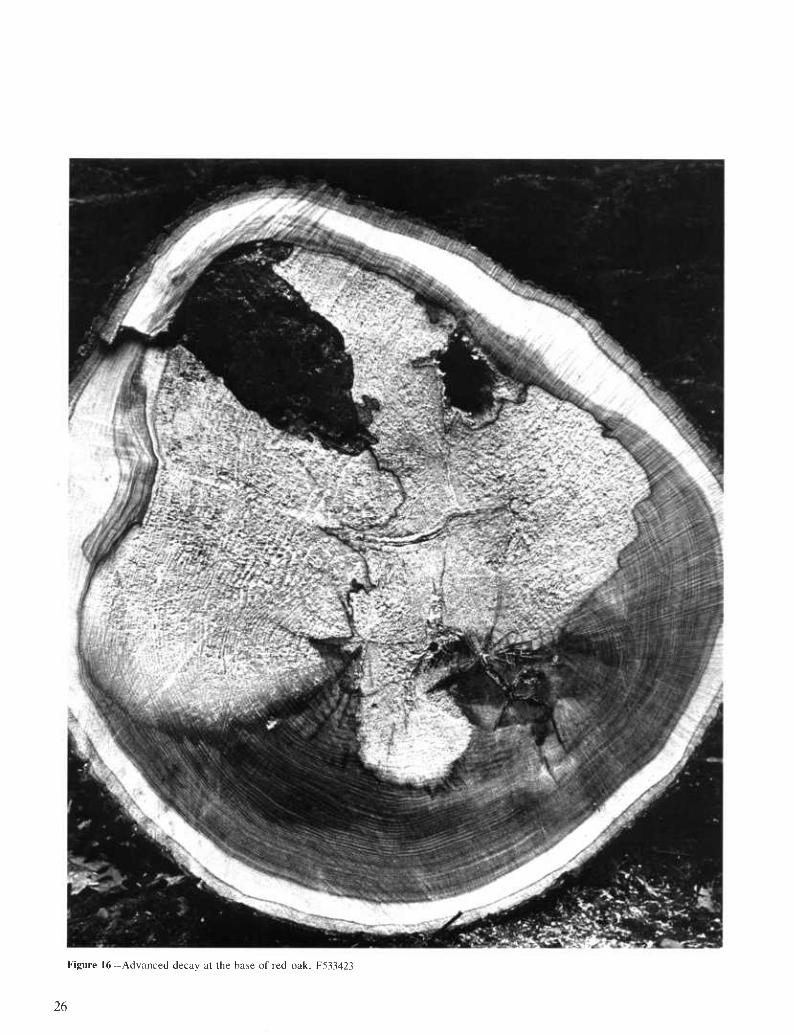
Figure 16—Advanced decay al the base of red oak. F533423
26
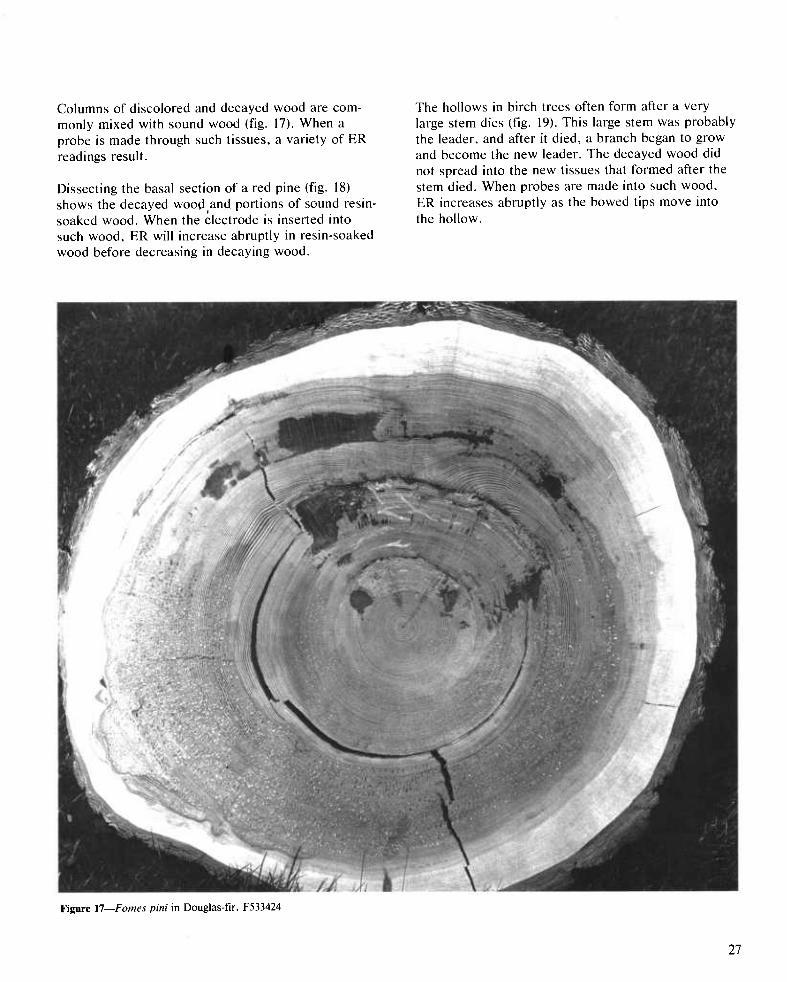
Columns of discolored and decayed wood are com- monly mixed with sound wood (fig. 17). When a probe is made through such tissues, a variety of ER readings result.
Dissecting the basal section of a red pine (fig. 18) shows the decayed wood and portions of sound resin- soaked wood. When the electrode is inserted into such wood, ER will increase abruptly in resin-soaked wood before decreasing in decaying wood.
The hollows in birch trees often form after a very large stem dies (fig. 19). This large stem was probably the leader, and after it died, a branch began to grow and become the new leader. The decayed wood did not spread into the new tissues that formed after the stem died. When probes are made into such wood, ER increases abruptly as the bowed tips move into the hollow.
Figure 17—Fames pini in Douglas-fir. F533424
27

Figure 18—Heterohasidion annosum in red pine. F533426
Figure 19—Hollow in birch. F533428
28
The Shigometer
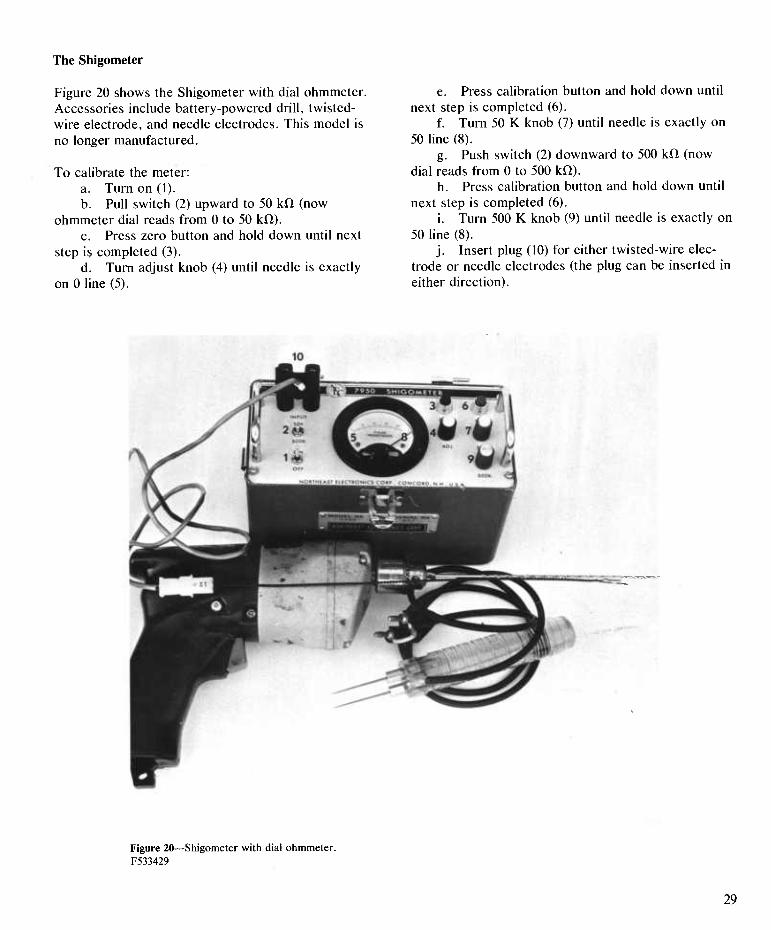
Figure 20 shows the Shigometer with dial ohmmeter. Accessories include battery-powered drill, twisted- wire electrode, and needle electrodes. This model is no longer manufactured.
To calibrate the meter: a. Turn on (1). b. Pull switch (2) upward to 50 kiî (now
ohmmeter dial reads from 0 to 50 kiî). c. Press zero button and hold down until next
step is completed (3). d. Turn adjust knob (4) until needle is exactly
on 0 line (5).
e. Press calibration button and hold down until next step is completed (6).
f. Turn 50 K knob (7) until needle is exactly on 50 line (8).
g. Push switch (2) downward to 500 kil (now dial reads from 0 to 500 kil).
h. Press calibration button and hold down until next step is completed (6).
i. Turn 500 K knob (9) until needle is exactly on 50 line (8).
j. Insert plug (10) for either twisted-wire elec- trode or needle electrodes (the plug can be inserted in either direction).
Figure 20—Shigometer with dial ohmmeter. F533429
29

Accessories for the Shigometer with digital display (fig. 21) include drill and electrodes. This model is made by Osmose Wood Preserving Co., Inc., of Buf- falo, NY. To calibrate meter:
a. Attach twisted-wire electrode or needle elec- trode to connecting cord.
b. Attach connecting cord jack into input outlet (1).
c. Set switch (2) to zero. Adjust zero control (3) until display reads "0 ± 1."
d. Set switch (2) to calibrate. Adjust calibration control (4) until display reads "200 ± 1."
e. Set switch (2) to measure. Insert electrode in sample and observe display.
f. To check batteries, set switch (2) to battery
test position and observe display. Be suspicious of batteries when display reads below 12.
This Shigometer should stay calibrated for several hours or days of use unless the controls are moved. It is good practice to check the calibration twice a day, or whenever the operator suspects that the controls have been moved.
There are many types of drill bits that can be used to make holes for the wire electrodes (fig. 22). Most drill bits (four on left) are three thirty-seconds of an inch (2.4 mm) in diameter. Some (two on right) are seven sixty-fourths of an inch (2.8 mm) in diameter. Drill bits have different amounts of flute length. Avoid drills that have very short flute lengths. Make certain
Figure 21—Shigometer with digital display. F533430
30
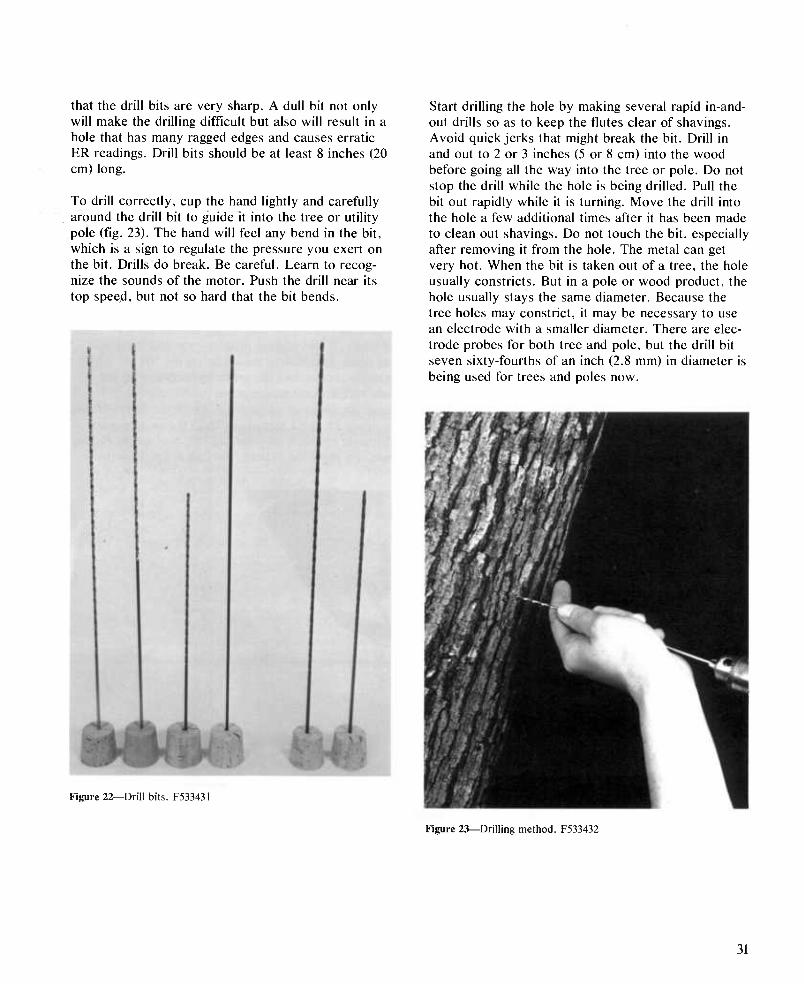
that the drill bits are very sharp. A dull bit not only will make the drilling difficult but also will result in a hole that has many ragged edges and causes erratic ER readings. Drill bits should be at least 8 inches (20 cm) long.
To drill correctly, cup the hand lightly and carefully around the drill bit to guide it into the tree or utility pole (fig. 23). The hand will feel any bend in the bit, which is a sign to regulate the pressure you exert on the bit. Drills do break. Be careful. Learn to recog- nize the sounds of the motor. Push the drill near its top speed, but not so hard that the bit bends.
Start drilling the hole by making several rapid in-and- out drills so as to keep the flutes clear of shavings. Avoid quick jerks that might break the bit. Drill in and out to 2 or 3 inches (5 or 8 cm) into the wood before going all the way into the tree or pole. Do not stop the drill while the hole is being drilled. Pull the bit out rapidly while it is turning. Move the drill into the hole a few additional times after it has been made to clean out shavings. Do not touch the bit, especially after removing it from the hole. The metal can get very hot. When the bit is taken out of a tree, the hole usually constricts. But in a pole or wood product, the hole usually stays the same diameter. Because the tree holes may constrict, it may be necessary to use an electrode with a smaller diameter. There are elec- trode probes for both tree and pole, but the drill bit seven sixty-fourths of an inch (2.8 mm) in diameter is being used for trees and poles now.
Figure 22—Drill bits. F533431
Figure 23—Drilling method. F533432
31

The tips of twisted-wire electrode should fit snugly into the drill hole. The bowed tips should be one above the other as they enter the drill hole (fig. 24). The ER will change slightly even in uniformly appear- ing sound wood.
Before inserting the electrode, make certain that no dirt or sap is between the tips. The ohmmeter should read 500 kiî or beyond when a clean electrode tip is in open air. Move your fingernail through tips to clean them, and to restore some spring. Be alert for broken or scratched surfaces on the electrode. If erratic read- ings occjir, check the insulation carefully. Discard damaged electrodes. When the electrode tip touches the end of the drill hole, the tips make additional con- tact with the wood and a lower ER results. Discount the last reading in trees and poles.
While inserting the twisted-wire electrode, your fin- gers should not leave the tree bark or the surface of the tree or pole. If the electrode is too loose, use a larger one; if it is too tight, use a smaller one. You should feel some resistance to pushing it in. It is best
to insert the electrode at intervals of one- or two- fifths of an inch (0.5 to 1 cm) in an even rhythm. With practice, you will notice small voids and decayed wood. The twisted-wire electrode will bend if it is in- serted improperly. Never hold it by the plastic cap. Bent electrodes can be straightened with care.
If you need to sample utility poles with the Shigome- ter, drill holes slightly downward at the base of the pole. When drilling downward below the groundline into a pole, start by setting the drill hole in a horizon- tal position and then continue the drilling downward. It is very difficult to start drilling in a downward posi- tion. The electrode should be inserted into the pole in such a way that your fingers are touching the pole at all times. If this is done properly, the electrode will not bend. Dial meters should be on the 500 kfl scale. When you complete the procedure, always fill the hole with a wood preservative.
In figure 25, the ER readings from the twisted-wire electrode are shown on the cut stump of a root-rotted pine. To show the pattern, the drill holes were made
Figure 24—Position of electrode tip. F533435
32
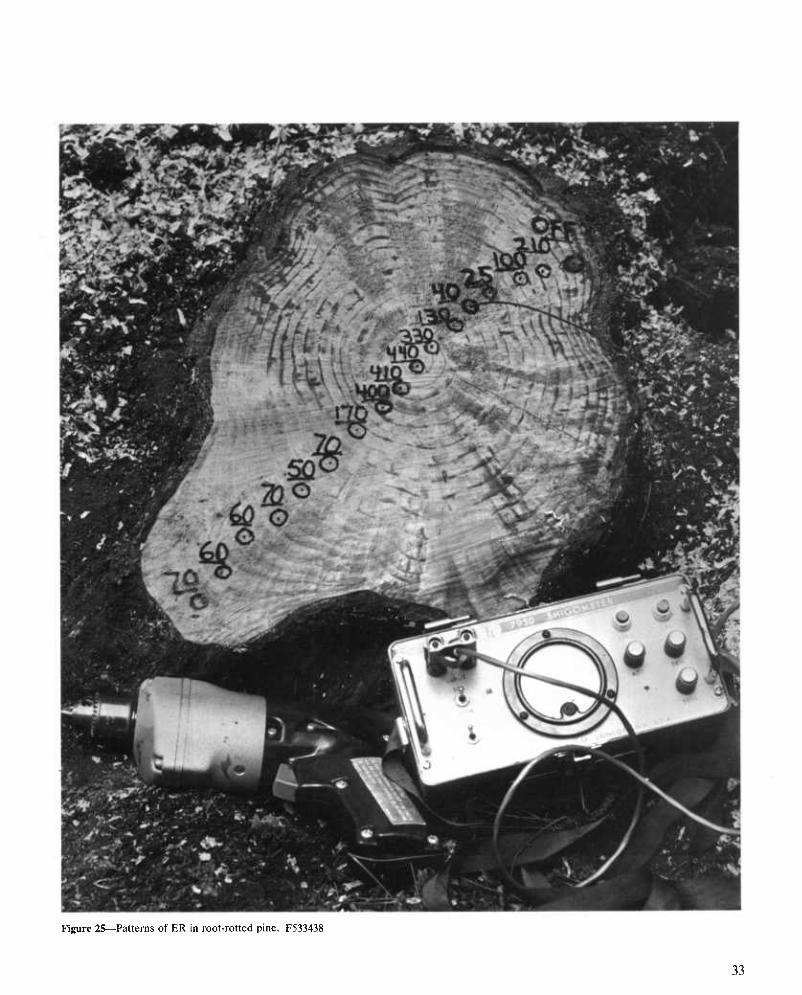
Figure 25—Patterns of ER in root-rotted pine. F533438
33
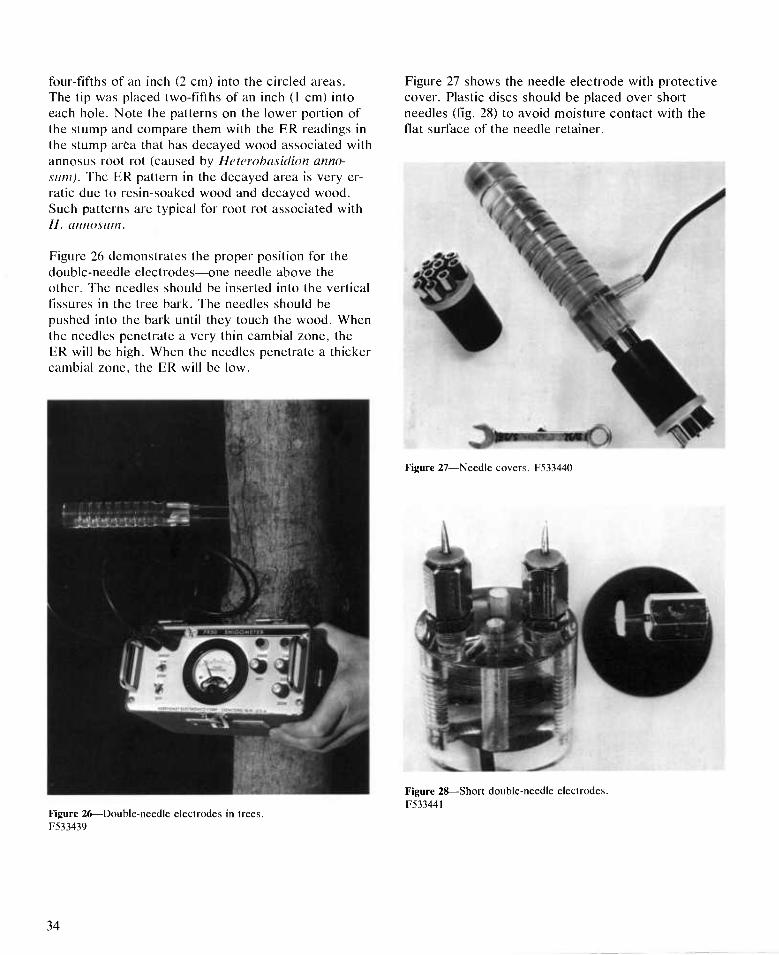
four-fifths of an inch (2 cm) into the circled areas. The tip was placed two-fifths of an inch (1 cm) into each hole. Note the patterns on the lower portion of the stump and compare them with the ER readings in the stump area that has decayed wood associated with annosus root rot (caused by Heterobasidion anno- siim). The ER pattern in the decayed area is very er- ratic due to resin-soaked wood and decayed wood. Such patterns are typical for root rot associated with H. annosiim.
Figure 26 demonstrates the proper position for the double-needle electrodes—one needle above the other. The needles should be inserted into the vertical fissures in the tree bark. The needles should be pushed into the bark until they touch the wood. When the needles penetrate a very thin cambial zone, the ER will be high. When the needles penetrate a thicker cambial zone, the ER will be low.
Figure 27 shows the needle electrode with protective cover. Plastic discs should be placed over short needles (fig. 28) to avoid moisture contact with the flat surface of the needle retainer.
Figure 27—Needle covers. F533440
Figure 26—Double-needle electrodes in trees. F533439
Figure 28—Short double-needle electrodes. F53344I
34
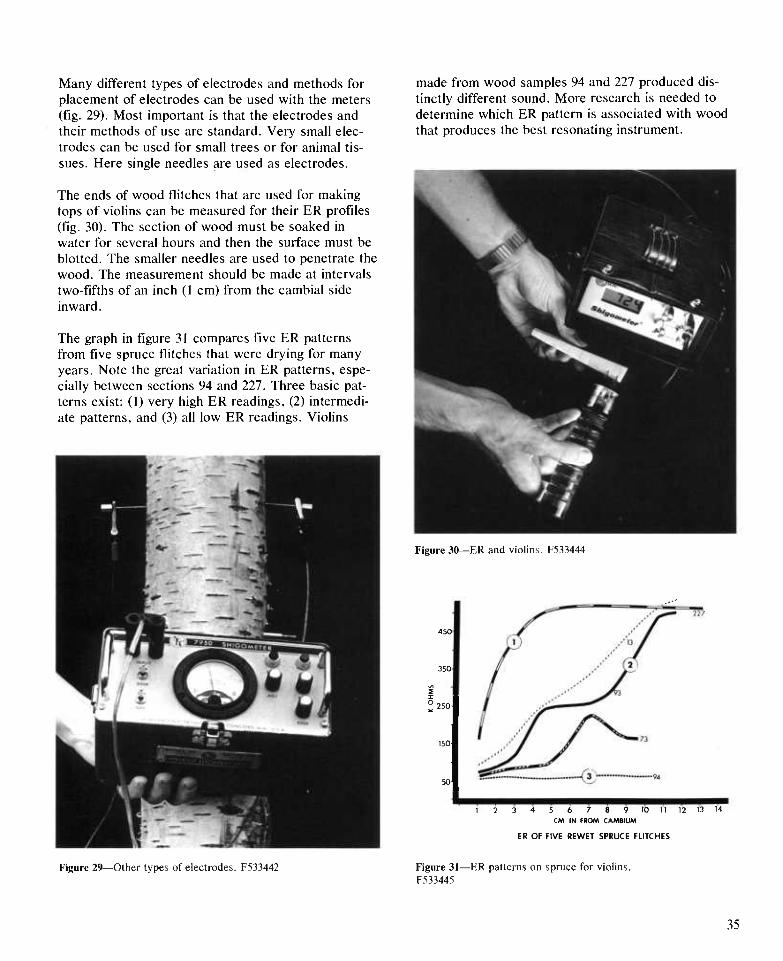
Many different types of electrodes and methods for placement of electrodes can be used with the meters (fig. 29). Most important is that the electrodes and their methods of use are standard. Very small elec- trodes can be used for small trees or for animal tis- sues. Here single needles are used as electrodes.
The ends of wood flitches that are used for making tops of violins can be measured for their ER profiles (fig. 30). The section of wood must be soaked in water for several hours and then the surface must be blotted. The smaller needles are used to penetrate the wood. The measurement should be made at intervals two-fifths of an inch (1 cm) from the cambial side inward.
The graph in figure 31 compares five ER patterns from five spruce flitches that were drying for many years. Note the great variation in ER patterns, espe- cially between sections 94 and 227. Three basic pat- terns exist: (1) very high ER readings, (2) intermedi- ate patterns, and (3) all low ER readings. Violins
made from wood samples 94 and 227 produced dis- tinctly different sound. More research is needed to determine which ER pattern is associated with wood that produces the best resonating instrument.
Figure 30—ER and violins. F533444
450-
350
150
Figure 29—Other types of electrodes. F533442
1 2 3 4 5 6 7 8 9 10 n 12 13 14 CM IN FROM CAMBIUM
ER OF FIVE REWET SPRUCE FLITCHES
Figure 31—ER patterns on spruce for violins. F533445
35
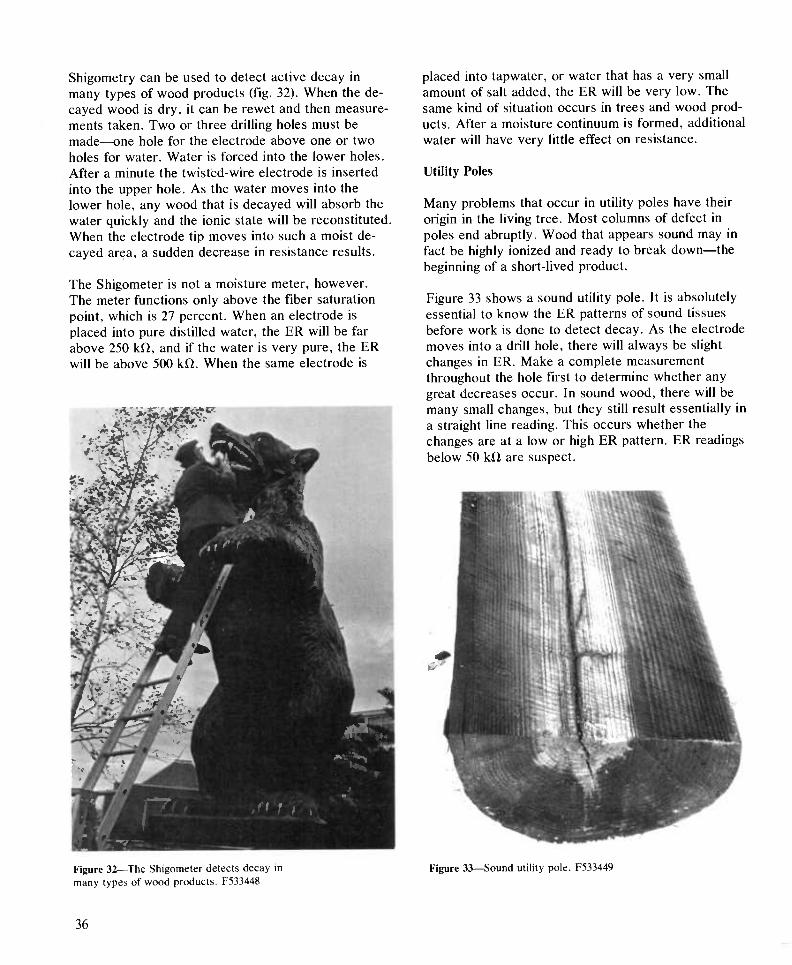
Shigometry can be used to detect active decay in many types of wood products (fig. 32). When the de- cayed wood is dry, it can be rewet and then measure- ments taken. Two or three drilling holes must be made—one hole for the electrode above one or two holes for water. Water is forced into the lower holes. After a minute the twisted-wire electrode is inserted into the upper hole. As the water moves into the lower hole, any wood that is decayed will absorb the water quickly and the ionic state will be reconstituted. When the electrode tip moves into such a moist de- cayed area, a sudden decrease in resistance results.
The Shigometer is not a moisture meter, however. The meter functions only above the fiber saturation point, which is 27 percent. When an electrode is placed into pure distilled water, the ER will be far above 250 kfl, and if the water is very pure, the ER will be above 500 kii. When the same electrode is
^
^R^R
ÉÉ ¿ï^s^^B^^B ̂̂ ^^^^^^^^1^
^làu Hy ^ ^^^F^^'k^ ^^Ê ^^^^^^^^^^^^1 ^^^^^HHB '''Ws^-''M ^-¿^^^^^^^k ̂ ^^^^^^^1 ^B
placed into tapwater, or water that has a very small amount of salt added, the ER will be very low. The same kind of situation occurs in trees and wood prod- ucts. After a moisture continuum is formed, additional water will have very little effect on resistance.
Utility Poles
Many problems that occur in utility poles have their origin in the living tree. Most columns of defect in poles end abruptly. Wood that appears sound may in fact be highly ionized and ready to break down—the beginning of a short-lived product.
Figure 33 shows a sound utility pole. It is absolutely essential to know the ER patterns of sound tissues before work is done to detect decay. As the electrode moves into a drill hole, there will always be slight changes in ER. Make a complete measurement throughout the hole first to determine whether any great decreases occur. In sound wood, there will be many small changes, but they still result essentially in a straight line reading. This occurs whether the changes are at a low or high ER pattern. ER readings below 50 kü are suspect.
Figure 32—The Shigometer detects decay in many types of wood products. F533448
Figure 33—Sound utility pole. F533449
36

The cross section in figure 34 siiows a utility pole with brownrot. Brownrot usually ends abruptly, but the wood far beyond the visual rot will be altered. The upper electrode is deep inside this pole, and the bowed tips are in sound-appearing wood directly in front of the decayed wood. The ER for this wood is 210 kil as shown on the meter to the left. The lower electrode is only a short distance into the pole. The tips of the electrode are in sound, well-preserved wood. The ER for this wood is beyond 500 kil, as shown on the meter to the right. Wood that appears sound but is moist and is highly ionized will have a
low ER reading and will soon decay. When such sound-appearing wood is examined from the incre- ment cores, it appears that the wood is really sound when it is actually in an early stage of decay. Industry has not learned to accept that wood does not go directly from sound to decayed. Even though the method can detect the early stages of decay, industry does not call it "decay" until the wood is visually broken down. Yet, treatment of poles in early stages of decay offers the best way to greatly increase the life of the pole.
Figure 34—Brownrot in a utility pole. F533450
37
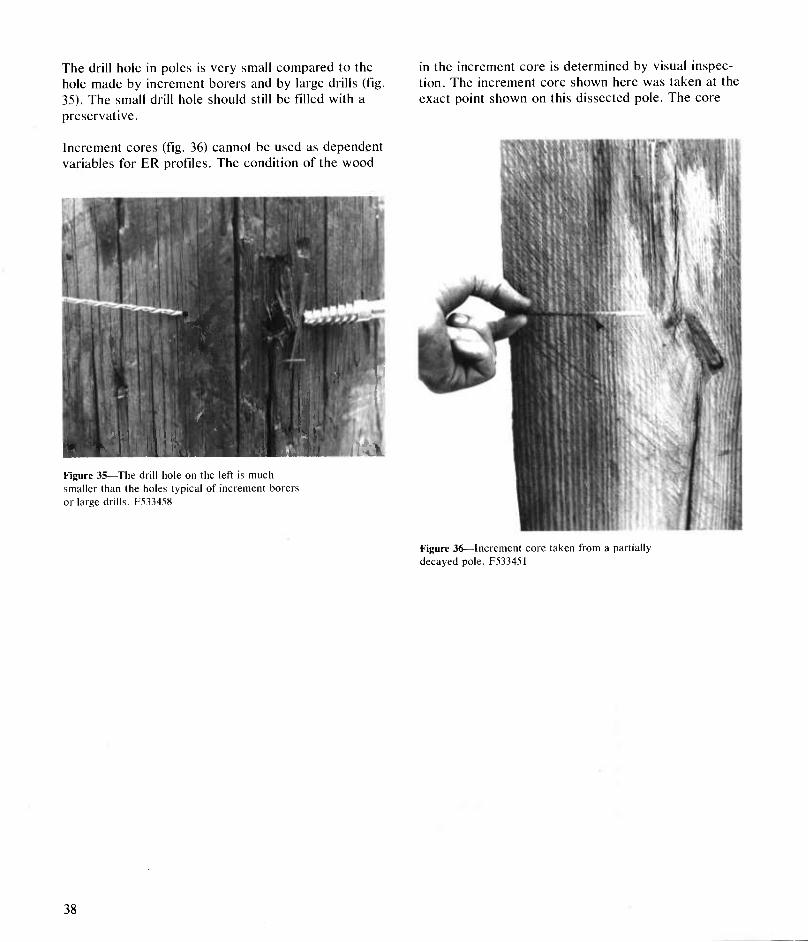
The drill hole in poles is very small compared to the hole made by increment borers and by large drills (t"ig. 35). The small drill hole should still be filled with a preservative.
Increment cores (fig. 36) cannot be used as dependent variables for ER profiles. The condition of the wood
X X .auM i íí<«JL
Figure 35—The drill hole on the left is much smaller than the holes typical of increment borers or large drills. F533458
in the increment core is determined by visual inspec- tion. The increment core shown here was taken at the exact point shown on this dissected pole. The core
Figure 36—Increment core taken from a partially decayed pole. F53345I
38
was only a few centimeters outside of the obvious column of decayed wood. The core appears perfectly sound. The profile of ER readings taken at the same point showed that wood was altered at the point shown by the arrow. When increment cores are used together with the Shigometer, there will always be confusion because the ER readings will seldom corre- late with the cores. Many studies with ER profiles have been done on dissections that showed where the column appeared to end, but the wood beyond was in an early stage of decay.
Early changes in wood condition can be detected with the needle electrodes. When the needles are pushed into such altered wood, a very low ER reading will result. When wood in utility poles is below 50 kiî, it is suspect. Pockets of rot in utility poles are usually 8 inches (20 cm) above ground level and 18 inches (45 cm) below groundline. When decay is active, moisture is above the fiber saturation point. When the needles go deep into the utility pole, the decayed condition is obvious.
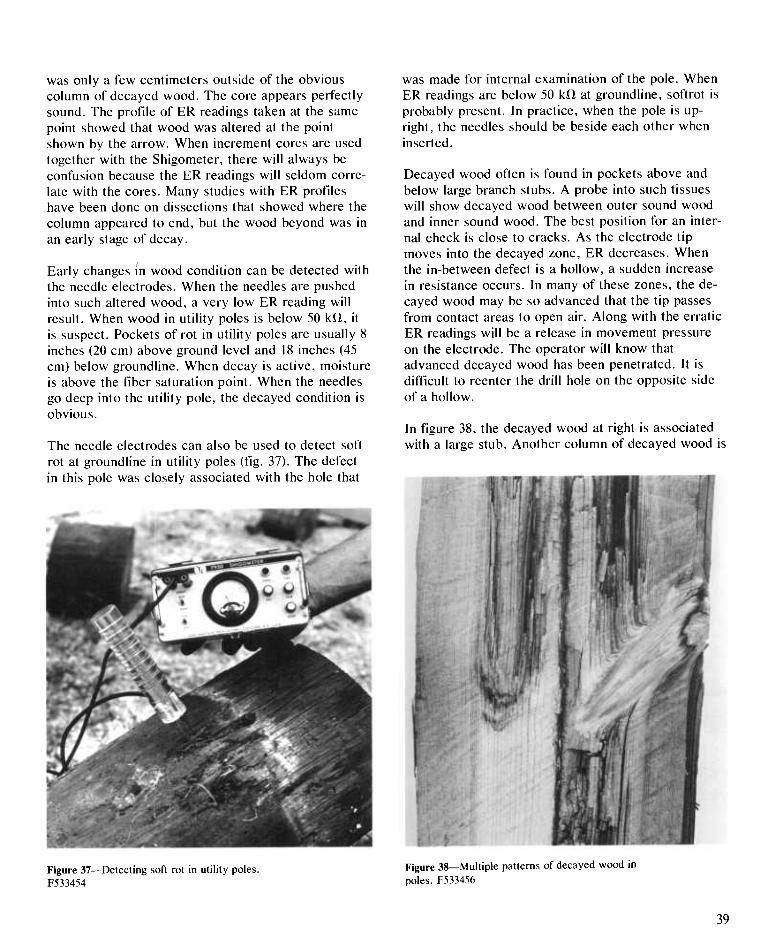
The needle electrodes can also be used to detect soft rot at groundline in utility poles (fig. 37). The defect in this pole was closely associated with the hole that
was made for internal examination of the pole. When ER readings are below 50 kiî at groundline, softrot is probably present. In practice, when the pole is up- right, the needles should be beside each other when inserted.
Decayed wood often is found in pockets above and below large branch stubs. A probe into such tissues will show decayed wood between outer sound wood and inner sound wood. The best position for an inter- nal check is close to cracks. As the electrode tip moves into the decayed zone, ER decreases. When the in-between defect is a hollow, a sudden increase in resistance occurs. In many of these zones, the de- cayed wood may be so advanced that the tip passes from contact areas to open air. Along with the erratic ER readings will be a release in movement pressure on the electrode. The operator will know that advanced decayed wood has been penetrated. It is difficult to reenter the drill hole on the opposite side of a hollow.
In figure 38, the decayed wood at right is associated with a large stub. Another column of decayed wood is
Figure 37- F533454
-Detecting soft rot in utility poles. Figure 38—Multiple patterns of decayed wood in poles. F533456
39
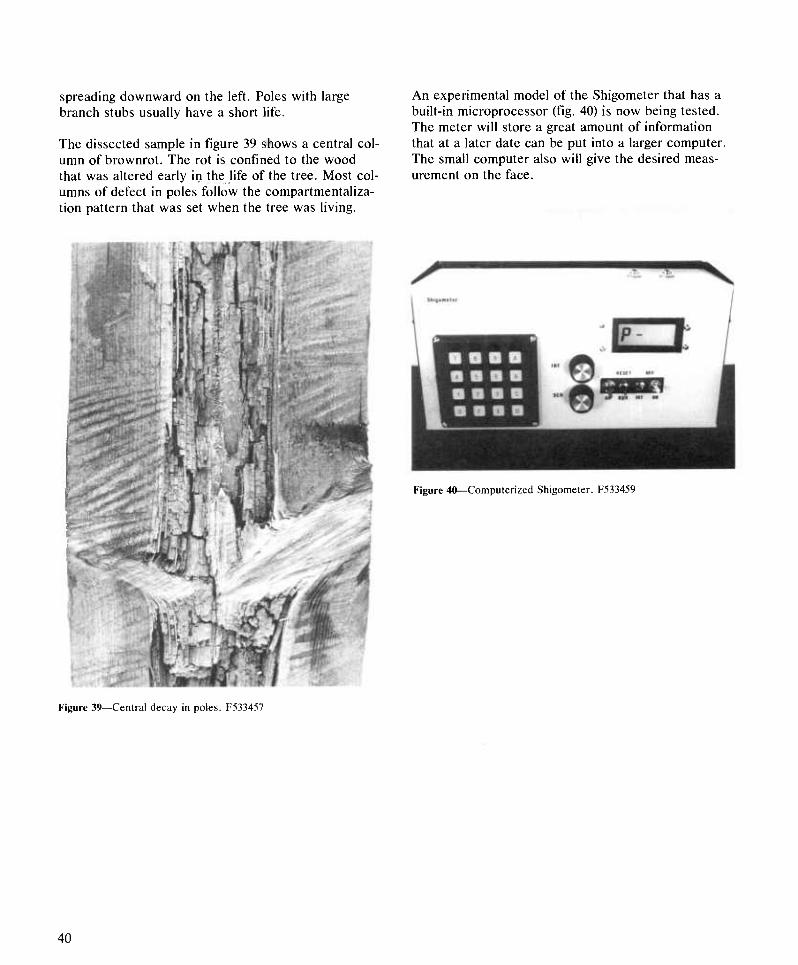
spreading downward on the left. Poles with large branch stubs usually have a short life.
The dissected sample in figure 39 shows a central col- umn of brownrot. The rot is confined to the wood that was altered early in the life of the tree. Most col- umns of defect in poles follow the compartmentaliza- tion pattern that was set when the tree was living.
An experimental model of the Shigometer that has a built-in microprocessor (fig. 40) is now being tested. The meter will store a great amount of information that at a later date can be put into a larger computer. The small computer also will give the desired meas- urement on the face.
Figure 40—Computerized Shigometer. F533459
Figure 39—Central decay in poles. F533457
40

ER Patterns
As the electrode tip moves into a sound tree, the ER readings increase (fig. 41).
Figure 42 illustrates the ER profile in altered wood. When the tips touch wood that has a higher concen- tration of moisture and ions, ER suddenly decreases. To determine the depth of the altered wood, as soon as ER decreases, hold the electrode by two fingers and pull it out of the pole. The length of the probe from your fingers to the bowed portion of the tips wil be the depth of sound wood.
DEPTH
Figure 41—ER patterns in sound wood.
DEPTH
Figure 42—ER patterns in altered wood.
41
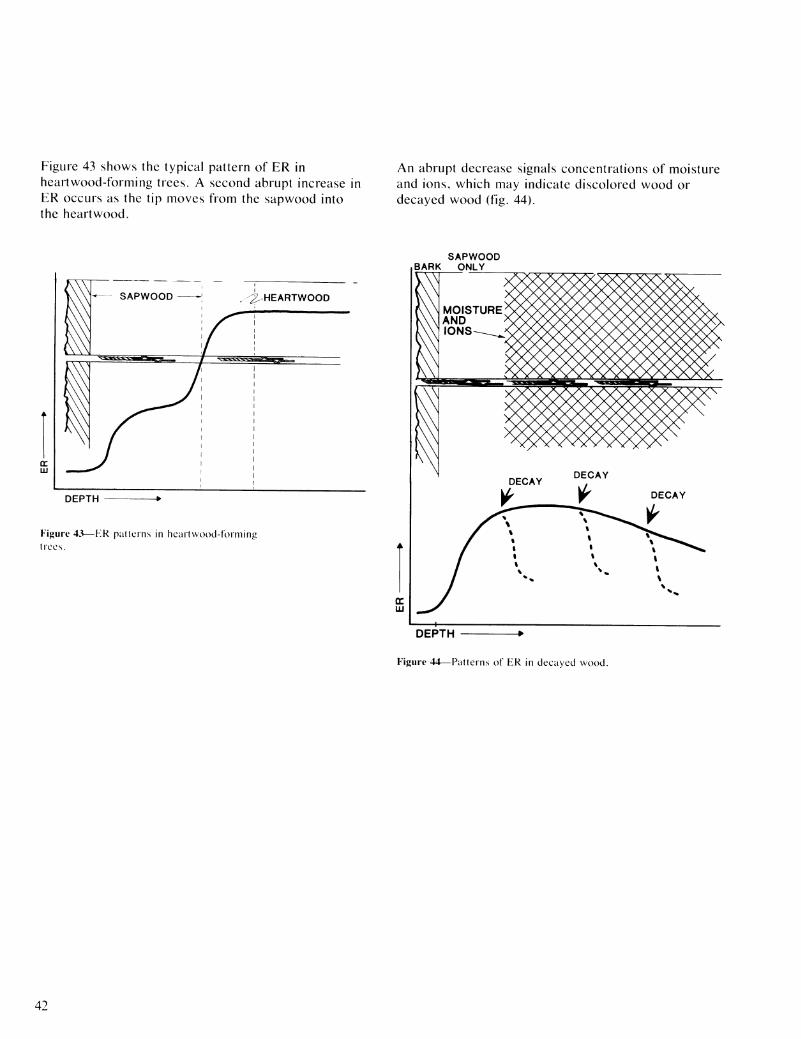
Figure 43 shows the typical pattern of ER in heartwood-forming trees. A second abrupt increase in ER occurs as the tip moves from the sapwood into the heart wood.
An abrupt decrease signals concentrations of moisture and ions, which may indicate discolored wood or decayed wood (fig. 44).
SAPWOOD BARK ONLY
DEPTH
Figure 43—HR patterns in heartwood-forming
DEPTH
Figure 44—Patterns of ER in decayed wood.
42
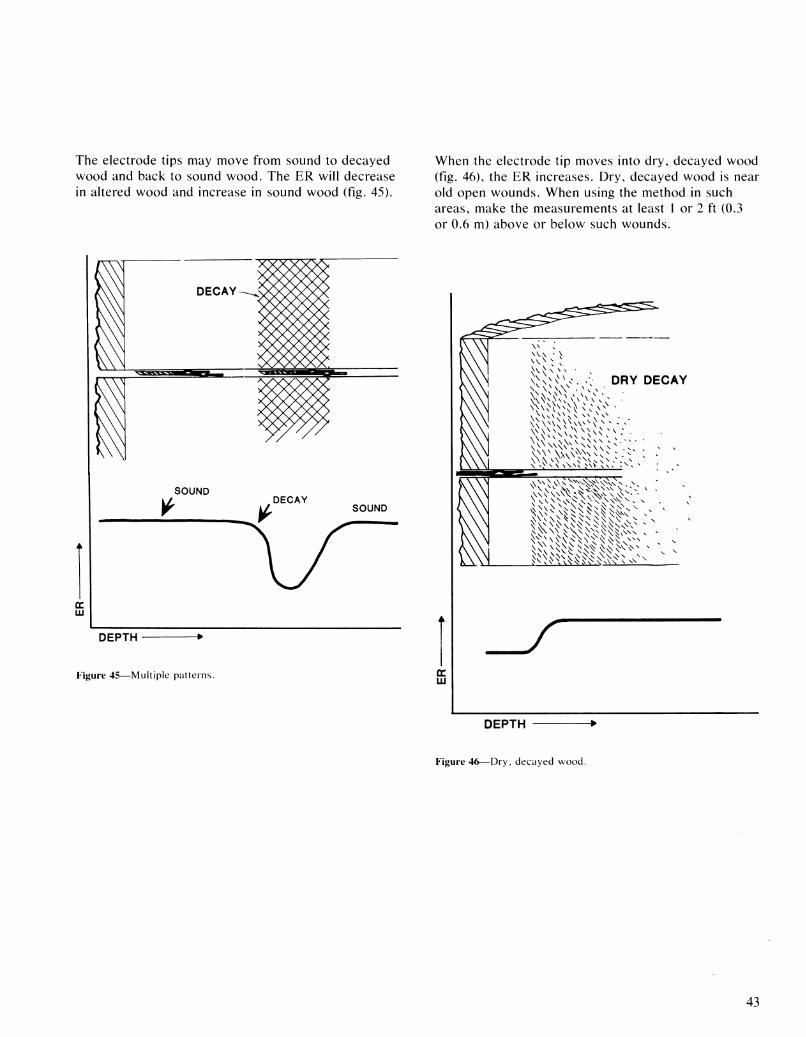
The electrode tips may move from sound to decayed wood and back to sound wood. The ER will decrease in altered wood and increase in sound wood (fig. 45).
When the electrode tip moves into dry, decayed wood (fig. 46), the ER increases. Dry, decayed wood is near old open wounds. When using the method in such areas, make the measurements at least 1 or 2 ft (0.3 or 0.6 m) above or below such wounds.
DEPTH
Figure 45—Multiple patterns.
. ^,- 0 V DRY DECAY
DEPTH
Figure 46—Dry, decayed wood.
43
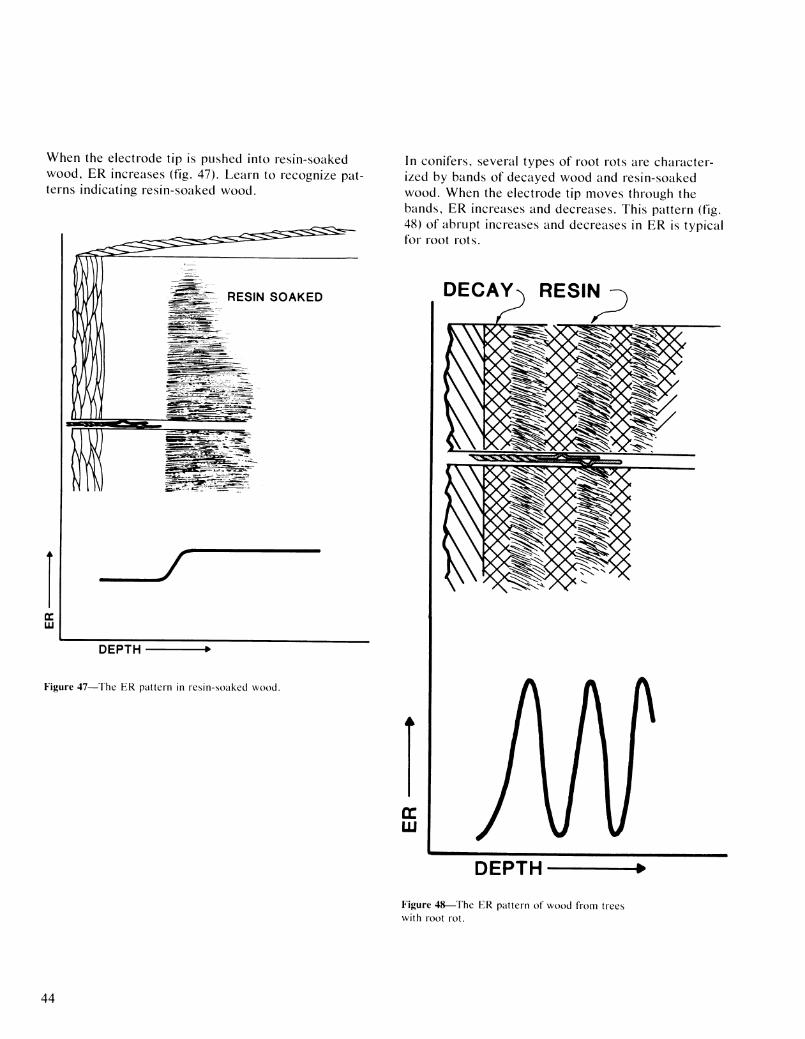
When the electrode tip is pushed into resin-soaked wood, ER increases (fig. 47). Learn to recognize pat- terns indicating resin-soaked wood.
LU
In conifers, several types of root rots are character- ized by bands of decayed wood and resin-soaked wood. When the electrode tip moves through the bands, ER increases and decreases. This pattern (fig. 48) of abrupt increases and decreases in ER is typical for root rots.
DECAY^ RESIN
/
DEPTH
Figure 47—The ER pattern in resin-soaked wood.
ÛC LU
DEPTH
Figure 48—The ER pattern of wood from trees with root rot.
44
Selected References
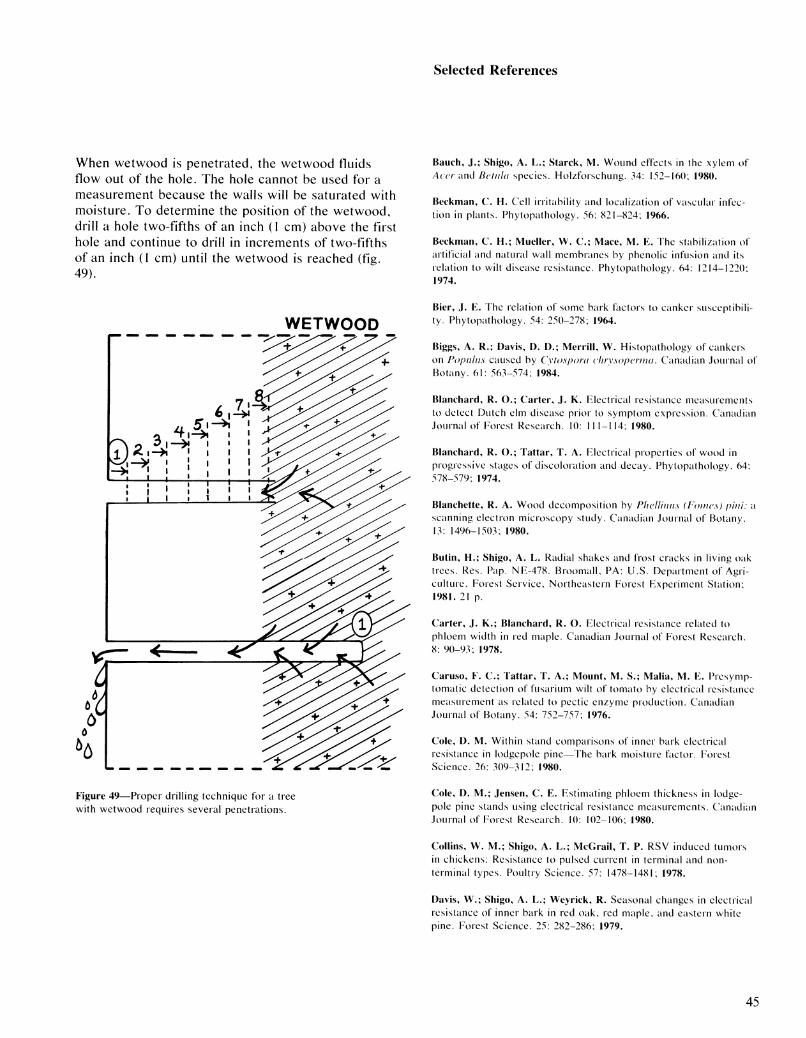
When wetwood is penetrated, the wetwood fluids flow out of the hole. The hole cannot be used for a measurement because the walls will be saturated with moisture. To determine the position of the wetwood, drill a hole two-fifths of an inch (1 cm) above the first hole and continue to drill in increments of two-fifths of an inch (1 cm) until the wetwood is reached (fig. 49).
Bauch, J.; Shigo, A. L.; Starck, M. Wound effects in the xylem of Acer dnd Bctula species. Holzforschung. 34: 152-160; 1980.
Beckman, C. H. Cell irritability and localization of vascular infec- tion in plants. Phytopathology. 56: 821-824; 1966.
Beckman, C. H.; Mueller, W. C; Mace, M. E. The stabilization of artificial and natural wall membranes by phenolic infusion and its relation to wilt disease resistance. Phytopathology. 64: 1214-1220; 1974.
WETWOOD
Figure 49—Proper drilling technique for a tree with wetwood requires several penetrations.
Bier, J. E. The relation of some bark factors to canker susceptibili- ty. Phytopathology. 54: 250-278; 1964.
Biggs, A. R.; Davis, D. D.; Merrill, W. Histopathology of cankers on Populus caused by Cytosponi chrysopcnnci. Canadian Journal of Botany. 61: 563-574; 1984.
Blanchard, R. O.; Carter, J. K. Electrical resistance measurements to detect Dutch elm disease prior to symptom expression. Canadian Journal of Forest Research. 10: 111-114; 1980.
Blanchard, R. O.; Tattar, T. A. Electrical properties of wood in progressive stages of discoloration and decay. Phytopathology. 64: 578-579; 1974.
Blanchette, R. A. Wood decomposition by Phcllinus (Fomes) pini: a scanning electron microscopy study. Canadian Journal of Botany. 13: 1496-1503; 1980.
Butin, H.; Shigo, A. L. Radial shakes and frost cracks in living oak trees. Res. Pap. NE-478. Broomall, PA: U.S. Department of Agri- culture, Forest Service, Northeastern Forest Experiment Station; 1981. 21 p.
Carter, J. K.; Blanchard, R. O. Electrical resistance related to phloem width in red maple. Canadian Journal of Forest Research. 8: 90-93; 1978.
Caruso, F. C; Tattar, T. A.; Mount, M. S.; Malia, M. E. Presymp- tomatic detection of fusarium wilt of tomato by electrical resistance measurement as related to pectic enzyme production. Canadian Journal of Botany. 54: 752-757; 1976.
Cole, D. M. Within stand comparisons of inner bark electrical resistance in lodgepole pine—The bark moisture factor. Forest Science. 26: 309-312; 1980.
Cole, D. M.; Jensen, C. E. Estimating phloem thickness in lodge- pole pine stands using electrical resistance measurements. Canadian Journal of Forest Research. 10: 102-106; 1980.
Collins, W. M.; Shigo, A. L.; McGrail, T. P. RSV induced tumors in chickens: Resistance to pulsed current in terminal and non- terminal types. Poultry Science. 57: 1478-1481; 1978.
Davis, W.; Shigo, A. L.; Weyrick, R. Seasonal changes in electrical resistance of inner bark in red oak, red maple, and eastern white pine. Forest Science. 25: 282-286; 1979.
45
Davis, W.; Shortle, W. C; Shigo, A. L. Potential hazard rating sys- tem for fir stands infested with budworm using cambial electrical resistance. Canadian Journal of Forest Research. 10: 541-544; 1980.
Dixon, M. A.; Thompson, R. G.; Fensom, D. S. Electrical resistance measurements of water potential in avocado and white spruce. Canadian Journal of Forest Research. 8: 73-80; 1978.
Farr, W. A.; Shaw, C. G., III. Initial testing of the Shigometer in healthy even-aged stands of western hemlock and sitka spruce in southeast Alaska. In: Jacobi, William R., comp. Proceedings of the 13th Annual Western International Forest Disease Work Confer- ence; 1982 September; Fallen Leaf Lake, CA. Fort Collins, CO: Colorado State University, Department of Botany and Plant Pathol- ogy; 1983: 15-22.
Ghosh, S. K.; Balasundaran, M.; Gnanaharan, R. Sandal spike diag- nosis by visual observation and by electrical resistance. A prelimi- nary study in the field. In: Proceedings of the 17th lUFRO World Congress, Japan 1981, Div. 2; 1981 September; Kyoto, Japan. Ibar- aki, Japan: Japanese lUFRO Congress Committee, Forestry and Forest Products Research Institute; 1982: 323-332.
Gotwols, T. A.; Blanchard, R. O.; Shortle, W. C. Some factors affecting canker formation in American beech inoculated with Ncctria coccinca viir. fa^inata. European Journal of Forest Pathol- ogy. 10: 365-370; 1980.
Gregory, R. A. Living elements of the conducting secondary xylem of sugar maple (Acer saccharum Marsh). International Association of Wood Anatomists Bulletin. 4: 65-69; 1978.
Hart, J. H. Morphological and chemical differences between sap- wood, discolored sapwood, and heartwood in black locust and Osage orange. Forest Science. 14: 334-338; 1968.
Inwards, R. D.; Ciraham, R. D. Comparing methods for inspecting Douglas-fir poles in service. In: Proceedings, American Wood Pre- servers Association. Annual Meeting; 1980 April 28-30; Nashville, TN. Bethesda, MD: American Wood Preservers Association; 1980. 5 p.
Leightley, L. E. The use of the Shigometer and Pilodyn as non- destructive test methods for detecting decay in CCA treated euca- lypt poles. In: Proceedings, The International Research Group on Wood Preservation. 12th Annual Meeting; 1981 May; Sarajevo, Yu- goslavia. Document No. IRG/WP/2153. Stockholm, Sweden: IRG Secretariat, Drottning Kristinas vag 47C, S-114 28; 1981. 23 p.
Malia, M. E.; Tattar, T. A. Electrical resistance, physical charac- teristics, and cation concentrations in xylem of sugar maple infected with Vcrtkillium dahliae. Canadian Journal of Forest Re- search. 8: 322-327; 1978.
Martin, B. Verfahren zur diagnose von Stammfäulen an Fichte (un- ter besonderer Berücksichtigung des Verfahrens Nach Shigo). Insti- tut für Waldarbeit und Forstmaschinenkunde der Universität Göt- tingen. Göttingen, West Germany: University of Göttingen; Ph.D. dissertation.
McGinnes, E. A., Jr. Response of black walnut to environmental mishap. In: Proceedings, 66th Annual Report of the Northern Nut Growers Association; 1975.
McGinnes, E. A., Jr.; Shigo, A. L. Electronic technique for detect- ing discoloration, decay, and injury-associated ring shake in black walnut. Forest Products Journal. 25: 30-32; 1975.
McLean, D. A. The assessment of wildlife damage on a prescribed burning experiment in a blackbutt {E. piliiUiris) forest. For. Comm. Rep. Proj. 435. Sydney, Australia: Forestry Commission of New South Wales; 1980. 14 p.
Mercer, P. C. Three-dimensional mapping of stain and decay col- umns in trees. Annals of Applied Biology. 91: 107-112; 1979.
Mercer, P. C. The detection of decay in trees with particular refer- ence to the use of the Shigometer. Arboric. Res. Note. 1980. Wrec- clesham Near Farnham, Surrey, UK: DOE Arboricultural Advisory and Information Service; 1980. 3 p.
Merrill, W.; Shigo, A. L. An expanded concept of tree decay. Phy- topathology. 69: 1158-1160; 1979.
Kaplan, D. T.; Tattar, T. A.; Rohde, R. A. Reduction of electrical resistance in sunflower roots infected with lesion nematodes. Phy- topathology. 66: 1262-1264; 1976.
Miller-Jones, D. N.; Houston, D. R.; Preece, T. F. The use of elec- trical resistance measurements to detect watermark disease of cricket bat willow. Plant Disease Reporter. 61: 268-272; 1977.
Kile, J. A.; Kellas, J. D.; Jarrett, R. G. Factors influencing electri- cal resistance in stems oí Eucalyptus obliqua, E. glohulus subsp. hicostata and E. viminalis. Australian Forestry. 12: 129-138; 1983.
Kile, J. A.; Kellas, J. D.; Jarrett, R. G. Electrical resistance in rela- tion to crown dieback symptoms. Armillaria infection and growth in Eucalyptus obliqua and E. globulus sub. sp. bicostata. Australian Forestry. 12: 139-149; 1983.
Moore, G.; Blaze, K. The electrical assessment of plant health and injury. In: Proceedings from green fingers to electronic sensors; 1982 Oct 14; Melbourne, Australia. Hawthorn, Australia; Theatretta at State College; 1982. 8 p.
Mulhern, J.; Shortle, W. C.; Shigo, A. L. Barrier zones in red maple: an optical and scanning microscope examination. Forest Science. 25: 311-316; 1979.
Kostka, S. J.; Sherald, J. L. An evaluation of electrical resistance as a measure of vigor in eastern white pine. Canadian Journal of Forest Research. 12: 463-467; 1982.
Mulhern, J. E.; Stavish, B. M.; Witkowski, S. L.; Shortle, W. C.; Shigo, A. L. Voltage changes along geranium petioles after leaf blade excision. Journal of Experimental Botany. 32: 573-579; 1981.
LaMadeleine, L. A. Estimating color and grade in black cherry and northern red oak veneer by electrical resistance to a pulsed current. Plywood and Panelling. 1979 August: 3 p.
Newbanks, D. The relationships between electrical resistance of cambial tissues oí Acer saccharum and physiological stress. Am- herst, MA: University of Massachusetts; 1976. 59 p. M.S. thesis.
46
Newbanks, D.; Tattar, T. A. The relationship between electrical resistance and severity ot decline symptoms in Acer saccluirmu. Canadian Journal of Forest Research. 7: 469-475; 1977.
Otjeb, L.; Blanchette, R. A. Patterns of decay caused by inonotus dryophilus (Aphyllophorales: Hymenochaetaceae), a white pocket rot fungus of oaks. Canadian Journal of Botany. 60: 2770-2779; 1982.
Pearce, R. B.; Rutherford, J. A wound associated suberized barrier to the spread of decay in sapwood of oak {Quercus rohiir L.) Phys- iological Plant Pathology. 19: 359-369; 1981.
Phelps, J. E.; McGinnes, A. E.; J-Y Lieu, P. Anatomy of xylem tis- sue formation associated with radial seams and cracks in black oak. Wood Science. 8: 397-405; 1975.
Piirto, D.; Wilcox, W. W. Critical evaluation of the pulsed current resistance meter for detection of decay in wood. Forest Products Journal. 28: 52-57; 1978.
Santamour, F. S. Seasonal variation in cambial electrical resistance in juvenile green ash from different provenances. Journal of Arbori- culture. 8: 100-103; 1982.
Schmitt, D.; Garrett, P. W.; Shigo, A. L. Decay resistant hard- woods? You bet! Northern Logger & Timber Processor. 27: 20-23; 1978.
Shain, L. Dynamic responses of differentiated sapwood to injury and infection. Phytopathology. 69: 1143-1147; 1979.
Shigo, A. L. Successions of microorganisms in discoloration and de- cay of wood. International Review of Forestry Research. 2: 237- 299; 1967.
Shigo, A. L. Tree decay: an expanded concept. Agrie. Inf. Bull. 419. Washington, DC: U.S. Department of Agriculture; 1979. 73 p.
Shigo, A. L.; Berry, P. A new tool for detection of decay associated with Ionics cinnosus in Finns resinosa. Plant Disease Reporter. 59: 739-742; 1975.
Shigo, A. L.; Hillis, W. E. Heart wood, discolored wood, and micro- organisms in living trees. Annual Review of Phytopathology. 11: 197-222; 1973.
Shigo, A. L.; Marx, H. G. Compartmentalization of decay in trees. Agrie. Inf. Bull. 405. Washington, DC: U.S. Department of Agricul- ture; 1977. 73 p.
Shigo, A. L.; Shigo, A. Detection of discoloration and decay in liv- ing trees <ind utility poles. Res. Pap. NEl-294. Upper Darby, PA: U.S. Department of Agriculture, Forest Service, Northeastern For- est Fxperiment Station; 1974. II p.
Shigo, A. L.; Shortle, W. C. Compartmentalization of discolored wood in heartwood of red oak. Phytopathology. 69: 710-711; 1979.
Shigo, A. L.; Shortle, W. C; Ochrymowych, J. Detection of active decay at groundline in utility poles. Gen. Tech. Rep. NF-35. Upper Darby, PA: U.S. Department of Agriculture, Forest Service, North- eastern Forest Fxperiment Station; 1977. 26 p.
Shortle, W. C. Compartmentalization of decay in red maple and hybrid poplar trees. Phytopathology. 69: 410-413; 1979.
Shortle, W. C. Detection of decay in trees. Journal of Arboricul- ture. 5: 226-232; 1979.
Shortle, W. C. Mechanisms of compartmentalization of decay in liv- ing trees. Phytopathology. 69: II47-II5I; 1979.
Shortle, W. C. Decaying Douglas-fir wood: ionization associated with resistance to a pulsed electric current. Wood Science. 15: 29- 32; 1982.
Shortle, W. C.; Abusamra, J.; Laing, F. M.; Morrelli, M. F. Flectri- cal resistance as a guide to thinning sugar maples. Canadian Journal of Forest Research. 9: 436-437; 1979.
Shortle, W. C; Shigo, A. L.; Berry, P.; Abusamra, J. Flectrical re- sistance in tree cambium zone: relationship to rate of growth and wound closure. Forest Science. 23: 326-329; 1977.
Shortle, W. C; Shigo, A. L.; Ochrymowych, J. Patterns of resis- tance to a pulsed electric current in sound and decayed utility poles. Forest Products Journal. 28: 48-51; 1978.
Skutt, H. R.; Shigo, A. L.; Lessard, R. A. Detection of discolored and decayed wood in living trees using a pulsed electric current. Canadian Journal of Forest Research. 2: 54-56; 1972.
Smith, D. ¥.. Abnormal wood formation following fall and spring injuries in black walnut. Wood Science. 12: 243-251; 1980.
Smith, D. E.; Shigo, A. L.; Safford, L. ().; Blanchard, R. O. Resis tance to a pulsed electric current reveal differences between non- released, released, and released-fertilized paper birch trees. Forest Science. 22: 471-472; 1976.
Sylvia, D. M.; Tattar, T. A. Flectrical resistance properties of tree tissues in cankers incited by Endothia parnsiiica and Ncctria í>ülli¡^cna. Canadian Journal of Forest Research. 8: 162-167; 1978.
Tattar, T. A. Measurement of electrical current in clear, discolored, and decayed wood from living trees. Phytopathology. 64: 1375- 1376; 1974.
Tattar, T. A. Use of electrical resistance to detect verticillium wilt in Norway and sugar maple. Canadian Journal of Forest Research. 6: 499-503; 1976.
Tattar, T. A.; Blanchard, R. O. Flectrophysiological research in plant pathology. Annual Reveiw of Phytopathology. 14: 309-325; 1976.
47
Tattar, T. A.; Blanchard, R. O. Flectrical techniques for disease diagnosis. Journal of Arboriculture 3: 21-24; 1977.
Tattar, T. A.; Blanchard, R. O.; Saufley, G. C. Relationship between the electrical resistance and capacitance of wood in pro- gressive stages of discoloration and decay. Journal of Experimental Botany. 25: 658-662; 1974.
Tattar, T. A.; Saufley, G. C. Comparison of electrical resistance and impedance measurement in wood in progressive stages of dis- coloration and decay. Canadian Journal of Forest Research. 3: 593-
595; 1973.
Tattar, T. A.; Shigo, A. L.; Chase, T. Relationship between the degree of resistance to a pulsed electric current and wood in pro- gressive stages of discoloration and decay in living trees. Canadian Journal of Forest Research. 2: 236-242; 1972.
Thornton, J. D. Detection of decay in wood using a pulsed current resistance meter (Shigometer). \. Laboratory tests of the progres- sion of decay of Finns racliata D. Don sapwood by Poria monticola Murr, and Fomcs lividus (Kalch). Material und Organismen. (Berlin) 14: 15-26; 1979.
Thornton, J. D. Detection of decay in wood using a pulsed current resistance meter (Shigometer). II. Laboratory tests of the progres- sion of decay of/:>Ví^/Y/ costulaía HK../'. by Gloeophyllum traheiim (Pers. ex. Fr.) Murr. Material und Organismen. 14: 193-204; 1979.
Ward, J. C; Kozlik, C. J. Kiln drying sinker heartwood from young growth western hemlocks: preliminary evaluation. In: Pro- ceedings of Western Dry Kiln Clubs: 26th Annual Meeting; 1975 May 1-2; Corvallis, OR. Redding, CA: Central California Dry Kiln
Club; 1975: 44-63.
Ward, J. C; Pong, W. Y. Wetwood in trees: a timber resource problem. Gen. Tech. Rep. PNW-112. Portland, OR: U.S. Depart- ment of Agriculture, Forest Service, Pacific Northwest Forest and Range Experiment Station; 1980. 56 p.
Wargo, P. M. Wound closure in sugar maple: adverse effects of defoliation. Canadian Journal of Forest Research. 7: 410-414; 1977.
Wargo, P. M.; Skutt, H. R. Resistance to pulsed electrical current: an indicator of stress in forest trees. Canadian Journal of Forest Research. 5: 557-561; 1975.
Wilkes, J. Stem decay in deciduous hardwoods—an overview. Australian Forestry. 45: 42-50; 1981.
Wilkes, J.; Heather, W. A. The association of wood properties and resistance to a pulsed electric current in tallowwood. Australian Forest Research. 12: 55-62; 1982.
Wilkes, J.; Heather, W. A. Detection of decay with a pulsed current resistance meter and radial variation in some wood properties in tallowwood. Australian Forest Research. 12: 63-70; 1982.
Wilson, P. J.; Allen, J. D.; Walker, J. C. F. Appraisal of the Shi- gometer technique. New Zealand Journal of Forest Science. 12: 86- 95; 1982.
Zabel, R. A.; Wang, C. J. K., Terracina, F. C. The fungal associ- ates, detection, and fumigant control of decay in treated southern pine poles. Final Rep. FL-2768, Res. Proj. 1471-1. Palo Alto, CA: Electric Power Institute, Research Reports Center; 1982. 104 p.
us Government Printing Office: 1986-479-437
48