cooperation of charges in photosynthetic o2 … publications/historical... · cooperation of...
TRANSCRIPT

Phuruthrmisrrv und Photobiolugy. 1970. Vol. 1 I , pp. 457-475. Pcrgamon Press. Printed in Great Britain
COOPERATION OF CHARGES IN PHOTOSYNTHETIC 0,
A LINEAR FOUR STEP MECHANISM EVOLUTION - I.
BESSEL KOK, BLISS FORBUSH and MARION McGLOlN Research Institute for Advanced Studies, 1450 South Rolling Road, Baltimore, Md. 2 1227, U.S.A.
(Received I9 September 1969; in revised form 29 December 1969)
Abstract- Using isolated chloroplasts and techniques as described by Joliot and Joliot [6] we studied the evolution of 0, in weak light and light flashes to analyze the interactions between light induced 0, precursors and their decay in darkness. The following observations and con- clusions are reported: 1. Light flashes always produce the same number of oxidizing equivalents either as precursor or as 02. 2. The number of unstable precursor equivalents present during steady state photosynthesis is = 1.2 per photochemical trapping center. 3. The cooperation of the four photochemically formed oxidizing equivalents occurs essentially in the individual reac- tion centers and the final 0, evolution step is a one quantum process. 4. The data are compatible with a linear four step mechanism in which a trapping center, or an associated catalyst, (S) successively accumulates four + charges. The S4+ state produces O2 and returns to the ground state S,,. 5. Besides So also the first oxidized state S+ is stable in the dark, the two higher states, S p + and S3+ are not. 6. The relaxation times of some of the photooxidation steps were estimated. The fastest reaction, presumably S: + S,, has a (first) half time < 200 psec. The S: state and probably also the SJ state are processed somewhat more slowly (- 300-400 psec).
INTRODUCTION
ALLEN and Franck [ 13 noticed that in darkness the photosynthetic apparatus looses its ability to produce 0, in a single flash, an observation which was confirmed e.g. by Whittingham and Bishop[2]. More recently, with the aid of refined polarographic techniques, Joliot and coworkers [3-51 analyzed this 'deactivation' of the 0, evolving process in greater detail and realized that the phenomena reflect the cooperation in 0, evolution of photochemically produced intermediates of limited stability. This paper reports additional observations concerning this process and offers a kinetic model for the mechanism of charge cooperation.
METHODS AND MATERIALS
The experiments were performed with chloroplasts isolated from green house grown spinach. Flash yields and rates of 0, evolution were measured at room tempera- ture (20°-25"C) with the modulated polarograph technique described by Joliot and Joliot[6]. Both flowing media contained 0.1 M KCI in phosphate buffer pH 7-5; the flow medium adjacent to the chloroplast suspension in addition contained M NADP. Chloroplast samples were diluted to 0.2 mg Chl/ml from a stock suspension in 0.4 M sucrose tris buffer pH 7.65 which was stored in a darkened ice bucket during 1-5 hr after its preparation. Enrichment of the chloroplast suspension with ferredoxin was required only if rates were to be measured in intensities higher than the ones used regularly. After being placed on the electrode and allowed to settle in darkness (- 10 min) a sample was used during some 30 min, then replaced by a fresh one. With each fresh, dark adapted sample, an activation rate transient was recorded (see below) which served as a standard curve used to normalize subsequent observations with
457

45 8 BESSEL KOK, BLISS FORBUSH and MARION McGLOlN
the sample. Observations made with one sample or with consecutive ones were re- producible within & 5-10 per cent. We noticed, however, a significant seasonal varia- tion of the stability and behavior of the individual chloroplast preparations.
For rate measurements we generally used a modulated detecting beam of long wavelength (A 3 700nm) to insure oxidation of Q and A and optimal performance of system 11 [3]. The light modulating rotating disc was synchronized with the external address advance of a Fabri-Tek 1052 signal averager. With a modulating frequency of - 50 cycles optimal time resolution was 2 10 msec, each 10 msec address stored one half cycle of the rectified signal and the entire time sweep lasted 10 sec. In order to view slower phenomena also, the signal could in addition be fed to a chart recorder (0.5 sec time resolution).
The shutter which admitted the modulated detecting beam was opened electro- mechanically (within 2 msec) during a preselected dark period of the modulated beam so that the subsequent light period could be measured. In addition to the modulated beam, the discharge of two Xenon flash lamps (E.G. and G . FX 6), mounted in high aperture reflectors, were focussed on the sample. For each lamp a set of capacitors was available, the one selected was charged to 800 V and discharged through the flash lamp at a selected moment. The flash energies, obtained with the various capacitors, were compared by means of a thermopile and the capacitance values were calibrated in terms of relative light emission. This calibration in terms of ‘effective capacitance’ thus accounted for deviations from the nominal C values as well as from the E = 3 CV2 relation. Initially our optical arrangement required the use of 1-2 p F discharge capacitors to obtain saturation of the flash yields (expts. Figs. 3, 5 , 8 ) . Later improve- ments allowed a more homogeneous illumination of the sample and the use of much smaller C values. Flash yields of 0, were measured in relative units as described in [61, the flash induced signals being rectified and read on a D.C. recorder. The elec- tronic circuitry, included provisions for programmed triggering of flashes and admission or removal of the measuring beam.
RESULTS
I . Rate transients after deactivation, concentration of labile 0, precursors Figures I and 2 illustrate the phenomena we are dealing with. Since most of these
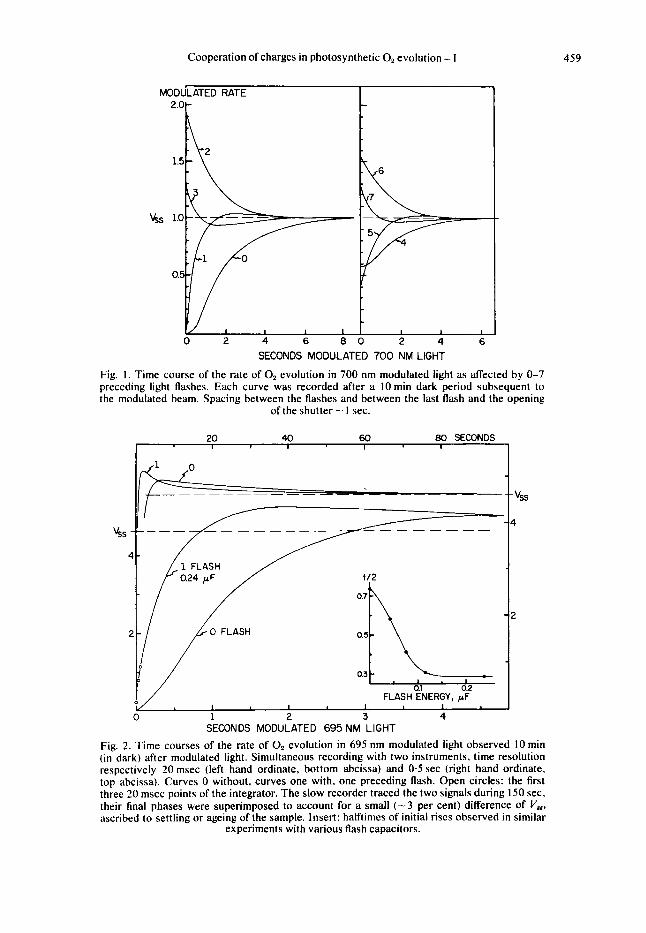
were earlier described by Joliot et al. [4,5] a brief enumeration of the more pertinent or novel aspects might suffice. Plotted in these figures is the modulated rate ( V ) of 0, evolution induced by a long wave modulated light admitted at zero time. The in- tensity of the light was within the linear range of the rate vs. intensity curve. After exposure to the weak beam the sample was kept in the dark for 10 min. This darktime sufficed to achieve complete loss of 0, evolution ability. Before readmitting the modulated beam and recording the rate, the sample was preilluminated with 0, I or more light flashes.
Without a preilluminating flash (curve 0) the initial 0, rate (V i ) is zero, subsequently the rate increases, following an S shaped time course towards the steady state rate Vss. Without deactivation the initial rate Vi would have been identical to V,, and thus the area bounded by the rate transient after 10 min dark (A,,), reflects the total induction loss: the number of absorbed quanta which have not resulted in 0,. Repeating the 0 flash experiment with a higher or lower intensity results in proportionally faster or slower transients which, however, bound the same area in terms of quantum deficit.
Cooperation of charges in photosynthetic 0, evolution - 1 459
SECONDS MODULATED 700 NM LIGHT
Fig. I . Time course of the rate of 0, evolution in 700 nm modulated light as affected by 0-7 preceding light flashes. Each curve was recorded after a IOmin dark period subsequent to the modulated beam. Spacing between the flashes and between the last flash and the opening
of the shutter - 1 sec.
20 40 60 80 SECONDS
I I 1 I I I
0 1 2 3 4 SECONDS MODULATED 695 NM LIGHT
Fig. 2. Time courses of the rate of 0, evolution in 695 nm modulated light observed 10 min (in dark) after modulated light. Simultaneous recording with two instruments, time resolution respectively 20 msec (left hand ordinate, bottom abcissa) and 0.5 sec (right hand ordinate, top abcissa). Curves 0 without, curves one with, one preceding flash. Open circles: the first three 20 msec points of the integrator. The slow recorder traced the two signals during 150 sec, their final phases were superimposed to account for a small ( - 3 per cent) difference of V,, ascribed to settling or ageing of the sample. Insert: halftimes of initial rises observed in similar
experiments with various flash capacitors.

460 BESSEL KOK, BLISS FORBUSH and MARION McGLOlN
This I X t relation and the assumption of constant quantum efficiency imply that quanta are not really lost, but used to fill a finite pool of photochemical intermediates. These intermediates are presumably precursor( s) of molecular 0, which are unstable and disappear in darkness. The area (A,) bounded between V,, and curve 0 thus reflects the number of these unstable procursor molecules which are present during steady state photosynthesis.
The second transient shown in Figs. 1 and 2 was a repeat of the previous one, except that the modulated light was preceded by a single light Aash. In this case the rate, initially quite low, rises rapidly and shows a small overshoot before slowly at- taining the steady state. A similar but slower overshoot occurs in the transient after 0 flashes (Fig. 2) and such secondary oscillations can be noticed in nearly all rate trans- ients. As far as we can judge, from transients after 1 flash, where the effect is analyzed most easily, also these secondary oscillations occur more rapidly in stronger light, and the rate transients follow the I X t relation throughout. The amplitude of these oscillations varies (5-15 per cent of V,,), their long duration complicates the measure- ments (demanding an additional rate recording) and introduces large uncertainties in the area computations, because in this time range the rate is affected by unrelated phenomena such as readjustment of the system I1 acceptor pool.
Our evaluation of the 0 and 1 flash transients (see also section 7), indicated that one flash removed most (a 80 per cent) of the deficit area (Ao), i.e. filled most of the steady state precursor pool. If one assumes that one flash hits all trapping centers in the system once, one estimates that the deficit area (A,) amounts to - 1 equivalent/trap.
2. 0, evolution, a four step process The third rate transient, in Fig. 1 (left, curve 2) was seen if two flashes preceded
the modulated beam. Now the rate initially exceeds the steady state - two-fold and the transient bounds an excess rather than a deficit area. Evidently two flashes produce an excess of precursor equivalents which is correlated with an enhanced rate.
After three preceding flashes (left, curve 3) the rate again initially exceeds the steady state rate (V,/V,, = 1-04-1.3), but now drops rapidly below this level and then slowly returns to it. The transient bounds a small net deficit area. Four preilluminating flashes (right, curve 4) yield a curve which resembles the ‘zero’ transient, except for the fact that the initial rate is about half V8#. The initial slope is zero, the rise curve is S shaped, approaches the steady state rate slowly, and bounds a deficit area - 0-5 A,,. Similarly, the transient after five flashes resembles the one after flash ( I ) : a rapid rise towards the steady state, which starts however, at V, = 0.5 V,, and bounds a small area. Six flashes induce a transient similar to the one induced by 2, 7 a pattern like the one in- duced by 3, etc. After additional flashes these four types of rate transients are repeated with decreasing amplitude until after three to four cycles steady state conditions are approached ( V , = V88,A = 0).
Figure 3, computed from transients as shown in Fig. 1 shows the variation of the initial rate ( V J and of the activated area (A) with the number of preceding flashes. Although generally a high initial rate correlates with a high level of the precursor pool, the two quantities, which both reveal a cycle of four, are not proportional and their oscillations are out of phase.
If one plots the relation between rate and area one finds four patterns, one induced by 0, 4, 8, 12 flashes, another by 1, 5, 9, 13 flashes, etc. We assume that these four

Cooperation of charges in photosynthetic O2 evolution- I 46 1
ACTIVATED AREA INITIAL RATE - - -c-
- 1.4
Steady state rate or level
- 0.8
\\ ! - 0.6 04 - v - 0.4
1 I I I I I I I I
2 4 6 8 10 12 14 16 18 NO. OF PRECEDING FLASHES
Fig. 3. Dots (left ordinate): initial rate V, as a function of the number of preceding flashes, spaced I sec apart. Pretreatment 10 min dark after weak light. Squares (right ordinate): relative areas bounded by the same rate transients as used for computing V,, normalized to the area bounded by the 0 flash transient. In this experiment and that of Fig. 5 the illumination system
required the use of a 2 pF discharge capacitor to obtain saturation (see Methods).
different patterns reflect the fact that liberation of an 0, molecule requires the coopera- tion of four oxidizing equivalents, generated by four excitations of system 11.
Apparently, in a sequence of light flashes there occurs a large fluctuation of the relative concentration of the intermediate oxidation states.
3 . 0 , liberated in a one quantum step, independent reaction chains The preceding data show that, depending upon its pretreatment, the system can
attain different states in which a greater or lesser fraction of quanta arriving in the trapping centers are able to evolve 0,. An important question is whether or not these specific states are recognized in the same fashion by weak and by strong light: In a bright flash all trapping centers are hit simultaneously, in weak light quanta arrive randomly and infrequently in the different centers. If, for instance, a collaboration between unstable photoproducts (such as T* + T* + O,, T* /ia, T) were involved, the relative yield of 0, produced by a flash (denoted Y) could differ greatly from the relative efficiency with which 0, is evolved by the first quanta of a weak beam admitted to a comparable state of the system. On the other hand, if in the final 0, evolving step each quantum acted by itself, the flash yield (Y) and the initial rate in weak light ( Vi) would reflect the same number of ‘ready’ centers and thus should be proportional.
For the plot of Fig. 4 we used experiments as shown in Fig. 1, and computed for each transient the initial rate, expressed as the ratio Vi/V,,. In parallel experiments we gave a sequence of flashes (spacing 1 sec), 10 min after an exposure to the mod- ulated beam. The steady state flash yield Y,, was determined either as the average value of e.g. the 10-20th flash, or the flash yield observed on a background of the modulated light - which yielded the same results as long as A > 700nm was used to eliminate interference through acceptor (A ) pool adjustments. Otherwise Y,, and V,, were normalized.

462 BESSEL KOK, BLISS FORBUSH and MARION McGLOlN
vi 4 s Fig. 4. Plot of the initial rate V , observed after flash (n) vs. the yield of flash (n + 1). All observa- tions preceded by 10 min darkness following weak light. Spacing between flashes and between flash n and admission of the -700nm beam 1 sec. Ditferent symbols represent ditferent
experiments.
In Fig. 4 we plotted the value of Vi after the flash ( n ) : ( V i n ) vs. the yield of flash
The plot indicates a linear relation between flash yield and initial quantum efficiency, apparently both quantities reflect the number of trapping centers which, upon excita- tion yield molecular 02. Although, as will be mentioned in a later paper[7] under some conditions this linearity may not quite hold, we conclude that the final 0, evolution step is essentially a one quantum process.
The data of Table 1 suggest that not only in the final step but also in the intermediate ones the trapping centers operate independently of each other.
( n + 1) : (Yn+l).
Table I . Effect of inhibition of system I 1 upon oscillation of flashyield
Control 10 min 20 min 3.10-'M Manganese U.V. U.V. DCMU extracted
US* 1 00 47 1 1 12 40 Y2l y , 26 23 25 13 26 Y,/Y, 195 219 220 210 240 Y,/Y,, 121 131 130 140 110 YS/ Y*# 47 58 60 - 37
Aliquots from a chloroplast preparation were irradiated with a germi- cidal lamp, provided with DCMU or extracted so as to remove part of the bound Mn[8]. Samples were placed on the electrode and after 10min darkness exposed to a series of twenty flashes given at 1 sec intervals. The top line shows for each sample the value of Y,, the constant flash yield observed in the latter half of the sequence, expressed as a percentage of the control value. Lower lines show the relative yields of the first five flashes, Y , was negligible in all cases.

Cooperation of charges in photosynthetic 0, evolution- I 463
In these experiments we used three different methods to specifically inhibit the activity of system 11: U.V. radiation, DCMU and Mn deficiency[8]. Inactivation of up till 90 per cent of the traps did not significantly alter the relative yields of the first five flashes, given after a 10 min dark period. This indicates a negligible role of dark reactions between charges generated in different trapping centers.
4. Conservation of excitations Interpretation of the observations would be quite difficult unless one could assume
that (except in long dark times, which allow detectable deactivation) no oxidizing equivalents are lost because they escape detection. For instance, a slow generation of 0, in darkness following illumination would contribute neither to the observed flash yield nor to the modulated rate measurement.
One thus would like to assume that excitation of a trapping center produces either an equivalent of 0, or an equivalent of precursor. Our conclusion in the previous section, that 0, occurs in a one quantum process, implies that in this event three equivalents are being consumed from the precursor pool.
To check this point, we computed plots as illustrated in Fig. 5 (open circles). The abcissa shows the initial rate Vi observed in modulated light admitted 1 sec after flash ( n - 1). As discussed in the previous section, these values reflect the amounts of 0, evolved by each flash ( Y,). The ordinate shows the difference between the transient areas before and after each flash, i.e. the number of equivalents which flash (n) added or subtracted from the pool: AA,,. After long dark, the first flash yields no oxygen,
* Y OVi(n-1) ,., Yn Fig. 5 . Open circles: change of activated area ( A A ) caused by flash (n) is plotted vs. V , after flash ( n - 1 ) which, according to Fig. 4, is proportional to Y,. Dots: abcissa, the 0, yield of flashes given at various moments during the recording of rate transients (see curves 0 and 2 in Fig. 1); ordinate, flash induced change of the area ( A A ) bounded by the subsequent part of
the transient.

464 BESSEL KOK, BLISS FORBUSH and MARION McGLOlN
it adds one unit of charge to the pool, i.e. for n = 1 Vt(n-l) = 0 and AA, = 1. On the other hand, the 20th flash, or a flash given during steady state illumination yields one unit of oxygen (YS8) but should not alter the filling of the pool so that for n = m Yi(n-l) = 1 and AA = 0. Flashes 2, 3 etc. produce variable quantities of 0, and either add or extract equivalents from the precursor pool.
Within the limits of experimental accuracy- the main uncertainty being in the area computations (see above) the data support a linear relation between Vi and area, i.e. the constancy of Y,, + A A n .
The same is borne out by the other set of data shown in Fig. 5 (dots). In this experi- ment we recorded a number of rate transients and gave a single flash at various moments (t,) during each transient (see Fig. 7, section 5). The flash caused a sudden change of the rate and the time course subsequent to tm bounded an area which differed from the one bounded by the unperturbed transient after t,. In this case the 0, yield of the flash was plotted vs. the area change induced by it. We conclude that, at least in first approximation, all flashes produce the same total number of oxidized equiva- lents, i.e. that excitations are conserved.
5. A linear, four step model for charge cooperation To facilitate the discussion of further data we will at this moment introduce a
model for charge accumulation which seems to generally satisfy the observations. The cycle of four, seen in flash yields and rate transients probably reflects that
0, liberation requires four electron transfers. About the simplest conceivable mechan- ism, would be a linear four quantum process in which four consecutive flashes induce four increasingly oxidized states of a trapping center (Sod), each excitation adding one + charge:
So Sl+ L S22+ -% S33+ -%S44+ - so + 0,.
We need an additional assumption to explain why the yield of the third flash is high and exceeds that of the fourth flash. The additional assumption is that in dark the system does not completely revert to the ground state (So) but that charges remain in the pool. In section 8 and a subsequent paper, we will present evidence that the Sl state is stable and that, even after a long dark time, the system contains a mixture of S, and So states their ratio being dependent upon pretreatment. In first approxima- tion, since three excitations suffice to make 0, from S, traps, Y, reflects the fraction of the traps in the S, state, while Y4 reflects the fraction which is in the So state.
In this model an 0, molecule is evolved when a trapping center in its S, state re- ceives a quantum, so that the rate of 0, evolution equals Y = W,). We assume that one of every four absorbed quanta evolves an 0, molecule so that in the steady state, a quarter of the trapping centers are in the S, state. A flash given during the steady state would yield 25 0 , l I O O traps or 0.25 O,/trap. Since in the steady state all steps have the same rate, the concentration of the four intermediates is equal: [So] = [S,] = [S,] = [S,] = 0.25, if the sum of all states is 1.
Trapping centers in the S, state contain three oxidizing equivalents, S, centers 2, S, centers 1 , so that in the steady state, the precursor pool should contain 3 + 2 + 1 + 0 = 6 equivalents per four traps or 1.5 eq./trap.
In section 2 (see also section 7) we observed that 1 flash, which presumably adds

Cooperation of charges in photosynthetic 0, evolution- I 465
one charge to each trapping center, just about filled the pool deficit seen after 10 min darkness. A deficit area A. = - 1 eq./trap traps now implies that after 10 min dark the pool still contains -0.5eq./trap-presumably half the traps are in the S, state, the other half in the So state. One predicts the first four flash yields to be: 0, 0, 0.5, 0.5 (if Y,, = 0.25 OJtrap).
The behavior of such a cyclic set of events in weak light can be evaluated with relative ease since the four differential equations:
which describe the time course in continuous weak light (I) can be solved explicitly. Figure 6 illustrates that so computed time courses simulate the observed transients
(Fig. 1) rather well, if one selects the right initial conditions (S,/So ratio). The model predicts that upon illumination the concentrations of the various intermediate states,
INITIALLY 40% So, 6o%si 2.5
c
& after 0 flashes
S, after 0 flashes
Q 5 t I / 1 / / S, after 0 flashes = Voz
I 1 I I 1 2 3 4
TIME IN WEAK LIGHT Fig. 6. Prediction of the time course of the concentration of the four intermediate states So, S, , Sf. S, upon admission of weak light. It is assumed that initially 40 per cent of the traps are in the So, 60 per cent in the S, state. The predicted yields of the first four flashes are indi- cated on the ordinate. A flash moves all states to the next one, and the four curves predict
the time course of the 0, rate c[S,]) after 0-3 preceding flashes.

466 BESSEL KOK, BLISS FORBUSH and MARION McGLOlN
including S3 - and thus the 0, rate - show a damped oscillation before attaining the steady state value. The four states participate in a cycle, a flash moving all states to the next one. Thus, the time course of [S,] after zero flashes is identical to the time course of [ S o ] after 1 flash, etc. and the four curves simulate the first four rate transients in Fig. 1.
Assumption of this model thus offers a simple way to analyze the momentary com- position of the precursor pool viz. by measuring the yields of four consecutive flashes: The first flash yields an amount of 0, proportional to the number of S3 states ( Y , = C . U [ S , ] ~ ) and moves all other states one step up. Flash (2) liberates 0, from S, states which were S, states at zero time: Y , = a[s,IO. Similarly the yield of flash (3) reflects the traps which are initially in the S, state Y3 = (Y[S~]~ and Y , = a[S&
An example of such analysis is shown in Fig. 7. It shows firstly a rate transient seen 10 min after removal of the modulated light (dash-dot). According to the model this curve reflects the rise of [S,] from 0 to its steady state value. The experiment was repeated, but now a flash was given 1 sec before the modulated light. The rate
-
RA'
2.
1.
1
0
-20
10
or [ ~ n l 2'5d
,/ I I
0.5 1 .o 1.5 ' b . 0 SECONDS IN ,., 693 NM LIGHT
Fig. 7. Rate transients, recorded after 10 min dark subsequent to weak light, were interrupted by a single 0.25 pF flash (dots) or a pair of flashes (Ar =. 10 msec, open circles). The dotted (dashed) curves show the time courses of the modulated rate subsequent to each flash (flash pair). The dots and circles connected by full lines show the rate immediately after the flashes and reflect [S,] and [S, ] just before each interruption. The uninterrupted curve (dash-dot) shows the time course of [S,] while the time course of [So] (long dash) was calculated from
the envelopes assuming a constant sum (4.0) of all states.
Cooperation of charges in photosynthetic Oz evolution- I 461
followed the dotted trace starting at Vi = 0 (dot). In the next experiments flashes were given during the zero flash transient (e.g. as illustrated at t = 0.25sec). This caused a sudden increase of the rate followed by an approach to the same (dotted) trace seen when the flash was given at zero time. Presumably the flash depleted all S3 and converted all S, to S, so that the rate immediately after the flash reflects [S,] immediately before it. The full line, connecting the dots in Fig. 7 thus should show the time course of [S,] during the zero flash transient.
In similar experiments we gave pairs of flashes (spacing 10 msec) instead of a single one. Now, the initial rate after each pair (open circles) should reflect [S,] at the moment the pair is given and the envelope of the ‘spikes’ (full line connecting the open circles) should show the time course of [S,] during the zero flash transient. The dashed line shows the individual time courses of the rate seen subsequent to the flash pairs. Experimental variability prevented a very precise analysis, but these curves tended to deviate from the envelope (full line) in the illustrated fashion.
If we now assume that the sum of all states remains constant, we can compute from the 0 transient ([S,]) and the [S,] and [S,] curves (full lines), the time course of So. The so computed time courses of the four states indeed resemble the pattern predicted by the model, and appear to indicate that after 10min dark 45 per cent of the traps are in the So state, 55 per cent in the S, state (in Fig. 6 the assumption was 40 and 60 per cent).
Clearly, however, the correspondence is only approximate, a comparison of Figs. 7 and 8 reveals several discrepancies between prediction and observation. Also, the model is obviously incomplete since it fails to predict the damping of the flash yield oscillation, observed to occur in three to four cycles (Fig. 3). One can conceive several perturbations which ‘mix up’ the various states and thus damp the flash yield osci- llation, distort the rate transients or do both.
Whatever the ‘spoiling’ perturbations, their effects will compound with increase of flash number or exposure time. Thus, it is not surprising that the computed [So] curve in Fig. 7 which is ‘preceded’ by three flashes and weak light differs notably from the prediction.
Based partly on evidence given in subsequent sections, we assume as major perturbations that the flashes convert a certain percentage of the traps more than once (‘double hits’) while another fraction of the traps are not converted at all by light (‘misses’). Double hits ‘advance’ while misses ‘retard’ the stepwise conversion of the states by the flashes. A detailed analysis of this spoil mechanism will be given in a subsequent paper[7].
6. Minimum time separation between flashes, rate constants If in photoact I1 an electron were transferred from donor Z to acceptor (2:
this act could be repeated only after the reoxidation of Q- and the rereduction of Z + in dark steps (see equation ( I ) ) . In most of our experiments pool A , acting as the final electron sink, was fully oxidized. Under this condition step k, takes < 1 msec [9]. Joliot[lO] found a = 1 msec delay between Z and 0, and also Witt et al.[1 I ] report a - 1 msec reaction time in system 11. As is illustrated in Fig. 8 (left) the relaxa-
P&P-Vol. I I .No.6-G

468 BESSEL KOK, BLISS FORBUSH and MARION McGLOlN
DEACTIVATION
1 SEC ....... 1 SEC .....
3 msEc..... 15 A ......
- - - - - - - 1.0 Is- - -
800pSEC
3wp9oc......
100psEc ....
6OpSEC .....
3 SEC....
10 SEC....
,opsEc.a5
..... e 0 pKC 100 S a .
I 1 1 I I I 1 1 I 0 5 l o o 5 10
SECONDS -650 NM LIGHT
Fig. 8. Effect of the time interval At between the first and the second flash, upon the rate transient in modulated 650 nm light, admitted I sec after the second flash. Left (‘activation’) full effect of second flash requires At I msec. Right (‘deactivation’): the effect decays
in - 10 sec. Insert: plot of V, vs. log At shows useful range between and 10 sec.
tion time of the system- i.e. the minimum spacing (At), required between two flashes, to be recognized as a pair rather than a single flash proved to be in this same time range, the effect being half at At = 0.3 msec and fully developed at At - 10 msec.
In the linear sequence of equation ( l ) , primary photooxidant Z is connected to (or identical with) a charge accumulating and 0, producing catalyst So=4. The various steps ko, k2 etc. such as Z + +So Z+S, (which we can write more simply as So* A S1 and S4 So+02) probably have different rates. If all of these were rapid compared to the rate of the Q + A transfer, one would expect to find a single time constant (k , ) regardless which flash pair is studied. Actually we do find different relaxation times and one cannot a priori decide whether the fastest of these should be ascribed to one of the Z + discharges or to the k, step.
In experiment Fig. 9 we attempted to determine k, and possibly also k,. We varied the time (At) which separated flashes ( 1) and (2), given after 5 min dark, and recorded yields of flashes (3) and (4) given 2 and 4 sec later. ‘Y3’, which for At = 0 actually corresponds to Y , in a normal sequence, reflects the number of S3 states left by the preceding flash pair. These were initially S2 states for At = 0 and S, states for At = 1 sec. Since, as we will describe in[7], after 5 min dark [&lo is small but [SllO con- siderable, Y3 will rise with At and reflect mainly k, in: Z++S, k Z + S q . If this were a first order reaction, Y , = [SJO (l-exp-k,t) in which [S,lO is the concentration of S, before the flash sequence is given.

Cooperation of charges in photosynthetic 0, evolution- I 469
2 q
Y
. . . . ._
1.6
1.4 ’ *
1.2
1.0
:.. l/Y,
....
p sec
DARKTIME 16+2, psec Fig. 9. Dependence of Y:, and Y4 upon the time spacing (At) between the first and second flash. Pretreatment for each point: fifteen flashes followed by 5 min dark. Full lines, observed curves; dashed line, Y3 curve corrected for spoiling and incomplete deactivation according to[7]. Dotted line: reciprocal plot of the dashed Y3 curve. Indicated on the ordinate are the yields of a single flash after 5 min and 10 min dark and the yield of a double flash (Al= 0) after 5 min dark. Insert: the time course of the flash intensity using a 0.25pF (full line), or a I p F capacitor (dotted). The maxima of the curves were normalized, the larger C value
yielded nearly twice the peak intensity.
Similarly, Y, will reflect [S,lO for At = 0 and [Sol0 for At = 1 sec, so that, again
Y, = [Solo ( 1-exp -kot) + [SllO (exp 4 , t ) and the sum Y3 + Y4 thus should reflect Lo. I n Fig. 9 the open symbols connected by a solid line show the actual observations
of Y3. A relatively short ( 5 min) darktime was used and deactivation was incomplete. In addition the Y3 curve does not truly reflect the time course of S1 because of spoiling. Applying our analysis of these two interferences descussed in [7], we computed a corrected time course for Y , which is shown as a dashed curve. The dotted slope is a reciprocal plot of the dashed one, I / ( Y,,,, - Y,,), and shows that the time course is approximately second order. The first halftime is - 200 psec.
Determination of ko from the plots of Y , and Y , vs. At proved beyond the precision of our experiments and spoiling analysis. There is some indication that ko is rather similar to kZ, i.e. slower than k, .
In experiment Fig. 10 we tried to determine k,. Again in each observation four flashes were given after 5 min dark and ‘Y3’ and ‘Y4’ recorded. Now the spacing At between flashes (2) and (3) was varied, the other spacings being 2 sec.
The flash yield signal is a damped oscillation, lasting = 0.1 sec (c.f. Fig. 3 in [6])
assuming first order kinetics:

470 BESSEL KOK, BLISS FORBUSH and MARION McGLOlN
P
Fig. 10. Dependence of V, and Y, upon the time interval (Ar) between flashes 2 and 3. Pre- treatment for each set of points: fifteen flashes followed by 5 min dark. For all but the highest At values (3 I sec) the ‘Y; signal included that of Y2, therefore the yield observed for At = 0
(0.38) was subtracted from these data.
so that the signals of two flashes given in close succession (A? in the msec range) are superimposed. The resulting distortion of ‘Y3’ is bearable, because at At = 0 ‘YzI is small (- 0.4 in Fig. 10) and can be subtracted. The time course of ‘Y3’ thus should provide a relatively faithful reflection of k2.
The Y3 curve in Fig. 10 might be first order, it shows a half time of - 400psec. Apparently reaction k, is considerably slower than step k, -at least initially. This is also seen in the time course of Y,, which reflects both k, and k2, and shows a distinct initial rise.
We will not at this moment contemplate whether the rapid step k , might not, in reality be k,, or the significance of its second order kinetics. Also, the rate of step k, might possibly be underestimated if the Q-A reaction had slowed down after the first two electron transfers driven by flashes (1) and (2).
One important consequence of these rapid relaxations, especially after the first flash, will be discussed in the next section.
7 . E$ect offlash intensity and duration The rapid relaxation of the system (especially k,) discussed above, raised doubts
Cooperation of charges in photosynthetic O2 evolution- I 47 I
whether the duration of the Xenon flashes could be neglected. The insert of Fig. 9 shows the time courses of the flash intensity observed with a 0.25pF and 1 pF capacitor (-0.3 and 1.2.I), used in many of our experiments. Flashes obtained with various capacitors show a limited variation of peak intensity, especially with high C values the increased output was mainly due to a longer duration of the main dis- charge, while also the emission in the long ‘tail’ is enhanced.
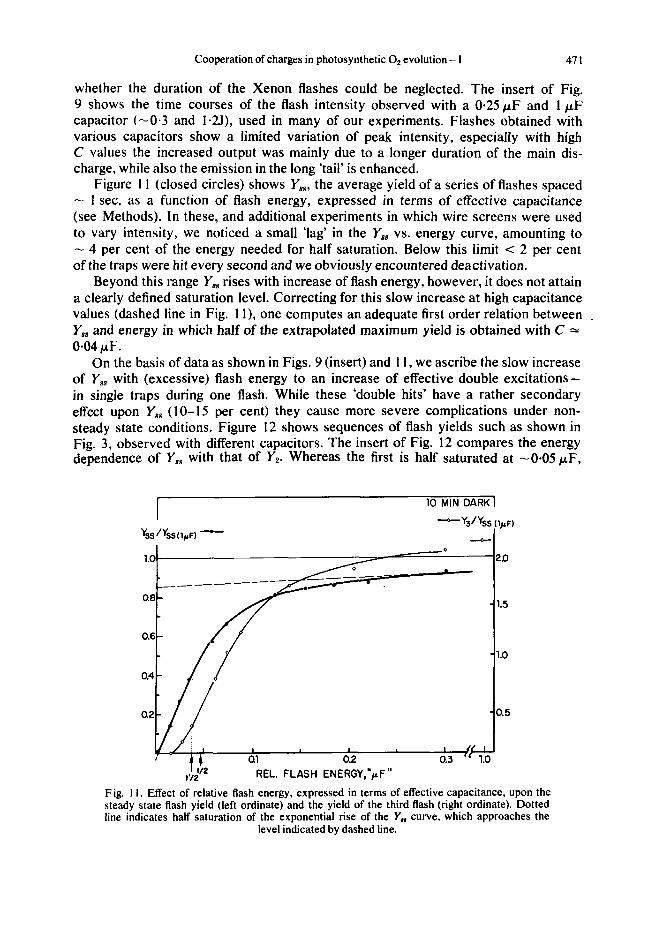
Figure 1 1 (closed circles) shows Y,,, the average yield of a series of flashes spaced - 1 sec, as a function of flash energy, expressed in terms of effective capacitance (see Methods). In these, and additional experiments in which wire screens were used to vary intensity, we noticed a small ‘lag’ in the Y,, vs. energy curve, amounting to - 4 per cent of the energy needed for half saturation. Below this limit < 2 per cent of the traps were hit every second and we obviously encountered deactivation.
Beyond this range Y,, rises with increase of flash energy, however, it does not attain a clearly defined saturation level. Correcting for this slow increase at high capacitance values (dashed line in Fig. 1 I ) , one computes an adequate first order relation between . Y,, and energy in which half of the extrapolated maximum yield is obtained with C 1: 0-04 pF.
On the basis of data as shown in Figs. 9 (insert) and 1 1, we ascribe the slow increase of Y,, with (excessive) flash energy to an increase of effective double excitations- in single traps during one flash. While these ‘double hits’ have a rather secondary effect upon Y,, ( 1 0-1 5 per cent) they cause more severe complications under non- steady state conditions. Figure 12 shows sequences of flash yields such as shown in Fig. 3, observed with different capacitors. The insert of Fig. 12 compares the energy dependence of Y,, with that of YP Whereas the first is half saturated at -0.05pF,
I 10 MIN DARK^
1’12 I tn REL. FLASH ENERGY,”pF”
Fig. 1 1 . Effect of relative flash energy, expressed in terms of effective capacitance, upon the steady state flash yield (left ordinate) and the yield of the third flash (right ordinate). Dotted line indicates half saturation of the exponential rise of the Y, curve, which approaches the
level indicated by dashed line.

472 BESSEL KOK, BLISS FORBUSH and MARION McGLOlN
NO. OF FLASH
Fig. 12. Flash yield sequences observed with flashes using various discharge capacitors. Before each sequence the sample was in dark during IOmin. Insert shows the variation of
Y, and Y2 with capacitance.
Y, shows an S shaped rise (full line, circles). The dashed line, a plot on a compressed abscissa scale, shows a pronounced secondary rise, so that with C = 10pF ( l /e decay time of the flash - 30 psec) Y, approaches 0.6 YS8. The main plot in Fig. 12 shows that with this capacitance, even flash ( I ) yields a significant amount of O,, which indicates the occurrence of triple hits.
We have measured Y, as a function of the effective capacitances ( C , and C,) used for flashes ( I ) and (2). The S shape occurred only when both capacitors were varied ( C , = C,). With either C fixed and the other varied, the relation between Y, and C was similar to that between Y , and C.
If in the latter type of experiment the invariant capacitor was ‘large’ (e.g. 2 pF), Y, rose to a higher value if C , was fixed than if C , was. Thus, double excitations are relatively more effective in the first flash than in the second flash, in agreement with the observation that k, > k, as discussed in the previous section.
A quadratic (S shaped) intensity curve of Y2 is to be expected since the 0, yield results from two successive flashes. The ‘true’ value of Y,, unaffected by double hits, thus can be estimated if we assume that a flash energy which yields 0.5 Y,, will yield 0.25 Y,. I n this way we compute that after 10 min dark, following weak light Y , s 0.1 Y,,.
We made a similar evaluation of flash energy in respect to the ‘true’ effect of flash ( I ) : As shown in the insert of Fig. 2 the halftime of the rise of the subsequent rate transient decreases with increase of flash energy, the bounded area decreasing similarly. With higher capacitance values the ‘overshoot’ becomes more pronounced, and begins to resemble the transient after two flashes. In Fig. 2 a 0.04 pF flash (s half saturation) removed 40 per cent of the deficit area A,, (10 min after continuous light). Twice this

Cooperation of charges in photosynthetic 0, evolution- I 473
value or -0.8 A. might be the best estimate of the effect of flash (l)-in accord with the data of Fig. 5 . As will be discussed in the subsequent paper[7] the so estimated value ofA, is actually lower than predicted by our hypothesis.
8. Deactivation, stability of S, In experiment Fig. 8 (right, insert) the effect of the dark interval (At) between
flashes (1) and (2) upon the subsequent rate transient is maximal and constant between - 10 msec and 1 sec. With longer intervals the high initial rate and excess activated area decline progressively more slowly; after some 15 sec V, = V, and after - 100 sec the transient resembles the one seen with a single flash (At = 0), the first flash of the pair having lost its effect.
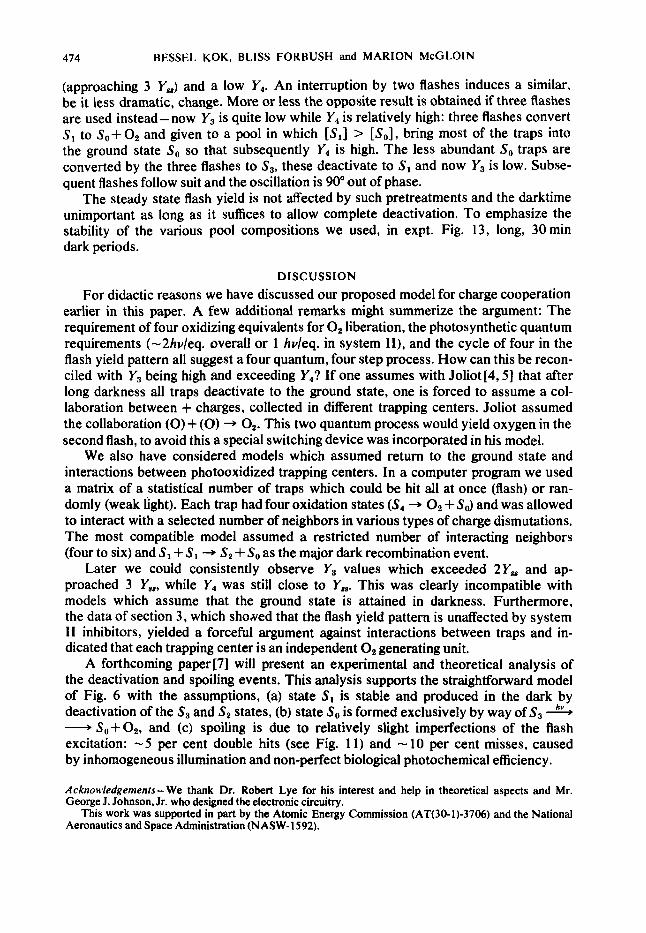
An essential assumption in our model (Sect. 5 ) is that during deactivation not all traps return to the ground state (So), but charges in the S, state are stable and remain in the pool indefinitely. For the computation of Fig. 6 to fit the observations, we had to assume that after deactivation only 40 per cent of the traps had returned to the ground state, (So) while 60 per cent had remained in the S1 state. If S1 were stable one might expect that under different conditions different amounts of S, and So remain after deactivation which would be seen as a variation of the ratio Y3/Y4. The data of Fig. 13 show that indeed by manipulating the initial composition of the pool, before deactivation, one can significantly vary the final composition after deactivation.
We assumed in Fig. 6 that deactivation following the steady state leaves [S,] > [So] so that one consequently observes Y3 > Y4. A single flash which moves all states one step up would bring a pool 0.4 So. 0.6 S, to 0.4 S,, 0.6 S, and leave no S,,. If S, were stable and S, converted largely into S,[7], subsequent deactivation would lead to a quite high concentration of S, and a low value of [So] so that in a subsequent flash series Y3 % Y4.
Figure 13 indeed shows that if a single flash is given after a 5 min dark period follow- ing the steady state the system deactivates to a state which leads to a very high Y3
30 MINUTES DARK AFTER
1 Flash - 2 Flasbes - - 0 - -
3 Flashes - _ _ - - _-
' 1 2 3 4 5 6 7 8 9
Fig. 13. Sequences of flash yields observed after 30 min darkness following one, two or three flashes. Pretreatment: fifteen flashes spaced I sec apart, 5 min dark.
NO. OF FLASH
474 BESSEL KOK, BLISS FORBUSH and MARION McGLOlN
(approaching 3 Yss) and a low Ye An interruption by two flashes induces a similar, be it less dramatic, change. More or less the opposite result is obtained if three flashes are used instead-now Y3 is quite low while Y4 is relatively high: three flashes convert S1 to S,+O, and given to a pool in which [S,] > [So], bring most of the traps into the ground state So so that subsequently Y4 is high. The less abundant So traps are converted by the three flashes to S3, these deactivate to S, and now Y3 is low. Subse- quent flashes follow suit and the oscillation is 90" out of phase.
The steady state flash yield is not affected by such pretreatments and the darktime unimportant as long as it suffices to allow complete deactivation. To emphasize the stability of the various pool compositions we used, in expt. Fig. 13, long, 30 min dark periods.
DISCUSSION
For didactic reasons we have discussed our proposed model for charge cooperation earlier in this paper. A few additional remarks might summerize the argument: The requirement of four oxidizing equivalents for 0, liberation, the photosynthetic quantum requirements (-2hvleq. overall or 1 hvleq. in system II), and the cycle of four in the flash yield pattern all suggest a four quantum, four step process. How can this be recon- ciled with Y3 being high and exceeding Y,? If one assumes with Joliot [4,5] that after long darkness all traps deactivate to the ground state, one is forced to assume a col- laboration between + charges, collected in different trapping centers. Joliot assumed the collaboration (0) + (0) + 0,. This two quantum process would yield oxygen in the second flash, to avoid this a special switching device was incorporated in his model.
We also have considered models which assumed return to the ground state and interactions between photooxidized trapping centers. In a computer program we used a matrix of a statistical number of traps which could be hit all at once (flash) or ran- domly (weak iight). Each trap had four oxidation states (S4 + 0, + So) and was allowed to interact with a selected number of neighbors in various types of charge dismutations. The most compatible model assumed a restricted number of interacting neighbors (four to six) and S, + S, --* S, + So as the major dark recombination event.
Later we could consistently observe Y3 values which exceeded 2YS8 and ap- proached 3 Y,,, while Y, was still close to Yg8. This was clearly incompatible with models which assume that the ground state is attained in darkness. Furthermore, the data of section 3, which showed that the flash yield pattern is unaffected by system I1 inhibitors, yielded a forceful argument against interactions between traps and in- dicated that each trapping center is an independent O2 generating unit.
A forthcoming paper [7] will present an experimental and theoretical analysis of the deactivation and spoiling events. This analysis supports the straightforward model of Fig. 6 with the assumptions, (a) state S, is stable and produced in the dark by deactivation of the S3 and S, states, (b) state So is formed exclusively by way of S3 4 - So+02, and (c) spoiling is due to relatively slight imperfections of the flash excitation: - 5 per cent double hits (see Fig. 11) and - 10 per cent misses, caused by inhomogeneous illumination and non-perfect biological photochemical efficiency.
Acknowledgements-We thank Dr. Robert Lye for his interest and help in theoretical aspects and Mr. George J. Johnson, Jr. who designed the electronic circuitry.
This work was supported in part by the Atomic Energy Commission (AT(30-1)-3706) and the National Aeronautics and Space Administration (NASW- 1592).

Cooperation of charges in photosynthetic 0, evolution- I 475
REFERENCES 1. F. L. Allen and J. Franck,Arch. Biochern. Biophys. 58.5 10 (1955). 2. C. P. Whittingham and P. M. Bishop, In Photosynthetic Mechanisms in Green Planrs, Publ. 1145,
p. 371 NAS-NRC, Washington, D.C. (1963). 3. P. Joliot, Biochirn. Biophys. Acta 102, 1 16 (1965). 4. P. Joliot, Phorochern. Photobiol. 8,45 1 ( 1968). 5. P. Joliot, G . Barbieri and R. Chabaud, Photochern. Photobiol. 10,309 ( 1969). 6. P. Joliot and A. Joliot, Biochirn. Biophys. Acta 153,625 ( 1968). 7. B. Forbush, B. Kok and M. McGloin, In preparation. 8. G. M. Cheniae and 1. Martin, Biochirn. Biophys.Acta 197,219 (1970). 9. B. Forbush and B. Kok, Eiochirn. Biophys. Acta 162,253 (1968).
10. P. Joliot, Energy Conoersion by the Photosynthetic Apparatus, Brookhaven Symposia in Biology,
1 1. H. T. Witt, B. Skerra and J. Vater, In Currents in Photosynthesis Donker, Rotterdam ( 1966). No. 19, p. 418 (1966).