cooperation and community-based development: notes on the
TRANSCRIPT

Journal of Regional Socio-Economic Issues, Volume 3, Issue 3, September 2013
1

Journal of Regional Socio-Economic Issues, Volume 3, Issue 3, September 2013
2
JOURNAL OF REGIONAL SOCIO-
ECONOMIC ISSUES (JRSEI) ISSN No. 2049-1395
Aims of the Journal: Journal of Regional Socio-Economic Issues (JRSEI) is an international
multidisciplinary refereed journal the purpose of which is to present papers manuscripts
linked to all aspects of regional socio-economic and business and related issues. The journal
indexed by Copernicus Index, DOAJ (Director of Opesn Access Journal) & EBSCO and
welcomes all points of view and perspectives and encourages original research or applied
study in any of the areas of regional socio-economic and business. The views expressed in
this journal are the personal views of the authors and do not necessarily reflect the views of
JRSEI journal. The journal invites contributions from both academic and industry scholars.
Electronic submissions are highly encouraged (mail to: [email protected]).
Chief-Editor Assoc. Prof. Dr. George M. Korres: Professor University of the Aegean, School of
Social Sciences, Department of Geography, [email protected], [email protected]
Editorial Board (alphabetical order) Prof. Dr. Elias G. Carayannis: Professor School of Business, George Washington
University, Washington, USA, [email protected], [email protected]
Prof. Dr. Hanna Dudek: Professor Warsaw University of Life Sciences,
Assoc. Prof. Dr. George Gkantzias: Associate Professor in Cultural Management, New
Technology University of the Aegean, [email protected]
Dr. Aikaterini Kokkinou: University of Glasgow, Department of Economics United
Kingdom, [email protected]
Prof. Dr. Elias A. Kourliouros: Professor University of the Aegean, School of Social
Sciences, Department of Geography, [email protected],
Assoc. Prof. Dr. Charalambos Louca: Associate Professor & Head of Business
Department , Director of Research Department, [email protected]
Prof. Dr. Photis Nanopoulos: Former Director of Eurostat, [email protected]
Dr. Pablo Ruiz-Nápoles:Faculty of Economics, Universidad Nacional Autonoma de
Mexico, [email protected]
Prof. Dr. Kiran Prasad, Professor Sri Padmavati Mahila University
[email protected]; [email protected]
Professor Paris Tsartas, Rector, University of the Aegean, E-mail: [email protected]
Assoc. Prof. Dr. George O. Tsobanoglou: Visiting Fellow University of Newcastle upon
Tyne, Centre of Urban and Regional Development Studies (CURDS) & President,
International Sociological Association, Research Committee on Socio-technics &
Sociological Practice (ISA-RC26) Assoc. Prof. University of the Aegean, ,
Prof. Dr. George Zestos: Professor of Finance, Christopher Newport University,

Journal of Regional Socio-Economic Issues, Volume 3, Issue 3, September 2013
3
Table of Contents
Editorial Board 2
Table of Contents
3
Paper 1: The Gordian Knot of Labor Market in European Union and Greece
(by Olga Papadopoulou)
5
Paper 2: Gentrification in the frame of Tourism: A case study in the City of
Athens (by Margarita Stergiou and Georgios Sidiropoulos)
25
Paper 3: Innovation Dynamics: Transforming the European Union Economy
(by Fragkiskos Xirouchakis)
37
Paper 4: Green Entrepreneurship, as an innovative tool for enhancement of
Hospitality SMEs Competitiveness, Viability and Profitability Strategies (by
Panagiotis Katis)
57
Paper 5: The Frame of Education and the effects in the Growth in E.U (by
Aliki Demosthenous)
74
Book Review
87
Call for Papers
89
Instructions to Authors 90

Journal of Regional Socio-Economic Issues, Volume 3, Issue 3, September 2013
4

Journal of Regional Socio-Economic Issues, Volume 3, Issue 3, September 2013
5
The Gordian Knot of Labor Market in European Union and Greece
Abstract:
The present paper focuses on the labor market and also its relevant inequalities, during the last
decade, including years of the Great Recession (2008 – 2010) and the stalled recovery years
(2011 - 2012). In a depth analysis of labor market inequalities, labor market is directly linked
to the economic, social and political spheres of the European Union. Moreover, one of the
objectives of European policy is to ensure the participation and equality in employment, since
the policy of equality constitutes an integral part of the common European Social Policy.
Consequently, understanding segregation is essential for the attainment of equality between
men and women in response to the current financial crisis. The paper presents the situation in
the European labor market. Using data from Eurostat, it presents trends in employment rates
of each Member State and European Union as a total, giving also special attention to the
Greek case. Moreover, some preliminary figures are provided on the evolution of employment
rates, by gender and working time, trying to shed light on the patterns of employment change
between men and women and part – time employment.
Keywords: labor market, employment, inequality, European Union, Greece
Olga Papadopoulou1
1Corresponding Address: Olga Papadopoulou,, University of the Aegean, School of Social Sciences, Department
of Geography, University Hill, 81100 Mytilene, Greece. Email: [email protected]
Journal of Regional Socio-Economic Issues, Volume 3, Issue 3, September 2013
6
1. Introduction
The recent global disruption, that started with the U.S.A. subprime mortgage crisis in 2007, it
is the deepest and broadest financial crisis since the 1930s. Due to high interconnection of
markets, this movement spread beyond the American borders, had affected various countries
around the world and has reignited the debate and the structure of global society and
economy.
In today’s harsh times of financial2 crisis, several issues of high importance have been
brought to the forefront, such as an unprecedented jobs and sales decline and overall
disregardment in areas such as work and education (Stiglitz 2009). Around five million
people work on shorter time in the advanced economies (IILS 2009). Especially, there has
been much discussion also of the European together with the Greek financial crisis that began
in May 2010, when it became evident that Greece could no longer service its growing debt. In
the summer of 2010, the European Central Bank, the European Commission, and the
International Monetary Fund managed to cover the borrowing needs of Greece. In July 2011,
a half rescue package was offered to Greece under structural reforms that the Greek
government was required to implement. The situation remains unresolved, with a high
unemployment rate above 26% in November 2012 (European Restructuring 2013), and
especially for youth above 50% in August 2012 (European Restructuring 2012). Greece is the
perfect example, where fiscal policy turned to austerity, affected also the labor market (Torres
2010).
The present paper focuses on the labor market and also its relevant inequalities, during
the last decade, including years of the Great Recession (2008 – 2010) and the stalled recovery
years (2011 - 2012). Labor market constitutes an integral part of the economic and social
sphere of the European Union (EU) and that can (re)shape the economic and social
development. From a political perspective, the situation on the labor market is used to monitor
the European Employment Strategy and responds to the requirements of the economic policy
in the European Union. One of the objectives of European policy is to ensure the participation
and equality in employment. Consequently, understanding gender segregation is essential for
the attainment of equality between men and women in response to the current financial crisis.
However in times of crisis, are the patterns of structural employment change? Does
crisis produce different job patterns between men and women, or even polarization? What
2 Although the term “financial crisis” is applied broadly to situations in which financial indicators decline in
value, its definition is conceptualized as “the disturbance to financial markets, associated typically with falling
asset prices and insolvency among debtors and intermediaries, which spreads through the financial system,
disrupting the market’s capacity to allocate capital” (General Secretariat of the Council 2012).
Journal of Regional Socio-Economic Issues, Volume 3, Issue 3, September 2013
7
about the change of working time in European Union and Greece? These questions are not
only important for understanding the employment impact of financial crisis, but also to
understand the potential structural changes general in employment and specifically, between
men and women.
The remainder of the paper is organized, following the below structure. Firstly, we
discuss the European Labor Policy on gender equality and then we try to give a concise
overview of some empirical studies on the topic. We continue by presenting the situation in
the European labor market, together with data on trends in employment rates of each Member
State and EU as a total, giving also special attention to the Greek case. Moreover, we provide
some preliminary figures on the evolution of employment rates, by gender and working time,
trying to shed light on the patterns of employment change between men and women and part
– time employment. We end by providing some conclusions.
2. The European Policy
The European policy on gender equality has gone through many stages, from the initial goal
of equal pay for equal work in the Article 119 of the Treaty that established the European
Economic Community (EEC Treaty) in 1957, to the policy of equality for all, in which gender
is treated as a criterion of discrimination. Throughout the progress of European policy,
European law recognizes the equal treatment in the labor market as a vital component of the
social dimension of the EU, since the reduced employment rate of women could be
considered as a sign of democratic deficit.
Mainly, the EU has as main objective the elimination of inequalities and promotion of
gender equality, through the equal treatment of men and women in the labor market, with
particular reference to wages. However, although the policy of equality constitutes an integral
part of the common European Social Policy, it is characterized by an intense bibliographic
gap.
All in all, the EU policy on gender equality has evolved significantly in the
mechanisms, and objectives, but always in accordance with the European priorities (Stratigaki
2008; 2011). The historical trajectory of the gender equality policy in EU can be divided in
the following six (6) time – periods:
A) Legal recognition of equal treatment of men and women in the labor market (1957 -
1982).
B) Positive actions for women along with programs on equal opportunities between men and
women (1982 - 1990).

Journal of Regional Socio-Economic Issues, Volume 3, Issue 3, September 2013
8
C) Inclusion of women in decision - making centers and the inclusion of the notion of gender
in all policies (1991 - 2000).
D) Establishment of the European Strategy and the relevant framework for gender equality
(2001 - 2005).
E) Establishment of “The European Roadmap for Gender Equality” (2006 - 2010).
F) The European Pact for Gender Equality (2011 - 2020). The main objective of this
particular period is to increase the employment rate to 75% for both men and women.
The above mentioned periods are distinguished also by the following characteristics of
equal treatment, positive actions for women, inclusion of gender mainstreaming in all
policies, inclusion of gender equality in the action “Equality for All” and development of
legislative framework on equal pay.
3. Literature Review
The questions of job shifts during and after recession period are extremely common and
crucial in the bibliography, since researchers have dealt with such issues and confirmed such
changes in terms of employment (Leschke & Jepsen 2012; de Beer 2012). But the existence
of a possible job polarization is unclear in other European countries and in the European
Union as a whole.
Wright and Dwyer (2003) examined in their paper the quality of jobs generated during
periods of job expansion from the 1960s through to the 1990s in the USA. Firstly, they
showed that the patterns of change in periods of employment expansion had a bigger impact
on structural change in job quality during the late 1990s, that led to a significant
asymmetrically polarization. Moreover, there has been a change in gender pattern, namely
gender differences in job expansion were very sharp in the 1960s and quite modest in the
1990s.
Also in the United Kingdom, Goos and Manning (2007) showed that since 1975 there
is a pattern of job polarization with increase in employment shares in the highest and lowest
wage occupations. This polarization of employment could explained also the increased wage
inequality over the period of 1976 – 1995, namely by one - third of the rise in the log(50/10)
wage differential and one - half of the rise in the log(90/50) wage differential.
Goos et al. (2009; 2010) found that in 15 countries, high paying occupations expanded
relative to middle wage occupations in the 1990s and 2000s, and in the total of 16 countries,
low paying occupations expanded relative to middle wage occupations.
Journal of Regional Socio-Economic Issues, Volume 3, Issue 3, September 2013
9
Oesch and Rodriguez Menes (2011) analyzed occupational change over the last two decades
in Britain, Germany, Spain and Switzerland, questioning which type of jobs (high-paid or
low-paid) has been expanding. The findings highlighted that the employment expanded most
at the top of the occupational hierarchy, among managers and professionals. On the other
hand, intermediary occupations (clerks and production workers) declined relative to those at
the bottom (service workers).
According to Dwyer (2013) the job structure in U.S.A. is increasingly polarized as
high and low-wage jobs grew strongly and many middle-wage jobs declined. The author
argues that “care work” theories can explain the robust growth at the bottom of the labor
market, since this type jobs contributed significantly and increasingly to job polarization from
1983 to 2007, growing at the top and bottom of the job structure but not at all in the middle.
On the other hand, one of the first study contacted by Eurofound (2008) revealed that
during the period from 1995 to 2006, the total employment grew by more than 22 million
jobs, assumed that expansions are more important periods for structural change. However,
there was a considerable diversity in the economies around Europe, since not all of them were
positive. Another study of Eurofound (2011) underlined the consequences of the Great
Recession period from 2008 to 2009. More specifically, there were five million fewer people
in paid employment in the EU27 Member States in the second quarter of 2010 than in the
second quarter of 2008. The main conclusion of the analysis was that employment growth
was skewed towards relatively higher - paid jobs and it had been weakest in the middle of the
wage distribution. Growth in the lowest - paid jobs was greater (Eurofound 2011).
Finally, Fernández-Macías (2012) presented some alternative evidence on the nature
of change in European employment structures between 1995 and 2007, arguing that there was
a plurality of patterns of structural employment change across Europe.
4. The Situation in the European Labor Market
But what is the situation on the European labor market, despite the undoubtful progress made
over time in the relevant European policies? The question is extremely crucial especially in
the European Union with the intense financial and social crisis, which is radically changing
the daily life of citizens. Not omitting to mention the EU’s “Europe 2020” strategy for
sustainable and inclusive growth that commits to fostering high levels of employment and
productivity, in order to achieve the target of a 75% employment rate among individuals aged
20 – 64 years.

Journal of Regional Socio-Economic Issues, Volume 3, Issue 3, September 2013
10
On the other hand, the implications concerning men and women have been
differentiated, since the efforts for gender equality can be varied or even canceled, under the
high pressure on combating the economic downturn and financial saving. Despite the
hardships, women play a significant role in the labor market landscape. Of course, often the
distinctive element between men and women is not only the different working paths and
experiences in a specific job sector in the labor market, but also the classification in the above
specific sector, which largely determines the quality of working life.
Below we present the current situation on the labor market of EU along with the
situation in Greece, with the most recent statistics from Eurostat that provide an overview of
the situation in the European labor market, including also the Greek case.
4.1 General Patterns of Employment Change in the Labor Market
According to Eurofound (2013), the common European labor market added nearly 30 million
new jobs in the Golden Age of employment before the Great Recession in 2008. However,
during the last years from 2002 to 2012, several changes occurred in employment rates,
namely the ratio of people that are employed and are in a working age.
For example the total employment rate for the EU27 Member States and for the individuals
that belong to the age group of 20 - 64 years, in 2002 was estimated at 66.7% and thereafter
gradually increased. Specifically, in 2005 was estimated at 68.0% and in 2008 to 70.3%.
However, since 2009 the overall employment rate for the age group 20 -64 years was
declined. Specifically, for 2009 was estimated at 69.0%, in 2010 and 2011 in 68.6% and in
2012 at 68.5% (Figure 1) (Eurostat 2013).
In other words, there were five million fewer people in paid employment in the EU27
in 2010 compared with 2008 as a result of the crisis, which was the most severe employment
decline in over a generation (Eurofound 2013). Consequently there is no achievement of the
objective of the strategy “Europe 2020”, namely achieving 75% employment for men and
women aged 20 - 64 years.
The same occurs for individuals belonging to the age group of 15 - 64 years.
Specifically in 2008, the overall employment rate was estimated at 65.8%, while for 2010
decreased to 64.1%. The following year 2011, there was a tentative increase in the
employment rate, which was estimated at 64.3%, because one million jobs being added as
labor markets began to revive, partly as a consequence of stimulus measures introduced in the
aftermath of the financial crisis (Torres 2010). Finally the year of 2012, the employment rate
was estimated at 64.2% (Figure 1) (Eurostat 2013).

Journal of Regional Socio-Economic Issues, Volume 3, Issue 3, September 2013
11
Figure 1. Total employment rate of the European Union, by age group and for the period
2002 – 2012.
58.0
60.0
62.0
64.0
66.0
68.0
70.0
72.0
2002 2003 2004 2005 2006 2007 2008 2009 2010 2011 2012
Years
Em
plo
ymen
t ra
tes
(%)
Ε.U - 27 (15 - 64 years) Ε.U - 27 (20 - 64 years)
Source: Eurostat (2013) (online data code:lfsi_emp_a).
However we have to highlight the fact that it remains a large variation in national
labor market performances within the common European labor market of EU27 Member
States. For the year 2011, the overall employment rate of 75% and above (achieving the
“Europe 2020” for 75% of employment) were found in Sweden (80.0%), the Netherlands
(77.0%), Germany (76.3%), Denmark (75.7%) and Austria (75.2%). It should be noted that
very high employment rates were found in countries outside the EU, such as in Iceland
(80.6%), Norway (79.6%) and Switzerland (81.8%) (Table 1) (Eurostat, 2013). So for 2011,
only five EU countries achieved the target for 75% employment. At the other end of the scale
the lowest employment rates for 2011, observed mainly in southern Europe, i.e. Greece
(59.9%), Italy (61.2%), Malta (61.5%) and Spain (61.6% ), along with Hungary (60.7%)
(Table 1) (Eurostat 2013).
For the year of 2012, the overall employment rate of 75% and above were found in
Sweden (79.4%), the Netherlands (77.2%), Germany (76.7%), Austria (75.6%) and Denmark
(75.4%). In comparison with 2011, Sweden and Denmark have a decrease in their
employment rates, respectively of 0.6% and 0.3%. High employment rates were remained
outside the EU, in Iceland (81.8%), Norway (79.9%) and Switzerland (82%). On the other
hand, the lowest employment rates for 2012, observed again in southern Europe, i.e. Greece
(55.3%), Spain (59.3%), Italy (61%) and Malta (63.1%) (Table 1).
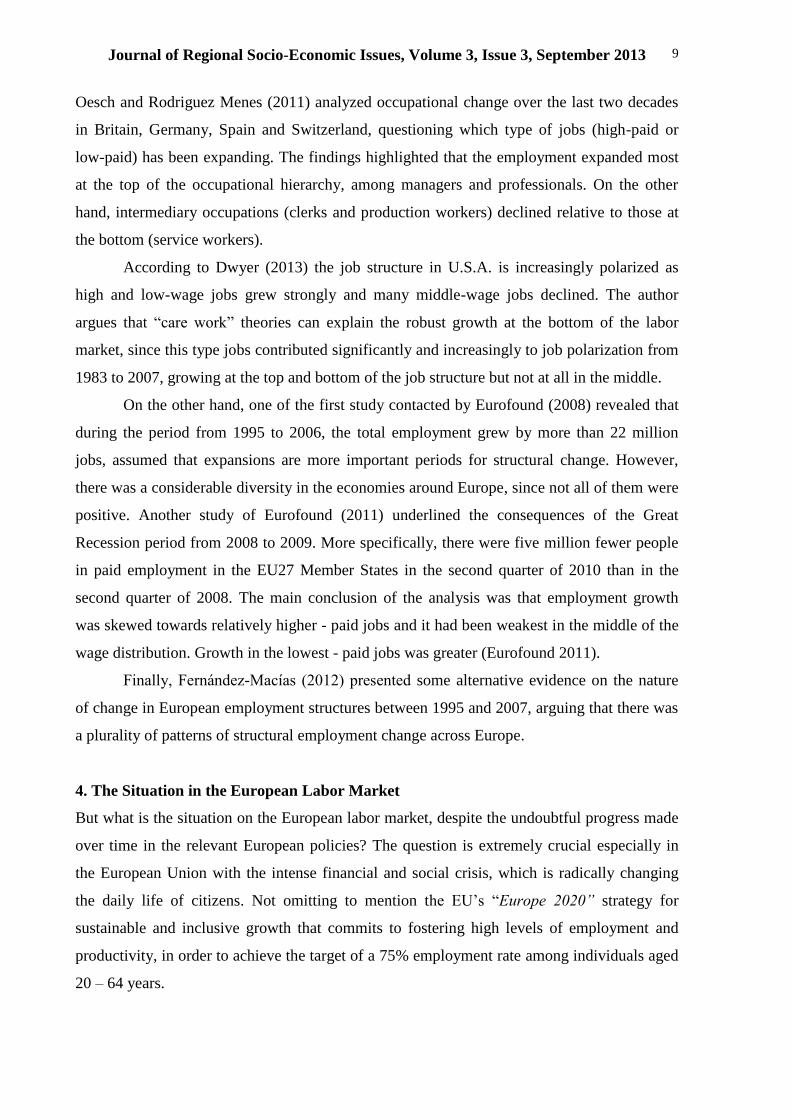
It is apparent that there is an extended dispersion of current employment rates in the
EU from 79.4% in Sweden to 55.3% in Greece (Figure 2). Specifically, Greece follows the
overall trend on employment of EU27 Member States. For example the total employment rate

Journal of Regional Socio-Economic Issues, Volume 3, Issue 3, September 2013
12
for Greece and for the individuals that belong to the age group of 20 - 64 years, in 2002 was
estimated at 62.5% and thereafter gradually increased. Specifically, in 2005 was estimated at
64.6% and in 2008 to 66.5%. As the overall trend in EU27 from the year of 2009, the overall
employment rate in Greece was also declined. Specifically, for 2009 was estimated at 65.8%,
in 2010 in 64.0%, in 2011 in 59.9% and finally in 2012 in 55.3%. The smallest difference
between the overall employment rate in EU27 and Greece was indentified in the year of 2009
(+3.2%), 69% in EU27 and 65.8% in Greece. On the other hand, the highest (+13.2%) was
indentified in the year of 2012, 68.5% in EU27 and 55.3% in Greece (Figure 2).
Table 1. Employment rates for age group 20 - 64 years, by country and for the period 2002 –
2012.
Countries 2002 2003 2004 2005 2006 2007 2008 2009 2010 2011 2012
EU27 66.7 67.0 67.4 68.0 69.0 69.9 70.3 69.0 68.6 68.6 68.5
Belgium 65.0 64.7 65.6 66.5 66.5 67.7 68.0 67.1 67.6 67.3 67.2
Bulgaria 55.8 58.0 60.1 61.9 65.1 68.4 70.7 68.8 65.4 63.9 63.0
Czech
Republic
71.6 70.7 70.1 70.7 71.2 72.0 72.4 70.9 70.4 70.9 71.5
Denmark 77.7 77.3 77.6 78.0 79.4 79.0 79.7 77.5 75.8 75.7 75.4
Germany 68.8 68.4 68.8 69.4 71.1 72.9 74.0 74.2 74.9 76.3 76.7
Estonia 69.2 70.0 70.6 72.0 75.8 76.8 77.0 69.9 66.7 70.4 72.1
Ireland 70.7 70.6 71.5 72.6 73.4 73.8 72.3 67.1 65.0 63.8 63.7
Greece 62.5 63.6 64.0 64.6 65.7 66.0 66.5 65.8 64.0 59.9 55.3
Spain 62.7 64.0 65.2 67.2 68.7 69.5 68.3 63.7 62.5 61.6 59.3
France 68.7 69.7 69.5 69.4 69.3 69.8 70.4 69.4 69.2 69.2 69.3
Italy 59.4 60.0 61.5 61.6 62.5 62.8 63.0 61.7 61.1 61.2 61.0
Cyprus 75.1 75.4 74.9 74.4 75.8 76.8 76.5 75.7 75.4 73.4 70.2
Latvia 67.0 68.9 69.3 70.3 73.5 75.2 75.8 67.1 65.0 66.3 68.2
Lithuania 67.2 68.9 69.0 70.6 71.6 72.9 72.0 67.2 64.4 67.0 68.7
Luxembourg 68.2 67.2 67.7 69.0 69.1 69.6 68.8 70.4 70.7 70.1 71.4
Hungary 61.4 62.4 62.1 62.2 62.6 62.6 61.9 60.5 60.4 60.7 62.1
Malta 57.7 57.8 57.9 57.9 57.6 58.5 59.1 58.8 60.1 61.5 63.1
Netherlands 75.8 75.2 74.9 75.1 76.3 77.8 78.9 78.8 76.8 77.0 77.2
Austria 71.8 72.0 70.8 71.7 73.2 74.4 75.1 74.7 74.9 75.2 75.6
Poland 57.4 57.1 57.3 58.3 60.1 62.7 65.0 64.9 64.6 64.8 64.7
Portugal 73.6 72.9 72.6 72.3 72.7 72.6 73.1 71.2 70.5 69.1 66.5
Romania 63.3 63.7 63.5 63.6 64.8 64.4 64.4 63.5 63.3 62.8 63.8
Slovenia 69.0 68.1 70.4 71.1 71.5 72.4 73.0 71.9 70.3 68.4 68.3
Slovakia 63.6 64.8 63.7 64.5 66.0 67.2 68.8 66.4 64.6 65.1 65.1
Finland 72.6 72.2 72.2 73.0 73.9 74.8 75.8 73.5 73.0 73.8 74.0
Sweden 78.5 77.9 77.4 78.1 78.8 80.1 80.4 78.3 78.7 80.0 79.4
United
Kingdom
74.5 74.7 75.0 75.2 75.2 75.2 75.2 73.9 73.6 73.6 74.2
Iceland : 85.1 84.4 85.5 86.3 86.7 85.3 80.6 80.4 80.6 81.8
Norway 79.6 78.4 78.2 78.2 79.5 80.9 81.8 80.6 79.6 79.6 79.9
Switzerland 81.2 80.2 80.0 79.9 80.5 81.3 82.3 81.7 81.1 81.8 82.0
Croatia 58.4 58.3 59.6 60.0 60.6 62.3 62.9 61.7 58.7 57.0 55.3
Note: (:) No available data.
Source: Eurostat (2013) (online data code:lfsi_emp_a).
Journal of Regional Socio-Economic Issues, Volume 3, Issue 3, September 2013
13
To sum up employment declines attributable in a high degree to developments in some
particular euro zone countries that have led to stagnant or declining output and negative labor
market dynamics, such as in the case of Greece.
Figure 2. Total employment rates for Greece and European Union, for the age group 20 - 64
years and for the period 2002 – 2012.
54
56
58
60
62
64
66
68
70
72
2002 2003 2004 2005 2006 2007 2008 2009 2010 2011 2012
Years
Em
plo
ymen
t ra
tes
(%)
EU27 Greece
Source: Eurostat (2013) (online data code:lfsi_emp_a).
4.2 Pattern of Employment Change by Gender
The impact of the recession and its aftermath has also varied widely in terms of its effects on
different background characteristics, such as gender and working time. It is clear now that
there are signs of segregation in the European labor market. The division between men and
women lies on working hours, specifying the type of employment as full or part - time
employment.
According to the employment rates by gender, women work less than men.
Specifically for all EU27 Member States in the year of 2010, the employment rate for men
aged 20 - 64 years was estimated at 75.1%. For 2011, it was estimated in 75%, reduced by
0.1% compared to 2010 and decreased by 1% compared with 2001 (76%). In 2012 for the
first time, the employment rate of men was estimated fewer than 75%, namely 74.6%,
decrease of 0.4% (Table 2) (Eurostat 2013).
Also for women, there has been a change in employment rates. In 2010, their
employment rate fell for the second consecutive year and stood at 62.1%, while there was an
overall decrease of 0.7% for the employment rate of women between 2008 and 2010. Finally,
between 2010 and 2011, a slight increase of only 0.2% in the employment rate was occurred,
along with an increase of only 0.1% between 2011 and 2012 (Table 2) (Eurostat 2013).

Journal of Regional Socio-Economic Issues, Volume 3, Issue 3, September 2013
14
Table 2. Total employment rates of the European Union, by gender for the period 2002 – 2012.
Gender 2002 2003 2004 2005 2006 2007 2008 2009 2010 2011 2012
Men 75.5 75.5 75.6 76.0 76.9 77.8 77.9 75.8 75.1 75.0 74.6
Women 58.1 58.7 59.4 60.0 61.1 62.1 62.8 62.3 62.1 62.3 62.4
Source: Eurostat (2013) (online data code: lfsi_emp_a).
Based on the above data, the EU could fulfill the primary objective of the “Europe
2020” program, i.e. employment for 75% of the population for individuals aged 20 to 64 years
by 2020, but only for men. However in the year of 2012, it seemed to move away from this
specific target of employment. In the case of employment of women, the achievement of the
target for 75% employment is not case. Below there is a graphical representation, which
clearly shows the difference by gender (Figure 3).
Figure 3. Total employment rates for the European Union, by gender, for persons
aged 20 to 64 years and for the period 2002 – 2012.
0
10
20
30
40
50
60
70
80
90
2002 2003 2004 2005 2006 2007 2008 2009 2010 2011 2012
Years
Em
ploy
men
t rat
e (%
)
Men Women
Source: Eurostat (2013) (online data code: lfsi_emp_a).
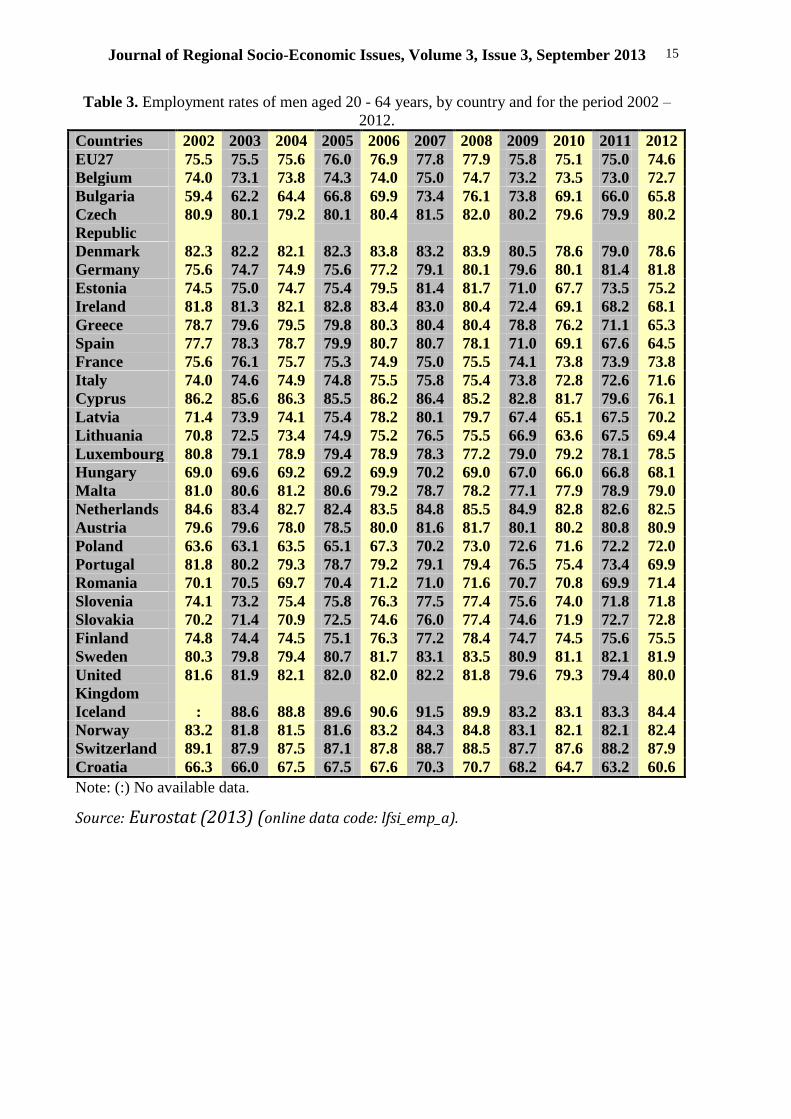
At the country level according to the data of 2011, eleven countries
(Czech Republic, Denmark, Germany, Cyprus, Luxembourg, Malta, the Netherlands,
Austria, Finland, Sweden and the United Kingdom) have achieved the target set
for employment on the male population. For 2012, one more country,
Estonia, with 75.2% achieved the relevant target of employment (Table 3).
Journal of Regional Socio-Economic Issues, Volume 3, Issue 3, September 2013
15
Table 3. Employment rates of men aged 20 - 64 years, by country and for the period 2002 –
2012.
Countries 2002 2003 2004 2005 2006 2007 2008 2009 2010 2011 2012
EU27 75.5 75.5 75.6 76.0 76.9 77.8 77.9 75.8 75.1 75.0 74.6
Belgium 74.0 73.1 73.8 74.3 74.0 75.0 74.7 73.2 73.5 73.0 72.7
Bulgaria 59.4 62.2 64.4 66.8 69.9 73.4 76.1 73.8 69.1 66.0 65.8
Czech
Republic
80.9 80.1 79.2 80.1 80.4 81.5 82.0 80.2 79.6 79.9 80.2
Denmark 82.3 82.2 82.1 82.3 83.8 83.2 83.9 80.5 78.6 79.0 78.6
Germany 75.6 74.7 74.9 75.6 77.2 79.1 80.1 79.6 80.1 81.4 81.8
Estonia 74.5 75.0 74.7 75.4 79.5 81.4 81.7 71.0 67.7 73.5 75.2
Ireland 81.8 81.3 82.1 82.8 83.4 83.0 80.4 72.4 69.1 68.2 68.1
Greece 78.7 79.6 79.5 79.8 80.3 80.4 80.4 78.8 76.2 71.1 65.3
Spain 77.7 78.3 78.7 79.9 80.7 80.7 78.1 71.0 69.1 67.6 64.5
France 75.6 76.1 75.7 75.3 74.9 75.0 75.5 74.1 73.8 73.9 73.8
Italy 74.0 74.6 74.9 74.8 75.5 75.8 75.4 73.8 72.8 72.6 71.6
Cyprus 86.2 85.6 86.3 85.5 86.2 86.4 85.2 82.8 81.7 79.6 76.1
Latvia 71.4 73.9 74.1 75.4 78.2 80.1 79.7 67.4 65.1 67.5 70.2
Lithuania 70.8 72.5 73.4 74.9 75.2 76.5 75.5 66.9 63.6 67.5 69.4
Luxembourg 80.8 79.1 78.9 79.4 78.9 78.3 77.2 79.0 79.2 78.1 78.5
Hungary 69.0 69.6 69.2 69.2 69.9 70.2 69.0 67.0 66.0 66.8 68.1
Malta 81.0 80.6 81.2 80.6 79.2 78.7 78.2 77.1 77.9 78.9 79.0
Netherlands 84.6 83.4 82.7 82.4 83.5 84.8 85.5 84.9 82.8 82.6 82.5
Austria 79.6 79.6 78.0 78.5 80.0 81.6 81.7 80.1 80.2 80.8 80.9
Poland 63.6 63.1 63.5 65.1 67.3 70.2 73.0 72.6 71.6 72.2 72.0
Portugal 81.8 80.2 79.3 78.7 79.2 79.1 79.4 76.5 75.4 73.4 69.9
Romania 70.1 70.5 69.7 70.4 71.2 71.0 71.6 70.7 70.8 69.9 71.4
Slovenia 74.1 73.2 75.4 75.8 76.3 77.5 77.4 75.6 74.0 71.8 71.8
Slovakia 70.2 71.4 70.9 72.5 74.6 76.0 77.4 74.6 71.9 72.7 72.8
Finland 74.8 74.4 74.5 75.1 76.3 77.2 78.4 74.7 74.5 75.6 75.5
Sweden 80.3 79.8 79.4 80.7 81.7 83.1 83.5 80.9 81.1 82.1 81.9
United
Kingdom
81.6 81.9 82.1 82.0 82.0 82.2 81.8 79.6 79.3 79.4 80.0
Iceland : 88.6 88.8 89.6 90.6 91.5 89.9 83.2 83.1 83.3 84.4
Norway 83.2 81.8 81.5 81.6 83.2 84.3 84.8 83.1 82.1 82.1 82.4
Switzerland 89.1 87.9 87.5 87.1 87.8 88.7 88.5 87.7 87.6 88.2 87.9
Croatia 66.3 66.0 67.5 67.5 67.6 70.3 70.7 68.2 64.7 63.2 60.6
Note: (:) No available data.
Source: Eurostat (2013) (online data code: lfsi_emp_a).

Journal of Regional Socio-Economic Issues, Volume 3, Issue 3, September 2013
16
Table 4. Employment rates of women aged 20 to 64 years, by country and for the period 2002 – 2012. Countries 2002 2003 2004 2005 2006 2007 2008 2009 2010 2011 2012
EU27 58.1 58.7 59.4 60.0 61.1 62.1 62.8 62.3 62.1 62.3 62.4
Belgium 55.8 56.2 57.2 58.6 58.8 60.3 61.3 61.0 61.6 61.5 61.7
Bulgaria 52.3 54.0 56.0 57.1 60.4 63.5 65.4 64.0 61.7 59.8 60.2
Czech Republic 62.3 61.4 61.1 61.3 61.8 62.4 62.5 61.4 60.9 61.7 62.5
Denmark 73.1 72.4 73.0 73.7 74.8 74.7 75.5 74.5 73.0 72.4 72.2
Germany 61.9 61.9 62.6 63.1 65.0 66.7 67.8 68.7 69.6 71.1 71.5
Estonia 64.5 65.5 66.8 69.0 72.5 72.5 72.8 68.8 65.7 67.6 69.3
Ireland 59.6 59.8 60.8 62.4 63.3 64.4 64.1 61.9 60.2 59.4 59.4
Greece 46.6 47.9 48.8 49.6 51.2 51.6 52.5 52.7 51.7 48.6 45.2
Spain 47.6 49.5 51.5 54.4 56.4 58.0 58.3 56.3 55.8 55.5 54.0
France 61.9 63.5 63.5 63.7 63.8 64.8 65.5 64.9 64.8 64.7 65.0
Italy 44.9 45.6 48.3 48.4 49.6 49.9 50.6 49.7 49.5 49.9 50.5
Cyprus 64.7 65.9 64.1 63.8 65.9 67.7 68.2 68.3 68.8 67.7 64.8
Latvia 63.0 64.3 65.0 65.7 69.1 70.7 72.1 66.8 64.9 65.3 66.4
Lithuania 63.9 65.6 65.0 66.6 68.3 69.5 68.8 67.5 65.1 66.6 67.9
Luxembourg 55.4 55.1 56.2 58.4 59.4 61.0 60.1 61.5 62.0 61.9 64.1
Hungary 54.3 55.5 55.3 55.6 55.7 55.5 55.1 54.4 55.0 54.9 56.4
Malta 34.4 34.9 34.3 35.1 35.4 37.4 39.3 39.8 41.5 43.4 46.8
Netherlands 66.8 66.9 66.9 67.6 69.0 70.7 72.2 72.7 70.8 71.4 71.9
Austria 64.1 64.5 63.7 64.9 66.4 67.2 68.6 69.4 69.6 69.6 70.3
Poland 51.4 51.2 51.2 51.7 53.1 55.5 57.3 57.6 57.7 57.6 57.5
Portugal 65.7 65.9 66.1 66.0 66.3 66.3 67.0 66.1 65.6 64.8 63.1
Romania 56.8 57.0 57.4 56.9 58.5 57.9 57.3 56.3 55.9 55.7 56.3
Slovenia 63.8 62.8 65.4 66.2 66.5 67.1 68.5 67.9 66.5 64.8 64.6
Slovakia 57.2 58.4 56.7 56.7 57.5 58.7 60.3 58.2 57.4 57.6 57.3
Finland 70.4 70.0 69.7 70.8 71.5 72.5 73.1 72.4 71.5 71.9 72.5
Sweden 76.6 76.0 75.3 75.5 75.8 77.1 77.2 75.7 75.0 76.5 76.8
United Kingdom 67.5 67.7 68.0 68.5 68.6 68.4 68.8 68.2 67.9 67.9 68.4
Iceland : 81.5 79.9 81.2 81.8 81.4 80.4 77.8 77.6 77.9 79.1
Norway 75.9 75.0 74.8 74.6 75.7 77.5 78.6 77.9 76.9 77.1 77.3
Switzerland 73.3 72.5 72.4 72.7 73.2 73.9 76.0 75.6 74.6 75.4 76.0
Croatia 50.9 50.9 51.9 52.8 53.7 54.5 55.2 55.4 53.0 50.9 50.2
Note: (:) No available data.
Source: Eurostat (2013) (online data code: lfsi_emp_a).
But for women, the vast majority of countries have not yet achieved the
target of 75% employment. According to data of the year of 2011, only Sweden
has achieved the target with 77.2% female employment. Other countries with
employment rates close to the target of 75% are the following: Denmark (72.4%),
Finland (71.9%) the Netherlands (71.4%) and Germany (71.1%) (Table 4) (Eurostat
2013). The landscape of female employment remains the same also for
2012, since only Sweden has achieved the relevant target with 76.8%

Journal of Regional Socio-Economic Issues, Volume 3, Issue 3, September 2013
17
female employment. Countries with employment rates close to 75% are
Denmark (72.2%), Finland (72.5%) the Netherlands (71.9%) and Germany (71.5%)
(Table 4) (Eurostat 2013).
Below, it is also presented the graphical representation of
employment rates by gender for the year of 2012 (Figure 4). For all
countries, the employment rate of men is higher compared to that of
women. However, the smallest difference (1.5%) is located in Lithuania
(69.4% for men and 67.9% for women). Countries with also small
differences are Finland (3.0%) (75.5% for men and 72.5% for women) and
Latvia (3.8%) (69.4% for men and 67.9% for women). On the other hand,
the highest difference is located in Malta with 32.2% (79.0% for men and
46.8% for women). Another two southern countries follow, Italy with
21.1% (71.6% and 50.5% respectively) and Greece with 20.1% difference
between men and women (65.3% and 45.2% respectively) (Figure 4)
(Eurostat 2013). We could therefore say that the southern part of Europe
dominates in gender employment gap. Specifically for Greece, the
employment rates by gender are clearly different. For example, for men, there
was a difference of 9.2% between the years of 2006 (80.3%) and 2011 (71.1%).
The difference for women was 2.6% between the years of 2006 (51.2%) and
2011 (48.6%) (Figure 5) (Eurostat 2013).

Journal of Regional Socio-Economic Issues, Volume 3, Issue 3, September 2013
18
Figure 4. Employment rates by gender for persons aged 20 to 64 years and for the year 2012.
0.010.020.030.040.050.060.070.080.090.0
100.0
EU
27B
elgi
umB
ulga
riaC
zech
Den
mar
kG
erm
any
Est
onia
Irel
and
Gre
ece
Spa
inF
ranc
eIt
aly
Cyp
rus
Latv
iaLi
thua
nia
Luxe
mbo
urH
unga
ryM
alta
Net
herla
nds
Aus
tria
Pol
and
Por
tuga
lR
oman
iaS
love
nia
Slo
vaki
aF
inla
ndS
wed
enU
nite
dIc
elan
dN
orw
ayS
witz
erla
ndC
roat
ia
Countries
Em
plo
ymen
t ra
tes
(%)
Male Female
Source: Eurostat (2013) (online data code: lfsi_emp_a).
Figure 5. Employment rates by gender for Greece and for the period 2002 – 2012.
0
10
20
30
40
50
60
70
80
90
2002 2003 2004 2005 2006 2007 2008 2009 2010 2011 2012
Years
Em
ploy
men
t rat
es (%
)
men female
Source: Eurostat (2013) (online data code: lfsi_emp_a).
4.3 Pattern of Employment Change by Working Time
According to the data for the year 2011 (Eurostat 2013), the proportion of the workforce
stated that their main job was part - time increased from 16.2% in 2002 to 19.5% in 2011 and
to 20% in 2012. For the year of 2011, the highest proportion of persons that worked under
part - time terms was found in the Netherlands (49.1%), followed by the United Kingdom
(26.8%), Germany (26.6%), Sweden (26.0%), Denmark (25.9%) and Austria (25.2%). In the
above mentioned countries, part – time employment represents about one quarter of the total
employment. In contrast, part - time employment rate was relatively small in Greece and

Journal of Regional Socio-Economic Issues, Volume 3, Issue 3, September 2013
19
Hungary (6.8%), the Czech Republic (5.5%), Slovakia (4.1%) and almost nonexistent in
Bulgaria (2.4%) (Table 5).
For 2012, the landscape remains the same since the highest part – time employment
rates were found in the Netherlands (49.8%), followed by the United Kingdom (27.2%),
Germany (26.7%), Sweden (26.5%), Denmark (25.7%) and Austria (25.7%). Again part -
time employment rate was relatively small in Greece (7.7%), Hungary (7.0%), the Czech
Republic (5.8%), Slovakia (4.1%) and almost nonexistent in Bulgaria (2.4%) (Table 5).
Although Greece has one of the lowest part – time employment rate, it should be highlighted
the significant increase of the relevant rate (Figure 6).
Table 5. Part – time employment rates for age group 20 - 64 years, by country and for the
period 2002 – 2012.
Countries 2002 2003 2004 2005 2006 2007 2008 2009 2010 2011 2012
EU27 16.2 16.6 17.2 17.8 18.1 18.2 18.2 18.8 19.2 19.5 20
Belgium 19.1 20.5 21.4 22 22.2 22.1 22.6 23.4 24 25.1 25.1
Bulgaria 2.5 2.3 2.4 2.1 2 1.7 2.3 2.3 2.4 2.4 2.4
Czech Republic 4.9 5 4.9 4.9 5 5 4.9 5.5 5.9 5.5 5.8
Denmark 20 21.3 22.2 22.1 23.6 23.7 24.4 25.9 26.3 25.9 25.7
Germany 20.8 21.7 22.3 24 25.8 26.1 25.9 26.1 26.2 26.6 26.7
Estonia 7.7 8.5 8 7.8 7.8 8.2 7.2 10.5 11 10.6 10.4
Ireland 16.5 16.9 16.8 : : 17.7 18.6 21.3 22.7 23.6 24
Greece 4.4 4.3 4.6 5 5.7 5.6 5.6 6 6.4 6.8 7.7
Spain 8 8.2 8.7 12.4 12 11.8 12 12.8 13.3 13.8 14.7
France 16.4 16.8 17 17.2 17.2 17.3 17 17.4 17.8 17.9 18
Italy 8.6 8.5 12.7 12.8 13.3 13.6 14.3 14.3 15 15.5 17.1
Cyprus 7.2 8.9 8.6 8.9 7.7 7.3 7.8 8.6 9.5 10.2 10.7
Latvia 9.7 10.3 10.4 8.3 6.5 6.4 6.3 8.9 9.7 9.2 9.4
Lithuania 10.8 9.6 8.4 7.1 9.9 8.6 6.7 8.3 8.1 8.9 9.4
Luxembourg 10.7 13.4 16.4 17.4 17.1 17.8 18 18.2 17.9 18.4 19
Hungary 3.6 4.4 4.7 4.1 4 4.1 4.6 5.6 5.8 6.8 7
Malta 8.3 9.2 8.7 9.6 10 10.9 11.5 11.3 12.5 13.2 14
Netherlands 43.9 45 45.5 46.1 46.2 46.8 47.3 48.3 48.9 49.1 49.8
Austria 19 18.7 19.8 21.1 21.8 22.6 23.3 24.6 25.2 25.2 25.7
Poland 10.8 10.5 10.8 10.8 9.8 9.2 8.5 8.4 8.3 8 7.9
Portugal 11.2 11.7 11.3 11.2 11.3 12.1 11.9 11.6 11.6 13.3 14.3
Romania 11.8 11.5 10.6 10.2 9.7 9.7 9.9 9.8 11 10.5 10.2
Slovenia 6.1 6.2 9.3 9 9.2 9.3 9 10.6 11.4 10.4 9.8
Slovakia 1.9 2.4 2.7 2.5 2.8 2.6 2.7 3.6 3.9 4.1 4.1
Finland 12.8 13 13.5 13.7 14 14.1 13.3 14 14.6 14.9 15.1
Sweden 21.5 22.9 23.6 24.7 25.1 25 26.6 27 27 26.5 26.5
United Kingdom 25.3 25.6 25.7 25.2 25.3 25.2 25.3 26.1 26.9 26.8 27.2
Iceland : 22.1 22.2 22.2 17.1 21.7 20.5 23.6 22.9 20.8 21.2
Norway 26.4 28.8 29.2 28.2 28.7 28.2 28.2 28.6 28.4 28.1 28.1
Switzerland 31.7 32.7 33 33.1 33.3 33.5 34.3 34.8 35.3 35.2 35.9
Croatia 8.3 8.5 8.5 10.1 9.4 8.6 8.8 9 9.7 9.9 8.4
Note: (:) No available data.
Source: Eurostat (2013) (online data code: tps00159 & lfsa_e2gis).

Journal of Regional Socio-Economic Issues, Volume 3, Issue 3, September 2013
20
In addition, part - time employment rates significantly differ between men and
women. In 2011, one third (32.1%) of employed women in the EU27 Member States has
worked under part - time terms, compared with 9.0% of men. The Netherlands holds the
highest rate in part – time employment of women, since 76.7% of them employed under part –
time terms in 2011. At the other side, the lower rate was found in Bulgaria with 2.6%. The
same pattern prevails among men, with the highest rate found in the Netherlands (2.5%) and
the lowest in Bulgaria (2.6%). In 2012, 32.6% of employed women in the EU27 Member
States have worked under part - time terms, compared with 9.5% of men. Again, the highest
rate in part – time employment of women holds the Netherlands (77%) and the lowest (2.7%)
in Bulgaria.
Figure 6. Part – time employment rate in Greece for the period 2002 – 2012.
0
1
2
3
4
5
6
7
8
9
2002 2003 2004 2005 2006 2007 2008 2009 2010 2011 2012
Years
Part
- tim
e em
ploy
men
t rat
e (%
)
Source: Eurostat (2013) (online data code: tps00159 & lfsa_e2gis). In Greece, the part – time employment pattern for men was increased from 2.3% in
2002, to 2.9% in 2006 and 4.9% in 2012. For female population of the country, the rates range
from 8% in 2002, to 10.2% in 2006 and 11.9% in 2012. The highest difference between men
and women was observed in the year of 2007 with 7.4% (Figure 7), (Eurostat 2013).
Figure 7. Part – time employment rates by gender in Greece, for 2002 – 2012
0.0
2.0
4.0
6.0
8.0
10.0
12.0
14.0
2002 2003 2004 2005 2006 2007 2008 2009 2010 2011 2012
Years
Par
t - ti
me
empl
oym
ent r
ate
(%)
Female Male
Source: Eurostat (2013) (online data code: tps00159 & lfsa_e2gis).

Journal of Regional Socio-Economic Issues, Volume 3, Issue 3, September 2013
21
5. Conclusion
In an era of financial crisis, the European labor market is of course changing. In this short
paper, we have approached the issue of labor market based on the latest data from Eurostat.
We attempted to review some of the main aspects of the European labor market, such as
employment rates and participation in part – time jobs, distinguished by gender. But despite
formal commitments and promises, the gap between men and women remains. On this
account, we are absolutely convinced that understanding employment also by gender is
essential for the attainment of equality between men and women in response to the current
financial crisis. Despite the hardships, women can play a significant role in the labor market
landscape. A possible interpretation is that technology could have a similarly polarizing effect
on employment rates everywhere, together with the speed of policy response across European
countries and the initial structure of the labor market. The persistent segregation of household
activities is the main factor justifying the increased partial employment of women and
reduced hours of work, which does not allow the promotion to positions of increased
responsibility and work full time.
Therefore, women are less likely to be the main workers in the family. But despite the
seemingly better conditions for workers in part - time employment in terms of working time
flexibility is precisely the workers who have little access to positive aspects of work, such as
training. This reflects in this way, the disadvantages of part - time workers (European
Foundation for the Improvement of Living and Working Conditions, 2007; Eurostat, 2013). In
other European countries, the high cost of childcare enhances also the part - time employment
for women. However it should be noted that part - time employment is still associated more
with women’s work (European Foundation for the Improvement of Living and Working
Conditions, 2007).
Another explanation given for the high part – time employment rate in countries, such
as the Netherlands and Germany, is the support by government subsidies. This kind of policy
contributes to maintaining employment levels, since many enterprises retain workers on
shorter hours (Torres 2010).
Thus, it is in the hands of governments, institutions and organizations to untie the
Gordian knot of the European and especially of the Greek labor market. The employment
policy of the European Union should follow new norms in terms of jobs, in order to follow
the new slogan “New skills for new jobs” of “Europe 2020” Strategy. Consequently, Greece
as a country - member of the European Union should follow the line of European politics,
since it is characterized by a great increase in part - time jobs and informal economy.

Journal of Regional Socio-Economic Issues, Volume 3, Issue 3, September 2013
22
6. References
De Beer, P. (2012). “Earnings and income inequality in the EU during the crisis,”
International Labour Review, 151, 4, pp. 313–331.
Dwyer, R. (2013). “The Care Economy? Gender, Economic Restructuring, and Job
Polarization in the U.S. Labor Market,” American Sociological Review, 78, 3, pp.
390-416.
Eurofound (2008). More and better jobs: Patterns of employment expansion in Europe,
ERM Report 2008, Publications Office of the European Union, Luxembourg.
Eurofound (2011). Shifts in the job structure in Europe during the Great Recession,
Publications Office of the European Union, Luxembourg.
Eurofound (2013). Employment polarization and job quality in the crisis, European Jobs
Monitor 2013, Publications Office of the European Union, Luxembourg.
European Foundation for the Improvement of Living and Working Conditions (2007).
Working conditions in the European Union: The gender perspective”. Office for
Official Publications of the European Communities, Luxembourg.
European Restructuring Monitor quarterly (2012). Issue 3 - October 2012. Retrieved in
12 November 2012.
http://www.eurofound.europa.eu/emcc/erm/templates/displaydoc.php?docID=72
European Restructuring Monitor quarterly (2013). Issue 4 – January 2013. Retrieved in
25 March 2013.
http://www.eurofound.europa.eu/emcc/erm/templates/displaydoc.php?docID=74.
Eurostat (2013). “Employment Statistics”, Statistics Explained (2013/3/6)
http://epp.eurostat.ec.europa.eu/statistics_explained/index.php/Labour_markets_atregio
nal_level. Retrieved in 9th March 2013.
Fernández-Macías, E. (2012) “Job Polarization in Europe? Changes in the Employment
Structure and Job Quality, 1995-2007,” Work and Occupations, 39, 2, pp. 157-182.
General Secretariat of the Council (2012). “Financial crisis. Key Terms in 23 languages”,
European Union, Belgium.
Goos, M. and Manning, A. (2007), “Lousy and lovely jobs: The rising polarisation of
work in Britain,” The Review of Economics and Statistics, 89, 1, pp. 118–133.
Goos, M., Manning, A. & Salomons, A. (2009). “Job polarisation in Europe,” American
Economic Review: Papers and Proceedings, 99, 2, pp. 58 – 63.
Goos, M., A. Manning and A. Salomons (2010). “Explaining Job Polarization in Europe:
the Roles of Technology and Globalization”, CEP Discussion Papers, No. 1026, Centre
for Economic Performance.
IILS (International Institute for Labour Studies) (2009). World of Work, Report 2009:
The global crisis and beyond. IILS, Geneva.
Leschke, J. & Jepsen, M. (2012). “Introduction: Crisis, policy responses and widening
inequalities in the EU,” International Labour Review, 151, 4, pp. 289 – 312.
Oesch, D. and Rodriguez Menes, J. (2011). “Upgrading or polarization? Occupational
change in Britain, Germany, Spain and Switzerland, 1990-2008,” Socioeconomic
Review, 9, 3, pp. 503-531.
Stiglitz, J. (2009). “The global crisis, social protection and jobs,” International Labour
Review, 148, pp. 1 – 13.
Stratigaki, Μ. (2008). «1957 – 2007: Πενήντα Χρόνια Πολιτικών Ισότητας στην Ε.Ε», in
Stratigaki (ed.), Sex Equality Policies. European Directives and National Practices (in
Greek) [“Fifty Years of Equality Policies in the EU”, in M. Stratigaki (ed.), Policies
for Gender Equality: European Directions and National Experiences], pp. 15 - 64.
Athens: Gutenberg.
Stratigaki, Μ. (2011). «Sex Equality Policies in Greec and in European Union (in Greek).
The National Program for Real Equality 2010 – 2013 (in Greek)». [Policies of

Journal of Regional Socio-Economic Issues, Volume 3, Issue 3, September 2013
23
Gender Equality in Greece and European Union. The National Program for Essential
Equality 2010 – 2013]. Institute of Strategic and Development Studies (ISTAME).
Online Publication:http://www.istame.gr/files/PDFs/2011/ EKDHLWSEIS/OMILIES-
PPP/Stratigaki22112011.pdf
Torres, R. (2010). “Incomplete crisis responses: Socio-economic costs and policy
implications,” International Labour Review, 149, 2, pp. 227 - 237.
Wright, E. O. and Dwyer, R. E. (2003). “The patterns of job expansions in the United
States: A comparison of the 1960s and 1990s,” Socio-Economic Review, 1, 3, pp. 289-
325.

Journal of Regional Socio-Economic Issues, Volume 3, Issue 3, September 2013
24

Journal of Regional Socio-Economic Issues, Volume 3, Issue 3, September 2013
25
Gentrification in the frame of Tourism: A case study in the City of Athens
Abstract:
Recently, in Greek cities, there is an ongoing debate among urban researchers about which is
the most appropriate method for measuring urban renewal in the city of Athens, while at the
same time taking into account its peculiarities. Last years, it is observed that the Urban
Renewal term progresses to the idea of qualitative regeneration of central regions. Urban
renewal interventions are taking place in different spaces and scales in Athens, but especially
it is more obvious the phenomenon of Gentrification. Gentrification, as a specialized term of
urban renewal, circumscribed, analyzed and evaluated using different tools and always in
relation to methodological differences. The relationships between variables and indicators are
the first step in the analysis, and then paired with one of the most appropriate simulation
model. The final result is a gentrification model which may be applied in any neighborhood of
Athens and it can be used as a tool for urban renewal, historic preservation and tourism. By
this effort through the simulation capabilities of specialized spatial analysis tools, give us the
perfect prospects for further research, even if there is great range and important levels of
complexity in such urban phenomena.
Key words: Gentrification, Urban renewal, Development, Geographical Information
Systems, Tourism Gentrification
Margarita Stergiou1 and Georgios Sidiropoulos
2
1 Corresponding Address: Margarita Stergiou, Department of Geography, University of the Aegean, University
Hill, Mytilene, 81110, Greece. Email: [email protected]
2 Corresponding Address: Dr. George Sidiropoulos, ΑssociateProfessor, Department of Geography, University
of the Aegean, University Hill, Mytilene, 81100, Greece. Email: [email protected]
Journal of Regional Socio-Economic Issues, Volume 3, Issue 3, September 2013
26
1. Introduction
In the modern world, urban renewal interventions in urban space, is a common challenge that
takes place either extensively within the urban fabric or on a smaller scale. The urban identity
even at neighborhood mutates over time, and in recent years, it has spread more and more
widely a change in the concept of urban renewal that transcends the umbrella of quality
renaissance. The concept of gentrification taking active action on the relocation of the middle
class in refurbished or renewed properties of neighborhoods of cities, where previously
inhabited by low income populations. Sometimes, gentrification connects with the term
Tourism Gentrification, which refers to the transformation of a middle-class neighborhood
into an affluent enclave ruled by a proliferation of corporate entertainment and tourism
venues. Especially, Athens, as a Mediterranean city translates this phenomenon according to
local peculiarities of this city. The research focuses in this phenomenon during the last five
years, a period before and during the crisis. The interpretation of Gentrification and Tourism
Gentrification has many dimensions and depends on which aspect the phenomenon is
recognized. After defining the concept of gentrification, it is reasonable in the next chapters to
identify the connection of gentrification with tourism and historic preservation, to evaluate the
detailed measurement tools of such a phenomenon as the methodological particularities in
each case. Gentrification is not the same everywhere and a deeper more nuanced
understanding of its heterogeneity, and complexity, must be achieved through geographically
sensitive research that pays close attention to both temporal and spatial context (Lees L.,
2000). In the end, it’s the presentation and the discussion of the results and the first
conclusions.
2. Analysis of Gentrification in combination with historical preservation and tourism
development
Historic preservation has begun to be viewed by cities and planners as a means to economic
development and urban renewal. The term historic preservation implies the maintenance of
both the social environment and the physical environment (Bures R., 2001). Gentrification, on
the other hand, implies the improvement of the physical environment at the expense of the
existing social environment (Bures R., 2001). In the European context, some cities have taken
a different approach and place greater emphasis on maintaining social diversity in
redeveloped areas (Fitch M., 1990). Gentrification is depending on its geography (Lees L.,
2000). Both historic preservation and gentrification are social processes that evolve over time
(Bures R., 2001). Historic preservation, gentrification, and tourism are three related, yet
distinct, redevelopment processes (Bures R., 2001). Tourism is an “invisible” industry, that’s

Journal of Regional Socio-Economic Issues, Volume 3, Issue 3, September 2013
27
why it became lately as one of planning’s “emerging specializations” (Harrill R. & T.Potts,
2011). All three can lead to improvements in the physical environment of a city but will have
different consequences for the social environment according to two theoretical perspectives:
human ecology and political economy (Bures R., 2001). The changing ecology of
communities leads to neighborhood succession, while changes in the political economy of an
area may result in the dislocation of residents (Bures R., 2001). Gentrification emerged as a
consequence of historic preservation and the preservation movement originated as a strategy
to control development (Bures R., 2001).
Recently, economic and political support for historic preservation have accelerated the
gentrification process and contributed to the growth of tourism as a major industry in the city
(Bures R., 2001). Perhaps the most important economic benefit resulting from historic
preservation is in its effects on the tourism industry (Lapenas D., 2002). Historic preservation
is also valuable in that it helps conserve scarce economic resources by promoting reuse of
existing buildings and infrastructure (Lapenas D., 2002). For example, historic preservation
districts in tourism cities play two important roles: a tourism attraction and a “symbolic
community” important to the city’s identity (Harrill R. & T.Potts, 2011). Something that also
happen, by the process of gentrification and that’s why a new term has come up known as
“tourism gentrification”. In other words, this represents one of the contradictions often
inherent in preservation: present-day communities may be destroyed in order to restore the
past, but at the same time is a opportunity to regain a sense of community identity that is often
lost in the process of urbanization (Bures R., 2001). It is important that all of these
perspectives are considered when measuring the success or failure of an economic
development strategy to ensure that the community is experiencing development and not
simply economic growth regardless of its effects on quality of life issues (Lapenas D., 2002).
But the governmental strategy to use gentrification to increase the city’s competitiveness is a
questionable tactic (Riegler J., 2011). This can potentially lead to significant divisions
between different economic classes, races, and other groups within communities as some
residents begin to view building and renovation regulations as limiting or beyond their
financial means (Lapenas D., 2002). One other of the biggest concerns about historic
preservation is the gentrification that may divide communities and cause resentment once an
area has begun to redevelop (Lapenas D., 2002). The final problem with using historic
preservation as a means to economic development is again one that could apply to all
economic development strategies (Lapenas D., 2002). This is the fact that it simply will not be
able to work for all areas that struggle from physical, social and economic decay (Lapenas D.,
Journal of Regional Socio-Economic Issues, Volume 3, Issue 3, September 2013
28
2002). Not all areas are equally inviting or capable of supporting tourism, and there are only
so many heritage tourists in the world to support every widespread little tourist town, rural
landscape, and historic urban neighborhood (Lapenas D., 2002).
Tourism gentrification highlights the twin processes of globalization and localization
that define modern urbanization and redevelopment processes (Gotham K., 2005). Tourism
may be a ‘global’ force, it is also a locally based set of activities and organizations involved in
the production of local distinctiveness, local cultures and different local histories that appeal
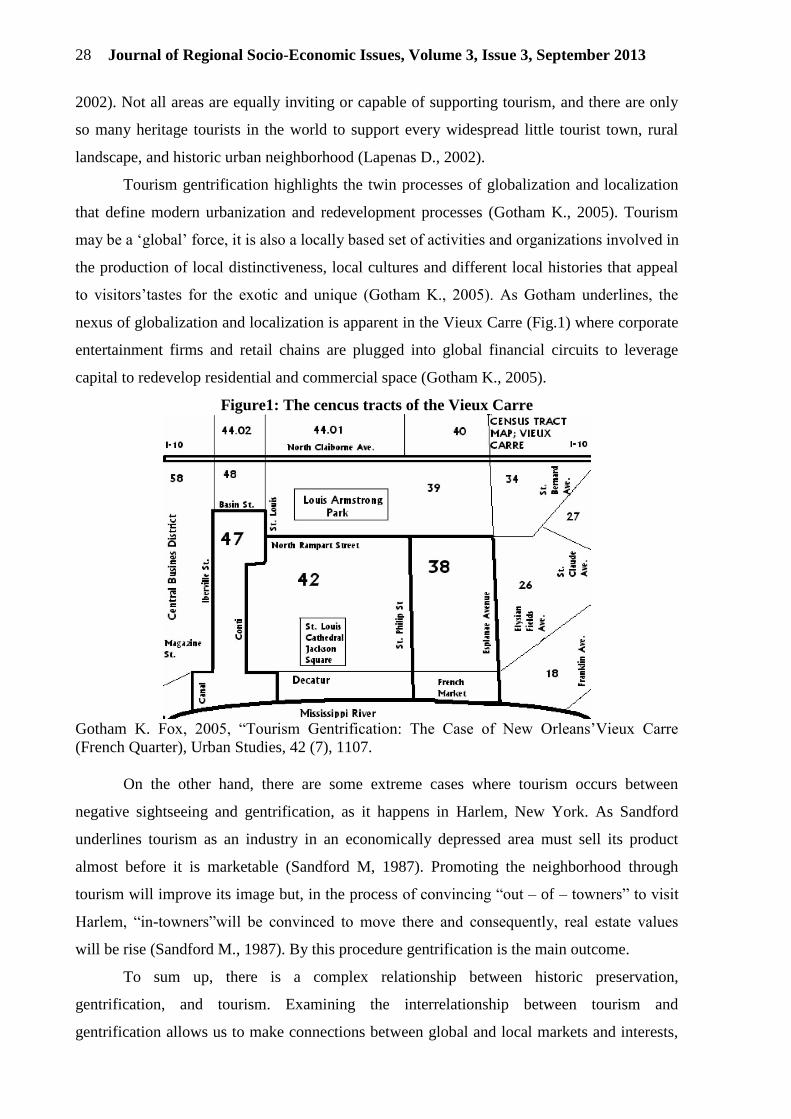
to visitors’tastes for the exotic and unique (Gotham K., 2005). As Gotham underlines, the
nexus of globalization and localization is apparent in the Vieux Carre (Fig.1) where corporate
entertainment firms and retail chains are plugged into global financial circuits to leverage
capital to redevelop residential and commercial space (Gotham K., 2005).
Figure1: The cencus tracts of the Vieux Carre
Gotham K. Fox, 2005, “Tourism Gentrification: The Case of New Orleans’Vieux Carre
(French Quarter), Urban Studies, 42 (7), 1107.
On the other hand, there are some extreme cases where tourism occurs between
negative sightseeing and gentrification, as it happens in Harlem, New York. As Sandford
underlines tourism as an industry in an economically depressed area must sell its product
almost before it is marketable (Sandford M, 1987). Promoting the neighborhood through
tourism will improve its image but, in the process of convincing “out – of – towners” to visit
Harlem, “in-towners”will be convinced to move there and consequently, real estate values
will be rise (Sandford M., 1987). By this procedure gentrification is the main outcome.
To sum up, there is a complex relationship between historic preservation,
gentrification, and tourism. Examining the interrelationship between tourism and
gentrification allows us to make connections between global and local markets and interests,

Journal of Regional Socio-Economic Issues, Volume 3, Issue 3, September 2013
29
as well as between production-side and demand-side explanations of urban change (Bures R.
& C.Cain, 2000). In utilizing historic preservation in economic development and urban
revitalization, it is extremely important to do specific planning and consideration before any
projects are presented to the public (Lapenas D., 2002). While change is an important part of
the urban environment, we need to consider more innovative approaches to maintaining
community and social environment while preserving the physical environment (Bures R.,
2001). That’s the main reason that leads the research to focus on developing the best
methodology for such phenomena. Understanding patterns of growth and change in Athens
can help urban scholars better anticipate the consequences of tourism and gentrification for
the social environment.
3. The methodology approach in the City of Athens
Briefly, the methodological approach of an urban phenomenon as gentrification requires the
analysis of theoretical base both locally and globally. Then, perform a review of methods and
techniques followed by the international literature, understanding the components surrounding
this phenomenon. A combination of quantitative and qualitative methodological approaches
are necessary. The key question is whether Athens is ready for such a phenomenon and how it
could address any of the assumptions.
Then, at the analysis stage visualize specific indicators that display the phenomenon of
gentrification. Mainly a census-based measure for identifying the changing character of a
neighborhood may be the proportion of “native” residents (Bures R. & C.Cain, 2008). Taking
into account the particularities of the Greek reality and shaping indicators depending on data
availability. The visualization of the indicators outline the current situation and as well if there
is evidence of gentrification or is likely to occur in the area. The method shows that each
index must be visualized separately, then determine the relationships between the variables
and at the end to create an equation (with the above variables) defining gentrification and it
can be re-visualized. The next step involves creating spatial models with CA (cellular
automata) and GIS (geographical information systems), which calculate some parameters that
shape possible growth patterns of gentrification in the city. Once selected the appropriate
patterns in time parameter, it will start production models, like flexible recording of data in
databases. Finally, there is a cartographic visualization of data and results, so as to draw
conclusions and make suggestions.

Journal of Regional Socio-Economic Issues, Volume 3, Issue 3, September 2013
30
3.1. Measurement Tools of gentrification
The international literature has shown that the use of Geographic Information Systems (GIS)
in conjunction with cellular automata (CA), is one of the most appropriate solutions for the
management of urban gentrification. Furthermore, the two main features of CA based models
is the realism and interactivity (Takeyama & Clouclelis, 1997). GIS additionally give the
possibility through the spatial statistics to identify the effects of variables of the indicators, as
well as the degree of interaction between them. Regression method is again investigating the
dependence of the values of a variable with the corresponding values of one or more other
variables (Halkias, 2006). Visualization of Indicators, statistical analysis and spatial analysis
capabilities of GIS can be used to work actively for decisions and policies (Sidiropoulos G. &
M. Stergiou 2012).
Analyzing gentrification through specific indicators is not easy procedure.
Specifically, the most important is the age of the building stock, changes in real estate taxes
(or increases the value of land) and market prices (price changes in land value) to determine
locations with gentrification (Levy L., 2009). At this point, it’s important to underline the
difficulty in studying the population shift, social involvement, whereas it is easier to identify
any demographic changes, for instance these gentrification variables by Atkinson (Atkinson
R., 2000). Nevertheless, GIS is identifying and analyzing the dynamic nature of the
phenomenon. The term dynamically means changes made in space and time (Fig.2). Within a
system, the dynamics is the DNA of the digital system (Dietzel & Clarke, 2004).
In conclusion, the main urban CA models that can implement an urban phenomenon
as gentrification are the following: Sleuth, model O'Sullivan, the model of Nuno Pinto, model
re -gentrification. Each individual has its advantages and disadvantages during application.
Today, this Mediterranean city shows a multiplex model in its urban systems, the dynamics
that affect the urban space are various and sometimes contradictory. Especially, the last
decade with the host of Olympic Games in 2004, many policies were implemented with
urgent rhythms. The most known plan was referred to the pedestrianisation of an area which
connects the main archaeological sites. This project affected immediately the around areas,
giving the chance to phenomena as gentrification to Psiri and to Metaksourgio Area (Dritsa,
2009).
Journal of Regional Socio-Economic Issues, Volume 3, Issue 3, September 2013
31
3.2. The Particularities of Athens
Any attempt to measure such an urban phenomenon must take into consideration the
circumstances and factors prevailing in each case study, even within the same city. The
particularities of the city of Athens are diverse both in theoretical and practical side. This
paper is an attempt to identify these particular elements that need to be taken into account by
the designer to be able to investigate this phenomenon in the Athenian neighborhoods.
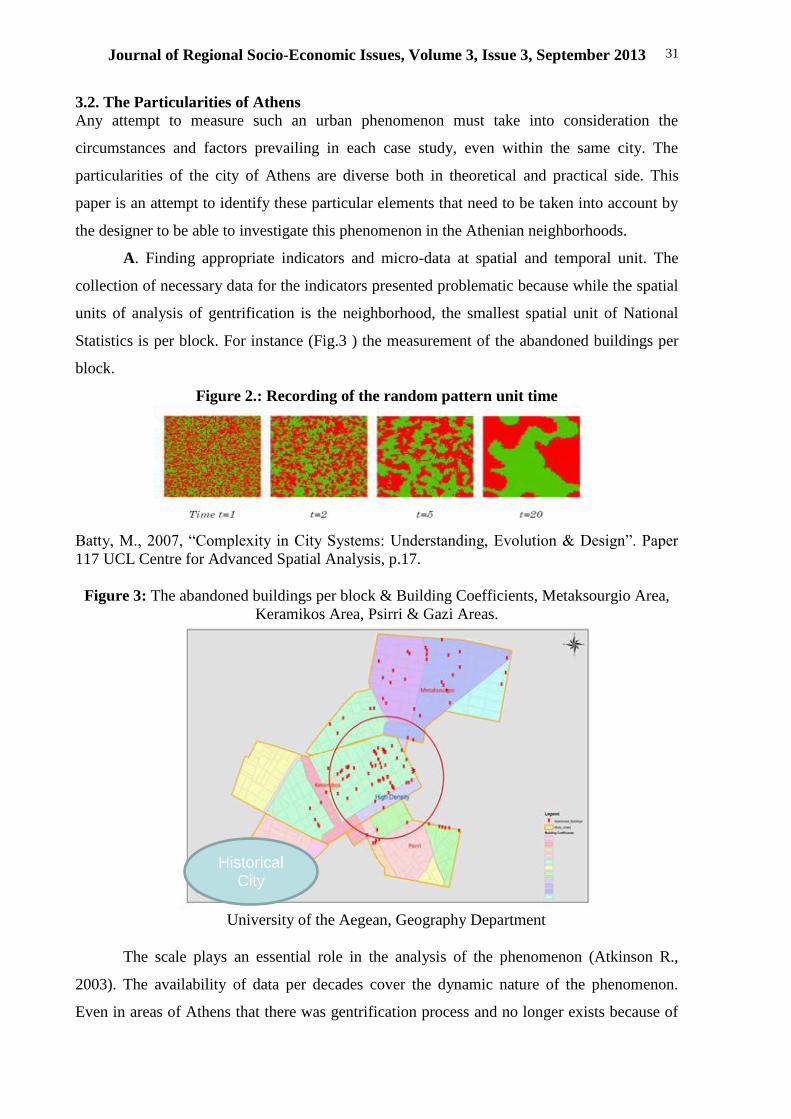
A. Finding appropriate indicators and micro-data at spatial and temporal unit. The
collection of necessary data for the indicators presented problematic because while the spatial
units of analysis of gentrification is the neighborhood, the smallest spatial unit of National
Statistics is per block. For instance (Fig.3 ) the measurement of the abandoned buildings per
block.
Figure 2.: Recording of the random pattern unit time
Batty, M., 2007, “Complexity in City Systems: Understanding, Evolution & Design”. Paper
117 UCL Centre for Advanced Spatial Analysis, p.17.
Figure 3: The abandoned buildings per block & Building Coefficients, Metaksourgio Area,
Keramikos Area, Psirri & Gazi Areas.
University of the Aegean, Geography Department
The scale plays an essential role in the analysis of the phenomenon (Atkinson R.,
2003). The availability of data per decades cover the dynamic nature of the phenomenon.
Even in areas of Athens that there was gentrification process and no longer exists because of
Historical City
Center

Journal of Regional Socio-Economic Issues, Volume 3, Issue 3, September 2013
32
the crisis, there is no precise evidence to prove as the official Census is every ten years. This
directly creates the need for a qualitative analysis or even for field research. In some cases, it
is necessary to create a new map in micro-scale to better identify the phenomenon. In most
case studies are necessary to adapt the theories and change indicators to be closer to the
assumptions of the research.
B. The type of coupling GIS and CA and the decision of the appropriate model CA is
highly the actual picture of the phenomenon in the urban space. Basic criteria for selection of
the model are as follows according to O'Sullivan: (a) in most applications the urban systems
relax the notion of neighborhood and underline the meaning action at a distance, (b) there is
difficulty at the scale of urban systems, if there are different procedures for each cell, (c) the
need for the CA to meet the rates change and (d) the use of GIS and geo-algebra (O'Sullivan,
2002). While also important particularity in the systems is the type of coupling for the best
resolution of space. In some cases the researcher selects the necessary data for the model
without giving importance to the spatial resolution, and sometimes the spatial resolution is so
detailed that the simulation time is greatly increased (Dietzel & Clarke, 2004). Finally, it is
important to note that for the assessment of the results, three are the numerical adaptation
indicators of results, the mean error of the map, indicators Lee-Sallee and Kappa (Mandela
2011). So technically, the results are detailed.
C. Selection of the appropriate gentrification theory for each study area. In some cases
it is necessary to analyze if the area is below one of the three main theories of gentrification or
it occurs with association theories. This is a direct consequence of the setting of the
parameters and the establishment of appropriate indicators. Specifically, for Athens proposed
a model where coexist all variations of gentrification (Alexandri G., 2011). Especially for the
phenomenon of gentrification, the international literature supports practically the CA, but not
in all theories of analysis, CA is ideal for Rent Gap Theory (O'Sullivan, 2002).
It is very important to underline that gentrification in Greece as a phenomenon, is not
developed in the same way as in other western societies. Therefore, a method or program
followed in another country or region, may not be enforceable in the same manner and in the
case case of gentrification in Athens. The context of the Greek case may be associated with
cases similar to those of the literature and sometimes be completely distinct. A typical
example is the analysis of building stock, which sometimes has a social character and
sometimes associated with profit from urban land. The empirical measurement, most often in
studies of gentrification, is not correctly link the explanation of the phenomenon and
measurements (Rowland and Wulff, 2009). Depending on the area of research, it is better to

Journal of Regional Socio-Economic Issues, Volume 3, Issue 3, September 2013
33
focus at a time and the goal of the researcher as well as the assumptions chosen as the main
components.
The term Gentrification is new and mainly it is implemented point like. There are just
a few common points between the classic theories of Gentrification of Anglo-American cities
and Greek planning. In Greek cities there are not areas with important size close to city center
with industrial or similar uses, which can be gentrified and change the current land uses. The
urban land is fragmented in such a degree that Gentrification process occurs in a small scale,
which lead to the conclusion that there is no change of the degraded identity. Furthermore, the
building stock belongs to individuals and not to the state, something that blocks the
implementation and the control of gentrification. As far as the tourism gentrification, it may
be implemented only in areas close to the historical city center or the archaeological areas.
3.3 Discussion
Athens as a Mediterranean city is trying to be a business center or a tourism cultural center.
The current situation in Athens, the last decade, has features such as change in composition of
the population, the increase in average income, the reduction in household size, the increase in
property prices means higher rents, rising asset values, crime reduction, changing the identity
of the neighborhood and its environment, increase or decrease of urban spaces and significant
changes in ownership. The last four years due to the economic crisis many of these factors
have changed. Nowadays, with the economic crisis, there is also a social crisis in Athens (the
increasing number of unemployment, the strikes, the increasing taxes, the homeless people,
the narcotics and even events of urban violence). On the one hand, there are neighborhoods
which show tendencies to gentrify, with young people that prefer to live in the center close to
their workplace or to cultural events. Of course this is not the main rule, as the unemployment
effects young educated people mostly, something that leads these people to turn back to their
families’ home. Furthermore, families do not prefer to live in the city center, as it is not the
ideal place for children. On the other hand, the city center living conditions have deteriorated
since the housing stock get older, the social condition gets mixed, and some areas are
neglected by the state (Alexandri, 2011). Moreover, in the degraded areas of the city center,
where is there is enough building stock, prefer to live foreigners of lower occupational
categories. In the current study maintained an average and studied if in the area of interest (eg.
Gazi) there were obvious signs of gentrification, if the process of gentrification continues, if it
has been stopped or if there is evidence of re-gentrification.

Journal of Regional Socio-Economic Issues, Volume 3, Issue 3, September 2013
34
Gentrification in Athens takes place individually and through various nests in the
urban fabric of Athens.The dominant question that requires further investigation is whether
the infrastructure and socio - economic peculiarity of the country allow the operation of such
a model and what are the possible modifications that need to accompany that strong efficacy.
The specifications, tools and specificities of research in urban geography of Athens listed
above, while success for research is the correct "translation" of the phenomenon in the
Athenian neighborhood and proper coding of the operating systems. The urban geography
involves the analysis of this factor. Because the false sense of homogeneity and zoning
derived primarily from external scholars of space and in many cases is not verified by the
residents (Sidiropoulos & Tsilimigkas, 2010). In conclusion, gentrification is a phenomenon
to be quantified must first be interpreted qualitatively.
This research aims to standardize the concept of urban renewal, particularly the
gentrification. The specification of key parameters, assess and evaluation of them,
manifesting in such a manner and to such an extent as to become a key analytical tool in this
process of urban renewal. Furthermore, through this process identifies the key requirements in
statistical material in order to develop suitable lines for this purpose and broad objectives in
the operation of the city. The time of the application can give an evolutionary development
model phenomenon for the study area but at the same time applicable to other urban centers
or neighborhoods.
The gentrification model will occur should be able to record changes in the region, its
historical development, social dimension, and economic phenomena that occur in the study
area. The pilot study in specific neighborhoods in both cities and suburbs to city centers such
as Athens (in certain districts), or the transformation of each study area could be developed
and appropriate models approach and the proper simulation of the change. The detailed data
collection will contribute to better implementation of rehabilitation programs, where you can
reach the potential impact from the beginning. The indicators should be created to cover all
the parameters and their evolution within the city limits.The depth of the analysis of patterns
should be enough to allow a comprehensive critical approach such a complex phenomenon
and the results should not be confused.
4. Conclusions
Ultimately, by analyzing the theoretical background of the concept of gentrification (and
urban renewal), it is obvious that in Athens there is not a standard strategy that can be
implemented. Probably, the best choice will be a combination of the above theories. As far as,

Journal of Regional Socio-Economic Issues, Volume 3, Issue 3, September 2013
35
the proper software (GIS and CA), data and the production of suitable models to each
circumstance depends on the specificity of Athens and her opportunities for research. The
production of the prediction model, is quite difficult to be implemented at Greek society to the
similar degree as to other metropolitan areas. However, through this simulation, there are
prospects for further research, so as to manage such complex urban phenomena, as
gentrification, to similar Greek cities or neighborhoods. As far as the gentrification and the
tourism gentrification, it is clear that in Athens there are prospects for both phenomena but it
depends on the goal of it’s implementation.
5. References
Alexandri G., 2011, The Breeder Feeder: Tracing Gentrification in Athens City Center, The
struggle to belong, Dealing with diversity in 21sr century urban settings. Amsterdam.
Atkinson R., 2000, “Measuring Gentrification and Displacement in Greater London, Urban
Studies”, 37 (1), 149-165.
Atkinson R., 2003, “Introduction: misunderstood savior or vengeful wrecker? The many
meanings and problems of gentrification”, Urban Studies, 40(12), 2343 - 2350.
Batty, M., 2007, “Complexity in City Systems: Understanding, Evolution & Design”. Paper
117 UCL Centre for Advanced Spatial Analysis, p.1-36.
Bures R., 2001, Historic preservation, gentrification, and tourism: The transformation of
Charleston, South Carolina, in Kevin Fox Gotham (ed.) Critical Perspectives on Urban
Redevelopment (Research in Urban Sociology, Vol. 6), Emerald Group Publishing
Limited, 195-209.
Bures R. & C.Cain, 2008, “Dimensions of Gentrification in a Tourist City”, University of
Florida, Department of Sociology, Meeting of the Population Association of America.
Clarke K. C. and Gaydos L., 1998, "Loose-coupling a cellular automaton model and GIS:
long-term urban growth prediction for San Francisco and Washington/Baltimore."
International Journal of Geographical Information Science, 12(7), 699-714.
Dritsa A. (2009), Areas with Urban Renewal -phenomena of Gentrification- the example of
Metaksourgio, National Technical University of Athens.
Dutton, P. (2003). Leeds calling: the influence of London on the gentrification of regional
cities. Urban Studies, 40(12), 2557 – 2572.
Fitch M., 1990, Historic Preservation, University of Virginia Press, Charlottesville.
Gotham K. Fox, 2005, “Tourism Gentrification: The Case of New Orleans’Vieux Carre
(French Quarter), Urban Studies, 42 (7), 1099-1121.
Halkias, C., 2006, “Terms & Concepts Geographical Information Science”, 1st ed.,
Publications Ion, Athens.
Harrill R. & T. Potts, 2011, “Tourism Planning in Historic District: Attitudes Toward
Tourism Development in Charleston”, Journal of the American Planning Association,
69 (3), 233-244.
Lapenas D., 2002, Historic Preservation:Gentrification or Economic Development, State and
Local Economic Development, Skidmore College.
Lees L., 2000, “A Reappraisal of Gentrification: Towards a ‘Geography of Gentrification’,
Progress in Human Geography, 24 (3), 389-408.
Levy L., 2009, “Mapping Gentrification in Pilsen: Community Empowerment through GIS
Technology”, L. S. S. C. Knowledge, DePaul University.
Mantelas L., 2011, “Numerical simulation of urban expansion by using fuzzy cellular

Journal of Regional Socio-Economic Issues, Volume 3, Issue 3, September 2013
36
automata”, Department of Rural and Surveying Engineering, NTUA, Athens.
O'Sullivan D., 2002, Toward micro-scale spatial modeling of gentrification. Journal of
Geographical Systems, 4(3), 251-274.
Riegler J., 2011, “Competitiveness VS Social Balance: Gentrification as Urban Policy in
Cases in Budapest and Vienna”, Culburg Workshop, Budapest.
Rowland A. and Wulff M., 2009, Gentrification and displacement: a review of approaches
and findings in the literature, Australian Housing and Urban Research Institute
(AHURi), 1-30.
Sandford M., 1987, “Tourism in Harlem: Between Negative Sightseeing and Gentrification”.
Journal of American Culture, 10, 99-105.
Sidiropoulos G. & G. Tsilimigkas, 2010, The question of urban violence: The case of Athens
Tech. Years. Homewares. Publ. Tee, No. 3, 163-173.
Sidiropoulos, G. & M. Stergiou, 2012, “The Urban Renewal and Cellular Automata -The
example of Athens”, 7th National Conference HellasGI, Geographic Information \
Systems, Athens.
Takeyama M. and Couclelis H., 1997, "Map dynamics: Integrating cellular automata and GIS
through Geo-Algebra." International Journal of Geographical Information Science,
11(1), 73-91.

Journal of Regional Socio-Economic Issues, Volume 3, Issue 3, September 2013
37
Innovation Dynamics: Transforming the European Union Economy
Abstract:
These days there is an on going discussion about the recession and the crisis in European
Union. Among other solutions the economists and experts are suggesting heavily the
entrepreneurship through innovation. The following paper is going to examine the situation in
Greece and European Union as far as it concerns the terms of entrepreneurship and
innovation. At the same time the SMEs of the region of Crete will be used as case study.
Keywords: Entrepreneurship and regional development, economic geography, management
of innovation
Fragkiskos Xirouchakis1
1 Corresponding Address: Fragkiskos Xirouchakis, University of the Aegean, Department of Geography, School
of Social Sciences, University Hill, 81100 Mytilene, Greece. Email: [email protected]

Journal of Regional Socio-Economic Issues, Volume 3, Issue 3, September 2013
38
1. Introduction
1.1 What is Innovation?
The Austrian economist Joseph Shumpeter was one of the founders of the theory of the
innovator entrepreneur (creative destruction). According to Shumpeter (1934) the innovations
can be radical or gradual. The main suggestions that he made were :
The introduction of a new product (either good or service)
The quality improvement of an existing product
The development of an innovation process which is new for an industrial sector
The opening of a new market
The conquest of a new source of supply of new materials or parts
The implementation of changes in the organasisation of the industry
The four elements of innovation are (a) the invention (b) the innovation (c) the
planning (d) the transfer and diffusion of technology (Carayannis E. & Bakouros I-2010,
Korres G-2010).
2. Main Definitions
2.1 The Measurement of Innovation Activities
According to the manuals of innovation there are four important distinctions of innovation.
The Oslo manual defines the innovation in the categories of technological and no
technological innovation. The Frascati manual focuses on R&D and related activities. The
Canberra manual focuses on human resources in science and technology. The Patent manual
focuses on using patent data as science and technology indicators (Korres G. and
Polychronopoulos G. -2011). The table 1 illustrates the OECD methodological manuals.
Table 1: OECD methodological manuals
Type of data Title
Α ‘The Frascati family’ The measurement of Scientific and
Technological Activities Series.
R&D Proposed Standard Practice for Surveys
of Research and Experimental
Development (Frascati Manual). R&D
Statistics and Output Measurement in the
Higher Education Sector
(Frascati Manual Supplement
OECD,1989b)
Technology balance payments Manual for the Measurement and
Interpretation of Technology Balance of
Payments Data – TBP Manual (OECD,

Journal of Regional Socio-Economic Issues, Volume 3, Issue 3, September 2013
39
1990)1
Innovation OECD Proposed Guidelines for
Collecting and Interpreting Technological
Innovation Data – Oslo Manual (OECD,
1997a)
Patents Using Patent Data as Science and
Technology Indicators – Patent
Manual 1994 (OECD,
OCDE/GD(94)114, 1994b)1
S&T personnel The Measurement of Human Resources
Devoted to Science and Technology –
Canberra Manual (OECD, 1995)
High-Technology Revision of High-technology Sector and
Product Classification (OECD, STI
Working Paper 1997/2)
Bibliometric Bibliometric Indicators and Analysis of
Research Systems, Methods and
Examples, by Yoshiko Okubo (OECD,
STI Working Paper 1997/1)
΄Β Other relevant OECD statistical
frameworks. Statistics in the field of
education
Methods, techniques and statistical
purposes for the education
programming (OECD,1967)
Education Statistics OECD Manual for Comparative
Education Statistics (forthcoming)
Training Statistics Manual for Better Training Statistics –
Conceptual, Measurement and Survey
Issues (OECD, 1997b)
Notes: (1).Deals mainly with problems of classifying and interpreting existing information.
OECD 2002-Frascati manual (p.16)
2.2 What is entrepreneurship?
This is the way that innovation is linking with entrepreneurship and growth. What is really
entrepreneurship? There are three basics school of thought about what is entrepreneurship.
These are the following:
The Austrian school of thought
The Chicago school of thought
The German school of thought
Von Mizes, Kirzner and Schackle from the Austrian school argue that the entrepreneur
behavior eliminates the mistakes and the adversity in the economy. Knight and Schultz from
the Chicago school of thought define the entrepreneur as an individual who is taking better

Journal of Regional Socio-Economic Issues, Volume 3, Issue 3, September 2013
40
decisions in an extremely risk environment. Von Thuenen and Shumpeter from the German
school of thought define the theory of creative destruction. The entrepreneur is shaping the
economy with his/her behaviour (Audretsch D.-2008, Korres G. -2008).
Among all the theories the Schumpeterian tradition has had the greatest impact on the
contemporary entrepreneurship literature. In his work in 1934 and 1942 Shumpeter defines
the entrepreneurship as a disequilibrating phenomenon. The entrepreneurs seek to reforms or
revolutionizes the pattern of production. This is happening either by creating an invention-a
patent or by producing new product with new technology or even an old product with new
technology (Audretsch D.-2003, Giannitsis T. -1991,Shumpeter -1934).
2.3 Innovation Barriers (internal and external)
Segarra-Blasco (2010), Hadjimanolis (2003) and Neely & Hii (1998) argue that the main
barriers of innovation are internal and external to the firm. The administration model of the
firm and organizational issues can be internal barriers. Examples are the lack of funding of
new ideas, the inappropriate workforce in terms of innovation, the management of the firm
and the no existence of alliances with other companies for technology matters. External
barrier is the inappropriate current legislation (for example patent rights). The culture of
society in terms of innovation and entrepreneurship can be another external barrier (Camagni,
R. & Capello, R.- 1999,OECD-2005, Fagerberg, J.-2005).
2.4 Innovation and Entrepreneurship (The Relationship)- Prons and Cons of SMEs
(Why SMEs?)
The endogenously developed technology and the exogenous technological inputs are
influencing the relationship between entrepreneurship and innovation. The main
characteristics of the endogenously developed technology are the firms R&D department
capability and the skills of the workforce. Examples of the exogenous technological inputs are
the patents, the licenses of technology transfer and last but not least the alliance with other
firms which technological environment is significant better (Palaskas T. and Tsampra M.-
2003). The study of Palaska T. and Tsampra M. (2003) figures that the highly skilled
workforce is the most important innovation in a firm. However the analysts should not
underestimate the role of patents and licences of technology transfer. According to Rothwell
(1988) the most important advantage of the SMEs compare to the MNEs is that they are better
in terms of behavior (for example the telecommunication sector). From the other hand the big
ones are more capable in finance and promote their projects (for example the banking sector)
(Storey D.-2000, Storey D.-2011).

Journal of Regional Socio-Economic Issues, Volume 3, Issue 3, September 2013
41
3. Global Environment-Global Financial Crisis
The current economic recession is creating an uncertain environment on the world economy.
The crisis started as financial (US banking system-large financial institutions), however it
became a crisis for the real economy (like the 1930s Great Depression). The effect of the
economic crisis was not the same across the world. The economic instability in Europe started
in the countries known as the PIGs (Portugal, Italy, Ireland, Greece, Spain) (World Bank-
2013a, World Economic Forum -2012). The most important implications of the crisis are the
increasing social distress, the rise of unemployment, the decrease in the amount of private
consumption, credit reductions and more bankrupt businesses. Especially SMEs are suffering
from demand shock and loss of credit. Carayannis (2006) and Krugman (1996) argue that the
SMEs are very important for the global economic recession. They support the technology
transfer and the regional development. They also increase the regional trade and the
restructuring of the industries. Finally they compete the MNEs (Xiaoni Li, Pere Segarra Roca
and Papaoikonomou E.- 2011).
4. European Context (European Policies-European Financial Crisis)
4.1 European Policies- European Technological Policy
4.1.1 Green Paper on Innovation-Entrepreneurship
The European Commission decided to create the Green paper on innovation in 1995. One of
the reasons of that, was for the European Union to catch up its main competitors USA and
Japan. The Green paper suggests three teen routes of actions and five main aims. The first aim
is the better collaboration among the research and the innovation. For example develop
technology monitoring and foresight. The second aim is to encourage the training and
education of the human resource (Clark J. and Guy K.-1998, Kokkinou A.-2010, Kourliouros
E. and Korres G.-2011). So the workforce can have innovated ideas. The third aim is to
reinforce the funding of innovation. The fourth aim has to do with the establishment of a legal
and regulatory environment which promotes innovation (i.e. promote intellectual and
industrial property). Finally the public state should promote innovation (i.e. eliminate
administration barriers) (Commission of the European Communities, 1995). In addition the
European Union in Barcelona 2002 decided to create the Green Paper on Entrepreneurship.
This happened in order to create new investments, boost the employment and reinforce the
innovation and entrepreneurship (European Commission.- 2003).

Journal of Regional Socio-Economic Issues, Volume 3, Issue 3, September 2013
42
4.1.2 Lisbon Strategy
The Heads of State and Governments decided at the Lisbon Summit in 2000 to support
innovation in European Union with the Lisbon strategy (European Union, 2004). This strategy
targets to transform the European Union by 2010 into the most competitive and dynamic
knowledge-based economy worldwide (Table 2 Emerging Technologies). Table 2 illustrates
the emerging technologies for the EU vis-avis USA and Japan. A lot of things have to be done
in order EU to reach the levels of USA and Japan. At the same time greater social cohesion
occurs with more and better jobs. The dimensions of the Lisbon strategy are the following
three:
Reinforce the creation, absorption, diffusion and transfer of knowledge
Improve the social model
Make the European economic environment stronger and more unite
(Korres G., Tsobanoglou G. and Kokkinou A. ,2011)
Table 2 Emerging Technologies
Europe Vis-à-vis the USA Vis-à-vis Japan
Ahead Digital Imaging
Technology
Flexible computer-
integrated
manufacturing
Flexible computer-
integrated
manufacturing
Software
engineering
technologies
Level Advanced
semiconductors
High-density data
storage
Sensor technology
Software
engineering
technologies
Advanced materials
Artificial technology
Digital imaging
technology
Sensor technology
Superconductors
Biotechnology
Medical equipment
Behind Artificial
intelligence
High-performance
computers
Optoelectronics
Biotechnology
Medical equipment
Advanced
semiconductors
High-performance
computers
Optoelectronics
Advanced materials
High-density data
storage
Source Korres G. (2011) p.204

Journal of Regional Socio-Economic Issues, Volume 3, Issue 3, September 2013
43
4.1.3 European Research Area
A basic tool for the support of innovation and the implementation of the Lisbon strategy was
the European Research Area (ERA). The European Research Era decided in Lisbon 2000 by
the European Commission. The aim was to eliminate the disadvantages of the European
research policies (Korres G., 2011). The main disadvantages were the low percentage of
investing in R&D and the problematic coordination of the research activities. The main
dimensions of the European Research Area are the following:
Creation of a single market for the research
Rebuild and coordinate the research system of the European Union and the research
policies of the individual member states
Develop of a European research policy which is going to have as a main influence the
national and European policies.
(Korres G., Tsobanoglou G. and Kokkinou A. ,2011)
4.1.4 European Innovation Scoreboard-Innovation Union Competitiveness
Another tool for the support of the innovation (Lisbon strategy) is the European Innovation
Scoreboard. The annual report of the European Innovation Scoreboard includes three main
types of indicators, eight innovation dimensions and twenty five different indicators
(Kourliouros E. and Korres G., 2011). The three main types (blocks) of indicators are the
enablers, the firm activities and the outputs. The report monitors innovation trends across the
EU27 member states, as well as Croatia, Iceland, the Former Yugoslav Republic of
Macedonia, Norway, Serbia, Switzerland and Turkey. The report also includes comparison
among EU27 and 10 global competitors (European Commission-2013d, European
Commission-2013b).
The enablers have to do with the first three innovation dimensions which are external
to the firm (Kourliouros E. and Korres G., 2011). These are the human resources, open
excellent and attractive research systems as well as finance and support. Furthermore the first
block includes nine indicators of the total twenty nine. The firm activities cover three
innovation dimensions which are internal to the firm. These are the firm investments, linkages
and entrepreneurship and intellectual assets. The second block includes 11 indicators of the
total twenty nine. Finally the outputs cover two innovation dimensions which reflect the
affects of firm innovation activities. These are innovators and economic affects. The third
block includes nine indicators of the total twenty nine (European Commission-2013d,
European Commission-2013b).

Journal of Regional Socio-Economic Issues, Volume 3, Issue 3, September 2013
44
According to the above the European Union countries are grouped to the following four
distinctions:
Innovation leader countries are the countries with innovation performance well above
that the EU27 average and all other countries
Innovation followers are the countries with innovation performance below those of the
innovation leaders but close or above of the EU27 average
Moderate innovators are the countries with innovation performance below the EU27
average
Modest innovators (catching up countries) are the countries with innovation
performance well below the EU27 average
(European Commission-2013d, European Commission-2013b)
4.2 European Union Context (inter comparisons)
Table 3 illustrates the Innovation Growth Leaders for 2012. The growth performance between
the four groups is very different. Some countries are growing relatively quickly and others
more slowly (Korres G., 2011). Four countries (Denmark, Finland, Germany and Sweden) are
innovation leaders. Denmark is the growth leader of this group. Ten countries (Estonia,
Slovenia, Netherlands, France, United Kingdom, Belgium, Luxembourg, Austria, Ireland and
Cyprus) belong to the second group (innovation followers). Estonia and Slovenia are the
growth leaders of the second group. Nine countries (Lithuania, Malta, Slovakia, Italy, Czech
Republic, Portugal, Hungary, Spain and Greece) are moderate innovators. Lithuania is the
growth leader of the moderate innovators. Four countries (Latvia, Romania, Bulgaria and
Poland) belong to the last group (modest innovators). Latvia is the growth leader of the last
group (European Commission-2013d, European Commission-2013b).

Journal of Regional Socio-Economic Issues, Volume 3, Issue 3, September 2013
45
Table 3 Innovation Growth Leaders
Group Growth rate
2008-2012
Growth
leaders
Moderate
growers
Slow growers
Innovation
Leaders
1.8% Denmark (DK
2.7%)
Finland (FI
1.9%)
Germany (DE
1.8%)
Sweden (SE
0.6%)
Innovation
followers
1.9% Estonia (EE
7.1%)
Slovenia (SI
4.1%)
Netherlands
(NL 2.7%)
France (FR
1.8%)
United
Kingdom (UK
1.2%)
Belgium (BE
1.1%)
Luxembourg
(LU 0.7%)
Austria (AT
0.7%)
Ireland (IE
0.7%)
Cyprus (CY-
0.7%)
Moderate
innovators
2.1% Lithuania (LT
5.0%)
Malta (MT
3.3%)
Slovakia (SK
3.3%)
Italy (IT 2.7%)
Czech Republic
(CZ 2.6%)
Portugal (PT
1.7%)
Hungary (HU
1.4%)
Spain (ES,
0.9%)
Greece (GR -
1.7%)
Modest
innovators
(Catching up
countries)
1.7% Latvia (LV
4.4%)
Romania (RO
1.2%)
Bulgaria (BG
0.6%)
Poland (PL
0.4%)
Source: Innovation Union Scoreboard, 2013
4.2.1 SWOT Analysis of European Innovation Process
The European Innovation Process characterizes from specific features. In order to understand
better the internal and external environment of the European Innovation process the experts
are using the S.W.O.T analysis (Strenghts, Weaknesses, Opportunities and Threats) (Table 4
SWOT Analysis of European Innovation Process) as a policy instrument. It is quite obvious
from the Table 4 that the large number of the SMEs is a weakness as far as it concerns the
competitiveness enhancement and the investment enhancement (Kokkinou A.-2010). From

Journal of Regional Socio-Economic Issues, Volume 3, Issue 3, September 2013
46
the other hand the high skilled human resources is strength for the competitiveness
enhancement, when the small percentage of skilled R&D personnel is a weakness for the
human resources and employment enhancement. The technology and knowledge diffusion is
an opportunity for the competitiveness enhancement. At the same time the fact that the SMEs
can not support effectively knowledge creation and accumulation is a weakness for the
productivity enhancement. However the increase of the technology-based firms is strength for
the R&D infrastructure enhancement. The low degree of specialization and the limited
productive network is a weakness for the investment enhancement, when the regional
disparities in technological expenditure and knowledge diffusion are a threat for the R&D
infrastructure enhancement (Kokkinou A.-2010).
The EU targets to increase the cohesion on technology and innovation issues. The
European Union technological policy aims not only to increase the competitiveness of the
Europe but also to eliminate the national differences and the regional differences of the
countries.
Table 4 SWOT Analysis of European Innovation Process
a) Strategic goal and Development Pillar: Competitiveness enhancement
Strengths High skilled human resources
Weaknesses Large number of Small and Medium
Enterprises (SMEs), low productivity of
public sector, imbalances in labor supply
and demand
Opportunities Modern administrative and law framework,
technology and knowledge diffusion,
clustering enhancement, education
Threats Delays in market liberalization, labor
market rigidities
b) Strategic goal and Development Pillar: Productivity enhancement
Strengths Convergence under Lisbon goals, modern
European technological policies
Weaknesses Bureaucracy, credit market rigidities,
weaknesses of SMEs to support knowledge
creation and accumulation, low value added
Opportunities EU enlargement with countries with
developing economies, low labor cost, high
productivity and value added
Threats Dualism in entrepreneurial activity and
development
c) Strategic goal and Development Pillar: Investment enhancement
Strengths Mobility and diffusion of entrepreneurial
and investment capital, credit market
liberalization

Journal of Regional Socio-Economic Issues, Volume 3, Issue 3, September 2013
47
Weaknesses Large number of SMEs, low degree of
specialization, limited productive network,
low connection of education with market
needs
Opportunities E.U enlargement with developing
economies and markets, European
development and innovation programs
Threats Trade and transport infrastructure
weakness, limited business services
d) Strategic goal and Development Pillar: R&D infrastructure enhancement
Strengths Increase of the technology-based firms,
increase in the technology and innovation
expenditure, connection of knowledge
creation with economic results and
economic products
Weaknesses Low level of R&D expenditure, low
technological infrastructure
Opportunities International trade trends, tax regimes,
European development funds
Threats Regional disparities in technological
expenditure and knowledge diffusion,
imperfect competition in energy market
e) Strategic goal and Development Pillar: Environment protection enhancement
Strengths New energy resources, clean environment
practices
Weaknesses Insufficient Administrative framework
Opportunities Development funds, innovation policies
Threats Global warming, polluting agents
f) Strategic goal and Development Pillar: Human resources & employment
enhancement
Strengths High skilled human capital, education
enhancement, high education expenditures,
higher education participation, international
research activities
Weaknesses Small percentage of skilled R&D
personnel, limited life-long learning, low
human capital mobility
Opportunities Education infrastructure, regional education
and innovation activities
Threats Brain drain towards U.S.A., labor market
rigidities
Source Kokkinou A. (2010) p.96

Journal of Regional Socio-Economic Issues, Volume 3, Issue 3, September 2013
48
4.2.2 Closing innovation divide
Table 3 and the Figure 1 show that regional innovation divergences still exist. At the same
time risk grows with the crisis. A lot of the European countries have regions at different
performance. For the innovative countries innovative regions drive the performance of the
country. This is not happening at the same level for others Member States. According to the
results plenty of regions are more innovative comparing to the countries where they belong.
Therefore the innovation support programmes need better coordination in order to meet the
needs of individual regions (European Commission-2013d, European Commission-2013b).
East of England and South East in UK are innovation leaders when UK is an innovation
follower. Praha is an innovation leader when Czech Republic is a moderate innovator. Lisboa
is an innovation leader when Portugal is a moderate innovator. Attiki in Greece is an
innovation follower when Greece is a moderate innovator. Bucuresti-ifov is a moderate
innovator when Romania is a modest innovator (European Commission-2013d, European
Commission-2013b).
Figure 1 Innovation performance by regions (data for 2012)
The EU Member States Cyprus, Estonia, Latvia, Lithuania, Luxembourg and Malta are not included in
the RIS analysis
Source: Innovation Union Scoreboard, 2013

Journal of Regional Socio-Economic Issues, Volume 3, Issue 3, September 2013
49
4.3 Greek Policies-Greek Financial Crisis
The economic instability in Europe started from Greece. Afterwards the crisis spread to the
south Europe countries. The possibility for Greece and perhaps other countries leaving the
euro, is now feasible (Ioanidis S.-2013, World Economic Forum-2012). At the latest
European Innovation Scoreboard (2013) Greece characterized as a moderate innovator and
slow grower with a negative mark (-1.7%). All the regions of Greece are moderate innovators,
expect Attiki which is the capital region and innovation follower. Therefore Greece is a
homogenous country in terms of innovation performance.
The situation for Greece is even worst in terms of competitiveness. The World
Economic Forum (2012) in the Global Competitiveness Report 2012-2013 ranked Greece in
the 96th position in a total of 142 countries. In this report Greece was the worst country of the
European Union. Greece is even worst compare to Serbia (95th
) and Argentina (94th
) and
slightly better from Jamaica (97th
) and Gambia (98th
). Greece falls another six places in the
rankings compare to the last year report. At the same time Greece ranked in the 87th
position
as far as it concerns innovation (World Economic Forum, 2012). Some of the most
problematic issues for doing business are the inefficient government bureaucracy, the access
to financing and the policy instability (World Bank-2013b, World Economic Forum -2012).
According to the European Commission (2011) the innovativeness of the Greek economy
depends on imported technology and know-how. This means that there are a lot of
organisational and marketing innovations and less on the production and exploitation of new
knowledge. In order to overcome such difficulties, the General Secretary of Research and
Technology in 2011 decided a new strategy for R&D and innovation (European Commission-
2013c, Ioanidis S.-2013). The main directions of the new strategy are the following five:
Agro-food sector
Information and communication technologies sector
Materials/chemicals sector
Energy-environment sector
Health/biomedical sector
At the same time the sector of SMEs includes the 99.9 % of the enterprises in Greece
and the 99.8 % in the EU 27 (table 4) (www.imegsevee.gr). However the micro-enterprises
are more in Greece (96.6%) in comparison with the EU27 (92.2%). The large enterprises are
more in EU27. It is quite obvious that in Greece the sector of the SMEs is the small bone of
the economy. It also includes the 2/3 of the total employment. One of the crisis effects in the
Greek sector of the SMEs is the closing down of twenty thousand SMEs in a year (the total
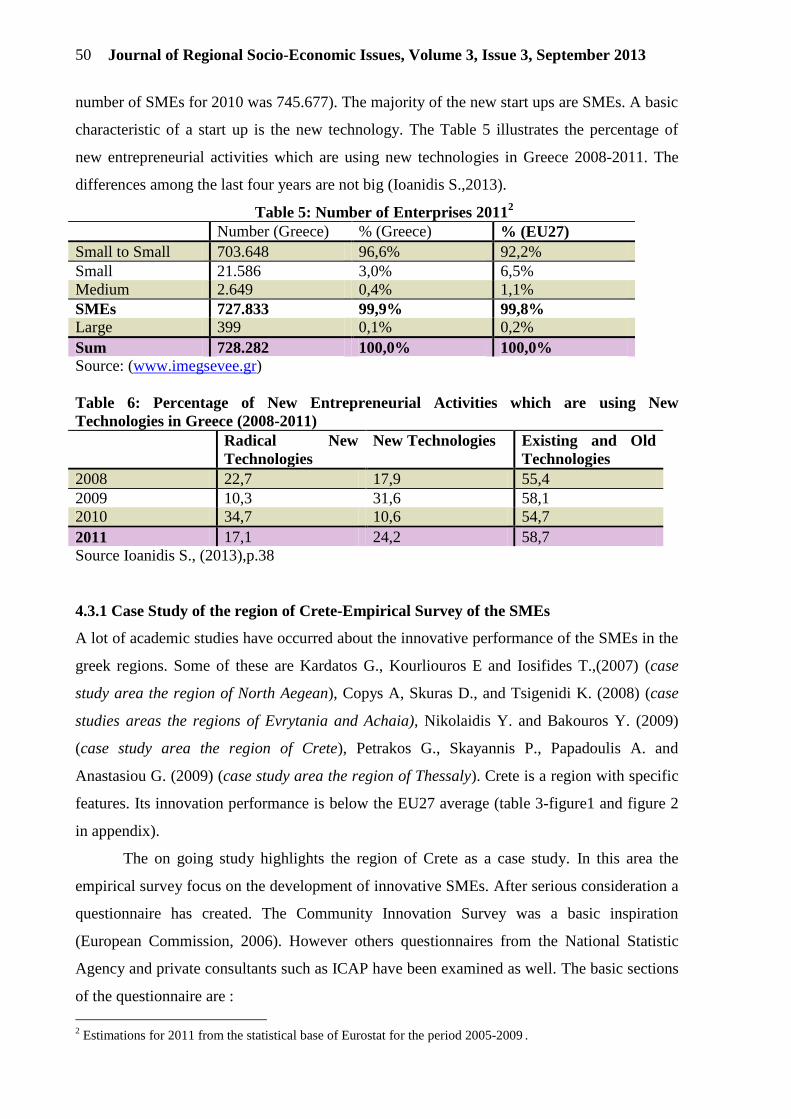
Journal of Regional Socio-Economic Issues, Volume 3, Issue 3, September 2013
50
number of SMEs for 2010 was 745.677). The majority of the new start ups are SMEs. A basic
characteristic of a start up is the new technology. The Table 5 illustrates the percentage of
new entrepreneurial activities which are using new technologies in Greece 2008-2011. The
differences among the last four years are not big (Ioanidis S.,2013).
Table 5: Number of Enterprises 20112
Number (Greece) % (Greece) % (EU27)
Small to Small 703.648 96,6% 92,2%
Small 21.586 3,0% 6,5%
Medium 2.649 0,4% 1,1%
SMEs 727.833 99,9% 99,8%
Large 399 0,1% 0,2%
Sum 728.282 100,0% 100,0%
Source: (www.imegsevee.gr)
Table 6: Percentage of New Entrepreneurial Activities which are using New
Technologies in Greece (2008-2011)
Radical New
Technologies
New Technologies Existing and Old
Technologies
2008 22,7 17,9 55,4
2009 10,3 31,6 58,1
2010 34,7 10,6 54,7
2011 17,1 24,2 58,7
Source Ioanidis S., (2013),p.38
4.3.1 Case Study of the region of Crete-Empirical Survey of the SMEs
A lot of academic studies have occurred about the innovative performance of the SMEs in the
greek regions. Some of these are Kardatos G., Kourliouros E and Iosifides T.,(2007) (case
study area the region of North Aegean), Copys A, Skuras D., and Tsigenidi K. (2008) (case
studies areas the regions of Evrytania and Achaia), Nikolaidis Y. and Bakouros Y. (2009)
(case study area the region of Crete), Petrakos G., Skayannis P., Papadoulis A. and
Anastasiou G. (2009) (case study area the region of Thessaly). Crete is a region with specific
features. Its innovation performance is below the EU27 average (table 3-figure1 and figure 2
in appendix).
The on going study highlights the region of Crete as a case study. In this area the
empirical survey focus on the development of innovative SMEs. After serious consideration a
questionnaire has created. The Community Innovation Survey was a basic inspiration
(European Commission, 2006). However others questionnaires from the National Statistic
Agency and private consultants such as ICAP have been examined as well. The basic sections
of the questionnaire are :
2 Estimations for 2011 from the statistical base of Eurostat for the period 2005-2009
.

Journal of Regional Socio-Economic Issues, Volume 3, Issue 3, September 2013
51
The SME
The Human Capital
The Business Environment and the Competitiveness of the enterprise
Innovation (Product Innovation, Innovation Process, Innovation Activities and
Expenditures, Finance of Innovation, Effects of Innovation, Source of innovation and Co-
operation for Innovation Activities, Innovation Barriers)
The Results of the Crisis
Recommendations
SMEs data have collected from the business champers all over Crete. The decision for
collecting the SMEs data from the four business champers of the four different regions of
Crete (Heraklion, Chania, Rethimno and Lasithi) has to do with the reflection of the real
business environment in Crete in times of crisis. Three hundred SMEs in Crete are going to
answer the questionnaire. From them one hundred and twenty are based in the area of
Heraklion, eighty in the area of Chania, sixty in the area of Rethimno and forty in the area of
Lasithi. The above statistical methodology is according to the methods of the National
Statistic Agency.
The majority of them are local and regional, some others national and fewer
international. Few of them are part of the local networks, incubators and clusters. For example
in the area of Heraklion there is a network of micro-tourism enterprises called Philloxenia.
There is also a network for the trade of wine. For all the regions of Crete there is a network
for the common trade of olive-oil called SEDIK. In the areas of Heraklion, Rethimno and
Chania there are clusters and incubators (at least one cluster for the renewable energy sources
in the area of Heraklion). In the area of Heraklion there is a Technology Park as well.
Different and important sectors of the local economy are going to analyze. These are
the following five (1) Software-Telecommunication (2) Energy-Environment (3) Food
processing (4) Tourism (5) Logistics-Transportation. The first two sectors classify as high
technology (industry of high knowledge). The last three sectors classify as low technology
(industry of high labor). These five sectors are case studies of developing economies not only
for the regional, national but also in European level. The latest directives from Europe 2020
and Horizon 2020 are in the same direction.
During the research a pilot survey took place. At the beginning the analyst chose to
examine the sectors of (1) Software (2) Telecommunication (3) Energy (4) Environment (5)
Food processing. The findings of the pilot survey were to examine further the sectors of
Tourism and Logistics-Transportation and make one the Software and Telecommunication.

Journal of Regional Socio-Economic Issues, Volume 3, Issue 3, September 2013
52
The same happened with Energy and Environment. It is quite obvious that there is a huge
collaboration among the five final sectors. One example is the interaction among the sector
of Tourism with the sectors of Software/Telecommunication and Logistics/Transportation (i.e
ebooking-ehandling). The same is happening between the sectors of Food processing and
those of Tourism and Software/Telecommunication (i.e cretan products in the Hotels, such as
the organic beer of Rethimno-esaling). The majority of the SMEs are located in the cities of
Heraklion (Heraklion), Chania (Chania), Rethimno (Rethimno) and Lasithi (Agios Nikolaos,
Ierapetra and Sitia). Short examples of the SMEs of the pilot survey were those who produce
and trade olive-oil, wine, mineral water, software-hardware and renewable energy sources.
5. Recommended Policies and Conclusions
This paper has illustrated the main theories and policies as far as it concerns the
entrepreneurship through innovation. This is the way to growth as Shumpeter figured in the
mid 1930s. The current crisis has been also considered not only in Global level but in
European, National and Local level as well. The European Union failed to concrete
innovation policy. The main reason is the national and regional disparities. Therefore the
innovation support programmes need better coordination in order to meet the needs of
individual regions. The innovativeness of the Greek economy depends heavily on imported
technology and know-how. This is the reason that Greece should focus on the production and
exploitation of new knowledge.
In order to escape the downward spiral and return Southern Europe and Greece to a
positive growth trajectory, others policies reforms will be required. According to economic
geographers such as Lamprianidis L. (2011, 2004) Greece has to develop the existing human
capital. The educated workforce which is friendly at adopting new technologies should be
used for productivity enhancements (i.e SMEs start-ups) (OECD-2013,OECD-2011). At the
same time the government should reinforce the entrepreneurship culture as a tool for local
development (Borowik I.M.-2012, European Commision-2013a, OECD-2011). This can be
happened with the transfer of technology from the Universities and Research Centers to the
local SMEs. In the case of Crete this is not happening. The diffusion of the technology to the
local SMEs and to the society as a whole can reduce the costs of the crisis. Alternative forms
of entrepreneurship should develop as well (this is an area of future research). These are the
social entrepreneurship (i.e social cooperatives) and the social innovation (i.e linux
programs).

Journal of Regional Socio-Economic Issues, Volume 3, Issue 3, September 2013
53
The European Union and the National policies should support the finance of the SMEs
from the high tech industry. For example there are a lot small to small enterprises from the
software sector that can not have easy access to finance. The creation of these firms is
comparative easily and furthermore they grow rapidly. Traditional industries and sectors
which are very crucial for the weaker states and regions should be supported with specific
research and technological programs. In the case of Crete and Greece these sectors are
Tourism and Agricultural. At the same time greater interaction among the sectors should
exist. The exploitation of the linkages between the sectors is a crucial mater. The local SMEs
should try to belong to business networks, clusters and incubators. In a firm level a new
culture is necessary. The SMEs should learn to manage themselves more easily and effective.
Conflict of interest and funding
The author has not received any funding or benefits from industry or elsewhere to conduct
this study.
6. References
Audretsch D. (2008), ‘Entrepreneurship, Innovation and Economic Growth’,UK, Edward
Elgar
Audretsch D. (2003), ‘Entrepreneurship : A survey of the literature’, Enterprise Papers
N.14, Enterprise Directorate-General European Commission
Borowik I.M. (2012), ‘Knowledge Exchange Mechanisms and Innovation Policy in Post-
Industrial Regions: Approaches of the Basque Country and the West Midlands’, J
Knowl Econ, DOI 10.1007/s13132-012-134-3
Camagni, R. & Capello, R. (1999), ‘Innovation and performance of SME’s in Italy: the
relevance of spatial aspects’, in Innovation, Networks and Localities, Fischer,M. et al,
Springer, Berlin-Heidelberg-NY.
Carayannis E. & Bakouros I. (2010), ‘Innovation and Entrepreneurship’, Thessaloniki,
Publication Sofia
Carayannis E., Popescu D., Slip C. McDonald S. (2006), ‘Technological learning for
entrepreneurial development (TL4ED) in the knowledge economy (KE) : Case studies
and lessons learned,’ Technovation, Vol. 26, No 4, 419-443
Clark J. & Guy K. (1998), ‘Innovation and Competitiveness: A review’, Technology
Analysis and Strategic Management, Vol.10, No. 3, 1998
Copus A, Skuras D., & Tsegenidi K. (2008), ‘Innovation and Peripherality: An Empirical
Comparative Study of SMEs in Six European Union Member Countries’,Economic
Geography, 84(1):51-82
Commission of the European Communities. (1995). Green paper on innovation
COM(95)688 Final. Brussels, Belgium: Author
European Commission, (2013a), Entrepreneurship 2020 Action Plan, January.
European Commission, (2013b), State of the Innovation Union 2012, Brussels
European Commission, (2013c), Research and Innovation Performance (Greece), Brussels
European Commission (2013d), Innovation Union Scoreboard 2013, Brussels
European Commission, (2011), Innovation Union Competitiveness report 2011 (Greece),
Brussels
Journal of Regional Socio-Economic Issues, Volume 3, Issue 3, September 2013
54
European Commission (2006). ‘’The Community Innovation Survey 2006’’
European Commission, (2003), “Green Paper: Entrepreneurship in Europe”, January.
European Union (2004), ‘Third Report on Economic and Social Cohesion’, Brussels
Fagerberg, J. (2005), ‘Innovation: A guide to the literature’, in The Oxford Handbook of
Innovation, Fagerberg, J., Mowery, D. & Nelson, R. (eds), Oxford University Press,
New York
Hadjimanolis A. (2003), ‘The barriers approach to innovation’, in The International
Handbook on Innovation, Larisa V. Shavinina, Elsevier Science Ltd
Giannitsis T. (1991), ‘Economic Theory and Technology’, Athens,Publication Gutenberg
Ioanidis S. (2013), ‘Entrepreneurship in Greece 2011-2012’, Athens, I.O.B.E/G.E.M
Kardatos G., Kourliouros E and Iosifides T., (2007), ‘Factors of entrepreneurial
innovation in new technologies in the north aegean region’, The Cyprus Journal of
Sciences, Vol 5, 2007/139-152
Kokkinou A. (2010), ‘Innovation Convergence and Regional Development: Goal or
Reality?’, The Cyprus Journal of Sciences, Vol 8, 2010/89-104
Korres G. (2011), ‘Handbook of innovation Economics’, New York, NY: Nova
Korres G. and Polychronopoulos G. (2011), ‘A new approach towards the measurement of
innovation and technological activities’, Journal of European Economy, Vol.10 (N.3),
September 2011
Korres G., Tsobanoglou G. and Kokkinou A. (2011), ‘Innovation Geography and
Regional Growth in European Union’, SAGE Open
Korres G. (2010), ‘Women Participation and Innovation Activiities’, Delhi, The Women
Press
Korres G. (2008), ‘Technical Change and Economic Growth’, Avebury Ashgate
Publishing Limited
Kourliouros E. and Korres G. (2011), ‘The Technological Policy and its implications in
Competitiveness and Regional Development of EU’, ERSA
Krugman P. (1996), ‘Development, Geography and Economic Theory’.Cambridge Masss,
MIT Press
Lamprianidis L., (2011), ‘Investing in Working Abroad’,Athina, Publications Kritiki
Lamprianidis L., (2004), ‘Entrepreneurship in the European Rural’,Thessaloniki,
Publications Epikentro
Neely, A. & Hii, J. (1998), ‘ Innovation and Business Performance: a literature review’,
The Judge Institute of Management Studies, University of Cambridge.
Nikolaidis Y. & Bakouros Y. (2009), ‘Innovation Penetration into a Region with Specific
Features: The Case of Crete, Greece’, International Journal of Entrepreneurship and
Innovation Management, Volume 9, Number 1-2
OECD (2013), ‘What Drives the Dynamics of Business Growth?’, OECD Science,
Technology and Industry Policy Papers N.1, Paris
OECD (2011), ‘Entrepreneurship at a Glance 2011’, Paris
OECD/Eurostat (2005), Proposed Guidelines for Collecting and Interpreting
Technological Innovation Data – Oslo Manual, The Measurement of Scientific and
Technical Activities Series, Paris
OECD (2002), Proposed Standard Practice for Surveys of Research and Experimental
Development, ‘Frascati Manual 2002’,Paris
Rothwell R. (1989), ‘Small Firms, Innovation and Industrial Change’, Small Business
Economics, 1,1, 51-64
Palaskas T. and Tsampra M. (2003), ‘Entrepreneurial competitiveness in the knowledge
economy: factors defining the innovativeness of small and medium size enterprises’,
MPRA Paper No.33561, posted 20. September 2011

Journal of Regional Socio-Economic Issues, Volume 3, Issue 3, September 2013
55
Petrakos G., Skayannis P., Papadoulis A., and Anastasiou G. (2009), ‘Entrepreneurship,
innovation and regional development: A Southern European perspective’,
Discussion Paper Series, 15 (3): 45-70
Segarra-Blasco A. (2010), ‘Innovation and productivity in manufacturing and service
firms in Catalonia: a regional approach’, Economics of Innovation and New
Technology, Vol.19, No.3, April 2010, 233-25
Schumpeter J.A. (1934), The theory of economic development, Cambridge, MA, Harvard
Economic Studies
Storey, David J., (2000), ‘Understanding the Small Business Sector’, Thomson Learning,
London
Storey D. & Greene F. (2011), ‘Entrepreneurship for SMEs’, Αthens, Publication Kritiki
World Bank, (2013a), “Doing Business: 2013”, September
World Bank, (2013b), “Doing Business (Greece): 2013”, September
World Economic Forum (2012), ‘The Global Competitiveness Report 2012-2013, Geneva
Xiaoni Li, Pere Segarra Roca and Eleni Papaoikonomou (2011), ‘SMEs’ responses to the
financial and economic crisis and policy implications: an analysis of agricultural and
furniture sectors in Catalonia, Spain, Policy Studies, 32:4, 397-412
Internet References:
http://europa.eu/rapid/press-release_MEMO-12-34_en.htm#PR_metaPressRelease_bottom
www.imegsevee.gr

Journal of Regional Socio-Economic Issues, Volume 3, Issue 3, September 2013
56
Appendix
Figure 2 RIS 2012 innovation performance sub-groups (data for 2011)
Source:http://europa.eu/rapid/press-release_MEMO-12-34_en.htm#PRmetaPress
Release_bottom

Journal of Regional Socio-Economic Issues, Volume 3, Issue 3, September 2013
57
Green Entrepreneurship, as an innovative tool for enhancement of
Hospitality SMEs Competitiveness, Viability and Profitability Strategies
Abstract:
Tourism today consists one of the greatest industries and most dynamic economic activities
internationally, as it has been argued and agreed in the World Economic Forum WEF that
took place in Davos- Switcherland in February 2009. It is also agreed that tourism consists the
prevailing activity in many countries, creating more new job positions than any other industry
affecting the rest of the sectors of an economy through its well known ‘multiplier effect’ and
thus contributing to the economic development of nations and the welfare of their citizens.
Therefore, supporting this dynamic track of tourism industry should be a priority for public as
well as private businesses operating within its environment ensuring sustainability and
competitiveness. This paper attempts to analyse the development of green entrepreneurship
and innovation by the SMEs operating in the touristt industry, with a focus on the respective
practices followed and applied by the Greek hotels as a vital tool for ensuring their viability
and maintaining their profitability especially during these unstable and turbulent times.
Key words: Innovation, Hospitality SMEs, Green Entrepreneurship, Marketing tool, People
Management.
Panagiotis Katis1
1 Corresponding Address: University of the Aegean, School of Social Sciences, University Hill, 81100 Mytilene,
Greece. Email: [email protected]

Journal of Regional Socio-Economic Issues, Volume 3, Issue 3, September 2013
58
1. Introduction
The major environmental and social problems that our planet is facing require active and large
incisions. The green growth movement that is constantly gaining momentum in a variety of
industries is about promoting and reinforcing economic development and further growth,
ensuring at the same time the fact that the natural assets involved continue to provide the
environmental services as well as the required resources on which well-being relies. In order
to do this it is necessary to foster innovation and its underlying investment, which in turn will
underpin sustained growth and give rise to new economic opportunities. The current paper
deals with the development of green entrepreneurship and innovation by the SMEs operating
in the touristt industry, with a focus on the respective practices followed and applied by the
Greek hotels as a vital tool for ensuring their viability and maintaining their profitability
especially during these unstable and turbulent times.
2. Innovation – Definition and Context
At this point the term ‘innovation’ should be defined. According to the official definition
provided by the OECD (2005) ‘innovation’ could be defined as the creation and/or provision
of better products and services achieved through improved processes and technological
approaches and devices.
These processes and approaches in turn lead to improved organisational structure and
effective working relations as well as enhanced connection of a business organisation with its
external operating environment (Eurostat/OECD, 2005). It is also very important to note that
as OECD argues, innovation comprises the key to economic recovery through ‘smart’
investments that can halt the financial downturn of contemporary economies and set a sound
basis for a strong and viable development. (OECD, Innovation and Crisis 2008).
By reviewing also the relevant literature, it becomes apparent that innovation is
considered by the researchers and the specialists as a vital parameter, necessary for the
viability of modern businesses which operate in a complex, dynamic and highly competitive
globalised environment. It is also evident and clear that ‘non innovation’ or otherwise
complacency of business which remain stagnant without renewing their product / service line
consist a matter of time for these organisations to get out of business losing a significant part
of their market share.
Considering and viewing innovation through the prism of contemporary economies,
the majority of which go through a recession or even a depression stage, one can realise the
need for innovation and its significance for the micro as well as the macro world of economy.

Journal of Regional Socio-Economic Issues, Volume 3, Issue 3, September 2013
59
Moving to the European level, as Kitsos & Hatzikan (2008) argue if European Union
does not transform itself to a ‘Union of Innovation’, the economy of its countries-members
will suffer economic stagnation since innovative ideas, relevant skills and respective potential
will become disused and invisible. Moreover, they argue that business innovative
performance contribute to the creation of new and stable employment positions which will be
able to resist globalisation pressures and safeguard their existence (Kitsos & Hatzikian,
2008). As Kotler (2001) argues the theory, which underlines the life cycle model, also implies
that all the products and or/services go through a series of alternative stages of the business
life cycle, starting with the ‘introduction’ and the ‘development’ stages and ending up with
the ‘maturity’ and ‘saturation’ stages, which in turn may lead to problems with business
viability and potential bankruptcy. Another very important lever of pressure that pushes
businesses towards innovation, stems from the respective practice applied by competitors who
take steps towards introducing innovative products and/or services so that they keep the
competitive momentum in the market.
Nevertheless, the concept of innovation is very often confused with the idea of ‘new’
with many companies or entrepreneurs perceiving automatically any new product or service
as an innovative one (Nedis & Byler, 2009).
What should be clarified at this point is that not every new product or service is an
innovative one. According to Kuczmarski (2011) the implications of confusing the two terms:
‘innovation’ with ‘modernity’2 may have detrimental effects since it may lead enterprises to
applying wrong approaches and business practices. Therefore, while modernity implies
introduction of a new product or service, innovation goes beyond modernity implying
transformation of these new ideas into marketable products or services. In other words, the
difference between ‘new’ and ‘innovative’ lies in the value that the market attaches to the
latter through its demand, otherwise we cannot talk about innovation that is developed to
contribute to the enhancement of business competitiveness.
On the other hand, the success of innovation, as Heerde &. Mela, (2005) argue
depends on the extent to which it satisfies real and specific needs of the market.
Consequently, if a company fails to identify properly and correctly a market need the
new idea, product, service or process introduced will most probably fail to be converted into
successful innovation and profitable marketable offerings. It is therefore obvious that the
successful introduction of innovation is inextricably linked with the proper market research
and well targeted promotion. As it has been stated above the focus of this paper is on the
2 Producing a new product or providing a new service.
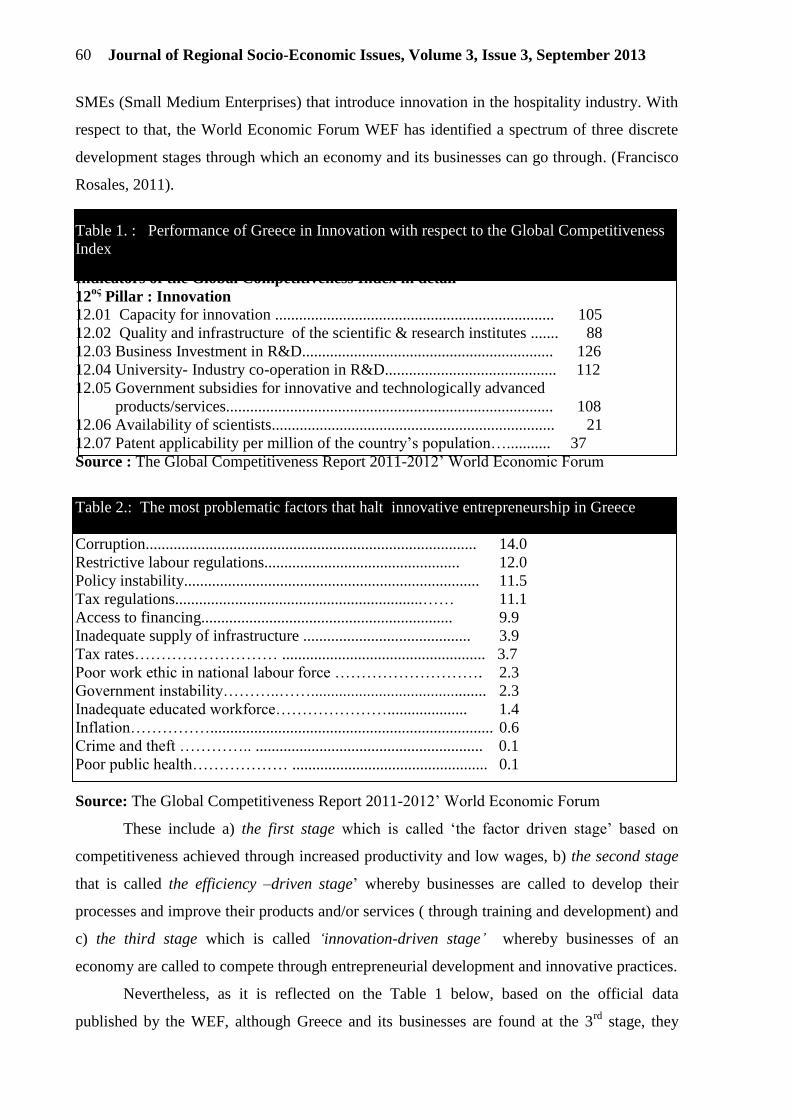
Journal of Regional Socio-Economic Issues, Volume 3, Issue 3, September 2013
60
SMEs (Small Medium Enterprises) that introduce innovation in the hospitality industry. With
respect to that, the World Economic Forum WEF has identified a spectrum of three discrete
development stages through which an economy and its businesses can go through. (Francisco
Rosales, 2011).
Table 1. : Performance of Greece in Innovation with respect to the Global Competitiveness
Index
Indicators of the Global Competitiveness Index in detail
12ος
Pillar : Innovation
12.01 Capacity for innovation ...................................................................... 105
12.02 Quality and infrastructure of the scientific & research institutes ....... 88
12.03 Business Investment in R&D............................................................... 126
12.04 University- Industry co-operation in R&D........................................... 112
12.05 Government subsidies for innovative and technologically advanced
products/services.................................................................................. 108
12.06 Availability of scientists....................................................................... 21
12.07 Patent applicability per million of the country’s population…........... 37
Source : The Global Competitiveness Report 2011-2012’ World Economic Forum
Table 2.: The most problematic factors that halt innovative entrepreneurship in Greece
Inefficient government bureaucracy...................................... 27.2
Corruption................................................................................... 14.0
Restrictive labour regulations................................................. 12.0
Policy instability.......................................................................... 11.5
Tax regulations..............................................................…… 11.1
Access to financing............................................................... 9.9
Inadequate supply of infrastructure .......................................... 3.9
Tax rates……………………… ................................................... 3.7
Poor work ethic in national labour force ………………………. 2.3
Government instability………..……............................................ 2.3
Inadequate educated workforce………………….................... 1.4
Inflation……………....................................................................... 0.6
Crime and theft ………….. ......................................................... 0.1
Poor public health……………… ................................................. 0.1
Source: The Global Competitiveness Report 2011-2012’ World Economic Forum
These include a) the first stage which is called ‘the factor driven stage’ based on
competitiveness achieved through increased productivity and low wages, b) the second stage
that is called the efficiency –driven stage’ whereby businesses are called to develop their
processes and improve their products and/or services ( through training and development) and
c) the third stage which is called ‘innovation-driven stage’ whereby businesses of an
economy are called to compete through entrepreneurial development and innovative practices.
Nevertheless, as it is reflected on the Table 1 below, based on the official data
published by the WEF, although Greece and its businesses are found at the 3rd
stage, they

Journal of Regional Socio-Economic Issues, Volume 3, Issue 3, September 2013
61
have a low ranking in comparison with the rest of the economies and with respect to
innovation, while they present a number of factors that act as burdens suppressing innovation
and entrepreneurship of Greek enterprises.
3. The significance of Tourism and Hospitality for an economy – a focus on the Greek
economy
According to the conclusions drawn and agreements reached in the World Economic Forum
WEF that took place in Davos- Switcherland in February 2009, tourism and hospitality
compose the dominant business activity in many countries, creating far more new job
opportunities than any other industry hence affecting the rest of the sectors of an economy
through its well known ‘multiplier effect’, contributing in this way both to the welfare of
citizens as well as the to the economic development of the involved nations. Therefore,
supporting this dynamic track of tourism industry should be a priority for public as well as
private businesses operating within its environment ensuring sustainability and
competitiveness.
The high degree of complexity and dynamism of the environment in which the tourist
and hospitality industry currently operates, is another important parameter that has been
officially established in the WEF Annual Meeting, 2009.
As far as the Greek society and economy are concerned the role of hospitality and
tourism in terms of their beneficial contribution is exceptionally immense. Indicatively, it can
be pointed out that the input of hospitality and tourism in the country’s Gross National
Product GNP reached 18% in 2008 while a number of 833.000 new job positions were created
and offered in the industry. This represents a 20% of the total employment in the country (
SETE, 2008-2009).
In relation to the Greek economy and in order to realise and appreciate the economic
significance as well as the dynamism of tourism and hospitality for the status of the Greek
economy, it should be mentioned that the total contribution of tourism and hospitality to GDP
is expected to rise on average by 4.0% per year from EUR 35.3 billion (15.8% of GDP) in
2011 to EUR 52.2 billion (18.5%) by 2021 (World Travel and Tourism Council (WTTC).
The work of the Tourism Committee of the OECD has recognised the importance of
Competitiveness as an issue for tourism policy makers and entrepreneur. Moreover, as it has
been estimated by a great number of economists the tourism industry can act as a main
mechanism of development and growth that will lead Greek economy out of its current
problematic state. (http://www.traveldailynews.gr/news/article/47008)

Journal of Regional Socio-Economic Issues, Volume 3, Issue 3, September 2013
62
However, apparently there is a great deal of conflicting opinions and controversy
with respect to the current reality of Greek tourism and hospitality as well as the factors and
variables that determine its competitiveness. According to the reports that the World Tourism
Organisation (UNWTO) and the World economic Forum ( WEF) issued in 2009, Greece
holds the 24th
place. Nevertheless, according to the General Index of Competitiveness it holds
the 67th
position. On the basis of these results, a reasonable question that might rise could be
related to the likely factors that underline this reality.
According to the former General Operations Manager of Sunwing Hotels Hellas S.A3
(the interview with whom consists a main source of the primary research data drawn fro the
purposes of the present study): ‘The picture of the Greek Tourist industry becomes blurred
when it is viewed through the prism of the wider framework of state infrastructure, the
exogenous touristic cost and the rest of the public services that a tourist pays for directly
and/or indirectly ’. Consequently, one can easily realise and understand that the real ‘weight’
of the industry’s competitiveness is placed on the ‘shoulders’ of the individual business units
that operate in the industry. In the light of the above one could pose the question about what a
realistic approach and a feasible strategy could be, so that Greek hospitality SMEs could
respectively follow and implement and hence be able to respond to these complex and
dynamic challenges and establish their competitiveness?’
The answer to this question should be given in line with the market demand. In that
respect, within the hotel sector, a constantly rising number of guests exhibit a tendency to
choose a green hotel which implements environmentally friendly policies and practices,
demonstrating a serious concern about the ecological degradation (Han, Hsu, & Sheu, 2010;
Manaktola & Jauhari, 2007). Recognising the momentum of this eco-friendly customers’ need
and their emerging concerns, nowadays many hotel firms seek to incorporate these concerns
about the environment in their marketing and management decision-making process and their
applied policies and procedures with respect to environmental awareness and tourism
customers’ sensitivity. (Bohdanowicz, 2006; Lee, Hsu, Han, & Kim, 2010; Mensah, 2006).
Professionals as well as academics specialising in the hospitality sector have come to the
conclusion that the action by hotel operations in order to be ‘green’ has become a necessity in
order for them to achieve noticeable and essential improvement in the degree of their ability
3 In this paper the case of Sunwing Hotels Hellas S.A is used as an example of best practice since its hotels were
awarded the first eco label (EU Flower) in Europe and recompenses all its environmental efforts for the last
decade with the help of the Scandinavian Organization "The Natural Step". Additionally Sunwing Hotels in
Greece are awarded continuously since 1985, the European Blue Flag for the way they manage and maintain
their coastal environment and beach. Moreover, in 2006 Sunwing Resort Kallithea was awarded the 2nd
ecological prize award among the Greek enterprises.
http://www.csrhellas.org/csr_last2/portal/gr/misc/674oz_20071113674.php3
Journal of Regional Socio-Economic Issues, Volume 3, Issue 3, September 2013
63
to compete in the sector (Han, Hsu, & Lee, 2009; Manaktola & Jauhari, 2007). Credible
pieces of evidence which demonstrate the increase of environmentally friendly customer
behaviour are provided by the studies carried out by a number of specialists in the field,
justifying the increased number of guests who demonstrate strong willingness and intention to
pay premium prices for green services and/or products (Laroche, Bergeron, & Barbaro-
Forleo, 2011).
It should be noted that as Bohdanowicz (2005) argues, an increasing number of
tourists globally exhibit the tendency to prefer what are known as ‘green hotels’.For example,
an 80% of the German hotel guests state firmly that high environmental standards compose a
determinant factor in their decision making process when they are choosing destination and
accommodation .
However, the oxymoron is that despite all of these new facts, hotel businesses do not
react in a suitable way as it would be expected and they do not seem to realise the concept and
the potential of ‘Green entrepreneurship’ as a competitive tool that could ensure their viability
and profitability in these times of high turbulence and uncertainty that economies, markets
and enterprises are going through.
4. The Concept of ‘Green Entrepreneurship’ and its entity as a vehicle of innovation
A widely acceptable definition of 'Green entrepreneurship' is that it is a kind of economic
activity that places the nature and environment at the heart of a business strategy and
practices. Green entrepreneurship focuses on the economic operation of the business unit
(Esty and Winston, 2006). The term economic operation indicates the business activities
where energy, labour, natural resources, and raw materials are carefully used and not wasted.
A business operating in the hospitality industry and manages to operate in line with the
principles of green entrepreneurship can enjoy direct financial benefits, by saving energy
consumed through the use of alternative energy sources, which in turn leads to a reduction in
operating costs by saving energy and using alternative sources increasing thus its long term
profits.
Within the context of green entrepreneurship the green strategies that may be introduced in
the hotel industry include the following general areas (Spanos, 2009):
A. Energy Saving.
B. Regular maintenance.
C. Waste Reduction and Waste Management.

Journal of Regional Socio-Economic Issues, Volume 3, Issue 3, September 2013
64
D. Recycling paper, plastic and glass.
E. Training and motivating employees on the use of new equipment and procedures
Green entrepreneurship and growth for SMEs implies increasing environmental
awareness and the derived pressures while expanding economic opportunities (OECD,
2011a). The challenge of combining the achievement of economic and environmental
performance goals can be hardly met by businesses as usual. What is required is a stronger
and cleaner growth path, implying innovation through the creation of new products, services,
their underlying processes as well as their application and diffusion (OECD, 2011a). What
seems to be combining the above parameters: innovation, application of environmental
technologies and SMEs competitiveness is Eco-innovation, which leads to environmental
improvements compared to relevant alternatives through the implementation of new
organisational structures, processes, marketing strategies that in turn lead to the production of
improved and eco-friendly products and services (OECD, 2009a).
Figure 1: Facets of eco-innovation
Source: OECD, 2009b.
It is important to note that there exists an uneven distribution of small firm innovation,
between a few highly innovative firms with high growth potential, and the great majority of
SMEs that innovate very little compared to their large counterparts (OECD, 2010). It is also
very significant to note that eco-innovation besides the environmental technologies it also
embraces several non-technological parameters. Based on the above and in line with the
Journal of Regional Socio-Economic Issues, Volume 3, Issue 3, September 2013
65
relevant definition as this has been outlined in the Oslo Manual : ‘eco-innovation is the
implementation of new, or significantly improved, products (goods or services), processes,
marketing methods, organisational structures and institutional arrangements which, with or
without intent, lead to environmental improvements compared to relevant alternatives”
(OECD, 2009a).
According to this definition, eco-innovation is distinguished from other types of
innovation solely by its environmental effects, whether intended or not. However, eco-
innovation can also be defined more broadly than in the conventional sense covered by the
Oslo Manual, as it also includes changes in ‘institutional arrangements’, together with
innovation in products, processes, marketing methods and organisational practices
(Figure.1.above).
The eco-innovation can also be differentiated in terms of degree of novelty and impact
on existing artefacts, processes, organisational practices or technological regimes into : i)
Incremental innovations that occur by modifying existing technology, ii) Disruptive
innovations that consist of changing how functions are fulfilled and generally things are done
and iii) Radical innovations which occurs when an entirely new solution is created and leads
to a full-scale shift in the technological regime at the time ( OECD, 2009a). -
5. Achieving competitiveness in the hospitality industry4 through green
entrepreneurship and eco-innovation
In the light of the above definitions and frameworks it becomes evident that green
entrepreneurs can become pioneers in green business practices by introducing eco-innovation.
Nevertheless, one could reasonably set the following question: ‘besides their social
contribution how can green entrepreneurship through eco-innovation ensure and/or increase
competitiveness of firms?’
A response to that question could be that, besides its reputation, the adoption of green
policies can lead to competitive advantage, especially when there is a relevant certification,
thereby creating new opportunities for providing improved service quality to customers (Roth,
2002).
The above of course also apply to the tourism and hotel industry where 'green
economic revolution', as it is characterised by Roth (2002), gives hoteliers and business
operators the unique opportunity to increase revenues and market share by harmonising the
services that their companies offer with the growing preference of customers for 'green
hotels'. There is a general misconception, evidenced by the results of empirical research as we
4 The focus is on hotels’ sector.

Journal of Regional Socio-Economic Issues, Volume 3, Issue 3, September 2013
66
shall see below, by which it is believed that the implementation of green practices in the hotel
industry is very expensive and only the hotels that can charge high prices may be involved in
the implementation of the specific strategies5. However, this is incorrect because even though
an initial investment in technology and the related know-how is required, the reduced costs
and the economy achieved in conjunction with its appeal to customers quickly pay back for
the investment. Specifically, a 75% of tourists clearly state a preference for eco-labeled hotels
while another 25% declare willingness to pay a premium price for their stay in green hotels
(Wight, 2003; Yunhiand Heesup, 2013).
According to the results of the US Travel Association (http://www.ustravel.org/ ) a
surprisingly high number of 55.1 million American tourists confirm that they belong to the
category of environmentally sensitive customers. Also, according to a survey by Edelman
Public Relations (http://www.edelman.com/) 91% of global consumers consider
environmental protection as the most important cause that should be pursued by firms and the
82% of them expressed increased preference for and confidence in companies that are making
progress and are taking action in environmental issues (Colona, 2010).
The results also of an empirical research carried out by the Green Hotels Association
(Business Link, 2011), provided evidence that hotel companies which implement
environmental policies and practices have 9% higher rate of growth in sales, 4% higher return
on invested capital and 17% higher increase in operating income than lodging operations that
do not apply any environmentally friendly culture and practices. Likewise, another survey
carried out on a sample of 100 hotels in Phuket more than a decade ago (Oines and Assenov,
2000) provided evidence about the beneficial economic results that could be derived from the
implementation of green practices in hotels (i.e. reduction in operating cost and savings of
20% -30%. The same survey carried out by the Green Hotels Association concludes that hotel
companies, which implement green strategies, manage to develop the following advantages:
Cost-competitive advantage: The reduction of operating costs through green practices is the
goal of many businesses today. In these times of global and national economic downturn, the
'going green' strategy can make a difference by allowing the respective businesses to compete
on cost.
Green revenue growth: This is the focal point of the 'green growth', an opportunity of trillions
of dollars exposed worldwide by companies that are willing to focus on environmental
practices.
5 Smarter Hotelier, “Green Hotels offer Brand Differentiation to mid-tier Hotels” Retrieved from: http://smarterhotelier.com/green-
hotels-offer-brand-differentiation-to-mid-tier-hotels/

Journal of Regional Socio-Economic Issues, Volume 3, Issue 3, September 2013
67
Green Entrepreneurship: In any economic revolution, such as the ‘green’ revolution there are
opportunities for the innovative entrepreneurs who will be the first movers in the new
directions and horizons. The hotel guests are looking for new solutions that meet their
environmental sensitivity and increasing requirements.
Differentiation competitive advantage: By investing in innovation, technology, expertise and
supporting staff training, the hotels can offer differentiated services that can attract more and
'better quality' of tourists. Undoubtedly, achieving and maintaining competitive advantage is
the most important objective of a business that wishes to remain profitable in an increasingly
competitive environment with challenges and difficulties.
There are two basic strategies for developing a strong competitive business through
creating firm-specific competitive advantages: cost leadership and differentiation. Two main
positions of increased importance seem to dominate the particular theory of Porter's 'generic
strategies':
a) Companies that pursue either cost leadership or differentiation seem to ensure greater
market share and are more profitable, and
b) A firm must either pursue cost leadership strategy or differentiation; otherwise it might “be
stuck in the middle” (Porter, 2004).
Based on a review of the literature conducted and the opinions presented below, the
author of this study concluded that the main thrust of Porter’s theory on competitive
advantage has been reversed.
According to Hambrick (1983), differentiation is a more profitable strategy than cost
leadership, since the leading companies that occupy the largest shares have a tendency to
compete on differentiation basis. Similarly, Peters and Waterman (1982) add that high
performance companies tend to focus more on customer value and differentiation rather than
cost. Additionally, a series of survey-results provide evidence that the basis of the
differentiation strategy - offering products and services of superior quality - is a much more
fundamental competitive factor than any other parameter including market share, low cost and
position on the learning curve (Buzzell & Gale, 1987, Jacobson & Aaker, 1987).
With respect to the second pillar of the theory where Porter argues that a low-cost
strategy requires a large market share, many analysts reply that a large market share is
acquired through high quality and differentiation strategy. So while even Porter identifies GM
as an example of companies that successfully implement a cost leadership strategy,
nevertheless, the company reports show that quality and differentiation played very important
role in the success.

Journal of Regional Socio-Economic Issues, Volume 3, Issue 3, September 2013
68
Finally, as Mintzberg (1988), and other surveys suggest: 'a low-cost strategy is
actually a differentiation strategy based on low price'. In other words even though Porter
insisted that any strategy requires its own culture and philosophy, the strategy of
differentiation and low cost can actually coexist.
Evidently, Porter’s position 'either cost leadership or differentiation or otherwise stuck
in the middle' is obsolete and its validity has been challenged by many analysts. The most
demonstrative position is the one stated by of Booth and Philip (2000) who declared that
businesses should be more flexible and combine 'differentiation’ and ‘cost leadership'
strategies in order to offer unique value to customers. A possible error though, can rise by the
basic principle that automatically connects differentiation to premium prices charged, a
situation that is rather incompatible with high market share.
Finally, according to the information presented above, hotels that implement green strategies
have the potential to succeed in both cost leadership and differentiation.
6. Mentality of the Greek Hotel Management as a barrier to the implementation of
Green entrepreneurship and eco-innovation
On the basis of comparative analysis of Greek hotels vis-à-vis best practice hotels operating in
Greece it could be drawn that there is an apparent ‘gap’ in their philosophy and culture as
these are reflected on their respective organisational values, policies and the practices applied.
The majority of the former:
- consider green strategies as a rather ‘costly business approach’ that bring about results on a
long term time span, while some of them consider them as a merely marketing trick with no
essential meaning and useful implications for their company’s competitiveness.
- apply a limited range of green practices compared with the approach followed by best
practice hotels and do not use these practices as marketing tools to promote their company’s’
image to an increasingly environmentally aware clientele and thus they fail to create a
competitive advantage
- do not invest in their people training and development and the know how necessary to
support green strategies’ implementation.
On the contrary, best practice hotels in green entrepreneurship apply the whole range
of the required green strategies to meet the criteria of reputable awarding bodies such as Eco
Flower, Blue Sea etc. and use their certification and labels as promotional tools to target more
environmentally aware customers.
Finally, what seems to be the main underlying reason for this disheartening reality that
small-medium hotel operations in Greece present with respect to the implementation of green

Journal of Regional Socio-Economic Issues, Volume 3, Issue 3, September 2013
69
strategies is their management attitude, beliefs and the subsequent lack of their commitment
to the idea and implementation of green strategies. The interview results with the former
Operations Manager of Sunwing Hotels Hellas S.A, provided evidence on the fact that hotels
managers have a dated attitude and appear to be rather skeptical about the potential that green
strategies can offer to their businesses in terms of enhancing and strengthening their
competitive position in the market. This attitude combined with a serious lack of respective
valuable marketing knowledge as well as with expressed reservations about eco labels and
certification, have resulted in Rhodes’ hotels applying some green practices in a haphazard
manner and hence not being able to make the most of green strategies to achieve core
competence and sustainable competitive advantage.
Nevertheless, it should be stressed that a positive aspect of the case of Greek hotels,
with respect to green entrepreneurship, is the fact that they have the right organisational
culture (their employees’ values and beliefs) and apply the appropriate human resource
management style on which the foundations for green entrepreneurship and eco-innovation
could be ‘built’. In other words, employees’ cultural values and beliefs as well as the way that
they are managed are two factors that the management of Greek hotels can make optimum
application should they wish to support the successful implementation of green strategies.
On the other hand, hotel managers’ attitude and beliefs with respect to the potential of green
strategies seem to be the main deterrent factor that prevents Greek hotels from making the
most of such an approach and the benefits they could possibly gain.
7. Conclusions and Recommendations
In the light of all the above, operators in hospitality have to realise that competitiveness of the
Greek hotel sector is not guaranteed and it needs a constant analysis and consideration of
evolving market trends. Greek hoteliers must realise that they are faced with intense
competition coming from economies with low labour cost and hence they have to devise
alternatives in order to improve their degree of competitiveness. They have to understand that
their belief: ‘once a competitive advantage always a competitive advantage’ can be a
dangerously wrong assumption leading to possible disastrous introversion.
Apparently, there is an apparent delay in the hotels’ transition to what is called
‘knowledge economy’ and the application of innovative technologies and approaches. As it
has been discussed above, Greek hotels’ management have not fully accepted the value and
potential of green development and respective strategies, demonstrating a serious lack of
awareness of relevant underpinning concepts and principles such as corporate social

Journal of Regional Socio-Economic Issues, Volume 3, Issue 3, September 2013
70
responsibility and innovation. Consequently, Greek hotels need to adopt a new developmental
framework that above all will be supported, beyond any necessary structure, by the
appropriate mentality, attitudes knowledge and beliefs of the management team. This
development has to be accompanied with and based on extrovert behaviour and market
oriented approach that will lead the management of Greek hotels to analyse the important
market trends and ‘listen’ more carefully to their customers’ constantly evolving wants and
requirements.
It is also very important for the hotel enterprises in Greece to assess the wider
economic environment in which they currently operate and realise that the economic
depression, Greek economy is currently going through, may lead to heavier taxation measures
that will be imposed on the businesses in order for the country to be able to respond to high
borrowing requirements.
Therefore, at this point one could reasonable ask what might be a realistic and feasible
solution that could protect hotel business sector from this hard situation. The answer coincides
with the view of the General Operations Manager of best practice hotels in Greece, who
strongly argued, based on his own extended practice and experience, that strategies such as
green strategies and Social Corporate Responsibility could act as a ‘shield’ to protect hotel
enterprises from the adverse effects of economic depression.
Consequently, Greek hotel enterprises need to make the most of their strengths and
competences in order to move from products and services of low technology and low quality
to products that create added value and offer high quality services to their customers.
This high quality of services offered combined with the traditional advantages (i.e.
geographical position and scenery, sea, sun etc.) will enable Greek hotel enterprises to
develop unique core competence, establish their competitiveness and safeguard it during these
hard economic times.
Based on the results and analysis carried out in the present study, the main
recommendations for the Greek hotel operations, in order to make the most of green
entrepreneurship idea and pracyice, could be summarised as follows:
(1). Development of marketing knowledge and adoption of an ‘extrovert orientated’ attitude
(2). Focus on market research and analysis of the prevailing dynamic trends in terms of
customer preferences, attitudes and buying behaviour as well as new practices developed by
competitors.
(3). Follow the example of best practice hotels and expand the implementation of green
strategies covering the whole range of their practices: i.e. waste management – clean sea
Journal of Regional Socio-Economic Issues, Volume 3, Issue 3, September 2013
71
programmes, systematic and regular maintenance of relevant equipment, personnel training
and development of Corporate Social Responsibility CSR policy.
(4). Enrichment and expansion of the applied green practices with alternative and more
economical sources of energy, i.e. aeolic energy (wind energy), biomass etc.
(5). Investment of resources in: a) personnel training and b) development of the technical
environmental know how and the required management skills.
(6). Application for certification awarded by established Eco Awarding Organisations, i.e.
Eco Flower, of international and global status and recognition.
(7). Use of green strategies and certification labels as tools for promotion in the tourist
markets to attract environmentally sensitive customers who tend to exhibit a price inelastic
buying behaviour when it comes to choosing ‘green’ accommodation.
(8). ‘Lobbying’ and ‘Networking’ with: a) best practice hotels for benchmarking purposes and
b) tour operators and travel agencies for intensive promotion
(9). Cooperation with tourism organisations that can provide expert guidance on available
funding programmes for the hotels to use in order to support their green strategies
implementation venture.
Finally, it should be stressed that a business organisation does not have to be built and
developed as a green company from its foundation. It can also be transformed to a green one
at a later stage of its operation (although this may prove to be more costly, according to
Crosby’s tenet: ‘quality first time’). It should also be noted that for such a venture training as
well as management commitment to long term results comprise two of the most fundamental
requirements for success. .
In the light of all of the above, it becomes obvious the paramount importance of the
need for the Greek hoteliers to see clearly the facts according to which they have to be ‘well
equipped’ in order to respond to the constantly increasing share of environmentally and
socially aware clientele and adopt the full range of green strategies as well as the appropriate
attitude and culture. If they keep on the present myopic attitude, ignoring this reality, they will
most probably find themselves out of the market due to fierce competition that will deprive
them of tourist demand which is of invaluable contribution to economic viability of Greek
enterprises and economy alike.
8. References Booth, M.E. and Philip, G. (1998), “Technology, competencies, and competitiveness: the case for
reconfigurable and flexible strategies”, Journal of Business Research, Vol. 41, pp. 29-40
Business Link (2011), Enabling the Transition to a Green Economy: Unlocking Green
Growth, Department of Business, Innovation and Skills, United Kingdom.
Journal of Regional Socio-Economic Issues, Volume 3, Issue 3, September 2013
72
Buzzell, R. D., & Gale, B. T. (1987). “The PIMS principles. New York: Free Press
Jacobson, R., & Aaker, D.A. (1987). Journal of Marketing, October, 31-44.
Colona, M. “Hotels offer Brand Differentiation to mid-tier Hotels”, April 2010
retrieved from:http://smarterhotelier.com/green-hotels-offer-brand-differentiation-to
mid-tier-hotels/
Esty, E. and Winston, A. (2006) “Green to Gold: How Smart Companies Use Environmental
Strategy to Innovate, Create Value and Build Competitive Advantage”, Yale University
Hambrick, D.C. & Lei, D, (1985). Towards an empirical prioritization of contingency
variables for business strategy. Academy of management Journal 28(4), 763-799. Press
London.
Heerde, & Mela , C 2005) The dynamic effect of Innovation on Market Structure,
Journal of Marketing Research: Vol. 41, No. 2
Kitsos, C.P., Hatzikian Y. (2008). Investigating Innovation techniques for the Greek
SMEs within the European Union
Kotler, P. (2001). Principles of Marketing. Prentice Hall.
Kuczmarski, T. (2011), Innovation always Trumps Invention, Bloomberg Business
week
Laroche, M., Bergeson, J., Barbari-Folero, G., 2001). Targeting consumers who are
willing to pay more for environmentally friendly products . Journal of Consumer
Marketing, Vol. 18 Iss: 6, pp.503 – 520
Mintzberg, H. (1988).”Generic strategies: Toward a comprehensive framework”. In
R. Lamb, &P. Shrivastava (Eds.), Advances in strategic management (Vol. 5).
Greenwich Press.
Nedis R., & Byler, E., (2009) Reinforcing Innovation Effectiveness A New
Methodological Approach for Policy Evaluation, ERSA Conference papers
OECD. (2005). OECD SME and Entrepreneurship Outlook. OECD Paris, page 17 .
OECD report 2008, Innovation and Crisis.
OECD (2009a). Sustainable Manufacturing and Eco-Innovation.. Framework,
Practices and Measurement, Synthesis Report, OECD, Paris
OECD (2009b), Eco-Innovation in Industry: Enabling Green Growth, OECD, Paris.
OECD (2010), The OECD Innovation Strategy: Getting a Head Start on Tomorrow,
OECD, Paris.
OECD 2011 WPSMEE. Annual SME Report, Paris.
Oines, A. and Assenov, I. (2007) ‘Competitive Advantage through Developing
Environmentally Friendly Hotel Resorts’http://fulltext.phuket.psu.ac.th/
proceeding/2549/25039.pdf#page=649
Peters, T. J., & Waterman, R. H., Jr. (1982).”In search of excellence.” New York:
Harper & Row
Porter, M., (2004) Competitive Advantage: Creating and Sustaining Superior
Performance, Free Press export Edition
Rosales, F., (2011). Competitiveness and Humanistic Productivity. Advances in
Competitiveness Research, Vol. 19 Issue 3/4, p74-84, 11p
Roth, B., (2002) “Hotel Industry Embraces Green Revolution”, Retrieved from:
http://www.entrepreneur.com/management/greencolumnistbillroth/article201838.html
Smarter Hotelier : Green Hotels offer Brand Differentiation to mind-tier Hotels.
Available at: http://smarterhotelier.com/green-hotels-offer-brand-differentiation-to-mid-
tier-hotels/
SETE – “The significance of Tourism for Greek economy” Athens 2008-2009
Spanos, Μ. (2009). “Corporate Social responsibility- Motives and Best practices”
Stohasis Consultancy Report.

Journal of Regional Socio-Economic Issues, Volume 3, Issue 3, September 2013
73
The Global Competitiveness Report 2011-2012’ World Economic Forum
Yunhi K., and Heesup H.,(2010) Intention to pay conventional-hotel prices at a green
hotel – a modification of the theory of planned behaviour. Journal of Sustainable
Tourism Vol. 18, No. 8, November 2010, 997–1014
Wight, PA (2003). “North American Ecotourism Markets: Motivations, Preferences
and Destinations.” Sage, California
World Economic Forum Annual Meeting 2009 Davos-Klosters, Switzerland, 28
January - 1 February 2009
WEBSITES
Edelman Public Relations (http://www.edelman.com/) Sunwing Hotels Hellas S.A.
http://www.csrhellas.org/csr_last2/portal/gr/misc/674oz_20071113674.php3
US Travel Association (http://www.ustravel.org/ )

Journal of Regional Socio-Economic Issues, Volume 3, Issue 3, September 2013
74
The Frame of Education and the effects in the Growth in E.U
Abstract:
The European Union invests considerably in education contributing to the growth of human
resources. Education, training and lifelong training constitute one of the most important
"levers" for the growth of competitiveness in a modern society. The Specialized and
experienced workers can contribute immediately to the aid of competitiveness and to the more
general economic and social growth. The considerable role of educational process at all
levels is not only just a simple truth that is continuously verified. It is a certainty in which
Europe is progressively and continuously supported. It is a collective investment that a
priority is connected unbreakably with various macroeconomic and micro-economic sizes of
economy, the harmonious social growth of member states of the European Community and
mainly the intellectual culture of people.
The EU has already began invest in the education and the continuing professional
training, from the treaty of Maastricht and with starting line two "White Bibles". The first
White Bible, in 1994, concerned growth, competitiveness and employment. The second
Bible, in 1995, gave particular accent to education and training. In 1997, the European Union
with the treaty of Amsterdam developed a coordinated strategy for employment and
contributes to the creation of specialized human resources via the possibility of access in
continuing education. With the beginning of a new millennium in Lisbon in March of 2000,
said that education is one of the most important things in the European Union and became the
most developed society of knowledge at world level. At the European Council in March 2003
it was there decided that should be investment specifically in human capital. Thus existence
competitiveness, so as to achieve high rhythms of growth and employment for the
establishment of an economy that would be based on knowledge (European
Commission,2003).Through the Council of Barcelona in March 2002 the "Agreement in
detail Program of Work for 2010" was decided, that would include the timetable for the future
objectives of systems in education and training. Studying various sessions of the European
Union we observe that the gravity and the qualitative accent that is observed for education,
training and via life learning, are immediately interwoven with the individual parameters and
repercussions that offer to the wider economy, social and cultural growth of member states in
their aggregate. This article aims to analyze the frame of education and training in the
European Union and also it investigates and analyzes the repercussions from the growth and
training of human recourses in the economic enlargement, competitiveness and social growth.
Keywords: Education, Growth, Cohesion, European Union
Aliki Demosthenous1
1 Corresponding Address: Demosthenous Aliki, University of Aegean, Department of Geography, Hill of
University, Mytilini: 81100, Lesvos. Email: [email protected]

Journal of Regional Socio-Economic Issues, Volume 3, Issue 3, September 2013
75
1. Introduction:
Education is a fundamental right of everybody. Help in the social and cultural growth
contributing to the acquisition of knowledge and dexterities. Education is determined by each
type of science, enacted form of teaching that is carried out in educational institutions,
independent of whether it is provided by the state or by private institutions.
The United Nations report that education should aim at the complete growth of human
personality and to aid the respect of human rights and fundamental freedoms. It should
promote friendship between nations and should encourage the growth of activities of the
United Nations in order to maintain peace (United Nations, 1948).
With regard to the definition that the World Bank gives for education it reports that
education is for all, big or small, in order to acquire knowledge and be possible to read and
write rightly. Their three pylons of strategy are: invest fast, invest intelligently and invest for
all. This strategy that they applied reflects correctly the best idea for what it work in
education, emanating from their world consultations with governments, schoolteachers,
students, parents and citizens in the above 100 cities in European Union.
Education constitutes an activity with cost in the present and investment in the future.
It has that is to say a future output because it increases and improves knowledge and faculties
of the individual and gives occasions to the individual to offer services in the private or public
sector, that will involve economic and not only utilities.
Cost of education is distinguished in private, which concerns the cost that pays the
individuals, and in social which concerns cost of state for education. The utilities from
education also can be separated in private and social and they take forms of finances and not
economic utilities, individual and social.
2. Life learning and economic growth
Rapid developments in science and in technology have been placed as fundamental strategic
objective, in order that an economy is competitive, dynamic and capable of viable growth.
The need in life of education and training is henceforth reality. In the modern society the
education and the training are placed between the higher strategic priorities. The creation of
high level of knowledge and acquisition of dexterities and faculties are considered essential
conditions for the attendance of individuals in all the aspects of modern society, as
professional integration, competitiveness, productivity, activation, personal growth and
extension for economic growth of country.

Journal of Regional Socio-Economic Issues, Volume 3, Issue 3, September 2013
76
The education constitutes continuous activity, continuous circle of action and
acquisition of new experiences, treatment and interconnection with existing knowledge, from
which are drawn conclusions that dictate with line new action. We live and developed in a
world economy. Thousands workers, graduates, unemployed and not, executives and
academicians face today challenge the continuing in life education. Upgrade of knowledge,
change of direction and re-designing of business, are variables that we continuously more
often meet and will meet in the direct future.
With the term economic growth we do not only mean the faculty of country increases
her production but also a line of structural changes and institutional changes of frame that
determine the way of production and their force of income. A process that makes the persons
generally wealthier, increasing their control in goods and extending their choices, by develop
their biotic level.
3. Education with Social Growth
When the term growth is reported in a more general frame social, economic and cultural life
of population, we speak about "social growth" .
Τhe basic beginning of social growth is the admission that knowledge constitutes a
condition for the energetic attendance of citizens in social and cultural life and aims for the
growth of the personality in the rapid international socio-economic, scientific and
technological developments, for the growth of attendance of citizens in situations that concern
them, for the contribution and for attendance, in the creation of cultural goods, in the balanced
social progress and in the confrontation of each form of discriminations and inequalities.
Growth as an objective aim and as a process includes a change in the basic values of
life and work as well as their social, cultural and political institutions. Mr Streeten sees the
process of growth through the progress and dimensions of standards production and income,
conditions of production, levels of life (diet, living, health, education), behavior and attitude
towards work, the institutions and the tactics that are followed. From above the result is that
growth is a multidimensional process and collection of aims, where the dimensions are social,
political and cultural.
4. Education and economic growth in the European Union
Education constitutes an integral and particularly important factor, which contributes to the
economic growth of a country. Between education and the economy there exists a process of
continuous adaptation and intense interdependence: changes in the operation of economy, as
Journal of Regional Socio-Economic Issues, Volume 3, Issue 3, September 2013
77
for example the industrial revolution, place in movement forces that radically alter the
character of education and vice versa. New technologies that emanate from the education
system and its development fundamentally affect economic relations.
In the report of Team of Work of European Committee, which was constituted on the
subject "the application of education and training 2010", it was reported that the essential
annual increase of investments in human resources, through education and training, is the key
to the intensification of the place of Europe in the sector of economy and the aid of social
cohesion in 21st century. More concretely, it is marked that education, training and life
learning play a vital role in the growth of economies and societies.
Investments in education have a long-term output, which are difficult to calculate. In
most countries these investments are responsible of mainly the public sector. However, public
funds are limited a particular accent is given to the increase in investments in education from
the private sector. Moreover, private level, profits exist at an individual level with the
significance of the quality of life the rise in the standard of living and active social role.
For evaluation issuing of economic resources is given particular accent in
significances of efficiency and feeling of right, what is very important for equitable
management of government owned budget and improvement of quality and effectiveness of
educational systems in the European Union (European Commission, 2004 v). First
significance concern in the relation "surges – flows" in the education, while second in affair
that the current school is imposed it includes students, depending on their individual
particularities, in a single educational frame, capable it ensures the equality of occasions and
the better success for all. Excluding restrictions that are presented by exterior factors as the
economic situation of family and the geographic place of place of residence (Commission of
the European Communities, 2005). Characteristic example they are the results of researches in
schools of Secondary Education, where it is realized that the school escape is smaller, when
the available Economic Resources in education and training are bigger (Ruseas & Vretakou,
2006).
4.1 Education and growth
The growth of human resources is also this process of learning which aims at a bigger time
horizon and the worker acquires knowledge in order to develop faculties that will be of use in
the future, in work that requires more responsibility and initiative. Education helps employees
to work methodically. On the contrary growth helps the worker to be prepared to undertake
future, new responsibilities, different from those of the present.

Journal of Regional Socio-Economic Issues, Volume 3, Issue 3, September 2013
78
Education and growth are relative between these terms. We often use the phrase
"education and growth personal". Education, not alone, is a means of growth. However in
order to be effective education should also be supported by a line of other factors, such as our
personal priorities, our, behavior and relation with our colleagues, and the culture of
enterprise and society.
If we take the significance of growth it has multidimensional content. Generally, is the
process of passage of society from a phase in other, superior. It comprehended as a
multifaceted process and reported in more permanent character changes in develop of
production, as enlargement of social justice in the country or as situation economic and
technological maturity that they have conquered certain societies.
It is generally acceptable that the objective of each organized society is the prosperity
of its members. Insofar as it has satisfied this objective we speak about growth. When the
term growth is reported in the production of economic goods and the improvement in the
standard of living of the residents of a country, then we speak about economic growth
(Psaxaropoulos, 1999). With the term economic growth we do not only mean the faculty of a
country increases its production but a line of structural changes and institutional changes of
frame that determine the way of production and force of income. It is to say a process that
makes the people in general richer and increasing their control of goods and extending their
choices.
Developed are considered today the modern industrial societies, provided that the
growth has been connected with the industrialization. Uncontradictable common
characteristic of all developed countries is the objective high of education and more generally
increased investments in human capital, after "…education is a conjunctive ring key in the
conjunctive structure between the culture and development…" and "the human resources
constitutes the final base of wealth of nations" (Harbison, 1973).
Always topical is the relation of reason – reasonable, whether, that is to say, the type
of education can influence the type of growth or reversely, the type of growth is what can
determine the type of education that is provided. In their bidirectional relation that is to say,
the side of demand or the side of offer is the most decisive element. The education belongs
and simultaneously constitutes one from motive forces of economic growth and the centre of
learning in a society. It is, at the same time, place of safeguarding and creation of knowledge.

Journal of Regional Socio-Economic Issues, Volume 3, Issue 3, September 2013
79
4.2 The education of human resources priority of European Union
The European Union with the finance that it provides in the educational and social policy
shows that it recognizes to a very big degree the importance of education, training and
continuing education for the individual, the society and the economy. This becomes
practically perceptible, from the conditions, the programs and the policies of growth of human
potential that applies in the European Union. The growth of programs of concrete action, that
objective aims at the confrontation of problems of strategic importance, as the unemployment
of young people and the achievement as the competitiveness of enterprises and the training of
citizens for technological developments, certifying the shift of interest for the growth of the
personality of European citizens to objectives that are influenced more immediately by the
economy.
From 1951, in its founding practice, it was already realized by the institutional frame
practiced educational policy of European Union for the continuing education, the importance
of professional training and reeducation. The high levels of unemployment, the appearance of
new technologies and the globalized economy, that began to characterize the countries of the
European Union from the decade of the 1980s, led to the necessity of continuing education. It
started giving emphasis to in the improved forms of training and considered the continuing
education condition for the social cohesion, the reduction of inequalities, the promotion of
economic growth and the improvement of competitiveness, through the better exploitation of
human potential and the manning of enterprises with a better trained personnel. Later, in the
decade 1990s, accent was given to the upgrading of systems of education and training and the
access of all citizens to them.
The European Union began therefore, to invest in education and continuing
professional training, something that appears with the treaty of Maastricht based on the two
white books that the European Committee has published. First White Bible, in 1994,
concerned the growth, the competitiveness and the employment, and second, in 1995,
education and training. Its European Year Via life of education and training, in 1996, stressed
the importance of continuous education and the active attendance of all in this, for the
improvement of competitiveness, the fight against of unemployment, and the attendance of
citizens in the social life and the growth of innovation. The European Union with the treaty
Amsterdam in 1997, strengthened and developed a coordinated strategy for employment that
contribute to the creation of specialized human potential, with the offer in all of the possibility
of access to continuing education. Later and with the beginning of new millennium in Lisbon
in March 2000, it elected the continuing but also basic education, in order for the European

Journal of Regional Socio-Economic Issues, Volume 3, Issue 3, September 2013
80
Union to become the most developed society of knowledge in the world. Even if the main
policy gave exclusive competence to the states-member to practice their own policies, at the
same time it strengthened the coordinative role of the Union, while it also placed also the
future objectives of systems of education and training up to 2010.
Entrepreneurship is a key competence in the European Framework, and an action in
both the recent Rethinking Education Commission Communication. The role of
entrepreneurship as an instrument to improve employability levels is also stressed in the
Annual Growth Survey 2013. Young people should be encouraged to develop entrepreneurial
skills through informal and non-formal education like volunteering. Such experiences should
also be validated and recognized, in accordance with the proposed commission
recommendation in this area.
Whether or not they go on to found businesses or social enterprises, young people who
benefit from entrepreneurial learning, develop business knowledge and essential skills and
attitudes including creativity, initiative, tenacity, teamwork , understanding of risk and a sense
of responsibility. This is the entrepreneurial mind-set that helps entrepreneurs transform ideas
into action and alsosignificantly increases employability.
Recently in the agenda of modernisation the European Union places certain objectives.
Its first objective is that 40% of individuals of ages 30-34 should have a degree. At an
individual level, the prospects of the employment of individuals will be improved. Europe
needs a wider spectrum of most Institution of Higher Education in order for it to correspond
with the needs of a bigger and more differentiated team of students and ensure that enough
individuals with high qualifications exist and innovative ideas in each sector of economy and
in society as a whole.
The countries of European Union collaborate more closely so that they ensure:
the possibility at more students continuing and completing their studies in the maximum
education
that universities and other educational institutions should offer qualitative study that
will be more attractive for the students and will correspond more with social and enterprising
needs
that by 2020, young citizens of Europe will have the occasion to do part of their study
or their studies abroad
Finally education is a process which is always topical and diachronic and which is
immediately related to the social, cultural and economic life of individuals. It is essential
nowadays because it helps the social and human growth contribute thus in the acquisition of

Journal of Regional Socio-Economic Issues, Volume 3, Issue 3, September 2013
81
knowledge and skills. The European Union has an important role to carry out the promotion
of education through a life-long training of individuals through various means and conditions.
The economic help that the European Union provides through its conditions, that
concern education, gives an impulse to her countries members to invest more seriously in the
education.
4.3 Tertiary education in European Union
The European Union has around 4000 higher education (undergraduate and postgraduate)
institutions, with almost 20 million students in 2010. Four member states reported more than
2 million tertiary students in 2010, namely Germany, the United Kingdom, France and
Poland. Tertiary student numbers in Italy and Spain were just below this level and together
these six countries accounted for two thirds of all European Union students in tertiary
education (Table 1).
Across the European Union, just over one third (34,7%) of the students in tertiary education
were studying social sciences, business or law. The second largest number of students by field
of education was in engineering, manufacturing and construction-related studies which
accounted for 14.7% of all students in tertiary education. The third largest number of students
(13,9%) was in the health and welfare area (European Union, 2011) (Figure 1).
The median age of students in tertiary education can be influenced by a number of
factors: whether students postpone starting tertiary education either by choice or obligation
(for example, for military service); the length of the tertiary education courses studied; or the
extent to which mature students return to tertiary education later in life. In 2010, the median
age of students in tertiary education ranged from 20.3 in Ireland to 24.9 in Sweden. The
German figure was above the European Union average of 22.1 years, even though the data
exclude those students enrolled in ISCED in level 6 (European Union, 2011).

Journal of Regional Socio-Economic Issues, Volume 3, Issue 3, September 2013
82
Table 1: Tertiary Education 2009/2010
TERTIARY EDUCATION 2009/10
TT
L N
O-S
TU
DE
NT
-
TE
RT
IAR
Y
ED
UC
AT
ION
HU
MA
NIT
IES
AN
D
AR
TS
SO
CIA
L
SC
IEN
CE
S,
BU
SIN
ES
S A
ND
LA
W
SC
IEN
CE
, M
AT
H
AN
D C
OM
PU
TIN
G
EN
G.
MA
NU
F.A
ND
CO
NS
TR
UC
TIO
N
AG
RIC
UL
. A
ND
VE
TE
RIN
AR
Y
HE
AL
TH
AN
D
WE
LF
AR
E
SE
RV
ICE
S
ED
UC
AT
ION
EU-27 19845,6 12,5 34,7 10,2 14,7 1,8 13,9 4,1 8,1
BE 445,3 10,8 31,7 6,2 11,5 2,8 23,1 1,7 12,2
BG 287,1 7,9 44 5,2 19,2 2,4 7,1 8,5 5,7
CZ 437,4 9 33,7 11,1 14,3 3,7 10,5 5,2 12,5
DK 240,5 14,1 31,9 8,6 10 1,5 21,1 2,3 10,4
DE 2555,6 13,7 26,3 14,2 16,5 1,4 17,9 2,8 7,2
EE 69 13,6 36,4 10,4 13,4 2,2 9,1 8 6,8
IE 194 17 27,5 14,6 13 1,5 16 4 6,4
EL 641,8 12,8 33,2 13,8 18,4 5 8,1 2,7 5,9
ES 1879 10,7 31,6 9,2 17,4 1,7 12,6 5,8 10,9
FR 2245,1 14,2 37,3 12,3 13,2 1,2 16 3,4 2,4
IT 1980,4 15,7 36,5 8,3 16,9 2,2 12,5 3 5,1
CY 32,2 10,1 51,7 8,5 9,8 0,3 7,1 4,3 8,2
LV 112,6 8,5 49,9 5,5 12,6 1,1 8,2 6,1 8,2
LT 201,4 7,3 46,5 5,1 17,1 1,9 8,8 2,9 10,5
LU 5,4 12,1 47,3 11,2 8,1 0 4,5 0 16,8
HU 389 9,6 40,4 7,1 14 2,4 9,3 10,5 6,6
MT 10,8 18,1 33,2 16,4 9,4 0,2 11,6 1,2 10
NL 650,9 8,5 38,9 6,3 8,2 1,1 17,3 65 13,3
AT 350,2 13,4 37,2 11 14,7 1,3 7,9 2,4 11,9
PL 2148,7 9,2 39,7 8,1 13,2 1,9 7,7 6,7 13,6
PT 383,6 8,9 31,8 7,3 22,1 1,8 16,3 6,4 5,4
RO 999,5 7,8 55 4,9 17,9 2,1 7,5 3,3 1,6
SI 114,9 8,3 37,5 6,7 18,9 3,2 8,7 9,3 7,4
SK 2345 6,9 30,7 8,4 15 2,1 18,2 6,2 12,5
FI 303,6 14,3 22,8 10,2 24,9 2,2 15,6 5,1 5
SE 455 13,6 27,2 8,6 16,7 1 17,2 2,5 13,2
UK 2479,2 17 29 14 8,9 1 18,7 1,8 9,5
IS 18,1 14,6 36,9 8,1 9,3 0,6 13,2 1,7 15,6
LI 0,8 - 70,1 - 24,7 - 52 - -
NO 224,7 10,8 32 8,3 8,1 0,7 20,3 5,2 14,5
CH 248,6 12,1 36,7 9,7 13,2 1,1 13,2 4,8 9,2
HR 149,9 9,5 42,2 6,8 15,3 4,2 8,4 8,8 4,7
MK 61,8 12,2 38,6 11,7 12,5 2,9 9,5 6,3 6,3
TR 3529,3 7,8 53,8 6,5 10,9 3,6 5,9 3,2 8,3
Sources: Eurostat
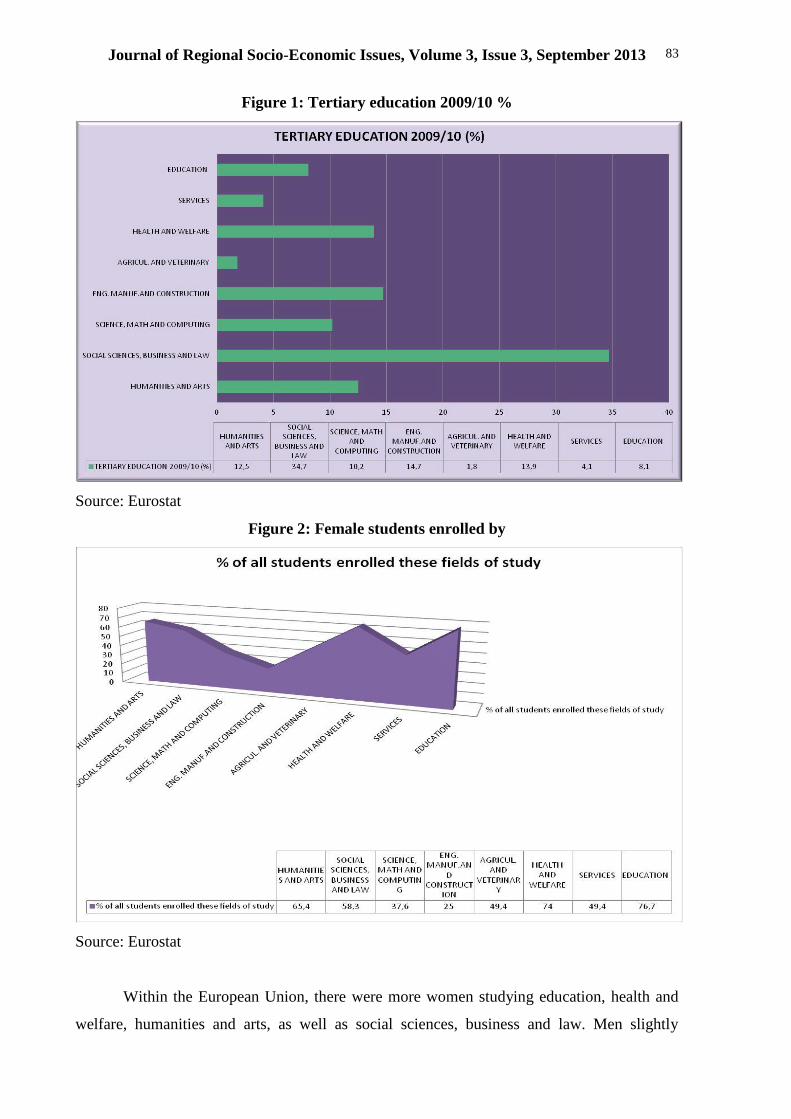
Journal of Regional Socio-Economic Issues, Volume 3, Issue 3, September 2013
83
Figure 1: Tertiary education 2009/10 %
Source: Eurostat
Figure 2: Female students enrolled by
Source: Eurostat
Within the European Union, there were more women studying education, health and
welfare, humanities and arts, as well as social sciences, business and law. Men slightly

Journal of Regional Socio-Economic Issues, Volume 3, Issue 3, September 2013
84
dominated in agriculture and veterinary fields, more so in services, science, mathematics and
computing fields, and by close to four to one in engineering, manufacturing and construction-
related fields (Figure 2).
5. Conclusions and Recommendations
The education is a process always topical and diachronic which is related immediately with
social, cultural and economic life of persons. It is essential in the days because it helps in the
social and human growth contributing thus in the acquisition of knowledge and dexterities.
Important role in this it is called to carry out also the European Union promoting the
education and the via life training of individuals through her various conditions.
The economic help that provides the European Union through her conditions, that
concern the education, gives a impulse in her countries members they invest considerably in
the education.
The Streen sees the process of growth through the progress and dimensions of
production and incomes, conditions of production, level of life (diet, accommodation, health,
and education), behavior and attitude as for the work, the institutions and the tactics that are
followed. Thus we lead to the conclusion that the growth is a multidimensional process with
total of aims, where the dimensions are social, political and cultural. Certain the growth as
process we cannot say that it is synonymous with the economic growth as the last one appears
to profit the persons with way unequal.
6. References
Commission of the European Communities (2005), Progress towards the Lisbon Objectives in
Education and Training: Making Best use of Resources, Progress Report
European Commission (2004), Implementation of Education and Training 2010. Work
Programme: Working Group E “ Making the best use of resources”, Progress Report
European Commission (2003), The success of the Lisbon Strategy Hinges on Urgent
Reforms.
Paper adopted jointly by the Council and the Commission (2003)
Ruseas P. and Vretaku B. (2006), The school Escape in the Secondary Education. Athens:
Eptalofos.
Gravaris, D.N (1994), Education and Political Economy. Athens: Foundation Saki
Karagiorga.
Harbison, F.H, (1973) Human Resources as the Wealth of Nations. New York: Oxford
University Press.
Christou G. & Roussaki I. (2008), European Union: Policies in Education, Pedagogic
Institute.
Papageorgiou P. and Xatzidima S. (2003) Import in Economy of Human Resources and
Education, Athens: Stamouli
Psaxaropoulos G. (1999) Education in Economics, Pub. Papazisis, Athens.

Journal of Regional Socio-Economic Issues, Volume 3, Issue 3, September 2013
85
Website
United Nations (1948) Universal Declaration of Human Rights. It was published 12
November
2012. Available from http://visit.un.org/wcm/content/
European Union, Work of Education. It was published 15 January 2012. Available from
http://ec.europa.eu/education/policies/2010/doc/working-group-repost_en.pdf
European Union, European Social Statistics. It was published in 2013. Available from
http://ec.europa.eu/eurostat/product

Journal of Regional Socio-Economic Issues, Volume 3, Issue 3, September 2013
86

Journal of Regional Socio-Economic Issues, Volume 3, Issue 3, September 2013
87
Book Reviews Book Presentations

Journal of Regional Socio-Economic Issues, Volume 3, Issue 3, September 2013
88
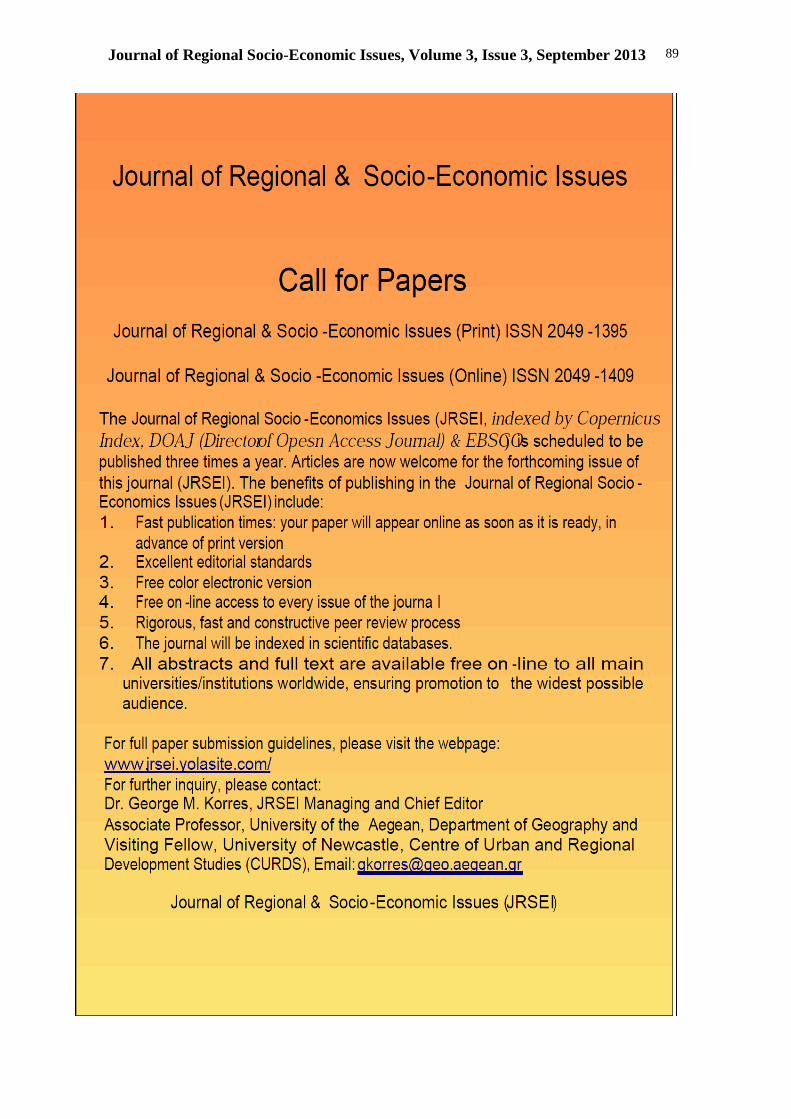
Journal of Regional Socio-Economic Issues, Volume 3, Issue 3, September 2013
89

Journal of Regional Socio-Economic Issues, Volume 3, Issue 3, September 2013
90
Instructions to Authors
Journal of Regional & Socio-Economic Issues (Print) ISSN 2049-1395
Journal of Regional & Socio-Economic Issues (Online) ISSN 2049-1409
Aims of the Journal: Journal of Regional Socio-Economic Issues (JRSEI) is an international multidisciplinary
refereed journal the purpose of which is to present manuscripts that are linked to all aspects of
regional socio-economic and all related issues. The journal indexed by Copernicus Index,
DOAJ (Director of Opesn Access Journal) & EBSCO and welcomes all points of view and
perspectives and encourages original research or applied study in any of the areas listed
above. The views expressed in this journal are the personal views of the authors and do not
necessarily reflect the views of JRSEI journal. The journal invites contributions from both
academic and industry scholars. If you have any questions about the journal, please contact
the chief editor. Electronic submissions are highly encouraged (mail to:
Review Process:
Each suitable article is blind-reviewed by two members of the editorial review board. A
recommendation is then made by the Editor-in-Chief. The final decision is made by the
Editor-in-Chief. If a revision is recommended, the revised paper is sent for a final approval to
the Chief-Editor.
Instructions to Authors: In order for a paper to be submitted to the Journal for publication, the following should be
taken into consideration:
1. All papers must be in English.
2. Papers for publication should be sent both in electronic format (MS Word and MS Excel
for charts) to the Chief Editor (mail to: [email protected]).
3. The Editor takes for granted that:
the submitted paper contains original, unpublished work that is not under consideration
for publication elsewhere;
authors have secured any kind of permission necessary for the publication from all
potential co-authors, along with having agreed the order of names for publication;
authors hold the copyright, have secured permission for the potential reproduction of
original or derived material and are ready to transfer copyright of the submitted paper to
the publisher, upon acceptance for publication.
4. The cover page should include the name of the author and coauthors, their affiliations, and
the JEL category under which the paper primarily belongs. The cover page is the only
page of the manuscript on which the names and affiliations of the authors and coauthors
should be listed.
5. Submission of manuscripts in electronic form: Authors must submit electronic
manuscripts. The submission should only contain the file(s) of the papers submitted for
publication, in MS Word and MS Excel for charts. If more than one file, a compressed file
(.zip) should be submitted instead.
Journal of Regional Socio-Economic Issues, Volume 3, Issue 3, September 2013
91
6. Formatting requirements: Everything should be double-spaced (main text, footnotes,
bibliography, etc.)
7. Footnotes should be as few and as short as possible (preferably devoid of tables or
formulae), marked in the manuscript by superscripts in Arabic figures.
8. Formulae should be numbered by consecutive, Arabic figures (such as (1), (2), etc.),
placed on the right-hand side of the page.
9. Tables and Figures should be numbered consecutively in Arabic figures and have a
heading and a title.
10. References are citations of literature referred to in the text and should not appear as
footnotes. Abbreviations are only accepted in the authors' first names. Place all references,
alphabetized by author's last name (with last name first), on separate pages in a section
titled "References" at the end of the paper. Indent the second and subsequent lines of each
reference.
Journals Include all authors, article title, full title of journal, volume number, issue number, month,
year, and full page numbers. Example:
Michael Mahmood. "A Multilevel Government Model of Deficits and Inflation,"
Economic Journal, 24, 2, June 2010, pp. 18-30.
Books Include name of author, full title of book, edition, city and state (or country) of publisher,
name of publisher, and year of publication. Example:
Shapiro, John. Macroeconomics, 4th ed., New York, NY: Harcourt Brace Jovanovich,
2009.
Use the following style when an author's work appears in a publication edited by another:
George Summers, "Public Policy Implications of Declining Old-Age Mortality," in Gary
ed., Health and Income, Washington, DC: The Brookings Institution, 1987, pp. 19-58.
Public Documents Include the department or agency responsible for the document, title, any further
description such as number in a series, city and state (or country) of publication,
publisher, and date of publication. Example:
World Bank. Educational Attainment of Workers, Special Labor Force Report 186,
Washington, 2010.