cooling strategies for ultra-high density racks and blade servers
TRANSCRIPT

Cooling Strategies for Ultra-High Density Racks and Blade Servers
Revision 7
by Neil Rasmussen
Introduction 2
Clearly defining power density in the data center
2
Power and cooling requirements for the high-density enclosure
6
Five strategies for deployment of high-density enclosures and blade servers
10
Value of compaction 15
Conclusion 17
Resources 19
Click on a section to jump to it Contents
White Paper 46
Rack power of 10 kW per rack or more can result from the deployment of high density information technology equipment such as blade servers. This creates difficult cooling challenges in a data center environment where the industry average rack power consumption is less than 2 kW. Five strategies for deploying ultra-high power racks are described, covering practical solutions for both new and existing data centers.
Executive summary>
white papers are now part of the Schneider Electric white paper libraryproduced by Schneider Electric’s Data Center Science Center [email protected]
Cooling Strategies for Ultra-High Density Racks and Blade Servers
Schneider Electric – Data Center Science Center White Paper 46 Rev 7 2
The power consumed by the equipment housed in a single rack enclosure can vary dramati-cally. The average power consumed by an enclosure in a data center is about 1.7 kW, but the maximum power that can be obtained by filling a rack with available high density servers, such as blade servers, is over 20 kW. Such loads greatly exceed the power and cooling design capabilities of the typical data center. Data center operators have very little experience with enclosures drawing over 10 kW, but recent trends suggest that many will be confronted with the need to install and provision power and cooling for high density racks either singly or in groups. The simple answer to this problem would be to provision a data center so that it is capable of providing 20 kW of redundant power and cooling to every enclosure. Unfortunately, this is simply not technically feasible or economically practical in almost any case. Making the wrong choices when specifying a data center for high density operation can needlessly increase the lifetime cost of the physical infrastructure by many times. The purpose of this paper is to outline practical and effective strategies for deployment of high density enclosures and blade servers. First the concept of power density is reviewed. Next the actual power density values of current and new data centers are examined. The practical approaches to achieving high density are presented, along with their limitations and benefits. Finally, logical and practical strategies for deploying high density computing are presented. Very significant misunderstandings can occur when describing power density because the meaning of the term “power density” is ambiguous. Power density is often expressed in Watts per square foot or Watts per enclosure. This simple description is sufficient when the power consumed by all enclosures is the same. However, in a real data center the power per enclosure varies dramatically. In these real-world cases the power density measured at the rack level, at the row level, and at the room level may all differ considerably. This variation in the power density measured at the enclosure, row, and room has a significant impact on the design of the power infrastructure support system, and has an even greater impact on the design of the cooling system. The difference in power density measured at the rack, row, and room levels is shown in Figure 11. In the figure, enclosures of 12 kW are installed in a typical room. In one case, 15% of the enclosures in the room draw 12 kW and the remainder draw, 1 kW. In the second case, the same percent of enclosures draw 12 kW but they are clustered into a single row. In the third case, all the enclosures in the room draw 12 kW. In each of these cases the peak power density is the same at 12 kW per rack, which translates to 480 W / ft2 (5.2 kW / m2). However, the row and the room power densities vary dramatically between the cases.
1 The rack and row densities in Figure 1 use a rack floor equivalent of 25 ft2. Commonly-used rack floor
equivalents vary from 25 to 30 ft2 (2.3- 2.8m2). For more about representing power density, see White Paper 120, Guidelines for Specification of Data Center Power Density.
Introduction
Clearly defining power density in the data center

Cooling Strategies for Ultra-High Density Racks and Blade Servers
Schneider Electric – Data Center Science Center White Paper 46 Rev 7 3
Alternative #1 Alternative #2 Alternative #3
Max Rack: 480 W / ft2 (5.2 kW / m2)
Max Rack: 480 W / ft2 (5.2 kW / m2)
Max Rack: 480 W / ft2 (5.2 kW / m2)
Max Row 150 W / ft2 (1.6 kW / m2) Max Row 315 W / ft2 (3.4
kW / m2) Max Row 480 W / ft2 (5.2 kW / m2)
Room: 109 W / ft2 (1.2 kW / m2) Room: 109 W / ft2 (1.2
kW / m2) Room: 480 W / ft2 (5.2 kW / m2)
The difference between the rack, the row, and the room power densities reflected in Figure 1 are representative of realistic alternative installations. These differences significantly affect the design of the power and cooling infrastructure. The total rating of the power system and the cooling system is simply the sum total of the power consumed by the loads. This allows the total size of the UPS and computer room air conditioners (CRACS) to be readily deter-mined. The main problem related to the variation and the peak values of power density relate to power and air distribution within the data center. Note that the above descriptions of density are expressed in terms of total floor area, which includes space such as aisles, which are needed but are in addition to the footprint area of the enclosure. This is the most commonly used method to describe density and this termi-nology will be used consistently throughout this paper. However, some literature, particularly from computer OEMs, describes density in Watts per unit area where the area is restricted the footprint of the enclosure. Such density numbers based on equipment footprint must be adjusted downwards by approximately 75%. Actual power density capability of current data center Schneider Electric and other organizations have conducted surveys of designers and operators of data centers to determine the current operating power densities and the design limits of new and existing data centers and large network rooms. The data of Table 1 represents a summary of 2002-2003 data from various sources including enterprise custom-
12 kW Rack 1 kW Rack
Figure 1 Power density in Watts per unit area, per rack, per row, and per room for three room configurations

Cooling Strategies for Ultra-High Density Racks and Blade Servers
Schneider Electric – Data Center Science Center White Paper 46 Rev 7 4
ers, service personnel, and consulting engineers. The actual overall per-enclosure power density value found agrees closely with the values found in recent surveys by the University of California at Berkeley.
Characteristic Average across data centers
90% of data centers are less
than
Maximum example found
Design power density 35 W / ft2 (0.38 kW / m2)
60 W / ft2 (0.65 kW / m2)
200 W / ft2 (2.15 kW / m2)
Actual operating power density 25 W / ft2 (0.27 kW / m2)
40 W / ft2 (0.43 kW / m2)
150 W / ft2 (1.61 kW / m2)
Design per-enclosure power density 1.1 kW / enclosure 1.8 kW / enclo-sure 6 kW / enclosure
Actual overall per-enclosure power density 1.7 kW / enclosure 2 kW / enclosure 4 kW / enclosure
Actual average per enclosure power in highest density row of enclosures in the data center
2 kW / enclosure 3 kW / enclosure 7 kW / enclosure
Actual Highest power enclosure in the data center 3 kW 6 kW 12 kW
The data indicates that design power density for data centers is on average 35 W / ft2 (0.377 kW / m2) corresponding to 1.1 kW per enclosure if 30 ft2 (2.79 m2) per enclosure is assumed. The finding that average per-enclosure actual power is greater than the design value is possible because on average the design density of 35 W / ft2 (0.38 kW / m2) per enclosure is not achieved. This occurs primarily because data centers are not fully populated with enclosures. For example, a data center that has a design per-enclosure power density of 1.1 kW / enclosure at 30 ft2 (2.79 m2)2 per enclosure may be able to power a per-rack power density of 2.2 kW / enclosure if the enclosures are only using half of the available floor space. Note that this data is for production environments only. Somewhat higher average and maximum power density was found in development and test environments. In Figure 2, the frequency distribution of per-rack power consumption based on survey data is shown.3 This provides additional insight into the drivers of power density. Each bar or bin represents the percentage of racks exhibiting a power draw in the 500-Watt range up to the
2 Mitchell-Jackson, J.D., Koomey, J.G., Nordman, B., Blazek, M., Data Center Power Requirements:
Measurements From Silicon Valley, May 16, 2001. Master’s Thesis, Energy and Resources Group, University of California. Berkeley, California.
3 This data is more difficult to obtain than the data in Table 1 because per-rack power measurement instrumentation is not present in most data centers. In many cases the data had to be estimated by taking the actual power data for a group of racks and then apportioning the power among the enclo-sures using the extensive cross-vendor power consumption data maintained by Schneider Electric for use in UPS sizing tools.
Table 1 Survey data regarding the design and actual power density of data centers
Note: enclosures include rack enclosure and equipment enclosures such as DASD and mainframe computers. Equipment larger than a rack enclosure are counted as a number of rack enclosures equaling the same footprint

Cooling Strategies for Ultra-High Density Racks and Blade Servers
Schneider Electric – Data Center Science Center White Paper 46 Rev 7 5
kW value indicated at the bottom of the bar. For example the 1.5 kW bar includes enclosures with a power draw between 1 kW and 1.5 kW. Note in Figure 2 that there are a substantial number of enclosures in a typical data center that draw under 500 W. These enclosures include patch panels and racks with low-density switches and low-density servers. Many of these racks also include substantial unused open vertical space. Note further in Figure 2 that the number of enclosures drawing power above 2 kW decreases dramatically, and that the number of enclosures drawing more than 8 kW was insignificant.
0%
5%
10%
15%
20%
25%
0.5 1.5 2.5 3.5 4.5 5.5 6.5 7.5 8.5 9.5 10.5
11.5
12.5
13.5
14.5
15.5
16.5
17.5
18.5
19.5
Per Rack Power - kW
% o
f Enc
losu
res
2003 actual dataAverage = 1.7kW
Max blade server
Max1 Userver
>90% of new data centerscapability
Superimposed on the actual per-enclosure power consumption values in Figure 2, are a number of reference lines. The first pair of reference lines indicates the range of average power densities that new data centers are designed for, based on a survey of consulting engineers. The next two lines represent the power densities that can be obtained by filling rack enclo-sures with the highest density server products available today, which are 1U servers and blade servers. These values greatly exceed the design values for new data centers and the actual values of existing data centers. Although blade servers can exhibit higher power per rack than 1U servers, it should be noted that at these power densities the blade servers provide approximately twice the number of servers as 1U servers, suggesting that blade servers draw approximately 40% less power per server than conventional 1U servers. From this data the following observations can be made: • Most enclosures in data centers operate at a power below the design value for the data
center
• High density computing equipment is not actually installed at the maximum density that it is capable of achieving
• Power density values that are routinely talked about in the popular press are not achieved by any significant number of current or impending data centers.
Figure 2 Frequency distribution of actual rack power consumption, showing relation to maximum possible rack configuration
Cooling Strategies for Ultra-High Density Racks and Blade Servers
Schneider Electric – Data Center Science Center White Paper 46 Rev 7 6
For purposes of this paper, the term “high density” will refer to enclosures of over 3 kW, where the 3 kW value corresponds to the upper limit of the range of the average cooling capability of current data centers. An example of a very high density enclosure would be a blade server installation consisting of six 7U blade server frames in a 42U rack, with each blade chassis consuming 3 kW for a total power requirement of 18 kW. This means that 18 kW of power must be provided to the enclosure, and that 18 kW of cooling must be provided to the enclosure. A system of this type would typically be considered a mission-critical system and both power and cooling redundancy would be required. Power requirement From the power standpoint, this six-chassis blade system would most likely require (24) 20 A power supply circuits at either 208 V or 230 V, assuming a typical four-wire configuration for each dual-path chassis. The cabling associated with this circuitry is bulky and would normally need to be run overhead to prevent the creation of airflow blockages under the raised floor (if a raised floor is used). This is particularly true if there were a number of such enclosures located near each other. Alternatively, if a raised floor is used the depth of the raised floor could be increased to accommodate the wiring. In either case, substantial additional wiring must be installed, which can be complicated and expensive if the data center is operational. With these methods it is possible to provide redundant power to an ultra-high density rack. Cooling requirement Cooling an ultra-high density enclosure is a much more difficult problem than providing power. The blade server system described above would require approximately 2,500 cfm (cubic feet per minute) (1,180 L/s) of cool air at the intake (based on a common value of 20°F [11°C] exhaust air temperature rise) and would exhaust the same amount of heated air from the rear of the enclosure. The equipment will draw this volume of air whether or not the cooling system can provide it. If the room is not capable of providing this quantity of cool air to the enclosure, then the enclosure will draw in its own hot exhaust air (or the exhaust air of neighboring equipment) and eventually overheat. There are four key elements needed to achieve the required cooling performance: • Supply 2,500 cfm (1,180 L/s) of cool air to the enclosure
• Remove 2,500 cfm (1,180 L/s) of hot exhaust air from the enclosure
• Keep the hot exhaust air away from the equipment air intake
• Provide all of these functions in a redundant and uninterrupted manner
Each of these functions is very difficult to achieve. The difficulties of each of these are addressed in the following sections. Supply 2,500 cfm (1,180 L/s) of cool air to the enclosure A typical raised floor data center provides one vented floor tile for each enclosure. The average vented floor tile is capable of providing approximately 300 cfm (142 L/s) of cool supply air to an enclosure. This means that the 18 kW enclosure requires 8 vented floor tiles, which is 8 times more than would normally be allocated. The aisle widths would need to be
Power and cooling requirements for the high-density enclosure
Cooling Strategies for Ultra-High Density Racks and Blade Servers
Schneider Electric – Data Center Science Center White Paper 46 Rev 7 7
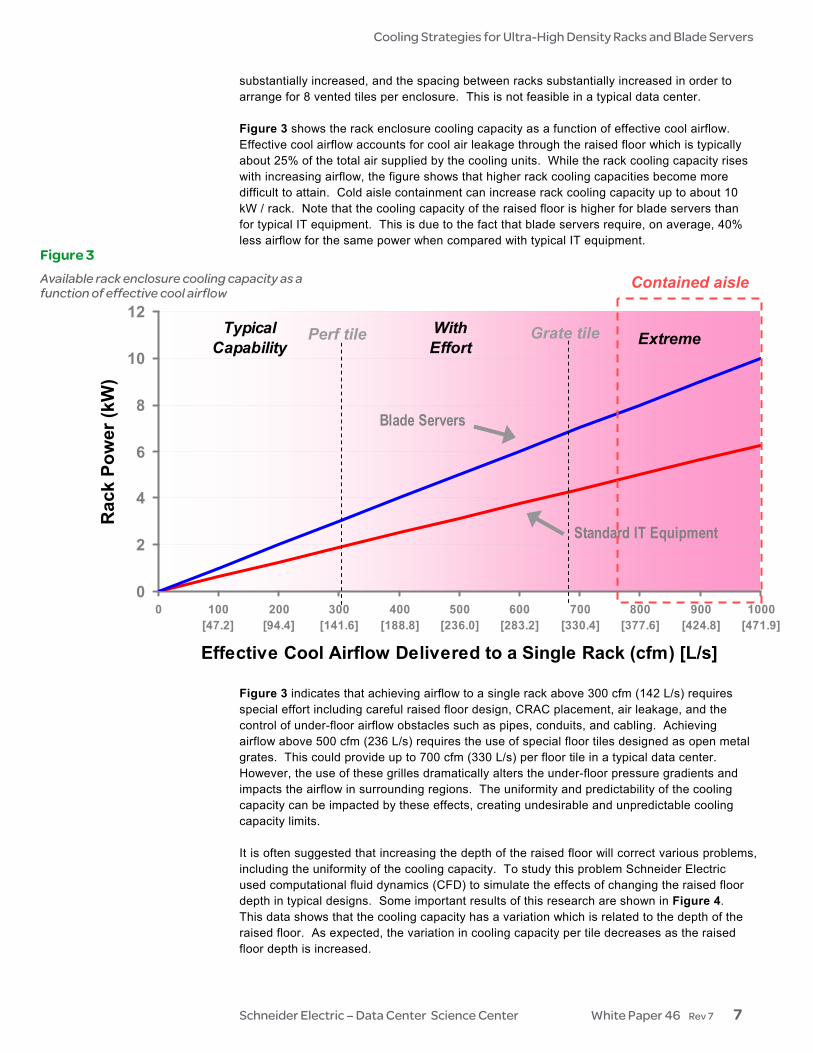
substantially increased, and the spacing between racks substantially increased in order to arrange for 8 vented tiles per enclosure. This is not feasible in a typical data center. Figure 3 shows the rack enclosure cooling capacity as a function of effective cool airflow. Effective cool airflow accounts for cool air leakage through the raised floor which is typically about 25% of the total air supplied by the cooling units. While the rack cooling capacity rises with increasing airflow, the figure shows that higher rack cooling capacities become more difficult to attain. Cold aisle containment can increase rack cooling capacity up to about 10 kW / rack. Note that the cooling capacity of the raised floor is higher for blade servers than for typical IT equipment. This is due to the fact that blade servers require, on average, 40% less airflow for the same power when compared with typical IT equipment.
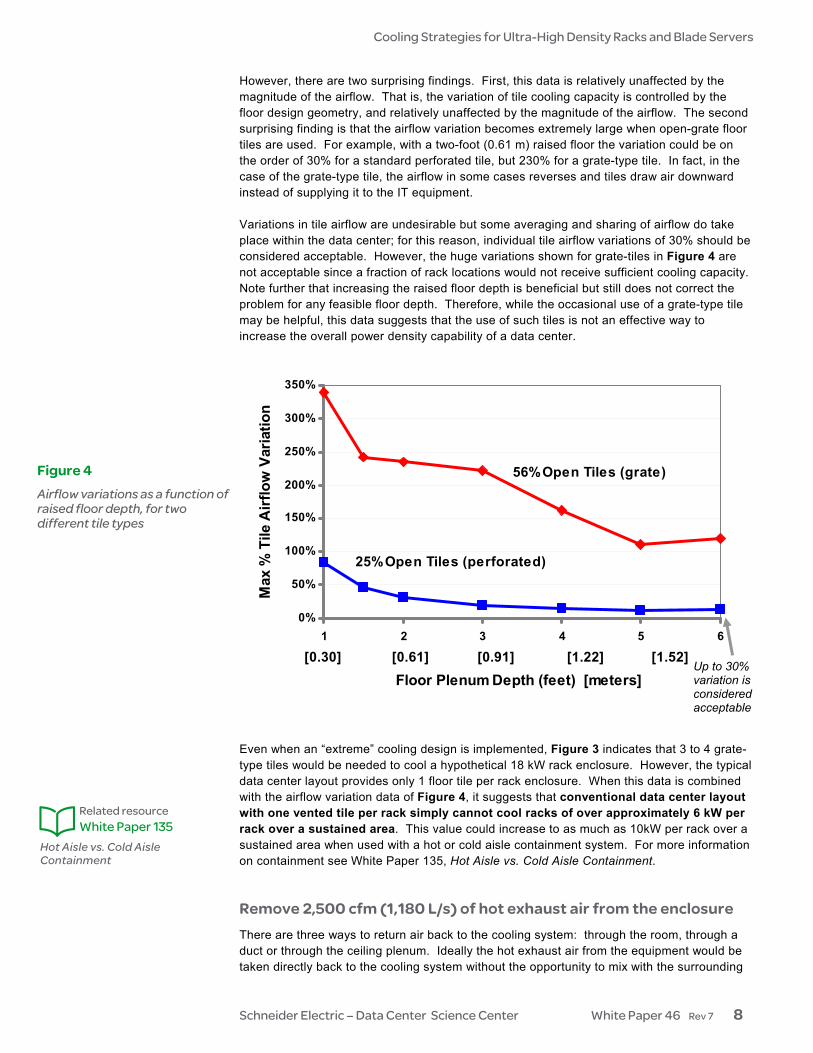
Figure 3 indicates that achieving airflow to a single rack above 300 cfm (142 L/s) requires special effort including careful raised floor design, CRAC placement, air leakage, and the control of under-floor airflow obstacles such as pipes, conduits, and cabling. Achieving airflow above 500 cfm (236 L/s) requires the use of special floor tiles designed as open metal grates. This could provide up to 700 cfm (330 L/s) per floor tile in a typical data center. However, the use of these grilles dramatically alters the under-floor pressure gradients and impacts the airflow in surrounding regions. The uniformity and predictability of the cooling capacity can be impacted by these effects, creating undesirable and unpredictable cooling capacity limits. It is often suggested that increasing the depth of the raised floor will correct various problems, including the uniformity of the cooling capacity. To study this problem Schneider Electric used computational fluid dynamics (CFD) to simulate the effects of changing the raised floor depth in typical designs. Some important results of this research are shown in Figure 4. This data shows that the cooling capacity has a variation which is related to the depth of the raised floor. As expected, the variation in cooling capacity per tile decreases as the raised floor depth is increased.
0
2
4
6
8
10
12
0 100[47.2]
200[94.4]
300[141.6]
400[188.8]
500[236.0]
600[283.2]
700[330.4]
800[377.6]
900[424.8]
1000[471.9]
Effective Cool Airflow Delivered to a Single Rack (cfm) [L/s]
Rac
k Po
wer
(kW
)
TypicalCapability
WithEffort Extreme
Standard IT Equipment
Blade Servers
Figure 3 Available rack enclosure cooling capacity as a function of effective cool airflow
Perf tile Grate tile
Contained aisle
Cooling Strategies for Ultra-High Density Racks and Blade Servers
Schneider Electric – Data Center Science Center White Paper 46 Rev 7 8
However, there are two surprising findings. First, this data is relatively unaffected by the magnitude of the airflow. That is, the variation of tile cooling capacity is controlled by the floor design geometry, and relatively unaffected by the magnitude of the airflow. The second surprising finding is that the airflow variation becomes extremely large when open-grate floor tiles are used. For example, with a two-foot (0.61 m) raised floor the variation could be on the order of 30% for a standard perforated tile, but 230% for a grate-type tile. In fact, in the case of the grate-type tile, the airflow in some cases reverses and tiles draw air downward instead of supplying it to the IT equipment. Variations in tile airflow are undesirable but some averaging and sharing of airflow do take place within the data center; for this reason, individual tile airflow variations of 30% should be considered acceptable. However, the huge variations shown for grate-tiles in Figure 4 are not acceptable since a fraction of rack locations would not receive sufficient cooling capacity. Note further that increasing the raised floor depth is beneficial but still does not correct the problem for any feasible floor depth. Therefore, while the occasional use of a grate-type tile may be helpful, this data suggests that the use of such tiles is not an effective way to increase the overall power density capability of a data center.
0%
50%
100%
150%
200%
250%
300%
350%
1 2 3 4 5 6
Floor Plenum Depth (feet) [meters]
Max
% T
ile A
irflo
w V
aria
tion
56% Open Tiles (grate)
25% Open Tiles (perforated)
[0.30] [0.61] [0.91] [1.22] [1.52]
Even when an “extreme” cooling design is implemented, Figure 3 indicates that 3 to 4 grate-type tiles would be needed to cool a hypothetical 18 kW rack enclosure. However, the typical data center layout provides only 1 floor tile per rack enclosure. When this data is combined with the airflow variation data of Figure 4, it suggests that conventional data center layout with one vented tile per rack simply cannot cool racks of over approximately 6 kW per rack over a sustained area. This value could increase to as much as 10kW per rack over a sustained area when used with a hot or cold aisle containment system. For more information on containment see White Paper 135, Hot Aisle vs. Cold Aisle Containment. Remove 2,500 cfm (1,180 L/s) of hot exhaust air from the enclosure There are three ways to return air back to the cooling system: through the room, through a duct or through the ceiling plenum. Ideally the hot exhaust air from the equipment would be taken directly back to the cooling system without the opportunity to mix with the surrounding
Up to 30% variation is considered acceptable
Figure 4 Airflow variations as a function of raised floor depth, for two different tile types
Hot Aisle vs. Cold Aisle Containment
Related resource White Paper 135

Cooling Strategies for Ultra-High Density Racks and Blade Servers
Schneider Electric – Data Center Science Center White Paper 46 Rev 7 9
air or be drawn into the intakes of equipment. This requires an unobstructed and direct return path. For reference, carrying 2,500 cfm (1,180 L/s) in a 12” (30 cm) round duct requires an air velocity of 35 miles per hour (56 km/hr). A high open ceiling with a bulk air return centrally located at a high point is one means of providing this function. However, many data centers depend on having the return air carried by return ductwork or a suspended ceiling plenum, and many rely on bulk air return across the room underneath a ceiling which is only a few feet higher than the enclosures. These cases represent technical challenges to the design. The availability of return air capability at a specific rack enclosure is limited just as the supply is limited. Like the supply side, attempts to provide more than about 400 cfm (189 L/s) return air capability per rack over a sustained area requires specialized engineering to assure that the system has the required performance and redundancy. Keep the hot exhaust air away from the equipment air intake The shortest supply path for air to reach the IT equipment air intake is the recirculation path from the equipment’s own exhaust. An essential part of data center design is that the cool air supply and hot exhaust return paths dominate this undesired recirculation path. This becomes particularly challenging for high density environments, as the high airflow velocities must overcome the resistances of the air distribution and return systems. Blanking panels, described later in this paper, are an effective solution for recirculation within the rack. This and other types of recirculation are covered in more detail in White Paper 49, Avoidable Mistakes that Compromise Cooling Performance in Data Centers and Network Rooms. Provide all of these functions in a redundant and uninterrupted manner In a high availability data center the loads must continue to operate during scheduled or unscheduled downtime of CRAC units. This means that cooling must be redundant – available when any individual CRAC unit is off. In conventional data center design, multiple CRAC units feed a shared raised floor or overhead plenum which is assumed to sum the outputs of all CRAC units and provide even pressure throughout the air distribution plenum. The system is designed to meet the airflow and cooling requirements when any one CRAC unit is off. When the operating power density of conventional data centers is increased, the flow of air in the plenum areas increases and the fundamental assumptions about the operation of the shared-plenum system begin to break down. Turning off an individual CRAC unit can radically alter the local airflow velocities within the plenum. The airflow at an individual floor tile may even reverse, drawing air down into the floor as a result of the Venturi effect. The operation of the cooling system under fault conditions becomes less predictable as power density increases. For this reason high density installations are frequently simulated using numerical simulation methods (computational fluid dynamics – CFD) to establish the pres-ence of redundancy. The concept of uninterruptible cooling is also challenged in a high density environment. A conventional data center cooling system receives backup power from a standby generator and not the uninterruptible power system (UPS). The generator startup delay is acceptable in the average data center because the loss of cooling and air supply for the 5-20 seconds needed to assure generator startup causes a temperature rise of only about 1°C (1.8°F). However, in a case where high density loads on the order of 18 kW per rack are installed, the air temperature rise during generator startup delay would be an unacceptable 8-30°C (14-54°F). Therefore in a high density installation it becomes necessary to continually operate the CRAC fans and pumps – in some cases even the CRAC units themselves – in order to
Avoidable Mistakes that Compromise Cooling Performance in Data Centers and Network Rooms
Related resource White Paper 49

Cooling Strategies for Ultra-High Density Racks and Blade Servers
Schneider Electric – Data Center Science Center White Paper 46 Rev 7 10
assure uninterrupted cooling. This necessity of having the cooling system on the UPS is a major cost driver and a major barrier to deployment of high density computing. There are five basic ways to deploy high density enclosures and blade servers:
1. Load spreading. Provide the room with the capability to power and cool to an average value below the peak enclosure value, and spread out the load of any proposed enclo-sures whose load exceeds the design average value by splitting the equipment among multiple rack enclosures.
2. Rules-based borrowed cooling. Provide the room with the capability to power and cool to an average value below the peak enclosure value, and use rules to allow high den-sity racks to borrow adjacent underutilized cooling capacity.
3. Supplemental cooling. Provide the room with the capability to power and cool to an average value below the peak enclosure value, and use supplemental cooling equip-ment as needed to cool racks with a density greater than the design average value
4. Dedicated high-density areas. Provide the room with the capability to power and cool to an average value below the peak enclosure value, provide a special limited area within the room that has high cooling capacity, and limit the location of high density enclosures to that area.
5. Whole-room cooling. Provide the room with the capability to power and cool any and every rack to the peak expected enclosure density
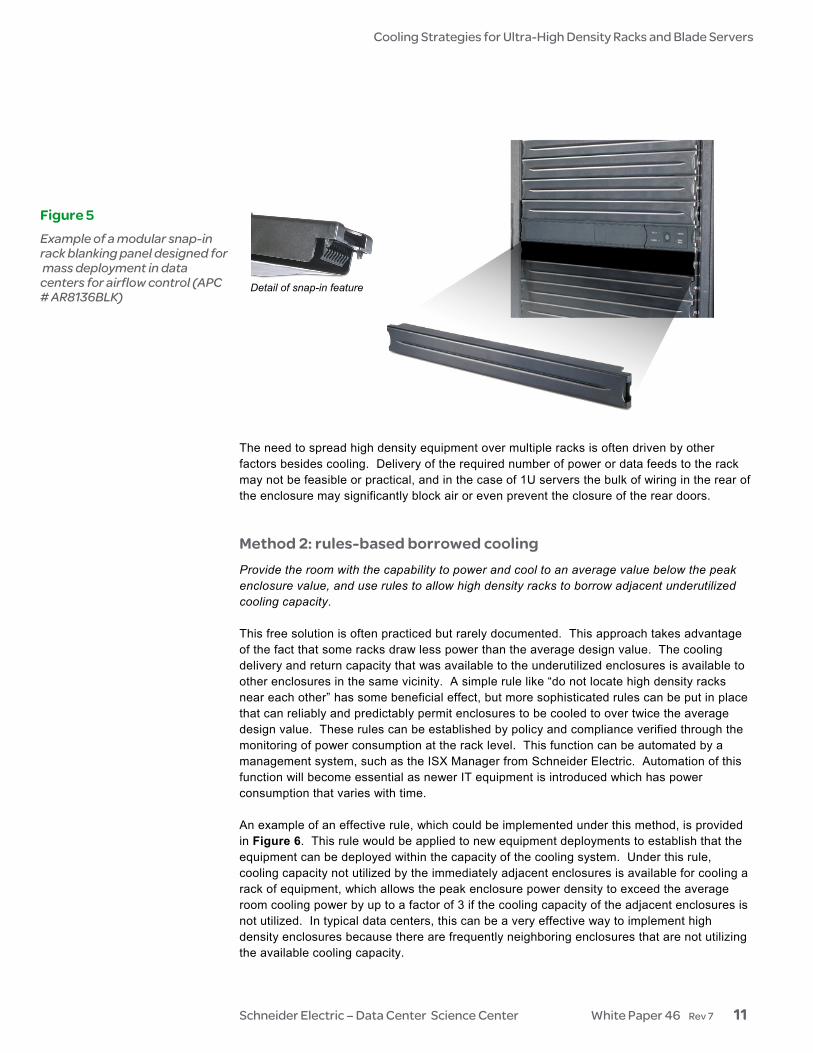
Each of these approaches is discussed in turn along with its advantages and disadvantages. Method 1: load spreading Provide the room with the capability to power and cool to an average value below the peak potential enclosure value, and spread out the load of any proposed enclosures whose load exceeds the design average value by splitting the equipment among multiple rack enclosures. This is the most popular solution for incorporating high-density equipment into today’s data centers. Fortunately, 1U servers and blade servers do not need to be installed closely spaced in the same enclosure, and can be spread out across multiple racks. By splitting equipment among racks no rack need ever exceed the design power density and conse-quently cooling performance is predictable. Note that spreading out equipment among multiple racks leaves a sizable amount of unused vertical space within the racks. This space must be filled with blanking panels to prevent degradation of cooling performance as described in White Paper 44, Improving Rack Cooling Performance Using Blanking Panels. An example of a modular snap-in blanking panel designed to seal racks is shown in Figure 5.
Five strategies for deployment of high-density enclosures and blade servers
Improving Rack Cooling Performance Using Blanking Panels
Related resource White Paper 44
Cooling Strategies for Ultra-High Density Racks and Blade Servers
Schneider Electric – Data Center Science Center White Paper 46 Rev 7 11
The need to spread high density equipment over multiple racks is often driven by other factors besides cooling. Delivery of the required number of power or data feeds to the rack may not be feasible or practical, and in the case of 1U servers the bulk of wiring in the rear of the enclosure may significantly block air or even prevent the closure of the rear doors. Method 2: rules-based borrowed cooling Provide the room with the capability to power and cool to an average value below the peak enclosure value, and use rules to allow high density racks to borrow adjacent underutilized cooling capacity. This free solution is often practiced but rarely documented. This approach takes advantage of the fact that some racks draw less power than the average design value. The cooling delivery and return capacity that was available to the underutilized enclosures is available to other enclosures in the same vicinity. A simple rule like “do not locate high density racks near each other” has some beneficial effect, but more sophisticated rules can be put in place that can reliably and predictably permit enclosures to be cooled to over twice the average design value. These rules can be established by policy and compliance verified through the monitoring of power consumption at the rack level. This function can be automated by a management system, such as the ISX Manager from Schneider Electric. Automation of this function will become essential as newer IT equipment is introduced which has power consumption that varies with time. An example of an effective rule, which could be implemented under this method, is provided in Figure 6. This rule would be applied to new equipment deployments to establish that the equipment can be deployed within the capacity of the cooling system. Under this rule, cooling capacity not utilized by the immediately adjacent enclosures is available for cooling a rack of equipment, which allows the peak enclosure power density to exceed the average room cooling power by up to a factor of 3 if the cooling capacity of the adjacent enclosures is not utilized. In typical data centers, this can be a very effective way to implement high density enclosures because there are frequently neighboring enclosures that are not utilizing the available cooling capacity.
Figure 5 Example of a modular snap-in rack blanking panel designed for mass deployment in data centers for airflow control (APC # AR8136BLK)
Detail of snap-in feature

Cooling Strategies for Ultra-High Density Racks and Blade Servers
Schneider Electric – Data Center Science Center White Paper 46 Rev 7 12
Method 3: supplemental cooling Provide the room with the capability to power and cool to an average value below the peak enclosure value, and use supplemental cooling equipment to cool racks with a density greater than the design average value. This solution normally requires that the installation be planned in advance to be able to utilize supplemental cooling equipment when and where needed. When a room has been planned in this way, a variety of techniques can be used to supplement rack cooling. These include: • Installation of specialty (grate-type) floor tiles or fans to boost the cool air supply from
the CRAC to an enclosure
• Installation of specialty return ducts or fans to scavenge the hot exhaust air from an enclosure for return to the CRAC
• Installation of special racks or rack mounted cooling devices with the capability to pro-vide the required cooling directly at the rack
These methods are the subject of discussion in White Paper 55, Rack Air Distribution Architecture for Mission Critical Facilities. These methods are only recently becoming available and are not deployed in significant numbers of data centers today. However, they offer significant flexibility and with proper planning do not need to be purchased and installed until needed.
START: New proposed load
Add up rack’s existing power plus new load
Does new rack power exceed avg.
cooling power?
Does either adjacent rack exceed
avg. cooling power?
Is rack at the end of a row?
Does avg. of new and adjacent rack
exceed avg. cooling power?
Does avg. of new and 2 adjacent racks
exceed avg. cooling power?
NO YES
YES YES NO NO
Split up load or try different location
NO YES
NO YES
New load may be deployed
New load may not be deployed
Rack Air Distribution Architecture for Mission Critical Facilities
Related resource White Paper 55
Figure 6 Example of “borrowed cooling” rules for the use of underutilized cooling capacity by adjacent high density enclosures

Cooling Strategies for Ultra-High Density Racks and Blade Servers
Schneider Electric – Data Center Science Center White Paper 46 Rev 7 13
Method 4: dedicated high-density area Provide the room with the capability to power and cool to an average value below the peak enclosure value, provide a special limited area within the room that has high cooling capacity, and limit the location of high density enclosures to that area. This approach requires prior knowledge of the fraction of high density enclosures, and the ability to segregate those enclosures into a special area, and under these constraints can achieve optimal space utilization. Unfortunately, prior knowledge of the fraction of high density enclosures is not typically available. Therefore, this option is not available to many users. When a special area for high density can be identified, special high density technologies can be installed to deliver predictable power and cooling density to that area. When the power density exceeds 10 kW per rack, the unpredictability of airflow becomes the dominant problem. The technologies that solve this problem are based on the principle of shortening the airflow path between the cooling system and the rack. An example of a modular high density power and cooling system for a cluster of high density racks is the InfraStruXure HD shown in Figure 7. This system integrates a cluster of IT racks with a high density air conditioning system and high density power distribution system in a pre-manufactured, pre tested unit. The system shown in Figure 7 consists of a hot-aisle / cold aisle layout of IT racks. The key operating principle of this system is the capture of all of the hot IT equipment exhaust air by enclosing the hot aisle, and then immediately cooling this air using a rack-based air condi-tioner. The capture of the hot air combined with the short air path allow very high density cooling and also cause the system to exhibit high efficiency. The performance of this system is completely independent of the site (even in locations where only comfort air is available) and can be installed without a raised floor.
Integral rack air conditioner
Neutralized ambient- temperature air returns
to room
Integral rack power distribution system
(Optional UPS)
Door access to hot aisle
and rear of IT equipment
All hot exhaust air is captured within chamber and neutralized
Can operate on hard floor or raised floor
Equipment racks take in ambient air from front
Figure 7 Example of a modular power and cooling system for a dedicated high density area within a data center. Modules of 2-12 IT racks, rated at 20 kW per rack.

Cooling Strategies for Ultra-High Density Racks and Blade Servers
Schneider Electric – Data Center Science Center White Paper 46 Rev 7 14
Solutions based on co-locating high density racks and using special high density technology are preferred when there is a requirement to keep the high density racks together. All other feasible solutions require some degree of spreading out of the high density equipment. Method 5: whole-room cooling Provide the room with the capability to power and cool any and every rack to the peak expected enclosure density. This is conceptually the simplest solution but is never implemented because data centers always have substantial variation in per-rack power and designing for the worst case is consequently wasteful and cost prohibitive. Furthermore, to design for an overall rack power density of over 6 kW per rack requires extremely complex engineering and analysis. This approach would only be logical in an extreme situation. Summary The advantages and disadvantages of the five approaches to providing cooling to high density enclosures are summarized in Table 2.
Approach Advantages Disadvantages Application
1 Spread the load Split equipment among enclosures to keep peak load down
Works anywhere, no planning needed Essentially free in many cases
High density equipment must be spread out even more than approach 2 Uses more floor space Can cause data cabling issues
Existing data centers, when high density equipment is a small fraction of the total load
2 Borrowed cooling Provide average cooling capability with rules to allow borrowing of underutilized capacity
No new equipment needed Essentially free in many cases
Limited to about 2X the design power density Uses more floor space Requires enforcement of complex rules
Existing data centers, when high density equipment is a small fraction of the total load
3 Supplemental cooling Provide average cooling capability with provision for supplemental cooling equipment
High density where needed and when needed Deferred capital costs High efficiency Good floor space utilization
Limited to about 10 kW per enclosure Racks and room must be designed in advance to support this approach
New construction or renovations Mixed environment Location of high density equipment is not known in advance
4 High density area Create a special high density row or zone within the data center
Maximum density Optimal floor space utilization High density equipment does not need to be spread out High efficiency
Need to plan a high density area in advance, or reserve space for it Must segregate high density equipment
Density 10-25 kW per rack When there is a requirement to co-locate high density devices New construction or renovations
5 Whole Room Provide high density cooling capability to every rack
Handles all future scenarios Extreme capital and operating costs of up to 4X alternative methods May result in extreme underutilization of expensive infrastructure
Rare and extreme cases of large farms of high density equipment with very limited physical space
Table 2 Application of the five approaches to cooling high density enclosures

Cooling Strategies for Ultra-High Density Racks and Blade Servers
Schneider Electric – Data Center Science Center White Paper 46 Rev 7 15
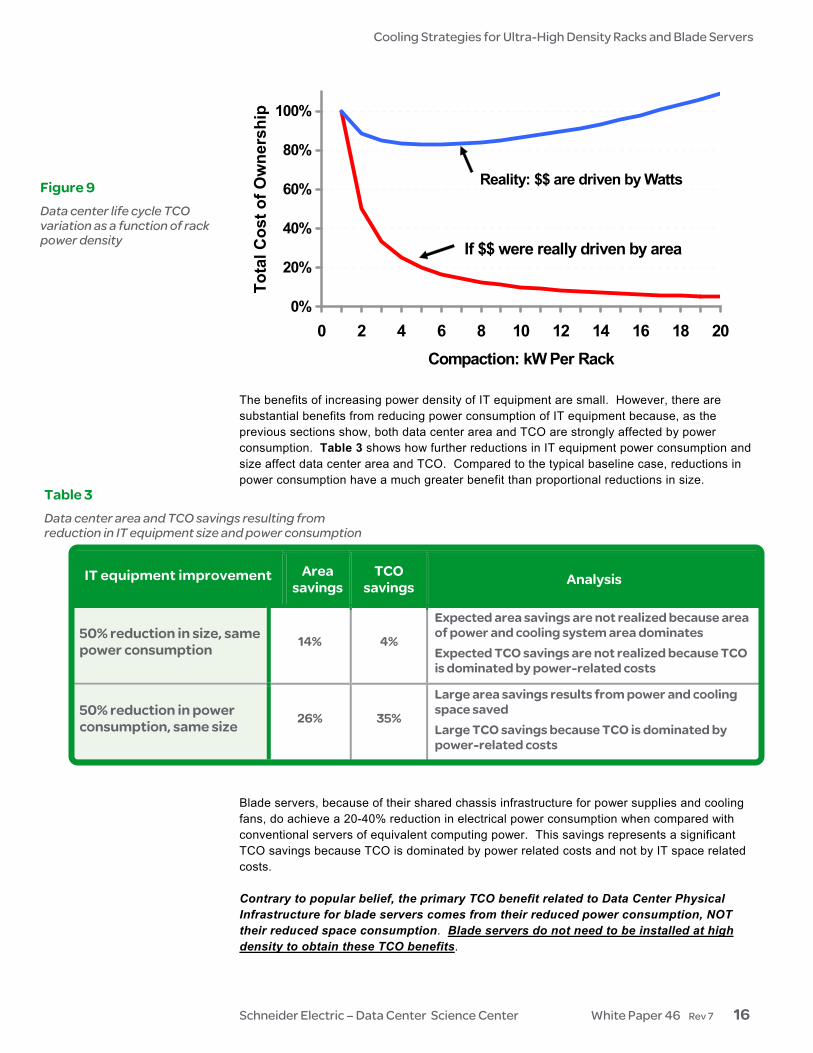
The previous sections identify a number of difficult cost, complexity, and reliability barriers associated with high power density installations. These problems must be overcome to deploy high density in the data center. Yet the prevailing predictions in industry trade publications are that compaction of data centers is inevitable and in process of occurring, due to the associated cost and space saving benefits associated with compaction. However, the data does not support these beliefs, and instead suggest that increasing compaction through increasing density without a fundamental reduction in power consumption is not cost effec-tive. Figure 8 shows the data center area per kW as a function of the power density of IT equip-ment. When the density of IT equipment is increased, the building area devoted to this equipment falls as shown in the lower curve. However, there is no corresponding decrease in the building area devoted to power and cooling infrastructure. After the power density passes approximately 2.5 kW per rack the area consumed by the power and cooling equipment actually exceeds the area of the IT equipment. The result is that compaction beyond approximately 4-5 kW per rack does not actually result in any further reduction of the total area. An unstated and widely held belief that is a fundamental premise of compaction is that data center costs are driven by area, so reducing area through compaction will reduce cost. Figure 9 shows the lifetime total cost of ownership (TCO) of the data center as a function of the power density of IT equipment. When the density of the IT equipment is increased, a commonly expected result is that the TCO will decrease proportionally as show in the lower curve in the figure. However, the reality is that 75% of data center TCO costs are driven by power and only 25% of costs are driven by area. Furthermore, per-Watt costs increase with increasing power density due to factors previously described. The consequence is that the TCO costs do not decline significantly with increasing power density, but actually increase after an optimum power density, which is on the order of 6 kW per enclosure.
Value of compaction
0
5
10
15
20
25
30
35
40
45
50
1 2 3 4 5 6 7 8 9 10 11 12 13 14 15 16 17 18 19 20
Compaction density: kW Per Rack
Are
a in
ft2 /
kW [
m2 /
kW]
Area of IT equipment
Area of power and cooling infrastructure
Total area of IT equipment + infrastructure
[4.65]
[4.18]
[3.72]
[3.25]
[2.79]
[2.32]
[1.86]
[1.39]
[0.93]
[0.46]
Figure 8 Data center area per kW of capacity as a function of rack power density
Cooling Strategies for Ultra-High Density Racks and Blade Servers
Schneider Electric – Data Center Science Center White Paper 46 Rev 7 16
The benefits of increasing power density of IT equipment are small. However, there are substantial benefits from reducing power consumption of IT equipment because, as the previous sections show, both data center area and TCO are strongly affected by power consumption. Table 3 shows how further reductions in IT equipment power consumption and size affect data center area and TCO. Compared to the typical baseline case, reductions in power consumption have a much greater benefit than proportional reductions in size.
IT equipment improvement Area savings
TCO savings Analysis
50% reduction in size, same power consumption 14% 4%
Expected area savings are not realized because area of power and cooling system area dominates Expected TCO savings are not realized because TCO is dominated by power-related costs
50% reduction in power consumption, same size 26% 35%
Large area savings results from power and cooling space saved Large TCO savings because TCO is dominated by power-related costs
Blade servers, because of their shared chassis infrastructure for power supplies and cooling fans, do achieve a 20-40% reduction in electrical power consumption when compared with conventional servers of equivalent computing power. This savings represents a significant TCO savings because TCO is dominated by power related costs and not by IT space related costs. Contrary to popular belief, the primary TCO benefit related to Data Center Physical Infrastructure for blade servers comes from their reduced power consumption, NOT their reduced space consumption. Blade servers do not need to be installed at high density to obtain these TCO benefits.
0%
20%
40%
60%
80%
100%
0 2 4 6 8 10 12 14 16 18 20Compaction: kW Per Rack
Tota
l Cos
t of O
wne
rshi
pIf $$ were really driven by area
Reality: $$ are driven by WattsFigure 9 Data center life cycle TCO variation as a function of rack power density
Table 3 Data center area and TCO savings resulting from reduction in IT equipment size and power consumption

Cooling Strategies for Ultra-High Density Racks and Blade Servers
Schneider Electric – Data Center Science Center White Paper 46 Rev 7 17
Optimal Cooling Strategy From the information presented in this paper it is possible to identify a coherent strategy which is optimal for most installations. This strategy uses a combination of the approaches previously described in this paper and is summarized in Table 4.
IT equipment improvement Analysis
1) Ignore physical size of IT equipment and focus on functionality per Watt consumed This is an effective way to minimize area and TCO.
2) Design the system to permit later installation of supplemental cooling devices
This allows supplemental cooling equipment to be installed later where and when needed on a live data center, in the face of uncertain future requirements.
3) Choose a baseline power density for new designs between 40 and 100 W / ft2 [0.4 – 1.1 kW / m2], with 80 W / ft2 [0.9 kW / m2] (2800 W / enclo-sure average) being a practical value for most new designs
The baseline power density should be selected to avoid significant waste due to oversizing, and by keeping it below 100 W / ft2 (1.1 kW / m2) the performance and redundancy capability becomes predictable.
4) When the fraction of high density loads is high and predictable, establish and equip special high density areas of 100-400 W / ft2 [1.1-4.3 kW / m2] (3-12 kW per enclosure) within the data center
When it is known in advance that an area of high density is needed, and spreading the load out is not feasible. This can add significant cost, time, and complexity to the data center design. These areas will use specialized cooling equipment and not the typical raised floor design.
5) Establish policies and rules, which determine the allowable power for any enclosure based on its location and the adjacent loads
When understanding of the design capabilities is combined with power monitoring, the implementation of rules for new equipment installs can reduce hotspots, help ensure cooling redundancy, increase the system cooling efficiency and reduce electrical consumption. More sophisticated rules and monitoring can enable higher power density.
6) Use supplemental cooling devices when indi-cated
Installing supplemental cooling devices where needed and when needed can boost the cooling capacity of a region of a data center by up to 3X the design value to accommodate high density equipment.
7) Split equipment up that cannot be installed to meet the rules
The lowest cost and lowest risk option, but can consume considerable space when there are more than a small fraction of high density loads. Many users who do not have significant area constraints choose this as their primary strategy.
The maximum rack power density exhibited by the latest generation of high density IT equipment is approximately 10 times the average rack power density in existing data centers. There are an insignificant number of rack enclosures operating in actual data centers operating at even half of this maximum power density. The current methods and layouts for data centers cannot practically provide the cooling required by this high density equipment because of limitations of the air delivery and return systems, and the difficulty of providing redundancy and uninterrupted cooling during genera-tor switchover.
Table 4 Practical strategy to optimize cooling when deploying high density computing equipment
Conclusion

Cooling Strategies for Ultra-High Density Racks and Blade Servers
Schneider Electric – Data Center Science Center White Paper 46 Rev 7 18
When the objective is to reduce data center area and reduce Total Cost of Ownership, customers should focus on the purchase of IT equipment based on functionality provided per Watt and ignore the physical size of the IT equipment. This unexpected conclusion results because above 60 W / ft2 (0.6 kW / m2), power has a larger affect than does IT equipment size on both TCO and area. There are a variety of solutions that allow high density computing equipment to be effectively deployed in conventional environments. While designing entire data centers for high density remains impractical, data centers can support the limited installation of high density equip-ment by using supplemental cooling systems, using rules to allow the borrowing of neighbor-ing underutilized capacity, and finally by spreading the load among multiple enclosures. When an installation is planned with a high percentage of high density enclosures, and it is not feasible to spread out the equipment, the only alternative is to design to provide this capability for all enclosures. Conventional raised floor designs will not provide sufficient capacity or predictable performance for such systems and specialized rack / row / cluster level cooling systems are needed. Despite the discussions in the trade journals of data center design densities of 300-600 Watts per square foot (3.2-6.5 kW / m2), achieving such densities remains impractical due to large cost penalties and the difficulties in achieving high availability at these densities. Current high availability, high performance data center designs are predictable and practical in the range of 40 to 100 W / ft2 [0.4-1.1 kW / m2] (1.2 kW to 3 kW per rack average), with the ability to accommodate occasional loads of up to 3X the design value by taking advantage of load diversity and through the use of supplemental cooling devices.
Neil Rasmussen is a Senior VP of Innovation for Schneider Electric. He establishes the technology direction for the world’s largest R&D budget devoted to power, cooling, and rack infrastructure for critical networks. Neil holds 19 patents related to high-efficiency and high-density data center power and cooling infrastructure, and has published over 50 white papers related to power and cooling systems, many published in more than 10 languages, most recently with a focus on the improvement of energy efficiency. He is an internationally recognized keynote speaker on the subject of high-efficiency data centers. Neil is currently working to advance the science of high-efficiency, high-density, scalable data center infrastructure solutions and is a principal architect of the APC InfraStruXure system. Prior to founding APC in 1981, Neil received his bachelors and masters degrees from MIT in electrical engineering, where he did his thesis on the analysis of a 200MW power supply for a tokamak fusion reactor. From 1979 to 1981 he worked at MIT Lincoln Laboratories on flywheel energy storage systems and solar electric power systems.
About the author
Cooling Strategies for Ultra-High Density Racks and Blade Servers
Schneider Electric – Data Center Science Center White Paper 46 Rev 7 19
Hot Aisle vs. Cold Aisle Containment White Paper 135
Avoidable Mistakes that Compromise Cooling Performance in Data Centers and Network Rooms White Paper 49
Improving Rack Cooling Performance Using Blanking Panels White Paper 44
Rack Air Distribution Architecture for Mission Critical Facilities White Paper 55
Resources Click on icon to link to resource
Browse all white papers
tools.apc.com
Browse all TradeOff Tools™
whitepapers.apc.com
For feedback and comments about the content of this white paper: Data Center Science Center [email protected] If you are a customer and have questions specific to your data center project: Contact your Schneider Electric representative
Contact us