cooling in the uk
TRANSCRIPT

August 2021
Cooling in the UK BEIS – Department for Business Energy and Industrial Strategy
Prepared by AECOM, Delta-EE & University of Exeter BEIS Research Paper 2021/050

© Crown copyright 2021
This publication is licensed under the terms of the Open Government Licence v3.0 except where otherwise stated. To view this licence, visit nationalarchives.gov.uk/doc/open-government-licence/version/3 or write to the Information Policy Team, The National Archives, Kew, London TW9 4DU, or email: [email protected].
Where we have identified any third-party copyright information you will need to obtain permission from the copyright holders concerned.
Any enquiries regarding this publication should be sent to us at: [email protected]

3
Contents Executive Summary _________________________________________________________ 6
1. Introduction ____________________________________________________________ 8
2. Current Cooling of UK Buildings ___________________________________________ 10
2.1 Current Cooling Demand in Buildings __________________________________ 10
2.1.1 Non-domestic Buildings ____________________________________________ 11
2.1.2 Domestic Buildings _______________________________________________ 14
2.2 Conventional Cooling Methods & Technologies __________________________ 14
2.3 Current Growth in Demand for Active Cooling ___________________________ 16
2.3.1 Current Trends in Domestic Buildings _________________________________ 20
2.3.2 Current Trends in Non-Domestic Buildings _____________________________ 23
2.4 Current Penetration of Cooling Technologies in New Buildings ______________ 26
2.4.1 High Level Comparison of Technologies _______________________________ 27
2.5 Barriers & Opportunities for Adoption of Different Cooling Measures __________ 35
2.5.1 Physical, Financial/Economic, Social & Behavioural Factors _______________ 36
3. Innovative Solutions Currently in Development ________________________________ 42
3.1 Sources of Information and Previous Research __________________________ 44
3.1.1 Research Commissioned by BEIS ___________________________________ 44
3.1.2 Research Commissioned by the US Department of Energy (DoE) ___________ 44
3.1.3 International Energy Agency (IEA) ___________________________________ 45
3.2 Innovative Cooling Technologies ______________________________________ 47
3.2.1 Context: Alternatives to Vapour Compression Systems ___________________ 47
3.2.2 Solid-State Cooling _______________________________________________ 50
3.2.3 Evaporative Cooling ______________________________________________ 54
3.2.4 Absorption Cooling _______________________________________________ 58
3.2.5 Other Examples __________________________________________________ 59
3.3 Key Summary Points _______________________________________________ 61
4. Defining Alternative Policy Scenarios _______________________________________ 62
4.1 Packages A & B for Each Archetype ___________________________________ 64
4.1.1 Shortlisting Cooling Measures _______________________________________ 64
4.1.2 Modelling the Short-Listed Cooling Measures ___________________________ 64

4
4.1.3 Evaluating the Cost-Effectiveness of Cooling Measures ___________________ 68
4.1.4 Deriving the Non-Domestic Packages A & B ____________________________ 70
4.1.5 Deriving the Domestic Packages A & B________________________________ 75
4.1.6 Summary of Packages ____________________________________________ 79
4.2 Costs of Packages ________________________________________________ 80
4.3 Barriers to Deployment of Measures ___________________________________ 84
4.3.1 Domestic Package A ______________________________________________ 84
4.3.2 Domestic Package B ______________________________________________ 85
4.3.3 Non-Domestic Package A __________________________________________ 86
4.3.4 Non-Domestic Package B __________________________________________ 86
5. Impacts of Alternative Policy Scenarios _____________________________________ 87
5.1 Overview of Modelling ______________________________________________ 87
5.1.1 Future Weather Files ______________________________________________ 90
5.2 Modelling Cooling Uptake ___________________________________________ 91
5.2.1 Modelling Transitions Between Business-as-Usual and Packages A/B _______ 92
5.2.2 Transition from Portable to Fixed Cooling ______________________________ 95
5.3 Deployment ______________________________________________________ 97
5.4 Cooling Effectiveness of Technologies ________________________________ 100
5.4.1 Cooling Energy Demand __________________________________________ 100
5.4.2 Cooling Energy Consumption to Meet Demand ________________________ 103
5.4.3 Peak Cooling Power Demand ______________________________________ 106
5.4.4 National Cooling Energy Consumption Profiles _________________________ 108
5.5 Modelled Space Heating Demands ___________________________________ 116
5.5.1 Heating Energy Demand __________________________________________ 116
5.5.2 Peak Heating Power Demand ______________________________________ 119
5.6 Costs & Benefits _________________________________________________ 121
5.7 Synergies with Other Government Policies _____________________________ 122
5.7.1 Decarbonisation of Heat __________________________________________ 122
5.7.2 Building Fabric Enhancements _____________________________________ 124
5.7.3 Green & Blue Infrastructure ________________________________________ 125
5.7.4 Renewable Energy ______________________________________________ 125
6. Conclusions _________________________________________________________ 128
7. Appendix A: Long List of Cooling Measures _________________________________ 131

5
8. Appendix B: Description of Sample Buildings used to Derive Passive Packages _____ 142
8.1 Baseline Office Building ___________________________________________ 142
8.2 Baseline Dwelling ________________________________________________ 144
9. Appendix C: Description of Modelled Passive Measures _______________________ 147
10. Appendix D: Modelled Transitions ____________________________________ 156
11. Appendix E: Modelling Packages of Measures __________________________ 165
11.1 Geometry ______________________________________________________ 165
11.2 Building Fabric & Infiltration _________________________________________ 166
11.3 Heating & Cooling ________________________________________________ 167
11.4 Mechanical Ventilation ____________________________________________ 167
11.5 Natural Ventilation ________________________________________________ 167
11.6 Internal Gains ___________________________________________________ 168
12. Appendix F: Current Cooling Market Growth Research Findings ____________ 169
12.1 Domestic Sector _________________________________________________ 169
12.1.1 Strong growth in retrofit of domestic cooling is anticipated, due to rising temperatures and a move to home working _________________________________ 169
12.1.2 The retrofit market is likely to start with portable cooling units, which will subsequently be replaced by single split units _______________________________ 169
12.1.3 New build market will remain a key sector for new sales ________________ 170
12.2 Non-domestic Sector ______________________________________________ 170
12.2.1 Demand for cooling is anticipated to have limited growth ________________ 170
12.2.2 New build will continue to dominate non-domestic sales ________________ 170
12.2.3 Chillers are seen as a competing solution to cooling ___________________ 171
13. Appendix G: Overview of Barriers & Decision Making _____________________ 172
13.1 Specific factors identified during course of this research ___________________ 172
13.1.1 Air-to-air heat pumps (split units) __________________________________ 172
13.1.2 VRF cooling systems ___________________________________________ 173
13.1.3 Domestic supply chains _________________________________________ 174
13.1.4 Refrigerant related issues ________________________________________ 174
13.2 Route to Market Considerations _____________________________________ 175

Cooling in the UK
6
Executive Summary The purpose of this research is to help improve BEIS’s evidence base on future cooling demand across the UK building stock and the impact of alternative policy interventions. It provides long-term projections of cooling demand to 2100 under two climate emission scenarios (low and high) and investigates the impact of three policy scenarios, which lead to different choices of passive and active cooling measures, on energy consumption, peak electricity demand and capital cost. The analysis focusses on conventional cooling technologies (accompanied by a review of potential future innovations) and focuses on the increased cooling demand from buildings that currently do not have a cooling system installed. AECOM led this project and partnered with University of Exeter and Delta-EE.
Three policy scenarios have been investigated in this project:
• No Intervention: The market determines the uptake of different measures. Basic adaptive measures are deployed with no strategic foresight; a combination of portable cooling and cost-effective passive measures have been modelled. When these reach the limits of their effectiveness or are found to be otherwise unsuitable, a low efficiency fixed refrigeration cooling system replaces the portable cooling.
• Passive First: Government intervenes to prioritise passive cooling measures. Government promotes higher cost, higher disruption passive measures than the basic adaptive measures of the other two scenarios. The government also requires any subsequent use of active refrigeration cooling systems to be high efficiency.
• Efficient Technologies: Like the No Intervention scenario, the market determines the uptake of different measures. However, the key difference is where refrigeration cooling systems are adopted, the government requires these to be high efficiency.
The key findings are as follows:
• For No Intervention, annual cooling energy consumption will be around 6.3TWh and 12.0TWh for the high and low emissions scenarios respectively by 2100. These values can be significantly reduced through policy intervention. For the high emissions scenario, the Efficient Technologies and Passive First scenarios reduce cooling energy consumption by around 21% and 34% respectively.
• Nearly all (99%) of the modelled UK cooling energy consumption is concentrated in England. This is due to a combination of warmer climate and England being host to around 84% of the UK building stock.
• Although the current demand for cooling is dominated by non-domestic buildings, by the end of the century, it is estimated that the domestic stock will require 75% to 85% of the cooling energy consumption.
• The modelled national peak demand for cooling during a heat wave event can be approximately twice as high as that in an average summer week, and between 20 and 65 times the annual average consumption.

Cooling in the UK
7
• Non-domestic cooling demand tends to peak during early afternoon when ambient temperatures are highest. However, domestic cooling demand tends to peak in early evening when most residents return home and coincides with cooking, entertainment and increasingly EV charging. Smart grid management may help reduce the need for increased electrical infrastructure capacity to meet increased domestic cooling demand such as the use of vehicle-to-grid to allow vehicle batteries to support local grid demand.
• The total cumulative capital costs associated with both No Intervention or Efficient Technologies could be £60-70bn by 2050. This compares to a Passive First approach which is around £20-30bn. The costs need to be weighed against the benefits which comprise factors including the health and well-being of the building occupants and their economic productivity. Active cooling measures do provide greater levels of comfort compared to passive measures; this has a material value which may offset the cost of cooling plant to some extent.
• Potential synergies have been identified between the increase in cooling demand and heat decarbonisation. Air-to-air heat pumps provide low carbon heat and can provide cooling when operating in reverse. However, the use of such cooling in the shorter-term (i.e. before the electricity grid has fully decarbonised) could significantly increase carbon emissions and energy use, when no/less active cooling may have been used. Furthermore, air-to-air heat pumps do not offer any solution for water heating. In addition, 5th generation heat networks allow users to both import and export heat into the network. An increase in cooling demand may strengthen the business case for 5th generation networks as customers are able to export waste heat from cooling systems into the network and other users can then import this heat.
• Care is needed as improved fabric standards designed to reduce heating demands may also increase annual cooling demands but will tend to reduce peak cooling demands. As buildings need to be retrofitted to meet net zero, installing any cooling measures at the same time would reduce the combined costs as well as increasing the perceived benefits to building owners/tenants for such retrofit works.

Cooling in the UK
8
1. Introduction This is the final report to BEIS for the Cooling in the UK project. This research is to help improve BEIS’s evidence base on future cooling demand and the impact of alternative policy interventions. AECOM has led this project and partnered with University of Exeter and Delta-EE.
The Government has committed to reducing greenhouses emissions of the UK to net zero by 2050. A challenge is that the summer demand for cooling in buildings is expected to rise as a result of warming from climate change and the need to deliver an indoor environment that is healthy and provides a productive workplace. It is necessary to assess how to cost-effectively meet this increasing demand whilst achieving net zero including the optimum combination of passive and active cooling measures. It is important to consider the wider opportunities and implications as, for example, adopting reversible heat pumps for cooling could benefit greater penetration of low carbon space heating into the existing building stock.
This study provides long-term projections of cooling demand to 2100 under different climate scenarios, with the aim of aiding understanding what this means for national energy consumption and peak electricity demand. It also maps out the costs, barriers and benefits of conventional passive and active technologies applied to different policy scenarios and gains insight into innovative technologies. The research covers new and existing domestic and non-domestic buildings across the UK with a greater emphasis on analysing building typologies that are currently not installed with cooling systems. The study also aims to explore opportunities to benefit from synergies at the energy system level.
This report is structured as follows. The content reflects the research questions specified by BEIS.
• Section 2 presents the current cooling demand in the UK. It also reviews the conventional passive and active cooling measures, the market trends for their adoption and barriers to greater deployment.
• Section 3 comprises a review of future innovative cooling technologies and their potential to improve effectiveness and/or cost.
• Section 4 presents the first step in the core modelling work. It develops three alternative policy/deployment scenarios for subsequent evaluation in the next step. This include evaluating different passive and cooling technologies to select those that best align with the different deployment scenarios.
• Section 5 evaluates and compares the three alternative policy/deployment scenarios to mitigate for the increased cooling demand. Modelling was undertaken to quantify the energy demand for each scenario until 2100 for two climate scenarios. The impact on daily and annual cooling energy demand is presented for the UK, broken down by country and by sector. The costs of implementation for the different policy scenarios are

Cooling in the UK
9
also presented at a national level. Synergies with other energy uses and across sectors is commented upon to help align potential policy interventions.

Cooling in the UK
10
2. Current Cooling of UK Buildings This section examines current cooling of UK buildings. It provides useful context and information for subsequent sections of this report.
• Section 2.1 summarises current energy use associated with cooling in buildings.
• Section 2.2 outlines the range of conventional methods to cool buildings.
• Section 2.3 examines current sales and trends for active cooling measures in buildings.
• Section 2.4 examines the current market penetration of active and passive measures in building design
• Section 2.5 explores barriers to implementing different methods to cool buildings
To inform this research, Delta-EE conducted some market research interviews with a range of industry players (manufacturers, installers, and independent industry specialists) to supplement published literature.
2.1 Current Cooling Demand in Buildings
This sub-section summarises the information found through a literature review of published data for current cooling demand in buildings in the UK.
A number of technology types are referred to in this section as summarised in Table 1 below.
Table 1: Description of active cooling system types
Cooling technology
Description
Packaged AC systems
A group of technologies which provide self-contained AC solutions, and do not operate in combination with other building HVAC systems.
Packaged AC – Single Split
Single split systems comprise an external compressor unit (often wall mounted) and an internal distribution unit. Refrigerant is circulated between the two units, and a fan system passes air over the internal coil for distribution in the room. Units can operate in cooling or heating mode by reversing the cycle.
Packaged AC – Multi Split
Multi-split systems are similar to single split systems, but with multiple (up to around 10) indoor units fed from one external unit. These are suited to buildings where multiple rooms need cooling (or heating).
Packaged AC – Variable
VRF systems (also known as Variable Refrigerant Volume or VRV) distribute refrigerant from an external compressor unit to multiple indoor units similar to a multi-split. In addition, the flow rate (volume of refrigerant) distributed to each indoor unit can be controlled, and through

Cooling in the UK
11
Cooling technology
Description
Refrigerant Flow (VRF)
using a three-pipe system, different indoor units can operate in heating or cooling mode, allowing internal heat recovery. These systems are generally more efficient than a multi-split system.
Large packaged
These are single systems comprising evaporator, condenser, and compressor in a single unit to provide chilled air in an air distribution system. Generally used in non-domestic building applications. They can be externally mounted (often on roofs) or internally installed in a plant room.
Chillers Chillers are similar to a large packed system, but chill water for distribution in a building HVAC system (for example chilled beams). They are either air cooled (using fans) or water cooled (using cooling towers, and are generally mounted on the roof of non-domestic buildings.
Portable AC Self-contained portable units designed for temporary use. Warm air from the unit is expelled to the outside via a flexible hose (usually through a window). They are generally low cost, and available through the consumer retail market (e.g. DIY stores) and require no installation expertise.
2.1.1 Non-domestic Buildings
The literature review found that the most complete dataset available relating to cooling energy consumption in the non-domestic sector is available through the UK National Statistics Energy Consumption in the UK data1. Table U6 “Services (excl. agriculture); detailed consumption by sub-sector, end use and fuel 2019” details energy consumption by end use, including a section on energy consumption relating to cooling and humidification. Based on the October 2020 issue, the UK consumed approximately 532 ktoe (kilo tonnes oil equivalent) of energy for cooling and humidification in 2019; this equates to approximately 6,187GWh. The following table shows the breakdown by sector of the cooling and humidification energy consumption for 2019 from this dataset.
1 https://assets.publishing.service.gov.uk/government/uploads/system/uploads/attachment_data/file/929571/2020_End_use_tables_-_web_copy.xlsx

Cooling in the UK
12
Table 2: 2019 cooling and humidification energy consumption by sector for non-domestic buildings
Sector Energy consumption for cooling and humidification (MWh)
Percentage of total UK cooling and humidification
Arts, leisure and community
381,610 6.2%
Clubs & community centres
47,217 0.8%
Leisure centres 257,548 4.2%
Museums 21,399 0.3%
Places of worship 19,273 0.3%
Theatres 36,174 0.6%
Education 234,606 3.8%
Nurseries 5,893 0.1%
State primary schools 32,556 0.5%
State secondary schools 93,696 1.5%
Universities, non-residential
100,564 1.6%
Universities, residential 1,897 0.0%
Emergency Services 62,821 1.0%
Fire and ambulance stations
6,172 0.1%
Law courts 23,912 0.4%
Police stations 20,463 0.3%
Prisons 12,274 0.2%
Health 556,548 9.0%
Health centres 39,201 0.6%
Hospitals 516,230 8.3%
Nursing homes 1,118 0.0%
Hospitality 338,505 5.5%
Cafes 5,021 0.1%
Hotels 216,717 3.5%
Pubs 19,271 0.3%

Cooling in the UK
13
Sector Energy consumption for cooling and humidification (MWh)
Percentage of total UK cooling and humidification
Restaurants and takeaways
97,496 1.6%
Military 97,896 1.6%
Military civilian accommodation
4,617 0.1%
Military offices 93,013 1.5%
Military storage 266 0.0%
Offices 3,166,651 51.2%
Private offices 2,725,108 44.0%
Public offices 441,544 7.1%
Retail 1,160,233 18.8%
Hairdressers 30,101 0.5%
Large food shops 45,735 0.7%
Large non-food shops 78,861 1.3%
Retail warehouse 209,445 3.4%
Showrooms 126,559 2.0%
Small shops 669,532 10.8%
Storage 188,055 3.0%
Cold stores 3,832 0.1%
Large distribution centres 9,750 0.2%
Stores 10,343 0.2%
Warehouses 164,129 2.7%
The largest energy consumption relating to cooling is found in the office sector which accounts for around half of the non-domestic energy consumption for cooling and humidification in the UK; most of this is private offices (accounting for 44.0% of total consumption). After offices, the next highest proportion of cooling demand is the retail sector at 18.8%, with small shops consuming 10.8% of this sector’s total. This breakdown of data by service sector is based on the Building Energy Efficiency Survey (BEES) 20152, which covered only England and Wales, however data has been extrapolated to be representative of the whole of the UK. This dataset does not contain a breakdown of the four nations (England, Wales, Scotland and Northern
2 https://www.gov.uk/government/publications/building-energy-efficiency-survey-bees

Cooling in the UK
14
Ireland) however the analysis described in Section 5 shows that the cooling demand in the latter two nations is much less than that in England and Wales.
2.1.2 Domestic Buildings
The literature review found little data to indicate the current cooling demand in domestic buildings across the UK. One data source is the Energy Follow Up Survey 20113; which estimated that approximately 2-3% of households surveyed have some form of portable or fixed cooling unit (Section 3.6 Electrical cooling equipment, table 25). This corresponds with BSRIA estimates 4 which range between 3% and 5% for the period 2013 – 2019.
Of this 3%, the EFUS report estimates that less than 1% is fixed cooling systems. This indicates that the bulk of cooling in UK domestic buildings is provided by portable systems which are designed to condition one room. The EFUS survey does not differentiate between portable and fixed cooling systems nor ask how many rooms are served. Without further details around current hours of use and efficiency of these systems (and the areas served) it is not possible to determine confidently the current cooling energy demand from the domestic sector.
2.2 Conventional Cooling Methods & Technologies
This section identifies the range of conventional cooling measures that can be integrated into dwellings and non-domestic buildings. This includes both active and passive measures; active measures use a refrigeration cycle to deliver cooling whilst passive measures are those that passively reduce the tendency of a space to reach high temperatures (such as solar shading or ventilation etc.). Some passive and active measures can work together; passive measures will often reduce the cooling load to be met by the active system. However, there are cases where a passive measure can increase the cooling demand, for example when the outside air is above the cooling set-point and ventilation brings this hotter air into the actively cooled space.
Drawing on AECOM’s extensive experience of building design, a long list of 83 active and passive cooling measures has been produced for subsequent sections. These measures are listed in full in the first column of the table in Appendix A: Long List of Cooling Measures. Measures in this list fall into one of ten categories:
1. External Shading: Provides shading for windows and outdoor areas against solar radiation. Solar radiation is often a key driver of high internal temperatures, so reducing this through passive shading such as overhangs above windows, or brise soleil can significantly reduce internal temperatures. External shading impacts the external appearance of buildings and may have structural implications.
2. Internal Shading: Measures such as blinds or curtains provide shading internally. This is generally lower cost but is less effective than external shading. Internal shading allows
3 https://www.gov.uk/government/statistics/energy-follow-up-survey-efus-2011 4 BSRIA UK Chillers reports. The 2013 report estimated 3% of homes equipped with some form of cooling technology in 2013, whilst the 2017 reports estimated 4% in 2015, and forecast 5% in 2019.

Cooling in the UK
15
solar radiation to enter the building through windows but may then reduce the extent to which it penetrates the building and, depending on its reflective properties, may reflect some solar radiation back out of the building.
3. Ventilation: Both mechanical and natural ventilation measures can help to cool buildings when the air supplied is cooler than the internal temperature. In the UK, the external temperature is generally below that inside buildings so supplying external air is generally an effective approach. The exception to this is during hot weather when the external temperature can be higher than that inside the building so ventilation acts to increase cooling demands. However, ventilation may be required to maintain indoor air quality and therefore continue to operate in this scenario.
4. Thermal Mass: Buildings with large amounts of masonry exposed to the internal spaces can benefit from the thermal mass of these materials. High thermal mass buildings take time to change temperature so can mitigate peaks in external temperature by allowing the thermal mass to absorb the heat and dissipate it later. However thermal mass can be counterproductive in cases where the building is not permitted to cool down (for example when a building is well insulated and not ventilated during cooler periods). Similarly, thermal mass is unhelpful in spaces that are generally occupied during the cooler night periods as they can store heat from the day when they are unoccupied and dissipate it at night.
5. Green & Blue: Vegetation and water can provide cooling to their surroundings through the effects of evapotranspiration and evaporation respectively. Measures such as green roofs, gardens, parks, ponds etc. can all provide a significant cooling effect to their surroundings as well as other benefits such as improved biodiversity and amenity.
6. Reflective: Selecting surface finishes with a high reflectivity can reduce the warming effect of solar radiation. These can be simple measures such as painting walls, roofs and paving in white or another light colour.
7. Active Technologies: The refrigeration cycle is widely used to move heat against the temperature gradient from one body to a hotter body. Several types of refrigeration cycle exist, the most common types used in cooling and heat pumps are electrically driven processes (see Section 3 for discussion of alternative technologies).
8. Cooling Emitters: Chilled fluid supplied by active refrigeration equipment can be supplied to rooms by many types of cooling emitters such as fan coil units, chilled beams or cooling air supplied through ventilation systems.
9. Building Form: Designing the shape and layout of a building can reduce the risk of overheating by using the building form to shade key areas and facilitating the preferred ventilation strategy. Optimising the building form requires a compromise between several priorities including:
• Functional requirements of the building (sizes, shapes and adjacencies of rooms);
• Taking advantage of solar heat gains to reduce space heating demand;

Cooling in the UK
16
• Reducing solar heat gains to reduce risk of overheating;
• Providing daylight and views out;
• Providing amenity space such as courtyards, roof terraces and gardens;
• Restrictions from planning bodies to mitigate visual impacts and shading of neighbouring properties.
10. Other: Several other measures were identified which do not easily fit into the categories above. These include behaviour changes such as modification to dress code, diet and working patterns and measures that improve comfort by increasing local air speeds such as desk and ceiling fans.
2.3 Current Growth in Demand for Active Cooling
This section explores the current growth in demand for cooling systems in different UK building sectors; the qualitative and quantitative findings described here draw on a mixture of published data and data and information that Delta-EE holds, in-house interviews with industry stakeholders (HVAC manufacturers, installation companies, distributors, etc.) and desk-based research. Further research findings can be found in Appendix F: Current Cooling Market Growth Research Findings.
Cooling has historically been dominated by the non-domestic sector, but domestic cooling is starting to become more prevalent than it has previously been.
Table 3 shows UK sales for each technology type including short term forecasts. This data is taken from BSRIA “UK Chillers” and “UK Splits systems” reports for both 2014 and 2017. Data on portable cooling systems is only provided as an estimate in the 2017 data.
Table 3: 2013 – 2019 sales data including estimates and forecasts of cooling units by type across all sectors
Category Sub-category
2013 2014 2015 2016 2017 2018 2019
Volume (1000 units)
Sale
s da
ta
Estim
ate
Estim
ate
Sale
s da
ta
Estim
ate
Fore
cast
Fore
cast
Packaged Air-conditioners (Outdoor Units)
Single Split
141.4 144.3 147.2 150.5 144.4 132.4 131.0
Packaged Air-conditioners
Multi Split 5.1 5.2 5.3 5.7 5.2 5.0 4.9

Cooling in the UK
17
Category Sub-category
2013 2014 2015 2016 2017 2018 2019
Volume (1000 units)
Sale
s da
ta
Estim
ate
Estim
ate
Sale
s da
ta
Estim
ate
Fore
cast
Fore
cast
(Outdoor Units)
Packaged Air-conditioners (Outdoor Units)
Variable Refrigerant Flow (VRF)
Variable Refrigerant Volume (VRV)
15.3 15.8 16.2 20.8 19.6 18.9 18.4
Large Packaged
Rooftops 0.7 0.7 0.7 0.8 0.8 0.8 0.8
Large Packaged
Indoor Package
2.2 2.4 2.4 1.4 1.4 1.4 1.4
Chillers Air Cooled 2.5 2.6 2.6 2.4 2.5 2.4 2.3
Chillers Water Cooled
0.4 0.4 0.4 0.4 0.4 0.4 0.3
Portable Portable 11.7 11.5 11.3 11.1
Figure 1: Split between annual sales figures (forecast) for 2020
76.9%
2.9%
10.8%
0.5%
0.9%
1.4% 0.2% 6.5%
Single Split
Multi Split
VRF
Packaged - Rooftops
Packaged - Indoor
Chiller - Air Cooled
Chiller - Water Cooled
Portable

Cooling in the UK
18
The data shows that sales of cooling are dominated by split systems with almost 80% comprising single and multi-split units. Of these, the majority (76.9%) are single split systems. The second most common type unit is Variable Refrigerant Flow (VRF) or Variable Refrigerant Volume (VRV) systems (10.8%), followed by portable cooling units (6.5%). Larger cooling systems (rooftop and indoor packaged units, and air- and water-cooled chillers) represent 3% of the overall annual sales market by unit number, but with capacities an order of magnitude larger than split or VRF systems, the provision of cooling is much greater as a proportion.
Research conducted by Delta-EE in 2019 examining the UK residential cooling market identified the prime technology being single split cooling units with these representing 95% of the split unit sales. There is also evidence of VRF systems being used in higher-end new build and refurbishment projects where greater cooling coverage is required across the dwelling. The estimates are presented in Table 4. The estimates of number of homes assume one split system is installed per home (this is probably an oversimplification with some homes potentially having more than one single split system installed). Where VRF systems are used in dwellings these are generally in apartment buildings in which case a single system would generally serve multiple apartments; for the purposes of Table 4, it is assumed that one system provides sufficient capacity for 3 homes on average, although a single VRF system may be used in very large single-home refurbishments.
Table 4: Estimates of residential cooling sales (2019) based on Delta-EE research
Cooling type
Total sales across all sectors (2019) (1000s)
Residential sales (1000 units)
Residential sales (% of total)
Number of homes
Single Split 132.4 4.99 3.8% 4,988
Multi Split 5.0 0.26 5.3% 263
VRF 17.6 1.31 7.5% 3,938
Some high-end apartments (predominantly in London) also use chillers but the overall number of sales into the domestic sector is likely to be relatively low.
Data on sales into the residential sector is difficult to access and discussions with manufacturers as part of this research agreed with the approximate figure of around 5% of split units going into residential. However, the internal research by one major manufacturer suggested that around 35% of their multi-split sales were into the residential sector and 40% of their VRF units into the residential sector. The disparity in data from different sources could be due to specific market focus by particular manufacturers but is also an indication of the paucity of information around the residential market.

Cooling in the UK
19
Table 5: Estimates of current install rates (number of homes per year) based on current sales data, industry research, and broken down by primary sector
Sector Cooling system
Lower estimate (number of homes or AC units per year)*
Upper estimate (number of homes or AC units per year)*
Notes and assumptions
Domestic - existing retrofit
Splits 2,600 (incl in total) 50:50 split between new build and retrofit.
50% of portable cooling units for domestic market
VRF 2,000 (incl in total)
Portable cooling units 5,400 (incl in total)
Total 10,000 42,000
Domestic - new build
Splits 2,600 (incl in total) 50:50 split between new build and retrofit.
50% of portable cooling units for domestic market
VRF 2,000 (incl in total)
Portable cooling units 5,400 (incl in total)
Total 10,000 42,000
Non domestic - existing retrofit (number of AC units)
Single Split 6,400 38,000
Lower range assumes 5% of sales go to retrofit. Upper range assumes 30% of sales go to retrofit. **
Multi Split 240 1,400
VRF 810 4,900
Packaged - Rooftops 39 230
Packaged - Indoor 74 440
Chiller - Air Cooled 110 640
Chiller - Water Cooled 16 94
Portable cooling units 5,400 5,400
Total (AC units) 13,000 51,000
Non domestic - new build
Single Split 96,000 64,000
Lower range assumes 75% of sales go to new build. Upper range assumes 50% of sales go to new build.**
Multi Split 3,500 2,400
VRF 12,000 8,100
Packaged - Rooftops 580 390
Packaged - Indoor 1,100 740
Chiller - Air Cooled 1,600 1,100
Chiller - Water Cooled 240 160
Portable cooling units 0 0
Total (AC units) 110,000 77,000
* Figures are provided in number of homes for the domestic sector due to a reasonably proportional relationship between the
number of units and the number of homes. For the non-domestic sector this relationship is complex (some buildings will have
multiple systems, some systems will service multiple buildings / use areas), and some buildings may have multiple technology
types, and therefore the figures provided are in terms of number of AC units.

Cooling in the UK
20
**Note the percentages give are based on approximate ranges. The remainder of installations not included in new build or
existing retrofit are attributed to replacement of existing systems. These are not included in the table since they are not
considered to be adding to the cooling loads met.
2.3.1 Current Trends in Domestic Buildings
The domestic sector in the UK is predominantly kept cool through natural ventilation with no active cooling i.e. very little penetration of cooling. The Energy Follow Up Survey 20115 estimated that approximately 3% of households surveyed have some form of portable or fixed cooling unit. BSRIA (2017 and 2020) estimates that around 5% of homes currently have a cooling solution, mostly using one or more portable cooling systems, with permanently installed systems being in the minority. The increase is around 1% over 3 years (the figure for 2013 was 3% of homes) but there is a significant degree of uncertainty in these estimates. Assuming an increase in 0.33% per year, around 83,000 additional homes are equipped with cooling per year. This is clearly in excess of the sales identified in Table 5 above, suggesting that either the update estimates are incorrect, or there are a large number of systems being installed through channels which are not well documented. Primary research with industry stakeholders suggests that a large proportion of the cooling “installs” are portable cooling systems and that it is possible that the BSRIA figures of circa 11,000 units per year are a significant under-estimate.
The current low levels of penetration in the domestic sector therefore represents a large potential for increase in cooling use. Feedback from Delta-EE’s research contacts suggests the domestic market is rapidly expanding, with comments including “flying at the moment” and a “big boost recently”.
It is important to consider the new build and retrofit sectors separately, although there are some important crossovers in definitions.
Domestic New-Build At present, cooling is generally only installed at the build stage in high-end housing where the market value can support the installation and it attracts customers. Whilst split units can be relatively low cost, the additional on-site trade is not attractive to developers in mass market housing where alternative heating solutions are in place.
However, as space heating loads are reduced in new build homes though improvements to energy efficiency (driven by Part L of the Building Regulations), the use of Split cooling systems as a heating source could be promoted. All split systems sold in the UK are reversible and capable of providing both space heating and cooling at a higher efficiency (with higher COPs) than hydronic air-water systems. In smaller homes, one or more single split systems could be adequate whilst in larger homes a multi-split system could be used. The current awareness of air to air heat pumps / split cooling systems for providing heating is very low and hence there hasn’t been a large uptake of heating led cooling installations.
5 https://www.gov.uk/government/statistics/energy-follow-up-survey-efus-2011

Cooling in the UK
21
In larger homes and blocks of flats, VRF type systems are increasingly common in high end developments, particularly in London. These are provided predominantly for heating (Delta-EE’s research suggests that over 90% of VRF installs provide the primary heating) with the added benefit of cooling. The market value of high-end flats (particularly in London) combined with the ability to spread the system cost across multiple homes as driven the use of VRF in this sector.
Market research by Delta-EE6 suggests that the distinction between new build and retrofit is blurred. Whilst the number of installs at the build stage may be relatively low, industry experience is that a larger number of systems are installed very shortly after completion in the first period of occupation. This may be due to overheating problems in new highly thermally efficient properties, or as a method of circumventing building regulations with the cooling system becoming the predominant heating system alongside providing cooling.
Domestic Retrofit and Refurbishment The split between new build and retrofit / refurbishment is uncertain but one manufacturer suggested this was around 50:50. Due to the recent uptake of cooling in the domestic sector it is likely that the majority of systems are being used to provide cooling in previously un-cooled spaces rather than as a replacement for an existing end of life system (with the exception of replacing portable systems – see below).
A major trend observed in 2020 has been the use of cooling systems in home offices, whether integrated into existing homes (to provide temperature control in a home office area), or as the prime heating and cooling solution in a separate office structure (e.g. a home office shed, modular building, etc, in the garden). Sales in July to September 2020 are approximately 20% higher than for the same period in 2019 based on some industry feedback and this use in home offices is thought to be a major driver. Following the change in working practices resulting from Covid-19, it is expected that there will be a long-term trend of people working from home for some or all of the time, and this is likely to maintain an increased market for cooling systems.
Alongside the need for home office space, the industry has also suggested that due to people spending more of their time at home during 2020, increased investment in homes and internal environment quality has led to a stronger market. The longevity of this is therefore debateable depending on what a post-Covid future looks like.
VRF type systems are being installed in high end retrofits (for example London town houses) alongside gas-based hydronic systems. The drive for installing here is the provision of cooling although they may also become the predominant heating system.
Portable Cooling Systems in the Domestic Sector Portable cooling systems are the dominant form of cooling in the domestic sector, due to their low cost (low £100s), do not require installation and are easily purchased from well-known online retailers. There has been a large increase in enquiries and sales for portable cooling
6 A series of unstructured interviews with manufacturers, installer organisations, and industry specialists.

Cooling in the UK
22
systems in the last year, potentially due to reasons outlined above as retrofit drivers and the warm summer.
However, the general consensus from industry stakeholders is that they are a poor solution, being noisy and requiring emptying of condensate, combined with the inconvenience in terms of space and exhaust air handling.
Some industry stakeholders suggested that they are used as a first stepping stone for customers, and generally after a short period of using a portable system and gaining the cooling benefits, many customers will then move onto a permanent cooling solution, predominantly a single split system.
Summary of Current Domestic Cooling Market and Drivers The following table summarises the current domestic cooling market and the drivers behind it.
Table 6: Summary of current domestic cooling market and drivers
New Build Retrofit / Refurbish Total Units Single Split
Often installed immediately post completion to provide cooling and heating.
Suitable for smaller high thermal efficiency properties as main heat source.
One or more units for summer cooling in home.
Provision of standalone heating and cooling in home offices and separate areas of the home.
Approx. 5,000 units
Multi-split Limited market. Limited market Approx. 250 units
VRF High end apartments (predominantly London) for the main heat source and additional cooling.
Retrofit in high end refurbishments for cooling and supplementary space heating
Approx. 4,000 homes
Portable cooling
First step in cooling following high temperature spikes. Often leads to permanent cooling solution.
First step in cooling following high temperature spikes. Often leads to permanent cooling solution.
50,000 – 80,000 units
Impact of Weather on Domestic Cooling Sales There is a reasonably strong relationship between short term weather and the interest in customers installing cooling systems.
Experience from other European countries with higher summer temperatures is that hot spring periods drive increased interest; customers believe that if the spring is hot enough to be uncomfortable, then summer is likely to be worse and they have time to install a cooling system and benefit from it during the summer period. If the spring is cooler, then high summer temperatures alone may not trigger such strong interest because customers may believe it is

Cooling in the UK
23
too late to have a system installed and benefit from the cooling and leave the decision to the following year.
In the UK the pattern may be different; the UK is less likely to have hot springs, and customers may be looking more at the trend for hot summers year after year. The general industry feedback from UK stakeholders is that hot weather spikes (consistent high temperatures for 1 or 2 weeks) can trigger much higher levels of enquiries resulting either in installations within the year, or through customers planning for the following year. It is believed that portable cooling units have the strongest correlation with temperature, due to their low cost and ease of purchase.
One interviewee suggested that the hot summer peaks don’t result in equipment demand spikes, but only a small upswing due mainly to distress purchases, e.g. to replace small splits which are performing poorly or not functioning.
Some of the stakeholders suggested that homeowners are now so used to cooling in other environments (for example cars, shops, workplaces), that high temperatures at home are more noticeable, driving the interest in domestic cooling during hot periods.
2.3.2 Current Trends in Non-Domestic Buildings
General State of the Market BSRIA sales data shows that the overall cooling market (which is predominantly driven by non-domestic installations) has been relatively flat over the last 10 years, suggesting that the non-domestic market hasn’t significantly grown. Across all technologies (excluding portable cooling) there has been a 1% growth over the decade between 2009 and 2019 in sales, and if the single split systems are excluded (which make up around 77% of the overall sales), the average sales across the other systems have dropped by 16% between 2009 and 2019. The data in Figure 2 shows the reduction in sales for larger cooling system types (particularly packaged indoor) and the shift to smaller modular systems (splits and VRF).

Cooling in the UK
24
Figure 2: Change in annual sales between 2009 and 2019 for all system types (excluding portable cooling)
There are a number of reasons for this overall general trend:
• Cooling installations are heavily influenced by new build development. The last 10 years have seen significant disruption to growth following the economic crisis in 2008, and uncertainty around Brexit from 2016.
• The non-domestic sector already has a high uptake of cooling and therefore the potential for further growth is limited.
In the short term there appears to be a reduction in sales and interest in 2020 due to Covid-19. One stakeholder suggested that sales to the non-domestic sector were about 20% down on last year and the industry believes that the next 12 months may be uncertain.
Non-domestic New Build There is uncertainty over the number of cooling systems sold into the new build sector but research for this project suggests this is in the range of 50% - 80% of overall sales. Feedback from industry stakeholders identified the following issues:
• The market is moving towards fewer larger contracts and they are becoming increasingly competitive. However there also appears to be a general nervousness from investors in larger projects in the last few years which is therefore having a large impact on the market.
• There is anecdotal evidence that the lead times and construction processes for larger projects are becoming extended (the reasons for this are uncertain but it could include the general nervousness around investment, alongside increased project programmes due to planning, etc). This is stretching out the demand for cooling therefore impacting the market.

Cooling in the UK
25
Non-Domestic New Installations in Existing Buildings New installations (also referred to as retrofit or refurbishment) provide additional cooling in buildings where there are no existing cooling systems. The size of this market is thought to be small (a general view of around 5% of total sales from a range of stakeholders) suggesting that the overall increase in cooling need across the non-domestic stock is relatively low with many of the sectors already having cooling systems installed. Trends identified form the industry research include:
• Offices: There is a trend for making office space more modular to allow for flexibility. This is driving the demand for smaller cooling systems in this sector. Another driver is for cooling to be installed at tenant changeover to attract new tenants. This presumably happens in lower grade offices where there is no existing cooling and the space needs to be competitive with higher grade buildings to attract tenants.
• Schools: Feedback was obtained via the industry (gathered by Delt-EE) market research that there is a growing trend for installing cooling systems in schools. One side benefit mentioned by one contact was that they had observed cooling systems also used to provide supplementary heating or completely offset heating from, for example, old inefficient oil boilers, this providing an overall CO2 benefit. This may not be a general market trend, but demonstrates that the installation of cooling could have impacts on heating efficiency and CO2 emissions.
• Warehouse conversions: Feedback from the industry suggested that there are instances where large untreated spaces such as warehouses are being converted into office space, using split units to provide localised space heating and cooling. It is uncertain whether this is a long-term trend.
• Larger scale cooling installations tend to be where major refurbishment work is taking place with new ventilation systems being installed using a full HVAC ducted approach.
Non-Domestic Replacement Systems Replacement of existing systems make up the rest of the sales, around 20% of the overall sales. Trends identified in the industry research include:
• A general decline in retail. Alongside the general decline in the high street and shopping centre market with the rise of online retail, there is a reduced need to replace cooling systems in this sector.
• NHS and healthcare have been large drivers for replacement sales, with large scale refurbishment and upgrading of buildings to provide higher quality services and lower CO2 emissions.
• There has been a short term (2020) increase in sales across hotels, restaurants and bars to improve internal air quality in preparation for re-opening after the spring 2020 lockdown. This is probably a short-term increase although potential changes to building standards and ventilation requirements following the Covid-19 pandemic may result in higher air quality requirements for these sectors. Changes to air quality requirements

Cooling in the UK
26
may result in renewal of ventilations systems which may in turn trigger first installation or replacement of cooling systems.
Impact of Weather on Non-Domestic Cooling Sales In general, the industry market research by Delta-EE suggests that there is little link between the sales of larger scale integrated cooling systems and weather, since these are driven by construction cycles and trends. Large projects are planned long in advance and therefore not susceptible to weather spikes.
For smaller split systems there is some anecdotal evidence that the market improves, particularly with year-ahead planning following a warm summer. The industry research suggested this is a growing trend, and could be responsible for the rise in split and VRF systems seen in the sales data.
Portable cooling systems are probably most impacted by short term weather for reasons outlined in the domestic section above.
2.4 Current Penetration of Cooling Technologies in New Buildings
It was agreed with BEIS that this question would be addressed through a limited survey of AECOM experts. It was initially intended that this question would be addressed through a review of databases (e.g. the EPC database) but the relevant information was not available.
A survey was sent to AECOM staff across the UK that had significant experience in designing new buildings, primarily within the mechanical engineering and building physics teams. Responses were received from 11 team members who together had experience working on projects in all four of the home nations.
The survey asked respondents to evaluate their experience of using different categories of cooling technologies for different building types. The categories of cooling technologies covered both passive and active cooling measures. The categories of cooling technologies and building types of interest were specified in the questionnaire. The respondent gave each category a score from 1 to 5 for each building type, where 1 represented never or very infrequently used for that building type and 5 represented a category that was almost always used for that building type. Where possible, additional information regarding their response was requested from the respondent to add further context.
A few comments about the survey.
• AECOM tends to work on large scale projects. The survey results may not fully represent the whole spectrum of new build projects in the UK such as smaller buildings.
• Whilst the respondents have together worked on each building type in the survey, many respondents specialise on a sub-group of the building types and only provided responses for those building types.

Cooling in the UK
27
• For some building types, for example acute healthcare buildings, the scale and timelines associated with these projects may mean that a respondent only has experience of one building of this type.
2.4.1 High Level Comparison of Technologies
To undertake a high-level analysis of the penetration of different categories of cooling technologies, a numeric average score was calculated for each category. This means that for a category which comprises cooling measures which are frequently used for a particular building type, this leads to a higher score.
The detailed results are summarised in Figure 3 and Figure 4 for domestic and non-domestic buildings respectively. More detailed results are presented in Table 7 and Table 8 for domestic and non-domestic buildings respectively.
Domestic Buildings Overall, the adoption of passive measures was noted as being greater than the active measures. The penetration of active cooling technologies in dwellings is noted as being very low. Considering the individual responses provided, a slightly higher prevalence of active cooling was noted for flats in the South East of England.
Reviewing the passive measures in more detail:
• Balconies in flats were noted as the most prevalent external shading measure, although it was noted that there is a risk that these reduce thermal performance, particularly in regard to the Fabric Energy Efficiency Standard.
• Trellises with deciduous vegetation were noted as sometimes being used as partitions between balconies in the South East of England; however, it was noted that there are concerns about their fire performance and long-term appearance.
• Blinds and curtains were noted as the most prevalent internal shading measures; although it was noted that these are sometimes installed by the occupants and not the builder/developer.
• Standard opening windows were found to be the most prevalent ventilation measure, with cross ventilation and night purging also noted as being prevalent within domestic buildings. Tempered mechanical ventilation was noted as being slightly more prevalent for the South East of England, which is used where there are noise or air quality issues.
• Of the reflective measures, the only measure that was highlighted as being adopted was solar control glass, although it was noted that adopting solar control glazing reduces the amount of beneficial solar heat gains within the Part L compliance calculation methodology and therefore can make compliance difficult.
• With regards to built form, it was noted that site constraints and desire to include as many units as possible on the site are the key drivers. It was noted that it is not usually possible to reduce the size of windows as a result of daylight requirements.

Cooling in the UK
28
Non-Domestic Buildings The penetration of passive and active measures in non-domestic buildings was more evenly spread, although ventilation measures were noted as being particularly prevalent. This is likely to be driven by the requirements of Part F of the Building Regulations, and the wider variety of ventilation strategies adopted in non-domestic buildings compared to domestic buildings.
External brise soleil, shading fins and overhangs are noted as the most prevalent external shading measures, with blinds noted as the most prevalent internal shading measure. In the case of internal blinds, it was noted that in many cases these are not accounted for within the design of HVAC systems as these are manually controlled and therefore their shading effect cannot be relied upon. It was also noted that blinds are often included for other reasons, e.g. glare control or privacy, rather than the beneficial shading effect that they provide.
A variety of different ventilation measures were noted as being used within non-domestic buildings, where it was noted that the strategy adopted is most strongly influenced by client and/or functional requirements of the building. It was highlighted that opening windows are less frequently used in larger offices and/or in city-centre locations where air quality and acoustic concerns make them unsuitable.
Measures including thermal mass were generally infrequently used but, of these measures, exposed concrete ceilings were noted as the most frequently used. It was noted that for some building types, e.g. healthcare, the desire to have exposed soffits can conflict with the need to use hygienic suspended ceilings and/or to conceal services.
Green and blue measures were noted as having low prevalence in the non-domestic sector, although in London the use of green roofs was noted as being adopted to support biodiversity improvements.
Solar control glass was noted as prevalent within non-domestic buildings, with a lower prevalence noted for retail buildings, as it was noted that the need for display glazing to be non-reflective general precludes the use of low g-value glazing. The inclusion of solar control glazing is generally driven by Part L Criterion 3 solar gains requirements, in addition to thermal comfort performance. Fritted glazing was noted as reasonably prevalent where it may be included to provide privacy to occupants as well as to provide shading.
Measures related to built form were generally noted as being infrequently used; however, this may be as a result of the people responding to this questionnaire generally getting involved at a later stage of design when it may not be possible to make changes to the architectural design. It was also noted that the architectural design is most often constrained by the site layout and functional requirements of the building. One respondent who tends to get involved at an earlier stage of design than others noted a higher prevalence of these measures, which may suggest that architects are incorporating these measures at a greater frequency than is perceived by mechanical engineers.

Cooling in the UK
29
Figure 3: Average Category Scores for Cooling Measures in Domestic Buildings
Figure 4: Average Category Scores for Cooling Measures in Non-Domestic Buildings
Table 7: Penetration of Cooling Technologies in Domestic Buildings
Measure Houses Flats
External Shading 1.5 1.7
Overhangs 2.3 1.3
Balconies 1.7 4.5

Cooling in the UK
30
Measure Houses Flats Shutters 1.0 1.0
Brise Soleil 1.0 1.0
Retractable Canopies 1.3 1.3
External blinds 1.0 1.0
Fins 1.0 1.0
Recessed glazing 2.7 2.7
Trellis (with deciduous vegetation) 1.0 1.3
Perforated (laser cut) sliding screens 1.3 1.7
High garden walls/fences 1.7 1.7
Internal shading 1.7 2.0
Blinds (venetian, roman, roller and vertical) 3.3 4.7
Automatic blinds 1.0 1.0
Curtains 2.3 2.3
Internal shutters (insulated or not) 1.0 1.0
Internal films on glass 1.0 1.0
Ventilation 1.8 1.8
Displacement ventilation 1.0 1.0
Standard opening windows/rooflights 3.7 4.3
Secure mesh openings for secure night vent 2.0 2.3
Opening windows with top and bottom openings 1.0 1.0
Cross ventilation through rooms and floors 3.7 2.7
Night purging 3.3 3.3
Ventilation atriums/stacks in tall buildings 1.0 1.0
Breathing buildings 1.0 1.0
Non-tempered mech vent 2.3 2.3
Tempered mech vent 1.7 1.7
Mixed mode 1.0 1.7
Ground ducts 1.0 1.0
Wind catchers 1.0 1.0
Stack chimney with Trombe Wall 1.0 1.0
Thermal mass 1.1 1.2
Masonry partitions 1.3 1.7
Masonry external walls 2.2 2.2
Exposed concrete ceilings 1.0 1.7
Exposed concrete floors 1.0 1.0
Rammed earth walls 1.0 1.0

Cooling in the UK
31
Measure Houses Flats Tanks of water 1.0 1.0
Thermodeck 1.0 1.0
Build underground 1.0 1.0
Phase change materials in fabric (e.g. plasterboard) 1.0 1.0
Phase change materials in tank/buffer 1.0 1.0
Thick stone/block walls on south/west facades 1.0 1.0
Green & Blue 1.1 1.4
Green roof 1.0 2.0
Green wall (internal and external) 1.0 1.0
Blue roof 1.0 1.7
Brown roof 1.0 1.7
Pond / Fountain 1.0 1.0
Canal 1.0 1.0
Park/planting around building 1.7 1.7
Reflective 1.1 1.1
Paint roads white 1.0 1.0
Reflective roof 1.0 1.0
Reflective walls 1.0 1.0
Electrochromic glass 1.0 1.0
Solar control glass 1.5 1.5
Fritted glass 1.0 1.0
Active technologies 1.0 1.1
Portable AC units 1.0 1.0
Electric chillers 1.0 1.3
Reversible heat pumps 1.0 1.3
Absorption chillers (w/wo solar thermal) 1.0 1.0
Adsorption chillers (w/wo solar thermal) 1.0 1.0
Running chillers at night to pre-cool when outside is cooler 1.0 1.0
Ice storage 1.0 1.0
Desiccant cooling 1.0 1.0
District Cooling 1.3 1.3
Cooling emitters 1.1 1.2
FCUs 1.0 1.3
Chilled beams (active and passive) 1.0 1.0
Chilled ceilings 1.0 1.0
Chilled floors 1.0 1.3

Cooling in the UK
32
Measure Houses Flats Carefully running radiators at a low temp but above the dew point 1.0 1.0
DX 1.0 1.0
All air system (VAV, CV) 1.0 1.0
VRF/VRV 1.0 1.0
Heat recovery (heat pump) MVHR 1.7 2.0
Building form 1.4 1.4
Northlights 1.5 1.5
Location of glazing away from sun 1.5 1.5
Reduce glazing size 1.0 1.0
Self-shading 1.5 1.5
Other 1.0 1.0
Taking steps to reduce internal gains 1.0 1.0
Modify dress code 1.0 1.0
Double skin façade 1.0 1.0
Ceiling fans 1.0 1.0
Portable/Desk fans 1.0 1.0
Table 8: Penetration of Cooling Technologies in Non-Domestic Buildings
Measure
Offi
ces
Ret
ail
Indu
stria
l
Hea
lthca
re
Educ
atio
n
Leis
ure
External Shading 1.4 1.2 1.0 1.4 1.4 1.2
Overhangs 1.7 1.5 1.2 2.6 1.8 2.0
Balconies 1.1 1.0 1.0 1.0 1.0 1.0
Shutters 1.0 1.0 1.0 1.0 1.0 1.0
Brise Soleil 3.1 1.7 1.3 2.6 3.0 1.8
Retractable Canopies 1.0 1.8 1.0 1.0 1.0 1.0
External blinds 1.0 1.0 1.0 1.0 1.3 1.0
Fins 2.0 1.0 1.0 2.0 1.6 1.0
Recessed glazing 1.3 1.0 1.0 1.6 1.4 1.0
Trellis (with deciduous vegetation) 1.1 1.0 1.0 1.0 1.0 1.0
Perforated (laser cut) sliding screens 1.0 1.0 1.0 1.0 1.0 1.0
High garden walls/fences 1.0 1.0 1.0 1.0 1.0 1.0
Internal shading 1.8 1.8 1.5 1.6 1.5 1.1

Cooling in the UK
33
Measure
Offi
ces
Ret
ail
Indu
stria
l
Hea
lthca
re
Educ
atio
n
Leis
ure
Blinds (venetian, roman, roller and vertical)
3.5 2.3 2.3 3.5 3.3 1.5
Automatic blinds 1.2 1.0 1.0 1.0 1.0 1.0
Curtains 1.0 2.3 2.0 1.0 1.0 1.0
Internal shutters (insulated or not) 1.0 1.0 1.0 1.0 1.0 1.0
Internal films on glass 2.3 2.3 1.3 1.6 1.0 1.0
Ventilation 1.7 1.3 1.5 2.1 2.1 1.3
Displacement ventilation 1.3 1.0 1.5 1.0 1.1 1.0
Standard opening windows/rooflights 2.6 2.3 3.0 3.8 4.3 1.0
Secure mesh openings for secure night vent
1.1 1.0 1.5 3.0 1.9 1.0
Opening windows with top and bottom openings
1.5 1.0 1.0 1.2 2.0 1.0
Cross ventilation through rooms and floors
1.5 1.0 2.3 2.0 1.8 1.0
Night purging 1.7 1.0 1.5 2.6 2.4 1.0
Ventilation atriums/stacks in tall buildings
1.4 1.0 1.0 1.8 2.1 1.0
Breathing buildings 1.0 1.0 1.3 1.0 2.7 1.0
Non-tempered mech vent 2.6 2.0 1.0 3.4 1.9 2.4
Tempered mech vent 3.9 3.0 2.0 4.3 2.9 3.5
Mixed mode 1.7 1.0 1.5 1.8 2.3 1.5
Ground ducts 1.0 1.0 1.0 1.0 1.0 1.0
Wind catchers 1.0 1.0 1.0 1.0 1.7 1.0
Stack chimney with Trombe Wall 1.0 1.0 1.0 1.0 1.1 1.0
Thermal mass 1.2 1.0 1.0 1.0 1.2 1.0
Masonry partitions 1.0 1.0 1.0 1.0 1.0 1.0
Masonry external walls 1.0 1.0 1.0 1.0 1.6 1.0
Exposed concrete ceilings 2.4 1.0 1.5 1.2 2.4 1.0
Exposed concrete floors 1.0 1.0 1.0 1.0 1.1 1.0
Rammed earth walls 1.0 1.0 1.0 1.0 1.0 1.0
Tanks of water 1.0 1.0 1.0 1.0 1.0 1.0
Thermodeck 1.2 1.0 1.0 1.0 1.0 1.0
Build underground 1.0 1.0 1.0 1.0 1.0 1.0

Cooling in the UK
34
Measure
Offi
ces
Ret
ail
Indu
stria
l
Hea
lthca
re
Educ
atio
n
Leis
ure
Phase change materials in fabric (e.g. plasterboard)
1.1 1.0 1.0 1.0 1.0 1.0
Phase change materials in tank/buffer 1.0 1.0 1.0 1.0 1.0 1.0
Thick stone/block walls on south/west facades
1.0 1.0 1.0 1.0 1.0 1.0
Green & Blue 1.2 1.4 1.4 1.5 1.3 1.3
Green roof 1.8 2.0 2.3 2.8 1.8 1.8
Green wall (internal and external) 1.2 1.3 1.3 1.2 1.1 1.3
Blue roof 1.3 1.7 1.5 1.4 1.3 1.5
Brown roof 1.3 1.7 1.5 1.4 1.3 1.5
Pond / Fountain 1.0 1.0 1.0 1.0 1.0 1.0
Canal 1.0 1.0 1.0 1.0 1.0 1.0
Park/planting around building 1.0 1.0 1.5 1.4 1.3 1.0
Reflective 1.6 1.6 1.3 1.7 1.5 1.6
Paint roads white 1.0 1.0 1.0 1.0 1.0 1.0
Reflective roof 1.0 1.0 1.0 1.0 1.0 1.0
Reflective walls 1.0 1.0 1.0 1.0 1.0 1.0
Electrochromic glass 1.0 1.0 1.0 1.0 1.0 1.0
Solar control glass 3.9 2.8 2.5 3.7 3.9 4.8
Fritted glass 1.9 3.0 1.5 2.3 1.0 1.0
Active technologies 1.5 1.7 1.4 1.5 1.3 1.3
Portable AC units 1.0 1.0 1.3 1.0 1.0 1.0
Electric chillers 3.2 3.9 2.8 3.0 1.7 2.8
Reversible heat pumps 2.9 3.5 2.8 3.5 2.0 2.0
Absorption chillers (w/wo solar thermal) 1.0 1.0 1.0 1.0 1.0 1.0
Adsorption chillers (w/wo solar thermal) 1.0 1.0 1.0 1.0 1.0 1.0
Running chillers at night to pre-cool when outside is cooler
1.0 1.0 1.0 1.0 1.0 1.0
Ice storage 1.0 1.0 1.0 1.0 1.0 1.0
Desiccant cooling 1.0 1.0 1.0 1.0 1.0 1.0
District Cooling 1.2 1.5 1.3 1.2 1.6 1.3
Cooling emitters 2.5 2.3 1.9 2.1 1.6 1.9
FCUs 4.4 4.4 1.5 2.7 2.1 4.3

Cooling in the UK
35
Measure
Offi
ces
Ret
ail
Indu
stria
l
Hea
lthca
re
Educ
atio
n
Leis
ure
Chilled beams (active and passive) 2.3 2.3 1.3 2.2 1.4 1.0
Chilled ceilings 1.4 1.0 1.0 1.2 1.0 1.0
Chilled floors 1.2 1.0 1.0 1.0 1.0 1.0
Carefully running radiators at a low temp but above the dew point
1.0 1.0 1.0 1.0 1.0 1.0
DX 3.7 4.0 3.0 3.7 2.8 2.5
All air system (VAV, CV) 2.7 2.3 3.5 2.3 1.6 2.3
VRF/VRV 3.8 3.4 2.5 3.5 2.3 3.0
Heat recovery (heat pump) MVHR 1.8 1.0 2.0 1.8 1.0 1.0
Building form 1.7 1.3 1.9 1.9 1.6 1.2
Northlights 1.6 1.4 2.3 1.8 1.7 1.8
Location of glazing away from sun 1.6 1.4 1.7 1.9 1.7 1.0
Reduce glazing size 1.9 1.0 1.6 2.3 1.4 1.0
Self-shading 1.6 1.4 1.9 1.8 1.6 1.0
Other 1.2 1.0 1.0 1.2 1.1 1.0
Taking steps to reduce internal gains 1.7 1.0 1.0 1.8 1.6 1.0
Modify dress code 1.0 1.0 1.0 1.0 1.0 1.0
Double skin façade 1.2 1.0 1.0 1.2 1.1 1.0
Ceiling fans 1.0 1.0 1.0 1.0 1.0 1.0
Portable/Desk fans 1.0 1.0 1.0 1.0 1.0 1.0
2.5 Barriers & Opportunities for Adoption of Different Cooling Measures
This section discusses barriers to the adoption of cooling measures in the UK.
A first key consideration when cooling a building is to determine the required thermal comfort outcome. There are two primary outcomes: either an improvement on an un-cooled situation and some mitigation of overheating, or provision of a desired level of comfort.
• Considering the former outcome, the technologies that may be used to achieve this are likely to be passive, since generally these can limit temperature rises, but do not guarantee a certain level of comfort.

Cooling in the UK
36
• In the case of the latter, whereby a technology is chosen to deliver a desired level of comfort, this will generally require an active cooling technology, that can reduce air temperatures beyond the capabilities of passive measures. However, it should be noted that passive technologies can be used in conjunction with active technologies to reduce the cooling load.
If there is to be an increase in adoption of cooling measures, both passive and active, another important context to understand is what the overall policy objectives are as this growth occurs:
• If the objective is to achieve energy savings and CO2 emissions reductions, then the aim may be to reduce barriers to the adoption of passive technologies, whilst increasing barriers to the adoption of active measures.
• Alternatively, if the objective is to facilitate the provision of desired levels of comfort, then the aim may be to reduce barriers to active cooling measures, in a way which drives efficient solutions, and which maximises the benefits of a passive-first strategy where viable.
A pragmatic approach is that building occupants will increasingly expect improved levels of comfort, particularly in light of increased summer temperatures with climate change, and this will necessitate the use of active cooling measures, alongside the adoption of passive measures where possible.
Once the wider context is understood, then the specific factors that influence whether a measure can be adopted within a building can be evaluated. Some of these factors will act as drivers and others act as barriers to adoption, with the relative importance of these factors depending on the technology under consideration, and particularly whether it is a passive or active technology. In addition, for some technologies, whether it is to be installed within a new build or existing building is of key importance.
2.5.1 Physical, Financial/Economic, Social & Behavioural Factors
There are four key factors that influence the cooling measure adopted in a building: physical, financial/economic, social and behavioural.
• Physical factors: These define the physical ability to adopting a technology, in addition to the physical impacts of using them. These include the impact of measures on the building fabric and structure, and the internal space required to facilitate the use of the technology.
• Financial and economic factors: These consider the capital and lifecycle costs associated with adopting a given cooling technology.
• Social factors: There cover a broad spectrum relating to social needs and trends surrounding comfort and cooling.
• Behavioural factors: These consider the behaviour of building occupants and decision makers, and will be closely related to the financial and social factors.

Cooling in the UK
37
Table 9 provides a high-level summary of the key barriers and opportunities for different passive and active cooling technologies from the perspective of these four factors. Some more detailed factors which can affect the choice between different types of active cooling technologies are provided in Appendix G: Overview of Barriers & Decision Making.

Cooling in the UK
38
Table 9: Summary of Barriers and Opportunities Applicable to different Cooling Technologies
Category Physical Financial/Economic Social Behavioural
External Shading (e.g. overhangs, canopies, brise soleil)
− Likely to require integration into architectural design from outset to ensure suitable structure (e.g. particularly balconies)
+ Balconies may provide opportunities for amenity space (particularly within residential buildings)
− May be considered an unnecessary CAPEX if shading doesn’t provide additional amenity
+ Most technologies do not incur additional OPEX
− Will not provide close control of internal temperatures
+ Can contribute to a reduction in cooling loads to be met by active cooling technologies
+ Operational performance does not rely on user input
− Significant intervention that is likely to take a long time to develop and implement
Internal Shading (e.g. blinds, curtains, shutters)
+ Minimal space requirements for these technologies
+ Can be easily integrated into new and existing buildings
+ Most technologies do not incur additional OPEX
− Will not provide close control of internal temperatures
+ Can contribute to a reduction in cooling loads to be met by active cooling technologies
− Most require user input to ensure operational performance
+ Many interventions can be implemented quickly
Mechanical Ventilation
− Some technologies may require additional plant space (e.g. mechanical ventilation)
− Additional CAPEX − Additional OPEX
− Will not provide close control of internal temperatures
+ Can contribute to a reduction in cooling loads to be met by active cooling technologies
− Some technologies will take a long time to develop and implement (e.g. adding mechanical ventilation if previously there was none)

Cooling in the UK
39
Category Physical Financial/Economic Social Behavioural
Natural Ventilation
− Some technologies require a particular architectural arrangement, and therefore likely to require inclusion in the design from the outset (e.g. cross ventilation, stack ventilation)
− Will generally incur additional CAPEX
− Will not provide close control of internal temperatures
− Can contribute to a reduction in cooling loads to be met by active cooling technologies
− Many require user input to ensure operational performance (e.g. opening windows during appropriate conditions)
− Some technologies will take a long time to develop and implement (e.g. creating path for natural ventilation may involve structural work)
Thermal Mass (e.g. heavyweight construction, phase change materials)
− Most technologies are likely to require integration into architectural design from outset
− Limited opportunity to retrofit these technologies into existing buildings, with the exception of some Phase Change Materials
− Depending on technology, may incur additional CAPEX
+ Most technologies do not incur additional OPEX
− Will not provide close control of internal temperatures
+ Can contribute to a reduction in cooling loads to be met by active cooling technologies
− Long term effectiveness depends on operating hours allowing for thermal mass to be ‘recharged’ overnight
− Effectiveness requires night-time ventilation which may require user input if this is provided naturally
+ Alternatively, if night-time ventilation is provided mechanically, once commissioned, this will require minimal user input

Cooling in the UK
40
Category Physical Financial/Economic Social Behavioural
Green and Blue (e.g. green roofs, ponds, green space around building)
− Many technologies require additional space beyond the footprint of the building
− Potential for technology may be limited by other functional requirements (e.g. green roof may be limited by plant space requirements)
− Most measures will have significant structural implications
+ Technologies may provide additional amenity space (e.g. green roofs)
− Will incur additional CAPEX
− Depending on technology, may incur additional OPEX from additional maintenance and irrigation requirements
− Will not provide close control of internal temperatures
+ Can contribute to a reduction in cooling loads to be met by active cooling technologies
+ Can provide additional wellbeing improvements
+ Operational performance does not rely on user input
Reflective (e.g. reflective coatings, solar control glass, electrochromic glass)
+ Technologies do not generally require additional space
− Technologies may result in unappealing architectural finishes
− Depending on technology, may incur additional CAPEX
+ Most technologies do not incur additional OPEX
− Will not provide close control of internal temperatures
+ Can contribute to a reduction in cooling loads to be met by active cooling technologies
+ Operational performance does not rely on user input

Cooling in the UK
41
Category Physical Financial/Economic Social Behavioural Active Technologies (e.g. electric chillers, portable air conditioners, district cooling)
− Suitable space must be found for central plant and emitters
− Some technologies are suited to low cooling load applications only
− For portable cooling units, their use necessitates exhaust pipes to be positioned through the building, along with acoustic considerations during use
− Will incur additional CAPEX
Will incur additional OPEX (unless functional requirements demand inclusion of active cooling)
+ Will provide close control of internal temperatures
+ Once commissioned, operational performance does not rely on user input, beyond regular maintenance
Cooling Emitters (e.g. FCUs, chilled beams, VRF)
Building Form (e.g. north lights, reduced glazing, self shading)
− Effectiveness of these measures may be limited by scope of site
+ Provided technologies are considered at a concept stage, inclusion can be CAPEX neutral
+ No additional OPEX
− Will not provide close control of internal temperatures
− Can contribute to a reduction in cooling loads to be met by active cooling technologies
+ Operational performance does not rely on user input
Other (e.g. reduced internal gains, modified dress code, desk fans)
+ Technologies do not generally require additional space
− Depending on technology, may incur additional CAPEX
− Depending on technology, may incur additional OPEX
+ Can contribute to occupants feeling more comfortable in elevated temperature conditions
− Most require user input to ensure operational performance

Cooling in the UK
42
3. Innovative Solutions Currently in Development
This section presents an overview of innovative cooling technologies that could potentially contribute to meeting the UK’s cooling demand but are not yet widely available. This complements the review in the previous section which focussed on conventional cooling technologies.
Our assessment of innovative cooling technologies is based on a desk review of published information from national and international organisations on technology trends, along with records of funding opportunities from UK and international innovation programmes. This was used to identify the most promising technologies and their key attributes – although it is important to note that this list is not exhaustive and that there are many different systems currently in development.
A recent study conducted by BEIS in 2019 identified a range of innovations in cooling (see Figure 5)7. This study focuses on cooling systems that offer reductions in energy demand and/or greenhouse gas (GHG) emissions. As such, the primary focus is on systems that provide cooling without the use of conventional vapour compression cycle refrigeration.
7 Vivid Economics on behalf of BEIS, ‘Energy Innovation Needs Assessment Sub-Theme Report: Heating & Cooling’ (2019). Available at: https://assets.publishing.service.gov.uk/government/uploads/system/uploads/attachment_data/file/845657/energy-innovation-needs-assessment-heating-cooling.pdf

Cooling in the UK
43
Figure 5: Innovation mapping for cooling. (Source: BEIS, 2019)8
8 The magnitude of the contribution to cost reduction and reducing deployment barriers are described in qualitative terms relative to other innovation opportunities: • Significantly above average = 5 • Above average = 4 • Average = 3 • Below average = 2 • Significantly below average = 1

Cooling in the UK
44
For each technology, where possible, we have provided:
• A description of the technology and how it works;
• An assessment of the technology readiness and potential timeframes for commercialisation;
• A qualitative view of the Cooling Potential & System Efficiency;
• Potential costs when deployed at scale; and
• A brief overview of the future trajectory for innovation.
3.1 Sources of Information and Previous Research
One of the inherent challenges of researching innovative technologies is the comparative lack of publicly available and / or peer-reviewed studies and evidence relating to system performance, costs and benefits. Key sources of information used in this report are described below, followed by brief commentary on their scope, limitations, and interrelationships.
3.1.1 Research Commissioned by BEIS
In 2019, BEIS published a report on innovative solutions for low carbon heating and cooling.9 The report considers a range of technologies, focusing on five main categories: heat pumps, heat networks, heat storage, cooling and hydrogen boilers. In each case, the report describes the key innovations and their potential impact on costs and timeframe.
The assessment of cooling technologies covered:
• Standalone cooling units – described in the ‘cooling’ section of the report.
• Reversible heat pumps that provide both heating and cooling – described in the ‘heat pumps’ section of the report.
Note that the study primarily aimed to describe innovations that ‘require government support to become commercialised, rather than innovations that are more likely to be delivered by industry.’ The focus is on innovations that can reduce costs and deployment barriers. Industrial, agricultural and retail refrigeration technologies were also excluded.
3.1.2 Research Commissioned by the US Department of Energy (DoE)
In the last decade, the US Department of Energy (DoE) has commissioned several studies to explore low carbon cooling technologies and funded a variety of research initiatives on this
9 Vivid Economics on behalf of BEIS, ‘Energy Innovation Needs Assessment Sub-Theme Report: Heating & Cooling’ (2019). Available at: https://assets.publishing.service.gov.uk/government/uploads/system/uploads/attachment_data/file/845657/energy-innovation-needs-assessment-heating-cooling.pdf

Cooling in the UK
45
subject. This includes a series of reports undertaken by Navigant Consulting that looked at innovative cooling technologies in considerable depth10,11.
‘Energy Savings Potential and R&D Opportunities for Non-Vapor-Compression HVAC Technologies’ (2014) Recognising the high global warming potential (GWP) of refrigerants used in heating, ventilation and cooling (HVAC) technologies, the aim of this study was to provide an overview of alternatives that do not rely on the use of vapour compression. For each technology identified, the report provides an estimate of the potential cost and complexity of adoption, impact on energy savings, co-benefits (e.g. noise reduction, indoor air quality, reducing peak electricity demands, etc.) and timescales for commercialisation. Then, it makes a series of recommendations for the DoE regarding future policies and research initiatives.
Note that, although the report is very comprehensive, it draws on examples of early stage R&D (research and development) initiatives and pilot projects. Therefore, some of the information, particularly the quantitative analysis or energy use and costs, may not reflect the performance of systems in mass production. This is an inherent challenge of carrying out research into emerging technologies but should be considered when interpreting the report’s overall findings.
‘The Future of Air Conditioning for Buildings’ (2016) Following the publication of the 2014 study (see above), Navigant Consulting was commissioned to produce a further report on the global future of cooling, considering issues such as increasing energy demands, technological changes, and potential policy responses. This report, like the one published in 2014, draws on examples of research initiatives funded by the DoE and IEA partner organisations to inform an assessment of future cooling technologies. It is referenced in the ‘Innovation Mapping for Cooling’ section of the BEIS study (2019). It is also referenced in several recent reports and resources produced by the International Energy Agency (see below).
3.1.3 International Energy Agency (IEA)
‘The Future of Cooling’ (2018) The IEA Report ‘The Future of Cooling’, published in 2018, describes the potential future scale and impact of rising global demand for cooling12. It provides a high-level assessment of global energy demand for cooling in the coming decades, and describes the potential effects of introducing stringent energy efficiency standards for cooling technologies via policy and regulatory frameworks. The discussion predominantly focuses on improving existing technologies rather than describing alternatives to vapour compression and other innovative
10 Navigant Consulting on behalf of the US Department of Energy, ‘Energy Savings Potential and R&D Opportunities for Non-Vapor-Compression HVAC Technologies’ (2014). Available at https://www.energy.gov/sites/prod/files/2014/03/f12/Non-Vapor%20Compression%20HVAC%20Report.pdf 11 Navigant Consulting on behalf of the US Department of Energy, ‘The Future of Air Conditioning for Buildings’ (2016). Available at: https://www.energy.gov/sites/prod/files/2016/07/f33/The%20Future%20of%20AC%20Report%20-%20Full%20Report_0.pdf 12 IEA, ‘The Future of Cooling: Opportunities for energy-efficient air conditioning’ (2018). Available at: https://www.iea.org/reports/the-future-of-cooling

Cooling in the UK
46
solutions in detail. We note that, where the report does address cooling innovations, much of the information is drawn from the earlier US Department of Energy studies.
‘Special Report on Clean Energy Innovation’ (2020) This IEA report presents an overview of the clean energy innovations viewed as crucial for achieving global decarbonisation targets13. It sets out principles that governments can follow to encourage the development and adoption of these technologies. There is a dedicated section on ‘advanced refrigerant-free cooling systems’; although it does not describe each technology in detail, the report confirms that most are ‘currently in the prototype phase’ but could potentially be adopted from the 2030s onwards.
‘Clean Energy Technology Guide’ (2020) More detailed information about innovative cooling technologies is provided in the IEA’s Energy Technology Perspectives (ETP) Clean Energy Technology Guide. This is an online interactive framework (last updated in July 2020) that covers a wide range of low carbon technology designs and components14. In each case, the Guide provides a description of the technology, its current Technology Readiness Level (TRL), relevant timescales for deployment / commercialisation, and examples notable research initiatives. The Guide appears to draw, at least in part, on records of research projects funded by UK and EU schemes, as well as entries to the Global Cooling Prize 2020 (see below).
Innovation Funding Competitions To understand whether there are any other notable technologies not covered by the above sources, we referred to databases of projects funded through Innovate UK and Horizon 2020. These were screened for potentially relevant entries using a keyword search for the terms ‘cooling’, ‘cool’, ‘air conditioning’, ‘chiller’ and ‘compressor’. All of the technologies highlighted by this exercise fit into the categories already described in the BEIS, DoE or IEA reports listed above.
We also reviewed descriptions of projects shortlisted for the Global Cooling Prize, an international competition carried out in 201915. This exercise showed that submissions to the Global Cooling Prize are included in the IEA’s ETP Clean Energy Technology Guide, which provides links to relevant funding and research initiatives for each technology.
Limitations of this Approach All of these sources agree on the broad types of innovative cooling systems that could become available in future, while noting that there is still a significant amount of further research and development required before they are widely adopted. However, some overlap is to be
13 IEA, ‘Special Report on Clean Energy Innovation: Accelerating technology progress for a sustainable future’ (2020). Available at: https://www.euneighbours.eu/sites/default/files/publications/2020-07/Energy_Technology_Perspectives_2020_-_Special_Report_on_Clean_Energy_Innovation.pdf 14 Available at: https://www.iea.org/articles/etp-clean-energy-technology-guide 15 Available at: https://globalcoolingprize.org/

Cooling in the UK
47
expected because they draw on the same source material to a significant extent (see Figure 6). Therefore, there is a risk that some information is out of date, particularly because it either:
• draws on pilot projects and modelling some of which was carried out in the 2000s; and/or
• omits or diminishes the potential importance of technologies that have only developed in the last few years.
Where possible, we have sought to mitigate this issue by cross-checking information across different sources, ensuring that the most up-to-date evidence is used, and making it clear throughout the report if there is limited information available to support estimates.
Figure 6: Relationships between key reference documents
3.2 Innovative Cooling Technologies
3.2.1 Context: Alternatives to Vapour Compression Systems
Many conventional cooling systems rely on a vapour compression cycle to provide cooling (Box 1 below). These require significant energy inputs, particularly to power the compressors, resulting in greenhouse gas (GHG) emissions from electricity use, and pressure on grid infrastructure due to high peak demands. There are further issues associated with the use of refrigerant working fluids; many refrigerants have a high global warming potential (GWP) and can also pose health and safety hazards.

Cooling in the UK
48
Box 1: The Vapour Compression Cycle
The majority of heat pumps rely on a vapour compression cycle to transfer heat from a heat source to a thermal reservoir. Depending on the direction of heat transfer, this process can be used to provide cooling or space heating to buildings.
A vapour compression cycle consists of four main components: an evaporator, a compressor, a condenser, and an expansion valve. A ‘working fluid’ is circulated through these elements via insulated pipes, absorbing and releasing heat as it undergoes state changes from gas to liquid and back again. The basic steps are as follows:
Compression: The gaseous refrigerant is compressed under adiabatic conditions, which raises both the temperature and pressure of the refrigerant. This process is typically driven by an electric motor.
Condensation: The gaseous refrigerant passes into the condenser and condenses back to a liquid. This releases latent heat, which is typically rejected to the outside air.
Expansion: The now-liquid refrigerant passes through an expansion valve. As a result, the refrigerant drops in temperature and pressure.
Evaporation: The liquid refrigerant enters the evaporator, which acts as a heat exchanger between the refrigerant and a source of heat (e.g. ground, air or water). When heat is transferred to the refrigerant, it boils and evaporates into a gas; in doing so, the refrigerant absorbs latent heat.
The negative environmental impacts associated with cooling technologies can be reduced by various means (see Figure 7), including improving the efficiency of the system, using low- or zero-GWP working fluids, and / or using technologies that do not rely on a vapour compression cycle to deliver cooling. The latter may be one of the most impactful options, as it can potentially solve multiple challenges at once by reducing both direct and indirect emissions.

Cooling in the UK
49
Figure 7: Opportunities to reduce emissions from cooling (A/C). (Source: US Department of Energy, 2016)
Examples of non-vapour-compression technologies include, but are not limited to:
• Solid-state cooling, also known as caloric cooling;
• Evaporative cooling;
• Solid or liquid desiccant cooling;
• Membrane cooling; and
• Absorption /adsorption cooling.
As will be discussed in the following sections, these technologies are at a comparatively early stage of R&D, even though some use components that are already commercialised for building heating, ventilation and cooling (HVAC). The IEA has stated an ambition for these systems to achieve the same cost as vapour compression under mass production, something that is crucial for the technologies to be adopted at scale. However, achieving this will rely on ‘additional research and large-scale manufacturing and integration of materials with high reliabilities and long operation lifetime.’ This research is expected to continue over the next decade, with wider deployment beginning from the 2030s onwards (IEA, 2020).
In the short- to medium-term, therefore, advances in cooling technology are more likely to be linked with improvements in existing systems and components, i.e. compressors, heat exchangers, materials, controls, etc., along with wider use of low- or zero-GWP refrigerants. For context, existing state-of-the-art vapour compression systems can be up to five times more efficient than average systems (IEA, 2020), so the potential for improvement in this area is significant. As shown in Figure 8 below, the average efficiency of cooling systems on the market has increased significantly over time, and this trend is expected to continue even without a step-change in cooling technology (IEA, 2018). However, the innovative technologies

Cooling in the UK
50
described in the following sections have the potential to transform this sector and radically accelerate the shift towards net zero emissions.
Figure 8: Historic and future trends in cooling efficiency, based on the weighted average world seasonal energy efficiency ratio (SEER)16 in a ‘Baseline’ scenario. (Source IEA, 2018)
3.2.2 Solid-State Cooling
Caloric cooling technologies, also known as solid-state cooling technologies, involve applying a magnetic or electric field, or a mechanical force, to specialised caloric materials that change their thermal state when the field is applied17. This is a relatively new approach to cooling that does not rely on moving parts such as compressors and avoids the use of refrigerants with high GWP. Therefore, they can significantly decrease the GHG emissions and electricity demands associated with conventional cooling systems. In principle, they would be applicable to all building types and climate zones, and could also act as reversible heat pumps, providing both cooling and space heating.
Magnetocaloric Cooling Description Magnetocaloric cooling involves cyclically applying a magnetic field to ferromagnetic material under adiabatic conditions. This leads to a reversible temperature change in the material that corresponds with the change in magnetization; the magnetocaloric material will absorb heat from its surroundings and reject it to a heat sink. As with other solid-state cooling systems, the key benefits are greater efficiencies and avoiding the use of HFC refrigerants. The technology is considered potentially suitable for a range of applications in refrigeration and industrial cooling along with building HVAC.
Technology Readiness This technology has been in R&D stage for decades and, although it is not yet commercially available, US Department of Energy (2014) reported that there have been breakthroughs in the
16 The SEER is one way of expressing the efficiency of a cooling system. It refers to the cooling output divided by the energy input to the system, over the course of a typical cooling season. The COP, by contrast, is based on the cooling output divided by energy input under specific operating conditions. 17 Many materials exhibit caloric effects to some extent when a field or force is applied. A simple example is natural rubber, which changes temperature when stretched. For solid-state cooling applications, materials might include ferroelectric ceramics, liquid crystals, or thin film polymers.

Cooling in the UK
51
last decade. In 2019, the Fraunhofer Society announced that it is carrying out research to develop a prototype18.
Cooling Potential & System Efficiency The cooling capacity of the system depends on the strength of the magnetic field, as this determines the temperature change of the material. US Department of Energy (2014) explains that, ‘existing permanent magnets suitable for air-conditioning applications […] yield a maximum temperature change of only 9°F’ and that the electrical power needed to obtain stronger magnetic fields using those magnets would negate the energy savings of the system.
To date, this has been one of the key factors that has limited the development of magnetocaloric cooling systems for buildings; research has focused on improving the cooling capacity of magnetocaloric systems, either by improving the use of existing magnets and materials or developing new ones.
US Department of Energy (2014) suggests that magnetocaloric cooling systems might ultimately use around 20% less energy than comparable vapour compression systems. The coefficient of performance (COP) of early prototypes developed as part of a DoE-funded study was around 2.0, although the researchers believed that a fully functioning version could potentially achieve a COP of 4.0.
Potential Costs The costs of magnetocaloric cooling systems are likely to be high compared with conventional systems. This is because, to achieve the required magnetic field, it is necessary to use rare-earth magnets which are in high demand.
Future Trajectory for Innovation Future research is likely to focus on ways to achieve a stronger magnetic field without increasing the required electricity inputs, and developing new magnets or magnetocaloric materials. It is unclear whether these developments will ultimately enable the system to become competitive with conventional cooling technologies in terms of cost and energy efficiency. BEIS (2019) indicates that magnetocaloric cooling could be commercialised for use in small refrigeration in the near term and the authors observe that this is ‘a promising sign that the technology may have wider potential.’
Elastocaloric (or Thermoelastic) Cooling Description Elastocaloric cooling involves cyclically applying mechanical stress to shape-memory alloys (SMAs) under adiabatic conditions. This causes a reversible change in the temperature of the caloric material, which either absorbs heat from, or rejects heat to, its surroundings.
Although elastocaloric cooling is a relatively new concept, the ETP Clean Energy Technology Guide rates this technology as having ‘high’ importance for reaching net zero emissions
18 Fraunhofer, ‘Research News: A cooling system without harmful refrigerants’ (2019). Available at: https://www.fraunhofer.de/content/dam/zv/en/press-media/2019/august/researchnews/ipm-a-cooling-system-without-harmful-refrigerants.pdf

Cooling in the UK
52
globally. Like other solid-state cooling technologies, it avoids the use of refrigerants and mechanical compressors, but due to the relatively high latent heat of the shape-memory alloys, it may offer greater cooling potential than other solid-state technologies (US Department of Energy, 2014).
Technology Readiness This technology is still in early R&D stage. Several prototypes have been developed, but a review published in 2015 indicated that none had achieved a temperature change that would be sufficient to provide space cooling.19
Cooling Potential & System Efficiency Modelling suggests that COPs could range from 5-7 (IEA, 2017) and could be potentially as high as 11 (US Department of Energy, 2014) depending on the materials that are used.
Potential Costs No cost estimates are available for this technology. US Department of Energy (2014) cites an expert opinion which claimed that under mass production, the costs could ultimately be similar to vapour compression.
Future Trajectory for Innovation The US Department of Energy provided funding for a prototype to be developed as part of the ‘Building Energy Efficiency Frontiers and Innovation Technologies (BENEFIT)’ initiative from 2015-2017. 20 According to the study authors, ‘Currently, the biggest hurdle preventing [thermoelastic cooling] from commercialization is difficulties in achieving an efficient way to apply large compression load (~ 900 MPa) with a small footprint with full recovery of the unloading energy.’
Other challenges include developing SMA materials that can resist crack propagation and fatigue. There may also be a possibility of using advanced polymers in place of SMA materials (US Department of Energy, 2014).
Barocaloric Cooling Description Barocaloric materials heat up when pressure is applied and cool down when pressure is released due to changes in the crystalline structure of the material. By applying pressure cyclically, and exposing the material to heat transfer fluids, it is possible to provide space cooling21. This is an emerging field of research but is described by the IEA (2020) as being among the ‘most suitable for thermal applications’ compared with other solid state cooling technologies.
19 Suxin Qian et al., ‘An overview of thermoelastic cooling technology’ (2015). Available at: https://heatpumpingtechnologies.org/publications/an-overview-of-thermoelastic-cooling-technology/ 20 US Department of Energy, ‘Compact Thermoelastic Cooling System’ (2017). Available at: https://www.energy.gov/eere/buildings/downloads/compact-thermoelastic-cooling-system 21 CIBSE Journal Online, ‘Zero-GWPcooling using the barocaloric effect’ (2020). Available at: https://www.cibsejournal.com/technical/barocaloric-cooling-a-potential-alternative-to-refrigerant/

Cooling in the UK
53
Technology Readiness Our review suggests that this technology is at early R&D phase. Initial research22 was carried out at the University of Cambridge in c. 2017-2018. Members of the research team subsequently formed a company called Barocal, which was awarded the Global Cooling Prize in 2019 and aims to develop a prototype in the next few years23.
Cooling Potential & System Efficiency According to the IEA (2020), ‘research in test conditions shows that barocaloric refrigeration […] performs better than vapour compression coolers in domestic applications, with improvements ranging from 5% to 150% depending on ambient, material and flow rate conditions.’ However, it is not clear what research this refers to or how the level of improvement was measured (i.e. what it was being compared to).
Potential Costs No cost information is available for this technology due to the early stage of R&D.
Future Trajectory for Innovation It is anticipated that prototype systems will be developed in the short to medium term following the Global Cooling Prize; however, given the early stage of R&D, the future trajectory and timescales are uncertain.
Electrocaloric Cooling Description Electrocaloric cooling is a form of solid-state cooling that involves applying an electric field to a caloric material that undergoes a temperature change due to changes in polarisation. This offers many of the same advantages as the other solid-state cooling technologies described above in that it avoids the use of refrigerants and mechanical compressors.
Technology Readiness This technology is in early R&D phase. Research funded by the US DoE in 2015-2017 aimed to achieve a TRL 3 demonstration of a new heat pump design (i.e. proof of concept).24 In late 2019, Fraunhofer ISE announced that the company will begin to develop a working prototype: ‘The team‘s goal is to have a demonstrator with an output of 100 watts and a temperature range of 30 K in four years‘ time.’25
22 For more information, see UK Research and Innovation, ‘Development of a sustainable solid-state barocaloric cooler’ (n.d.) Available at: https://gtr.ukri.org/projects?ref=EP%2FP031412%2F1 and Engineering and Physical Sciences Research Council, ‘Details of Grant: Development of a sustainable solid-state barocaloric cooler’ (n.d.) Available at: https://gow.epsrc.ukri.org/NGBOViewGrant.aspx?GrantRef=EP/P031412/1 23 According to the Barocal website, available at: https://barocal.com/ 24 https://www.energy.gov/eere/buildings/downloads/high-efficiency-solid-state-heat-pump-module 25 Fraunhofer, ‘Press Release: Fraunhofer starts development of refrigerant-free, energy-efficient electrocaloric heat pumps’ (2019). Available at: https://www.iaf.fraunhofer.de/en/media-library/press-releases/elkawe.html

Cooling in the UK
54
Cooling Potential & System Efficiency The DoE-funded project (see above) aimed to show that this technology could achieve a seasonal COP of 6.0 at full commercialisation. However, it appears that published results are not available to confirm whether this was achieved.
Potential Costs No cost information is available for this technology due to the early stage of R&D.
Future Trajectory for Innovation A key limitation of this technology, as with other solid-state cooling technologies, is that at present only a small temperature change can be achieved. Further development is needed to achieve a higher temperature difference without requiring very high electric fields via use of innovative materials (e.g. ceramics and thin polymer films). It should also be noted that some electrocaloric materials contain lead, which poses an environmental hazard; future research may investigate lead-free alternatives26.
3.2.3 Evaporative Cooling
In a typical evaporative cooler, a fan blows warm, dry air over water-soaked filter pads, causing the water to evaporate. This lowers the air temperature while raising its humidity. Evaporative cooling is a well-established technology that uses significantly less energy than vapour compression and does not use liquid refrigerants. However, its application has historically been limited to hot-dry climates, because in humid conditions, less evaporation takes place. One way of addressing this challenge is to provide separate cooling and dehumidification, which can be achieved through use of secondary technologies such as desiccants or specialised membranes.
Evaporative Cooling Coupled with Solid or Liquid Desiccants Description A desiccant is a substance that can be used as a drying agent due to its high affinity for water (i.e. hygroscopic properties). Desiccants can be used to dehumidify incoming air before it passes through an evaporative cooler.
One example is the DEVap system, which has been developed in part through DoE funding in the last decade27. When supply air is exposed to a desiccant, the desiccant absorbs water, which dehumidifies and warms the air. The air then passes a heat recovery wheel, which cools it below the initial ambient temperature. The cool air is supplied to the building. Finally, the desiccant is regenerated by applying heat, which causes it to release the absorbed moisture so that the cycle can start over. Figure 9 illustrates how this could be incorporated into a residential building.
26 CIBSE Journal Online, ‘Electrocaloric cooling – making a difference’ (2019). Available at: https://www.cibsejournal.com/technical/electrocaloric-cooling-making-a-difference/ 27 National Renewable Energy Laboratory, ‘Desiccant Enhanced Evaporative Air-Conditioning (DEVap): Evaluation of a New Concept in Ultra Efficient Air Conditioning’ (2011). Available at: https://www.nrel.gov/docs/fy11osti/49722.pdf

Cooling in the UK
55
Figure 9: Diagram of the DEVap cooling system in a residential building. (Source: NREL)
There are several variations on this approach. In an open desiccant system, air comes into direct contact with the desiccant, whereas in a closed system the desiccant is confined to a separate chamber via a specialised membrane. The desiccant may be either solid (e.g. silica gel) or liquid (e.g. lithium chloride). Solid desiccants are well-established in HVAC applications while liquid desiccants are relatively new28,29.
Evaporative desiccant cooling technology could therefore be suitable for humid climates where conventional evaporative coolers are ineffective. The lack of a compressor, and lower latent heat loads, can reduce the energy demands of the system. Furthermore, the regeneration process can be driven by renewable and low carbon sources of thermal energy (e.g. waste heat, solar heat)30. Desiccant cooling therefore offers benefits in terms of both energy and GHG emissions reductions. It also provides independent control of temperature and humidity, which can contribute to thermal comfort.
Technology Readiness
US Department of Energy (2014) indicates that this technology has not yet progressed beyond prototype / demonstration phase.
Cooling Potential & System Efficiency
The cooling potential and system efficiency depend on a wide range of factors, including but not limited to (a) what technologies are being used in combination with the desiccant, and (b)
28Mujahid Rafique, M. & Gandhidasan, P. & Rehman, Shafiqur & Al-Hadhrami, Luai M., 2015. ‘A review on desiccant based evaporative cooling systems,’ Renewable and Sustainable Energy Reviews, Elsevier, vol. 45(C), pages 145-159. Available at: https://www.sciencedirect.com/science/article/pii/S0306261916311230#f0005 29 D.B.Jani, Manish Mishra and P.K.Sahoo, ‘Solid desiccant air conditioning – A state of the art review’ (2016). Available at: https://www.sciencedirect.com/science/article/abs/pii/S1364032116002665 30 The opportunity to utilise solar heat was explored as part of the IEA’s research task, ‘New Generation Solar Cooling & Heating Systems (PV or solar thermally driven systems)’ which ran from 2014 to 2018. More information is available at: https://task53.iea-shc.org/

Cooling in the UK
56
whether the desiccant is solid or liquid. Liquid desiccants require less energy to regenerate and could therefore provide higher efficiencies.
According to US Department of Energy (2014), the DEVap liquid desiccant evaporative cooling system could offer energy savings of around 60% compared with vapour compression systems. This estimate represents an average, based on modelled estimates of the energy savings for US cities in different climate zones.
Potential Costs
The potential costs of this technology are highly uncertain due to the early stage of development. US Department of Energy (2014) indicates that DEVap is likely to be more expensive than vapour compression but there is ‘potential to reach cost parity’ longer term.
Future Trajectory for Innovation
The ETP Clean Energy Technology Guide indicates that evaporative desiccant cooling is one of the most promising innovative cooling technologies in development. Unlike some of the other technologies described in this report, desiccant cooling systems use components that are already commercialised. However, there are several other potential market barriers to overcome. For instance, the systems increase on-site water consumption, and there are maintenance issues (common to all evaporative cooling systems) associated with scale, freezing damage, etc. Further research is needed to develop and test prototypes that mitigate these issues and prove that they can operate efficiently in different climate conditions.
Evaporative Cooling Coupled with Permeable Membranes Description
US Department of Energy (2014) explains that, ‘Emerging research in material science and nanotechnology has led to the development of selectively permeable membranes that transport water molecules across their surface very efficiently while inhibiting the migration of air.’ Permeable membranes are already in use in certain types of water purification and heat recovery ventilation systems31. In addition, similar to desiccants, they can be used in cooling systems to dehumidify incoming air before it passes through an evaporative cooler. This approach can provide independent control of temperature and humidity using significantly less energy input than conventional cooling systems.
This technology is considered one of the most promising innovative cooling approaches (see US Department of Energy 2014 and ETP Clean Energy Technology Guide), for a variety of reasons, including but not limited to the following:
• Higher system efficiencies would significantly reduce electricity demands;
• The technology uses commercially available HVAC components, which could potentially reduce the timescales for adoption;
31 For example, see https://daisanalytic.com/applications/conserv/

Cooling in the UK
57
• It uses non-HFC refrigerants, thus reducing GHG emissions;
• It is expected to be similar in size and cost to vapour compression systems; and
• It is theoretically applicable for all building types in all climate zones.
The main drawback is that these systems consume a significant amount of water, although this can be reduced if water collected by the membranes is fed back to the evaporative cooler.
Note: In this system, specialised membranes are used to provide dehumidification prior to sensible cooling; in Section 3.2 we describe how membranes can act as electrochemical compressors but these are not the same technology32. The sensible cooling step could also be provided by a range of other technologies other than evaporative cooling.
Technology Readiness
This technology is at prototype stage and there are several R&D initiatives underway. For example, M2 Thermal Solutions was selected as one of eight finalists for the Global Cooling Prize33. NanoAir is a reversible membrane heat pump currently in development by Dais Analytic that can provide both heating and cooling; the company has developed second-generation prototypes and is working to develop larger systems with funding from the US Department of Energy34.
Cooling Potential & System Efficiency
This review has found various estimates of the potential system efficiency of this technology, all of which suggest that it is far more efficient than vapour compression. This is to be expected due to the lack of energy needed to power a compressor, but nonetheless, these figures should be interpreted with some caution due to the early stage of R&D.
Estimates from Dais Analytic (as reported by US Department of Energy, 2014) suggest that their designs could be up to twice as efficient as vapour compression technologies, with system EERs of 26, based on preliminary modelling. More recently, M2 Thermal Solutions publicly claimed that their prototype can achieve a 500% improvement in efficiency compared with similar vapour compression technologies, although it is not clear what this is based on35. According to IEA (2020), ‘In tests, membrane-based systems have shown promising coefficients of performance ranging from 5 up to 15.5 in advanced evaporative cooling systems.’ No citation was provided.
Potential Costs
According to US Department of Energy (2014), this technology could be comparable to vapour compression systems in mass production. This estimate was based on the fact that the key
32 US Department of Energy, ‘Membrane Based Air Conditioning’ (n.d.) Available at: https://www.energy.gov/eere/buildings/downloads/membrane-based-air-conditioning 33 For more information, see https://globalcoolingprize.org/m2-thermal-solutions/ 34 For more information, see https://daisanalytic.com/applications/nanoair/ 35 Global Cooling Prize promotional video, ‘About the Finalists: M2 Thermal Solutions’ (2020). Available at: https://www.youtube.com/watch?v=DGtg0vC8-Sc&feature=youtu.be

Cooling in the UK
58
system components are already commercialised within the HVAC industry. More recently, M2 Thermal Solutions has publicly stated that they are aiming for a ‘purchase price similar to current units’ although it is not clear whether that would be possible based on the technology as currently proposed.
Future Trajectory for Innovation
As stated previously, research is currently underway to develop larger-scale prototypes and test these systems in a range of different climate conditions.
3.2.4 Absorption Cooling
Description Whereas vapour compression systems use electrical or mechanical energy drive the cooling process, absorption cooling works using heat. Both methods involve a refrigerant being condensed and evaporated as part of a cooling cycle, but in an absorption cooler, the refrigerant vapour is pumped to a higher-pressure level via a thermo-chemical interaction instead of a compressor. US Department of Energy (2014) describes this technology as being only ‘moderately promising’ due to its potentially limited applications, but it may be of interest for industrial or large commercial facilities.
Technology Readiness Absorption cooling systems are well-developed compared with many of the other cooling technologies considered in this report, but they are not as widely used as vapour compression systems due in part to having higher capital costs and lower efficiencies (see below). They are mainly used in large commercial applications, although reversible and heat-only systems are available for light commercial and residential applications.
Cooling Potential & System Efficiency Absorption chillers can achieve typical COPs of around 0.6-1.2, which is lower than comparable vapour compression systems. However, if there is a source of low carbon heat available, then this could result in a decrease in electricity demands and GHG emissions.
Potential Costs Absorption coolers are significantly more expensive than vapour-compression systems. They are more financially attractive for large commercial applications particularly where there is a source of waste heat, and/or there a need to reduce peak electricity consumption. Depending on the working fluids used, some systems require cooling towers, leading to additional cost and complexity; this is a significant barrier to uptake in residential buildings.
Future Trajectory for Innovation According to US Department of Energy (2014), some of the next steps for technology development include:

Cooling in the UK
59
• Improving the design of individual components to allow for higher efficiencies, smaller size and lower cost; and
• Research into alternative working fluid pairs, to reduce the risk of toxicity and crystallisation.
Further research could also focus on developing absorption coolers (and controls) that integrate with other building services in order to capture waste heat.
3.2.5 Other Examples
There are too many examples for this review to list all possible combinations of different cooling systems, but the following technologies can potentially be used with those listed above to offer additional benefits.
Electrochemical Compression Description
In this system, mechanical compressors are replaced with electrochemical compressors (ECCs) that rely on specialised ion-permeable membranes to transport gas from an area of low concentration to an area of high concentration when an external voltage is applied36. Research into electrochemical compression has historically focused on its application in hydrogen fuel cells, but it can also potentially be used in heat pumps. According to the authors of a DoE-funded study37 carried out between 2015 and 2017, this approach would offer several potential advantages over vapour compression:
‘Electrochemical compressors (a) are more efficient (i.e. have an inherently high COP) than conventional compressors, (b) are motorless and therefore reliable and noiseless, (c) use non-HFC refrigerants and therefore have a lower global warming potential, (d) are modular and scalable, (e) can operate very efficiently at partial loads, and (f) can be designed to fit different form factors.’
Technology Readiness
This technology is at early R&D stage. It is understood that Xergy, in association with Dais Analytic and the Oak Ridge National Laboratory in the US have been working on a prototype cooling system that uses ECC; the project received DoE funding from 2015-2017.
Cooling Potential & System Efficiency
There is limited information about the cooling potential or system efficiency of this technology. The Xergy prototype (see above) was intended to have a COP above 4, with a target of 4.5,
36 Bahar et. al., ‘An overview of advancements in electrochemical compressor driven heat pump systems’, paper submitted to the 12th IEA Heat Pump Conference (2017). Available at: http://hpc2017.org/wp-content/uploads/2017/06/O.4.9.4-An-overview-of-advancements-in-electrochemical-compressor-driven-heat-pump-systems.pdf 37 US Department of Energy, ‘Low-Cost Electrochemical Compressor Utilizing Green Refrigerants for HVAC Applications’ (n.d.) Available at: https://www.energy.gov/eere/buildings/downloads/low-cost-electrochemical-compressor-utilizing-green-refrigerants-hvac

Cooling in the UK
60
when ECC was combined with liquid desiccants. However, it is not clear what stage of development was reached.
Potential Costs
No cost estimates are available for this technology.
Future Trajectory for Innovation
Although water can be used as a working fluid for ECC, this requires the system to operate below atmospheric pressure, which is a key challenge. Future research by Xergy is expected to focus on building prototypes that use alternative working fluids (e.g. ammonia or CO2) and improving the speed of the electrochemical reaction.
Chilled Water Storage Description
Although not a standalone cooling technology, chilled water storage (CWS) can be used to reduce peak cooling loads. As with hot water storage, which is widely used in buildings throughout the UK, a thermal energy storage tank can be charged when there is low electricity demand / usage and then discharged during peak periods. This can help to reduce operating costs by allowing consumers to purchase electricity at lower prices38.
Technology Readiness
Chilled water storage systems have been in use for decades in relevant markets, i.e. commercial and industrial applications where there is a need to reduce peak loads and / or operating costs. They are not widely used in domestic buildings.
Cooling Potential & System Efficiency
CWS can improve the efficiency of the cooling system, thus providing energy savings, in a few different ways. For instance:
• It can be charged overnight when there are lower ambient temperatures and therefore less temperature change
• It can allow the cooling system to operate more continuously, closer to full load
Published case studies indicate that it is possible to achieve on-site energy savings of 10-20%. There may also be energy savings at the source electricity plant due to peak demand reduction39.
Potential Costs
38 US Department of Energy Office of Scientific and Technical Information, ‘Technical Report: Thermal energy storage for space cooling’ (2000). Available at: https://www.osti.gov/servlets/purl/770996/ 39 ASHRAE Journal, ‘Emerging Technologies: Thermal Energy Storage’ (2013). Available at: https://www.iaf.fraunhofer.de/en/media-library/press-releases/elkawe.html

Cooling in the UK
61
The cost of thermal storage tanks varies depending on size, ranging from several hundred pounds for domestic-scale systems to several thousand pounds for commercial applications. It is worth noting that CWS can lower the required cooling capacity, which would potentially reduce the capital cost of the cooling system.
Future Trajectory for Innovation
This is a relatively mature technology that is described by the ETP Clean Energy Technology Guide as being of ‘Very High’ importance for reaching Net Zero emissions. A key challenge for deployment would be ensuring that CWS is correctly integrated with whatever other HVAC systems are in place, were this to be retrofitted into existing buildings.
Note that, although water is the most common thermal storage medium in building HVAC, ice and other phase-change materials can also be used. Future developments in phase-change technologies could therefore provide additional benefits in terms of peak demand reduction if combined with other cooling systems.
3.3 Key Summary Points
Improvements in vapour compression cycle systems: There are some existing state-of-the-art systems that can achieve COPs more than double the average, but these come at a significant price premium. Further R&D is needed to improve system components while bringing costs down. Our review suggests that these could be ready for deployment in the medium term (2020s), which means that these will be crucial for reducing the environmental impacts of cooling systems.
Alternatives to vapour compression: There are a variety of technologies that deliver cooling without vapour compression, thereby reducing energy demands along with GHG emissions. These are mostly at early prototype stage but could become available from around 2030 onwards.
In general terms, solid-state cooling holds significant promise because it is potentially applicable to a wide range of climate zones, building types, and building services, including hot water heating and domestic refrigeration. Membrane-assisted evaporative cooling and desiccant cooling would be particularly relevant to markets where there is a greater need for independent control of temperature and humidity, e.g. hot-humid climate zones. Absorption cooling is already commercially available for certain applications but could become more attractive in future when there is a greater need to reduce peak electricity demand and/or readily available sources of waste heat. It is therefore relevant to industrial and large commercial facilities. Some of these techniques can be used on their own while others are being combined in innovative ways.
All types of cooling systems can benefit from smart controls, better integration with other building services, demand side management, and so on, which can help to reduce energy demands overall. These options are discussed in a recent report produced by BEIS in 2019 and have not been considered in detail.

Cooling in the UK
62
4. Defining Alternative Policy Scenarios The core part of this study is to compare alternative policy/deployment scenarios in response to a warming UK climate. Three scenarios were discussed and agreed with BEIS. For the purposes of this analysis, each deployment scenario is taken to consist of a progression through a series of packages of measures designed to mitigate overheating risk. Figure 10 shows a graphical representation of the three deployment scenarios.
• No intervention: Government makes no specific interventions and the market determines the most likely uptake of different measures. Basic adaptive measures (Package A) are deployed with no strategic foresight; this could include the use of passive measures and/or active cooling. When these reach the limits of their effectiveness or are found to be otherwise unsuitable, a low efficiency fixed refrigeration cooling system is retrofitted.
• Passive first: Government intervenes to prioritise passive cooling measures. Government promotes higher cost, higher disruption passive measures than would be adopted without government intervention (Passive Package B). Active refrigeration is only deployed where Passive Package B measures are no longer effective; government requires active cooling to be high efficiency.
• Efficient technologies: Government intervenes to target the deployment of systems that can provide cooling in an efficient way. There is no coordinated uptake of passive measures. Basic adaptive measures (Package A) are deployed without government input; this could include the use of passive measures and/or active cooling. When these reach the limit of their effectiveness or are found to be otherwise unsuitable, active refrigeration cooling systems are installed, and government requires these to be high efficiency.
Figure 10: Representation of three deployment scenarios each consisting of a progression through packages of passive and active measures
No Intervention
Business-as-Usual:• No
intervention
Package A:• Low cost• Low disruption• Convenient
Active cooling retrofit:• Minimum efficiency• Including benefits of previously-fitted passive
package A
Passive FirstBusiness-as-Usual:• No
intervention
Passive Package B:• Higher cost• Higher disruption
Active cooling retrofit:• High efficiency• Including benefits of previously-
fitted passive package B
Efficient Technologies
Business-as-Usual:• No
intervention
Package A:• Low cost• Low disruption• Convenient
Active cooling retrofit:• High efficiency• Including benefits of previously-fitted passive
package A
Increasing Global Temperatures

Cooling in the UK
63
Five packages of building-level measures have been developed for each building sector with variants for new and existing buildings. These provide the building blocks to evaluate the impact of these three deployment scenarios:
• Business-as-Usual: No additional intervention to mitigate cooling demand or overheating risk than typically applied to buildings today.
• Package A: Low cost, low disruption convenient measures that building owners/occupants might reasonably take to accommodate a temperature rise without considering the longer-term impacts of climate change and without specific government intervention. This could include active cooling and/or passive measures.
• Passive Package B: Higher cost, higher disruption passive mitigation measures that might be taken with government encouragement.
• Fixed Active Refrigeration Cooling: Deployed when passive measures reach their performance limits. Two variants/packages have been developed:
o Combined with Package A;
o Combined with Passive Package B.
These packages are combined as illustrated in Figure 10 to model the three deployment scenarios.
Each of the deployment scenarios is considered to be a sequence of deploying one of these packages for a period until it is gradually superseded by another package. This progression will be modelled as occurring when the previous package is either no longer achieving sufficient thermal comfort or because it is causing inconvenience. At this point it will be assumed that the owner transitions to fixed (i.e. not portable) active cooling at a rate defined by transition curves rather than a sudden step change. Section 5.2 describes the process of deriving these modelled transitions.
This section describes how the packages were derived.
• The first stage was to identify a long-list of different measures that may be adopted within a building’s design to contribute to the provision of comfortable internal temperatures. The suitability of this long-list of measures for inclusion within the different building archetypes was assessed, and those that scored highly were short-listed for further investigation.
• The short-listed measures were then applied to two sample building models, representing non-domestic and domestic buildings, to assess the cost-effectiveness of these measures on the provision of comfortable internal temperatures of the buildings.
Section 5 then presents the modelling methodology and results for three alternative policy/deployment scenarios developed in Section 4 to mitigate for the increased cooling demand. The analysis quantifies the energy demand for each deployment scenario until 2100 for two climate scenarios. The impact on daily and annual cooling energy demand is presented for the UK, broken down by country and by sector. The costs of implementation for the different

Cooling in the UK
64
policy scenarios are also presented at a national level. Synergies with other energy uses and across sectors is commented upon to help align potential policy interventions.
4.1 Packages A & B for Each Archetype
This section describes how individual measures have been selected for inclusion in Package A and Passive Package B; distinct packages have been developed for domestic and non-domestic building archetypes.
The business-as-usual (BAU) package (i.e. the starting position for each of the three deployment scenarios), is deemed to not include any of the measures identified below and to use a standard natural or mechanical ventilation strategy selected to suit each room in the archetype models; details of these baseline models can be found in Appendix E: Modelling Packages of Measures.
The three deployment scenarios end with either Package A combined with fixed (rather than portable) cooling or Passive Package B combined with fixed cooling.
4.1.1 Shortlisting Cooling Measures
A long list of passive and active cooling measures that may be adopted within a building’s design was prepared. Drawing on AECOM’s extensive experience and knowledge of building design, each measure was rated for its suitability for adoption within each of the twelve building archetypes, leading to overall suitability scores for each measure within domestic and non-domestic buildings. Innovative and immature technologies, such as those explored in Section 3, were generally given low scores due to their current unavailability and uncertainty over their speed of development and future costs etc. Measures that scored highly were deemed to be suitable for adoption; these formed the short-list of measures that were modelled to investigate their effectiveness. Appendix A: Long List of Cooling Measures comprises a table which identifies the long list of cooling technologies considered, their evaluation, and the short-listed measures identified in the final column.
4.1.2 Modelling the Short-Listed Cooling Measures
Once the short-listed measures were identified, the next step was to evaluate the effectiveness of these measures in improving the thermal comfort performance of buildings. To do this, two sample buildings were chosen to represent non-domestic and domestic buildings.
The sample non-domestic building was an existing shallow-plan office with mechanical ventilation40, and an existing semi-detached dwelling with natural ventilation was selected to represent domestic buildings. Detailed descriptions of the sample buildings are given in Appendix B: Description of Sample Buildings used to Derive Passive Packages. Within these sample buildings, the effect of each of the short-listed measures was assessed for a single
40 It is assumed that the office would have openable windows that are not an essential element of the ventilation design, i.e. the mechanical ventilation achieves ventilation rates compliant with Part F of the Building Regulations.

Cooling in the UK
65
room; in the case of the office this was a south-facing mid-floor office (with the exception of the model for reflective roofs which was assessed for a top-floor office), and within the dwelling this was a south-facing living room. Both buildings were simulated using the current London TRY weather tape (published in 201641) for the summer period May to September inclusive42.
Table 10 shows the agreed short-list of measures that have been considered for the non-domestic and domestic buildings, with additional commentary provided to clarify how the measures have been modelled where this may be unclear. Full details of all of the modelled measures are given in Appendix C: Description of Modelled Passive Measures.
For each of the domestic and non-domestic buildings, the following ventilation strategies were chosen to act as the baseline against which the performance of the other short-listed measures could be compared. The baseline ventilation strategies are highlighted in green in Table 10.
• Non-Domestic Buildings: Non-Tempered Mechanical Ventilation;
• Domestic Buildings: Standard Natural Ventilation openings.
Table 10: Short-Listed Modelled Measures for Non-Domestic and Domestic Buildings
Measure (with shorthand same used in graphs is shown in round brackets) [1]
Non-Domestic Domestic
Overhangs (Overhang) N/A Yes
Balconies (Balcony) N/A Yes
Shutters (ExtShutter) N/A Yes
Brise Soleil (BriseSoliel) Yes Yes
Retractable Canopies (RetractCanopies)
N/A Yes
External Blinds (ExtBlinds)
Yes Yes
Fins (Fins) Yes Yes
Recessed Glazing (Recess)
Yes N/A
Internal Blinds (IntBlinds)
Yes Yes
Automatic Internal Blinds (AutoIntBlinds)
Yes Yes
41 CIBSE weather data. https://www.cibse.org/weatherdata 42 The process of selecting measures for inclusion in the packages is based on comparative rather than absolute performance; therefore, the weather file selected was chosen as being likely to show a degree of overheating with most individual measures considered. London is the hottest weather data from the four locations selected (London, Cardiff, Belfast and Glasgow).

Cooling in the UK
66
Measure (with shorthand same used in graphs is shown in round brackets) [1]
Non-Domestic Domestic
Curtains (IntBlinds)
Yes – the impact of curtains is deemed to be the same as internal blinds and has not been separately modelled.
Yes – the impact of curtains is deemed to be the same as internal blinds and has not been separately modelled
Uninsulated Internal Shutters (IntShutters)
Yes Yes
Insulated Internal Shutters (IntInsShutters)
Yes Yes
Shading Films applied to Glazing (ShadingFilm)
Yes Yes
Standard Window Openings (StdNatVent)
Yes – top hung windows limited to 100mm maximum opening; where windows are assumed to be open to 50% of their maximum extent throughout the occupied period to provide fresh air, and to open to their fullest extent when the internal air temperature reaches 24ºC. Windows are closed outside of occupied hours.
Baseline assumption
During the occupied period windows and door opens to a maximum of 30º when the internal air temperature reaches 22ºC.
Secure Mesh Openings for Night Vent (SecNatVent)
Yes – during the occupied period windows open as described in the Standard Window Openings. Outside of the occupied period, windows open if the internal air temperature is greater than 22ºC (out of hours opening is limited to 80% to model effect of security grille in front of window).
Yes - during the occupied period windows open as described in the Standard Window Openings. Outside of the occupied period, windows open if the internal air temperature is greater than 22ºC (out of hours opening is limited to 80% to model effect of security grille in front of window).
Opening Windows with Top and Bottom Openings
(Non-Domestic = CntrHung and Domestic = TopBottom)
Yes – centre hung windows limited to 100mm maximum opening; with opening strategy as described in the Standard Window Openings.
Yes – additional low-level windows provided. These open to a maximum of 30º and open on the same basis as described in Standard Window Openings.

Cooling in the UK
67
Measure (with shorthand same used in graphs is shown in round brackets) [1]
Non-Domestic Domestic
Night Purging (NightPurge)
Yes – mechanical ventilation operates throughout the occupied period (as per non-tempered mechanical ventilation), and additionally operates out of hours if the internal air temperature is greater than 22ºC.
Yes – windows open as described in Standard Window Openings during the day. Overnight, windows open to 5% (representative of the free area that may be provided by a locked secure opening) if the internal air temperature is greater than 22ºC.
Non-Tempered Mechanical Ventilation (MechVent)
Baseline assumption
Mechanical ventilation operates throughout the occupied period only. Ventilation air is supplied at the external air temperature.
N/A dwellings with mechanical ventilation generally have opening windows as well, see Mixed Mode.
Tempered Mechanical Ventilation (TempMechVent)
Yes – mechanical ventilation operates as described in the Non-Tempered Mechanical Ventilation. When the external air temperature rises above 22ºC, the ventilation air is tempered and supplied at 22ºC to the space, at all other times the air is supplied at the external air temperature.
Yes – mechanical ventilation operates as described in the Non-Tempered Mechanical Ventilation. When the external air temperature rises above 22ºC, the ventilation air is tempered and supplied at 22ºC to the space, at all other times the air is supplied at the external air temperature. There are no opening windows in this option.
Mixed Mode (MixedMode)
Yes – During the occupied periods, windows open as described in the Standard Window Openings. This is supplemented by mechanical ventilation, which during the occupied periods operates when the internal air temperature rises above 26ºC. At all other times the mechanical ventilation does not operate.
Yes – the mechanical ventilation operates as per the Non-Tempered Mechanical Ventilation option. This is supplemented by purge ventilation provided by opening windows and doors, that open to the same extent as described in the Standard Window Openings option, but open when the internal air temperature reaches 24ºC.
Reflective Roof (ReflectRoof)
Yes N/A
Reflective Walls (ReflectWalls)
Yes Yes

Cooling in the UK
68
Measure (with shorthand same used in graphs is shown in round brackets) [1]
Non-Domestic Domestic
Electrochromic Glass (Electrochromic)
Yes Yes
Solar Control Glass (SolarCntl)
Yes Yes
Fritted Glass (Fritting) Yes Yes
Portable Cooling Units (PortAC)
Yes Yes
Fixed Cooling (FixedAC)
Yes Yes
Taking Steps to Reduce Internal Gains (IntGains)
Yes – improving the efficiency of lighting and IT equipment to reduce internal gains during occupied periods.
Yes – improving the efficiency of lighting and appliances to reduce internal gains during occupied periods.
Modify Dress Codes (Clothing)
Yes Yes
Ceiling Fans (CeilingFans)
Yes Yes
Portable/Desk Fans (DeskFan)
Yes Yes
[Note 1] Shorthand names are used in subsequent figures.
4.1.3 Evaluating the Cost-Effectiveness of Cooling Measures
The short-listed cooling measures were each modelled individually in the non-domestic and domestic sample building models as applicable, and their cost-effectiveness on controlling the internal temperature was assessed. Sample rooms were modelled using dynamic thermal modelling software (IES-VE) to assess their thermal comfort performance using CIBSE TM52:2013 “The Limits of Thermal Comfort: Avoiding Overheating in European Buildings”, hereafter referred to as CIBSE TM52 standards. CIBSE also published TM59:2017 “Design methodology for the assessment of overheating risk in homes”. TM52 and TM59 are similar in that both are based on the principle of adaptive thermal comfort and they share a test criterion. TM52 requires all occupied spaces to comply with two of three criteria whilst TM59 requires occupied rooms to comply with one of the same criteria as defined in TM52 and sets an additional criterion for bedrooms. The analysis undertaken for this report uses TM52 criteria for all archetypes (both domestic and non-domestic) because of the similarities described above and because a common method was required when modelling the transitions from one package to the next as is described in Section 5.2.

Cooling in the UK
69
Criteria for Assessing the Risk of Overheating in Buildings CIBSE TM52:2013 defines a standard for controlling the risk of overheating based on three criteria.
The three criteria are all defined in terms of ∆T, i.e. the difference between the actual operative temperature in the room at any time (Top) and Tmax the limiting maximum acceptable temperature. Tmax is calculated from the exponentially weighted running mean of the outdoor temperature Trm:
Tmax = 0.33Trm + 21.8
The exponentially weighted running mean temperature, Trm, for any day is expressed in the series:
Trm = (1 – α) (Tod–1 + α Tod–2 + α² Tod–3 ....)
where α is a constant (<1) and Tod–1, Tod–2, etc. are the daily mean temperatures for yesterday, the day before, and so on.
∆T is calculated as:
∆T = Top – Tmax
∆T is rounded to the nearest whole degree (i.e. for ∆T between 0.5 and 1.5 the value used is 1 K; for 1.5 to 2.5 the value used is 2 K, and so on).
The three criteria are:
• Criterion 1 Hours of Exceedance (He): The number of hours (He) that ∆T is greater than or equal to one degree (K) during the period May to September inclusive shall not exceed 3%.
• Criterion 2 Daily Weighted Exceedance (We): To allow for the severity of overheating the weighted exceedance (We) shall be less than or equal to 6 in any one day where:
𝑊𝑊𝑒𝑒 = ��ℎ𝑒𝑒� × 𝑊𝑊𝑊𝑊 = (ℎ𝑒𝑒0 × 0) + (ℎ𝑒𝑒1 × 1) + (ℎ𝑒𝑒2 × 2) + (ℎ𝑒𝑒3 × 3)
Where the weighting factor WF = 0 if ∆T ≤ 0, otherwise WF = ∆T, and hey is the time (h) when WF = y.
• Criterion 3 Upper Limit Temperature (Tupp): To set an absolute maximum value for the indoor operative temperature the value of ∆T shall not exceed 4K.
These criteria apply during the occupied hours of a typical non-heating season (May to September inclusive) and a room is deemed to overheat if any two of the three criteria are not met, i.e. compliance with CIBSE TM52 is achieved when 2 of the 3 criteria are met.
The CIBSE TM52 criteria 1, 2 and 3 results were collated for each of the short-listed measures.

Cooling in the UK
70
Assessing the Cost-Effectiveness of Cooling Measures To compare the effectiveness of each measure, a single metric combining the CIBSE TM52 criteria 1, 2 and 3 results for each measure was created following the below method:
• The CIBSE TM52 criteria 1, 2 and 3 results were individually normalised against the baseline result for the building type, such that an improvement against the baseline would report a normalised result less than one, whilst a poorer performing measure would score greater than one.
• The individual normalised criteria scores were added together, such that the baseline model had a total normalised result of 3 (i.e. a score of 1 for each of criteria 1, 2 and 3). This equally weights each of the three criteria.
• Each measure was compared to the baseline by subtracting its total normalised result from the baseline, such that a positive score represented an improved CIBSE TM52 performance (i.e. less overheating than the baseline) whilst a negative result represented a poorer CIBSE TM52 performance (i.e. more overheating than the baseline). Measures that match the baseline performance achieve a score of zero whilst measures that achieve zero against all three criteria (e.g. fixed cooling systems) achieve a maximum score of three.
In addition to comparing the CIBSE TM52 performance, the total additional capital cost (CAPEX) associated with adopting each measure was determined; see details in Appendix C: Description of Modelled Passive Measures. A high-level evaluation of whether the measure would lead to an increase in operational cost (OPEX) was also recorded. The impact on OPEX was recorded as either:
• “+” for those measures that lead to an increase in OPEX (those including additional fans or active cooling),
• “0” for those measures that do not increase OPEX (passive measures),
• “-” for those measures that reduce OPEX (e.g. reduced internal gains).
4.1.4 Deriving the Non-Domestic Packages A & B
The effect of each modelled measure, when applied to the office and assessed against the CIBSE TM52 criteria, were scored as described in the previous section. The following measures, which were found to reduce the CIBSE TM52 performance compared to the baseline, were excluded from any further analysis:
• Improving the glazing U-value to 1.8W/m²K or 1.6W/m²K: Improving the glazing U-value beyond the level included in the baseline model was found to reduce the CIBSE TM52 performance of the office; as although this change reduces the conduction heat gains through the glazing from the outside when the external temperature is greater than internal temperatures, which would benefit thermal comfort performance, it also has the effect of reducing conduction losses through the windows during periods when the internal temperatures are greater than external, which is detrimental to thermal comfort. For the sample building it was found that the detrimental impact of heat gains

Cooling in the UK
71
from being ‘trapped’ inside outweighed the beneficial impact of reduced external conduction gains. It should be noted that this finding is a function of the thermal characteristics of the sample buildings and in some instances these measures may improve thermal comfort. Another measure that was considered is the effect of replacing windows with units with a lower U-value and G-value. The combined effect of these two improvements was found to be to reduce thermal comfort levels in the two sample buildings. In response to this, the analysis considered the effect of improving the G-value without changing the U-value, and this improved the thermal comfort performance but is more expensive than retrofitting a solar control film to an existing window (which is separately included in the list of measures).
• Ceiling and Desk Fans: By adding ceiling or desk fans, this increases the internal air speed which provides a cooling effect for occupants. However, in the case of the office, it was found that the increased heat gains from the ceiling and desk fans outweighed the benefit of the increased air speed, leading to an overall reduction in CIBSE TM52 performance.
For those measures that were found to improve the CIBSE TM52 performance, their scores were plotted against the additional CAPEX associated with that measure, as shown in Figure 11, Figure 12 and Figure 13. Capital rather than operational cost was used as the comparator as it is felt that capital cost is generally a stronger influence on the key decision makers in most cases. The operational cost of cooling systems is often unknown as systems are seldom sub-metered and maintenance regimes may vary from annual servicing and pre-emptive maintenance through to reactive maintenance.
Figure 11: CIBSE TM52 Improvement vs Increased CAPEX for Mid-Floor Office

Cooling in the UK
72
Figure 11 illustrates the increased CAPEX versus the CIBSE TM52 improvement for all measures that improve the overheating performance. Figure 12, below, is an extract of Figure 11, as illustrated by the yellow shaded zone, which shows those measures that have lower calculated CAPEX than a fixed air-conditioning system.
Figure 12: Extract from Figure 11 showing CIBSE TM52 Improvement vs Increased CAPEX for Mid-Floor Office

Cooling in the UK
73
Figure 13: CIBSE TM52 Improvement vs Increased CAPEX for Top-Floor Office
It is seen in Figure 12 and Figure 13 that the portable and fixed cooling achieve the greatest CIBSE TM52 improvements, achieving CIBSE TM52 improvement scores of 2.9 and 3.0 respectively. Portable cooling units are generally less efficient than fixed systems and so will have higher running costs if providing the same quantity of cooling.
Connecting the origin of the graph, which represents the baseline performance, to the portable and fixed cooling points results in two lines as shown in green and purple, respectively, on the graph. The gradients of these lines represent the CIBSE TM52 improvement per £ CAPEX, and for the purposes of this study are considered to be the envelopes of Package A (below the green line) and Passive Package B (below the purple line).
Package A for the office includes measures that are found to achieve a cost effectiveness up to (and including) that of the most cost-effective form of active cooling (portable cooling units). These measures are:
• Portable Cooling Units;
• Standard Window Openings;
• Mixed Mode Ventilation.
Only two measures were found to be more cost effective than portable cooling units. These measures both relate to ventilation and are mutually exclusive. As the mixed mode approach is shown to have a greater effect, this is taken to be the preferred solution. This mixed mode approach is compatible with portable cooling if the following approach is taken for Package A for non-domestic buildings:

Cooling in the UK
74
• Cold weather/heating season: Mechanical ventilation only.
• Mid-season: Natural ventilation only.
• Hot weather/cooling season: Portable cooling units and mechanical ventilation (no natural ventilation).
It seems likely that, if a non-domestic building becomes warm, existing opening windows would be used as a means of cooling the building even if mechanical ventilation is present. There may be exceptions to this where natural ventilation presents challenges such as concerns over safety, security, noise and/or air quality, however in most cases a degree of window opening may be acceptable.
Figure 12 shows that, night purging is only slightly less cost effective than portable cooling. In discussion with BEIS, it was agreed that given this small shortfall, which is within the margin for error, night purging should be included in Package A.
Passive Package B for the office includes measures that provide a lower overall CIBSE TM52 improvement than fixed cooling but are more cost effective in terms of their CIBSE TM52 Improvement per £ CAPEX. These measures are those passive measures included in Package A plus:
• Night Purge Ventilation (using base case mechanical ventilation system);
• Manual Internal Blinds;
• Shading Film on windows.
Considering the compatibility of all the passive measures included in Package A and the additional passive measures listed above, the following approach is recommended for Passive Package B:
• Cold weather/heating season: Mechanical ventilation only.
• Mid-season: Natural ventilation only.
• Hot weather/cooling season: Mixed mode; mechanical ventilation and natural ventilation (no active cooling) Mixed mode as described in Table 10 using the standard window opening sizes (i.e. not increased from the base case).
• All year:
o Night purge mechanical ventilation to operate if internal temperature is above 22°C and outside temperature is lower than internal temperature (all windows securely shut);
o Manual internal blinds;
o Shading film applied to windows.

Cooling in the UK
75
4.1.5 Deriving the Domestic Packages A & B
The effect of each of the modelled measures for the dwelling on the CIBSE TM52 performance were scored as described in the previous section, with any measures found to reduce the CIBSE TM52 performance excluded from any further analysis. The measures excluded were:
• Improving the glazing U-value to 1.8W/m²K or 1.6W/m²K: As was found to be the case in the office, improving the glazing U-value to 1.8W/m²K or 1.6W/m²K caused a reduction in CIBSE TM52 performance in the living room. For a full commentary on this effect, refer to Section 4.1.4.
• Tempered Mechanical Ventilation: The mechanical ventilation flow rate assumed within this assessment was that required for the whole dwelling ventilation rate from Approved Document F of the Building Regulations. The supplied air was modelled as being tempered/cooled to 22°C whenever the outside temperature exceeds this level. This flow rate was found to be too low to provide significant cooling to the dwelling, to the extent that a greater cooling effect could be achieved through opening windows. Increasing the tempered mechanical ventilation flow rate to a higher flow rate is analogous to installing fixed cooling. Combining tempered mechanical ventilation with natural ventilation undermines the effectiveness of the cooling provided.
For those measures that were found to improve the CIBSE TM52 performance, these scores were plotted against the additional CAPEX associated with that measure, as shown in Figure 14:
Figure 14: CIBSE TM52 Improvement vs Increased CAPEX for Living Room
Figure 14 illustrates the increased CAPEX versus the CIBSE TM52 improvement for all measures that improve the overheating performance. Figure 15, is an extract of Figure 14, as

Cooling in the UK
76
illustrated by the yellow shaded zone, which shows those measures that have lower calculated CAPEX than a fixed cooling system.
Figure 15 Extract from Figure 14 showing CIBSE TM52 Improvement vs Increased CAPEX for Living Room
As for the office building, the origin of the graph, which represents the baseline performance, was connected to the portable and fixed cooling points to result in two lines as shown in green and purple, respectively, on the graph. The gradients of these lines represent the CIBSE TM52 improvement per £ CAPEX, and for the purposes of this study are considered to be the envelopes of Package A (below the green line) and Passive Package B (below the purple line).
• Package A is intended to comprise low cost, low disruption convenient measures. The Delta-EE research suggests that strong growth in domestic cooling is expected and likely to commence with portable cooling. They are also the most cost-effective form of active cooling. Hence a key question here for deriving Package A is whether there are reasonable passive alternatives to portable cooling or whether Package A includes portable cooling with potentially passive measures as well.
• Passive Package B comprises passive measures only. For the purpose of this analysis, it is assumed that the measures should be at least as capital cost-effective as fixed cooling. We recognise that a true measure of cost-effectiveness would account for the operating costs, albeit householders tend to focus more on the upfront capital cost.
Potential measures for Package A for the dwelling include measures that are found to achieve a cost effectiveness up to (and including) that of portable cooling units. These measures are:
• Portable Cooling Units;

Cooling in the UK
77
• Manual Internal Blinds;
• Night Purge (securely opening windows to 5% over night);
• Shading Film on windows;
• Ceiling Fans,
• Desk Fans.
Ceiling fans and desk fans both achieve improved thermal comfort by increasing air velocity. It is therefore difficult to combine their effects without diminished returns and potentially causing discomfort by increasing air velocity too much and noise etc. Modelling suggests that desk fans achieve a greater improvement to thermal comfort at a slightly lower capital cost. Therefore, Package A includes all the measures listed above except ceiling fans.
We considered several ways to derive Package A from the results above:
1. Portable cooling units plus cost effective passive measures: Residents use all the measures listed above in combination. This suggests a well-informed decision maker with an understanding of the relative costs and benefits of the measures available.
2. Portable cooling units only: Residents do not deploy any passive measures but simply purchase portable cooling units. This suggests a lack of awareness of passive measures, a lack of concern over running costs and carbon emissions and/or an unwillingness to adopt any passive measures.
3. Cost effective passive measures only: Residents make use of passive measures which are shown to be more cost effective than portable cooling units but stop short of using any active cooling system. This suggests the decision maker is well informed and concerned about running costs and/or carbon emissions from active measures.
4. Portable cooling units plus simple passive measures: Residents adopt the most widely understood cost effective passive measures in combination with portable cooling units. From the list above this is taken to be use of blinds/curtains, night purging through opening windows (both of which are already in place so would simply be used differently) and desk fan(s). Solar control film would be omitted from this list as residents may not be aware of it, may not accept the change to the appearance of the windows (especially given that this would be in place throughout the year) and may not feel able to install the film adequately.
5. Simple passive measures (without portable cooling): This would be the same as the previous option but with portable cooling omitted.
Some residents may move through a succession of the options listed above, for example from 5 to 4, or from 5 to 3 to 1. Any of these options could be justified, however for the purposes of this analysis, it was agreed with BEIS to adopt option 4.
Passive Package B for the dwelling includes measures that provide a lower overall CIBSE TM52 improvement than fixed cooling but are more cost effective in terms of their CIBSE TM52

Cooling in the UK
78
Improvement per £ CAPEX. As automatic blinds and manual blinds are mutually exclusive, Passive Package B omits the automatic blinds. Therefore, Passive Package B consists of the passive measures from Package A plus:
• Reflective walls;
• Mixed mode ventilation.

Cooling in the UK
79
4.1.6 Summary of Packages
Table 11 summarises the packages used in the analysis as derived in Sections 4.1.4 and 4.1.5.
Table 11: Summary of packages
Non-domestic Domestic
Business as Usual
• Mechanical Ventilation. • Natural Ventilation.
Package A
• Portable Cooling Units;
• Night Purge Ventilation (using base case mechanical ventilation system);
• Mixed Mode Ventilation (adapted to work with cooling).
• Portable Cooling Unit(s);
• Manual Internal Blinds;
• Night Purge (securely opening windows to 5% over night);
• Desk Fans.
Passive Package B
• Night Purge Ventilation (using base case mechanical ventilation system);
• Mixed Mode Ventilation;
• Manual Internal Blinds;
• Shading Film on windows.
• Manual Internal Blinds;
• Night Purge (securely opening windows to 5% over night);
• Desk Fans;
• Shading Film on windows;
• Reflective Walls;
• Mixed Mode Ventilation.
Package A & Fixed Cooling
• Night Purge Ventilation (using base case mechanical ventilation system);
• Mixed Mode Ventilation (adapted to work with cooling);
• Fixed Cooling System.
• Manual Internal Blinds;
• Night Purge (securely opening windows to 5% over night);
• Desk Fans;
• Fixed Cooling System.
Passive Package B & Fixed Cooling
• Night Purge Ventilation (using base case mechanical ventilation system);
• Mixed Mode Ventilation (adapted to work with cooling);
• Manual Internal Blinds;
• Shading Film on windows;
• Fixed Cooling System.
• Manual Internal Blinds;
• Night Purge (securely opening windows to 5% over night);
• Desk Fans.
• Shading Film on windows;
• Reflective Walls
• Mixed Mode Ventilation;
• Fixed Cooling System.

Cooling in the UK
80
4.2 Costs of Packages
Appendix C: Description of Modelled Passive Measures includes estimated costs for all the shortlisted measures that were modelled on the two sample rooms (a domestic living room and a commercial office space). Table 12 and Table 13 show the costs of the individual measures selected for the five packages.
To derive capital costs, quotations from individual suppliers have been obtained where possible, and rates have been built up with labour constants / rates to arrive at a total rate per item / unit. If this was not possible then costs have been applied from Spons 2020 for items or a similar spec. All costs have been adjusted for typical Contractor ‘on costs’ including a 13% additional for Prelims / OH+P, except for domestic measures where occupants are likely to implement measures themselves, such as replacing light bulbs. Cost rates used have also been gauged from recent live projects / tenders received, with any necessary index adjustment made for average / inflation. This costing exercise does not use any projected future reductions in technology costs due to the high degree of uncertainty around this.

Cooling in the UK
81
Table 12: Description and estimated costs of measures selected for domestic packages
Measure Description
CAPEX for Domestic Room (£)
CAPEX for Domestic Room (£/m²)
Portable Cooling Units
A commercially available cooling unit, with a rated cooling capacity of 2.06kW.
£275 £13.73
Internal Blinds
Internal blinds manually operated to control solar gains during daytime. This is assumed to be a no-cost behaviour change as baseline building will include blinds or curtains.
£0 £0.00
Night Purging
During the occupied period, the windows open as per the Standard Window Openings option. Outside of the occupied period, windows are assumed to open to 5% of their maximum extent, as may be provided by a secure locked opening position, when the internal air temperature is greater than 22ºC. This is assumed to be a no-cost behaviour change
£0 £0.00
Portable/ Desk Fans
A desk fan is assumed to increase the summer elevated air speed thus improving thermal comfort.
£25 £1.25
Shading Films applied to Glazing
The shading film is assumed to reduce the g-value of the glazing to 23%.
£123 £6.14
Reflective Walls
A beige reflective coating is modelled on the external walls. This is modelled with a reflectance of 45%.
£114 £5.69
Mixed Mode
The mechanical ventilation operates, and windows are assumed to open when the internal air temperature is greater than 24ºC. Window openings are as per the Standard Window Opening Option.
£159 £7.94
Fixed Cooling
It is assumed that the fixed cooling is sized sufficiently to meet the cooling demands from the building.
£1,234 £61.61

Cooling in the UK
82
Table 13: Description and estimated costs of measures selected for non-domestic packages
Measure Description for Non-Domestic Building
CAPEX for Non-Domestic Building (£)
CAPEX for Non-Domestic Building (£/m²)
Portable Cooling Units
A commercially available cooling unit, with a rated cooling capacity of 2.86kW. Portable cooling units are assumed to be located in the perimeter zones of the sample office building model only. It was assumed that one unit would be provided per seating bay; where a seating bay was assumed to be 4m wide.
£8,800 £52.38
Night Purging
During the occupied period, the mechanical ventilation operates as normal. Outside of the occupied hours, mechanical ventilation operates if the internal air temperature is greater than 22ºC.
£1,627 £9.68
Mixed Mode
Opening windows operate as normal. Mechanical ventilation operates when the internal air temperature is greater than 26ºC during the occupied period.
£1,627 £9.68
Internal Blinds
Internal blinds manually operated to control solar gains during daytime.
£10,460 £62.26
Shading Films applied to Glazing
The shading film is assumed to reduce the g-value of the glazing to 23%.
£3,815 £22.71
Fixed Cooling
It is assumed that the fixed cooling is sized sufficiently to meet the cooling demands from the building.
£53,449 £318.15

Cooling in the UK
83
The total costs for each package of measures is shown in Table 14 and Table 15. In both domestic and non-domestic cases, package A is lower cost than package B and fixed cooling is the highest cost single measure by a considerable margin.
Table 14: Calculated costs of domestic packages
Measure
CAPEX for Domestic Room (£)
Package A Package A plus fixed cooling
Package B Package B plus fixed cooling
Portable Cooling Units
£275
Internal Blinds £0
Night Purging £0
Portable/Desk Fans
£25
Shading Films applied to Glazing
£123
Reflective Walls
£114
Mixed Mode £159
Fixed Cooling £1,234
Package total (£): £300 £1,259 £421 £1,655
Package total (£/m²): £14.98 £62.85 £21.02 £82.62

Cooling in the UK
84
Table 15: Calculated costs of non-domestic packages
Measure
CAPEX for Non-Domestic Building (£)
Package A Package A plus fixed cooling
Package B Package B plus fixed cooling
Portable Cooling Units
£8,800
Night Purging £1,627
Mixed Mode £1,627
Internal Blinds £10,460
Shading Films applied to Glazing
£3,815
Fixed Cooling £53,449
Package total: £12,054 £56,703 £17,529 £70,978
Package total (£/m²): £71.75 £337.52 £104.34 £422.49
4.3 Barriers to Deployment of Measures
As previously described in Section 2.5, there are many barriers that can impact the deployment of different cooling technologies. A preliminary review of these barriers helped to identify those technologies that can be adopted within many different building types, and it was these that were short-listed to assess their cost-effectiveness at improving thermal comfort conditions as described previously within this section.
4.3.1 Domestic Package A
The measures included within package A comprised portable cooling units, manual internal blinds, night purge ventilation and desk fans.
The following points summarise some of the key barriers that may be experienced in implementing this package:
• As it is necessary to exhaust the hot air from a portable cooling unit via an exhaust hose, ideally through an opening window or door to outside, this can limit the areas in which portable cooling can be utilised. These barriers associated with adopting portable air conditioners in dwellings are broadly similar to those experienced in non-domestic

Cooling in the UK
85
buildings (see Section 4.3.3). However, rooms in dwellings tend to be smaller and so the need for several units in one room, as well as providing an exhaust air path, will be reduced.
• The additional noise associated with portable cooling units present a particular challenge for bedrooms, where occupants may be unwilling to use them overnight for fear of disturbing their sleep.
• Similarly, desk fans may experience similar barriers to their use in bedrooms, if users find them too noisy to sleep. There may also be issues associated with finding an appropriate position to locate a desk fan where occupants can experience a pleasant level of air movement, without it feeling draughty.
• Internal blinds can generally be included on most windows, though there may be occasions where occupants are less likely to use the blinds; for example, if blinds are in front of opening windows users may be less likely to close blinds when the windows are open, since this is likely to lead to the blinds fluttering.
4.3.2 Domestic Package B
Package B included manual internal blinds, desk fans, shading film on windows, reflective walls and mixed mode ventilation.
The barriers associated with manual internal blinds and desk fans are as described for Package A. The following describes additional key barriers to adoption of the other Package B measures:
• With regards to solar control film in the domestic sector, one of the key barriers to its deployment is an unawareness of the product within the wider population. Furthermore, occupants may be unwilling to install it owing to the change in appearance to the window and may feel that they are unable to install the film adequately. Occupants may also be reluctant to undertake a measure that is present year-round and thus reduced daylight levels and useful solar heat gain in cooler months.
• Adding a reflective wall coating is likely to experience similar barriers as solar control glazing films, whereby the wider population are unlikely to be aware of this product. In addition, it is likely that the coating would require professional installation which may discourage some householders from adopting this technology. Furthermore, as is the case for glazing shading films, the change in their house’s appearance as a result of applying a light coloured reflective wall coating may dissuade some householders from using this technology, since depending on the architectural style of housing in their street, applying a light coloured reflective coating may make their house ‘stand out’.
• To adopt a mixed mode ventilation strategy, it will be necessary to find space for the mechanical ventilation plant, and potentially ductwork. Householders may find the installation prohibitively disruptive, requiring work in many rooms of the house in order to site ventilation grilles, which may dissuade them from proceeding with installation.

Cooling in the UK
86
4.3.3 Non-Domestic Package A
The measures included within package A are portable cooling units, mixed mode ventilation and night purging.
The following points summarise some of the key barriers that may be experienced in implementing this package:
• As it is necessary to exhaust the hot air from a portable cooling unit via an exhaust hose, ideally through an opening window or door to outside, this can limit the areas in which portable cooling can be utilised. If the building has a large number of internal spaces, this may make portable cooling unfeasible for inclusion.
• On a related note to above, in large spaces where it may be necessary to use several portable cooling units to meet the cooling demand, this will require several exhaust hoses to be positioned. Depending on the function of the space, this may be difficult to coordinate with existing furniture and access routes and therefore may reduce the likelihood that portable cooling units are used, or lead to them being badly positioned, reducing their effectiveness at servicing the whole area.
• Furthermore, portable cooling units can be noisy during operation, which may make them unsuitable for some building types. Users may be accepting of the additional noise for short periods of very hot weather, but they may not find them acceptable for long term use.
• Adoption of a mixed mode, and night purge, ventilation strategy requires space for mechanical ventilation units to be found. This may be possible for new build, provided the decision is taken early enough to coordinate with the architectural design, but it may be difficult to retrofit this into some particularly congested buildings.
4.3.4 Non-Domestic Package B
Package B includes night purge ventilation, mixed mode ventilation, manual internal blinds and shading film.
The barriers to adopting night purge and mixed mode ventilation are as described in Package A. The following describes additional key barriers to adoption of the other Package B measures:
• Internal blinds can generally be included on most windows, though there may be occasions where occupants are less likely to use the blinds; for example, if blinds are in front of opening windows users may be less likely to close blinds when the windows are open, since this is likely to lead to the blinds fluttering.
• The installation of a shading film on the glazing may impact the appearance of the building, which may be unacceptable in some applications. It is also likely that professional installation will be required to achieve a good level of finish. Occupants may also be reluctant to undertake a measure that is present year-round and thus reduced daylight levels and useful solar heat gain in cooler months.

Cooling in the UK
87
5. Impacts of Alternative Policy Scenarios This section evaluates and compares the three alternative policy/deployment scenarios developed in Section 4 to mitigate for the increased cooling demand. This section describes modelling undertaken to quantify the energy demand for each deployment scenario until 2100 for two climate scenarios. The impact on daily and annual cooling energy demand is presented for the UK, broken down by country and by sector. The costs of implementation for the different policy scenarios are also presented at a national level. Synergies with other energy uses and across sectors is commented upon to help align potential policy interventions.
5.1 Overview of Modelling
To represent the varied nature of the UK building stock, twelve archetype buildings were selected in agreement with BEIS. The selection of archetypes sought to represent the broad range of domestic and non-domestic building types. The selected archetypes include six dwellings and six non-domestic buildings; three of the twelve are intended to reflect current new build fabric standards whilst the remainder are based on older standards given the greater prevalence of existing buildings in the UK building stock. Representative models were developed to reflect each of these archetypes; see details in Table 16 and Appendix E: Modelling Packages of Measures. All the archetypes were assumed to have conventional fossil-fuelled boiler systems for space heating. Most of the baseline archetypes were modelled as having no cooling, the exception to this is some areas of the hospital archetype where there was deemed to be a clinical need for cooling (medical imaging etc.). Five versions of each of these modelled archetypes was created, to reflect each of the five packages respectively:
• Business-as-usual (BAU);
• Package A (inc. portable cooling);
• Passive package B;
• Package A with fixed cooling replacing portable cooling;
• Passive package B with fixed cooling.

Cooling in the UK
88
Table 16: Description of 12 building archetypes modelled
Sector Ref. Status Type Fabric Standards Occupancy/Use
Dom
estic
1 Existing Detached house Part L 1995 In during day inc. homeworking
2 Existing Semi-detached/end-terrace house
1960s with cavity wall insulation retrofitted
In during day inc. homeworking
3 New Semi-detached/end-terrace house
Part L1A 2013 In during day inc. homeworking
4 Existing Mid-terrace house Pre-1919, solid brick walls, loft insulation retrofitted
In during day inc. homeworking
5 Existing Mid floor flat Part L 1995 Out during day
6 New Mid floor flat Part L1A 2013 Out during day
Non
-Dom
estic
7 Existing Shallow-plan office Part L 1995
National Calculation Methodology (NCM)43
8 Existing Hospital Part L 1995
9 Existing Multi-residential building
Part L 1995
10 Existing School Part L 1995
11 New School Part L2A 2013
12 Existing Distribution warehouse
Part L 1995
The baseline or business-as-usual (BAU) models for all the selected archetypes are non-cooled with the exception of some rooms in the hospital which were deemed to require cooling due to high internal gains or clinical requirements. This approach was agreed with BEIS at the start of the analysis with the aim of focussing the analysis on the potential increase in cooling demand from the installation of active cooling systems in buildings where this is not currently present.
All of these resulting models were then simulated multiple times using dynamic thermal modelling software (IES-VE). Weather files were created specifically for this research study using the method described in Section 5.1.1:
43 The National Calculation Method (NCM) is defined by the Ministry for Housing Communities and Local Government (MHCLG). It describes the procedure for demonstrating compliance with the carbon emission requirements of Part L of the Building Regulations and for calculating ‘operational ratings’ and ‘asset ratings’ in the production of Energy Performance Certificates (EPC’s) for buildings other than dwellings. The NCM contains a standard set of assumed profiles for building use, occupancy, internal gains etc. for a wide variety of non-domestic room types and buildings.

Cooling in the UK
89
• 4 locations:
o London;
o Cardiff;
o Belfast;
o Glasgow.
• 2 emissions scenarios:
o Low emissions, projected to reach a mean global temperature rise of 1.5°C by 2081-2100;
o High emissions, projected to reach a mean global temperature rise of 4.0°C by 2081-2100.
• 5 time horizons (dynamic thermal modelling was undertaken for 5 time horizons, but the spreadsheet post-processing tool creates outputs for a larger number as described in Section 5.1.1):
o 2025;
o 2035;
o 2045;
o 2055;
o 2075.
• 2 weather types:
o Test reference year (TRY) deemed to be typical;
o Design summer year (DSY1) deemed to be warmer than average.
The following selected modelling results were then collated for each individual archetype for each of these simulations:
• Thermal comfort performance (based on CIBSE TM52, see Section 5.1) using the TRY weather.
• Half-hourly modelled heating and cooling demand profiles for:
o Average spring week (TRY);
o Average summer week (TRY);
o Average autumn week (TRY);
o Average winter week (TRY);
o Heat wave (DSY1).
• Peak heating and cooling demand (TRY).
• Annual total heating and cooling demand (TRY).

Cooling in the UK
90
All of these results were collated into a single spreadsheet tool for post-processing. Post processing included:
• Calculating energy required by heating and cooling systems (i.e. accounting for plant and system efficiencies defined in Section 5.4.2).
• Extrapolating demands to reflect national building stock profiles44.
• Interpolating and extrapolating results to reflect all years between 2020 and 2100.
• Blending results from different packages to reflect the modelled transition of the building stock from one package to the next in each deployment scenario, see Section 5.2.
Section 5.4 shows selected results from this analysis. This spreadsheet tool is provided to BEIS along with the raw modelling results to facilitate further analysis.
5.1.1 Future Weather Files
Climate Change Scenarios For this project, we used the new UKCP18 probabilistic projections with a baseline of 1981-2010. Future weather files were developed specifically for this research project using two climate change scenarios:
• The RCP2.6 scenario, which is representative of the highest mitigation scenario. This has a mean change in temperature of around 1.5°C by 2081-2100.
• The RCP8.5 scenario, which is representative of where greenhouse gas emissions continue to grow largely unmitigated. This has a mean change in temperature of around 4°C by 2081-2100.
The weather files do not account for urban heat island effects as these are highly variable. Similarly, no attempt has been made to include this influence in the modelling or post processing. If this factor was to be included in the analysis then this would increase the projected cooling demands. However, the extent to which the cooling demand would increase is difficult to estimate as it will be a function of many different factors such as the proportion of the population living in cities and urban design.
Base Weather Industry standard weather files are widely used to inform the potential energy demand of buildings. These take the form of Test Reference Years (TRYs) and probabilistic Design Summer Years (pDSYs). A TRY is a single year which has been developed to represent the historic average (typically based on 20 years or more of weather data). Such data is regularly
44 Building stock profiles were derived from data contained in the English Housing Survey 2019 to 2020 (https://www.gov.uk/government/statistics/english-housing-survey-2019-to-2020-headline-report ) and the Non-domestic National Energy Efficiency Data Framework (ND-NEED) 2020 (https://www.gov.uk/government/statistics/non-domestic-national-energy-efficiency-data-framework-nd-need-2020 ). Where data sets did not cover the whole of the UK or where a national breakdown was required, data was prorated on the basis of population data from the Office for National Statistics 2019 estimates (https://www.ons.gov.uk/peoplepopulationandcommunity/populationandmigration/populationestimates/bulletins/annualmidyearpopulationestimates/mid2019estimates )

Cooling in the UK
91
used to estimate the average consumption of buildings45. They are widely used to estimate the average energy consumption of buildings. A DSY is a single year which comprises a warmer than average year and can be used to assess the risk of overheating. CIBSE’s DSY1 has a 1-in-7 year return period with DSY2 and DSY3 being more extreme46. For the purpose of this project we have used both TRY and DSY1 weather data.
Future Weather To create future weather files, the morphing methodology was used to transform the base weather files into future weather files47. This is the methodology used by CIBSE to produce its most recent future weather files based on UKCP09 48. This comprises a set of algorithms to transform the underlying weather into future weather dependant on the changes in the climate as represented by the UKCP18 probabilistic projections. We directly modified the dry bulb temperature, short wave radiation flux, cloud cover and air pressure using these algorithms into future weather data. Relative humidity is not an output from the climate change scenarios but is important for thermal comfort and the impact on dehumidification so we firstly morphed the specific humidity and then calculated the humidity form the morphed specific humidity, dry bulb temperature and air pressure49.
Years We created industry standard weather files for building performance analysis for the years 2020, 2025, 2030, 2035, 2040, 2045, 2050, 2055, 2065, 2075, 2085 and 2100. The modelling analysis below uses five of these time horizons namely 2025, 2035, 2045, 2055 and 2075; the post processing tool interpolates and extrapolates using the cooling degree day data from the full set of weather files to create modelling results for all years between 2020 and 2100.
5.2 Modelling Cooling Uptake
The modelling analysis considers three deployment scenarios as described in Section 4 and repeated in Figure 16.
45 Eames, M. E., Ramallo-Gonzalez, A. P. & Wood, M. J. An update of the UK’s test reference year: The implications of a revised climate on building design. Build. Serv. Eng. Res. Technol. 37, 316–333 (2015). 46 Eames, M. E. An update of the UK’s design summer years: Probabilistic design summer years for enhanced overheating risk analysis in building design. Build. Serv. Eng. Res. Technol. 37, (2016). 47 Eames, M., Kershaw, T. & Coley, D. A comparison of future weather created from morphed observed weather and created by a weather generator. Build. Environ. 56, 252–264 (2012). 48 CIBSE weather data. https://www.cibse.org/weatherdata 49 Heard, C., Eames, M., García López, E. & Olivera Villarroel, S. Climate change impact on thermal comfort in Mexico City housing. WEENTECH Proc. Energy 5, 79–91 (2019).

Cooling in the UK
92
Figure 16: Representation of three deployment scenarios each consisting of a progression through packages of passive and active measures showing two distinct transition types (1 and 2)
Each of the deployment scenarios is considered to be a sequence of deploying a package for a period until it is gradually superseded by another package. This progression will be modelled as occurring when the previous package is either no longer achieving sufficient thermal comfort or because it is causing inconvenience. Fixed cooling (included in the later packages) may not be reached if the previous step(s) prove to be sufficiently effective. When considering the national building stock, it is apparent that the owners/occupiers of each building will decide to implement measures at different times; so, at a national level the transition from one package to the next might be considered to be a gradual rather than step change. To reflect this gradual transition, two types of transition curves have been derived. We understand that this is a simplistic interpretation of what will, in reality, be a highly complex response to rising temperatures. However, we consider that this approach is an appropriate way to assess the potential effects of different government policies/strategies and could be refined over time.
For the purposes of this analysis, the transition from one package to the next is generally deemed to be a function of their modelled thermal comfort performance; these transitions are indicated with an orange circle containing the number 1 in Figure 16 and described in Section 5.2.1. However, transitions from portable to fixed cooling systems are deemed to primarily occur when the annual number of hours for which these portable systems are used reaches a point where the occupants resent the inconvenience of factors such as the floor space taken up, noise and the need to empty condensate; these transitions are indicated by a grey circle with a number 2 in Figure 16 and described in Section 5.2.2.
5.2.1 Modelling Transitions Between Business-as-Usual and Packages A/B
This section describes the modelling of the transitions between packages indicated with an orange circle containing the number 1 in Figure 16.
No Intervention
Business-as-Usual:• No
intervention
Package A:• Low cost• Low disruption• Inc. portable
cooling
Active cooling retrofit:• Minimum efficiency• Including benefits of previously-fitted passive
package A
Passive FirstBusiness-as-Usual:• No
intervention
Passive Package B:• Higher cost• Higher disruption
Active cooling retrofit:• High efficiency• Including benefits of previously-
fitted passive package B
Efficient Technologies
Business-as-Usual:• No
intervention
Package A:• Low cost• Low disruption• Inc. portable
cooling
Active cooling retrofit:• High efficiency• Including benefits of previously-fitted passive
package A
Increasing Global Temperatures
1
1
1
1
2
2

Cooling in the UK
93
A previous literature review50 for MHCLG, identified limited information on retrofit rates for cooling based on external weather. Despite limitations, the best information identified was a US study (Sailor et al.) which determined a relationship between active cooling uptake and climate (measured as cooling degree days)51. Figure 17 shows the application of this formula to London weather data (in blue). It suggests that the 2020 market penetration for domestic cooling systems should be as high as 28% in London (and zero in the other three locations modelled by applying their weather data). However research undertaken as part of this study suggests that, although evidence is limited, a much lower figure (perhaps around 3% to 5%) is closer to the current UK domestic market penetration (see Sections 2.1.2 and 2.3). Whilst a detailed investigation into this disparity is outside the scope of this study potential influences may include:
• Economics: The relative prices of domestic cooling equipment and electricity may be lower in the US than in the UK. This may in part be because the market for cooling systems in parts of the US that are warmer than the UK is sufficiently large that a mature US market has developed. This US domestic cooling market can then expand into cooler areas more easily than a market starting from a very low base in the UK.
• Culture: US residents may have a greater expectation of cooling in residential settings. There may be many historical and cultural reasons for this.
• Lag: In the context of a warming climate, because UK dwellings have not historically been deemed to require cooling, it may take several years for cooling deployment to respond to climate change.
In recognition of the discrepancy between the uptake of cooling reported in the US and the UK, the market penetration curve derived by Sailor et al. was modified to better reflect the current UK market penetration, these two curves are shown in Figure 17. The curve has been adjusted to reflect 5% current market penetration in London in 2020 which is at the upper end of current UK-wide estimate provided by the Energy Follow Up Survey 201152 and BSRIA.
50 MHCLG (2019) Research into overheating in new homes: Phase 2 Report. https://www.gov.uk/government/publications/research-into-overheating-in-new-homes 51 Sailor, D.J. and Pavlova A.A. (2001). ‘Air conditioning market saturation and long-term response of residential cooling energy demand to climate change’, Energy, 28 (2003), pp. 941-951 52 https://www.gov.uk/government/statistics/energy-follow-up-survey-efus-2011

Cooling in the UK
94
Figure 17: Idealised relationship between domestic cooling market penetration and cooling degree days (CDD) after Sailor et al. and modified curve used for this study
Using the modified curve described above (Figure 17) the average domestic market penetration of cooling systems was plotted against the average domestic TM52 thermal comfort performance (see Figure 18). The line of best fit through these datapoint was then used to define a relationship between the modelled TM52 thermal comfort performance and the possible uptake of active cooling systems (see equation in Figure 18). This derived relationship was applied to the modelling of each individual archetype under all the weather scenarios to determine the proportion of each archetype where packages either side of the transition (number 1 in Figure 16) at each time horizon.

Cooling in the UK
95
Figure 18: Derived relationship between modelled CIBSE TM52 thermal comfort performance and cooling market penetration
5.2.2 Transition from Portable to Fixed Cooling
This section describes the modelling of the transitions between packages indicated with a grey circle containing the number 2 in Figure 16. This type of transition only occurs where portable cooling units (used in Package A) are being replaced with fixed cooling systems.
Initial modelling showed that the modelled thermal comfort performance achieved by portable and fixed cooling systems is similar (see Sections 4.1.4 and 4.1.5). One effect of this is that, if the transition was modelled using the method described in Section 5.2.1, then portable cooling systems would predominate and very rarely be replaced with fixed systems. This was felt to be unrealistic, so an alternative method was derived as described below.
Delta-EE research (see Appendix F: Current Cooling Market Growth Research Findings) includes the following useful observations about the use of portable cooling units:
Portable cooling systems are the dominant form of cooling in the domestic sector, due to their low cost (low £100s), do not require installation and are easily purchased from well-known online retailers. There has been a large increase in enquiries and sales for portable cooling systems in the last year, potentially due to reasons outlined above as retrofit drivers and also the warm summer.
However, the general consensus from industry stakeholders is that they are a poor solution, being noisy and requiring emptying of condensate, combined with the inconvenience in terms of space and exhaust air handling.
Some industry stakeholders suggested that they are used as a first stepping stone for customers, and generally after a short period of using a portable system and gaining the cooling benefits, many customers will then move onto a permanent cooling solution, predominantly a single split system.

Cooling in the UK
96
The capacity of portable units is more limited than that of fixed cooling systems because:
• There is a practical limit to the number of portable units that can be conveniently accommodated in any room;
• Portable units have a limited distance over which the cooled air output is propelled;
• The capacity of the existing electrical systems in the building will limit the number of units that can safely operate.
Modelling that takes account of these limitations suggests that the levels of comfort achieved by portable units is generally close to that achieved by fixed units for most of the cooling season provided enough portable units can be accommodated whilst not working within constraints such as floor area and electrical capacity of sockets etc. However, Delta-EE research quoted above suggests that building owners’ motives to change from portable to fixed cooling units are multifaceted and could include:
• Higher noise levels from portable units;
• Greater space taken up by portable units (this could include safety and aesthetic concerns);
• Inconvenience of the need to repeatedly empty condensate tanks;
• Higher running costs due to lower efficiencies.
A suitable proxy for all of these considerations could be the either the amount of time that the portable units are required in a typical year (run hours per year) or the amount of cooling that they typically deliver (kWhc/yr). Whilst these two parameters are likely to share a positive correlation, annual run-time is a close proxy for the noise and space considerations whilst annual cooling delivery is a closer proxy for the number of times condensate tanks require emptying and the operational cost. On the basis that many occupants would tolerate a higher operational cost (that they may not be aware of and/or be unable to quantify) in preference to the relatively large upfront cost of a fixed system, the transition away from portable cooling units has been modelled based on the annual run hours rather than cooling delivered. In many cases, the cost of cooling energy may increase if a fixed system is installed that can deliver greater capacity or serves a larger area.
It was agreed with BEIS that the transition curve for domestic buildings covers the range from 100 to 600 run-hours per year. This reflects a range of intermittent use from around 3 weeks to 2 months per year (based on five hours per day and eight hours per day respectively). For non-domestic buildings we consider that the tolerance for the use of portable cooling units will generally be lower/shorter; portable units may be used in non-domestic buildings for a few seasons as a distress-purchase for example. The modelled range for non-domestic buildings is therefore 100 to 200 run-hours per year (based on five 10-hour days per week for two to four weeks). The domestic and non-domestic transitions curves for the switch from portable to fixed cooling systems is shown in Figure 19.

Cooling in the UK
97
Figure 19: Modelled transition curves from portable to fixed cooling systems
5.3 Deployment
Using the transition curves described in Section 5.2, the rate at which building archetype progresses through the different packages has been modelled. Figure 20 and Figure 22 show the progression of buildings in London for the five modelled years using the high emissions scenario (a full set of similar graphs for all four modelled locations and two emissions scenarios can be found in Appendix D: Modelled Transitions). Figure 20 shows the modelled transitions for the “No Intervention” and “Efficient Technologies” deployment scenarios which are the same; the only difference between these two deployment scenarios is the efficiency of the cooling systems. Figure 22 shows similar results for the “Passive First” deployment scenario.
The vertical axes of Figure 20 to Figure 22 show the percentage of the building stock modelled to be using each of the three packages applicable to that deployment scenario; the horizontal axes show the twelve archetypes repeated for each of the five modelled years.

Cooling in the UK
98
Figure 20: London high emissions scenario modelled transition of 12 archetypes for “No Intervention” and “Efficient Technologies” deployment scenarios
Figure 20 shows the use of cooling generally increasing towards the right of the graph, i.e. as time passes. This graph also shows that, in the London high emissions scenario, Package A is not modelled as being in use for any of the archetypes. This is because the climate is sufficiently warm that the amount which a portable cooling unit is used surpasses the range of hours used described in Section 5.2.2 within the first year of its use. However, Figure 21 below and Figure 66 and Figure 74 in Appendix D: Modelled Transitions, which show the results for the other three locations, shows that Package A is modelled as being in use in Cardiff and Glasgow.

Cooling in the UK
99
Figure 21: Cardiff low emissions scenario modelled transition of 12 archetypes for “No Intervention” and “Efficient Technologies” deployment scenarios
Figure 22: London high emissions scenario modelled transition of 12 archetypes for “Passive First” deployment scenario
Figure 22 shows the deployment of Package B generally increasing towards the right of the graph, i.e. as time passes. Similarly, Package B with fixed cooling (shown in orange) is increasingly deployed in later decades.

Cooling in the UK
100
Similar graphs for other emissions scenarios and modelled locations can be found in Appendix D: Modelled Transitions. These indicate that there is limited need for the use of passive and active cooling measures for buildings in Cardiff, Belfast and Glasgow.
5.4 Cooling Effectiveness of Technologies
The modelling results are extensive. A selected sample of the results is included and discussed here. Full results are provided in a spreadsheet tool and raw modelling results are provided as CSV files. The spreadsheet tool provides heating and cooling demands, however the analysis below focusses on cooling.
5.4.1 Cooling Energy Demand
Figure 23 shows the change in modelled total cooling demand for the UK between 2020 and 2100 driven by increased uptake of cooling in response to a warming climate. Trends are shown for two emissions scenarios and three deployment scenarios, however the cooling demands for “No Intervention” and “Efficient Technologies” are the same so only the latter is visible. These two deployment scenarios differ only in terms of the efficiency of the cooling systems used (see Section 5.4.2), so the cooling demands are the same but the cooling energy consumption is different.
All six curves show an upward trend throughout the assessed period. These results show the potential value of adopting passive measures to reduce cooling uptake and demand. Figure 23 suggests that, for the high emissions scenario (4.0°C) the use of passive measures might reduce the UK annual cooling demand by around 32TWh in 2100. Figure 23 shows an increase in the demand for cooling from around 2055; this is associated with a group of archetypes reaching the tipping point where fixed cooling is deployed, this timing of this uptake is sensitive to the deployment assumptions described in Section 5.3.
Analysis in Section 5.4.2 suggest there is a discrepancy between the estimated current UK cooling energy consumption (circa 6,200GWh, see Section 2.1.1) and the 2020 values calculated by the model (which range from 5 to 700GWh). This is to be expected because, as explained in Section 5.1, the business as usual (BAU) models are mostly non-cooled to focus this analysis on the potential increase in cooling demand from the installation of active cooling systems in buildings where they are not currently present. Accounting for cooling system efficiencies the estimated cooling delivered is calculated to be around 15,500GWh whilst the model developed for this research suggests values between 26 and 3,600. UK National Statistics Energy Consumption in the UK data suggests that around 51% of the estimated current UK cooling demand is in office buildings, around 19% in retail and 9% in healthcare (79% in total across these three sectors). It is suspected that the current deployment of cooling in offices and retail spaces in particular is greater than the model suggests; this may be partly because occupant expectations in these spaces is higher and/or building form makes it harder to maintain thermal comfort by other means (for example deep-plan offices and retail units in shopping centres). The data plotted in Figure 23 to Figure 37 have been calibrated such that

Cooling in the UK
101
the 2020 values in the model represent estimated current UK cooling energy demand and consumption.
Figure 23: Modelled annual cooling energy demand for the UK
Figure 24 to Figure 27 show the change in modelled annual cooling demand for the four nations of the UK between 2020 and 2100. This shows that around 98% of the modelled increase in cooling demand is in England. This is partly a function of the relative size of the buildings stock (around 84% of the UK building floor area is in England) and climate (London is the warmest of the four locations modelled)53.
53 For the purposes of the analysis, Cardiff, Belfast and Glasgow have each been assumed to represent the nations in which they are located. However, London is deemed to only represent the South and East of England whilst the modelled results for Cardiff are extrapolated to represent the Midlands and south west and Glasgow used to represent the North of England. The model weights the three weather tapes by dividing England into three regions (South East, Midlands with South West and North) on the basis of the relative floor areas in each of these regions in the English EPC database.

Cooling in the UK
102
Figure 24: Modelled annual cooling energy demand for England Figure 25: Modelled annual cooling energy demand for Wales
Figure 26: Modelled annual cooling energy demand for Northern Ireland
Figure 27: Modelled annual cooling energy demand for Scotland

Cooling in the UK
103
5.4.2 Cooling Energy Consumption to Meet Demand
Cooling energy consumption is calculated by dividing the cooling energy demand by the seasonal efficiency of the cooling system (referred to as the SEER or Seasonal Energy Efficiency Ratio). For the purposes of this study, a range of SEERs has been used to reflect the choice of cooling system used in each deployment scenario. The analysis assumes that the SEERs will improve (increase) as technology improves over the period of the analysis. This assumed rate of increase is based on a trend published by the IEA in the “Future of Cooling” report (2018), which is illustrated in Figure 8 in Section 3.2.1. Table 17 shows the SEERs used for the years 2025 and 2075; the model assumes that these vary linearly between these dates. These values are based on extrapolations from starting values for the year 2020; these starting values are drawn from a combination of the IEA “Future of Cooling” report and market research as indicated below.
Table 17: Summary of cooling SEERs used in analysis
Cooling System 2025 SEER 2075 SEER Basis of Starting Values
No intervention portable cooling
2.40 3.43 Market research of selected products performance data Efficient technologies
portable cooling 2.82 4.03
No intervention fixed cooling
5.22 7.46
IEA “Future of Cooling” (2018) Figure 2.354
Passive first fixed cooling
5.22 7.46
Efficient technologies fixed cooling
9.40 13.43
Figure 28 shows the change in modelled total cooling energy consumption for the UK between 2020 and 2100 driven by increased uptake of cooling in response to a warming climate. Trends are shown for two emissions scenarios and three deployment scenarios. Unlike the graphs shown in Section 5.4.1, Figure 28 shows a difference between the “No Intervention” and “Efficient Technologies”, although the cooling demand is the same for these two scenarios, the difference in cooling SEERs causes a difference in energy consumption.
All six curves show an upward trend throughout the assessed period with the 4.0°C emissions scenarios showing an acceleration towards the end of the century. These results show the potential value of adopting passive measures to reduce energy consumption and of adopting efficient technologies where active cooling is used. Figure 28 suggests that, for the high emissions scenario (4.0°C) the use of efficient technologies might reduce the UK annual cooling energy consumption by around 2.6TWh in 2100 and by adopting a passive first approach around 4.1TWh might be saved by the same time.
54 IEA, ‘The Future of Cooling: Opportunities for energy-efficient air conditioning’ (2018). Available at: https://www.iea.org/reports/the-future-of-cooling

Cooling in the UK
104
Figure 28: Modelled annual cooling energy consumption for the UK
Figure 29 to Figure 32 show the change in modelled annual cooling energy consumption for the four nations of the UK between 2020 and 2100. As was shown in Section 5.4.1, the vast majority of the increased cooling energy consumption is modelled as being in England, again this a function climate and buildings stock size but, unlike cooling load, the energy consumption is also influenced slightly by the different rates at which packages are adopted in the different climatic conditions of each nation.

Cooling in the UK
105
Figure 29: Modelled annual cooling energy consumption for England
Figure 30: Modelled annual cooling energy consumption for Wales
Figure 31: Modelled annual cooling energy consumption for Northern Ireland
Figure 32: Modelled annual cooling energy consumption for Scotland

Cooling in the UK
106
5.4.3 Peak Cooling Power Demand
Figure 33 shows the change in modelled peak cooling power consumption for the UK between 2020 and 2100 driven by increased uptake of cooling in response to a warming climate. Trends are shown for the two emissions scenarios and three deployment scenarios. The peak demand is taken to be the highest half-hourly modelled demand of the simulated year.
All six curves show an upward trend throughout the assessed period with the 4.0°C emissions scenarios showing an acceleration towards the end of the century. As with the power consumption figures in Section 5.4.2, Figure 33 shows the potential value of both adopting passive measures to reduce power consumption and of adopting efficient technologies where active cooling is used. Figure 33 suggests that, for the high emissions scenario (4.0°C), the use of efficient technologies might reduce the UK peak cooling power consumption by around 3.5GW in 2100 and by adopting a passive first approach around 5.1GW might be saved by the same time.
Figure 33: Modelled peak cooling power consumption for the UK
Figure 34 to Figure 37 show the change in modelled peak cooling power consumption for the four nations of the UK between 2020 and 2100. As was shown in Sections 5.4.1 and 5.4.2, the vast majority of the cooling is modelled as being in England primarily due to the effects of climate and buildings stock size. Generally, all these national curves show a similar upward trend. However, the Scottish “No Intervention” and “Efficient Technologies” curves for the low emissions scenario show a slight decline between 2045 and 2055. In some cases, there are reductions in power consumption for part of the century due to the effect of a shift from relatively inefficient portable cooling units to the more efficient fixed cooling systems. However, the overall trend is of increasing power consumption as the effects of warming climate and increased active cooling deployment dominate.

Cooling in the UK
107
Figure 34: Modelled peak cooling power consumption for England
Figure 35: Modelled peak cooling power consumption for Wales
Figure 36: Modelled peak cooling power consumption for Northern Ireland
Figure 37: Modelled peak cooling power consumption for Scotland

Cooling in the UK
108
5.4.4 National Cooling Energy Consumption Profiles
To investigate the different deployment scenarios in more detail, half-hourly profiles were generated for sample weeks for each of the four seasons as well as for a heatwave event. These were generated for both cooling demand and cooling energy consumption.
Sample weeks were selected for each season by the following method:
1. Calculate the average ambient temperature recorded in the Test Reference Year (TRY)55 weather files for each week of the year.
2. Calculate the average ambient temperature for each of the four seasons with each season being deemed to last for three months on the following basis:
a. Spring: March, April and May
b. Summer: June, July and August
c. Autumn: September, October and November
d. Winter: December, January and February
3. The sample week for each season is then taken to be the week falling within the period of that season for which the weekly average temperature is closest to the seasonal average.
The heat wave week (a single week during summer) is taken to be the week in the Design Summer Year (DSY1)56 weather file which has the highest average weekly temperature.
Note that the sample weeks are the same for each time step as the temperature profile is the same shape.
All of the following graphs show significant variations between days of the week. This is indicative of the type of variation that may occur in a sample week as the weather patterns change from one day to the next.
55 TRY weather files are deemed to represent an average year. 56 DSY1 weather files are deemed to be a warmer than average year

Cooling in the UK
109
Comparison of Time Horizons Figure 38 compares the modelled UK half-hourly cooling energy consumption profiles for five different time horizons ranging from 2025 to 2075. These profiles are for the average summer week, the “No Intervention” deployment scenario and high CO2 emissions (4.0°C).
Comparison of these five curves shows the effect of the warming climate, with each successive time horizon showing an increase in the cooling energy consumption. The shape of the cooling energy consumption profile also changes over the time period considered; this reflects the changing uptake of cooling in the twelve different building archetypes (see Section 5.2 for more detailed analysis of this effect).
Figure 38: Half-hourly profiles comparing five time horizons from 2025 to 2075 for the total UK cooling energy consumption across all archetypes for a typical summer week, the “No Intervention” deployment scenario and high CO2 emissions (4.0°C)

Cooling in the UK
110
Comparing Seasons & Heat Wave Figure 39 compares the modelled UK half-hourly cooling energy consumption profiles for a representative week in each of the four seasons and a heat wave event. These profiles are the modelled data for 2035, the “No Intervention” deployment scenario and high CO2 emissions (4.0°C).
Comparison of these five curves shows how the modelled cooling energy consumption changes at different times of year. This suggests that the cooling demand in summer is much higher than at other times of year. During the heat wave event (shown in purple) the peak cooling demand is approximately double that which occurs in the average summer week.
Figure 39: Half-hourly profiles comparing typical weeks for the four seasons and a heat wave event showing the total UK cooling energy consumption across all archetypes for 2035, the “No Intervention” deployment scenario and high CO2 emissions (4.0°C)
Figure 40 compares the modelled UK half-hourly cooling energy consumption profiles for the three different deployment scenarios; “No Intervention”, “Passive First” and “Efficient Technologies”. These profiles are for the 2035 heat wave event and high CO2 emissions (4.0°C).
Comparison of these three curves shows the potential benefits of adopting the “Efficient Technologies” or “Passive First” policy approaches. The peak cooling energy consumption under “Efficient Technologies” is approximately half that of the “No Intervention” approach whilst the peak under the “Passive First” approach is much lower than both of the alternatives.

Cooling in the UK
111
Figure 40: Half-hourly profiles comparing three deployment scenarios for the heat wave event showing the total UK cooling energy consumption across all archetypes for 2035 and high CO2 emissions (4.0°C)
Figure 41 compares the modelled UK half-hourly cooling energy consumption profiles with those of its four constituent nations. These profiles are for the 2075 heat wave event, the “No Intervention” deployment scenario and high CO2 emissions (4.0°C).
Comparison of these five curves shows that the vast majority of the modelled UK cooling demand is in England; this is due to a combination of the English climate being generally warmer than other parts of the UK and because around 84% of the UK building floor area is in England.

Cooling in the UK
112
Figure 41: Half-hourly profiles comparing the UK and its four constituent nations for the heat wave event showing the total cooling energy consumption across all archetypes for 2075, the “No Intervention” deployment scenario and high CO2 emissions (4.0°C)
Figure 42 compares the modelled total UK half-hourly cooling energy consumption profile with those of the domestic and non-domestic building stock. These profiles are for the 2075 heat wave event, the “No Intervention” deployment scenario and high CO2 emissions (4.0°C).
The results for this sample week show that most of the modelled cooling energy consumption is associate with dwellings; this is partly because dwellings account for around 79% of the UK building stock.
Figure 42 also shows the difference in profile shape between domestic and non-domestic buildings. Most non-domestic building are occupied during the working day (8am to 6pm) so their cooling profile peaks during this time. However, dwelling cooling demand tends to peak in the early evening when resident return home and cooling systems are switched on.

Cooling in the UK
113
Figure 42: Half-hourly profiles comparing domestic and non-domestic with the total cooling energy consumption for the UK in the 2075 heat wave event for the “No Intervention” deployment scenario and high CO2 emissions (4.0°C)
Figure 43 focusses on the domestic sector and shows the total English domestic half-hourly cooling energy consumption profile for different dwelling archetypes. These profiles are for the 2075 heat wave event, the “No Intervention” deployment scenario and high CO2 emissions (4.0°C). Six domestic archetypes have been modelled and shows the four which make the largest contribution to the total domestic cooling energy consumption. These archetypes are (see Table 16 in Section 5.1 for further details):
• A01: Existing detached house;
• A02: Existing semi-detached/end-terrace house;
• A05: Existing mid floor flat;
• A06: New mid floor flat. Figure 43 shows that the modelled energy consumption for existing flats makes the greatest contribution to the peak cooling energy consumption but that this demand sometimes occurs over a shorter period than the detached and semi-detached houses. This difference in profile shape is partly due to the differing occupancy patterns that were modelled for these dwelling types, see Table 16 in Section 5.1.

Cooling in the UK
114
Figure 43: Half-hourly profiles comparing domestic total cooling demand with that of four individual domestic archetypes in England in the 2075 heat wave event for the “No Intervention” deployment scenario and high CO2 emissions (4.0°C)
Figure 44 shows the total English non-domestic half-hourly cooling energy consumption profile. These profiles are for the 2075 heat wave event, the “No Intervention” deployment scenario and high CO2 emissions (4.0°C). Six non-domestic archetypes have been modelled and shows the four which make the largest contribution to the total non-domestic cooling energy consumption. These are (see Table 16 in Section 5.1 for further details):
• A07: Existing shallow-plan office;
• A08: Existing hospital;
• A10: Existing school;
• A12: Existing distribution warehouse. Figure 44 shows that the modelled energy consumption for distribution warehouses makes the greatest contribution to the cooling demand and offices make the second largest contribution. This is largely because these two archetypes represent the greatest proportion of the total non-domestic building stock in the model (67% and 24% respectively). Figure 44 also shows the difference in cooling profile between the different archetypes, for example the office profile is zero when the office is unoccupied at the weekend and during cooler weather on the Friday.

Cooling in the UK
115
Figure 44: Half-hourly profiles comparing non-domestic total cooling energy consumption with that of four individual non-domestic archetypes in England in the 2075 heat wave event for the “No Intervention” deployment scenario and high CO2 emissions (4.0°C)

Cooling in the UK
116
5.5 Modelled Space Heating Demands
Whilst the focus of this study has been on the impact of climate change on cooling demands in the UK, the analysis has also provided some insight into how a warming UK climate may impact space heating demands. The modelled effects of the same three deployment scenarios are compared. However, in general, the modelling suggests that there is little difference in space heating demands between these three deployment scenarios; this is thought to be because the measures implemented in each scenario are selected to mitigate cooling demands and mostly have little impact on space heating. Therefore, charts in Sections 5.5.1 and 5.5.2 only show two curves, one representing the three scenarios based on the low (1.5°C) emissions scenario and the other representing the three scenarios based on the high (4.0°C) emissions scenario.
Analysis of these results suggest there is a discrepancy between the estimated current UK heating energy consumption (circa 400TWh57) and the 2020 values calculated by the model (153TWh). This is to be expected because almost all of the modelling choices have been focussed on investigating the impact of the projected warming climate on space cooling (rather than space heating). For example, one of the key modelling decisions that has caused this apparent under estimation of heating demands is the fabric specification of the archetype buildings, with only one of the twelve archetypes having solid walls with no insulation whilst the majority are based on fabric standards in 1995 (see Table 16 on page 88). The data plotted in 5.5.1 have been calibrated such that the 2020 values in the model represent estimated current UK space heating energy demand; peak demands have been adjusted using the same calibration factor but may not be representative of real peak demands (see Section 5.5.2 for details).
5.5.1 Heating Energy Demand
Figure 45 shows the change in modelled total heating demand for the UK between 2020 and 2100 driven by a warming climate. Both of these curves show a downward trend throughout the assessed period. The differences between these heating demand curves is caused by the climatic differences between the low and high emissions scenarios.
This modelling does not attempt to capture the effect of future changes to the energy efficiency of the building stock including energy efficient upgrades and improved energy efficiency standards in buildings (new build and retrofit). Inclusion of the potential such impacts would likely further reduce heating demands below the levels suggested by this analysis.
57 https://www.gov.uk/government/collections/digest-of-uk-energy-statistics-dukes

Cooling in the UK
117
Figure 45: Modelled annual heating energy demand for the UK
Figure 46 to Figure 49 show the change in modelled annual heating demand for the four nations of the UK between 2020 and 2100.
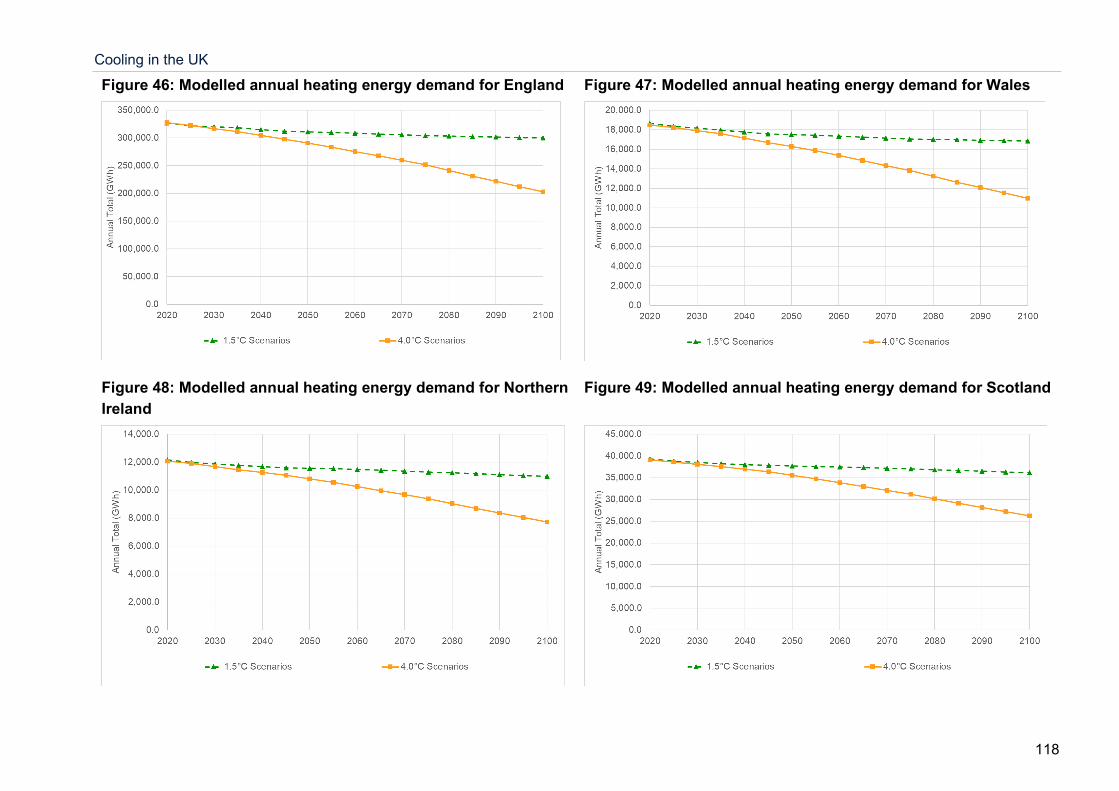
Cooling in the UK
118
Figure 46: Modelled annual heating energy demand for England Figure 47: Modelled annual heating energy demand for Wales
Figure 48: Modelled annual heating energy demand for Northern Ireland
Figure 49: Modelled annual heating energy demand for Scotland

Cooling in the UK
119
5.5.2 Peak Heating Power Demand
Figure 50 shows the change in modelled peak heating power demand for the UK between 2020 and 2100 driven by a warming climate. Trends are shown for the two emissions scenarios, with the results for the three deployment scenarios being similar. The peak demand is calculated by identifying the highest half-hourly modelled demand for the whole simulated year. Both curves show a downward trend throughout the assessed period. The differences between these heating demand curves is caused by the climatic differences between the low and high emissions scenarios.
It is thought likely that these peak demand figures are a significant over-estimate of the reality. One key reason for this is that the heating setpoint templates used for many of the archetype buildings include a step change between night-time setback and daytime temperatures. The effect of this in a simulation is that the peak demand occurs when the heating abruptly raises the temperature from night to daytime setpoints in a single timestep of just a few minutes. Real building heating systems will generally have a smaller capacity than this so will be programmed to warm up the building over a period of an hour or more before occupancy.
Figure 50: Modelled peak heating power consumption for the UK
Figure 51 to Figure 54 show the change in modelled peak heating power consumption for the four nations of the UK between 2020 and 2100.

Cooling in the UK
120
Figure 51: Modelled peak heating power consumption for England
Figure 52: Modelled peak heating power consumption for Wales
Figure 53: Modelled peak heating power consumption for Northern Ireland
Figure 54: Modelled peak heating power consumption for Scotland

Cooling in the UK
121
5.6 Costs & Benefits
Using the cost rates presented in Section 4.2, an indicative capital cost of the retrofitting of cooling solutions (both passive and active) has been calculated for each of the deployment and emissions scenarios. Figure 55 shows the calculated cumulative capital cost of the modelled scenarios for the whole of the UK.
The results suggest that there is a substantial cost saving to be made by the use of a Passive First approach compared to the No Intervention and Efficient Technologies deployment scenarios. The Passive First approach reduces or delays the deployment of the more expensive active cooling measures. The results for No Intervention and Efficiency Technologies show a similar trend with the latter having a higher capital cost (but lower energy use) due to a similar deployment strategy with the exception of more efficient (and more expensive) fixed cooling.
Whilst it is true that active technologies have a higher capital cost (and operational cost) they also provide greater levels of comfort than passive measures. This improved comfort has a material value which may offset the cost of cooling plant to some extent.
This analysis is based on high-level cost data and does not seek to differentiate between the different archetypes (although domestic and non-domestic are distinguished). It is reasonable to expect that the cost of cooling technologies might fall as demand increases and the industry expands in response to this. Section 5.7 discusses potential synergies between cooling and other policy areas; some of these synergies may influence the capital cost of measures where, for example, two technologies are able to share costs when deployed at the same time.
Figure 55: Calculated indicative cumulative capital costs of deployment scenarios for the UK
Reducing the extent to which buildings exceed comfortable temperatures has multiple benefits. For example, high temperatures can have detrimental effects on the health and well-being of

Cooling in the UK
122
occupants as well as their economic productivity. MHCLG’s recent research on overheating looked to identify and quantify the benefits (and costs) of mitigating the risk of overheating in new homes 58.
5.7 Synergies with Other Government Policies
This section includes a high-level review of potential synergies between the cooling mitigation strategies explored in this report and other policy objectives. This is not intended to be a comprehensive review but highlight some key interactions.
5.7.1 Decarbonisation of Heat
The decarbonisation of heat is a key element of the UK strategy to decarbonise the economy as whole and buildings in particular. BEIS estimates that heat accounts for around 37% of UK emissions with space heating and cooling in buildings contributing around 17%59. Three key approaches are being pursued to decarbonise heat in buildings:
• Electrification coupled with renewable electricity generation;
• Use of green gases (hydrogen and biogas);
• District heat networks.
Of these three, electrification and district heat networks both have strong synergies with cooling and are discussed here.
Electrification of Heat The UK electricity grid has decarbonised rapidly over the last five years and is projected to continue this trend. Whilst historically UK electricity was a higher carbon source than mains gas and other fossil fuels, the reverse is now true. This creates the opportunity to decarbonise heat by switching from fossil-fuelled heat generators to electrically powered systems such as direct use of electricity or electric heat pumps. Electric heat pumps are several times more efficient than direct electric systems and therefore achieve greater carbon savings and lower operational costs however their capital cost is much higher.
Current government policies and incentives seek to support the use of hydronic heat pumps (generally air-to-water60) which can readily connect to existing wet heating systems and provide domestic hot water. Some air-to-water heat pumps can provide cooling however this requires a suitable cooling emitter to be connected (such as fan coil units or chilled beams). Most air-to-air heat pumps include the ability to provide both heating and cooling as standard and deliver both through an indoor fan coil unit.
58 MHCLG (2019) Research into overheating in new homes: Phase 2 Report. https://www.gov.uk/government/publications/research-into-overheating-in-new-homes 59 BEIS (2018) Clean Growth – Transforming Heating https://assets.publishing.service.gov.uk/government/uploads/system/uploads/attachment_data/file/766109/decarbonising-heating.pdf (Accessed: 15th April 2021). 60 Other supported technologies include ground-to-water and water-to-water heat pumps.

Cooling in the UK
123
The efficiency of a heat pump is largely influenced by the temperature to which the delivered fluid is being heated; higher delivered temperatures result in lower efficiency. A typical hydronic heat pump system supplying radiators, or a hot water tank, might typically supply water heated to around 50°C61 whereas the indoor unit of an air-to-air heat pump in heating mode would generally supply air at no more than around 30°C. This difference in supply temperature is due to the difference in heat emitter and means that air-to-air heat pumps can be more efficient than hydronic equivalents.
As more buildings have cooling installed over the coming decades there is an opportunity to combine this deployment with the electrification of heating by encouraging the use of air-to-air heat pumps that can deliver both heating and cooling. Two downsides to this approach are:
• Acceleration of cooling uptake: Government interventions that encourage the uptake of air-to-air heat pumps to decarbonise heating will also accelerate the uptake of cooling, thus increasing electricity demands during hot weather, and such systems do not generally supply hot water demands.
• Failure to decarbonise hot water: Air-to-air heat pumps do not have the facility to supply hot water. In many buildings (particularly residential), hot water demands are a significant part of the total heating requirement. Separate measures could be deployed to decarbonise water heating, but this approach may be considered to add complexity in some cases.
District Heat Networks District heat networks (DHNs) supply heat to buildings through the circulation of heated water in insulated pipes running between buildings. Whilst DHNs have higher heat losses and capital costs than stand-alone building heat generation plant, they offer the advantage of access to heat sources that are either remote from or too large for individual buildings, including low carbon heat sources. DHNs also allow for the exchange of energy between buildings, for example waste heat from one building can be used to supply another. UK administrations are actively supporting the development of DHNs as a key part of their decarbonisation strategies.
Traditional DHN systems have been designed to operate at temperatures generally above 70°C. However, there are several drivers to design DHNs to operate at lower temperatures:
• Reduce heat losses from the network;
• Improve efficiency of heat pumps supplying the DHN;
• Use lower temperature heat sources such as waste heat from industrial processes.
Lower temperature networks (referred to as fourth generation DHNs) can be designed to supply water as cool at 45°C. Fifth generation DHNs operate at even lower temperatures and require each individual building to have a heat pump which upgrades heat from the network to supply the building systems; this arrangement allows the building heat pumps to be run in either direction to supply the building with heating or cooling. When operating in cooling mode the building heat pump rejects heat into the DHN which then becomes available to other
61 Underfloor heating systems generally operate at around 35°C.

Cooling in the UK
124
connected buildings which may require heating. An increase in cooling demand across the UK building stock will increase the opportunities for fifth generation DHNs to exchange energy between buildings in this way.
5.7.2 Building Fabric Enhancements
As well as steps to decarbonise heat, UK administrations are progressively requiring greater levels of energy efficiency to reduce the demands for energy use in buildings; this includes improvements to building fabric to reduce heating demands. However, increased insulation levels also have an impact on cooling demands, and can both reduce and increase such demands at different times:
• Where the outside temperature is greater than the cooling set point then increased insulation levels will reduce the cooling demand.
• Where the outside temperature is lower than the cooling set point then increased insulation levels will increase both the scale and duration of any cooling demands. However, this effect can be mitigated to some extend through improved ventilation.
The current UK climate is such that the periods where outside air temperature exceed typical cooling set points (typically around 24°C) are limited, as is the amount by which this threshold is exceeded. This means that increased insulation levels currently tend to increase annual cooling demands (although they may reduce the peak demand). However, as the climate warms, the duration and extent to which outside air temperatures exceed cooling set points will increase. This trend will increase the value of insulation as a means of reducing cooling demands. However, as the climate warms, a parallel reduction in the occurrence of colder temperatures during the heating season may counter, at least to some degree, the benefits of insulation as heating demands are reduced.
In addition, to decarbonise the UK building stock, there is a need to retrofit efficiency and decarbonisation measures to the majority of existing buildings where no other building alterations are planned. This undertaking presents many challenges such as developing a viable economic model for improvements and persuading private building owners to accept the disruption that works will cause. The potential increased need for cooling highlighted through this report presents the following two opportunities:
• Shared costs: The installation of cooling may be coordinated with other works being undertaken to decarbonise buildings. This coordination may create opportunities for some costs to be shared and for efficiencies to be realised during retrofit works. However, there is also the possibility that the added complexity of coordinating cooling retrofit with other measures could increase costs and delays.
• Owner/occupant engagement: Many building owners/occupants are resistant to the disruption associated with decarbonisation retrofit works. This challenge may be effectively countered where the works include measures which offer tangible benefits to the owner/occupant; the addition of cooling may be considered to be one such tangible benefit. As the climate warms the desirability of cooling will increase and thus amplify this benefit to building owners/occupiers.

Cooling in the UK
125
5.7.3 Green & Blue Infrastructure
Green and blue infrastructure such as parks, green roofs and ponds offer a wide range of benefits including increased biodiversity, improved mental health and improved air quality. These measures can also reduce the demand for active cooling by passively reducing local temperatures through shading, evaporation and evapotranspiration. As the UK climate warms these cooling benefits will become more important. As the climate warms there may be an increased demand for these measures which will bring additional benefits for biodiversity and air quality etc. Whilst the cooling effects of green and blue infrastructure can be significant, they are difficult to quantify as they are subject to several interrelated and unpredictable influences such as the moisture content of the soil, the types of plant, their ages and states of health etc.
5.7.4 Renewable Energy
Solar PV generation on the UK electricity grid has increased substantially over the last few years and is set to continue to increase as the technology price falls and carbon targets become more pressing. The typical output profile of a south-facing PV system is a sine-wave-like curve with the peak occurring around solar noon. This output profile is similar to that of the cooling demand in some building types.
Figure 56 compares the modelled cooling energy consumption profile for domestic and non-domestic buildings from this research project with the indicative output of a solar PV array. This suggests that the typical non-domestic cooling demand profile peaks during early afternoon and has a similar shape to the output of a typical solar PV array, although the peak non-domestic cooling demand tends to occur slightly later in the day as ambient temperatures peak later than solar noon. The modelled domestic cooling demand profiles tend to peak much later in the day (typically around 5-6pm) when many residents return home. This later domestic cooling peak approximately coincides with peaks in demand from other uses, such as cooking, entertainment and (increasingly) charging electric vehicles, which are also associated with residents returning home.

Cooling in the UK
126
Figure 56: Comparison of modelled domestic and non-domestic cooling demand profile with indicative output of solar PV array
On a seasonal basis, the output of solar PV systems and cooling demands are generally well matched with both reaching a peak during summer months and a minimum during winter. Greater use of solar PV may help to mitigate the increased demand for cooling; however, the timing of PV supply and cooling demand is not a perfect match. Solar PV output may align reasonably well to non-domestic cooling demand, however the analysis described above suggests that maximum domestic cooling demands occur many hours after solar PV output has peaked. Energy storage or demand-side management may help to reduce this misalignment.
As mentioned above, the evening peak in domestic electricity demand may be amplified by increased charging of electric vehicles (EVs). The development of vehicle-to-grid (V2G) technology (and the legislation and business models to facilitate its use) may play a role in allowing domestic cooling demands to be served by energy stored in EVs. Early evening will be a suitable time for many EV owners to supply power to the grid as the typical EV usage pattern is primarily commuting-based with relatively few evening journeys.
Analysis of the cost effectiveness of passive and active cooling measures described in Sections 4.1.4 and 4.1.5 shows that solar shading measures such as overhangs were not included in any of the final packages. However, these measures are able improve thermal comfort and would have been considered cost effective enough to include in the packages if their capital costs were lower. One way in which lower effective capital costs might be achieved would be to combine the functionality of a solar shade with that of a solar PV panel. This approach has been adopted in several buildings such as the DEFRA office building in Alnwick shown in Figure 57.

Cooling in the UK
127
Figure 57: DEFRA office building in Alnwick (the UK’s first zero carbon office) showing solar PV serving dual purpose as solar shading device

Cooling in the UK
128
6. Conclusions This research has modelled the future cooling demand for the UK building stock until 2100. It has evaluated the impact of alternative deployment/policy scenarios on energy consumption and peak electricity demand. It has mapped out the costs, barriers and benefits of passive and active technologies associated with the different policy scenarios and gained an insight into future innovative cooling technologies. The research has been delivered through a combination of market research, literature reviews and the development of a multi-parameter model of the UK building stock.
Below are key findings identified for the 3 deployment scenarios. It is important to note that the results are subject to the specifications and assumptions used to define these three scenarios.
• Without any policy intervention, it is estimated that the annual cooling energy consumption will be around 6.3TWh and 12.0TWh for the high and low emissions scenarios respectively by 2100. These values can be significantly reduced through policy intervention. Taking the high emissions scenario, through focussing on efficient active cooling technologies or passive cooling measures first reduces cooling energy consumption by around 21% and 34% respectively.
• Most of the modelled UK cooling energy consumption is concentrated in England. This is due to a combination of warmer climate and England being host to around 84% of the UK building stock.
• Although the current demand for cooling in the UK is dominated by non-domestic buildings, the much larger domestic building stock means that domestic cooling energy consumption is likely to be greater. For example, by the end of the century, it is estimated that the domestic stock will require 75% to 85% of the cooling energy consumption depending on the policy intervention adopted.
• The modelled national peak demand for cooling during a heat wave event can be approximately twice as high as that in an average summer week, and between 20 and 65 times the annual average consumption.
• Non-domestic cooling demand tends to peak during early afternoon when ambient temperatures are highest. However, domestic cooling demand tends to peak in early evening when most residents return home and this coincides with other domestic demand such as cooking, entertainment and increasingly EV charging. Smart grid management may be helpful in reducing the need for increased electrical infrastructure capacity to meet increased domestic cooling demand such as the use of vehicle-to-grid (V2G) which allows vehicle batteries to support local grid demands.
• The modelled demand for heating is projected to reduce as the UK climate warms. The modelling suggests that there is little difference in space heating demands between the three deployment scenarios; this is thought to be because the measures implemented in each scenario are selected to mitigate cooling demands and mostly have little impact on space heating. The analysis is not focussed on detailed determination of the space

Cooling in the UK
129
heating demand and suggests an 8% and 38% reduction in space heating demand for the low and high emissions scenarios respectively by 2100.
• The total cumulative capital costs associated with both no intervention or a focus on efficient active cooling technologies could increase to £60-70 bn by 2050. This compares to a Passive First approach which is around £20-30bn. The costs need to be weighed against the benefits which comprise a number of factors including the health and well-being of the building occupants and their economic productivity.
• Potential synergies have been identified between the increase in cooling demand and heat decarbonisation. Air-to-air heat pumps provide low carbon heat and are able to provide cooling when operating in reverse. However, there is a risk that such use for cooling in the shorter-term could significantly increase carbon emissions and energy use, when no/less active cooling may have been used. Furthermore, air-to-air heat pumps do not offer any solution for water heating. In addition, 5th generation heat networks allow users to both import and export heat into the network. An increase in cooling demand may strengthen the business case for 5th generation networks as customers are able to export waste heat from cooling systems into the network and other users can then import this heat.
• Care is needed as improved fabric standards designed to reduce heating demands may also increase annual cooling demands but will tend to reduce peak cooling demands. It is also noted that as buildings need to be retrofitted to meet net zero, installing any cooling measures at the same time would reduce the combined costs as well as increasing the perceived benefits to building owners/tenants for such retrofit works.
The following areas of further research and analysis are suggested:
• The literature includes limited information on the rate of uptake of active cooling as the weather warms that is applicable to the UK. Further research would be helpful to better characterise this uptake which can then be applied to the modelled data to revise the predictions in this report. This further research should assess the relationship between long term and short term (heat wave) weather patterns on cooling uptake.
• The use of cooling in all building types is strongly influenced by occupant behaviour. Modelling undertaken for this study makes a series of standardised assumptions about cooling set point temperatures, hours of use and the various other behaviour patterns of occupants which influence cooling demands (heat gains, ventilation etc.) The model developed for this analysis could be further enhanced by sensitivity analysis to different occupant behaviour. This both provides a more complete analysis and can provide an evidence-base for guidance to influence behaviour to reduce cooling demand.
• The modelling demonstrates benefits of both the Passive First and Efficient Technology strategies in reducing average and peak energy consumption. Further work could consider additional deployment scenarios including the benefit of a combined approach which could be expected to reduce energy consumption further. In addition, it would be beneficial to undertake a more detailed cost benefit analysis of different policy scenarios which could expand on MHCLG’s cost benefit analysis on the impact of cooling measures to mitigate the risk of overheating in new homes as well as consider projected

Cooling in the UK
130
cost reductions from greater take-up of conventional cooling measures as well as the introduction of more innovative measures.
• Several potential synergies between cooling and other policy areas have been identified, particularly in relation to low carbon heating and fabric energy retrofit of buildings. It would be beneficial to investigate these synergies further as part of policy development.
• Further analysis would be beneficial to investigate the potential scale of the increased demands on electrical infrastructure and synergies with smart grid solutions such as vehicle-to-grid (V2G).
• This analysis suggests that the future demand for cooling in the UK may be concentrated in the south and east. However, the analysis undertaken for this report considered just four locations; a more detailed study might provide greater insight into the geographical spread of this increased cooling demand.

Cooling in the UK
131
7. Appendix A: Long List of Cooling Measures The following table includes the long list of cooling measures, alongside their suitability score, and whether the measure is to be investigated further. This short-list of measures to be investigated further was agreed with BEIS. Each measure has a suitability score for each of the twelve building archetypes; these scores range from not suitable (left blank) through low (L), medium (M) and High (H) suitability.
Table 18: Long List of Cooling Measures, identifying Short Listed Measures to be Taken Forwards
Domestic Non-Domestic
Archetype 1 2 3 4 5 6 7 8 9 10 11 12 Suitability
Score To
model
Prim
ary
Cat
egor
y
Measure
Exis
ting
Det
ache
d ho
use
(not
coo
led)
Ex
istin
g Se
mi-
deta
ched
/end
-terr
ace
hous
e 19
60s
cavi
ty
wal
l ins
ulat
ion
retr
ofitt
ed (n
ot c
oole
d)
New
Sem
i-de
tach
ed/e
nd-te
rrac
e ho
use
(not
coo
led)
Ex
istin
g M
id-te
rrac
e ho
use
pre
1919
, sol
id
bric
k (n
ot c
oole
d)
Exis
ting
Mid
floo
r fla
t (n
ot c
oole
d)
New
Mid
floo
r fla
t (no
t co
oled
) Ex
istin
g Sh
allo
w-p
lan
offic
e (n
ot c
oole
d)
Exis
ting
Hos
pita
l (c
oolin
g in
sm
all
num
ber o
f sel
ecte
d ar
eas
only
)
Exis
ting
Mul
ti-re
si (n
ot
cool
ed)
Exis
ting
Scho
ol (n
ot
cool
ed)
New
Sch
ool (
not
cool
ed)
Exis
ting
Dis
trib
utio
n w
areh
ouse
(not
co
oled
)
Dom
estic
Non
-Dom
estic
Dom
estic
Non
-Dom
estic
Exte
rnal
Sha
ding
Overhangs M M H M M H M M M M H 14 11 Y N
Balconies M M H M M H L L L L L 14 5 Y N
Shutters H H H H H H M L M M M M 18 11 Y N
Brise Soliel H H H H H H H M H H H M 18 16 Y Y
Retractable Canopies
H H H H H H L L L L M M 18 8 Y N
External blinds M M H M L M M M M L H M 12 12 Y Y

Cooling in the UK
132
Domestic Non-Domestic Archetype 1 2 3 4 5 6 7 8 9 10 11 12
Suitability Score
To model
Prim
ary
Cat
egor
y
Measure
Exis
ting
Det
ache
d ho
use
(not
coo
led)
Ex
istin
g Se
mi-
deta
ched
/end
-terr
ace
hous
e 19
60s
cavi
ty
wal
l ins
ulat
ion
retr
ofitt
ed (n
ot c
oole
d)
New
Sem
i-de
tach
ed/e
nd-te
rrac
e ho
use
(not
coo
led)
Ex
istin
g M
id-te
rrac
e ho
use
pre
1919
, sol
id
bric
k (n
ot c
oole
d)
Exis
ting
Mid
floo
r fla
t (n
ot c
oole
d)
New
Mid
floo
r fla
t (no
t co
oled
) Ex
istin
g Sh
allo
w-p
lan
offic
e (n
ot c
oole
d)
Exis
ting
Hos
pita
l (c
oolin
g in
sm
all
num
ber o
f sel
ecte
d ar
eas
only
)
Exis
ting
Mul
ti-re
si (n
ot
cool
ed)
Exis
ting
Scho
ol (n
ot
cool
ed)
New
Sch
ool (
not
cool
ed)
Exis
ting
Dis
trib
utio
n w
areh
ouse
(not
co
oled
)
Dom
estic
Non
-Dom
estic
Dom
estic
Non
-Dom
estic
Fins H H H H H H M M M M H M 18 13 Y Y
Recessed glazing L L H L L H M M M M H L 10 12 N Y
Trellis (with deciduous vegetation)
M M H M M H L L L L M 14 6 N N
Perforated (laser cut) sliding screens – shading and fall-arrest screen for larger opening of windows by sliding rather than side/top/bottom hung openable
M L M L M H M M M L M 11 9 N N
High garden walls/fences
M M H L L 8 1 N N

Cooling in the UK
133
Domestic Non-Domestic Archetype 1 2 3 4 5 6 7 8 9 10 11 12
Suitability Score
To model
Prim
ary
Cat
egor
y
Measure
Exis
ting
Det
ache
d ho
use
(not
coo
led)
Ex
istin
g Se
mi-
deta
ched
/end
-terr
ace
hous
e 19
60s
cavi
ty
wal
l ins
ulat
ion
retr
ofitt
ed (n
ot c
oole
d)
New
Sem
i-de
tach
ed/e
nd-te
rrac
e ho
use
(not
coo
led)
Ex
istin
g M
id-te
rrac
e ho
use
pre
1919
, sol
id
bric
k (n
ot c
oole
d)
Exis
ting
Mid
floo
r fla
t (n
ot c
oole
d)
New
Mid
floo
r fla
t (no
t co
oled
) Ex
istin
g Sh
allo
w-p
lan
offic
e (n
ot c
oole
d)
Exis
ting
Hos
pita
l (c
oolin
g in
sm
all
num
ber o
f sel
ecte
d ar
eas
only
)
Exis
ting
Mul
ti-re
si (n
ot
cool
ed)
Exis
ting
Scho
ol (n
ot
cool
ed)
New
Sch
ool (
not
cool
ed)
Exis
ting
Dis
trib
utio
n w
areh
ouse
(not
co
oled
)
Dom
estic
Non
-Dom
estic
Dom
estic
Non
-Dom
estic
Inte
rnal
sha
ding
Blinds (venetian, roman, roller and vertical)
H H H H H H H M H H H M 18 16 Y Y
Automatic blinds H H H H H H H M H H H H 18 17 Y Y
Curtains H H H H H H H H H H H H 18 18 Y Y
Internal shutters (insulated or not)
M M H M M H M L M M H M 14 12 Y Y
Internal films on glass
H H H H H H H H H H H H 18 18 Y Y
Vent
ilatio
n
Displacement ventilation (only effectively for very low load conditions)
L L H L M H M 2 11 N N
Standard opening windows/rooflights
H H H H H H H H H H H M 18 17 Y Y

Cooling in the UK
134
Domestic Non-Domestic Archetype 1 2 3 4 5 6 7 8 9 10 11 12
Suitability Score
To model
Prim
ary
Cat
egor
y
Measure
Exis
ting
Det
ache
d ho
use
(not
coo
led)
Ex
istin
g Se
mi-
deta
ched
/end
-terr
ace
hous
e 19
60s
cavi
ty
wal
l ins
ulat
ion
retr
ofitt
ed (n
ot c
oole
d)
New
Sem
i-de
tach
ed/e
nd-te
rrac
e ho
use
(not
coo
led)
Ex
istin
g M
id-te
rrac
e ho
use
pre
1919
, sol
id
bric
k (n
ot c
oole
d)
Exis
ting
Mid
floo
r fla
t (n
ot c
oole
d)
New
Mid
floo
r fla
t (no
t co
oled
) Ex
istin
g Sh
allo
w-p
lan
offic
e (n
ot c
oole
d)
Exis
ting
Hos
pita
l (c
oolin
g in
sm
all
num
ber o
f sel
ecte
d ar
eas
only
)
Exis
ting
Mul
ti-re
si (n
ot
cool
ed)
Exis
ting
Scho
ol (n
ot
cool
ed)
New
Sch
ool (
not
cool
ed)
Exis
ting
Dis
trib
utio
n w
areh
ouse
(not
co
oled
)
Dom
estic
Non
-Dom
estic
Dom
estic
Non
-Dom
estic
Secure mesh openings for secure night vent
H H H H H H M H H H H H 18 17 Y Y
Opening windows with top and bottom openings (middle tilt) for stack effect
M M H M M H M H H H H 14 14 Y Y
Cross ventilation through rooms and floors (not always possible in dwellings due to fire requirements and single aspect flats)
H M H L L M L M M 10 7 N N
Night purging H H H H H H H M H H H 18 14 Y Y
Ventilation atriums/stacks in tall buildings with roof
M M M M L M L L 11 2 N N

Cooling in the UK
135
Domestic Non-Domestic Archetype 1 2 3 4 5 6 7 8 9 10 11 12
Suitability Score
To model
Prim
ary
Cat
egor
y
Measure
Exis
ting
Det
ache
d ho
use
(not
coo
led)
Ex
istin
g Se
mi-
deta
ched
/end
-terr
ace
hous
e 19
60s
cavi
ty
wal
l ins
ulat
ion
retr
ofitt
ed (n
ot c
oole
d)
New
Sem
i-de
tach
ed/e
nd-te
rrac
e ho
use
(not
coo
led)
Ex
istin
g M
id-te
rrac
e ho
use
pre
1919
, sol
id
bric
k (n
ot c
oole
d)
Exis
ting
Mid
floo
r fla
t (n
ot c
oole
d)
New
Mid
floo
r fla
t (no
t co
oled
) Ex
istin
g Sh
allo
w-p
lan
offic
e (n
ot c
oole
d)
Exis
ting
Hos
pita
l (c
oolin
g in
sm
all
num
ber o
f sel
ecte
d ar
eas
only
)
Exis
ting
Mul
ti-re
si (n
ot
cool
ed)
Exis
ting
Scho
ol (n
ot
cool
ed)
New
Sch
ool (
not
cool
ed)
Exis
ting
Dis
trib
utio
n w
areh
ouse
(not
co
oled
)
Dom
estic
Non
-Dom
estic
Dom
estic
Non
-Dom
estic
and low level openings to draw in air at ground level
Breathing buildings M M H L 0 8 N N
Non-tempered mech vent
H H M H H H 14 17 N Y
Tempered mech vent
M M H M M H H H M H H H 14 17 Y Y
Mixed mode M M H M M H M H M H H H 14 16 Y Y
Ground ducts L L M L L L L M L 5 6 N N
Wind catchers (w/wo solar assist)
L L M L M M H H 5 10 N N
Stack chimney with Trombe Wall for enhanced and sustained stack throughout the day
L L M L L L L M M 5 7 N N

Cooling in the UK
136
Domestic Non-Domestic Archetype 1 2 3 4 5 6 7 8 9 10 11 12
Suitability Score
To model
Prim
ary
Cat
egor
y
Measure
Exis
ting
Det
ache
d ho
use
(not
coo
led)
Ex
istin
g Se
mi-
deta
ched
/end
-terr
ace
hous
e 19
60s
cavi
ty
wal
l ins
ulat
ion
retr
ofitt
ed (n
ot c
oole
d)
New
Sem
i-de
tach
ed/e
nd-te
rrac
e ho
use
(not
coo
led)
Ex
istin
g M
id-te
rrac
e ho
use
pre
1919
, sol
id
bric
k (n
ot c
oole
d)
Exis
ting
Mid
floo
r fla
t (n
ot c
oole
d)
New
Mid
floo
r fla
t (no
t co
oled
) Ex
istin
g Sh
allo
w-p
lan
offic
e (n
ot c
oole
d)
Exis
ting
Hos
pita
l (c
oolin
g in
sm
all
num
ber o
f sel
ecte
d ar
eas
only
)
Exis
ting
Mul
ti-re
si (n
ot
cool
ed)
Exis
ting
Scho
ol (n
ot
cool
ed)
New
Sch
ool (
not
cool
ed)
Exis
ting
Dis
trib
utio
n w
areh
ouse
(not
co
oled
)
Dom
estic
Non
-Dom
estic
Dom
estic
Non
-Dom
estic
Ther
mal
mas
s
Masonry partitions L L H L L H M L M M H 10 10 N N
Masonry external walls
H H H 6 3 N N
Exposed concrete ceilings
H H H 6 3 N N
Exposed concrete floors
H H H 6 3 N N
Rammed earth walls L L M L 2 3 N N
Tanks of water L L L L L L M L L M H M 6 11 N N
Thermodeck (are there other things like this?)
M M H 4 3 N N
Build underground L L L L 2 2 N N
Phase change materials in fabric (e.g. plasterboard)
M M H M M H M M M M H 14 11 N N

Cooling in the UK
137
Domestic Non-Domestic Archetype 1 2 3 4 5 6 7 8 9 10 11 12
Suitability Score
To model
Prim
ary
Cat
egor
y
Measure
Exis
ting
Det
ache
d ho
use
(not
coo
led)
Ex
istin
g Se
mi-
deta
ched
/end
-terr
ace
hous
e 19
60s
cavi
ty
wal
l ins
ulat
ion
retr
ofitt
ed (n
ot c
oole
d)
New
Sem
i-de
tach
ed/e
nd-te
rrac
e ho
use
(not
coo
led)
Ex
istin
g M
id-te
rrac
e ho
use
pre
1919
, sol
id
bric
k (n
ot c
oole
d)
Exis
ting
Mid
floo
r fla
t (n
ot c
oole
d)
New
Mid
floo
r fla
t (no
t co
oled
) Ex
istin
g Sh
allo
w-p
lan
offic
e (n
ot c
oole
d)
Exis
ting
Hos
pita
l (c
oolin
g in
sm
all
num
ber o
f sel
ecte
d ar
eas
only
)
Exis
ting
Mul
ti-re
si (n
ot
cool
ed)
Exis
ting
Scho
ol (n
ot
cool
ed)
New
Sch
ool (
not
cool
ed)
Exis
ting
Dis
trib
utio
n w
areh
ouse
(not
co
oled
)
Dom
estic
Non
-Dom
estic
Dom
estic
Non
-Dom
estic
Phase change materials in tank/buffer
H H H H H H H H H H H H 18 18 N N
Thick stone/block walls on south/west facades (e.g. not the same construction for all walls only providing thermal mass where exposed to direct sun)
H H H 6 3 N N
Gre
en &
Blu
e Green roof L L M L L L L L H L 5 8 N N
Green wall (internal and external)
L L M L M M M L H 5 10 N N
Blue roof L L L 2 1 N N
Brown roof L L M L L L L L H L 5 8 N N

Cooling in the UK
138
Domestic Non-Domestic Archetype 1 2 3 4 5 6 7 8 9 10 11 12
Suitability Score
To model
Prim
ary
Cat
egor
y
Measure
Exis
ting
Det
ache
d ho
use
(not
coo
led)
Ex
istin
g Se
mi-
deta
ched
/end
-terr
ace
hous
e 19
60s
cavi
ty
wal
l ins
ulat
ion
retr
ofitt
ed (n
ot c
oole
d)
New
Sem
i-de
tach
ed/e
nd-te
rrac
e ho
use
(not
coo
led)
Ex
istin
g M
id-te
rrac
e ho
use
pre
1919
, sol
id
bric
k (n
ot c
oole
d)
Exis
ting
Mid
floo
r fla
t (n
ot c
oole
d)
New
Mid
floo
r fla
t (no
t co
oled
) Ex
istin
g Sh
allo
w-p
lan
offic
e (n
ot c
oole
d)
Exis
ting
Hos
pita
l (c
oolin
g in
sm
all
num
ber o
f sel
ecte
d ar
eas
only
)
Exis
ting
Mul
ti-re
si (n
ot
cool
ed)
Exis
ting
Scho
ol (n
ot
cool
ed)
New
Sch
ool (
not
cool
ed)
Exis
ting
Dis
trib
utio
n w
areh
ouse
(not
co
oled
)
Dom
estic
Non
-Dom
estic
Dom
estic
Non
-Dom
estic
Pond / Fountain M M H L L M M L M L M L 11 9 N N
Canal L L L 2 1 N N
Park/planting around building
M M H L L M M M M M H 11 11 N N
Ref
lect
ive
Paint roads white H H H H H H H H H H H H 18 18 N N
Reflective roof L L H L L H M M M M H H 10 14 N Y
Reflective walls M M H M M H H H H H H H 14 18 z Y
Electrochromic glass H H H H H H H H H H H L 18 16 Y Y
Solar control glass H H H H H H H H H H H M 18 17 Y Y
Fritted glass H H H H H H H H H H H M 18 17 Y Y
Activ
e te
chno
logi
es Portable cooling
units H H H H H H H H H H H H 18 18 Y Y
Electric chillers M M M M M M H H M H H H 12 17 Note 1 Reversible heat
pumps M M H M M H H H H H H H 14 18

Cooling in the UK
139
Domestic Non-Domestic Archetype 1 2 3 4 5 6 7 8 9 10 11 12
Suitability Score
To model
Prim
ary
Cat
egor
y
Measure
Exis
ting
Det
ache
d ho
use
(not
coo
led)
Ex
istin
g Se
mi-
deta
ched
/end
-terr
ace
hous
e 19
60s
cavi
ty
wal
l ins
ulat
ion
retr
ofitt
ed (n
ot c
oole
d)
New
Sem
i-de
tach
ed/e
nd-te
rrac
e ho
use
(not
coo
led)
Ex
istin
g M
id-te
rrac
e ho
use
pre
1919
, sol
id
bric
k (n
ot c
oole
d)
Exis
ting
Mid
floo
r fla
t (n
ot c
oole
d)
New
Mid
floo
r fla
t (no
t co
oled
) Ex
istin
g Sh
allo
w-p
lan
offic
e (n
ot c
oole
d)
Exis
ting
Hos
pita
l (c
oolin
g in
sm
all
num
ber o
f sel
ecte
d ar
eas
only
)
Exis
ting
Mul
ti-re
si (n
ot
cool
ed)
Exis
ting
Scho
ol (n
ot
cool
ed)
New
Sch
ool (
not
cool
ed)
Exis
ting
Dis
trib
utio
n w
areh
ouse
(not
co
oled
)
Dom
estic
Non
-Dom
estic
Dom
estic
Non
-Dom
estic
Absorption chillers (w/wo solar thermal)
L M M M M M M M 3 12
Adsorption chillers (w/wo solar thermal)
L M M M M M M M 3 12
Running chillers at night to pre-cool when outside is cooler
M M H M M H H H H H H H 14 18
Ice storage M M H M M H H H H H H H 14 18
Desiccant cooling L L M L L H H H H H H H 9 18
District Cooling M M H M M H H H H H H H 14 18
Coo
ling
emitt
ers FCUs M M M M M M H H H H H H 12 18 N N
Chilled beams (active and passive)
M M M M M M H H H H H L 12 16 N N
Chilled ceilings M M H M M H H H H H H L 14 16 N N
Chilled floors M M H M M H H H H H H M 14 17 N N

Cooling in the UK
140
Domestic Non-Domestic Archetype 1 2 3 4 5 6 7 8 9 10 11 12
Suitability Score
To model
Prim
ary
Cat
egor
y
Measure
Exis
ting
Det
ache
d ho
use
(not
coo
led)
Ex
istin
g Se
mi-
deta
ched
/end
-terr
ace
hous
e 19
60s
cavi
ty
wal
l ins
ulat
ion
retr
ofitt
ed (n
ot c
oole
d)
New
Sem
i-de
tach
ed/e
nd-te
rrac
e ho
use
(not
coo
led)
Ex
istin
g M
id-te
rrac
e ho
use
pre
1919
, sol
id
bric
k (n
ot c
oole
d)
Exis
ting
Mid
floo
r fla
t (n
ot c
oole
d)
New
Mid
floo
r fla
t (no
t co
oled
) Ex
istin
g Sh
allo
w-p
lan
offic
e (n
ot c
oole
d)
Exis
ting
Hos
pita
l (c
oolin
g in
sm
all
num
ber o
f sel
ecte
d ar
eas
only
)
Exis
ting
Mul
ti-re
si (n
ot
cool
ed)
Exis
ting
Scho
ol (n
ot
cool
ed)
New
Sch
ool (
not
cool
ed)
Exis
ting
Dis
trib
utio
n w
areh
ouse
(not
co
oled
)
Dom
estic
Non
-Dom
estic
Dom
estic
Non
-Dom
estic
Carefully running radiators at a low temp but above the due point
M M H M M H L L M H M 14 9 N N
DX M M M M M M H H H H H L 12 16 N N
All air system (VAV, CV)
L L L L L L H H M H H L 6 15 N N
VRF/VRV L L L L M M H H H H H L 8 16 N N
Heat recovery (heat pump) MVHR – manufacturer - Nilan – into DHW
H H H H H H H H H H H L 18 16 N N
Build
ing
form
Northlights M H M 0 7 N N
Location of glazing away from sun
L L H M L H L 7 5 N N
Reduce glazing size L L H M L H L 7 5 N N

Cooling in the UK
141
Domestic Non-Domestic Archetype 1 2 3 4 5 6 7 8 9 10 11 12
Suitability Score
To model
Prim
ary
Cat
egor
y
Measure
Exis
ting
Det
ache
d ho
use
(not
coo
led)
Ex
istin
g Se
mi-
deta
ched
/end
-terr
ace
hous
e 19
60s
cavi
ty
wal
l ins
ulat
ion
retr
ofitt
ed (n
ot c
oole
d)
New
Sem
i-de
tach
ed/e
nd-te
rrac
e ho
use
(not
coo
led)
Ex
istin
g M
id-te
rrac
e ho
use
pre
1919
, sol
id
bric
k (n
ot c
oole
d)
Exis
ting
Mid
floo
r fla
t (n
ot c
oole
d)
New
Mid
floo
r fla
t (no
t co
oled
) Ex
istin
g Sh
allo
w-p
lan
offic
e (n
ot c
oole
d)
Exis
ting
Hos
pita
l (c
oolin
g in
sm
all
num
ber o
f sel
ecte
d ar
eas
only
)
Exis
ting
Mul
ti-re
si (n
ot
cool
ed)
Exis
ting
Scho
ol (n
ot
cool
ed)
New
Sch
ool (
not
cool
ed)
Exis
ting
Dis
trib
utio
n w
areh
ouse
(not
co
oled
)
Dom
estic
Non
-Dom
estic
Dom
estic
Non
-Dom
estic
Self-shading M H H 5 3 N N
Oth
er
Taking steps to reduce internal gains
H H H H H H H H H H H H 18 18 Y Y
Cold food H H H H H H M L L M M M 18 10 N N
Modify dress code H H H H H H H L M H H H 18 15 Y Y
Double skin façade M M L L L M M 2 9 N N
Ceiling fans H H H H H H H L H H H 18 13 Y Y
Portable/Desk fans H H H H H H H L H H H M 18 15 Y Y
Changing work schedules (i.e. avoid hottest part of day).
L L L L 0 4 N N
Note 1: Test modelling of active cooling technologies unnecessary because modelled performance of all active cooling is the same (i.e. cooling set points are achieved).

Cooling in the UK
142
8. Appendix B: Description of Sample Buildings used to Derive Passive Packages
8.1 Baseline Office Building
The non-domestic office building is broadly based on a model used for the Part L 2021 impact assessment. This is a rectilinear three storey office building with floor plates measuring 18m by 40m and glazing covering 40% of each facade. The model has been modified to reflect an existing rather than a new building. Occupancy and control patterns are based on the applicable National Calculation Methodology (NCM) templates.
The baseline mid-floor office was modelled as described below. When modelling the effect of a reflective roof on a top floor office, all settings are the same, with the exception that the ‘active’ rooms are moved to the top of the building.
Figure 58: Screenshots Illustrating Sample Office Building IES Model
Office storey height = 3.5m
Glazing area = 40% of external wall area
Active rooms in model shown in blue, with other adjacent floors shown in pink.
Extent of assessed office space is shown by dashed red line
40m 18m
North

Cooling in the UK
143
Table 19: Performance of the Baseline Office Building Fabric (based on Part L 1995)
Construction Element
U-Value (W/m²K) g-value (%) Light Transmittance (%)
External Wall 0.45 - -
Roof 0.25 - -
External Glazing 3.30 52 55
The remaining parameters were aligned to the NCM template for this room type, as set out below:
The heating operates as described below:
• Office: Heated to 22ºC between 05:00 and 19:00 Monday to Friday, and to 12ºC at all other times.
• Circulation: Heated to 20ºC between 05:00 and 19:00 Monday to Friday, and to 12ºC at all other times.
The mechanical ventilation operates as described below:
• Office: Mechanical ventilation flow rate of 10l/s/person, operates between 07:00 and 19:00 Monday to Friday, and off at all other times
• Circulation: Mechanical ventilation flow rate of 10l/s/person, operates between 07:00 and 19:00 Monday to Friday, and off at all other times
The internal gains were entered as described below:
• Office:
o Lighting gains of 15W/m², operates between 07:00 and 19:00 Monday to Friday, and off at all other times
o Occupancy density of 9.0m²/person (occupant gains of 73W/person sensible and 50W/person latent), varying profile between 07:00 and 19:00 Monday to Friday and unoccupied at all other times. Full description of profile provided below.
o Equipment gains of 11.7W/m², operates at 100% between 07:00 and 19:00 Monday to Friday, and at 5.4% at all other times
• Circulation:
o Lighting gains of 5.2W/m², operates between 07:00 and 19:00 Monday to Friday, and off at all other times
o Occupancy density of 8.5m²/person (occupant gains of 70W/person sensible and 70W/person latent), varying profile between 07:00 and 19:00 Monday to Friday and unoccupied at all other times. Full description of profile provided below.
o Equipment gains of 1.9W/m², operates at 100% between 07:00 and 19:00 Monday to Friday, and at 5.4% at all other times

Cooling in the UK
144
The occupancy profile applied to both the office and circulation spaces is as described below in Table 20.
Table 20: Occupancy Profile for Office Building
Description of Profile Visual Representation of Profile Monday to Friday:
00:00 – 07:00: 0% (Unoccupied)
07:00 – 08:00: 25%
08:00 – 09:00: 50%
09:00 – 12:00: 100%
12:00 – 14:00: 75%
14:00 – 17:00: 100%
17:00 – 18:00: 50%
18:00 – 19:00: 25%
19:00 – 24:00: 0% (Unoccupied)
Saturday and Sunday: 0% (Unoccupied)
8.2 Baseline Dwelling
The baseline living room was modelled as described below. This model is based on that used for the recent MHCLG research study into overheating in new homes62. This model has been modified to reflect building fabric representative of an older building, see Table 21.
Figure 59: Screenshots Illustrating Sample Dwelling IES Model
Living room floor to ceiling height = 2.662m
Glazing area = 2.485m x 2.11m
Active rooms in model shown in blue, with other adjacent rooms shown in pink and shading elements shown in green.
62 https://www.gov.uk/government/publications/research-into-overheating-in-new-homes
4.835m 4.397m

Cooling in the UK
145
Extent of assessed living room is shown by dashed red line
The performance of the building fabric has been entered as per the Thin Internal Wall Insulation study63 undertaken for BEIS, for an existing semi-detached dwelling with partially filled cavity walls.
Table 21: Performance of the Baseline Dwelling Fabric
Construction Element
U-Value (W/m²K) g-value (%) Light Transmittance (%)
External Wall 0.49 - -
Ground Floor 0.51 - -
External Glazing 3.10 76 71
The air permeability rate was entered as 0.522ach-1; which is based on the previous “Thin Internal Wall Insulation” Study for existing semi-detached dwellings.
The heating set point was set as 20ºC, and operates between 06:30 and 08:30 and 17:00 and 22:00, 7 days per week between October and mid-April. Outside of these times, the heating does not operate.
The internal gains were entered as described below:
• Lighting gains of 2W/m², operating between 18:00 and 22:00 7 days per week.
• 2 occupants (occupant gains of 75W/person sensible and 55W/person latent), between 09:00 and 22:00, 7days per week with a 75% diversity factor applied to the number of occupants.
• Equipment gains of 150W, operating on a varying profile 24 hours per day.
The equipment profile applied was as described below in Table 22.
63 Cooke, D and Jones E. (2016) DECC Thin Internal Wall Insulation. P.34. Available at: https://assets.publishing.service.gov.uk/government/uploads/system/uploads/attachment_data/file/656868/27062016_-_DECC_Thin_IWI_final_issued__2_.pdf [Accessed 7th December 2020]
North

Cooling in the UK
146
Table 22: Equipment Profile for Living Room
Description of Profile Visual Representation of Profile
Monday to Sunday:
00:00 – 09:00: 23%
09:00 – 18:00: 40%
18:00 – 22:00: 100%
22:00 – 24:00: 40%

Cooling in the UK
147
9. Appendix C: Description of Modelled Passive Measures The following table provides a detailed description of how each passive measure has been modelled, alongside the CAPEX for the measure.
To derive capital costs, quotations from individual suppliers have been obtained where possible, and rates have been built up with labour constants / rates to arrive at a total rate per item / unit. If this was not possible then costs have been applied from Spons 2020 for items or a similar spec. All costs have been adjusted for typical Contractor ‘on costs’ including a 13% additional for Prelims / OH+P, except for domestic measures where occupants are likely to implement measures themselves, such as replacing light bulbs. Rates applied these have also been gauged from recent live projects / tenders received, with any necessary index adjustment made for average / inflation.
Table 23: Detailed Description of Modelled Measures
Category Measure Description for Non-Domestic Building
CAPEX for Non-Domestic Building (£)
Description for Domestic Building
CAPEX for Domestic Building (£)
External Shading
Overhangs (Overhang)
N/A N/A A 1.827m deep overhang (1.055m above window), across the full width of the window
£1,005
Balconies (Balcony)
N/A N/A A 1.827m deep balcony (1.055m above window), across the full width of the window
£3,899
Shutters (ExtShutter)
N/A N/A
External shutters, with 0.06m deep fins at 0.07m spacing at an angle of 35º to cover the whole window.
• Condition to close shutters = 250W/m²
• Condition to open shutters = 150W/m²
£1,376

Cooling in the UK
148
Category Measure Description for Non-Domestic Building
CAPEX for Non-Domestic Building (£)
Description for Domestic Building
CAPEX for Domestic Building (£)
Brise Soliel (BriseSoliel)
Horizontal brise soliel, 1.299m deep (0.75m above window) across whole width of window
£45,102 Horizontal brise soliel, 1m deep (immediately above window) across whole width of window
£953
Retractable Canopies (RetractCanopies)
N/A N/A 1.827m deep translucent canopy with 21% light transmission, immediately above window.
£6,301
External Blinds (ExtBlinds)
External blinds modelled with the following specification:
• Condition to lower device = 250W/m²
• Condition to raise device = 150W/m²
• Shading = 0.3 • Short wave radiant fraction = 0.66
£65,190
External blinds modelled with the following specification:
• Condition to lower device = 250W/m²
• Condition to raise device = 150W/m²
• Shading = 0.3 • Short wave radiant fraction =
0.66
£2,107
Fins (Fins) 200mm vertical fins at 1.5m spacing across width of window
£13,898 200mm vertical fins at the left and right hand side of windows
£1,358
Recessed Glazing (Recess)
Windows are recessed 200mm into wall
£17,021 N/A N/A
Internal Shading
Internal Blinds (IntBlinds) Internal blinds modelled with the
following specification:
• Condition to lower device = 250W/m²
£10,460 Internal blinds modelled with the following specification:
• Condition to lower device = 250W/m²
£0 – this is assumed to be a
no-cost behaviour
change
Automatic Internal Blinds (AutoIntBlinds)
£32,347

Cooling in the UK
149
Category Measure Description for Non-Domestic Building
CAPEX for Non-Domestic Building (£)
Description for Domestic Building
CAPEX for Domestic Building (£)
Curtains (IntBlinds)
• Condition to raise device = 150W/m²
• Shading = 0.3 • Short wave radiant fraction = 0.66
£10,460
• Condition to raise device = 150W/m²
• Shading = 0.48 • Short wave radiant fraction =
0.625
Uninsulated Internal Shutters (IntShutters)
Internal shutters are assumed to provide the same shading effect as internal blinds.
£48,622 Internal shutters are assumed to provide the same shading effect as internal blinds.
£1,572
Insulated Internal Shutters (IntInsShutters)
Internal shutters are assumed to provide the same shading effect as internal blinds.
Insulated internal shutters are assumed to provide a thermal resistance of 0.456m²K/W.
£48,622
Internal shutters are assumed to provide the same shading effect as internal blinds.
Insulated internal shutters are assumed to provide a thermal resistance of 0.456m²K/W.
£1,572
Shading Films applied to Glazing (ShadingFilm)
The shading film is assumed to reduce the g-value of the glazing to 23%.
£3,815 The shading film is assumed to reduce the g-value of the glazing to 23%.
£123
Ventilation Standard Window Openings (StdNatVent)
Windows are assumed to be top-hung, and restricted to a maximum 100mm opening. It is assumed that windows are open to 50% of their maximum extent throughout the occupied period to provide fresh air, and open to their fullest extent if the internal air temperature is greater than 24ºC. Windows are assumed to
£0 – this is assumed to be a
no-cost behaviour
change
This is the baseline option. 2 top hung windows (0.643m x 0.692m) and 1 opening door (0.6m x 2.11m) are assumed to open to a maximum angle of 30º when the internal air temperature reaches 22ºC, during the occupied period.
£0 – this is the baseline

Cooling in the UK
150
Category Measure Description for Non-Domestic Building
CAPEX for Non-Domestic Building (£)
Description for Domestic Building
CAPEX for Domestic Building (£)
be closed outside of the occupied period.
There is no mechanical ventilation in this scenario.
Secure Mesh Openings for Night Vent (SecNatVent)
This option adopts the same openings and strategy as for the Standard Window Openings measure during the occupied period.
In addition, windows are assumed to open overnight if the internal air temperature is greater than 22ºC, with the opening restricted to 80% of its maximum to account for the effect of a security grille.
There is no mechanical ventilation in this scenario.
£42,208
This option adopts the same openings and strategy as for the Standard Window Openings measure during the occupied period.
In addition, windows are assumed to open overnight if the internal air temperature is greater than 22ºC, with the opening restricted to 80% of its maximum to account for the effect of a security grille.
There is no mechanical ventilation in this scenario.
£1,364
Opening Windows with Top and Bottom Openings
(Non-Domestic = CntrHung and Domestic = TopBottom)
Windows are assumed to be centre-hung, and restricted to a maximum 100mm opening. Windows open following the same strategy as the Standard Window Openings option.
There is no mechanical ventilation in this scenario.
£99,096
In addition to the window openings included in the Standard Window Openings option, 2 additional low-level side hung windows (0.643m x 1.418m) opening to a maximum of 30º are included. These also open when the internal air temperature reaches 22ºC during the occupied period.
£1,453

Cooling in the UK
151
Category Measure Description for Non-Domestic Building
CAPEX for Non-Domestic Building (£)
Description for Domestic Building
CAPEX for Domestic Building (£)
Night Purging (NightPurge)
During the occupied period, the mechanical ventilation operates as per the Non-Tempered Mechanical Ventilation option.
Outside of the occupied hours, mechanical ventilation operates if the internal air temperature is greater than 22ºC.
At all times, air is supplied at the external air temperature.
£1,627
During the occupied period, the windows open as per the Standard Window Openings option. Outside of the occupied period, windows are assumed to open to 5% of their maximum extent, as may be provided by a secure locked opening position, when the internal air temperature is greater than 22ºC.
£0 – this is assumed to be a
no-cost behaviour
change
Non-Tempered Mechanical Ventilation (MechVent)
This is the baseline option. Mechanical ventilation operates at 100% throughout the occupied period. Air is supplied at the external air temperature.
£0 – this is the baseline
N/A Dwellings with mechanical ventilation generally also have opening windows and so are not purely mechanically ventilated, see Mixed Mode
N/A
Tempered Mechanical Ventilation (TempMechVent)
Mechanical ventilation operates with the same flow rate and operation profile as the Non-Tempered Mechanical Ventilation Option.
If the external air temperature is greater than 22ºC, then air is supplied to the room at 22ºC, otherwise air is supplied at the external air temperature.
£8,170
Mechanical ventilation operates with the same flow rate and operation profile as the Non-Tempered Mechanical Ventilation Option.
If the external air temperature is greater than 22ºC, then air is supplied to the room at 22ºC, otherwise air is supplied at the external air temperature.
£942

Cooling in the UK
152
Category Measure Description for Non-Domestic Building
CAPEX for Non-Domestic Building (£)
Description for Domestic Building
CAPEX for Domestic Building (£)
Mixed Mode (MixedMode)
This option uses the same window openings and control strategy as the Standard Window Opening option.
In addition, mechanical ventilation operates, with the same flow rate as the Non-Tempered Mechanical Ventilation option, when the internal air temperature is greater than 26ºC during the occupied period.
£1,627
The mechanical ventilation operates as per the Non-Tempered Mechanical Ventilation option.
In addition, windows are assumed to open when the internal air temperature is greater than 24ºC. Window openings are as per the Standard Window Opening Option.
£159
Reflective
Reflective Roof (ReflectRoof)
A beige reflective coating is modelled on the roof. This is modelled with a reflectance of 45% (absorptance of 55%).
£4,393 N/A N/A
Reflective Walls (ReflectWalls)
A beige reflective coating is modelled on the external walls. This is modelled with a reflectance of 45% (absorptance of 55%).
£1,431
A beige reflective coating is modelled on the external walls. This is modelled with a reflectance of 45% (absorptance of 55%).
£114
Electrochromic Glass (Electrochromic)
Electrochromic glass is modelled with a g-value ranging between 41% when the incident solar irradiance is 600W/m² and 9% when the incident solar irradiance is 400W/m².
£183,512
Electrochromic glass is modelled with a g-value ranging between 41% when the incident solar irradiance is 600W/m² and 9% when the incident solar irradiance is 400W/m².
£5,933
Solar Control Glass (SolarCntl)
Solar control glazing reduces the g-value of the glazing to 28%, and the light transmittance to 60%.
£39,455 Solar control glazing reduces the g-value of the glazing to 28%, and the light transmittance to 60%.
£1,275

Cooling in the UK
153
Category Measure Description for Non-Domestic Building
CAPEX for Non-Domestic Building (£)
Description for Domestic Building
CAPEX for Domestic Building (£)
Fritted Glass (Fritting)
The fritting is assumed to be a 50% density grey frit pattern, which reduces the g-value of the glazing to 38.8%.
£43,125
The fritting is assumed to be a 50% density grey frit pattern, which reduces the g-value of the glazing to 57%.
£1,394
Active Portable Cooling Units (PortAC)
A commercially available cooling unit, with a rated cooling capacity of 2.86kW, was calculated to have an actual cooling capacity of 1.32kW once the gains from the operation of the unit and exhaust pipe were accounted for. It is assumed that the portable cooling units exhaust pipe would be hung out of an open window with a seal around it, make-up air enters the building by infiltration to balance the hot exhaust flow from the unit. Portable cooling was applied to the perimeter zones of the sample office building model only. It was assumed that one unit would be provided per seating bay; where a seating bay was assumed to be 4m wide.
The cooling set point is 24ºC and is modelled as operating between
£8,800
A commercially available cooling unit, with a rated cooling capacity of 2.06kW, was calculated to have an actual cooling capacity of 0.93kW once the gains from the operation of the unit and exhaust pipe were accounted for. It is assumed that the portable cooling units exhaust pipe would be hung out of an open window with a seal around it, make-up air enters the building by infiltration to balance the hot exhaust flow from the unit.
The cooling set point is entered as 23ºC, and is modelled as operating between 09:00 and 22:00.
£275

Cooling in the UK
154
Category Measure Description for Non-Domestic Building
CAPEX for Non-Domestic Building (£)
Description for Domestic Building
CAPEX for Domestic Building (£)
07:00 and 19:00 Monday to Friday, and off at all other times.
Fixed Cooling (FixedAC)
It is assumed that the fixed cooling is sized sufficiently to meet the cooling demands from the building.
The cooling set point is 24ºC and is modelled as operating between 05:00 and 19:00 Monday to Friday, and off at all other times.
£53,449 It is assumed that the fixed cooling is sized sufficiently to meet the cooling demands from the building.
£1,234
Other
Taking Steps to Reduce Internal Gains (IntGains)
Reduced internal gains are entered in accordance with the LETI Climate Emergency Design Guide:
• Lighting gains = 4.5W/m² • Equipment gains = 8.0W/m²
£35,911
It is assumed that the lighting heat gains can be reduced to 10W after switching to LED lighting, and the equipment gains can be halved to 75W.
£604
Modify Dress Codes (Clothing)
A modified dress code is assumed to reduce the insulating effect of clothing to 0.43 clo, equivalent to underpants, short sleeve shirt, shorts, ankle socks, thin sole shoes and the insulating effect of a chair.
£0 – this is assumed to be a
no-cost behaviour
change
A modified dress code is assumed to reduce the insulating effect of clothing to 0.43 clo, equivalent to underpants, short sleeve shirt, shorts, ankle socks, thin sole shoes and the insulating effect of a chair.
£0 – this is assumed to be a
no-cost behaviour
change
Ceiling Fans (CeilingFans)
Ceiling fans are assumed to increase the summer elevated air speed to 0.9m/s.
The additional heat gains associated with ceiling fans are entered as
£1,705
A ceiling fan is assumed to increase the summer elevated air speed to 0.9m/s.
The additional heat gains associated with a ceiling fan are
£34

Cooling in the UK
155
Category Measure Description for Non-Domestic Building
CAPEX for Non-Domestic Building (£)
Description for Domestic Building
CAPEX for Domestic Building (£)
0.5W/m² based on a commercially available unit.
entered as 71W based on a commercially available unit.
Portable/Desk Fans (DeskFan)
Desk fans are assumed to increase the summer elevated air speed to 0.9m/s.
The additional heat gains associated with desk fans are entered as 2.78W/m², which is based on a commercially available unit and assumes 1 desk fan per occupant.
£1,849
A desk fan is assumed to increase the summer elevated air speed to 0.9m/s.
The additional heat gains associated with a desk fan are entered as 25W which is based on a commercially available unit and assumes 1 desk fan in the living room.
£25
Improved Glazing U-value to 1.8W/m²K (Glass1.8)
The window U-value is improved to 1.8W/m²K
N/A – measure causes poorer thermal comfort performance
The window U-value is improved to 1.8W/m²K
N/A – measure causes poorer thermal comfort performance
Improved Glazing U-value to 1.6W/m²K (Glass1.6)
The window U-value is improved to 1.8W/m²K
N/A – measure causes poorer thermal comfort performance
The window U-value is improved to 1.8W/m²K
N/A – measure causes poorer thermal comfort performance

Cooling in the UK
156
10. Appendix D: Modelled Transitions
Graphs shown in this appendix show the modelled percentages of each archetype that are deemed to be using each package in each of the modelled years (2025 to 2075); Sections 5.2 and 5.3 provide further discussion of this. The vertical axis shows the percentage breakdown whilst the horizontal axis shows the year and archetype references. Twelve archetypes are modelled:
• Domestic:
o A01: Existing detached house;
o A02: Existing semi-detached house;
o A03: New semi-detached house;
o A04: Existing mid-terrace house;
o A05: Existing mid-floor flat;
o A06: New mid-floor flat;
• Non-Domestic:
o A07: Existing office;
o A08: Existing hospital;
o A09: Existing student residential;
o A10: Existing school;
o A11: New school;
o A12: Existing warehouse.
Graphs are shown for each of the four locations modelled (London, Cardiff, Belfast and Glasgow) and for the two emissions scenarios:
• Low emissions, projected to reach a mean global temperature rise of 1.5°C by 2081-2100;
• High emissions, projected to reach a mean global temperature rise of 4.0°C by 2081-2100.

Cooling in the UK
157
Figure 60: London low emissions scenario modelled transition of 12 archetypes for “No Intervention” and “Efficient Technologies” deployment scenarios
Figure 61: London low emissions scenario modelled transition of 12 archetypes for “Passive First” deployment scenario

Cooling in the UK
158
Figure 62: London high emissions scenario modelled transition of 12 archetypes for “No Intervention” and “Efficient Technologies” deployment scenarios
Figure 63: London high emissions scenario modelled transition of 12 archetypes for “Passive First” deployment scenario

Cooling in the UK
159
Figure 64: Cardiff low emissions scenario modelled transition of 12 archetypes for “No Intervention” and “Efficient Technologies” deployment scenarios
Figure 65: Cardiff low emissions scenario modelled transition of 12 archetypes for “Passive First” deployment scenario

Cooling in the UK
160
Figure 66: Cardiff high emissions scenario modelled transition of 12 archetypes for “No Intervention” and “Efficient Technologies” deployment scenarios
Figure 67: Cardiff high emissions scenario modelled transition of 12 archetypes for “Passive First” deployment scenario

Cooling in the UK
161
Figure 68: Belfast low emissions scenario modelled transition of 12 archetypes for “No Intervention” and “Efficient Technologies” deployment scenarios
Figure 69: Belfast low emissions scenario modelled transition of 12 archetypes for “Passive First” deployment scenario

Cooling in the UK
162
Figure 70: Belfast high emissions scenario modelled transition of 12 archetypes for “No Intervention” and “Efficient Technologies” deployment scenarios
Figure 71: Belfast high emissions scenario modelled transition of 12 archetypes for “Passive First” deployment scenario

Cooling in the UK
163
Figure 72: Glasgow low emissions scenario modelled transition of 12 archetypes for “No Intervention” and “Efficient Technologies” deployment scenarios
Figure 73: Glasgow low emissions scenario modelled transition of 12 archetypes for “Passive First” deployment scenario

Cooling in the UK
164
Figure 74: Glasgow high emissions scenario modelled transition of 12 archetypes for “No Intervention” and “Efficient Technologies” deployment scenarios
Figure 75: Glasgow high emissions scenario modelled transition of 12 archetypes for “Passive First” deployment scenario

Cooling in the UK
165
11. Appendix E: Modelling Packages of Measures
A model was developed incorporating 12 different building types; A01 to A06 are residential buildings, and A07 to A12 are non-domestic buildings:
• A01: Existing detached house;
• A02: Existing semi-detached house;
• A03: New semi-detached house;
• A04: Existing mid-terrace house;
• A05: Existing mid-floor flat;
• A06: New mid-floor flat;
• A07: Existing office;
• A08: Existing hospital;
• A09: Existing student residential;
• A10: Existing school;
• A11: New school;
• A12: Existing warehouse.
For ease, the model containing these 12 different building types is referred to as a ‘Village’.
The following sections describe some of the key inputs used within the Village models developed to model the effects of the different cooling packages.
11.1 Geometry
The geometries for each of the above listed building types have been based on archetypes that AECOM has developed for other research projects and are representative of typical arrangements within the UK.
Within the Village model, buildings are separated by distances to account for typical street dimensions and other features such as parking and vehicle access so that the different buildings are subject to levels of shading appropriate for the building type.

Cooling in the UK
166
Figure 76: Screenshot illustrating Building Spacing
11.2 Building Fabric & Infiltration
The following table describes the key fabric performances included within the Business as Usual Village model, along with the assumed infiltration rates.
Table 24: Key Fabric Performances within Business as Usual Model
Building Type
U-value (W/m²K) Glazing g-value (%)
Infiltration (ach) Ground
Floor External Wall
Roof External Doors
Windows
A01 0.45 0.45 0.25 3.30 3.30 76 0.52
A02 0.51 0.49 0.26 3.10 3.10 76 0.52
A03 0.13 0.18 0.13 1.00 1.40 63 0.25
A04 1.20 1.70 0.26 3.10 3.10 76 0.52
A05 N/A 0.45 N/A 3.30 3.30 76 0.52
A06 N/A 0.18 N/A 1.00 1.40 63 0.35
A07 0.45 0.45 0.25 N/A 3.30 76 0.45
A08 0.45 0.45 0.25 N/A 3.30 76 0.35
A09 0.45 0.45 0.25 N/A 3.30 76 0.50
A10 0.45 0.45 0.25 N/A 3.30 76 0.38
A11 0.22 0.26 0.18 N/A 1.60 40 0.15
A12 0.45 0.45 0.25 0.70 3.30 76 0.33

Cooling in the UK
167
11.3 Heating & Cooling
Within the domestic buildings, heating is assumed to operate between October and 15th April to a set point of 20ºC within bedrooms, dining rooms, living rooms, kitchens, bathrooms and ensuites. There is no cooling within the domestic buildings within the Business as Usual scenario.
Within the non-domestic buildings, heating operates in accordance with the applicable NCM activity templates for the spaces. For the Business as Usual scenario, there is only cooling applied within the treatment, consultation and examination rooms within the Hospital, and this is applied in accordance with the applicable NCM activities.
11.4 Mechanical Ventilation
Within the domestic buildings, bathrooms and ensuites are modelled with extract ventilation, except in A01 where the wet rooms that have an external window are assumed to have no mechanical ventilation due to intermittent use of a fan in this space (i.e. only used when having shower/bath for short period of time). Kitchens are assumed to have boost extract ventilation used during cooking.
Within the non-domestic buildings, the following spaces have mechanical ventilation:
• A8 Hospital – extract in showers, changing rooms, toilets, dirty utility rooms. Supply and extract in all internally occupied rooms that do not have external windows, all eating/drinking rooms and lounges.
• A09 Student Residential – kitchen and restaurant.
• A10 and A11 School – extract in toilets.
• A12 Warehouse – extract in toilets, changing rooms, and shower rooms. Supply and extract in conference, canteen, cash room and managers office.
11.5 Natural Ventilation
Natural ventilation in the domestic and non-domestic building models is modelled using Macroflo in the IES software. Windows are modelled as opening during occupied periods only, on the basis of the internal temperature.

Cooling in the UK
168
11.6 Internal Gains
Internal gains in domestic buildings are included in accordance previous overheating analysis commissioned by MHCLG 64.
Internal gains in non-domestic buildings are modelled in accordance with the applicable NCM activity templates, with the exception of circulation, cupboards and plant rooms where occupancy gains have been removed. Heat gains from lighting has been entered on the basis of high efficiency tungsten lighting.
64 MHCLG (2019). Research into overheating in homes – Phase 1 report. https://assets.publishing.service.gov.uk/government/uploads/system/uploads/attachment_data/file/835240/Research_into_overheating_in_new_homes_-_phase_1.pdf

Cooling in the UK
169
12. Appendix F: Current Cooling Market Growth Research Findings
12.1 Domestic Sector
12.1.1 Strong growth in retrofit of domestic cooling is anticipated, due to rising temperatures and a move to home working
• Industry stakeholders have been identifying significant growth over the last year, in the UK and across other growth markets in Europe
o “growth of 20% in sales in the UK” – product manufacturer
o “In the Netherlands, 2.5x more ACs were sold this year than previous years” - Alklima Mitsubishi Electric
o "Air conditioning installation companies are increasingly busy, especially with the heat of last week. Jordy van de Griendt of Klimax Installation companies notices this too." https://nos.nl/artikel/2295688-klimaatverbond-airco-s-frustreren-doelstellingen-klimaatakkoord.html
• In mature markets such as Italy, sales are highly linked to previous summer and this year's spring temperatures e.g. spike in sales in 2016 following warm 2015 and warm 2016 spring.
• Prices are dropping, increasing customer appeal resulting in greater uptake
• S-curve growth is anticipated, with clustering effects as residents see their neighbours installing systems
12.1.2 The retrofit market is likely to start with portable cooling units, which will subsequently be replaced by single split units
• Prices of portable cooling units are low and are easily accessible reactive purchases during time of high temperature.
• Limitations of portable cooling units e.g. noise will eventually push customers to installed systems once benefits/need has been confirmed and customer expectations adjust. This is likely to start in higher income households.
• Residents typically start with one room and expand, as observed in the Nordic markets.
• Likely to be cities, where a heat island effect elevates temperatures, and rural areas, where a rise in home offices is anticipated.
• Single split units are increasingly being installed in home offices in garages, conservatories or extensions due to their ability to meet both heating and cooling demand.

Cooling in the UK
170
12.1.3 New build market will remain a key sector for new sales
• Overheating issues in luxury multi-family apartments are already driving sales of cooling systems, especially in the south of England. We expect this trend to continue, with these systems becoming increasingly common.
• In the medium term, this trend is likely to extend to luxury single family homes.
• Building regulations currently inhibit installation of cooling systems during the build stage. However, immediate retrofit of an cooling system post-handover has been observed.
• Significant change in building regulations are expected from 2025, which might drive air/air heat pumps to be main heating system for new builds from this time as heat demand reduces due to improved building fabric.65
12.2 Non-domestic Sector
12.2.1 Demand for cooling is anticipated to have limited growth
• Cooling is already common in non-domestic sites, particularly large offices, hospitality and retail, driven by a change in occupant expectations. Potential growth sectors for the cooling market include:
o Schools - requirements may be brought in to prevent students from staying in school once certain temperatures are reached or air quality thresholds exceeded. This could drive the installation of cooling and ventilation systems to limit impact on school operation.
o Hospitals - hospitals are seen as a key segment for heat pump solutions due to their 24/7 occupancy profile and high need for comfort to be maintained.
o Warehouses - warehouses with built in office space, or requirements to keep goods below a certain temperature, could see increased single or multi-split systems in future as temperatures increase. Air-to-air systems are low cost and decision makers find having a single HVAC system appealing.
12.2.2 New build will continue to dominate non-domestic sales
• The new build sector makes up the largest proportion of current sales of non-domestic cooling, with purpose-built offices, hospitality and retail installing cooling systems as standard.
65 Decisions around allowing cooling modes to be enabled as part of building regulations could influence how frequently air-to-air systems are selected. However, in the French market, air-to-air heat pumps are frequently being installed despite building regulations requiring cooling mode to be disabled. This is typically reactivated once the homes have been handed over to occupants.

Cooling in the UK
171
12.2.3 Chillers are seen as a competing solution to cooling
• This is being driven by refrigerant regulations getting tighter, requiring increasing checks and maintenance, leading to water-based systems being more appealing. This trend has been observed in the Nordic markets, where tighter regulations on F-gas is impacting the market for larger cooling systems.

Cooling in the UK
172
13. Appendix G: Overview of Barriers & Decision Making
13.1 Specific factors identified during course of this research
13.1.1 Air-to-air heat pumps (split units)
Split cooling systems dominate the active cooling market in terms of unit sales due to their low cost, modularity, and ease of installation. There is a mature supply chain and installer network focussed predominantly on the non-domestic sector but increasingly also the domestic sector.
A view from the industry is that air-to-air systems are one of the most appropriate methods for providing both heating and cooling to new build homes in the future, being capable of meeting the low space heating demands in modern homes, providing higher efficiencies than air to water systems, and at much lower cost than an air to water HP and hydronic heating system. Findings from research in this project suggest that air-to-air systems are increasingly being installed in new build homes immediately post completion for cooling and potentially heating.
It should be noted that in the SME non-domestic sector where split units dominate the cooling solution, around two thirds of installations which can operate in heating and cooling mode are the only form of heating available to the building66.
Barriers identified include:
• The difference in treatment of air-to-air heat pumps vs air-to-water heat pumps in policy and regulation. Whilst air-to-water systems are actively promoted as a low carbon heating source with associated fiscal incentives (such as the RHI) and policy benefits at a local and national level (e.g. local planning requirements, national building regulations), air-to-air systems are excluded. A view from the industry is that this could lead to the installation of higher cost and less efficiency heating systems for new homes, missing out on the opportunities that air-to-air systems may provide. A specific barrier raised included the removal of the lower energy saving VAT rate of 5% on split cooling by HMRC last October. Removing these barriers and enabling air-to-air systems to compete with air-to-water systems could potentially result in a much higher uptake of heat pumps for heating at a lower cost to consumers.
• Householders have lack of knowledge about cooling systems. Most homeowners are not aware that air-to-air cooling systems can provide heating alongside cooling. The potential for cooling systems to provide a gradual transition to heating by operating in parallel with existing gas-based systems may therefore be missed.
66 The Contribution of Reversible Air-to-Air Heat Pumps to the UK’s Obligation under the Renewable Energy Directive (2009/28/EC). Delta-EE for BEIS. 2017. Results from an interview survey with 100 SMEs.

Cooling in the UK
173
• Cooling installers need training to offer the best solution for their customers. In general, the cooling industry is focussed on the commercial sector and has a relatively poor understanding of the domestic sector’s needs resulting in a poor customer journey. This can provide a clinical and technical approach to homeowners and may result in poor advice and installation practices delivering sub-optimal systems. There is also concern over the use of unskilled labour being used in installations and greater inclusion into a regulated framework such as the MCS system would be beneficial.
• Air-to-air systems are not suitable for heating in many domestic properties where there are higher heat demands. Installing as a cooling-only option will therefore lose the benefits associated with the renewable heating.
It is likely that the market for air-to-air systems (predominantly single split but also multi-split) will increase significantly in the domestic sector driven by comfort expectations, and therefore potential considerations include:
• Understanding how air-to-air technologies can be considered as a renewable heating technology alongside air-to-water HPs to increase the potential for renewable heating. This means addressing barriers around building regulations and the broader policy framework in a way which enables installation for cooling purposes whilst also accessing the heating benefits.
• Developing the domestic supply chain to provide a more tailored customer offering where the supply chain and installers have a better understanding of the domestic market needs, and can deliver more suitable and optimised systems.
• Better understanding of the niche role that air-to-air systems could have as a stand-alone heating and cooling system in the domestic sector (e.g. the home office market identified in this work, but also for supplementary cooling and heating in other parts of homes and buildings), and how to provide a supportive policy framework to maximise the benefits across heating and cooling.
13.1.2 VRF cooling systems
VRF systems are well established in the non-domestic market but form a minority of the cooling and heating solutions in the domestic sector. The focus is around premium new build flats (believed predominantly to be in London), and high value single home retrofits.
Similarly, to split units, VRF systems provide an alternative to boiler-based hydronic heating systems with the ability to provide high efficiency space heating and cooling simultaneously. Barriers to the uptake of VRF systems are:
• Systems are predominately aimed at the non-domestic sector and therefore capacities are generally suited to larger buildings. This means in the domestic sector they are installed as maxi-systems across multiple dwellings (for example on average Delta-EE understands that around 3 flats are connected to a single VRF system), or as mini-systems in large domestic retrofits (for example large premium town houses).

Cooling in the UK
174
• VRF systems are more expensive to install than split units. They are generally only used in the premium end of the domestic market, either in new build flats, or older home retrofits.
• As a predominately non-domestic solution, the domestic supply chain is not catering for VRF solutions. They are not generally accessible to the domestic market unless through the use of professional HVAC design companies as part of new build or major retrofit projects.
13.1.3 Domestic supply chains
Some of the issues around the domestic supply chains have been discussed in the previous section. Alongside these factors, a barrier to high quality installations raised through the research is the routes which homeowners take to identify cooling solutions and providers.
In the heating sector, consumers are most likely to rely on expert advice from local installers for replacing their system, potentially based on recommendations from friends or relatives. However, this relationship for cooling does not exist, and there is a greater reliance on using searches and on-line platforms with very little knowledge about what is suitable or high quality. There is some concern from the industry that recent increases in domestic cooling demand will result in a greater number of poor-quality products and unscrupulous suppliers cashing in on the market.
In light of the strengthening market, there is a need for more guidance for consumers and measures to ensure that appropriate systems are supplied. In particular if air-to-air cooling systems become a primary heating technology, then the current safeguards and standards in the heating sector could be broadened to include the cooling sector.
13.1.4 Refrigerant related issues
The research identified some potential barriers and issues around refrigerants and F-gas regulations.
Whilst F-gas regulations apply to the domestic sector, there is no requirement for a logbook or mandatory leak checking at routine intervals for any systems containing less than 5 tonnes CO2 equivalent. With many domestic installations potentially falling under this size, this presents a potential risk in terms of overall leakage levels.
F-gas regulations are moving towards hydrocarbon refrigerant solutions for smaller air-to-air split units such as R290 (propane). Concerns have been raised during the research in this project about the availability of skills and the potential risks arising from this particularly in a domestic installation. Recommendations were made from consultees that there needs to be a similar set of safety training and standards as for the current Gas Safe scheme.

Cooling in the UK
175
13.2 Route to Market Considerations
Those responsible for designing and selecting the cooling measure are linked to the type of building, i.e. domestic or non-domestic, whether it is a new build or retrofit application, and the size of the installation. This influences the cooling measure(s) adopted in the building unless limited by regulation. The following highlights some of the considerations, along with the associated decision-making processes which can influence the choice of technology.
In the commercial sector, the following key influences are experienced:
• For projects with a cooling output less than 50kW, generally the installer is the key decision maker with regards to the type and brand of system. Conversely, for systems greater than 50kW, there are often a larger number of influencers, and the key decision maker(s) depend on the project. On these larger scale projects, the chiller or heat pump manufacturer will usually have a much greater involvement in the planning and design phase of the project, often through their own sales engineers.
• For smaller scale projects, the usual supply channel is via wholesalers, and manufacturers are only involved in a consulting role at the request of the installer. This contrasts with larger scale projects where direct sales to the installer/contractor, or even end-user, are more common.
• Considering new build projects, in these cases the HVAC consultant plays a key role through their specifications. Often in these projects, different lots are separately tendered and installers/contractors bid trying to put in the best offer with a product complying with the consultant’s specification. On new build projects, there is the potential that some players, without being a key decision maker, could influence the brand decision. Furthermore, teams may have a preferred brand based on past experience.
• However, for replacement projects, it is generally the company providing the maintenance that is the key decision maker. Furthermore, in retrofit projects, the customer’s experience with the brand and product installed will play an important role in decision making.
• For replacement projects, where the chiller/heat pump manufacturer is providing maintenance services, this gives them a clear advantage in their bid to supply new equipment. However, if the installation is being replaced after an energy audit by an external company, this company will usually play a key role in specifying and deciding upon the new solution.
Information for the domestic sector is generally more limited, however it is thought that influences here may be similar to those experienced by small commercial buildings described above.
The small building sector decision making process is relatively simple and often installer-led. Medium/large buildings decision making process is more complex with projects having a multitude of stakeholders and a highly competitive tendering processes.

Cooling in the UK
176
Small building sectors: The decision-making process is often simple and with end users often talking directly with installers. The client will likely obtain a small number of quotes. The supply chain is characterised by a large number of small companies.
Table 25: Decision Makers in Small Building Sector
Players Roles End-users (E.g. Building owners, facility management co., occupants)
Main priorities are meeting the comfort / technical requirements, economics, low disruption. Can have some influence on recommended system type and product solutions if awareness level is high enough.
Installers Very important role. Will usually act as the specifier, suggesting to the client a range of possible solutions (both in terms of system type and brand choice). Possible solutions have high probability of being chosen by the final decision maker.
Their recommendations will depend on the conditions and requirements of the project and on factors like purchasing costs, knowledge about possible solutions, existing relationships with manufacturers or their distributors and previous experience with a specific brand/product.
Architects Only relevant for new build projects or substantial extensions/refurbishments. Might influence the system choice by recommending specific systems.
Energy consultants
A fairly new but increasingly important player. Will trigger projects and might also recommend / prescribe solutions and brands.
HP / HVAC manufacturer
Need to make sure that all actors are aware of their solutions. Support installer in specifying the system.
Medium / large building sectors: Building projects involve many stakeholders, sometimes with their own agenda, in an often fragmented process. The whole process is likely to be highly competitive, with a number of tendering processes. It is possible to develop strong relationships in the private sector to ease this process, but public sector procurement will usually be open.
Table 26: Decision Makers in Medium/Large Building Sector
Players Roles End-users (E.g. Building owners, facility management co., occupants)
Main priorities are meeting the comfort / technical (temperature, etc.) requirements, economics, low disruption. Can have some influence on recommended system type and product solutions if awareness level is high enough.

Cooling in the UK
177
Players Roles Designers / specifiers (M&E engineer, energy specialist, etc).
Responsible for developing design concepts though outline design to detailed design stages (identified by the RIBA plan of work). Responsible for identifying solutions which meet the client needs and range of drivers (regulatory, planning, etc). Writing and supporting development of tender documents for D&B contracts, or final contractor. May identify “example” solutions / products in the designs and specifications.
Contractors Design & Build route: Contractors will develop outline designs to detailed design. They may change designs and specifications at this stage.
Conventional route: Contractors carry out buildings work and installation (potentially with sub-contractors) in line with the detailed designs and specifications in the tender. Products and suppliers may be changed if alternatives can be sourced which meet the same requirements.
Commercial advisors
May advise clients and end users on building management and operation strategies. Often highly influential in the design of a scheme. Could be the gateway to offering a new lifecycle proposition.
Energy consultants Increasingly important – may trigger projects and might also recommend / prescribe solutions and brands or the general specifying engineer (if not the same company already).
HP / HVAC manufacturer
Need to make sure that all players are aware of their solutions. Will need to be active in the construction industry and the professional building services industry.

This publication is available from: www.gov.uk/beis
If you need a version of this document in a more accessible format, please email [email protected]. Please tell us what format you need. It will help us if you say what assistive technology you use.