cool campus challenge 2015 - sustainability · knowledge of the carbon neutrality ... cool campus...
TRANSCRIPT
1 | P a g e
Cool Campus Challenge 2015
Program Summary and Evaluation
May 2016
Prepared by:
Christopher M. Jones*†
Kira Stoll ‡
Jewel Snavely§
Janika McFeelyλ Sara McKinstry*
†CoolClimate Network, Renewable and Appropriate Energy Laboratory, UC Berkeley
‡ UC Berkeley Office of Sustainability and Energy §UC Santa Barbara Office of Sustainability
λ UC Office of the President, Energy and Sustainability §UC Santa Barbara Office of Sustainability
*UC San Diego Sustainability
* Corresponding authors: Jones ([email protected], 510-643-5048); contact Jones for research and data related inquiries.
Stoll ([email protected], 510-642-0074) Snavely ([email protected], 805.893.8367)
McFeely ([email protected], (510) 987-9896) McKinstry ([email protected], 858.534.5563)
2 | P a g e
Table of Contents Executive Summary ................................................................................................................... 4 Overview .................................................................................................................................... 5 Program Design ......................................................................................................................... 6
Project Team .......................................................................................................................... 6 Resources .............................................................................................................................. 6 Research and Theoretical Foundation for the Program .......................................................... 7 Communications and Outreach .............................................................................................10
Figure 1. Screenshots of website ......................................................................................11 The Ten-Week CCC Themes and Timeline ...........................................................................11
Table 1. Weekly Themes ...................................................................................................11 Pledges .................................................................................................................................12
Table 2. Pledges, points and CO2 savings ........................................................................12 Point Structure ......................................................................................................................13
Table 3. Actions and points ...............................................................................................13 Software ................................................................................................................................13
Figure 2. Screenshot of challenge tool profile page ...........................................................14 Figure 3. Screenshot of example teams page: UC Berkeley's Cal Band ............................15
Centralized Communication ..................................................................................................15 Reported Results ......................................................................................................................17
Participation ..........................................................................................................................17 Table 4. Participation of faculty, staff and students by campus ..........................................17 Figure 4. Participants by campus over time .......................................................................18
Teams ...................................................................................................................................18 Table 5. Participants on teams by campus ........................................................................19
Points and Levels ..................................................................................................................19 Table 6. Final points and rankings after validation process ................................................20 Figure 5. Participants by campus over time .......................................................................20 Table 7. Number of participants achieving different levels, by campus ..............................21
Pledges .................................................................................................................................21 Most Popular Pledges .......................................................................................................21 Figure 6. Most popular verified pledges .............................................................................22 Popularity of new actions pledged .....................................................................................22 Figure 7. Number of participants taking each pledge as a new action ...............................23 Table 8. Example of validation stories for new pledges .....................................................24 Popularity of actions already being done ...........................................................................24 Figure 8. Percentage of staff who already take actions .....................................................25 Figure 9. Percentage of students who already take actions ...............................................26
Persistence of pledged actions ..............................................................................................26 Figure 10. Self-reported persistence .................................................................................27
Greenhouse Gas Savings .....................................................................................................27 Table 9. Estimate GHG savings (metric tons CO2) by campus..........................................27
Participant Survey .....................................................................................................................28 Who participated in the CCC .................................................................................................28
Figure 11. Surveys by campus ..........................................................................................28 Figure 12. Surveys by campus appointment ......................................................................28 Figure 13. Survey by age ..................................................................................................29 Figure 14. Surveys by gender............................................................................................29
Beliefs about climate change.................................................................................................29 Figure 15. Political orientation ...........................................................................................29
Awareness about climate change ..........................................................................................29
3 | P a g e
Figure 16. Awareness of climate change ...........................................................................30 Figure 17. Cause of climate change ..................................................................................30
Concern and empowerment ..................................................................................................30 Figure 18. Level of concern about climate change .............................................................31 Figure 19. Belief in ability to affect climate change ............................................................31
Awareness of UC sustainability efforts ..................................................................................31 Figure 20. Knowledge of the Carbon Neutrality Initiative ...................................................32 Figure 21. Participation in campus sustainability communications .....................................32
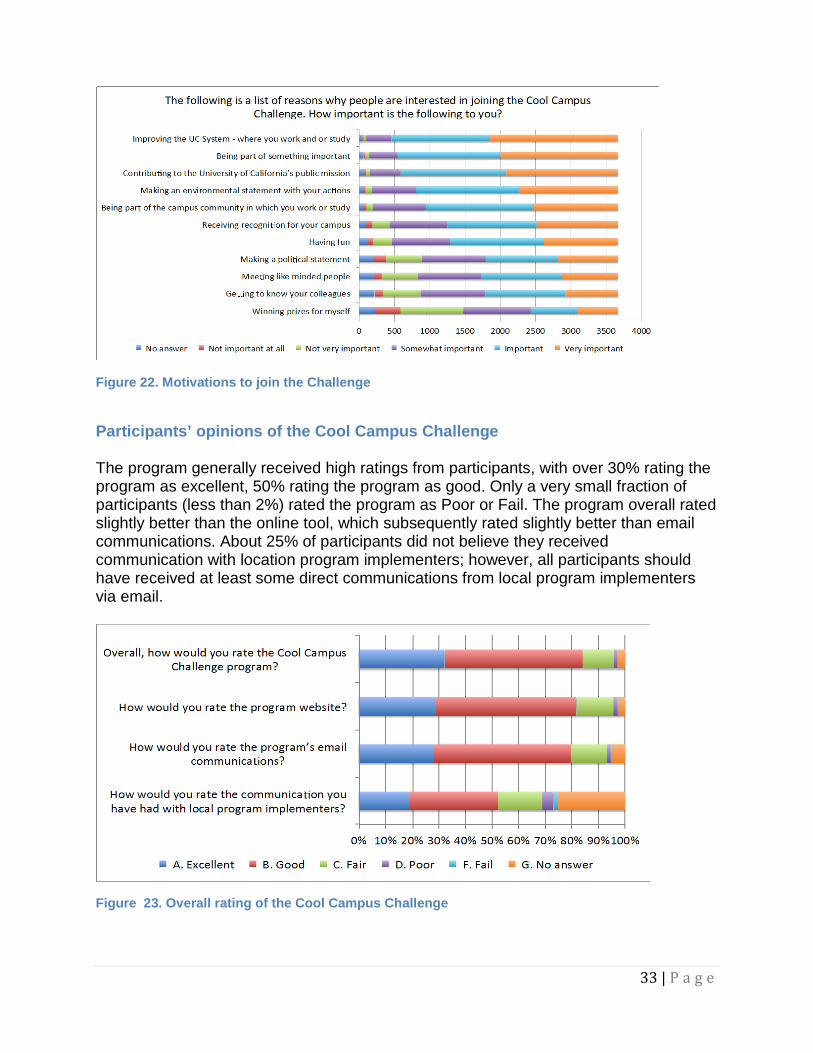
Motivation to participate ........................................................................................................32 Figure 22. Motivations to join the Challenge ......................................................................33
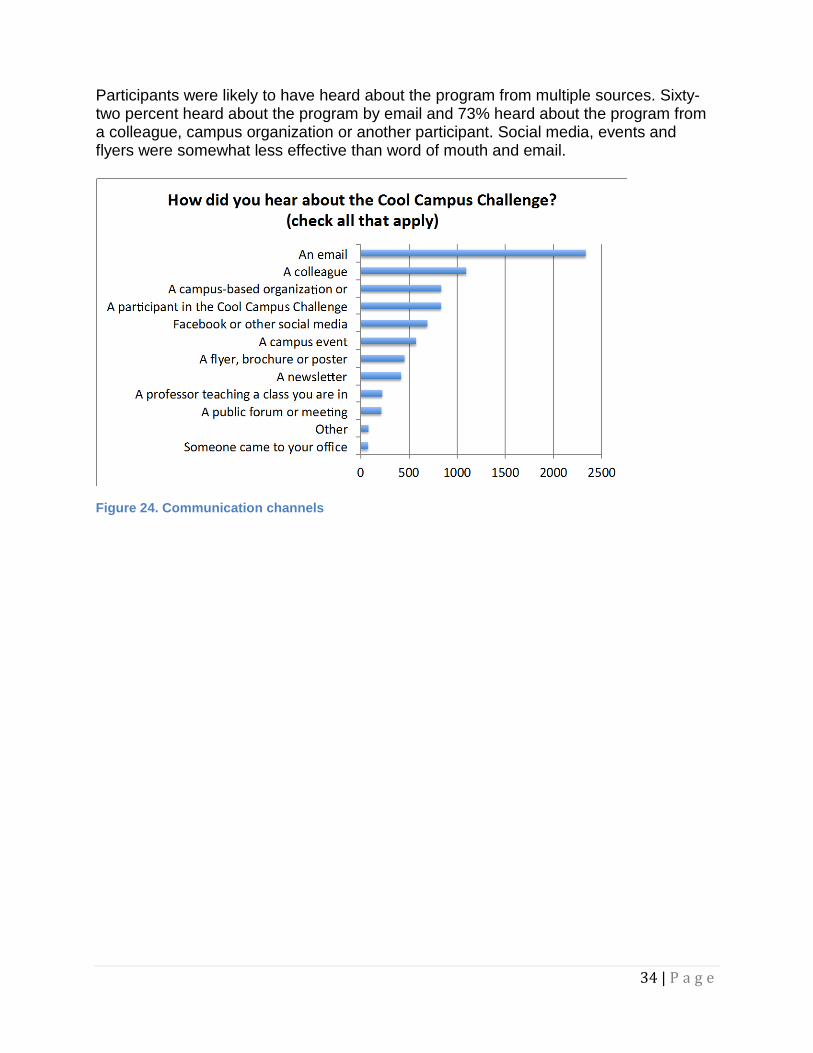
Participants’ opinions of the Cool Campus Challenge ...........................................................33 Figure 23. Overall rating of the Cool Campus Challenge ..................................................33 Figure 24. Communication channels .................................................................................34
Summary ..................................................................................................................................35 Participation ..........................................................................................................................35 Greenhouse gas savings .......................................................................................................35 Cost-effectiveness .................................................................................................................35 Survey Results ......................................................................................................................36 Evaluation .............................................................................................................................36
Recommendations for Future Programs....................................................................................37 Cited References ......................................................................................................................39 Appendix A. Additional Figures and Tables ...............................................................................40
Data from software tool .........................................................................................................40 Additional participant survey responses ................................................................................44
Appendix B: Assumptions for Pledges ......................................................................................45 Appendix C: Detailed data by campus ......................................................................................49
Cool Campus Challenge 2015 Summary - UC Berkeley ........................................................50 Cool Campus Challenge 2015 Summary - UC Davis ............................................................63 Cool Campus Challenge 2015 Summary - UC Irvine .............................................................74 Cool Campus Challenge 2015 Summary - UC Los Angeles ..................................................85 Cool Campus Challenge 2015 Summary - UC Merced..........................................................93 Cool Campus Challenge 2015 Summary - UCOP ............................................................... 105 Cool Campus Challenge 2016 Summary – Riverside .......................................................... 112 Cool Campus Challenge 2015 Summary – San Diego ........................................................ 120 Cool Campus Challenge 2015 Summary – San Francisco .................................................. 129 Cool Campus Challenge 2016 Summary – Santa Barbara .................................................. 135 Cool Campus Challenge 2015 Summary – Santa Cruz ....................................................... 142
4 | P a g e
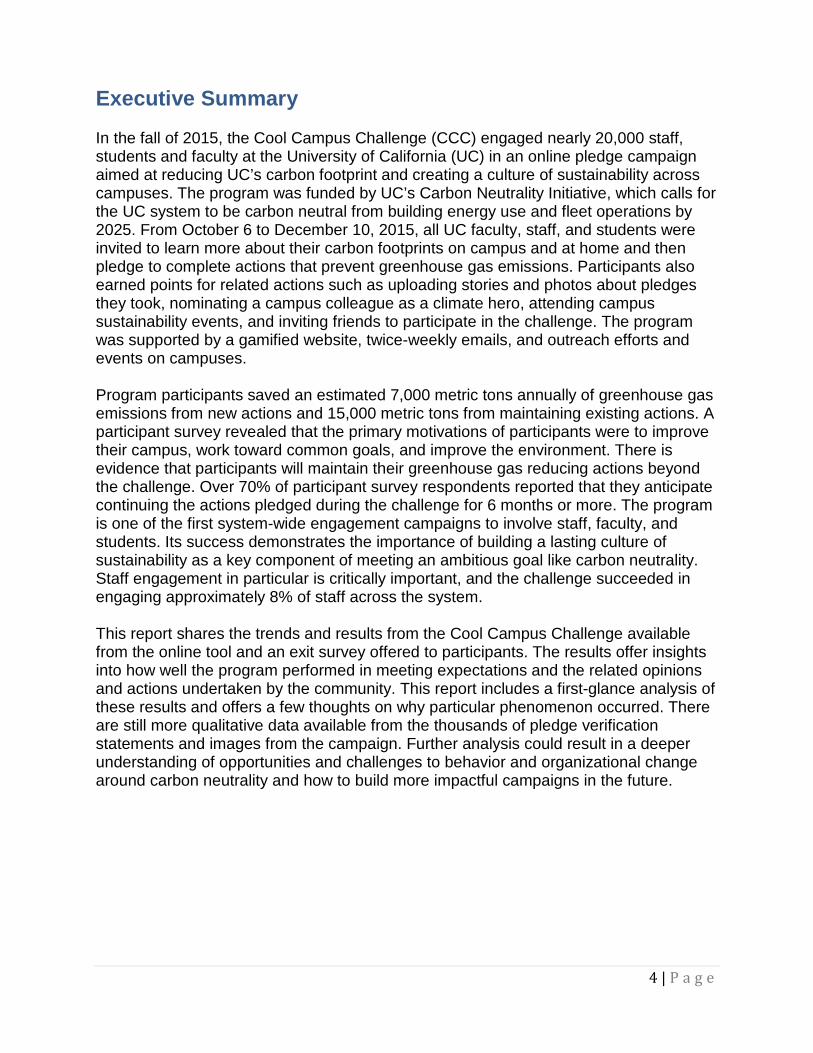
Executive Summary In the fall of 2015, the Cool Campus Challenge (CCC) engaged nearly 20,000 staff, students and faculty at the University of California (UC) in an online pledge campaign aimed at reducing UC’s carbon footprint and creating a culture of sustainability across campuses. The program was funded by UC’s Carbon Neutrality Initiative, which calls for the UC system to be carbon neutral from building energy use and fleet operations by 2025. From October 6 to December 10, 2015, all UC faculty, staff, and students were invited to learn more about their carbon footprints on campus and at home and then pledge to complete actions that prevent greenhouse gas emissions. Participants also earned points for related actions such as uploading stories and photos about pledges they took, nominating a campus colleague as a climate hero, attending campus sustainability events, and inviting friends to participate in the challenge. The program was supported by a gamified website, twice-weekly emails, and outreach efforts and events on campuses. Program participants saved an estimated 7,000 metric tons annually of greenhouse gas emissions from new actions and 15,000 metric tons from maintaining existing actions. A participant survey revealed that the primary motivations of participants were to improve their campus, work toward common goals, and improve the environment. There is evidence that participants will maintain their greenhouse gas reducing actions beyond the challenge. Over 70% of participant survey respondents reported that they anticipate continuing the actions pledged during the challenge for 6 months or more. The program is one of the first system-wide engagement campaigns to involve staff, faculty, and students. Its success demonstrates the importance of building a lasting culture of sustainability as a key component of meeting an ambitious goal like carbon neutrality. Staff engagement in particular is critically important, and the challenge succeeded in engaging approximately 8% of staff across the system. This report shares the trends and results from the Cool Campus Challenge available from the online tool and an exit survey offered to participants. The results offer insights into how well the program performed in meeting expectations and the related opinions and actions undertaken by the community. This report includes a first-glance analysis of these results and offers a few thoughts on why particular phenomenon occurred. There are still more qualitative data available from the thousands of pledge verification statements and images from the campaign. Further analysis could result in a deeper understanding of opportunities and challenges to behavior and organizational change around carbon neutrality and how to build more impactful campaigns in the future.
5 | P a g e
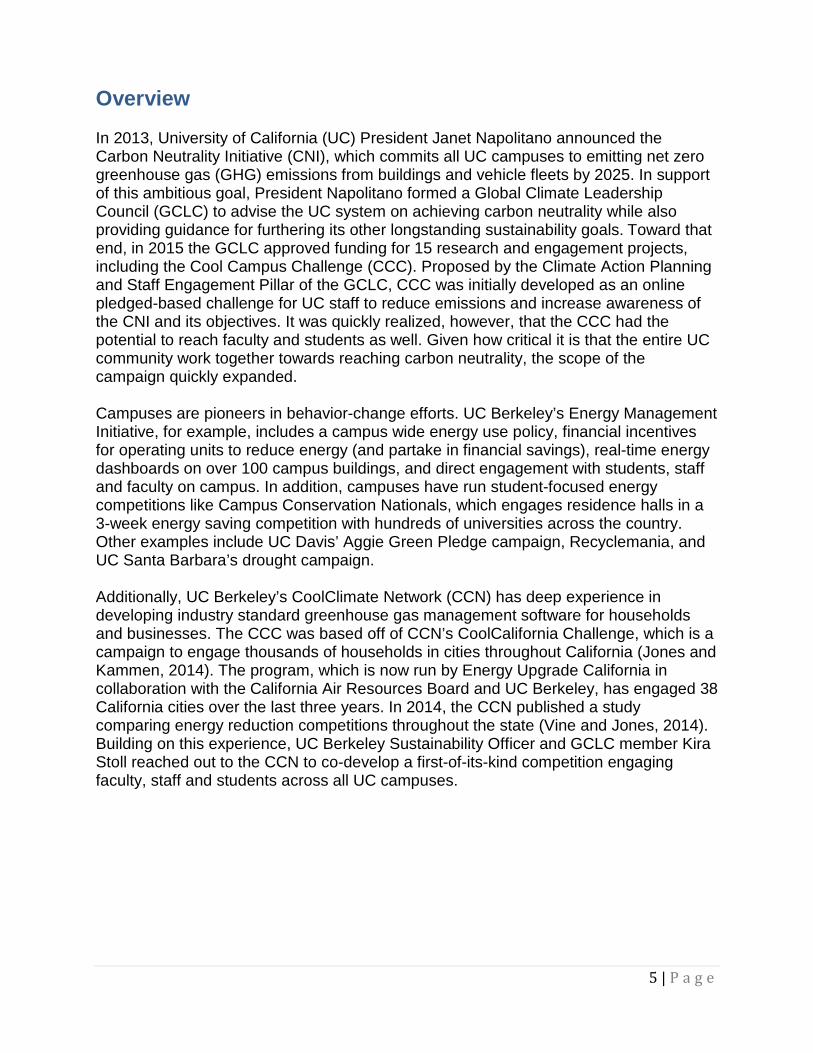
Overview In 2013, University of California (UC) President Janet Napolitano announced the Carbon Neutrality Initiative (CNI), which commits all UC campuses to emitting net zero greenhouse gas (GHG) emissions from buildings and vehicle fleets by 2025. In support of this ambitious goal, President Napolitano formed a Global Climate Leadership Council (GCLC) to advise the UC system on achieving carbon neutrality while also providing guidance for furthering its other longstanding sustainability goals. Toward that end, in 2015 the GCLC approved funding for 15 research and engagement projects, including the Cool Campus Challenge (CCC). Proposed by the Climate Action Planning and Staff Engagement Pillar of the GCLC, CCC was initially developed as an online pledged-based challenge for UC staff to reduce emissions and increase awareness of the CNI and its objectives. It was quickly realized, however, that the CCC had the potential to reach faculty and students as well. Given how critical it is that the entire UC community work together towards reaching carbon neutrality, the scope of the campaign quickly expanded. Campuses are pioneers in behavior-change efforts. UC Berkeley’s Energy Management Initiative, for example, includes a campus wide energy use policy, financial incentives for operating units to reduce energy (and partake in financial savings), real-time energy dashboards on over 100 campus buildings, and direct engagement with students, staff and faculty on campus. In addition, campuses have run student-focused energy competitions like Campus Conservation Nationals, which engages residence halls in a 3-week energy saving competition with hundreds of universities across the country. Other examples include UC Davis’ Aggie Green Pledge campaign, Recyclemania, and UC Santa Barbara’s drought campaign. Additionally, UC Berkeley’s CoolClimate Network (CCN) has deep experience in developing industry standard greenhouse gas management software for households and businesses. The CCC was based off of CCN’s CoolCalifornia Challenge, which is a campaign to engage thousands of households in cities throughout California (Jones and Kammen, 2014). The program, which is now run by Energy Upgrade California in collaboration with the California Air Resources Board and UC Berkeley, has engaged 38 California cities over the last three years. In 2014, the CCN published a study comparing energy reduction competitions throughout the state (Vine and Jones, 2014). Building on this experience, UC Berkeley Sustainability Officer and GCLC member Kira Stoll reached out to the CCN to co-develop a first-of-its-kind competition engaging faculty, staff and students across all UC campuses.
6 | P a g e
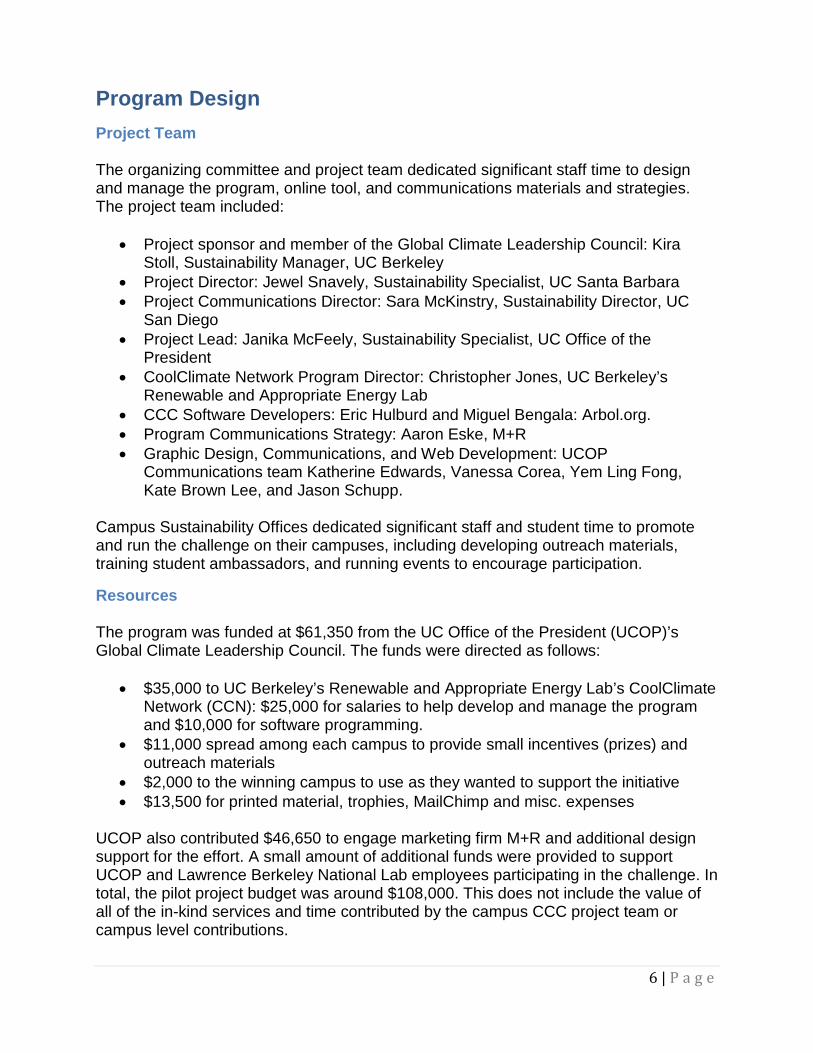
Program Design Project Team The organizing committee and project team dedicated significant staff time to design and manage the program, online tool, and communications materials and strategies. The project team included:
• Project sponsor and member of the Global Climate Leadership Council: Kira Stoll, Sustainability Manager, UC Berkeley
• Project Director: Jewel Snavely, Sustainability Specialist, UC Santa Barbara • Project Communications Director: Sara McKinstry, Sustainability Director, UC
San Diego • Project Lead: Janika McFeely, Sustainability Specialist, UC Office of the
President • CoolClimate Network Program Director: Christopher Jones, UC Berkeley’s
Renewable and Appropriate Energy Lab • CCC Software Developers: Eric Hulburd and Miguel Bengala: Arbol.org. • Program Communications Strategy: Aaron Eske, M+R • Graphic Design, Communications, and Web Development: UCOP
Communications team Katherine Edwards, Vanessa Corea, Yem Ling Fong, Kate Brown Lee, and Jason Schupp.
Campus Sustainability Offices dedicated significant staff and student time to promote and run the challenge on their campuses, including developing outreach materials, training student ambassadors, and running events to encourage participation.
Resources The program was funded at $61,350 from the UC Office of the President (UCOP)’s Global Climate Leadership Council. The funds were directed as follows:
• $35,000 to UC Berkeley’s Renewable and Appropriate Energy Lab’s CoolClimate Network (CCN): $25,000 for salaries to help develop and manage the program and $10,000 for software programming.
• $11,000 spread among each campus to provide small incentives (prizes) and outreach materials
• $2,000 to the winning campus to use as they wanted to support the initiative • $13,500 for printed material, trophies, MailChimp and misc. expenses
UCOP also contributed $46,650 to engage marketing firm M+R and additional design support for the effort. A small amount of additional funds were provided to support UCOP and Lawrence Berkeley National Lab employees participating in the challenge. In total, the pilot project budget was around $108,000. This does not include the value of all of the in-kind services and time contributed by the campus CCC project team or campus level contributions.
7 | P a g e
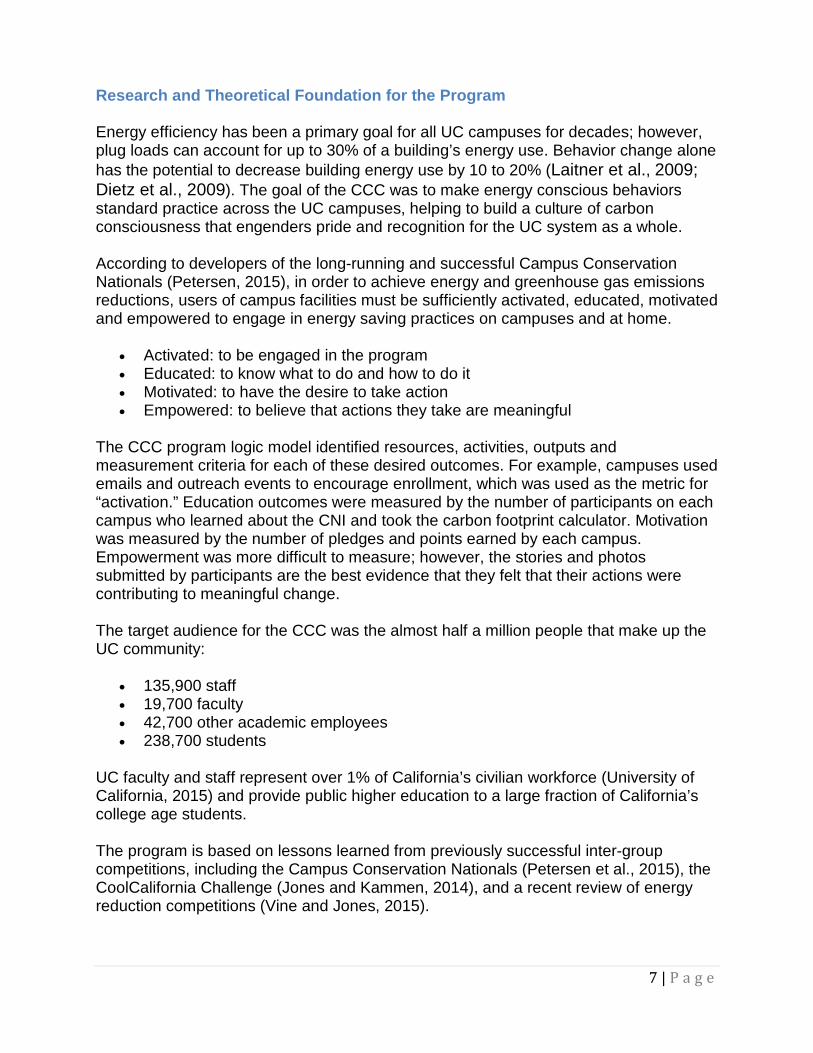
Research and Theoretical Foundation for the Program Energy efficiency has been a primary goal for all UC campuses for decades; however, plug loads can account for up to 30% of a building’s energy use. Behavior change alone has the potential to decrease building energy use by 10 to 20% (Laitner et al., 2009; Dietz et al., 2009). The goal of the CCC was to make energy conscious behaviors standard practice across the UC campuses, helping to build a culture of carbon consciousness that engenders pride and recognition for the UC system as a whole. According to developers of the long-running and successful Campus Conservation Nationals (Petersen, 2015), in order to achieve energy and greenhouse gas emissions reductions, users of campus facilities must be sufficiently activated, educated, motivated and empowered to engage in energy saving practices on campuses and at home.
• Activated: to be engaged in the program • Educated: to know what to do and how to do it • Motivated: to have the desire to take action • Empowered: to believe that actions they take are meaningful
The CCC program logic model identified resources, activities, outputs and measurement criteria for each of these desired outcomes. For example, campuses used emails and outreach events to encourage enrollment, which was used as the metric for “activation.” Education outcomes were measured by the number of participants on each campus who learned about the CNI and took the carbon footprint calculator. Motivation was measured by the number of pledges and points earned by each campus. Empowerment was more difficult to measure; however, the stories and photos submitted by participants are the best evidence that they felt that their actions were contributing to meaningful change. The target audience for the CCC was the almost half a million people that make up the UC community:
• 135,900 staff • 19,700 faculty • 42,700 other academic employees • 238,700 students
UC faculty and staff represent over 1% of California’s civilian workforce (University of California, 2015) and provide public higher education to a large fraction of California’s college age students. The program is based on lessons learned from previously successful inter-group competitions, including the Campus Conservation Nationals (Petersen et al., 2015), the CoolCalifornia Challenge (Jones and Kammen, 2014), and a recent review of energy reduction competitions (Vine and Jones, 2015).
8 | P a g e
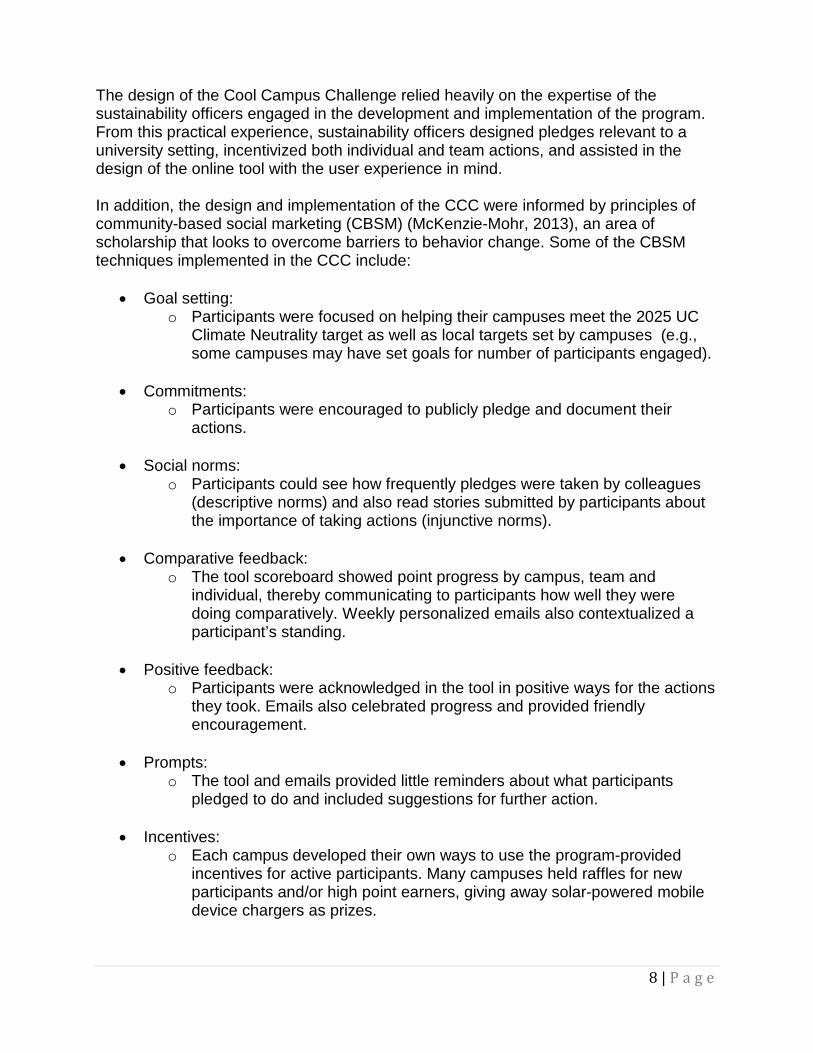
The design of the Cool Campus Challenge relied heavily on the expertise of the sustainability officers engaged in the development and implementation of the program. From this practical experience, sustainability officers designed pledges relevant to a university setting, incentivized both individual and team actions, and assisted in the design of the online tool with the user experience in mind. In addition, the design and implementation of the CCC were informed by principles of community-based social marketing (CBSM) (McKenzie-Mohr, 2013), an area of scholarship that looks to overcome barriers to behavior change. Some of the CBSM techniques implemented in the CCC include:
• Goal setting: o Participants were focused on helping their campuses meet the 2025 UC
Climate Neutrality target as well as local targets set by campuses (e.g., some campuses may have set goals for number of participants engaged).
• Commitments: o Participants were encouraged to publicly pledge and document their
actions.
• Social norms: o Participants could see how frequently pledges were taken by colleagues
(descriptive norms) and also read stories submitted by participants about the importance of taking actions (injunctive norms).
• Comparative feedback: o The tool scoreboard showed point progress by campus, team and
individual, thereby communicating to participants how well they were doing comparatively. Weekly personalized emails also contextualized a participant’s standing.
• Positive feedback: o Participants were acknowledged in the tool in positive ways for the actions
they took. Emails also celebrated progress and provided friendly encouragement.
• Prompts: o The tool and emails provided little reminders about what participants
pledged to do and included suggestions for further action.
• Incentives: o Each campus developed their own ways to use the program-provided
incentives for active participants. Many campuses held raffles for new participants and/or high point earners, giving away solar-powered mobile device chargers as prizes.
9 | P a g e
• Local messengers: o The best messenger is someone within one’s own community. The tool
therefore utilized personalized Facebook like profile pages that were searchable along with a comment thread for each pledge so that participants could share actions in the tool and on their own social media pages.
• Authority:
o Campuses utilized the system-wide carbon neutrality goal as a reason why individual participation was important. In addition, President Napolitano created a video to launch the campaign along with writing letters to each Chancellor to encourage participation. Weekly emails by theme were written by experts related to those themes (i.e. purchasing staff encouraging people to lease or buy Energy Star products).
• Social diffusion: o Campuses utilized existing campus community groups and events to
promote the campaign. For example, many campuses tabled at weekly on-campus farmer’s markets or Homecoming/fall welcome events to sign up new CCC participants.
Through these tools the program sought to create a positive environment that supported participants in their efforts to lead more climate-friendly lifestyles and practices. The program also builds on lessons from a recent review of energy and carbon footprint reduction competitions (Vine and Jones, 2015). The top recommendations from this report are:
• Create Well Crafted Intervention Strategies • Change the Focus from Winning to Doing Well • Know Your Target Audience • Simplify Engaging Software • Be Careful in Scaling Up • Use Rewards But Be Careful • Experiment • Devote More Resources to Measurement and Evaluation • Ensure Persistence
Embedded in the CCC is the idea of challenge and competition as a motivator for participation and engagement. While this is an important aspect of the design, the role and impact of competition in the CCC has only been evaluated on a cursory level. Future programs would benefit from a deeper understanding. Due to limited budget and resources (as any program has) some objectives were easier to meet than others. Future programs of this type should keep these in mind. Additional suggestions are included in the Recommendations section of this report.
10 | P a g e
Communications and Outreach The success of the CCC hinged on the ability to engage across multiple campus constituencies; however, there were no UC system-wide mechanisms with which to promote a campaign such as this. UCOP Communications and the development team therefore worked with a consultant group to help develop messaging for the CCC that could build the broadest reach. In parallel, the Communications team designed a consistent visual look and style that drove the development of the website and challenge tool. Based on these efforts, the team prepared a communications toolkit for the campuses to assist with outreach, which included flyers, door hangers, social media content, email language and templates, and event suggestions. Campuses took these tools and created their own internal campaigns with different events and promotional strategies. For example UC Merced’s PowerSave Program held weekly workshops associated with the weekly theme to encourage student, faculty and staff to participate in the challenge.
11 | P a g e
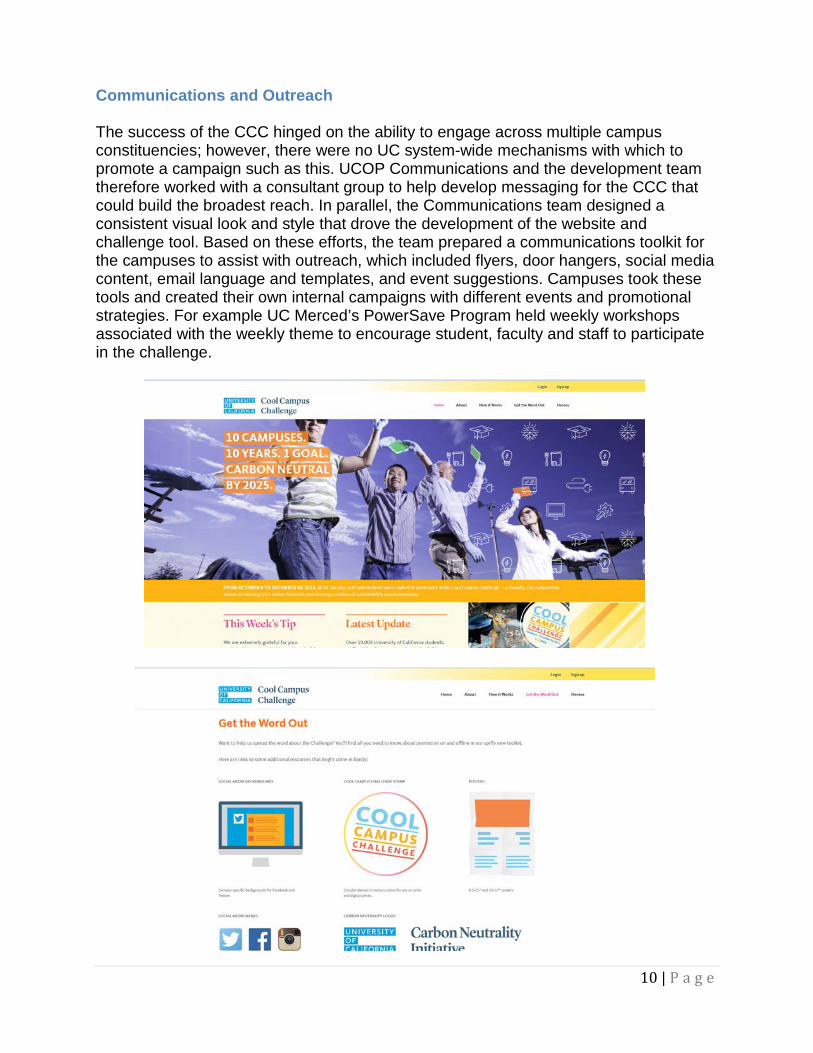
Figure 1. Screenshots of website
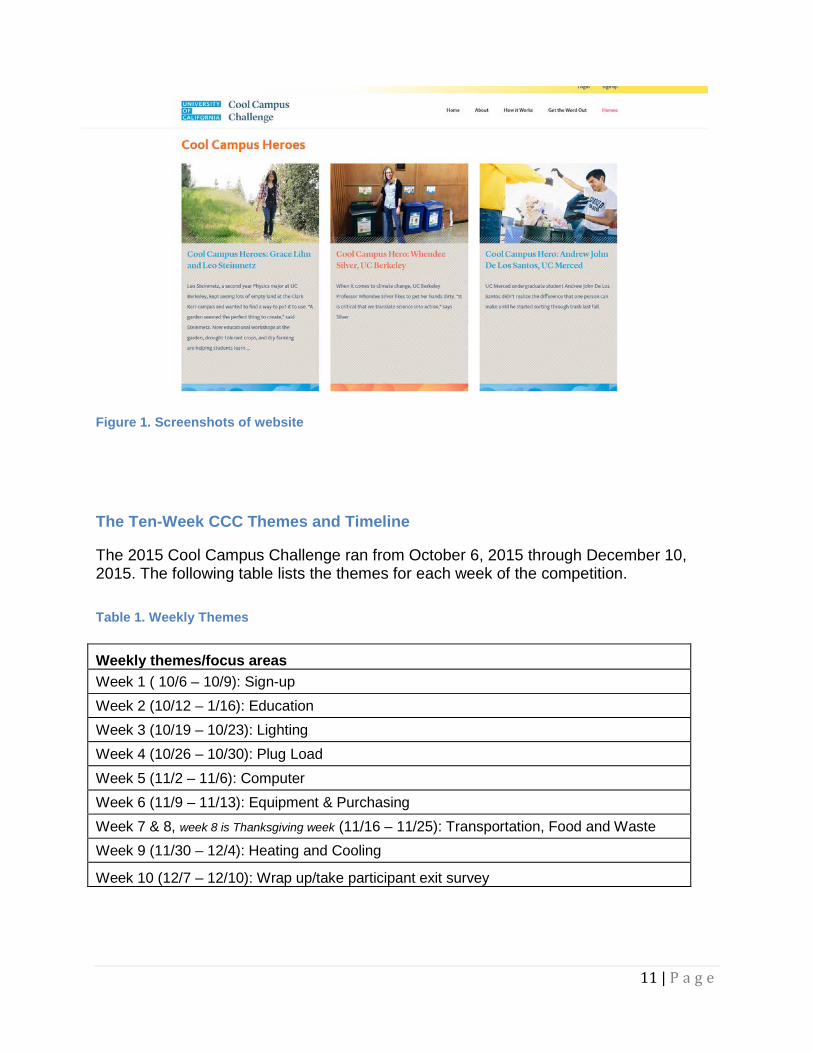
The Ten-Week CCC Themes and Timeline The 2015 Cool Campus Challenge ran from October 6, 2015 through December 10, 2015. The following table lists the themes for each week of the competition.
Table 1. Weekly Themes Weekly themes/focus areas Week 1 ( 10/6 – 10/9): Sign-up
Week 2 (10/12 – 1/16): Education
Week 3 (10/19 – 10/23): Lighting
Week 4 (10/26 – 10/30): Plug Load
Week 5 (11/2 – 11/6): Computer Week 6 (11/9 – 11/13): Equipment & Purchasing
Week 7 & 8, week 8 is Thanksgiving week (11/16 – 11/25): Transportation, Food and Waste Week 9 (11/30 – 12/4): Heating and Cooling
Week 10 (12/7 – 12/10): Wrap up/take participant exit survey
12 | P a g e
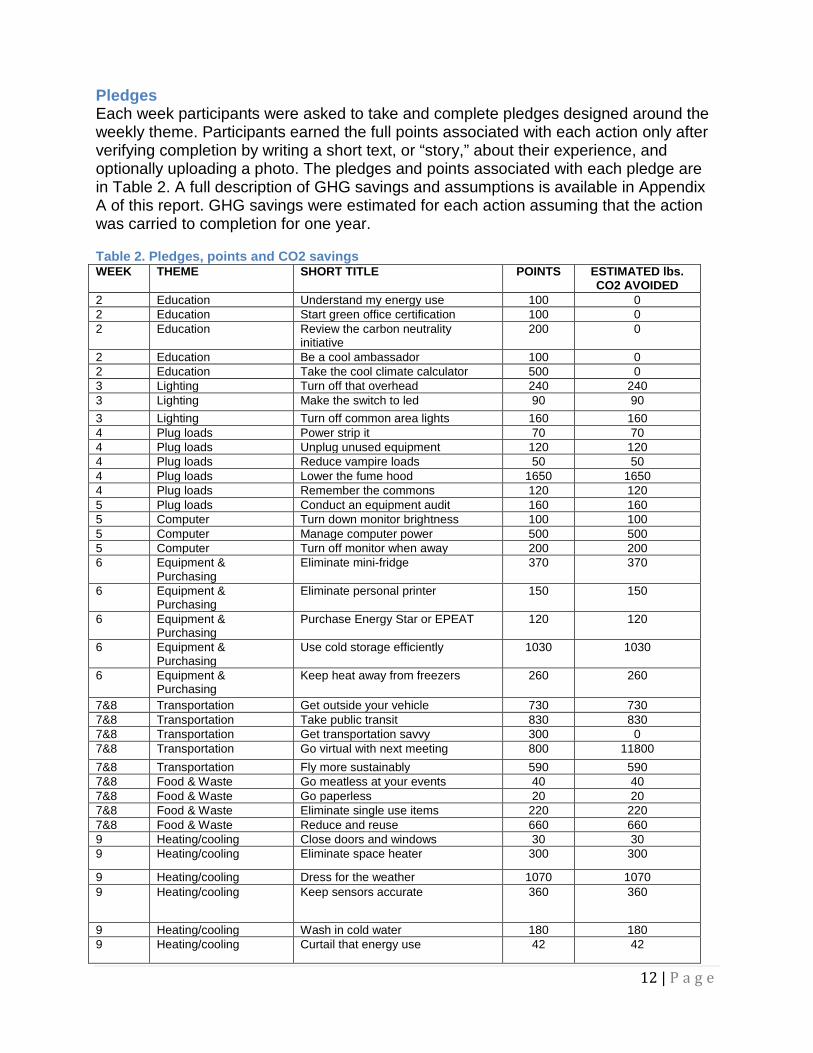
Pledges Each week participants were asked to take and complete pledges designed around the weekly theme. Participants earned the full points associated with each action only after verifying completion by writing a short text, or “story,” about their experience, and optionally uploading a photo. The pledges and points associated with each pledge are in Table 2. A full description of GHG savings and assumptions is available in Appendix A of this report. GHG savings were estimated for each action assuming that the action was carried to completion for one year.
Table 2. Pledges, points and CO2 savings WEEK THEME SHORT TITLE POINTS ESTIMATED lbs.
CO2 AVOIDED 2 Education Understand my energy use 100 0 2 Education Start green office certification 100 0 2 Education Review the carbon neutrality
initiative 200 0
2 Education Be a cool ambassador 100 0 2 Education Take the cool climate calculator 500 0 3 Lighting Turn off that overhead 240 240 3 Lighting Make the switch to led 90 90 3 Lighting Turn off common area lights 160 160 4 Plug loads Power strip it 70 70 4 Plug loads Unplug unused equipment 120 120 4 Plug loads Reduce vampire loads 50 50 4 Plug loads Lower the fume hood 1650 1650 4 Plug loads Remember the commons 120 120 5 Plug loads Conduct an equipment audit 160 160 5 Computer Turn down monitor brightness 100 100 5 Computer Manage computer power 500 500 5 Computer Turn off monitor when away 200 200 6 Equipment &
Purchasing Eliminate mini-fridge 370 370
6 Equipment & Purchasing
Eliminate personal printer 150 150
6 Equipment & Purchasing
Purchase Energy Star or EPEAT 120 120
6 Equipment & Purchasing
Use cold storage efficiently 1030 1030
6 Equipment & Purchasing
Keep heat away from freezers 260 260
7&8 Transportation Get outside your vehicle 730 730 7&8 Transportation Take public transit 830 830 7&8 Transportation Get transportation savvy 300 0 7&8 Transportation Go virtual with next meeting 800 11800 7&8 Transportation Fly more sustainably 590 590 7&8 Food & Waste Go meatless at your events 40 40 7&8 Food & Waste Go paperless 20 20 7&8 Food & Waste Eliminate single use items 220 220 7&8 Food & Waste Reduce and reuse 660 660 9 Heating/cooling Close doors and windows 30 30 9 Heating/cooling Eliminate space heater 300 300
9 Heating/cooling Dress for the weather 1070 1070 9 Heating/cooling Keep sensors accurate 360 360
9 Heating/cooling Wash in cold water 180 180 9 Heating/cooling Curtail that energy use 42 42
13 | P a g e
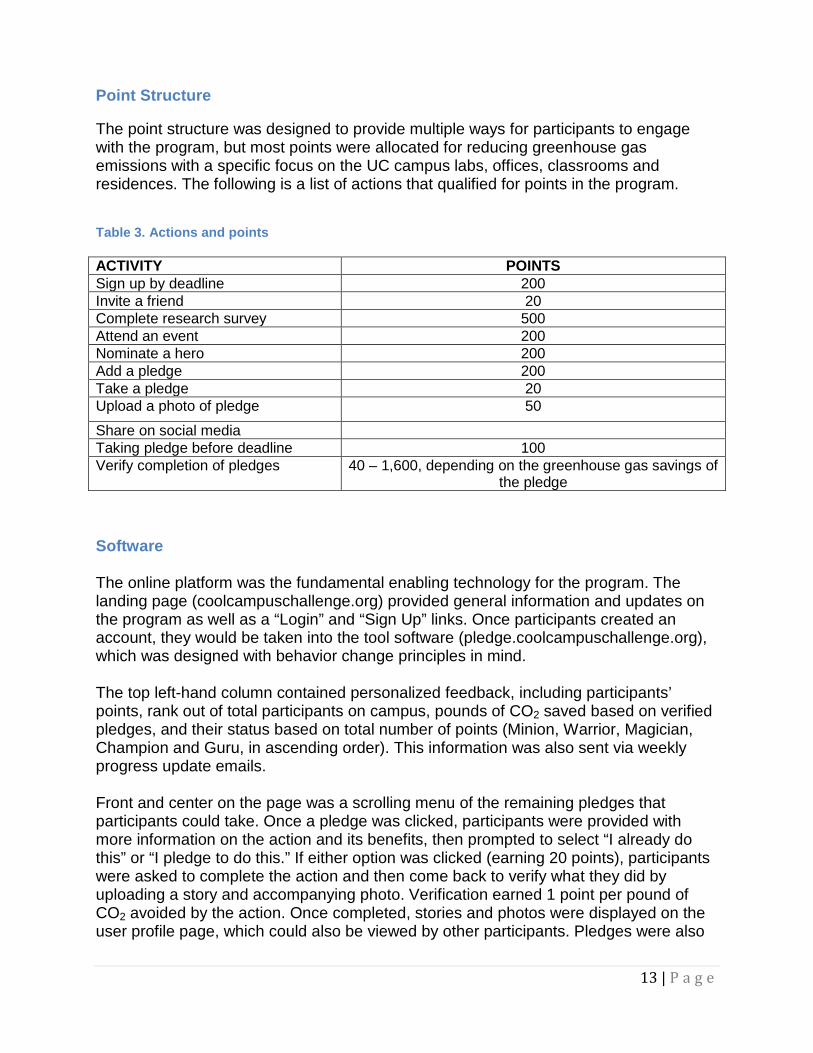
Point Structure The point structure was designed to provide multiple ways for participants to engage with the program, but most points were allocated for reducing greenhouse gas emissions with a specific focus on the UC campus labs, offices, classrooms and residences. The following is a list of actions that qualified for points in the program.
Table 3. Actions and points ACTIVITY POINTS Sign up by deadline 200 Invite a friend 20 Complete research survey 500 Attend an event 200 Nominate a hero 200 Add a pledge 200 Take a pledge 20 Upload a photo of pledge 50
Share on social media Taking pledge before deadline 100 Verify completion of pledges 40 – 1,600, depending on the greenhouse gas savings of
the pledge
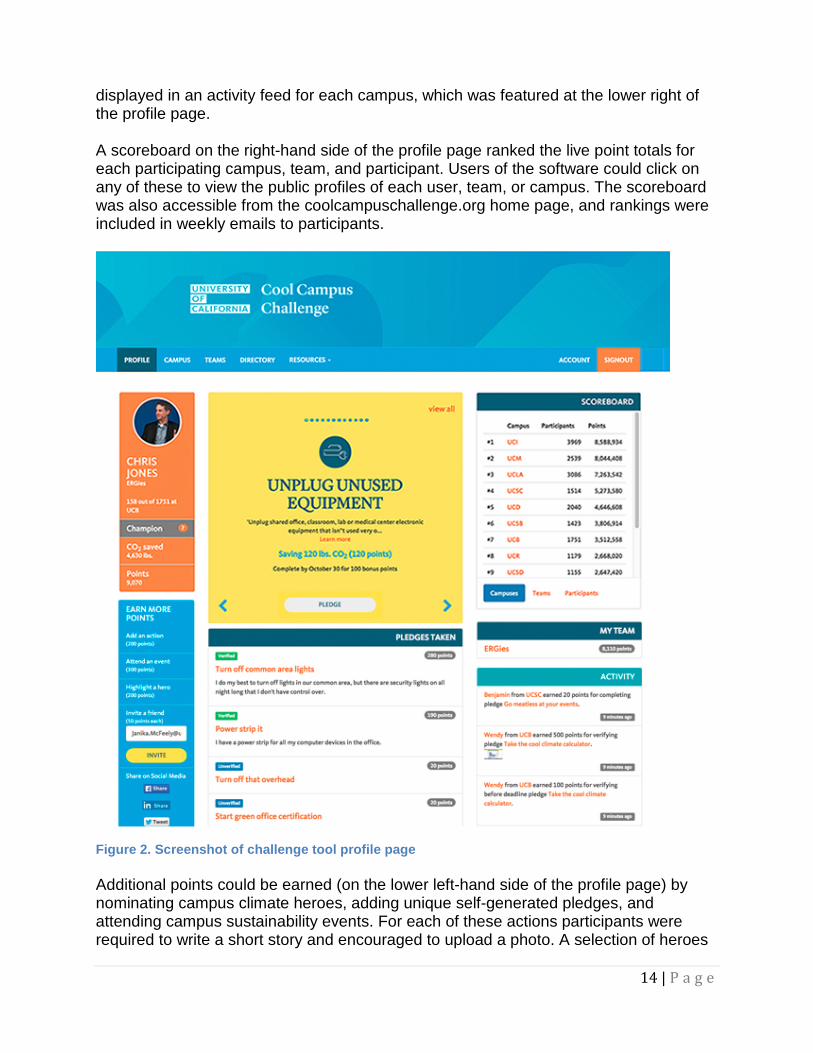
Software The online platform was the fundamental enabling technology for the program. The landing page (coolcampuschallenge.org) provided general information and updates on the program as well as a “Login” and “Sign Up” links. Once participants created an account, they would be taken into the tool software (pledge.coolcampuschallenge.org), which was designed with behavior change principles in mind. The top left-hand column contained personalized feedback, including participants’ points, rank out of total participants on campus, pounds of CO2 saved based on verified pledges, and their status based on total number of points (Minion, Warrior, Magician, Champion and Guru, in ascending order). This information was also sent via weekly progress update emails. Front and center on the page was a scrolling menu of the remaining pledges that participants could take. Once a pledge was clicked, participants were provided with more information on the action and its benefits, then prompted to select “I already do this” or “I pledge to do this.” If either option was clicked (earning 20 points), participants were asked to complete the action and then come back to verify what they did by uploading a story and accompanying photo. Verification earned 1 point per pound of CO2 avoided by the action. Once completed, stories and photos were displayed on the user profile page, which could also be viewed by other participants. Pledges were also
14 | P a g e
displayed in an activity feed for each campus, which was featured at the lower right of the profile page. A scoreboard on the right-hand side of the profile page ranked the live point totals for each participating campus, team, and participant. Users of the software could click on any of these to view the public profiles of each user, team, or campus. The scoreboard was also accessible from the coolcampuschallenge.org home page, and rankings were included in weekly emails to participants.
Figure 2. Screenshot of challenge tool profile page Additional points could be earned (on the lower left-hand side of the profile page) by nominating campus climate heroes, adding unique self-generated pledges, and attending campus sustainability events. For each of these actions participants were required to write a short story and encouraged to upload a photo. A selection of heroes
15 | P a g e
was highlighted in emails to participants, and some were featured on the coolcampuschallenge.org home page. Even more points could be garnered by inviting friends to join the program.
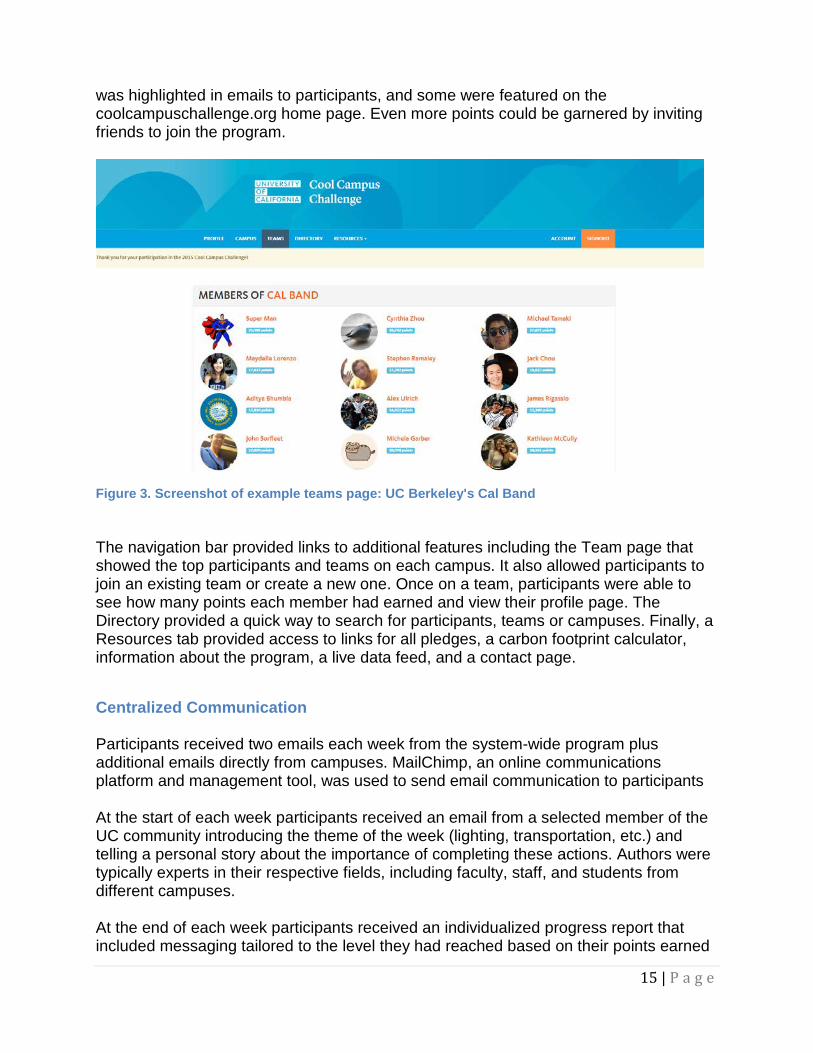
Figure 3. Screenshot of example teams page: UC Berkeley's Cal Band The navigation bar provided links to additional features including the Team page that showed the top participants and teams on each campus. It also allowed participants to join an existing team or create a new one. Once on a team, participants were able to see how many points each member had earned and view their profile page. The Directory provided a quick way to search for participants, teams or campuses. Finally, a Resources tab provided access to links for all pledges, a carbon footprint calculator, information about the program, a live data feed, and a contact page.
Centralized Communication Participants received two emails each week from the system-wide program plus additional emails directly from campuses. MailChimp, an online communications platform and management tool, was used to send email communication to participants At the start of each week participants received an email from a selected member of the UC community introducing the theme of the week (lighting, transportation, etc.) and telling a personal story about the importance of completing these actions. Authors were typically experts in their respective fields, including faculty, staff, and students from different campuses. At the end of each week participants received an individualized progress report that included messaging tailored to the level they had reached based on their points earned
16 | P a g e
(Minion, Warrior, Magician, Champion or Guru) and feedback on their progress as a participant, team (if on a team) and campus. Feedback included their rank, points, and CO2 saved. Program managers at each campus were able to use MailChimp to send tailored messages to participants on their campus. These messages ranged in content but often included information on campus-specific events and incentives. Campuses also employed many of their own communication efforts. This report does not cover the details of those efforts, but they are presumed to have been significant contributors to participation rates and depth of engagement in the challenge.
17 | P a g e
Reported Results The following highlights mostly the quantitative results of the campaign that could be extracted from the software tool and participant exit survey. The scope of this report intends to only include a very limited analysis of these results and offers a few suggestive thoughts on why particular phenomenon occurred. An enormous amount of data was generated by the challenge, which could be further evaluated in the future to inform a deeper understanding of opportunities and challenges to behavior change and engagement campaigns.
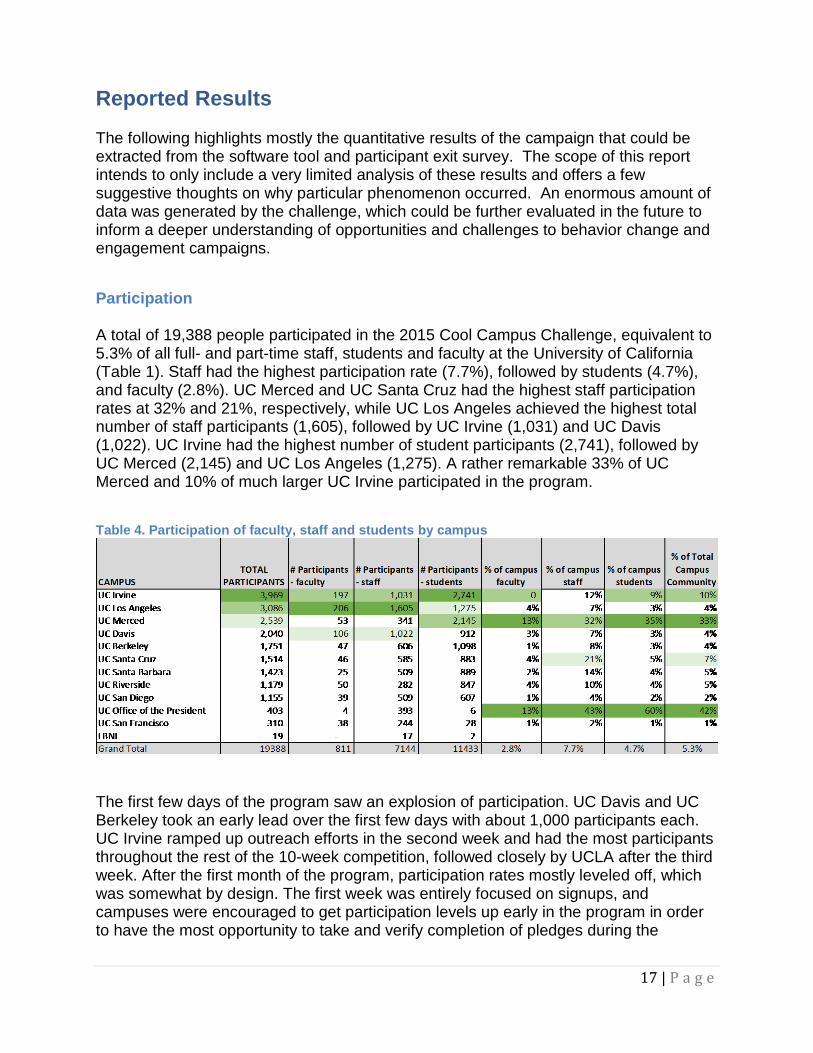
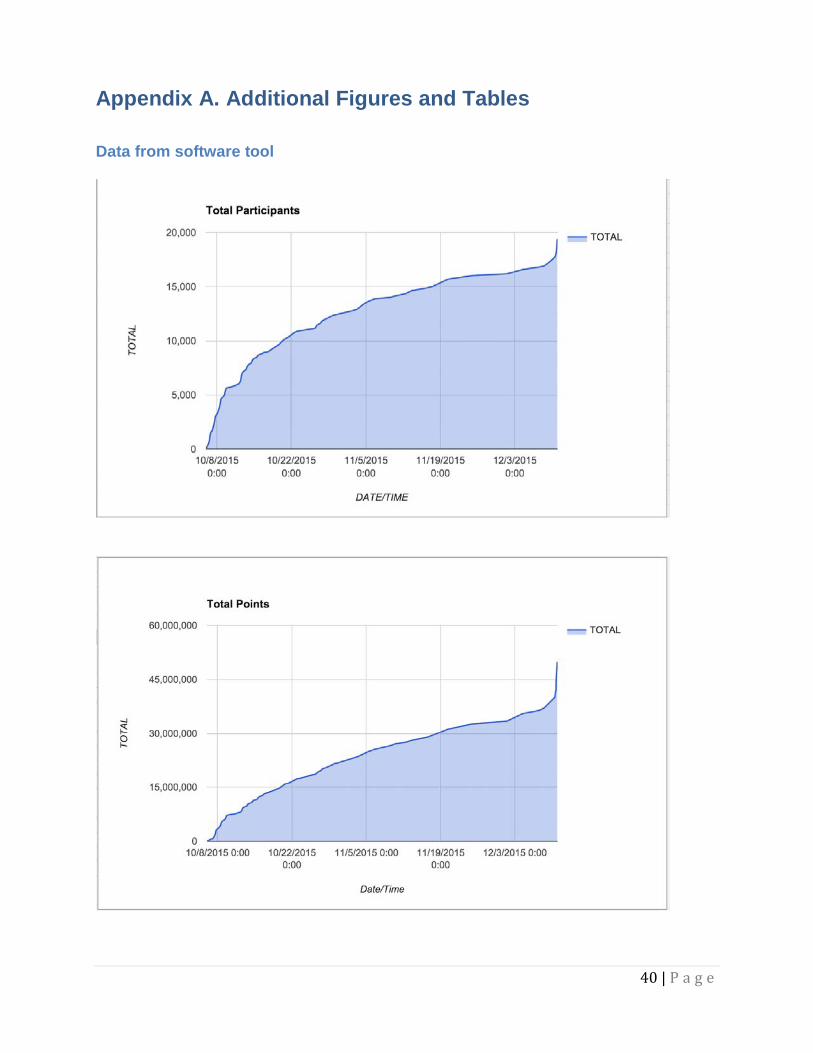
Participation A total of 19,388 people participated in the 2015 Cool Campus Challenge, equivalent to 5.3% of all full- and part-time staff, students and faculty at the University of California (Table 1). Staff had the highest participation rate (7.7%), followed by students (4.7%), and faculty (2.8%). UC Merced and UC Santa Cruz had the highest staff participation rates at 32% and 21%, respectively, while UC Los Angeles achieved the highest total number of staff participants (1,605), followed by UC Irvine (1,031) and UC Davis (1,022). UC Irvine had the highest number of student participants (2,741), followed by UC Merced (2,145) and UC Los Angeles (1,275). A rather remarkable 33% of UC Merced and 10% of much larger UC Irvine participated in the program.
Table 4. Participation of faculty, staff and students by campus
The first few days of the program saw an explosion of participation. UC Davis and UC Berkeley took an early lead over the first few days with about 1,000 participants each. UC Irvine ramped up outreach efforts in the second week and had the most participants throughout the rest of the 10-week competition, followed closely by UCLA after the third week. After the first month of the program, participation rates mostly leveled off, which was somewhat by design. The first week was entirely focused on signups, and campuses were encouraged to get participation levels up early in the program in order to have the most opportunity to take and verify completion of pledges during the
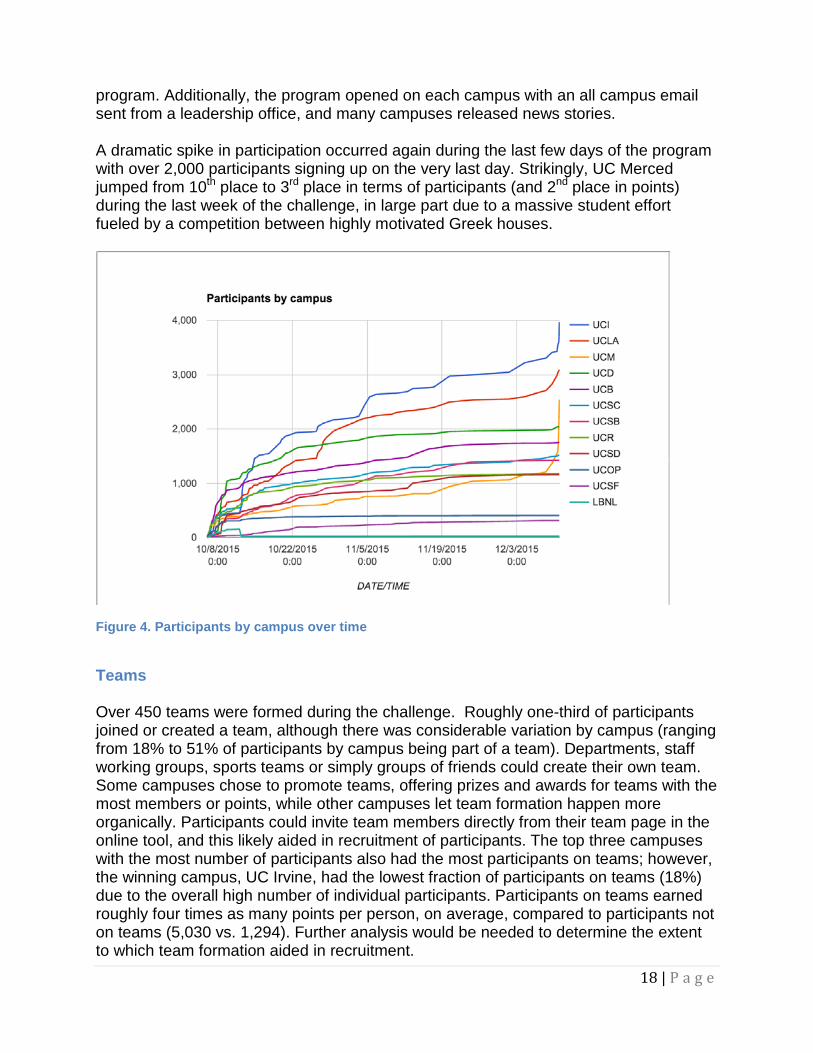
18 | P a g e
program. Additionally, the program opened on each campus with an all campus email sent from a leadership office, and many campuses released news stories. A dramatic spike in participation occurred again during the last few days of the program with over 2,000 participants signing up on the very last day. Strikingly, UC Merced jumped from 10th place to 3rd place in terms of participants (and 2nd place in points) during the last week of the challenge, in large part due to a massive student effort fueled by a competition between highly motivated Greek houses.
Figure 4. Participants by campus over time
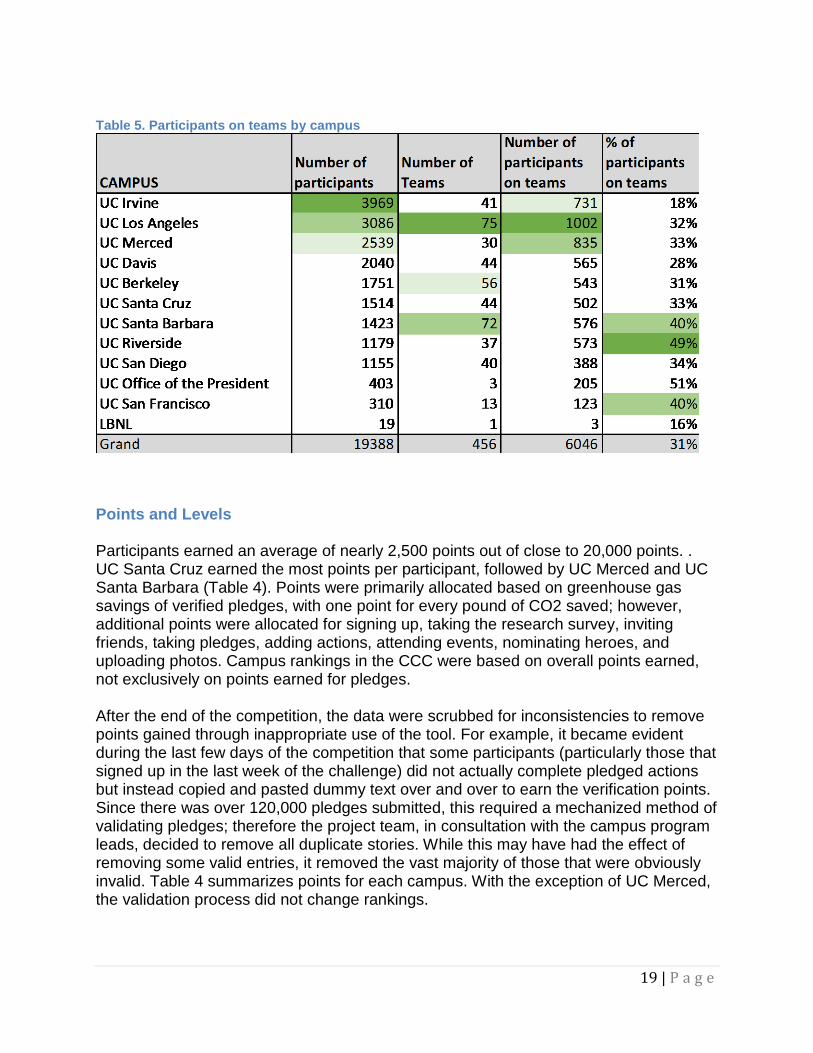
Teams Over 450 teams were formed during the challenge. Roughly one-third of participants joined or created a team, although there was considerable variation by campus (ranging from 18% to 51% of participants by campus being part of a team). Departments, staff working groups, sports teams or simply groups of friends could create their own team. Some campuses chose to promote teams, offering prizes and awards for teams with the most members or points, while other campuses let team formation happen more organically. Participants could invite team members directly from their team page in the online tool, and this likely aided in recruitment of participants. The top three campuses with the most number of participants also had the most participants on teams; however, the winning campus, UC Irvine, had the lowest fraction of participants on teams (18%) due to the overall high number of individual participants. Participants on teams earned roughly four times as many points per person, on average, compared to participants not on teams (5,030 vs. 1,294). Further analysis would be needed to determine the extent to which team formation aided in recruitment.
19 | P a g e
Table 5. Participants on teams by campus
Points and Levels Participants earned an average of nearly 2,500 points out of close to 20,000 points. . UC Santa Cruz earned the most points per participant, followed by UC Merced and UC Santa Barbara (Table 4). Points were primarily allocated based on greenhouse gas savings of verified pledges, with one point for every pound of CO2 saved; however, additional points were allocated for signing up, taking the research survey, inviting friends, taking pledges, adding actions, attending events, nominating heroes, and uploading photos. Campus rankings in the CCC were based on overall points earned, not exclusively on points earned for pledges. After the end of the competition, the data were scrubbed for inconsistencies to remove points gained through inappropriate use of the tool. For example, it became evident during the last few days of the competition that some participants (particularly those that signed up in the last week of the challenge) did not actually complete pledged actions but instead copied and pasted dummy text over and over to earn the verification points. Since there was over 120,000 pledges submitted, this required a mechanized method of validating pledges; therefore the project team, in consultation with the campus program leads, decided to remove all duplicate stories. While this may have had the effect of removing some valid entries, it removed the vast majority of those that were obviously invalid. Table 4 summarizes points for each campus. With the exception of UC Merced, the validation process did not change rankings.
20 | P a g e
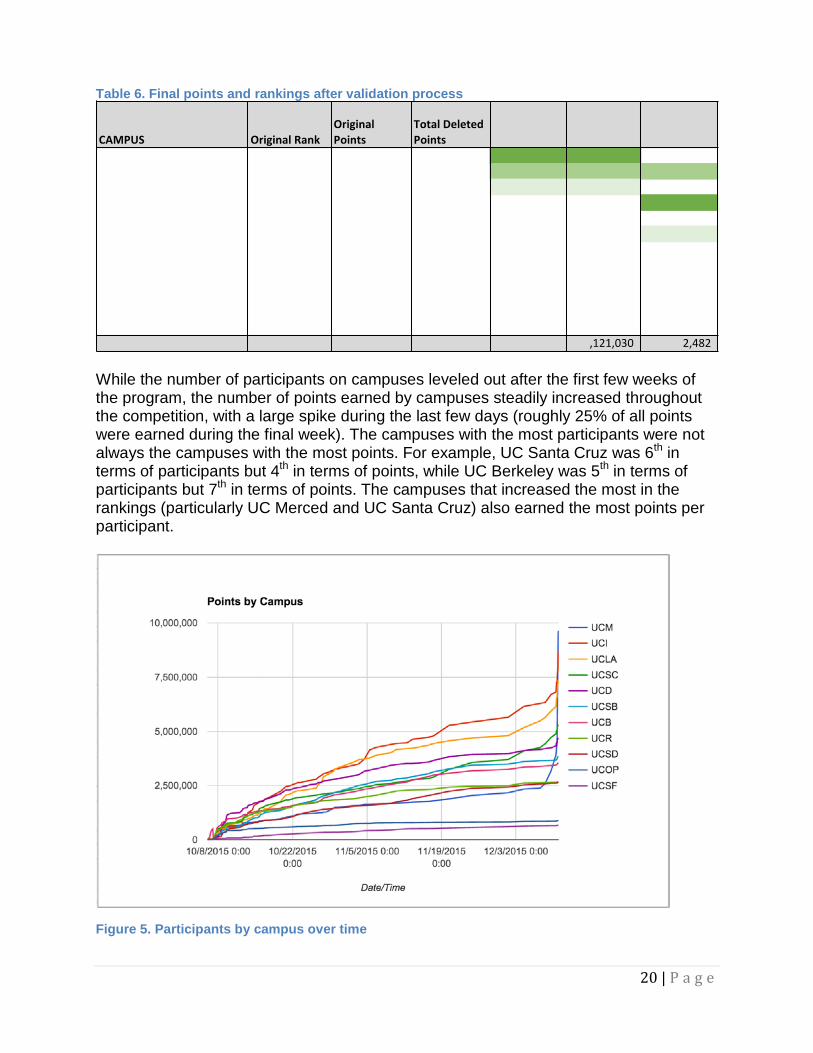
Table 6. Final points and rankings after validation process
While the number of participants on campuses leveled out after the first few weeks of the program, the number of points earned by campuses steadily increased throughout the competition, with a large spike during the last few days (roughly 25% of all points were earned during the final week). The campuses with the most participants were not always the campuses with the most points. For example, UC Santa Cruz was 6th in terms of participants but 4th in terms of points, while UC Berkeley was 5th in terms of participants but 7th in terms of points. The campuses that increased the most in the rankings (particularly UC Merced and UC Santa Cruz) also earned the most points per participant.
Figure 5. Participants by campus over time
21 | P a g e
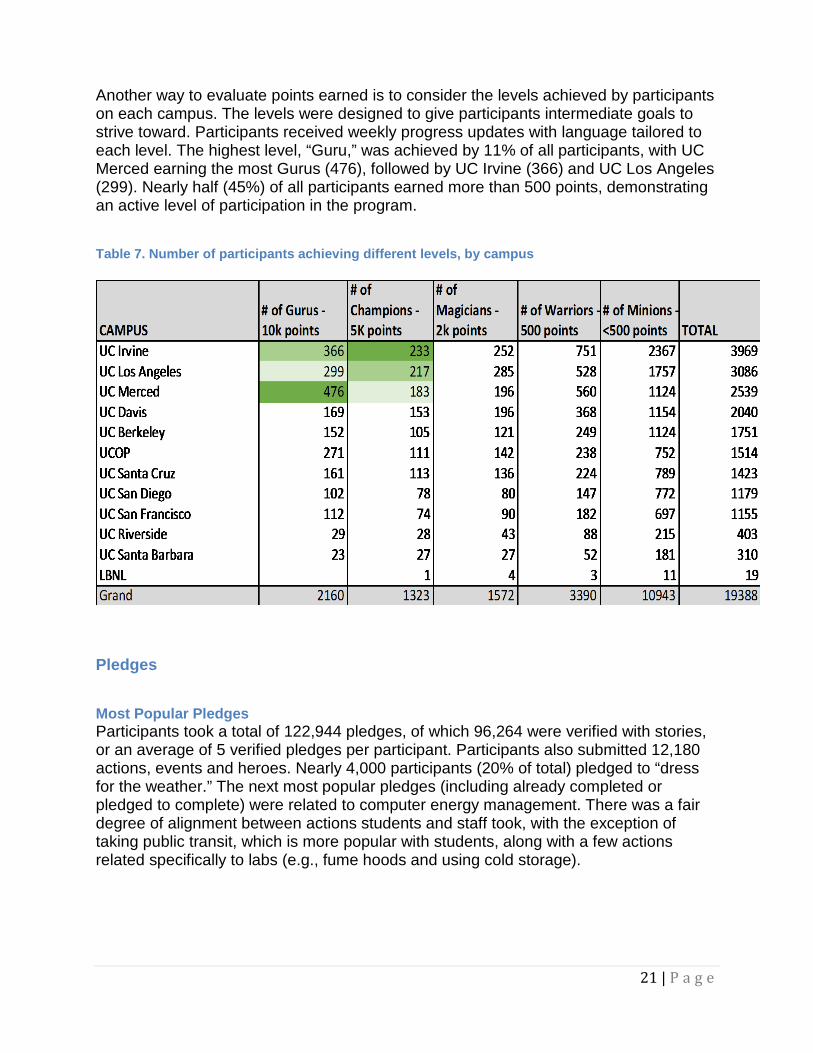
Another way to evaluate points earned is to consider the levels achieved by participants on each campus. The levels were designed to give participants intermediate goals to strive toward. Participants received weekly progress updates with language tailored to each level. The highest level, “Guru,” was achieved by 11% of all participants, with UC Merced earning the most Gurus (476), followed by UC Irvine (366) and UC Los Angeles (299). Nearly half (45%) of all participants earned more than 500 points, demonstrating an active level of participation in the program.
Table 7. Number of participants achieving different levels, by campus
Pledges
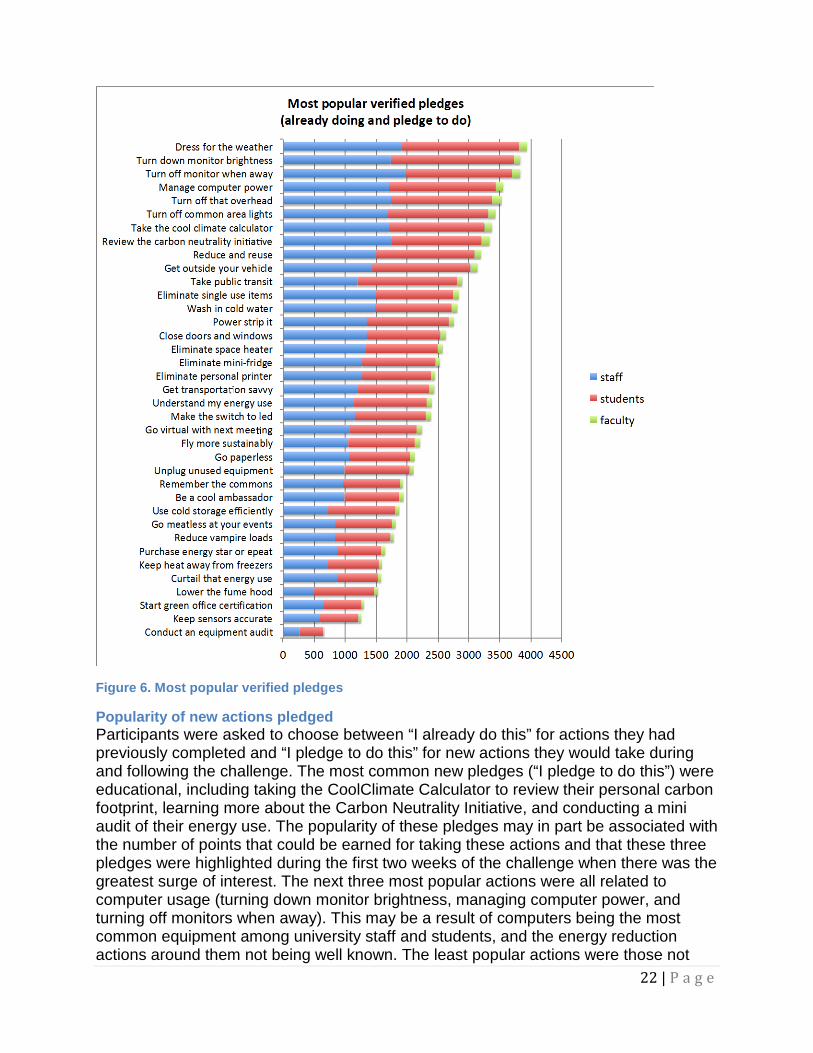
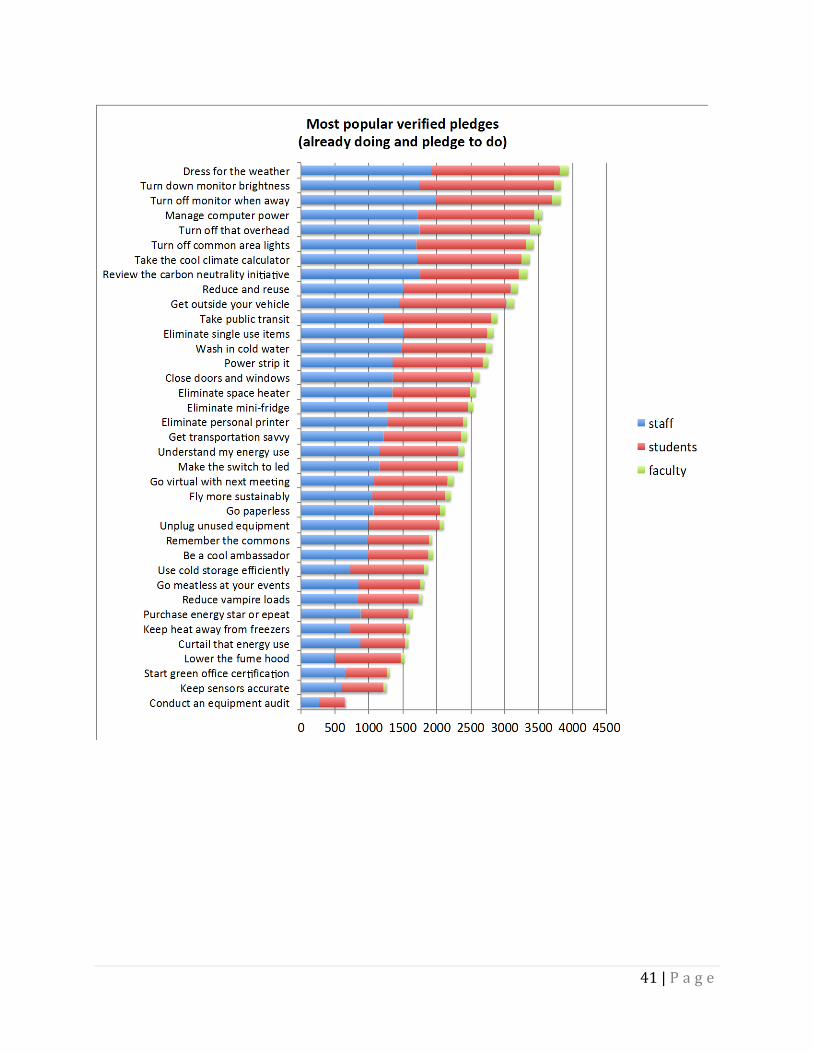
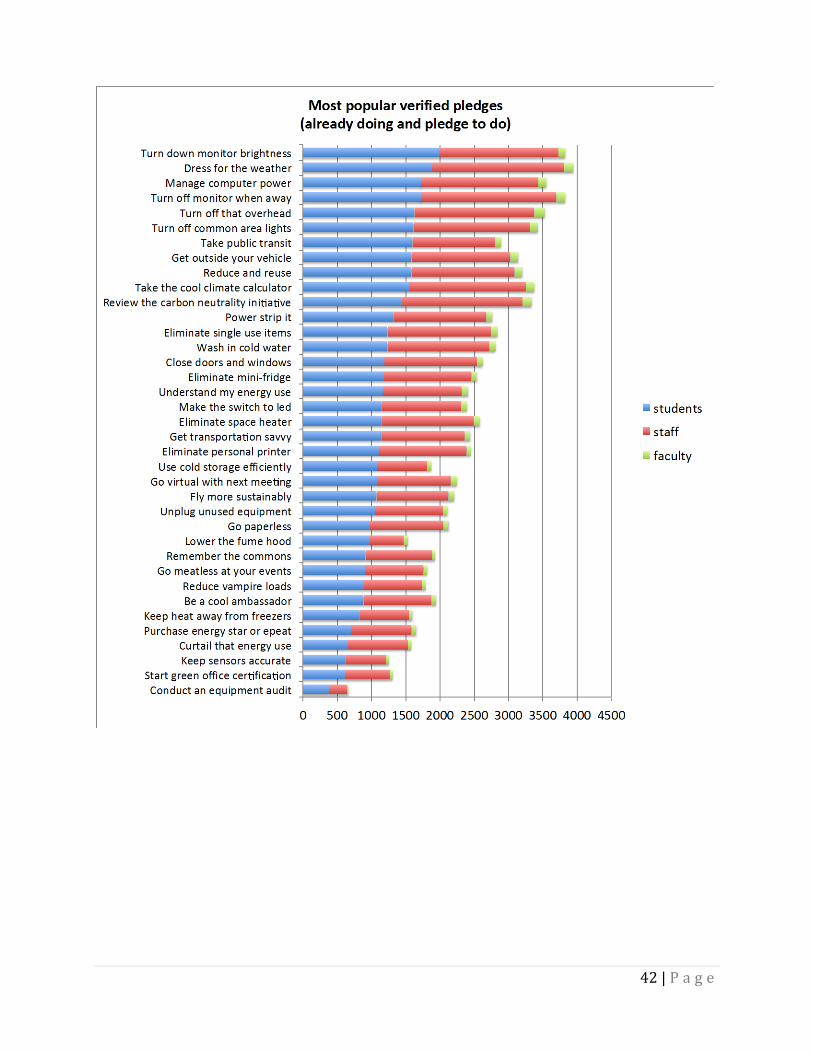
Most Popular Pledges Participants took a total of 122,944 pledges, of which 96,264 were verified with stories, or an average of 5 verified pledges per participant. Participants also submitted 12,180 actions, events and heroes. Nearly 4,000 participants (20% of total) pledged to “dress for the weather.” The next most popular pledges (including already completed or pledged to complete) were related to computer energy management. There was a fair degree of alignment between actions students and staff took, with the exception of taking public transit, which is more popular with students, along with a few actions related specifically to labs (e.g., fume hoods and using cold storage).
22 | P a g e
Figure 6. Most popular verified pledges
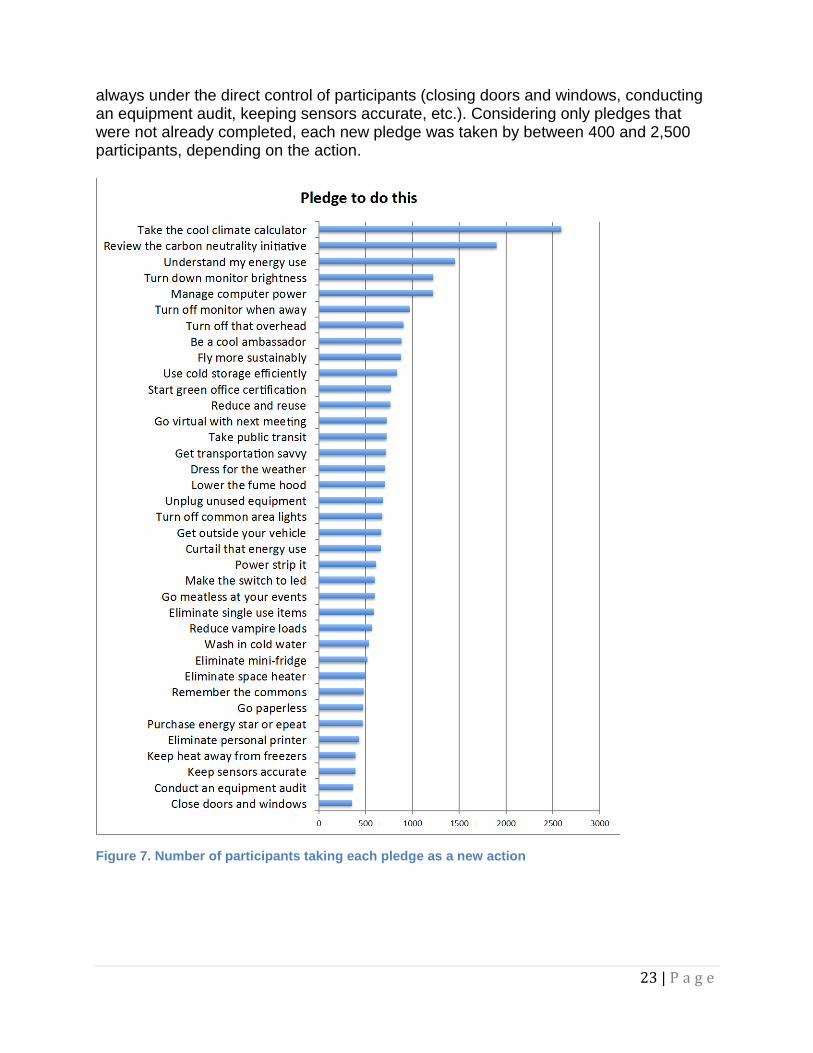
Popularity of new actions pledged Participants were asked to choose between “I already do this” for actions they had previously completed and “I pledge to do this” for new actions they would take during and following the challenge. The most common new pledges (“I pledge to do this”) were educational, including taking the CoolClimate Calculator to review their personal carbon footprint, learning more about the Carbon Neutrality Initiative, and conducting a mini audit of their energy use. The popularity of these pledges may in part be associated with the number of points that could be earned for taking these actions and that these three pledges were highlighted during the first two weeks of the challenge when there was the greatest surge of interest. The next three most popular actions were all related to computer usage (turning down monitor brightness, managing computer power, and turning off monitors when away). This may be a result of computers being the most common equipment among university staff and students, and the energy reduction actions around them not being well known. The least popular actions were those not
23 | P a g e
always under the direct control of participants (closing doors and windows, conducting an equipment audit, keeping sensors accurate, etc.). Considering only pledges that were not already completed, each new pledge was taken by between 400 and 2,500 participants, depending on the action.
Figure 7. Number of participants taking each pledge as a new action
24 | P a g e
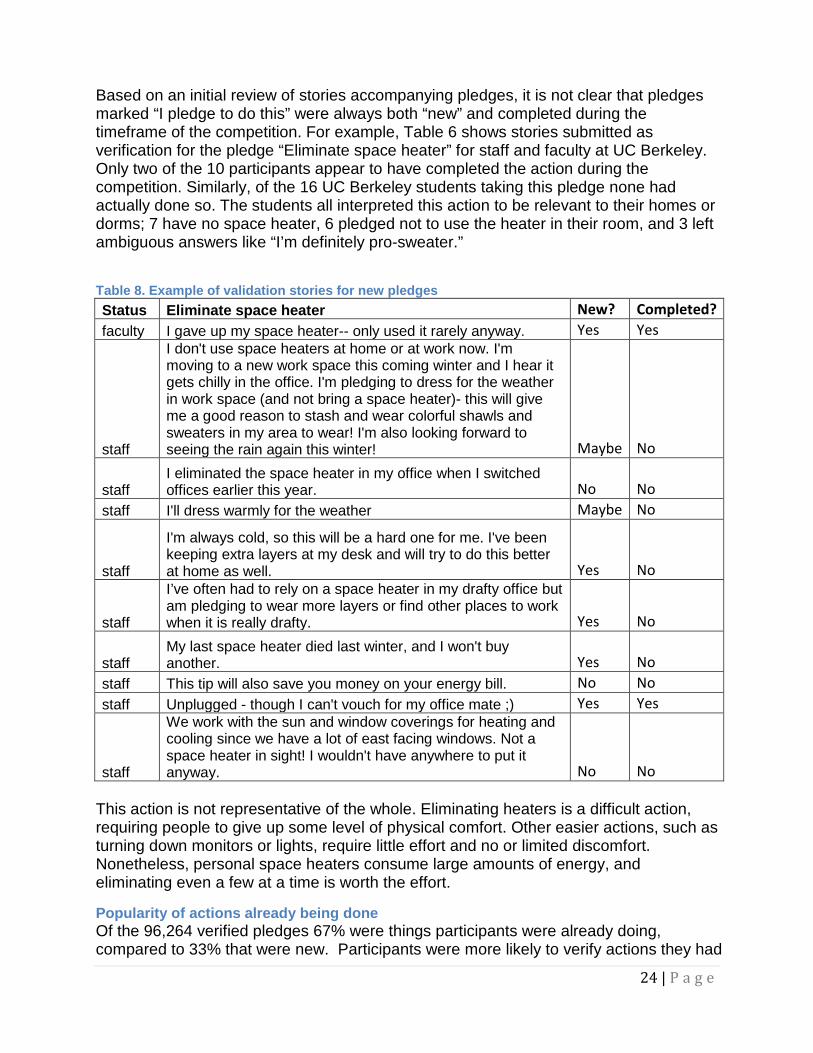
Based on an initial review of stories accompanying pledges, it is not clear that pledges marked “I pledge to do this” were always both “new” and completed during the timeframe of the competition. For example, Table 6 shows stories submitted as verification for the pledge “Eliminate space heater” for staff and faculty at UC Berkeley. Only two of the 10 participants appear to have completed the action during the competition. Similarly, of the 16 UC Berkeley students taking this pledge none had actually done so. The students all interpreted this action to be relevant to their homes or dorms; 7 have no space heater, 6 pledged not to use the heater in their room, and 3 left ambiguous answers like “I’m definitely pro-sweater.”
Table 8. Example of validation stories for new pledges Status Eliminate space heater New? Completed? faculty I gave up my space heater-- only used it rarely anyway. Yes Yes
staff
I don't use space heaters at home or at work now. I'm moving to a new work space this coming winter and I hear it gets chilly in the office. I'm pledging to dress for the weather in work space (and not bring a space heater)- this will give me a good reason to stash and wear colorful shawls and sweaters in my area to wear! I'm also looking forward to seeing the rain again this winter! Maybe No
staff I eliminated the space heater in my office when I switched offices earlier this year. No No
staff I'll dress warmly for the weather Maybe No
staff
I'm always cold, so this will be a hard one for me. I've been keeping extra layers at my desk and will try to do this better at home as well. Yes No
staff
I’ve often had to rely on a space heater in my drafty office but am pledging to wear more layers or find other places to work when it is really drafty. Yes No
staff My last space heater died last winter, and I won't buy another. Yes No
staff This tip will also save you money on your energy bill. No No staff Unplugged - though I can't vouch for my office mate ;) Yes Yes
staff
We work with the sun and window coverings for heating and cooling since we have a lot of east facing windows. Not a space heater in sight! I wouldn't have anywhere to put it anyway. No No
This action is not representative of the whole. Eliminating heaters is a difficult action, requiring people to give up some level of physical comfort. Other easier actions, such as turning down monitors or lights, require little effort and no or limited discomfort. Nonetheless, personal space heaters consume large amounts of energy, and eliminating even a few at a time is worth the effort.
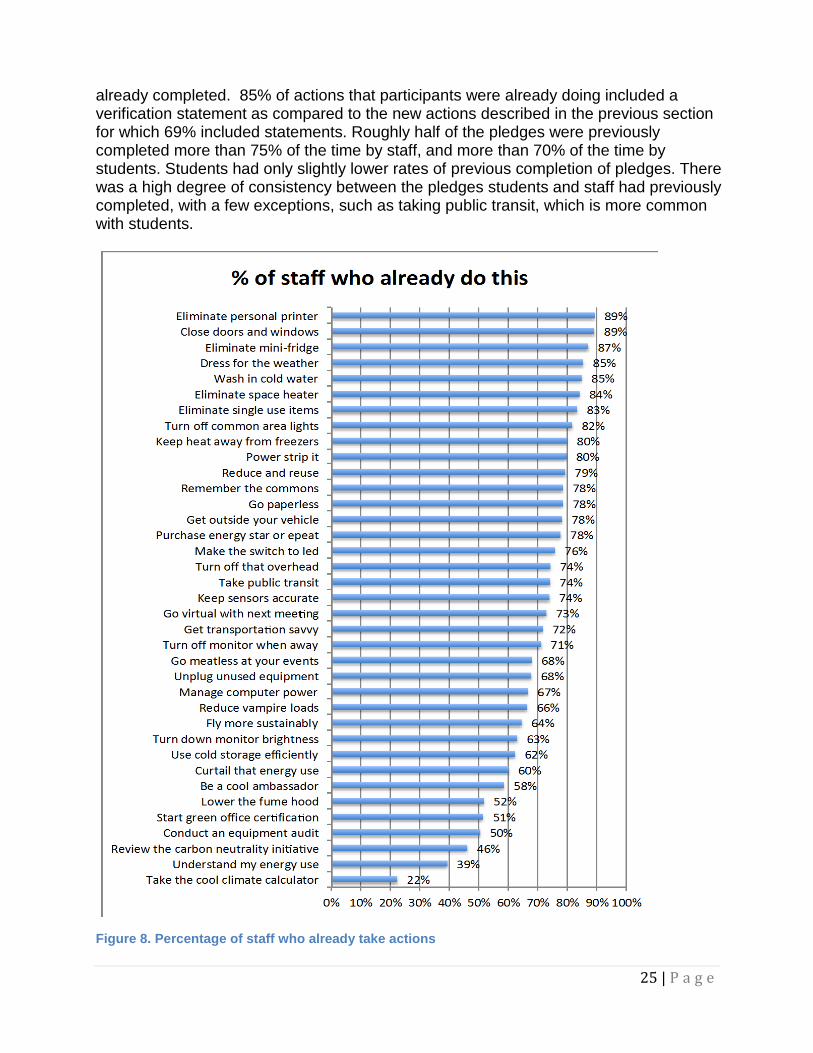
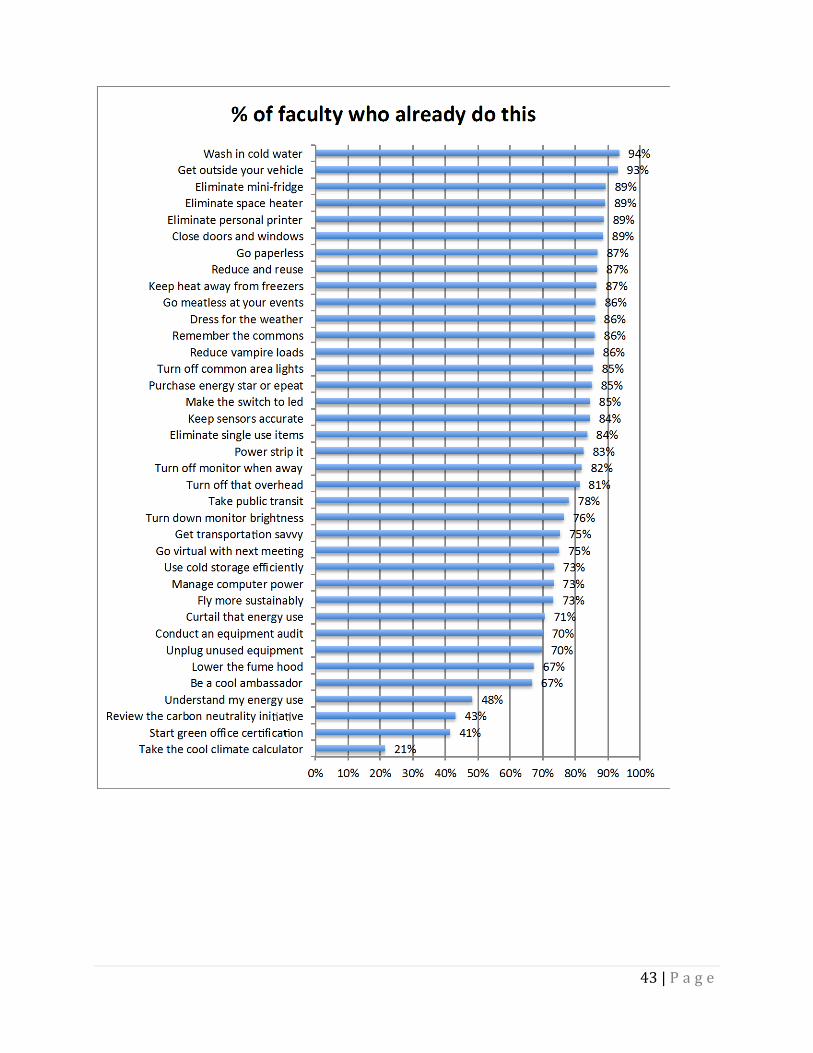
Popularity of actions already being done Of the 96,264 verified pledges 67% were things participants were already doing, compared to 33% that were new. Participants were more likely to verify actions they had
25 | P a g e
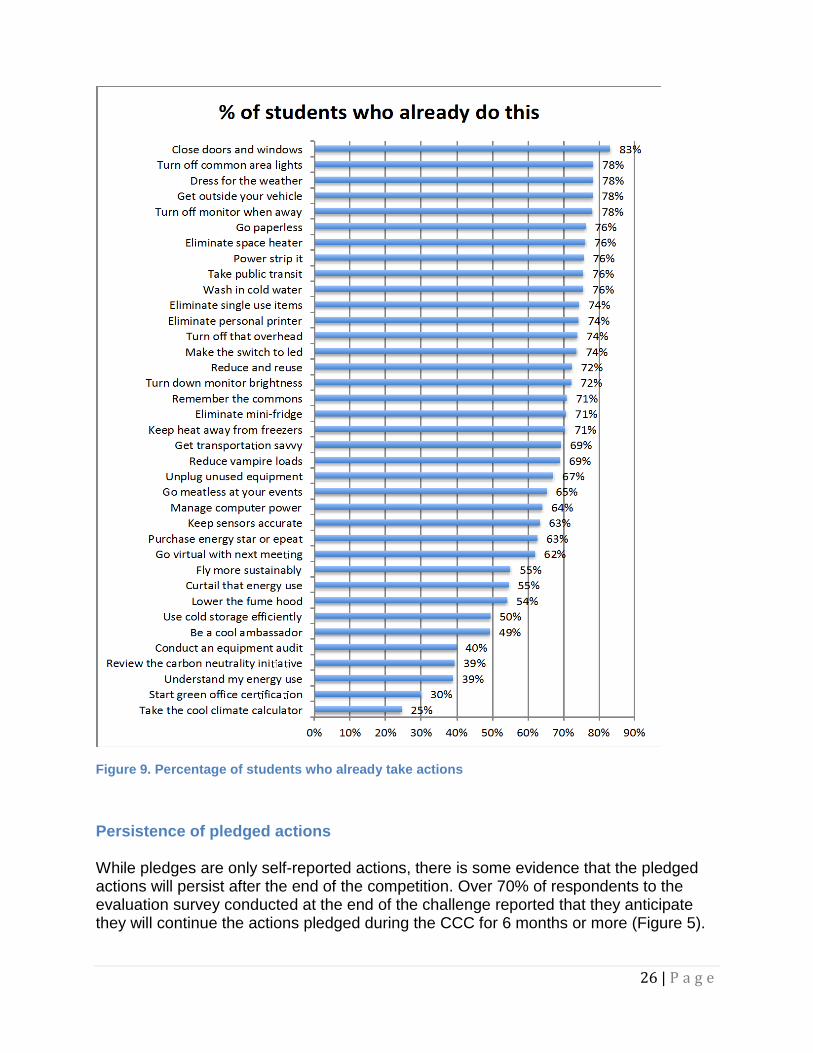
already completed. 85% of actions that participants were already doing included a verification statement as compared to the new actions described in the previous section for which 69% included statements. Roughly half of the pledges were previously completed more than 75% of the time by staff, and more than 70% of the time by students. Students had only slightly lower rates of previous completion of pledges. There was a high degree of consistency between the pledges students and staff had previously completed, with a few exceptions, such as taking public transit, which is more common with students.
Figure 8. Percentage of staff who already take actions
26 | P a g e
Figure 9. Percentage of students who already take actions
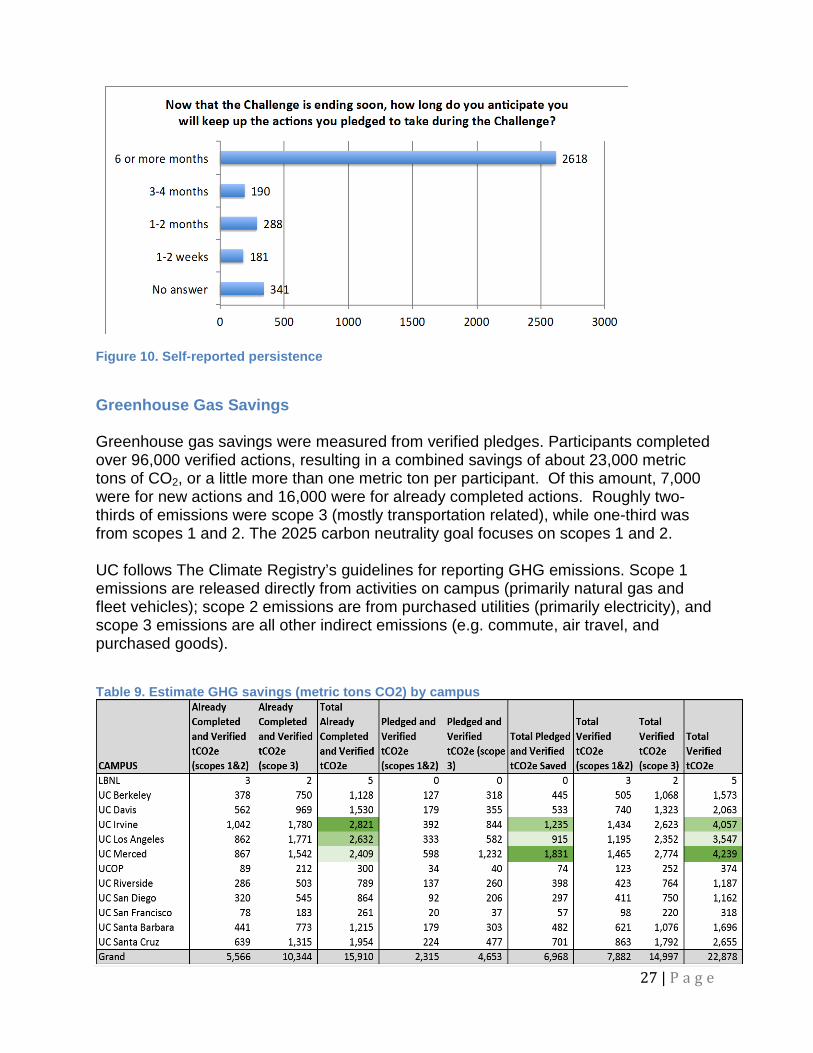
Persistence of pledged actions While pledges are only self-reported actions, there is some evidence that the pledged actions will persist after the end of the competition. Over 70% of respondents to the evaluation survey conducted at the end of the challenge reported that they anticipate they will continue the actions pledged during the CCC for 6 months or more (Figure 5).
27 | P a g e
Figure 10. Self-reported persistence
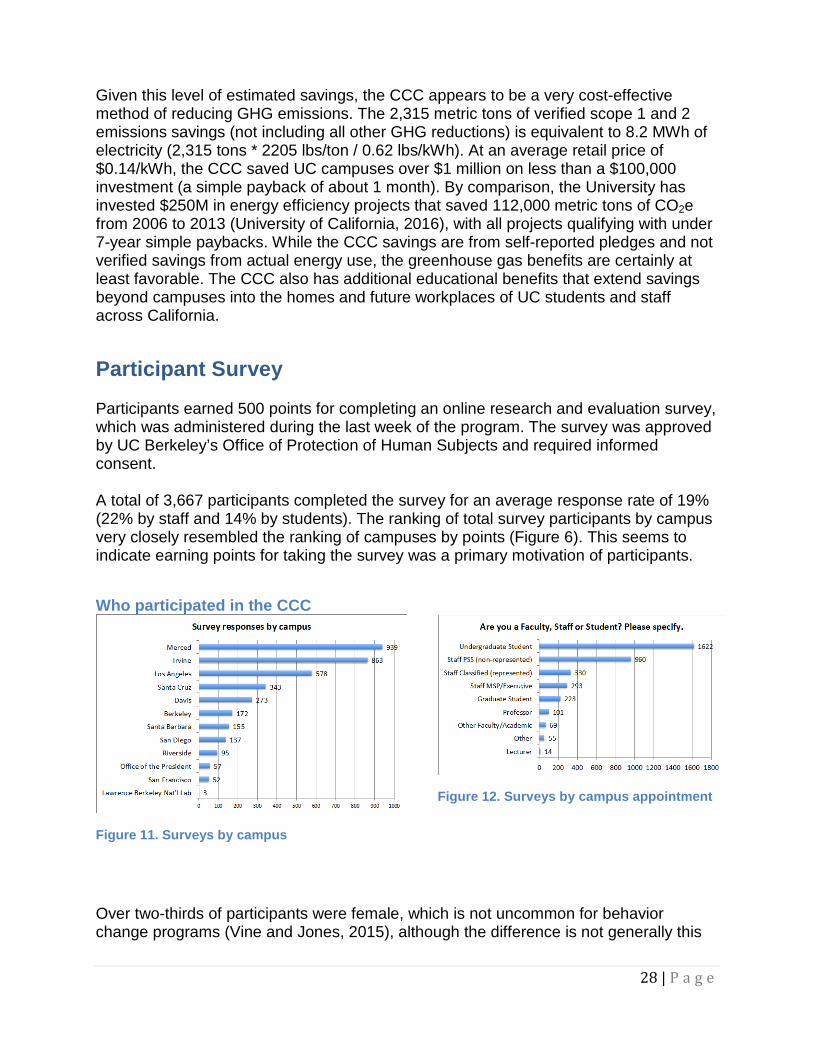
Greenhouse Gas Savings Greenhouse gas savings were measured from verified pledges. Participants completed over 96,000 verified actions, resulting in a combined savings of about 23,000 metric tons of CO2, or a little more than one metric ton per participant. Of this amount, 7,000 were for new actions and 16,000 were for already completed actions. Roughly two-thirds of emissions were scope 3 (mostly transportation related), while one-third was from scopes 1 and 2. The 2025 carbon neutrality goal focuses on scopes 1 and 2. UC follows The Climate Registry’s guidelines for reporting GHG emissions. Scope 1 emissions are released directly from activities on campus (primarily natural gas and fleet vehicles); scope 2 emissions are from purchased utilities (primarily electricity), and scope 3 emissions are all other indirect emissions (e.g. commute, air travel, and purchased goods).
Table 9. Estimate GHG savings (metric tons CO2) by campus
28 | P a g e
Given this level of estimated savings, the CCC appears to be a very cost-effective method of reducing GHG emissions. The 2,315 metric tons of verified scope 1 and 2 emissions savings (not including all other GHG reductions) is equivalent to 8.2 MWh of electricity (2,315 tons * 2205 lbs/ton / 0.62 lbs/kWh). At an average retail price of $0.14/kWh, the CCC saved UC campuses over $1 million on less than a $100,000 investment (a simple payback of about 1 month). By comparison, the University has invested $250M in energy efficiency projects that saved 112,000 metric tons of CO2e from 2006 to 2013 (University of California, 2016), with all projects qualifying with under 7-year simple paybacks. While the CCC savings are from self-reported pledges and not verified savings from actual energy use, the greenhouse gas benefits are certainly at least favorable. The CCC also has additional educational benefits that extend savings beyond campuses into the homes and future workplaces of UC students and staff across California.
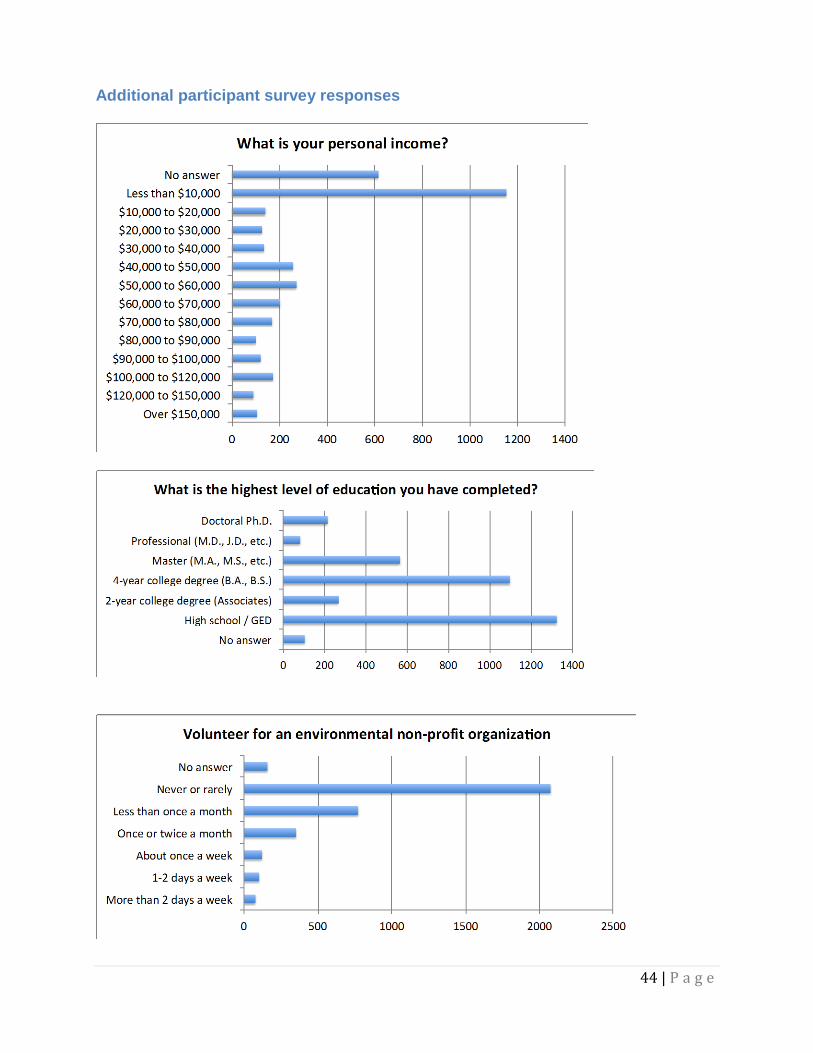
Participant Survey Participants earned 500 points for completing an online research and evaluation survey, which was administered during the last week of the program. The survey was approved by UC Berkeley’s Office of Protection of Human Subjects and required informed consent. A total of 3,667 participants completed the survey for an average response rate of 19% (22% by staff and 14% by students). The ranking of total survey participants by campus very closely resembled the ranking of campuses by points (Figure 6). This seems to indicate earning points for taking the survey was a primary motivation of participants.
Who participated in the CCC
Figure 11. Surveys by campus
Figure 12. Surveys by campus appointment
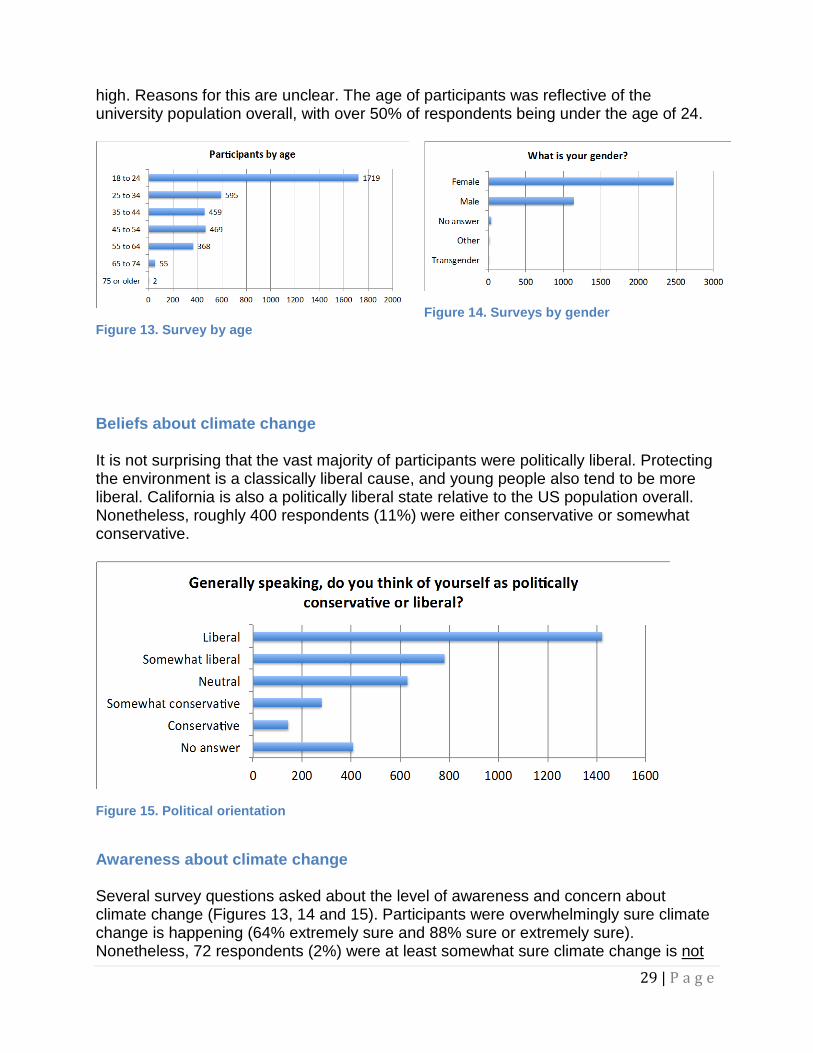
Over two-thirds of participants were female, which is not uncommon for behavior change programs (Vine and Jones, 2015), although the difference is not generally this
29 | P a g e
high. Reasons for this are unclear. The age of participants was reflective of the university population overall, with over 50% of respondents being under the age of 24.
Figure 13. Survey by age
Figure 14. Surveys by gender
Beliefs about climate change It is not surprising that the vast majority of participants were politically liberal. Protecting the environment is a classically liberal cause, and young people also tend to be more liberal. California is also a politically liberal state relative to the US population overall. Nonetheless, roughly 400 respondents (11%) were either conservative or somewhat conservative.
Figure 15. Political orientation
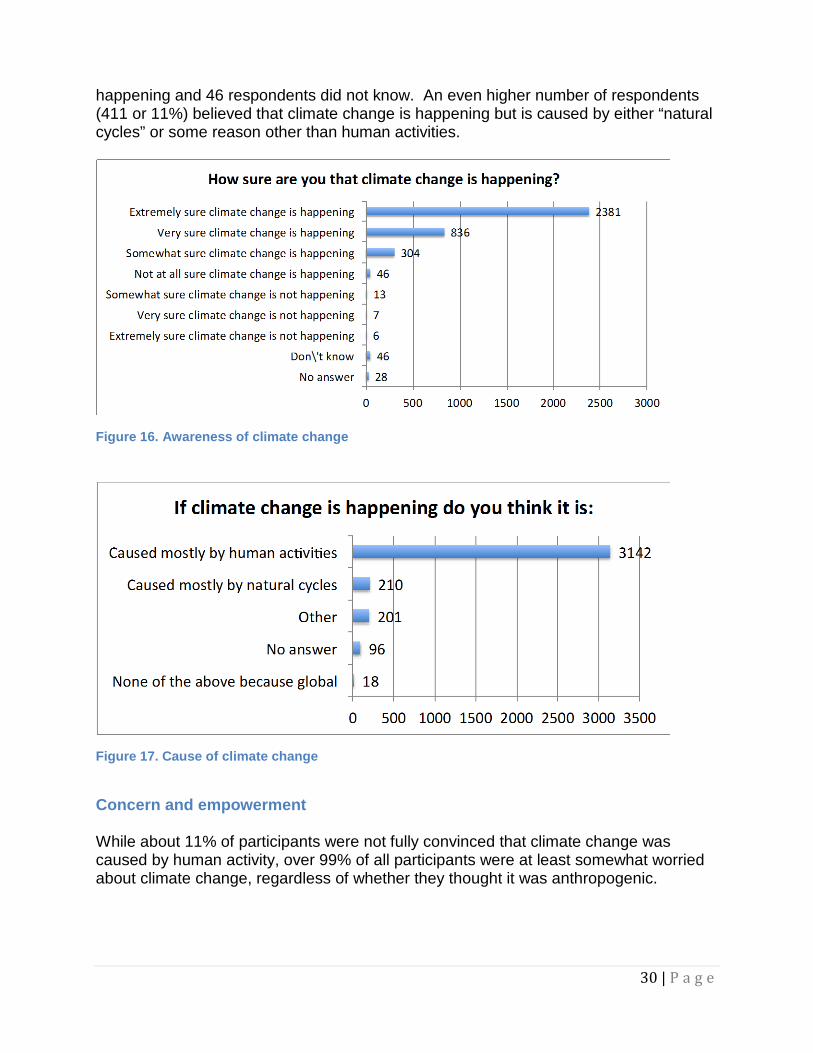
Awareness about climate change Several survey questions asked about the level of awareness and concern about climate change (Figures 13, 14 and 15). Participants were overwhelmingly sure climate change is happening (64% extremely sure and 88% sure or extremely sure). Nonetheless, 72 respondents (2%) were at least somewhat sure climate change is not
30 | P a g e
happening and 46 respondents did not know. An even higher number of respondents (411 or 11%) believed that climate change is happening but is caused by either “natural cycles” or some reason other than human activities.
Figure 16. Awareness of climate change
Figure 17. Cause of climate change
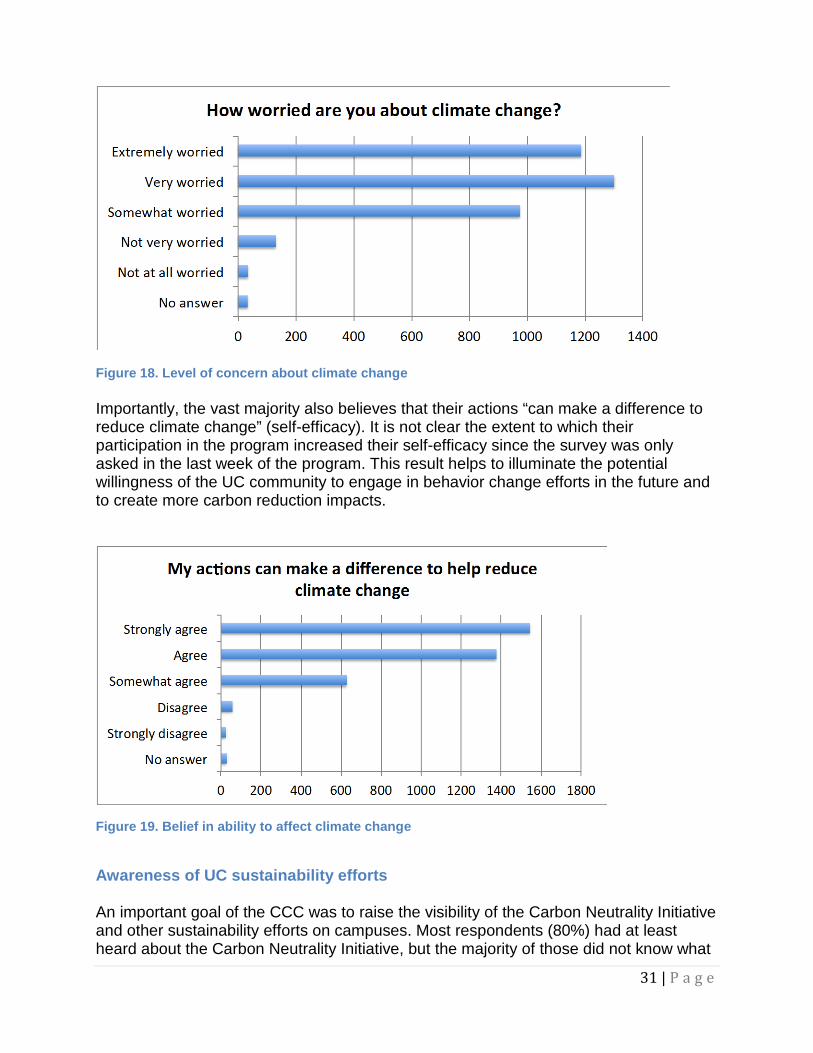
Concern and empowerment While about 11% of participants were not fully convinced that climate change was caused by human activity, over 99% of all participants were at least somewhat worried about climate change, regardless of whether they thought it was anthropogenic.
31 | P a g e
Figure 18. Level of concern about climate change Importantly, the vast majority also believes that their actions “can make a difference to reduce climate change” (self-efficacy). It is not clear the extent to which their participation in the program increased their self-efficacy since the survey was only asked in the last week of the program. This result helps to illuminate the potential willingness of the UC community to engage in behavior change efforts in the future and to create more carbon reduction impacts.
Figure 19. Belief in ability to affect climate change
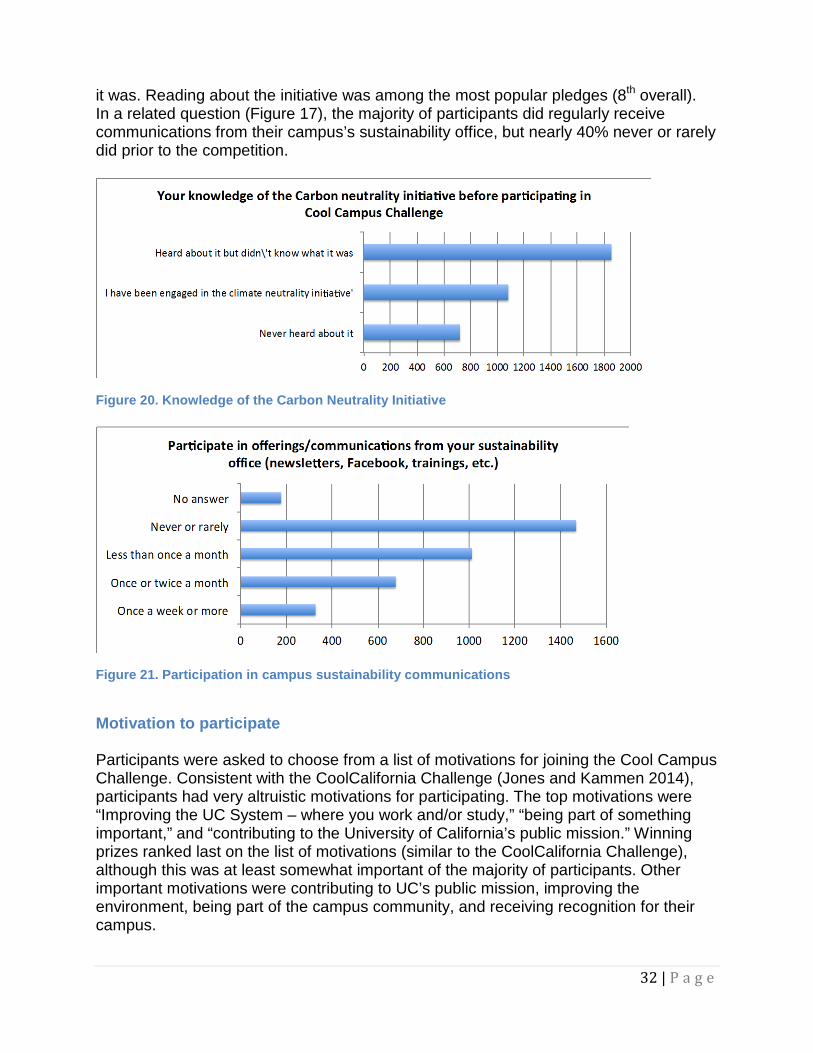
Awareness of UC sustainability efforts An important goal of the CCC was to raise the visibility of the Carbon Neutrality Initiative and other sustainability efforts on campuses. Most respondents (80%) had at least heard about the Carbon Neutrality Initiative, but the majority of those did not know what
32 | P a g e
it was. Reading about the initiative was among the most popular pledges (8th overall). In a related question (Figure 17), the majority of participants did regularly receive communications from their campus’s sustainability office, but nearly 40% never or rarely did prior to the competition.
Figure 20. Knowledge of the Carbon Neutrality Initiative
Figure 21. Participation in campus sustainability communications
Motivation to participate Participants were asked to choose from a list of motivations for joining the Cool Campus Challenge. Consistent with the CoolCalifornia Challenge (Jones and Kammen 2014), participants had very altruistic motivations for participating. The top motivations were “Improving the UC System – where you work and/or study,” “being part of something important,” and “contributing to the University of California’s public mission.” Winning prizes ranked last on the list of motivations (similar to the CoolCalifornia Challenge), although this was at least somewhat important of the majority of participants. Other important motivations were contributing to UC’s public mission, improving the environment, being part of the campus community, and receiving recognition for their campus.
33 | P a g e
Figure 22. Motivations to join the Challenge
Participants’ opinions of the Cool Campus Challenge The program generally received high ratings from participants, with over 30% rating the program as excellent, 50% rating the program as good. Only a very small fraction of participants (less than 2%) rated the program as Poor or Fail. The program overall rated slightly better than the online tool, which subsequently rated slightly better than email communications. About 25% of participants did not believe they received communication with location program implementers; however, all participants should have received at least some direct communications from local program implementers via email.
Figure 23. Overall rating of the Cool Campus Challenge
34 | P a g e
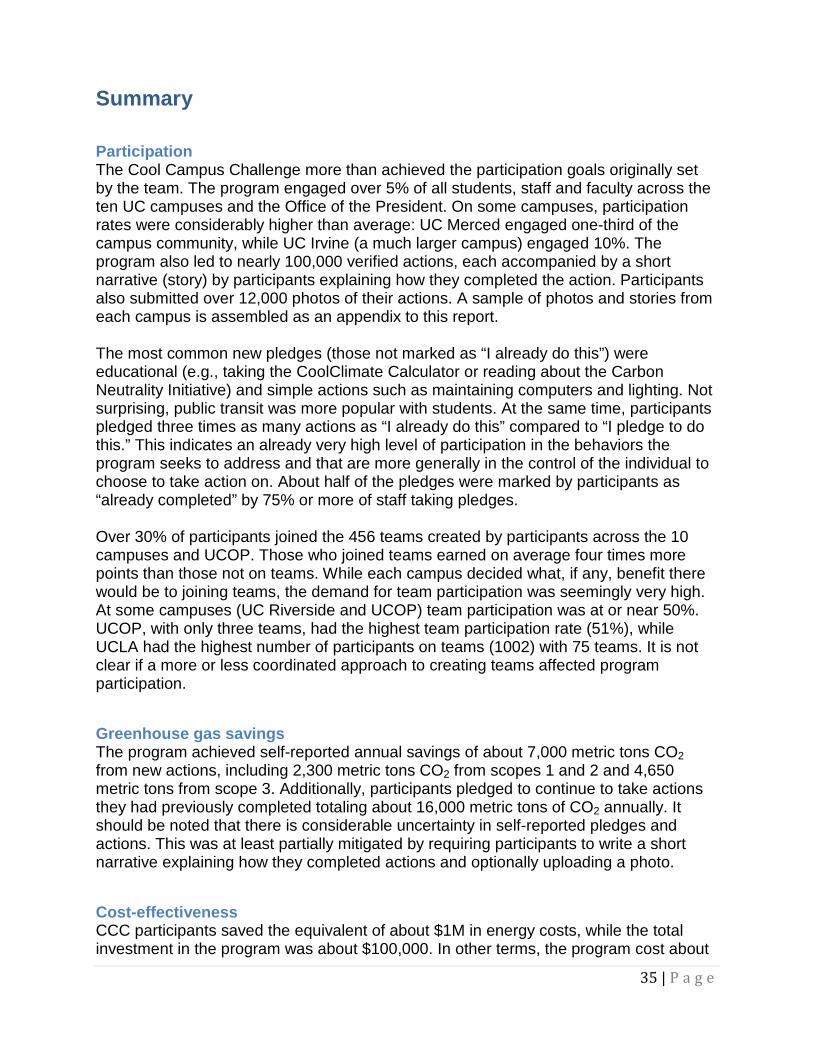
Participants were likely to have heard about the program from multiple sources. Sixty-two percent heard about the program by email and 73% heard about the program from a colleague, campus organization or another participant. Social media, events and flyers were somewhat less effective than word of mouth and email.
Figure 24. Communication channels
35 | P a g e
Summary
Participation The Cool Campus Challenge more than achieved the participation goals originally set by the team. The program engaged over 5% of all students, staff and faculty across the ten UC campuses and the Office of the President. On some campuses, participation rates were considerably higher than average: UC Merced engaged one-third of the campus community, while UC Irvine (a much larger campus) engaged 10%. The program also led to nearly 100,000 verified actions, each accompanied by a short narrative (story) by participants explaining how they completed the action. Participants also submitted over 12,000 photos of their actions. A sample of photos and stories from each campus is assembled as an appendix to this report. The most common new pledges (those not marked as “I already do this”) were educational (e.g., taking the CoolClimate Calculator or reading about the Carbon Neutrality Initiative) and simple actions such as maintaining computers and lighting. Not surprising, public transit was more popular with students. At the same time, participants pledged three times as many actions as “I already do this” compared to “I pledge to do this.” This indicates an already very high level of participation in the behaviors the program seeks to address and that are more generally in the control of the individual to choose to take action on. About half of the pledges were marked by participants as “already completed” by 75% or more of staff taking pledges. Over 30% of participants joined the 456 teams created by participants across the 10 campuses and UCOP. Those who joined teams earned on average four times more points than those not on teams. While each campus decided what, if any, benefit there would be to joining teams, the demand for team participation was seemingly very high. At some campuses (UC Riverside and UCOP) team participation was at or near 50%. UCOP, with only three teams, had the highest team participation rate (51%), while UCLA had the highest number of participants on teams (1002) with 75 teams. It is not clear if a more or less coordinated approach to creating teams affected program participation.
Greenhouse gas savings The program achieved self-reported annual savings of about 7,000 metric tons CO2 from new actions, including 2,300 metric tons CO2 from scopes 1 and 2 and 4,650 metric tons from scope 3. Additionally, participants pledged to continue to take actions they had previously completed totaling about 16,000 metric tons of CO2 annually. It should be noted that there is considerable uncertainty in self-reported pledges and actions. This was at least partially mitigated by requiring participants to write a short narrative explaining how they completed actions and optionally uploading a photo.
Cost-effectiveness CCC participants saved the equivalent of about $1M in energy costs, while the total investment in the program was about $100,000. In other terms, the program cost about
36 | P a g e
$5 dollars per participant and will lead to about 0.33 metric tons per participant in direct and indirect savings (about $15/per metric ton). While there is uncertainty in the actual (vs. reported) savings and the persistence of those savings over time, these are certainly encouraging findings of the potential of behavior change to complement traditional energy efficiency measures. Behavior programs have the additional benefit of extending savings into the homes and future workplaces of UC students and staff, furthering the public service mission of the University. What’s more, the awareness of the CNI created by the program potentially helped create a culture of support for any policy changes of new best practices recommended by the CNI for campuses to embrace. Clearly, both strategies (energy efficiency and conservation) are needed in order to have the greatest effect. The Cool Campus Challenge has the potential to greatly increase energy savings into the future, particularly if the program is able to grow, adapt and improve its effectiveness over time.
Survey Results Over two-thirds of participants were female. While it is common for women to have higher rates of participation than men (e.g., the CoolCalifornia Challenge), it is unclear why this is the case. In stark contrast to the CoolCalifornia City Challenge, for which only 15% of participants are typically under the age of 24 (Jones and Kammen, 2015), over 40% of participants in the Cool Campus Challenge were under 24. This is rather an obvious outcome given the audience of the program, but it should help inform future campaigns given the level of interest by both younger students and older staff. Participants were overwhelmingly liberal, with strong pro-environmental beliefs; however, about 10% of participants were conservative and about 5% of participants were skeptical of anthropogenic climate change. It is interesting to note that while their belief in climate change were not aligned with the objective of the program, there was still active participation from a broad range of the campus community. Consistent with other similar programs, participants were primarily motivated to improve their campuses (or communities), and to be part of something important. This connection to colleagues is essential for creating a culture of sustainability on campuses, which is the ultimate goal of the program. Participants have strong beliefs that their actions make a difference, or self-efficacy, with higher rates among students. Only a tiny fraction (about 1-2%) disagreed that their actions can make a difference to help reduce climate change. It would be interesting to see if self-efficacy can be increased over time with multiple iterations of the program in the future.
Evaluation Participants generally rated the program highly, with 85% rating the program as either excellent (32%) or good (about 50%). Only a tiny fraction considered the program to be poor. For a pilot program, with limited budget and time to implement, these are encouraging results; however there is considerable room for improvement. The following section provides some recommendations for future similar programs.
37 | P a g e
Recommendations for Future Programs While the program was highly successful at engaging the campus community, there are a number of improvements that could be made to make the program even more successful at meeting its goals of activating, educating, motivating, and empowering individuals on campus to make lasting changes that reduce the UC carbon footprint
1. Develop separate targeted messaging for students, faculty and staff. During the pilot program, the weekly emails were all from staff and faculty; however, students outnumbered staff in total participation. Tailored messaging to these two groups could greatly improve participation rates.
2. Develop clear benefits for team participation. Roughly one-third of participants joined teams without clearly defined benefits of doing so. Those who joined teams earned four times as many points. For example, campuses could use small amounts of funding to provide pizza parties for teams meeting certain levels of membership or points, regardless of whether the team is in first place. Or, more strategically, campuses could reach out to teams to help them, for example, conduct an equipment energy audit or go through green office certification.
3. Provide more educational and fun pledges. Taking the CoolClimate Calculator and learning about the Carbon Neutrality Initiative were by far the most popular new pledges. Educational activities also directly contribute to the educational goals of the program.
4. Reduce the number of very common pledges. About 75% or more of participants already completed about half of all pledges. Pledges should focus more on new actions that contribute to reducing energy consumption and GHG emissions on campuses.
5. Share stories and photos. Perhaps the most inspiring aspect of the program is the thousands of photos and tens of thousands of stories submitted by participants. Future iterations could do more to share the best stories and disseminate these to participants on each campus through email,social media and even public displays of campus-specific heroes people could see in person in public areas on campus.
6. Provide positive feedback. Participants should receive recognition for their efforts beyond just points. For example, all participants who achieve either Champion or Guru status could have access to benefits only available to them.
7. Set clear ground rules. The last few days of the competition saw a large number of pledges that were obviously false. Participants should know that verification requires submitting narratives and photos demonstrating how they completed actions, and understand that their points may be eliminated for not playing fair. Future campaigns could limit new signups to the first few weeks of the CCC.
8. Find ways to engage the Gurus. Some participants quickly maxed out all the points they could earn by completing all of the actions. The participants with the most points could have the opportunity to be mentors or participate in activities only available to the participants with the most points.
38 | P a g e
9. Automate data collection. Providing real-time or near real-time data and feedback was extremely laborious. At a minimum the online toold should auto-generate tables and figures and provide this feedback in real time to participants and campuses.
10. Increase social media presence. Social media was a much more popular form of reaching students. If future programs focus more on students, then communicating through social media could greatly improve participation rates.
11. Test software fully before deploying. During the first 24 hours the software was overloaded by the amount of participation. The same thing happened at the end of the CCC. The software should ideally be built and tested long in advance of the launch of future programs.
12. Consider a shorter timeframe. Participation rates were highest at the beginning and end of the program, with considerable leveling off in the middle.
13. Allow for customization by campuses. For example, campuses could include specific educational events for which participants would earn points
14. Follow up for persistence. Six months following the CCC ask people if they have completed pledges. Also, remind them that they made a commitment to do this.
15. Keep up the momentum. Other ways should be explored to keep participants engaged in pledged actions after the program has ended, particularly for ongoing actions that require continual effort and habit formation.
39 | P a g e
Cited References Dietz, T., Gardner, G.T., Gilligan, J., Stern, P.C. and Vandenbergh, M.P., 2009. Household actions can provide a behavioral wedge to rapidly reduce US carbon emissions. Proceedings of the National Academy of Sciences, 106(44), pp.18452-18456. Jones, C.M. and Kammen, D.M., The CoolCalifornia Challenge: A Pilot Inter-City Household Carbon Footprint Reduction. Report prepared for the California Air Resources Board under contract 10-325. November 2014. 90 pages. Laitner et al., 2009. “Examining the Scale of the Behavior Energy Efficiency Continuum” Doug McKenzie-Mohr, 2013. Fostering sustainable behavior: An introduction to community-based social marketing Petersen JE, Frantz CM, Shammin MR, Yanisch TM, Tincknell E, Myers N (2015) Electricity and Water Conservation on College and University Campuses in Response to National Competitions among Dormitories: Quantifying Relationships between Behavior, Conservation Strategies and Psychological Metrics. PLoS ONE 10(12): e0144070. doi:10.1371/journal.pone.0144070 Vine, E. and Jones, CM. A Review of Energy Reduction Competitions: What Have We Learned? Report prepared for the California Public Utilities Commission. 2015. 167 pp. University of California, 2016. Fact sheet: UC Carbon Neutrality Initiative. Downloaded at http://www.ucop.edu/initiatives/_files/carbon-neutrality-initiative/cni-fact-sheet.pdf. University of California, 2016b. Carbon Neutrality Initiative website: http://www.ucop.edu/sustainability/_files/carbon-neutrality2025.pdf
40 | P a g e
Appendix A. Additional Figures and Tables
Data from software tool
41 | P a g e
42 | P a g e
43 | P a g e
44 | P a g e
Additional participant survey responses
45 | P a g e
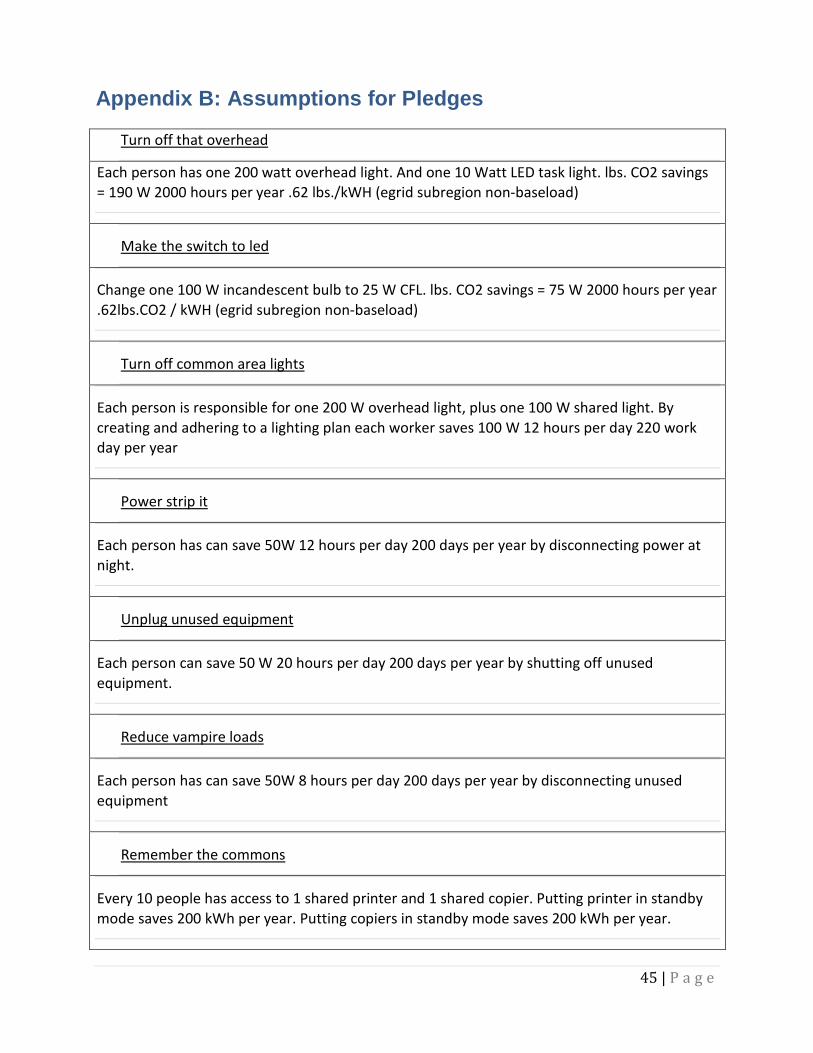
Appendix B: Assumptions for Pledges
Turn off that overhead
Each person has one 200 watt overhead light. And one 10 Watt LED task light. lbs. CO2 savings = 190 W 2000 hours per year .62 lbs./kWH (egrid subregion non-baseload)
Make the switch to led
Change one 100 W incandescent bulb to 25 W CFL. lbs. CO2 savings = 75 W 2000 hours per year .62lbs.CO2 / kWH (egrid subregion non-baseload)
Turn off common area lights
Each person is responsible for one 200 W overhead light, plus one 100 W shared light. By creating and adhering to a lighting plan each worker saves 100 W 12 hours per day 220 work day per year
Power strip it
Each person has can save 50W 12 hours per day 200 days per year by disconnecting power at night.
Unplug unused equipment
Each person can save 50 W 20 hours per day 200 days per year by shutting off unused equipment.
Reduce vampire loads
Each person has can save 50W 8 hours per day 200 days per year by disconnecting unused equipment
Remember the commons
Every 10 people has access to 1 shared printer and 1 shared copier. Putting printer in standby mode saves 200 kWh per year. Putting copiers in standby mode saves 200 kWh per year.
46 | P a g e
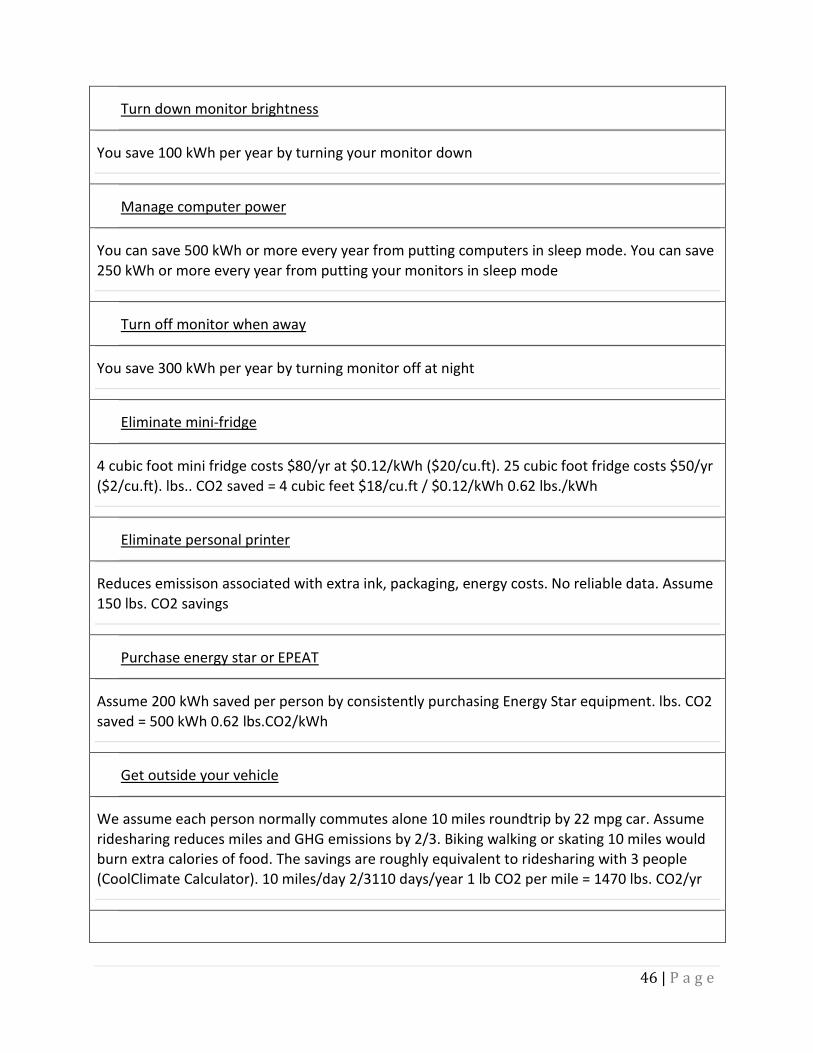
Turn down monitor brightness
You save 100 kWh per year by turning your monitor down
Manage computer power
You can save 500 kWh or more every year from putting computers in sleep mode. You can save 250 kWh or more every year from putting your monitors in sleep mode
Turn off monitor when away
You save 300 kWh per year by turning monitor off at night
Eliminate mini-fridge
4 cubic foot mini fridge costs $80/yr at $0.12/kWh ($20/cu.ft). 25 cubic foot fridge costs $50/yr ($2/cu.ft). lbs.. CO2 saved = 4 cubic feet $18/cu.ft / $0.12/kWh 0.62 lbs./kWh
Eliminate personal printer
Reduces emissison associated with extra ink, packaging, energy costs. No reliable data. Assume 150 lbs. CO2 savings
Purchase energy star or EPEAT
Assume 200 kWh saved per person by consistently purchasing Energy Star equipment. lbs. CO2 saved = 500 kWh 0.62 lbs.CO2/kWh
Get outside your vehicle
We assume each person normally commutes alone 10 miles roundtrip by 22 mpg car. Assume ridesharing reduces miles and GHG emissions by 2/3. Biking walking or skating 10 miles would burn extra calories of food. The savings are roughly equivalent to ridesharing with 3 people (CoolClimate Calculator). 10 miles/day 2/3110 days/year 1 lb CO2 per mile = 1470 lbs. CO2/yr
47 | P a g e
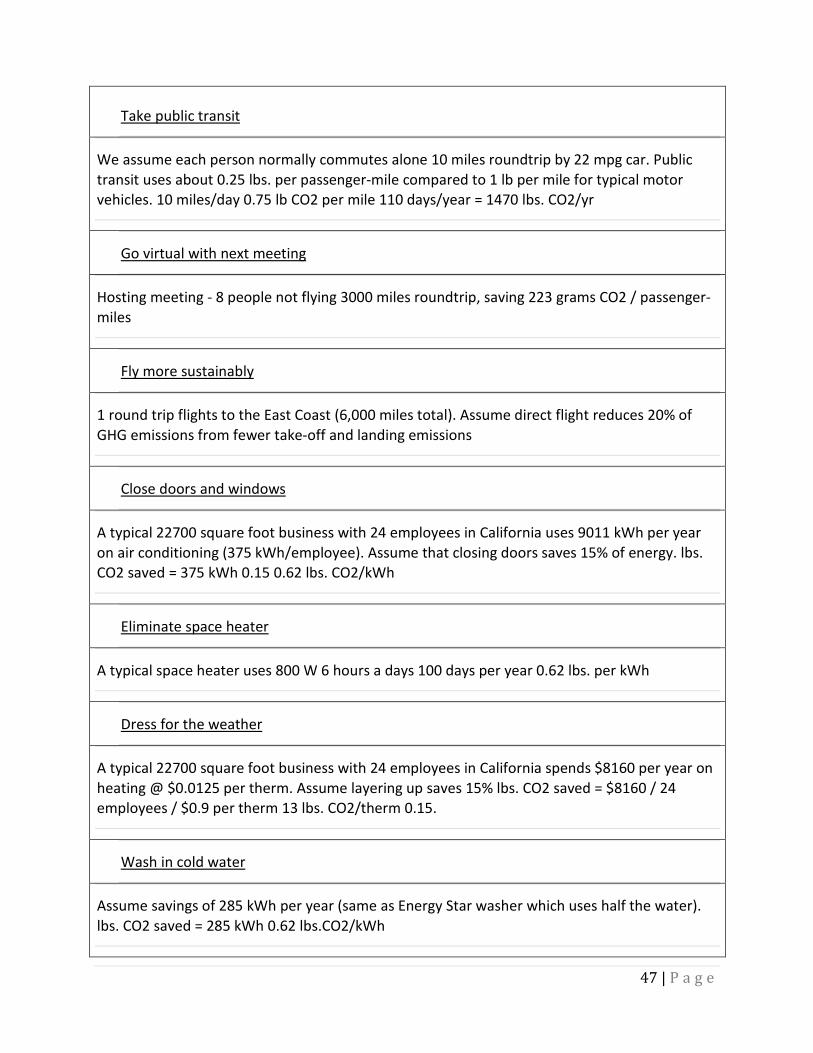
Take public transit
We assume each person normally commutes alone 10 miles roundtrip by 22 mpg car. Public transit uses about 0.25 lbs. per passenger-mile compared to 1 lb per mile for typical motor vehicles. 10 miles/day 0.75 lb CO2 per mile 110 days/year = 1470 lbs. CO2/yr
Go virtual with next meeting
Hosting meeting - 8 people not flying 3000 miles roundtrip, saving 223 grams CO2 / passenger-miles
Fly more sustainably
1 round trip flights to the East Coast (6,000 miles total). Assume direct flight reduces 20% of GHG emissions from fewer take-off and landing emissions
Close doors and windows
A typical 22700 square foot business with 24 employees in California uses 9011 kWh per year on air conditioning (375 kWh/employee). Assume that closing doors saves 15% of energy. lbs. CO2 saved = 375 kWh 0.15 0.62 lbs. CO2/kWh
Eliminate space heater
A typical space heater uses 800 W 6 hours a days 100 days per year 0.62 lbs. per kWh
Dress for the weather
A typical 22700 square foot business with 24 employees in California spends $8160 per year on heating @ $0.0125 per therm. Assume layering up saves 15% lbs. CO2 saved = $8160 / 24 employees / $0.9 per therm 13 lbs. CO2/therm 0.15.
Wash in cold water
Assume savings of 285 kWh per year (same as Energy Star washer which uses half the water). lbs. CO2 saved = 285 kWh 0.62 lbs.CO2/kWh

48 | P a g e
Curtail that energy use
Assume curtailments saves 200 Watts 24 hrs/day 14 days 0.62 lbs. CO2 per kWh
Go meatless at your events
2 campus meeting events per year with 8 people at each meeting/event 500 calories of meat reduced 2.25 gCO2/calorie
Go paperless
Assume saves 20 lbs. CO2
Eliminate single use items
1 plastic item per day 1 lbs. CO2 saved per plastic fork 220 days
Reduce and reuse
1 office chair per year $500 per chair 600 grams CO2 per $
49 | P a g e
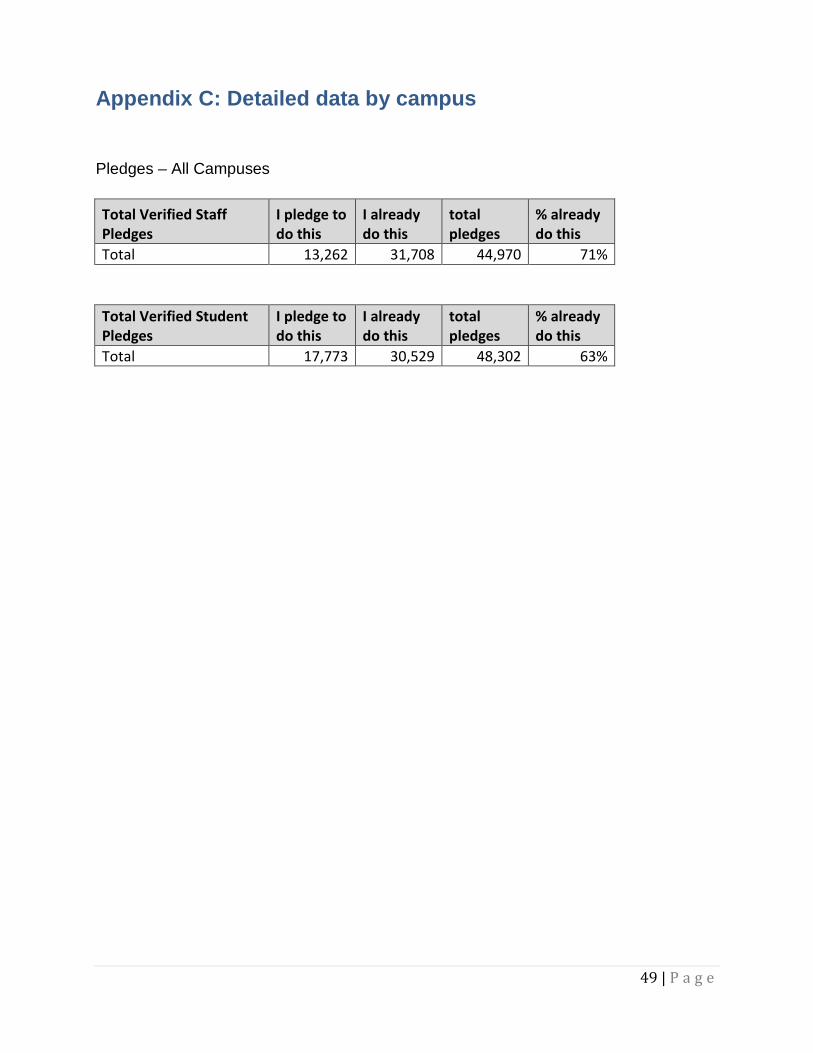
Appendix C: Detailed data by campus Pledges – All Campuses Total Verified Staff Pledges
I pledge to do this
I already do this
total pledges
% already do this
Total 13,262 31,708 44,970 71%
Total Verified Student Pledges
I pledge to do this
I already do this
total pledges
% already do this
Total 17,773 30,529 48,302 63%
50 | P a g e
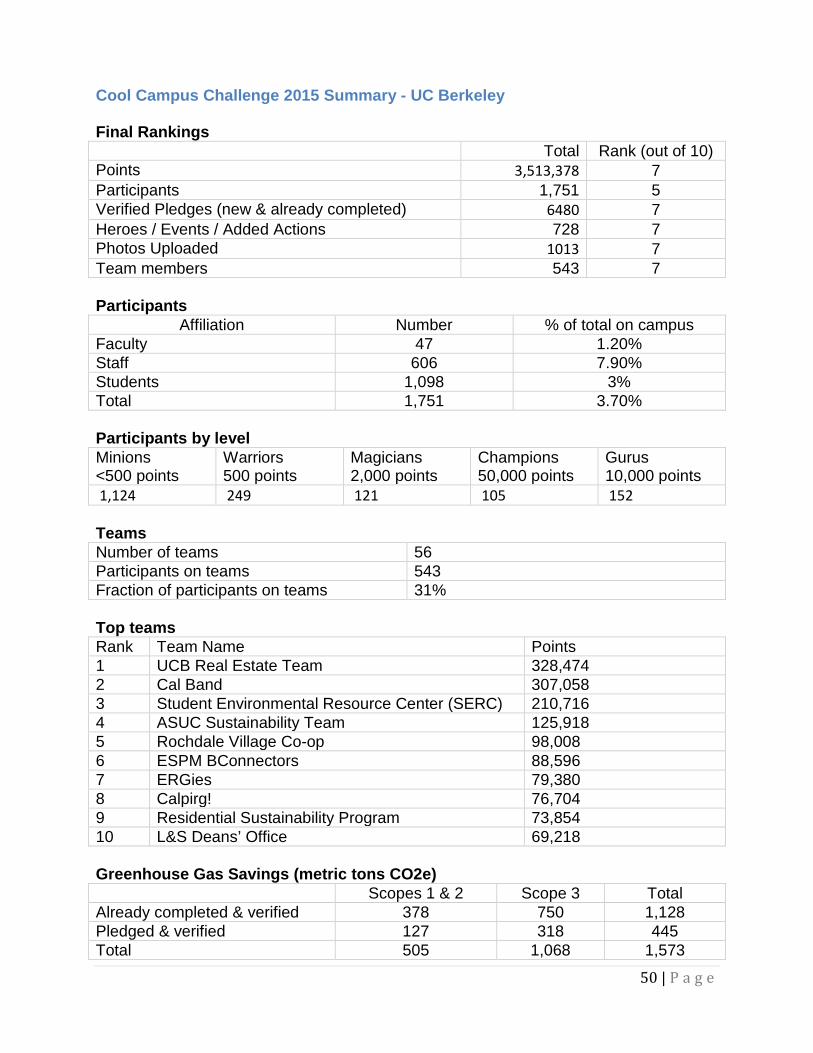
Cool Campus Challenge 2015 Summary - UC Berkeley Final Rankings Total Rank (out of 10) Points 3,513,378 7 Participants 1,751 5 Verified Pledges (new & already completed) 6480 7 Heroes / Events / Added Actions 728 7 Photos Uploaded 1013 7 Team members 543 7 Participants
Affiliation Number % of total on campus Faculty 47 1.20% Staff 606 7.90% Students 1,098 3% Total 1,751 3.70% Participants by level Minions <500 points
Warriors 500 points
Magicians 2,000 points
Champions 50,000 points
Gurus 10,000 points
1,124 249 121 105 152 Teams Number of teams 56 Participants on teams 543 Fraction of participants on teams 31% Top teams Rank Team Name Points 1 UCB Real Estate Team 328,474 2 Cal Band 307,058 3 Student Environmental Resource Center (SERC) 210,716 4 ASUC Sustainability Team 125,918 5 Rochdale Village Co-op 98,008 6 ESPM BConnectors 88,596 7 ERGies 79,380 8 Calpirg! 76,704 9 Residential Sustainability Program 73,854 10 L&S Deans’ Office 69,218 Greenhouse Gas Savings (metric tons CO2e)
Scopes 1 & 2 Scope 3 Total Already completed & verified 378 750 1,128 Pledged & verified 127 318 445 Total 505 1,068 1,573
51 | P a g e
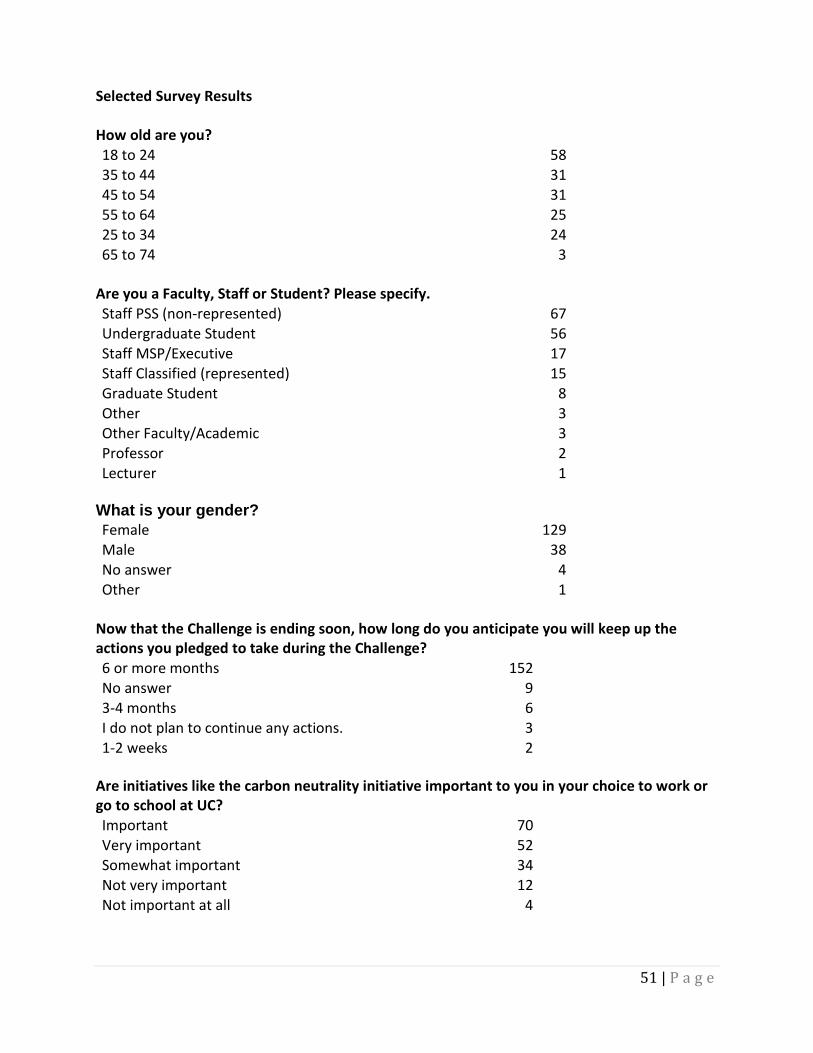
Selected Survey Results
How old are you? 18 to 24 58 35 to 44 31 45 to 54 31 55 to 64 25 25 to 34 24 65 to 74 3
Are you a Faculty, Staff or Student? Please specify. Staff PSS (non-represented) 67 Undergraduate Student 56 Staff MSP/Executive 17 Staff Classified (represented) 15 Graduate Student 8 Other 3 Other Faculty/Academic 3 Professor 2 Lecturer 1
What is your gender? Female 129 Male 38 No answer 4 Other 1
Now that the Challenge is ending soon, how long do you anticipate you will keep up the actions you pledged to take during the Challenge? 6 or more months 152 No answer 9 3-4 months 6 I do not plan to continue any actions. 3 1-2 weeks 2
Are initiatives like the carbon neutrality initiative important to you in your choice to work or go to school at UC? Important 70 Very important 52 Somewhat important 34 Not very important 12 Not important at all 4
52 | P a g e
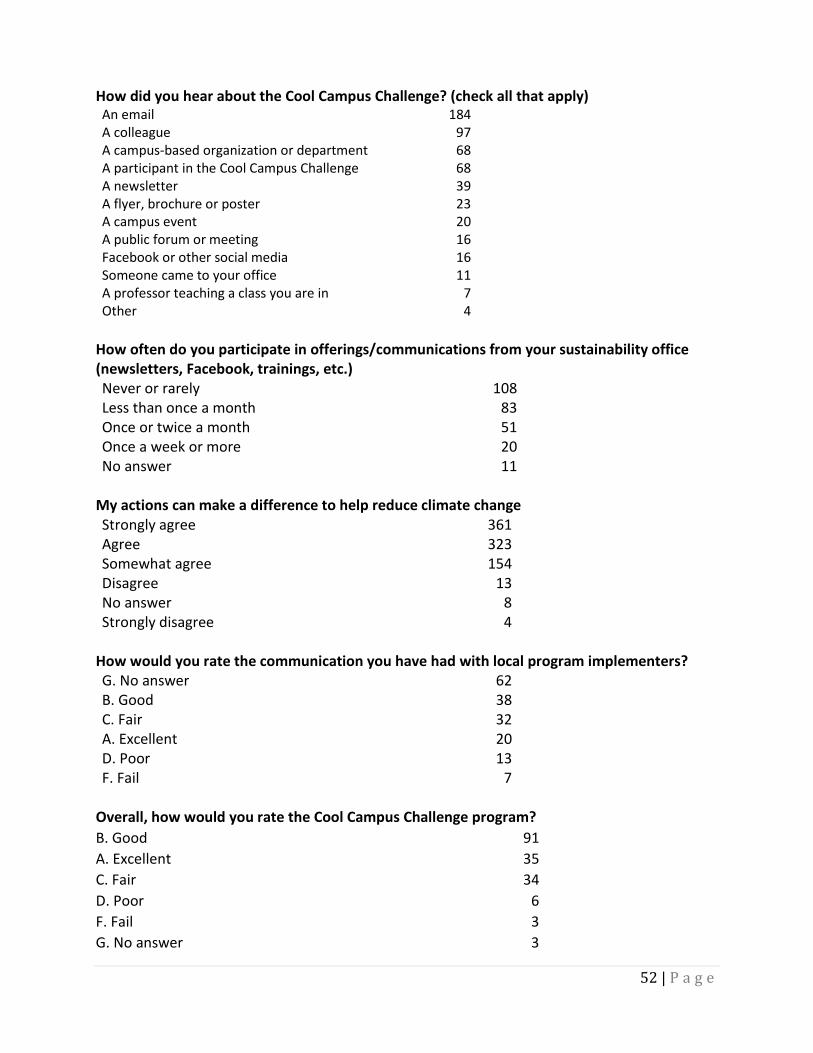
How did you hear about the Cool Campus Challenge? (check all that apply) An email 184 A colleague 97 A campus-based organization or department 68 A participant in the Cool Campus Challenge 68 A newsletter 39 A flyer, brochure or poster 23 A campus event 20 A public forum or meeting 16 Facebook or other social media 16 Someone came to your office 11 A professor teaching a class you are in 7 Other 4
How often do you participate in offerings/communications from your sustainability office (newsletters, Facebook, trainings, etc.) Never or rarely 108 Less than once a month 83 Once or twice a month 51 Once a week or more 20 No answer 11
My actions can make a difference to help reduce climate change Strongly agree 361 Agree 323 Somewhat agree 154 Disagree 13 No answer 8 Strongly disagree 4
How would you rate the communication you have had with local program implementers? G. No answer 62 B. Good 38 C. Fair 32 A. Excellent 20 D. Poor 13 F. Fail 7
Overall, how would you rate the Cool Campus Challenge program? B. Good 91 A. Excellent 35 C. Fair 34 D. Poor 6 F. Fail 3 G. No answer 3
53 | P a g e
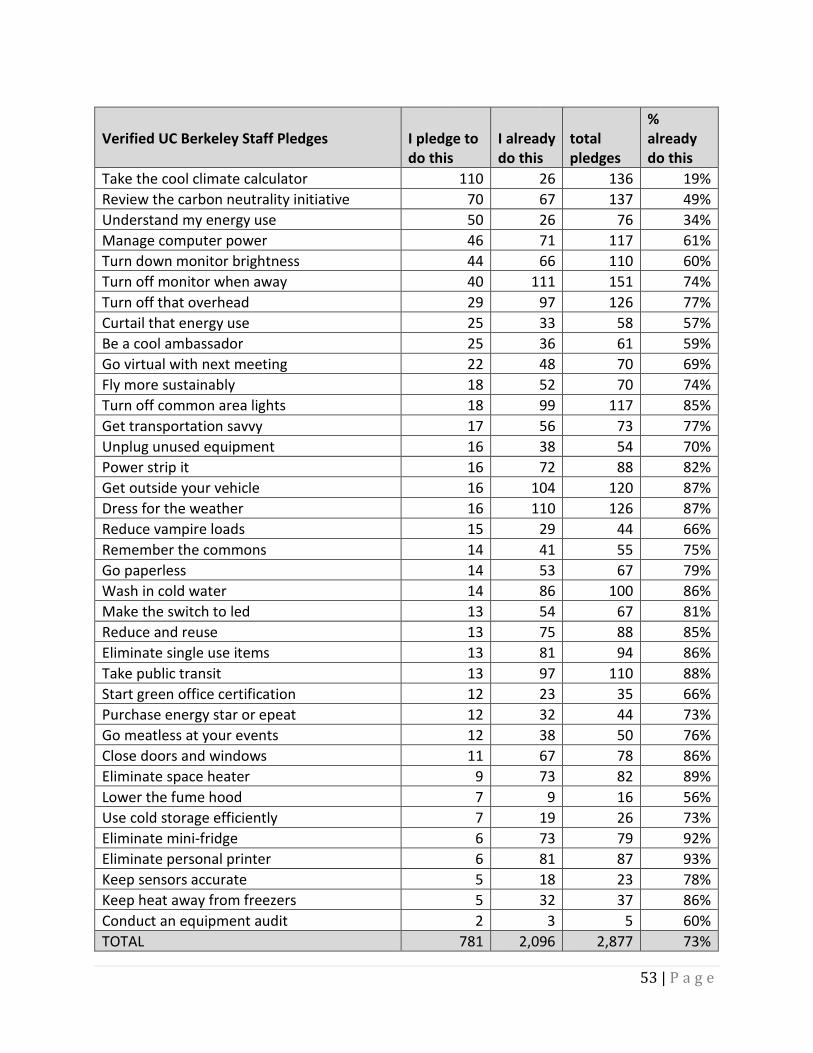
Verified UC Berkeley Staff Pledges
I pledge to do this
I already do this
total pledges
% already do this
Take the cool climate calculator 110 26 136 19% Review the carbon neutrality initiative 70 67 137 49% Understand my energy use 50 26 76 34% Manage computer power 46 71 117 61% Turn down monitor brightness 44 66 110 60% Turn off monitor when away 40 111 151 74% Turn off that overhead 29 97 126 77% Curtail that energy use 25 33 58 57% Be a cool ambassador 25 36 61 59% Go virtual with next meeting 22 48 70 69% Fly more sustainably 18 52 70 74% Turn off common area lights 18 99 117 85% Get transportation savvy 17 56 73 77% Unplug unused equipment 16 38 54 70% Power strip it 16 72 88 82% Get outside your vehicle 16 104 120 87% Dress for the weather 16 110 126 87% Reduce vampire loads 15 29 44 66% Remember the commons 14 41 55 75% Go paperless 14 53 67 79% Wash in cold water 14 86 100 86% Make the switch to led 13 54 67 81% Reduce and reuse 13 75 88 85% Eliminate single use items 13 81 94 86% Take public transit 13 97 110 88% Start green office certification 12 23 35 66% Purchase energy star or epeat 12 32 44 73% Go meatless at your events 12 38 50 76% Close doors and windows 11 67 78 86% Eliminate space heater 9 73 82 89% Lower the fume hood 7 9 16 56% Use cold storage efficiently 7 19 26 73% Eliminate mini-fridge 6 73 79 92% Eliminate personal printer 6 81 87 93% Keep sensors accurate 5 18 23 78% Keep heat away from freezers 5 32 37 86% Conduct an equipment audit 2 3 5 60% TOTAL 781 2,096 2,877 73%
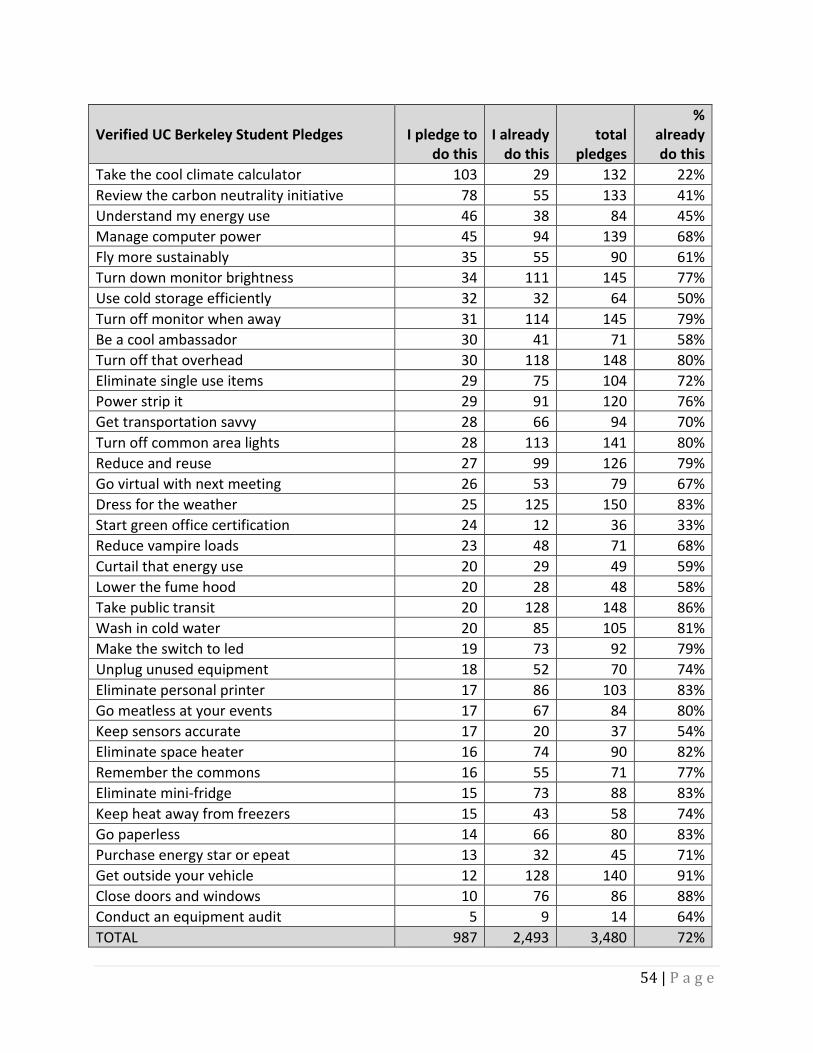
54 | P a g e
Verified UC Berkeley Student Pledges
I pledge to do this
I already do this
total pledges
% already do this
Take the cool climate calculator 103 29 132 22% Review the carbon neutrality initiative 78 55 133 41% Understand my energy use 46 38 84 45% Manage computer power 45 94 139 68% Fly more sustainably 35 55 90 61% Turn down monitor brightness 34 111 145 77% Use cold storage efficiently 32 32 64 50% Turn off monitor when away 31 114 145 79% Be a cool ambassador 30 41 71 58% Turn off that overhead 30 118 148 80% Eliminate single use items 29 75 104 72% Power strip it 29 91 120 76% Get transportation savvy 28 66 94 70% Turn off common area lights 28 113 141 80% Reduce and reuse 27 99 126 79% Go virtual with next meeting 26 53 79 67% Dress for the weather 25 125 150 83% Start green office certification 24 12 36 33% Reduce vampire loads 23 48 71 68% Curtail that energy use 20 29 49 59% Lower the fume hood 20 28 48 58% Take public transit 20 128 148 86% Wash in cold water 20 85 105 81% Make the switch to led 19 73 92 79% Unplug unused equipment 18 52 70 74% Eliminate personal printer 17 86 103 83% Go meatless at your events 17 67 84 80% Keep sensors accurate 17 20 37 54% Eliminate space heater 16 74 90 82% Remember the commons 16 55 71 77% Eliminate mini-fridge 15 73 88 83% Keep heat away from freezers 15 43 58 74% Go paperless 14 66 80 83% Purchase energy star or epeat 13 32 45 71% Get outside your vehicle 12 128 140 91% Close doors and windows 10 76 86 88% Conduct an equipment audit 5 9 14 64% TOTAL 987 2,493 3,480 72%
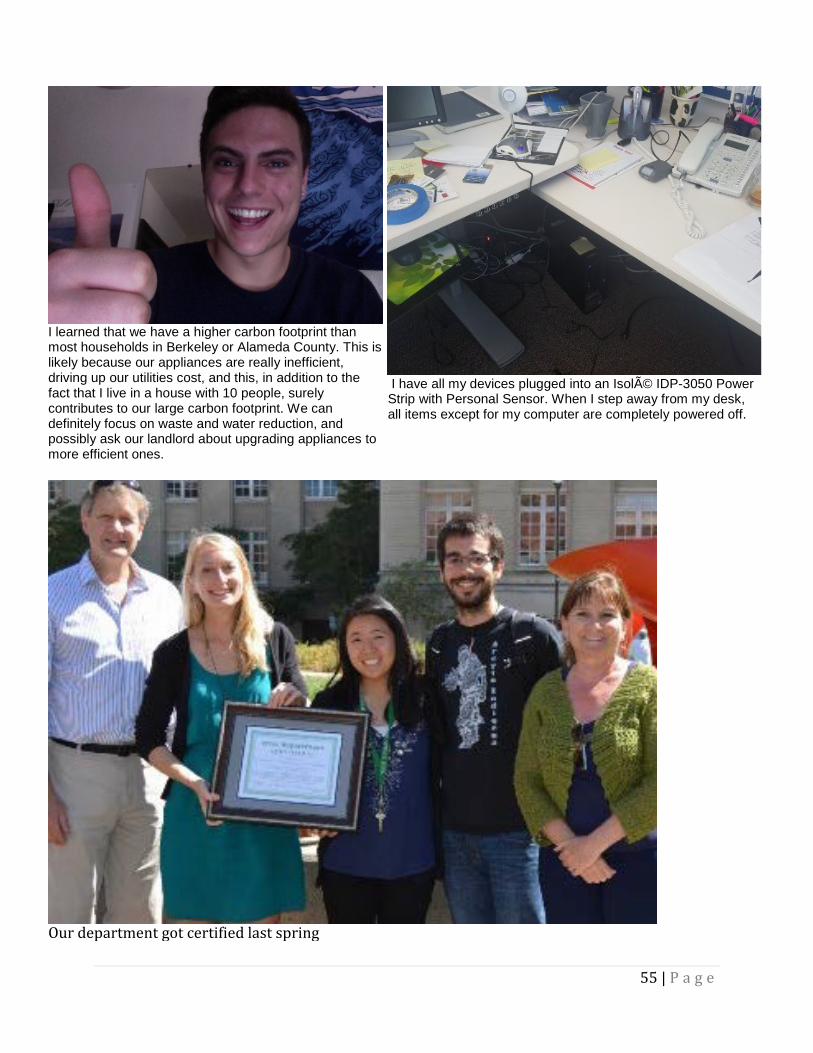
55 | P a g e
I learned that we have a higher carbon footprint than most households in Berkeley or Alameda County. This is likely because our appliances are really inefficient, driving up our utilities cost, and this, in addition to the fact that I live in a house with 10 people, surely contributes to our large carbon footprint. We can definitely focus on waste and water reduction, and possibly ask our landlord about upgrading appliances to more efficient ones.
I have all my devices plugged into an Isolé IDP-3050 Power Strip with Personal Sensor. When I step away from my desk, all items except for my computer are completely powered off.
Our department got certified last spring
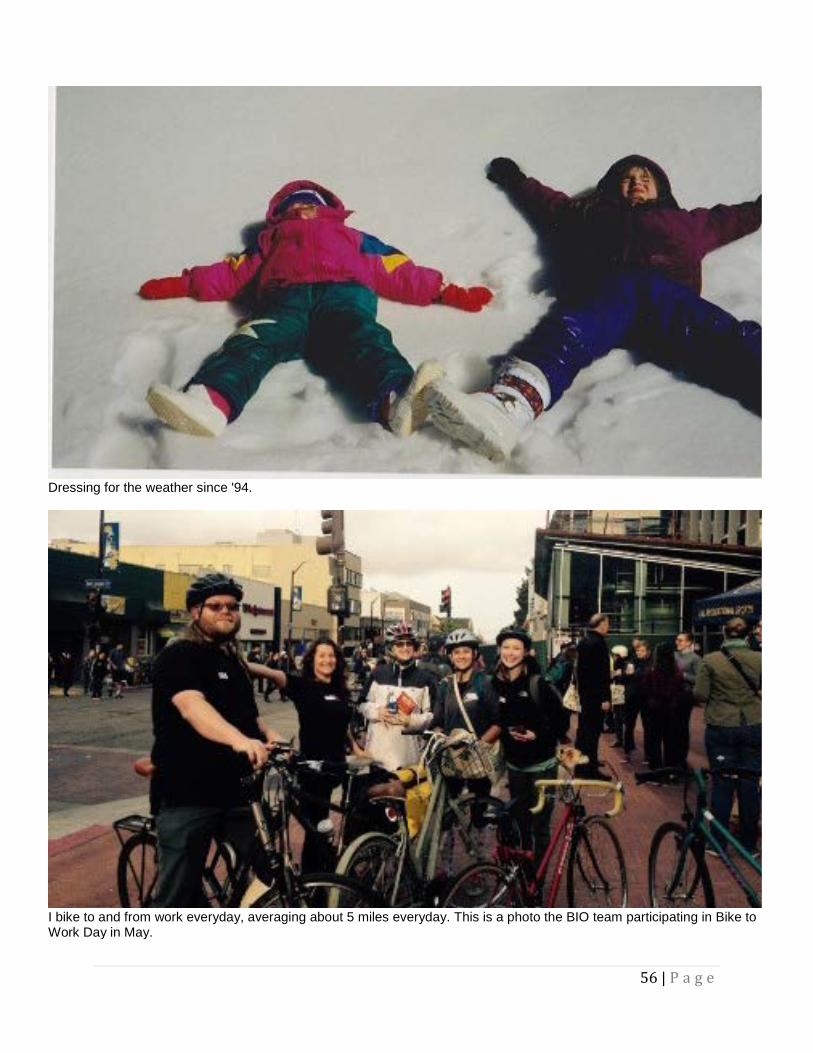
56 | P a g e
Dressing for the weather since '94.
I bike to and from work everyday, averaging about 5 miles everyday. This is a photo the BIO team participating in Bike to Work Day in May.
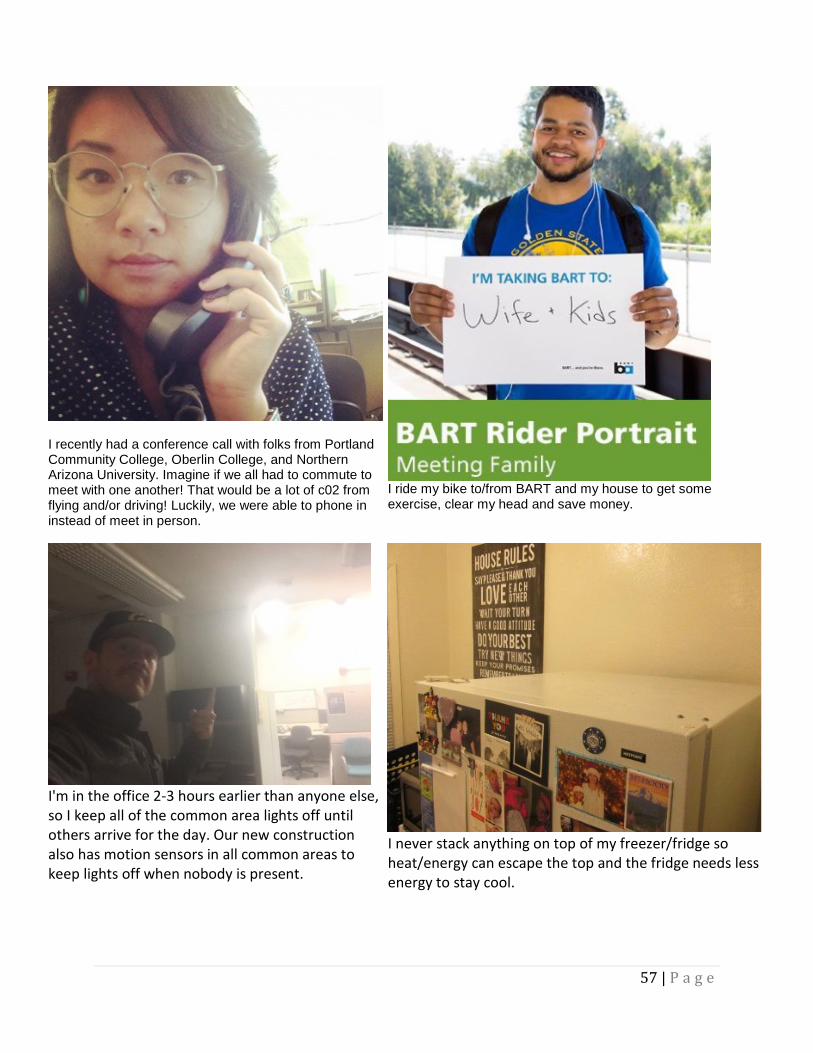
57 | P a g e
I recently had a conference call with folks from Portland Community College, Oberlin College, and Northern Arizona University. Imagine if we all had to commute to meet with one another! That would be a lot of c02 from flying and/or driving! Luckily, we were able to phone in instead of meet in person.
I ride my bike to/from BART and my house to get some exercise, clear my head and save money.
I'm in the office 2-3 hours earlier than anyone else, so I keep all of the common area lights off until others arrive for the day. Our new construction also has motion sensors in all common areas to keep lights off when nobody is present.
I never stack anything on top of my freezer/fridge so heat/energy can escape the top and the fridge needs less energy to stay cool.
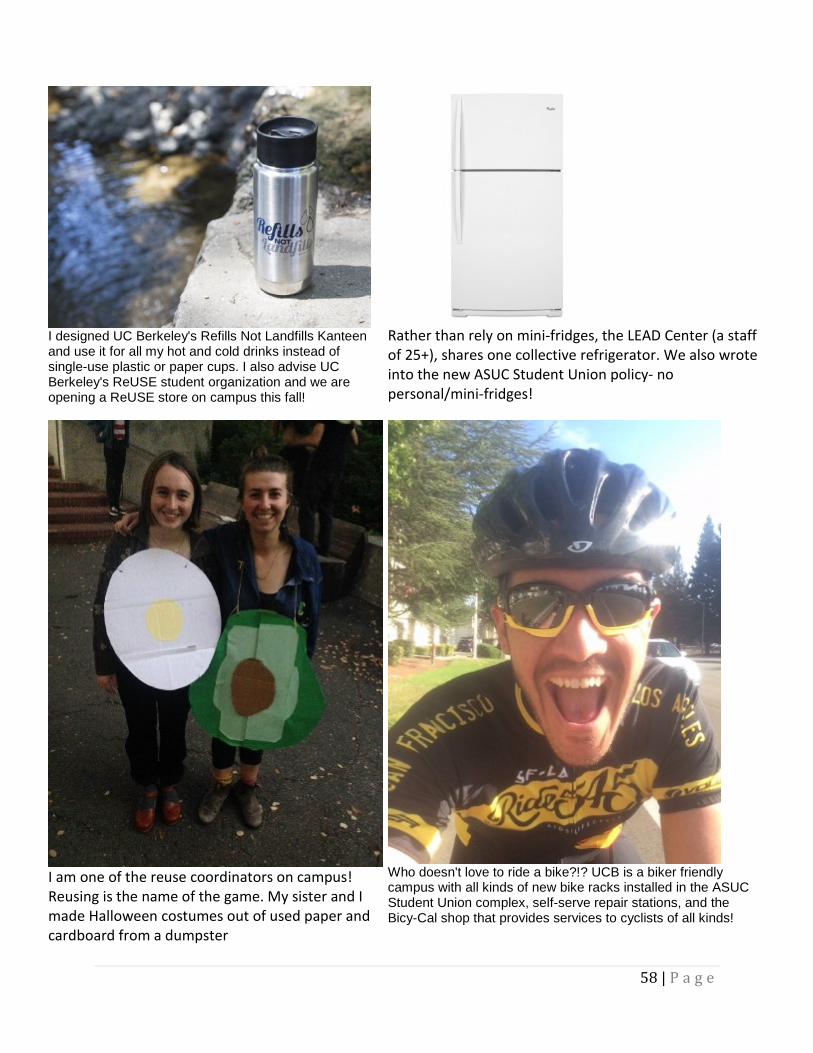
58 | P a g e
I designed UC Berkeley's Refills Not Landfills Kanteen and use it for all my hot and cold drinks instead of single-use plastic or paper cups. I also advise UC Berkeley's ReUSE student organization and we are opening a ReUSE store on campus this fall!
Rather than rely on mini-fridges, the LEAD Center (a staff of 25+), shares one collective refrigerator. We also wrote into the new ASUC Student Union policy- no personal/mini-fridges!
I am one of the reuse coordinators on campus! Reusing is the name of the game. My sister and I made Halloween costumes out of used paper and cardboard from a dumpster
Who doesn't love to ride a bike?!? UCB is a biker friendly campus with all kinds of new bike racks installed in the ASUC Student Union complex, self-serve repair stations, and the Bicy-Cal shop that provides services to cyclists of all kinds!
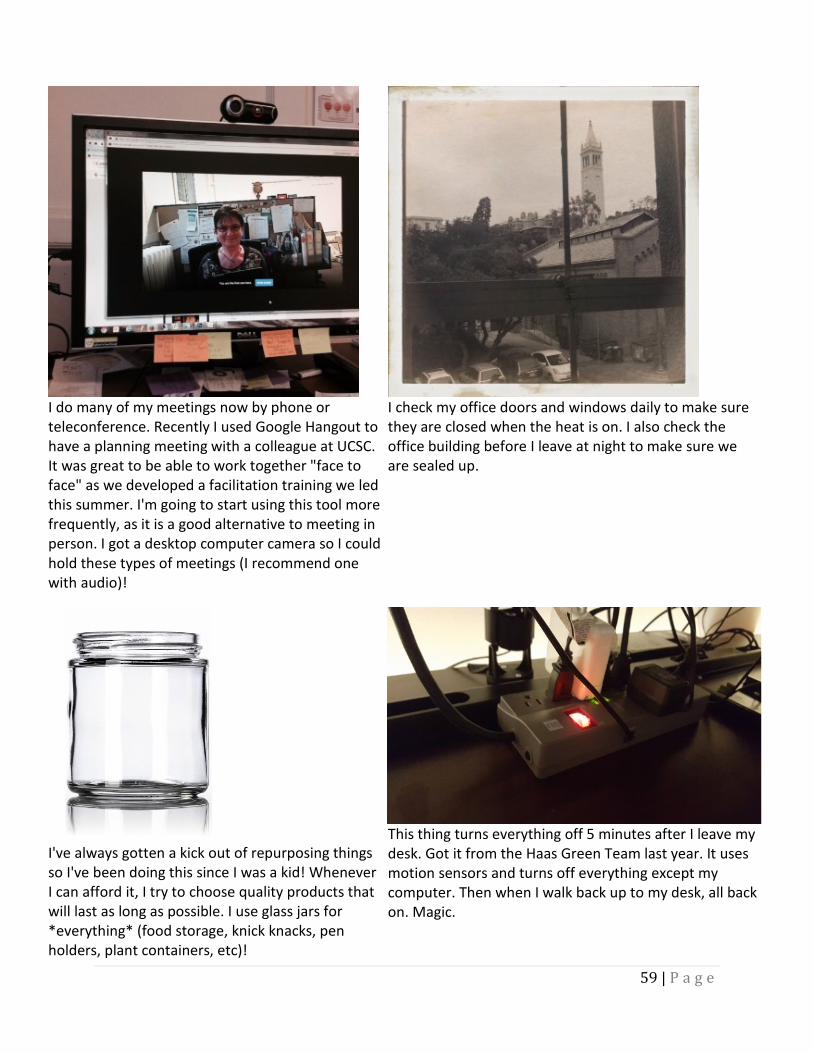
59 | P a g e
I do many of my meetings now by phone or teleconference. Recently I used Google Hangout to have a planning meeting with a colleague at UCSC. It was great to be able to work together "face to face" as we developed a facilitation training we led this summer. I'm going to start using this tool more frequently, as it is a good alternative to meeting in person. I got a desktop computer camera so I could hold these types of meetings (I recommend one with audio)!
I check my office doors and windows daily to make sure they are closed when the heat is on. I also check the office building before I leave at night to make sure we are sealed up.
I've always gotten a kick out of repurposing things so I've been doing this since I was a kid! Whenever I can afford it, I try to choose quality products that will last as long as possible. I use glass jars for *everything* (food storage, knick knacks, pen holders, plant containers, etc)!
This thing turns everything off 5 minutes after I leave my desk. Got it from the Haas Green Team last year. It uses motion sensors and turns off everything except my computer. Then when I walk back up to my desk, all back on. Magic.
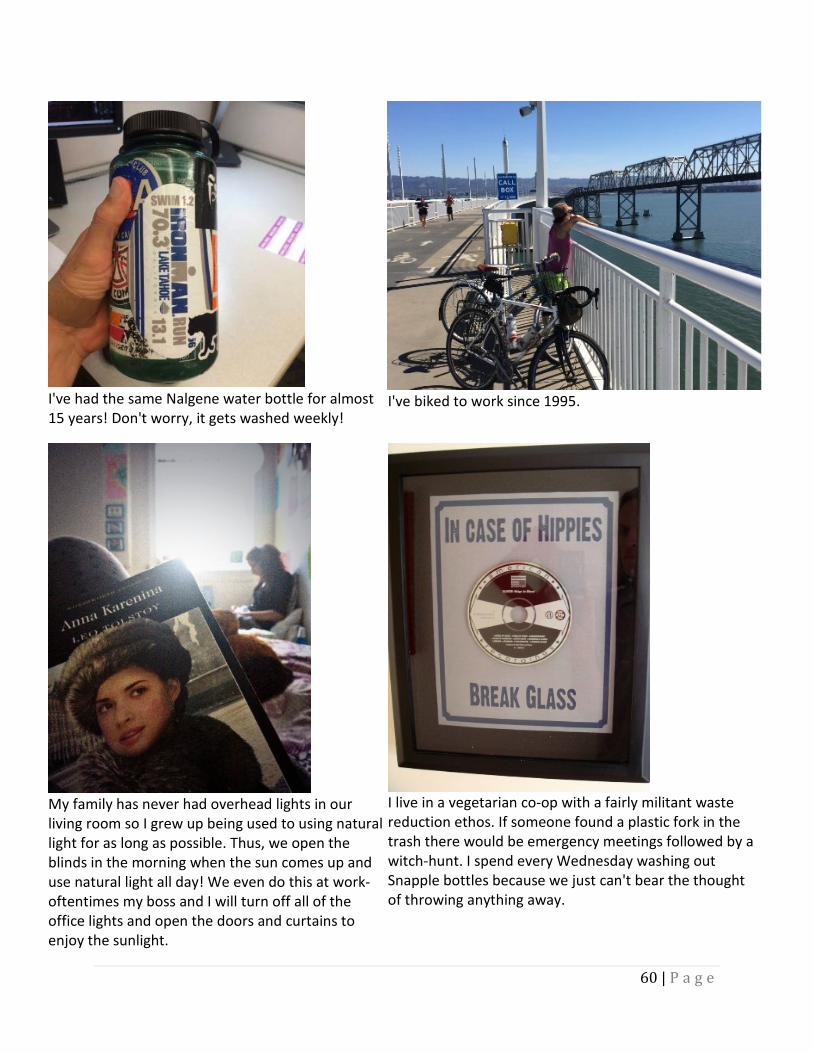
60 | P a g e
I've had the same Nalgene water bottle for almost 15 years! Don't worry, it gets washed weekly!
I've biked to work since 1995.
My family has never had overhead lights in our living room so I grew up being used to using natural light for as long as possible. Thus, we open the blinds in the morning when the sun comes up and use natural light all day! We even do this at work- oftentimes my boss and I will turn off all of the office lights and open the doors and curtains to enjoy the sunlight.
I live in a vegetarian co-op with a fairly militant waste reduction ethos. If someone found a plastic fork in the trash there would be emergency meetings followed by a witch-hunt. I spend every Wednesday washing out Snapple bottles because we just can't bear the thought of throwing anything away.
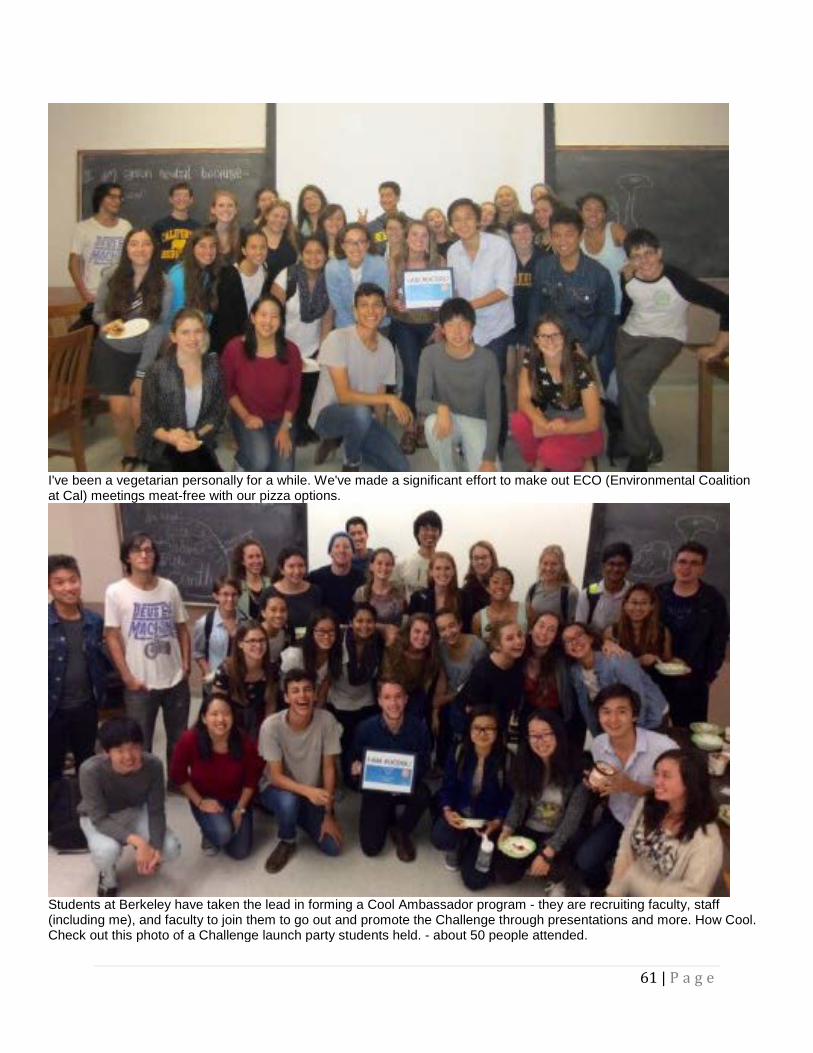
61 | P a g e
I've been a vegetarian personally for a while. We've made a significant effort to make out ECO (Environmental Coalition at Cal) meetings meat-free with our pizza options.
Students at Berkeley have taken the lead in forming a Cool Ambassador program - they are recruiting faculty, staff (including me), and faculty to join them to go out and promote the Challenge through presentations and more. How Cool. Check out this photo of a Challenge launch party students held. - about 50 people attended.
62 | P a g e
I have talked about and encouraged my roommates, club and friends to get involved with the cool campus challenge. I also taught how to use the platform at my decal.
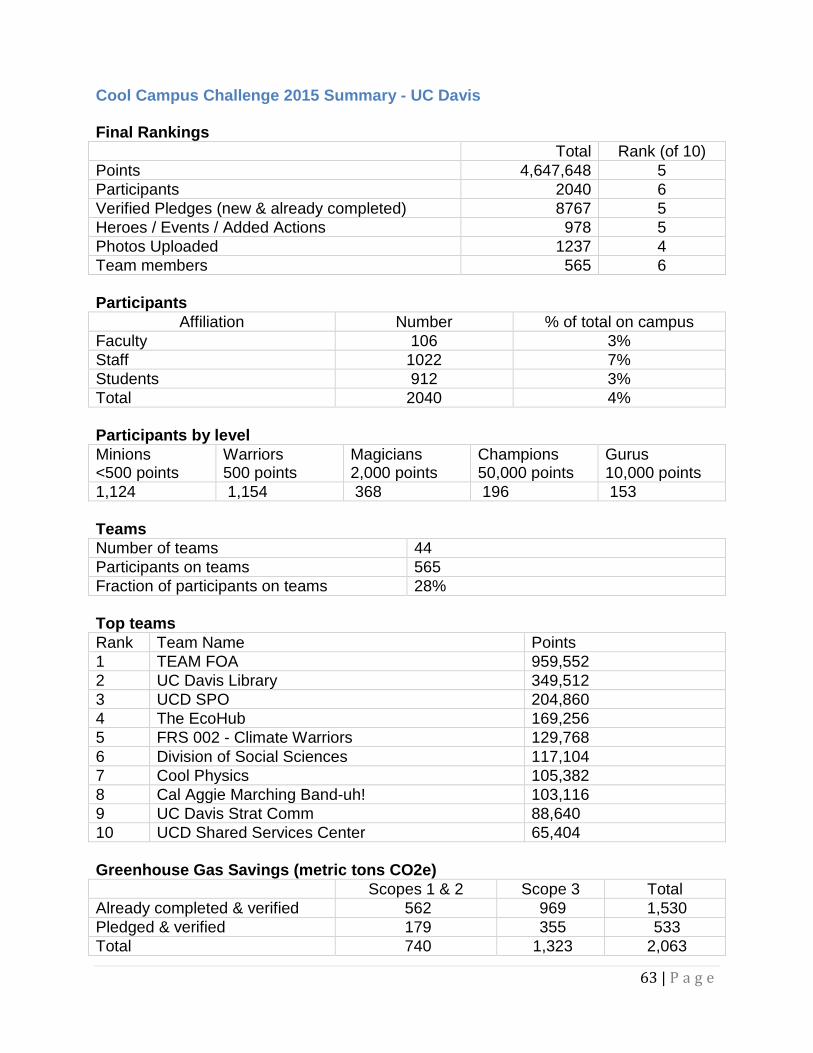
63 | P a g e
Cool Campus Challenge 2015 Summary - UC Davis Final Rankings Total Rank (of 10) Points 4,647,648 5 Participants 2040 6 Verified Pledges (new & already completed) 8767 5 Heroes / Events / Added Actions 978 5 Photos Uploaded 1237 4 Team members 565 6 Participants
Affiliation Number % of total on campus Faculty 106 3% Staff 1022 7% Students 912 3% Total 2040 4% Participants by level Minions <500 points
Warriors 500 points
Magicians 2,000 points
Champions 50,000 points
Gurus 10,000 points
1,124 1,154 368 196 153 Teams Number of teams 44 Participants on teams 565 Fraction of participants on teams 28% Top teams Rank Team Name Points 1 TEAM FOA 959,552 2 UC Davis Library 349,512 3 UCD SPO 204,860 4 The EcoHub 169,256 5 FRS 002 - Climate Warriors 129,768 6 Division of Social Sciences 117,104 7 Cool Physics 105,382 8 Cal Aggie Marching Band-uh! 103,116 9 UC Davis Strat Comm 88,640 10 UCD Shared Services Center 65,404 Greenhouse Gas Savings (metric tons CO2e)
Scopes 1 & 2 Scope 3 Total Already completed & verified 562 969 1,530 Pledged & verified 179 355 533 Total 740 1,323 2,063
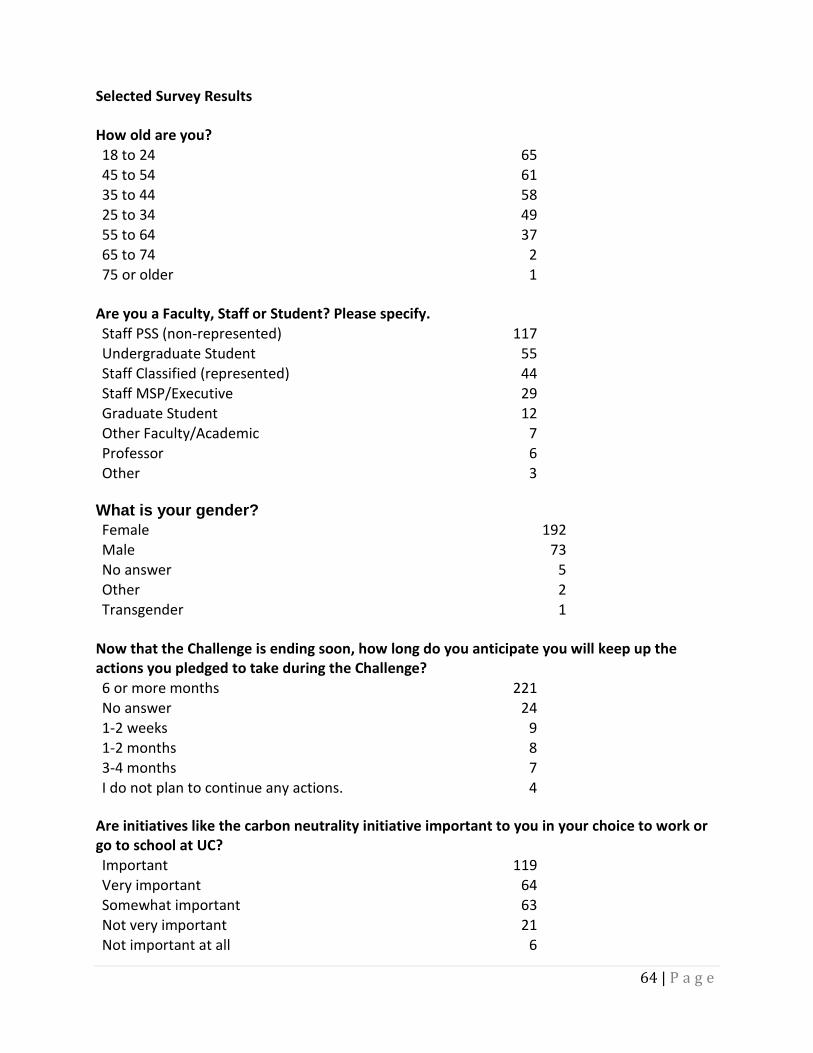
64 | P a g e
Selected Survey Results How old are you? 18 to 24 65 45 to 54 61 35 to 44 58 25 to 34 49 55 to 64 37 65 to 74 2 75 or older 1
Are you a Faculty, Staff or Student? Please specify. Staff PSS (non-represented) 117 Undergraduate Student 55 Staff Classified (represented) 44 Staff MSP/Executive 29 Graduate Student 12 Other Faculty/Academic 7 Professor 6 Other 3
What is your gender? Female 192 Male 73 No answer 5 Other 2 Transgender 1
Now that the Challenge is ending soon, how long do you anticipate you will keep up the actions you pledged to take during the Challenge? 6 or more months 221 No answer 24 1-2 weeks 9 1-2 months 8 3-4 months 7 I do not plan to continue any actions. 4
Are initiatives like the carbon neutrality initiative important to you in your choice to work or go to school at UC? Important 119 Very important 64 Somewhat important 63 Not very important 21 Not important at all 6
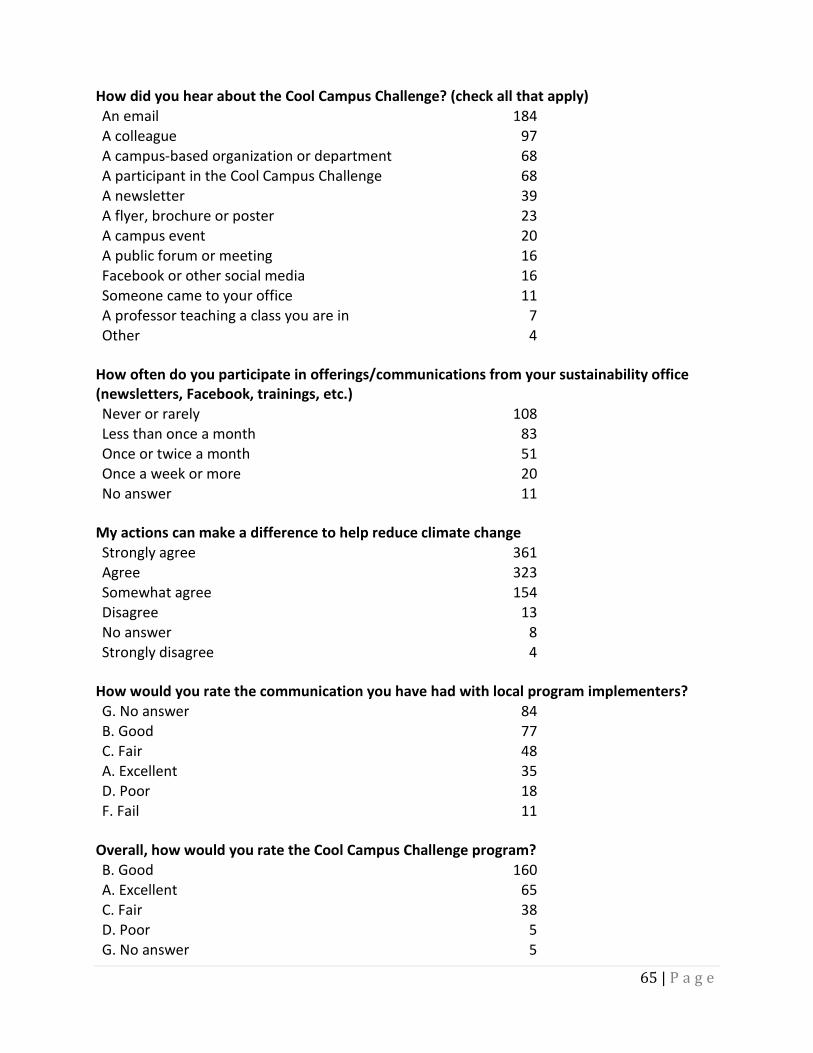
65 | P a g e
How did you hear about the Cool Campus Challenge? (check all that apply) An email 184 A colleague 97 A campus-based organization or department 68 A participant in the Cool Campus Challenge 68 A newsletter 39 A flyer, brochure or poster 23 A campus event 20 A public forum or meeting 16 Facebook or other social media 16 Someone came to your office 11 A professor teaching a class you are in 7 Other 4
How often do you participate in offerings/communications from your sustainability office (newsletters, Facebook, trainings, etc.) Never or rarely 108 Less than once a month 83 Once or twice a month 51 Once a week or more 20 No answer 11
My actions can make a difference to help reduce climate change Strongly agree 361 Agree 323 Somewhat agree 154 Disagree 13 No answer 8 Strongly disagree 4
How would you rate the communication you have had with local program implementers? G. No answer 84 B. Good 77 C. Fair 48 A. Excellent 35 D. Poor 18 F. Fail 11
Overall, how would you rate the Cool Campus Challenge program? B. Good 160 A. Excellent 65 C. Fair 38 D. Poor 5 G. No answer 5
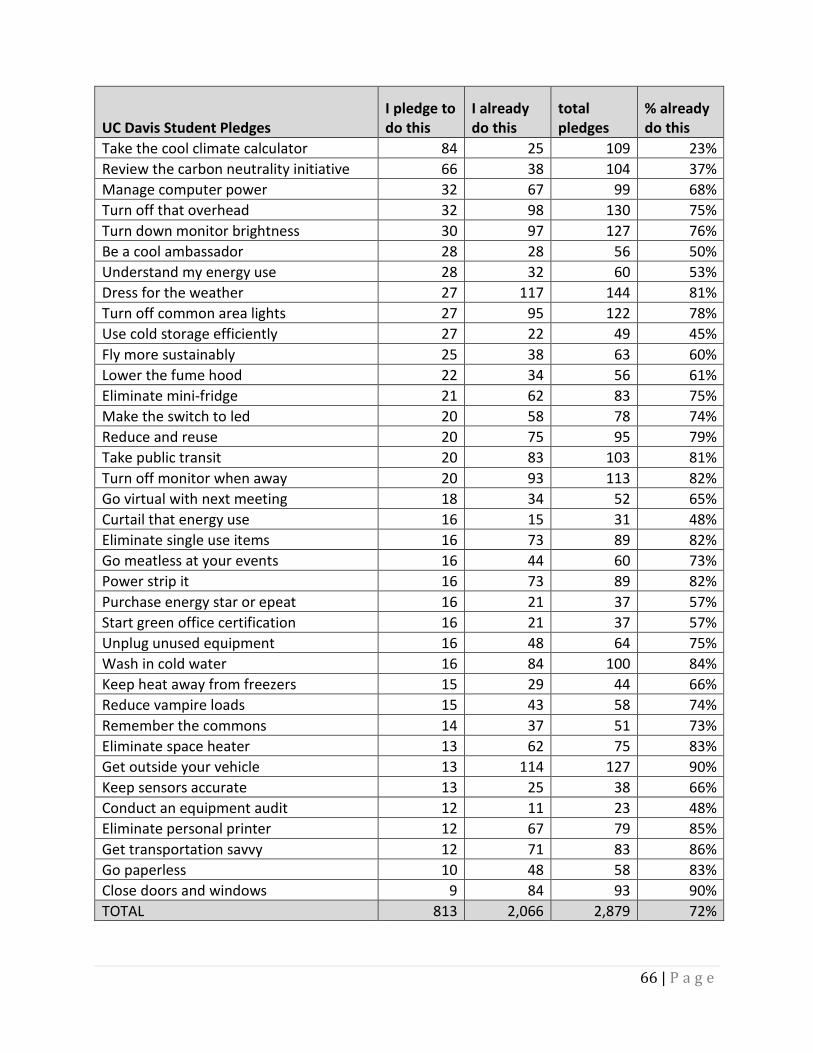
66 | P a g e
UC Davis Student Pledges I pledge to do this
I already do this
total pledges
% already do this
Take the cool climate calculator 84 25 109 23% Review the carbon neutrality initiative 66 38 104 37% Manage computer power 32 67 99 68% Turn off that overhead 32 98 130 75% Turn down monitor brightness 30 97 127 76% Be a cool ambassador 28 28 56 50% Understand my energy use 28 32 60 53% Dress for the weather 27 117 144 81% Turn off common area lights 27 95 122 78% Use cold storage efficiently 27 22 49 45% Fly more sustainably 25 38 63 60% Lower the fume hood 22 34 56 61% Eliminate mini-fridge 21 62 83 75% Make the switch to led 20 58 78 74% Reduce and reuse 20 75 95 79% Take public transit 20 83 103 81% Turn off monitor when away 20 93 113 82% Go virtual with next meeting 18 34 52 65% Curtail that energy use 16 15 31 48% Eliminate single use items 16 73 89 82% Go meatless at your events 16 44 60 73% Power strip it 16 73 89 82% Purchase energy star or epeat 16 21 37 57% Start green office certification 16 21 37 57% Unplug unused equipment 16 48 64 75% Wash in cold water 16 84 100 84% Keep heat away from freezers 15 29 44 66% Reduce vampire loads 15 43 58 74% Remember the commons 14 37 51 73% Eliminate space heater 13 62 75 83% Get outside your vehicle 13 114 127 90% Keep sensors accurate 13 25 38 66% Conduct an equipment audit 12 11 23 48% Eliminate personal printer 12 67 79 85% Get transportation savvy 12 71 83 86% Go paperless 10 48 58 83% Close doors and windows 9 84 93 90% TOTAL 813 2,066 2,879 72%
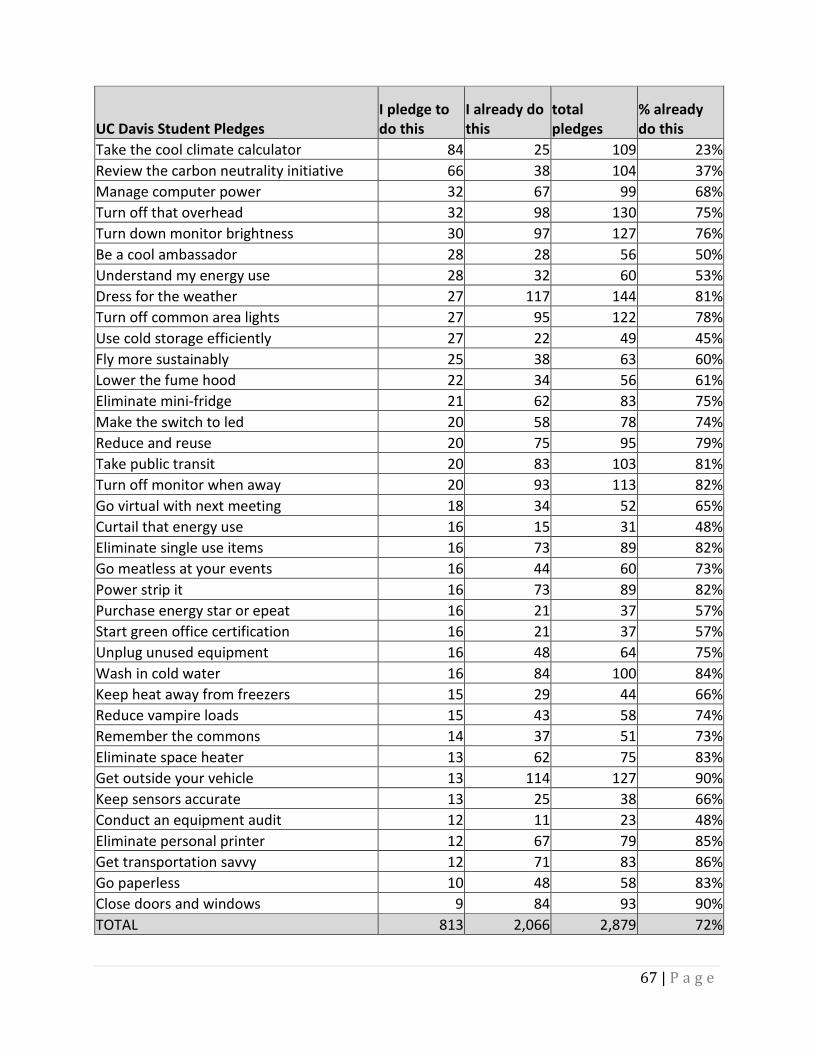
67 | P a g e
UC Davis Student Pledges I pledge to do this
I already do this
total pledges
% already do this
Take the cool climate calculator 84 25 109 23% Review the carbon neutrality initiative 66 38 104 37% Manage computer power 32 67 99 68% Turn off that overhead 32 98 130 75% Turn down monitor brightness 30 97 127 76% Be a cool ambassador 28 28 56 50% Understand my energy use 28 32 60 53% Dress for the weather 27 117 144 81% Turn off common area lights 27 95 122 78% Use cold storage efficiently 27 22 49 45% Fly more sustainably 25 38 63 60% Lower the fume hood 22 34 56 61% Eliminate mini-fridge 21 62 83 75% Make the switch to led 20 58 78 74% Reduce and reuse 20 75 95 79% Take public transit 20 83 103 81% Turn off monitor when away 20 93 113 82% Go virtual with next meeting 18 34 52 65% Curtail that energy use 16 15 31 48% Eliminate single use items 16 73 89 82% Go meatless at your events 16 44 60 73% Power strip it 16 73 89 82% Purchase energy star or epeat 16 21 37 57% Start green office certification 16 21 37 57% Unplug unused equipment 16 48 64 75% Wash in cold water 16 84 100 84% Keep heat away from freezers 15 29 44 66% Reduce vampire loads 15 43 58 74% Remember the commons 14 37 51 73% Eliminate space heater 13 62 75 83% Get outside your vehicle 13 114 127 90% Keep sensors accurate 13 25 38 66% Conduct an equipment audit 12 11 23 48% Eliminate personal printer 12 67 79 85% Get transportation savvy 12 71 83 86% Go paperless 10 48 58 83% Close doors and windows 9 84 93 90% TOTAL 813 2,066 2,879 72%
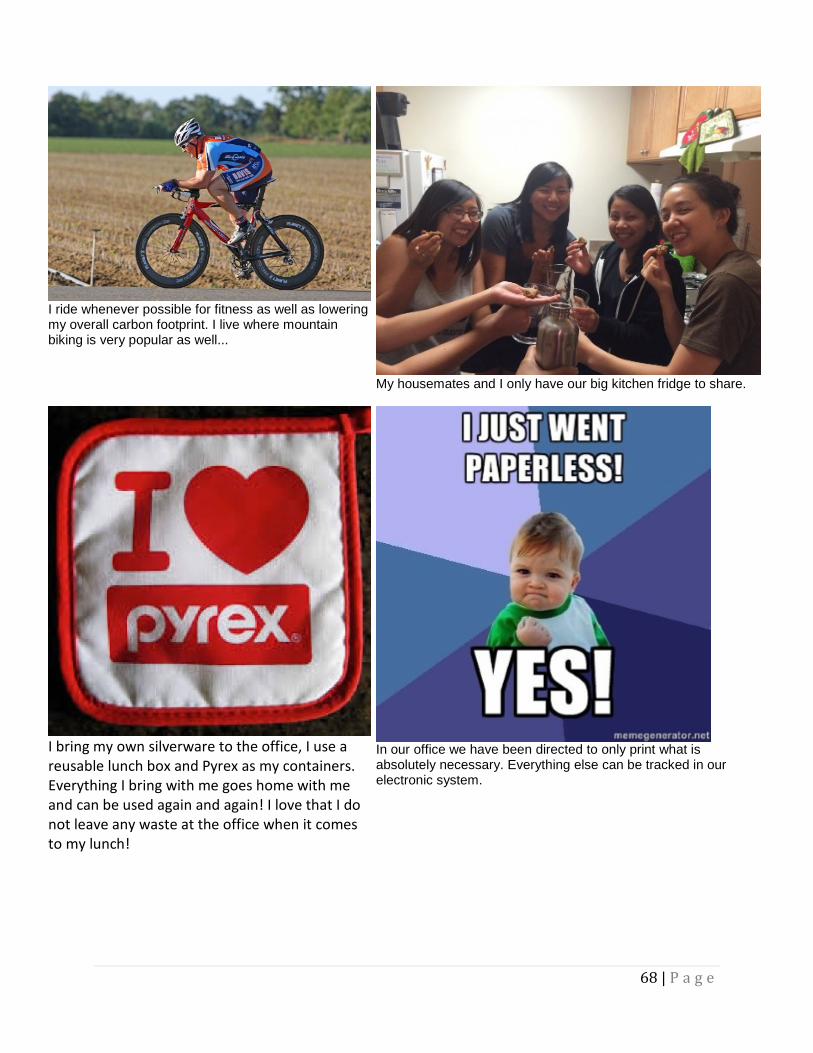
68 | P a g e
I ride whenever possible for fitness as well as lowering my overall carbon footprint. I live where mountain biking is very popular as well...
My housemates and I only have our big kitchen fridge to share.
I bring my own silverware to the office, I use a reusable lunch box and Pyrex as my containers. Everything I bring with me goes home with me and can be used again and again! I love that I do not leave any waste at the office when it comes to my lunch!
In our office we have been directed to only print what is absolutely necessary. Everything else can be tracked in our electronic system.
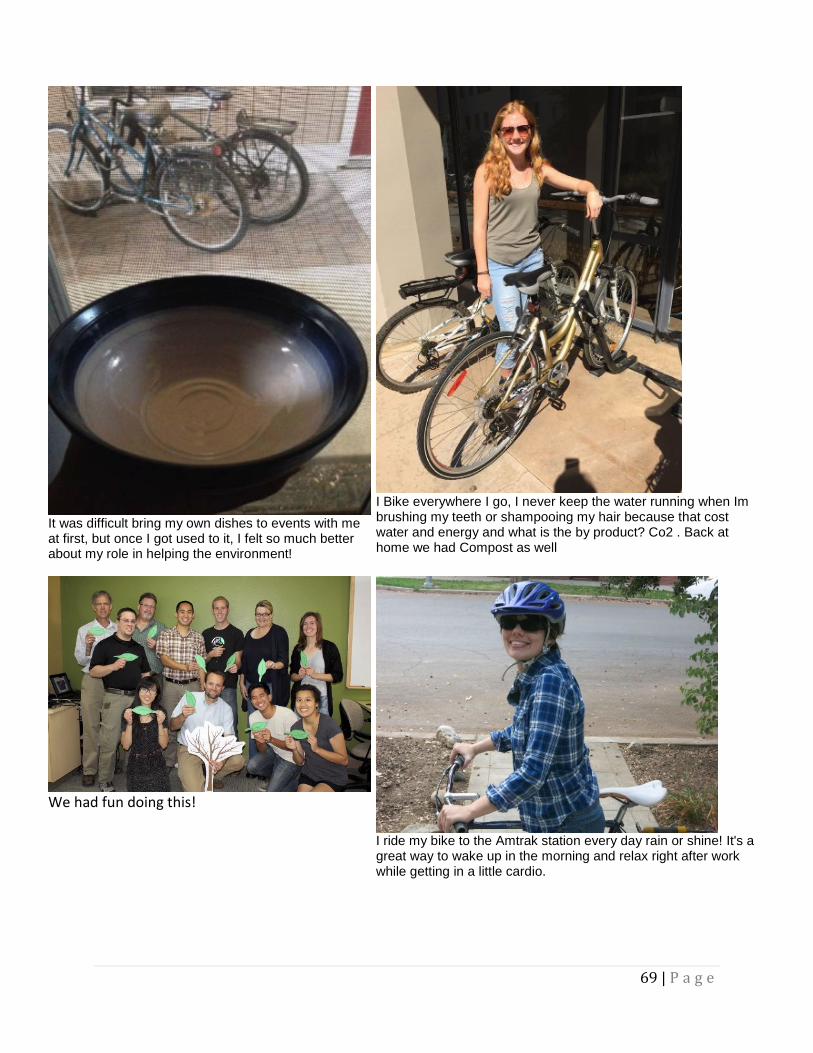
69 | P a g e
It was difficult bring my own dishes to events with me at first, but once I got used to it, I felt so much better about my role in helping the environment!
I Bike everywhere I go, I never keep the water running when Im brushing my teeth or shampooing my hair because that cost water and energy and what is the by product? Co2 . Back at home we had Compost as well
We had fun doing this!
I ride my bike to the Amtrak station every day rain or shine! It's a great way to wake up in the morning and relax right after work while getting in a little cardio.
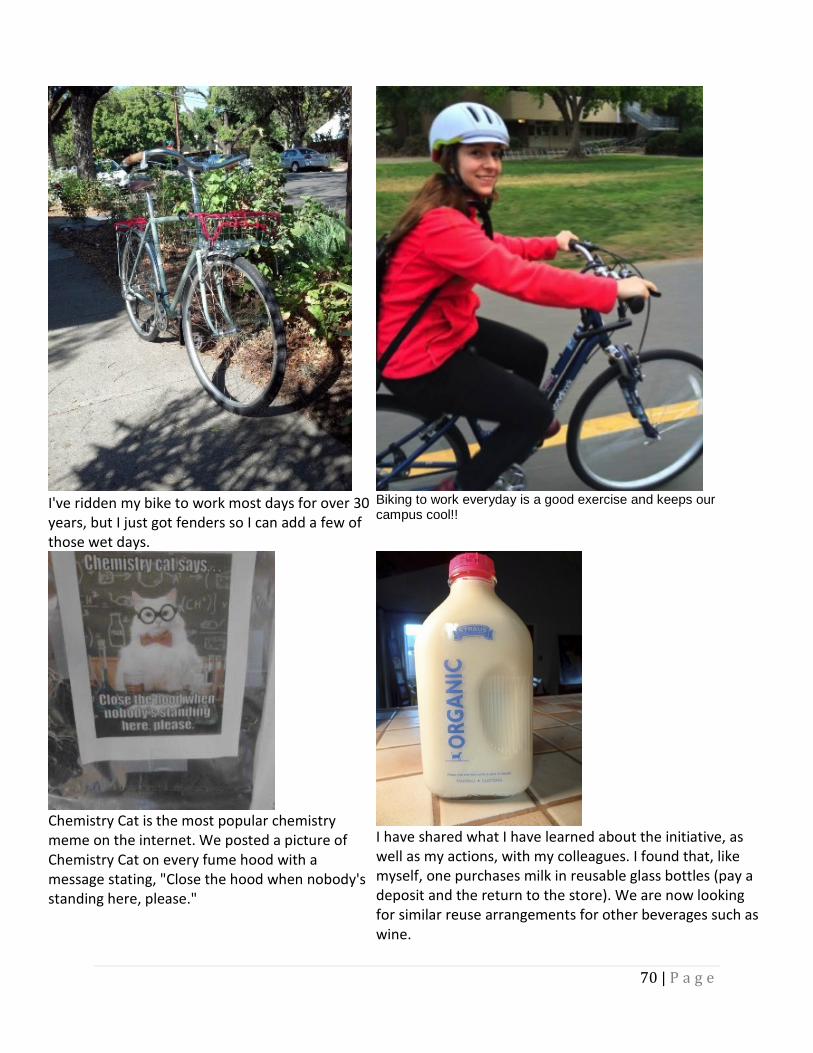
70 | P a g e
I've ridden my bike to work most days for over 30 years, but I just got fenders so I can add a few of those wet days.
Biking to work everyday is a good exercise and keeps our campus cool!!
Chemistry Cat is the most popular chemistry meme on the internet. We posted a picture of Chemistry Cat on every fume hood with a message stating, "Close the hood when nobody's standing here, please."
I have shared what I have learned about the initiative, as well as my actions, with my colleagues. I found that, like myself, one purchases milk in reusable glass bottles (pay a deposit and the return to the store). We are now looking for similar reuse arrangements for other beverages such as wine.
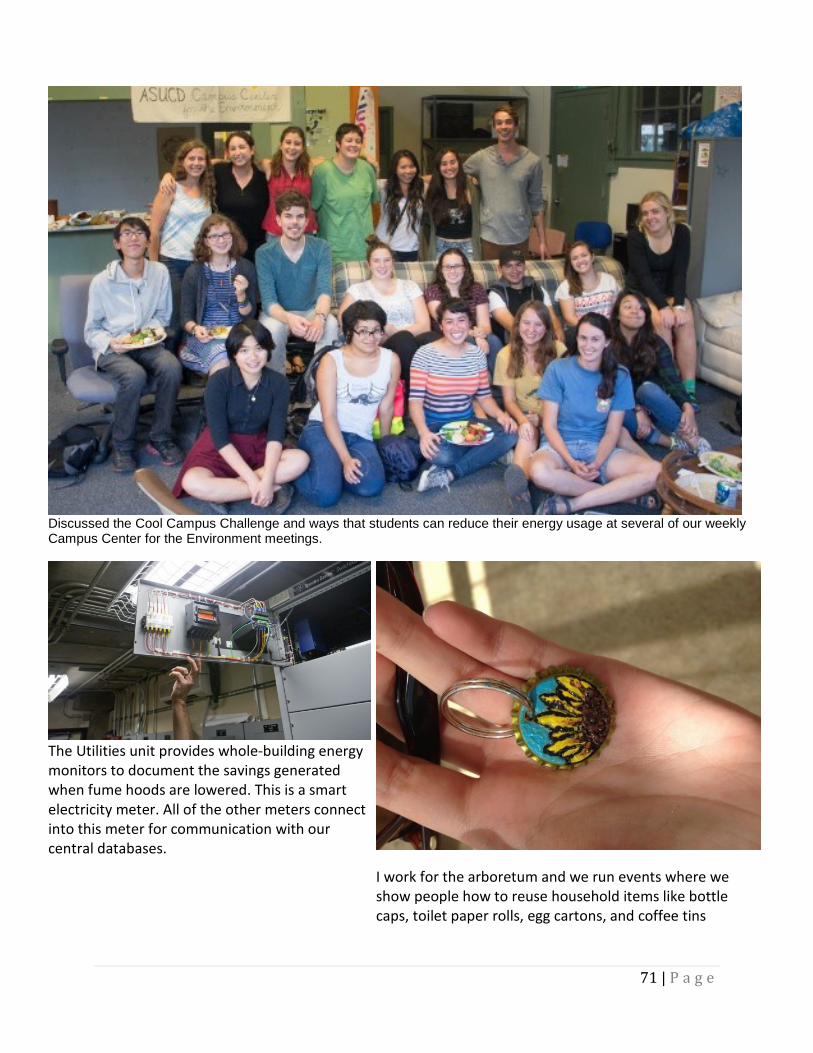
71 | P a g e
Discussed the Cool Campus Challenge and ways that students can reduce their energy usage at several of our weekly Campus Center for the Environment meetings.
The Utilities unit provides whole-building energy monitors to document the savings generated when fume hoods are lowered. This is a smart electricity meter. All of the other meters connect into this meter for communication with our central databases.
I work for the arboretum and we run events where we show people how to reuse household items like bottle caps, toilet paper rolls, egg cartons, and coffee tins
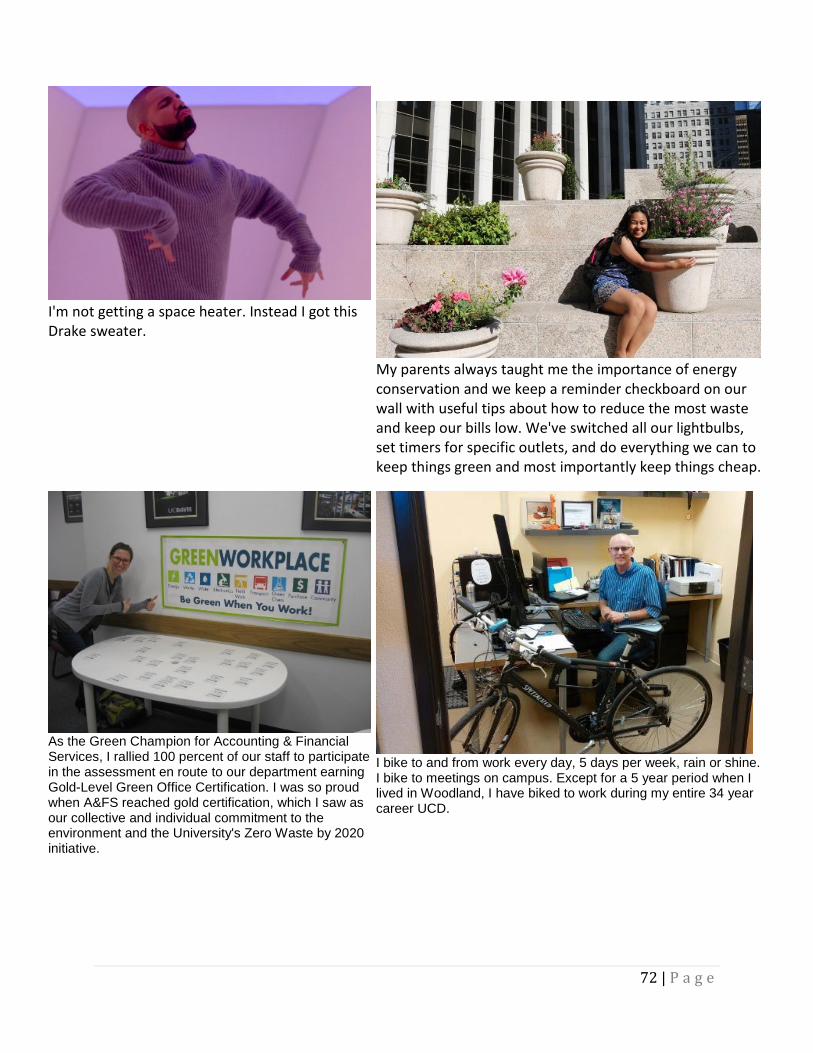
72 | P a g e
I'm not getting a space heater. Instead I got this Drake sweater.
My parents always taught me the importance of energy conservation and we keep a reminder checkboard on our wall with useful tips about how to reduce the most waste and keep our bills low. We've switched all our lightbulbs, set timers for specific outlets, and do everything we can to keep things green and most importantly keep things cheap.
As the Green Champion for Accounting & Financial Services, I rallied 100 percent of our staff to participate in the assessment en route to our department earning Gold-Level Green Office Certification. I was so proud when A&FS reached gold certification, which I saw as our collective and individual commitment to the environment and the University's Zero Waste by 2020 initiative.
I bike to and from work every day, 5 days per week, rain or shine. I bike to meetings on campus. Except for a 5 year period when I lived in Woodland, I have biked to work during my entire 34 year career UCD.
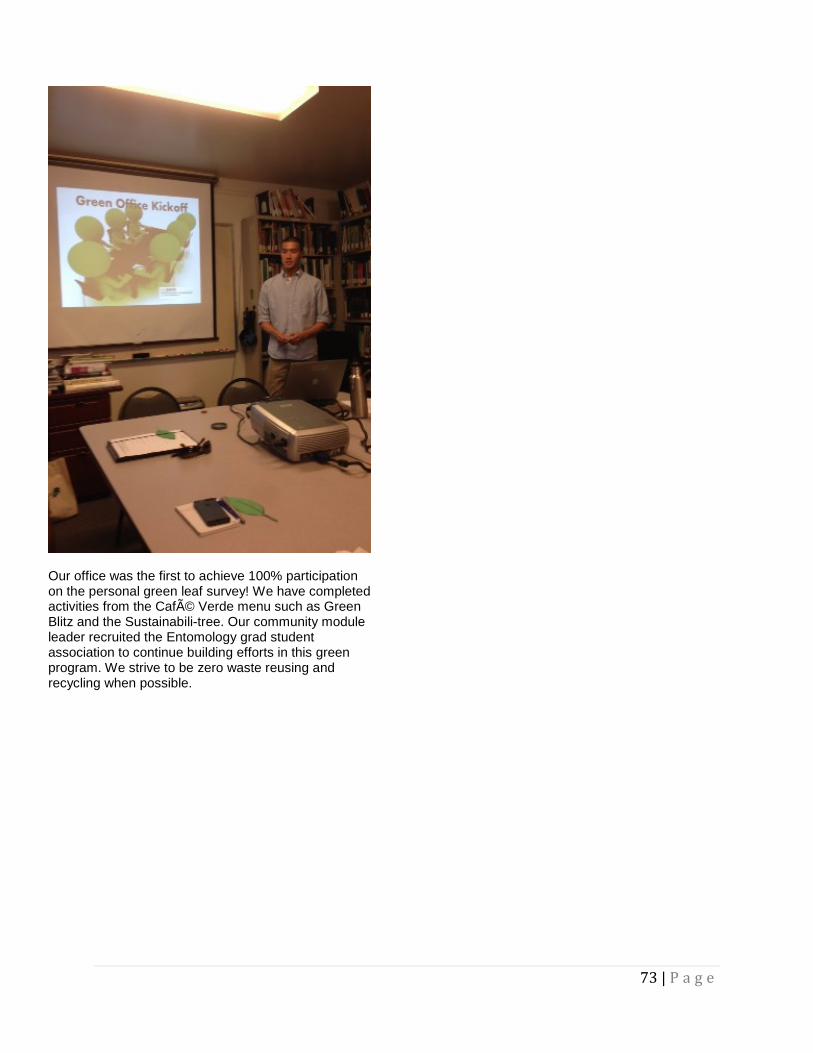
73 | P a g e
Our office was the first to achieve 100% participation on the personal green leaf survey! We have completed activities from the Café Verde menu such as Green Blitz and the Sustainabili-tree. Our community module leader recruited the Entomology grad student association to continue building efforts in this green program. We strive to be zero waste reusing and recycling when possible.
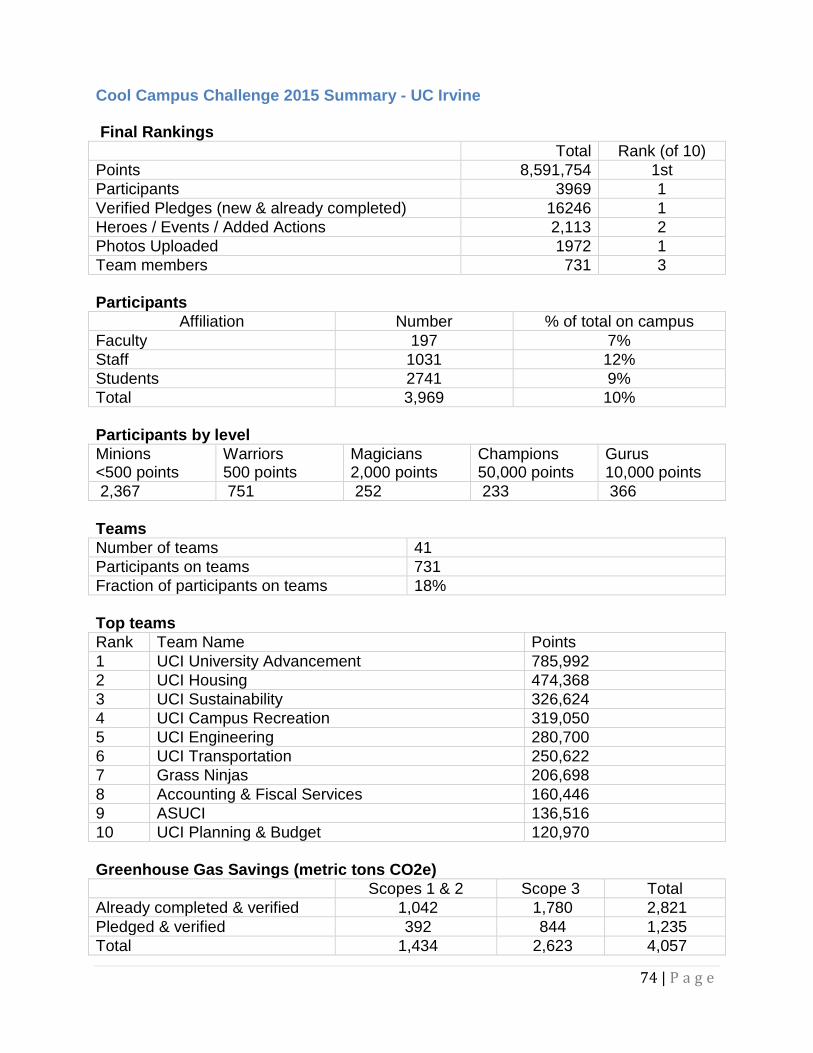
74 | P a g e
Cool Campus Challenge 2015 Summary - UC Irvine Final Rankings Total Rank (of 10) Points 8,591,754 1st Participants 3969 1 Verified Pledges (new & already completed) 16246 1 Heroes / Events / Added Actions 2,113 2 Photos Uploaded 1972 1 Team members 731 3 Participants
Affiliation Number % of total on campus Faculty 197 7% Staff 1031 12% Students 2741 9% Total 3,969 10% Participants by level Minions <500 points
Warriors 500 points
Magicians 2,000 points
Champions 50,000 points
Gurus 10,000 points
2,367 751 252 233 366 Teams Number of teams 41 Participants on teams 731 Fraction of participants on teams 18% Top teams Rank Team Name Points 1 UCI University Advancement 785,992 2 UCI Housing 474,368 3 UCI Sustainability 326,624 4 UCI Campus Recreation 319,050 5 UCI Engineering 280,700 6 UCI Transportation 250,622 7 Grass Ninjas 206,698 8 Accounting & Fiscal Services 160,446 9 ASUCI 136,516 10 UCI Planning & Budget 120,970 Greenhouse Gas Savings (metric tons CO2e)
Scopes 1 & 2 Scope 3 Total Already completed & verified 1,042 1,780 2,821 Pledged & verified 392 844 1,235 Total 1,434 2,623 4,057
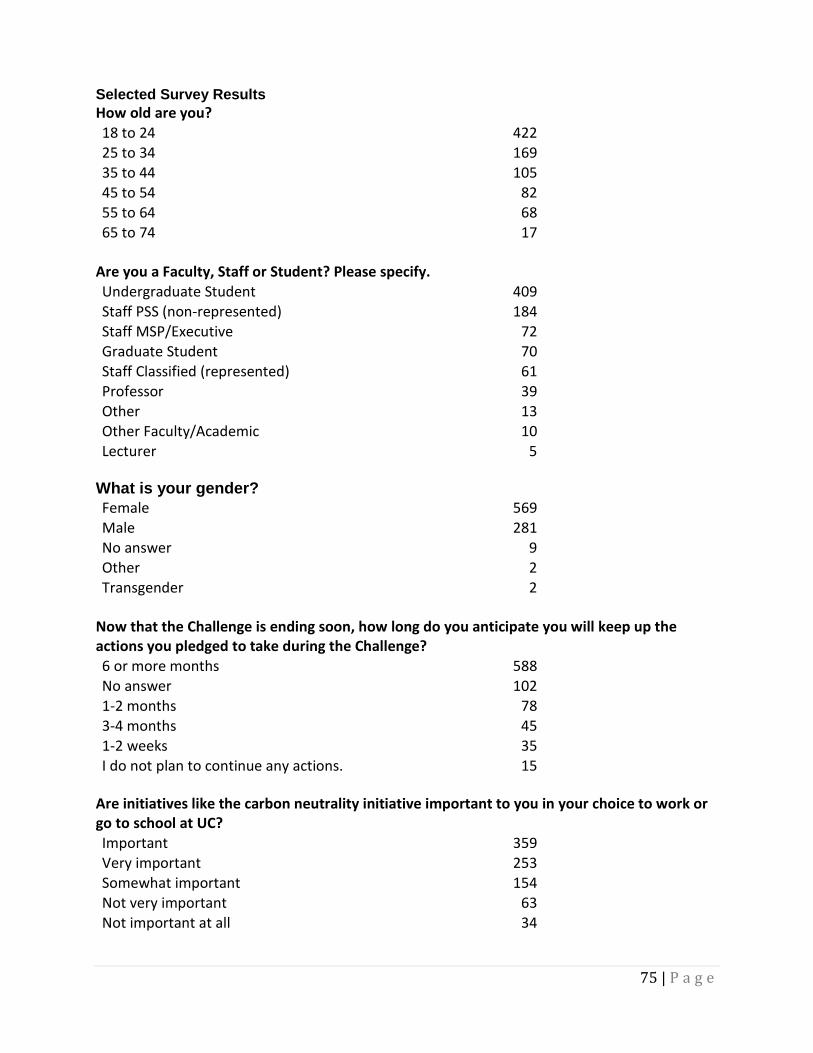
75 | P a g e
Selected Survey Results How old are you? 18 to 24 422 25 to 34 169 35 to 44 105 45 to 54 82 55 to 64 68 65 to 74 17
Are you a Faculty, Staff or Student? Please specify. Undergraduate Student 409 Staff PSS (non-represented) 184 Staff MSP/Executive 72 Graduate Student 70 Staff Classified (represented) 61 Professor 39 Other 13 Other Faculty/Academic 10 Lecturer 5
What is your gender? Female 569 Male 281 No answer 9 Other 2 Transgender 2
Now that the Challenge is ending soon, how long do you anticipate you will keep up the actions you pledged to take during the Challenge? 6 or more months 588 No answer 102 1-2 months 78 3-4 months 45 1-2 weeks 35 I do not plan to continue any actions. 15
Are initiatives like the carbon neutrality initiative important to you in your choice to work or go to school at UC? Important 359 Very important 253 Somewhat important 154 Not very important 63 Not important at all 34
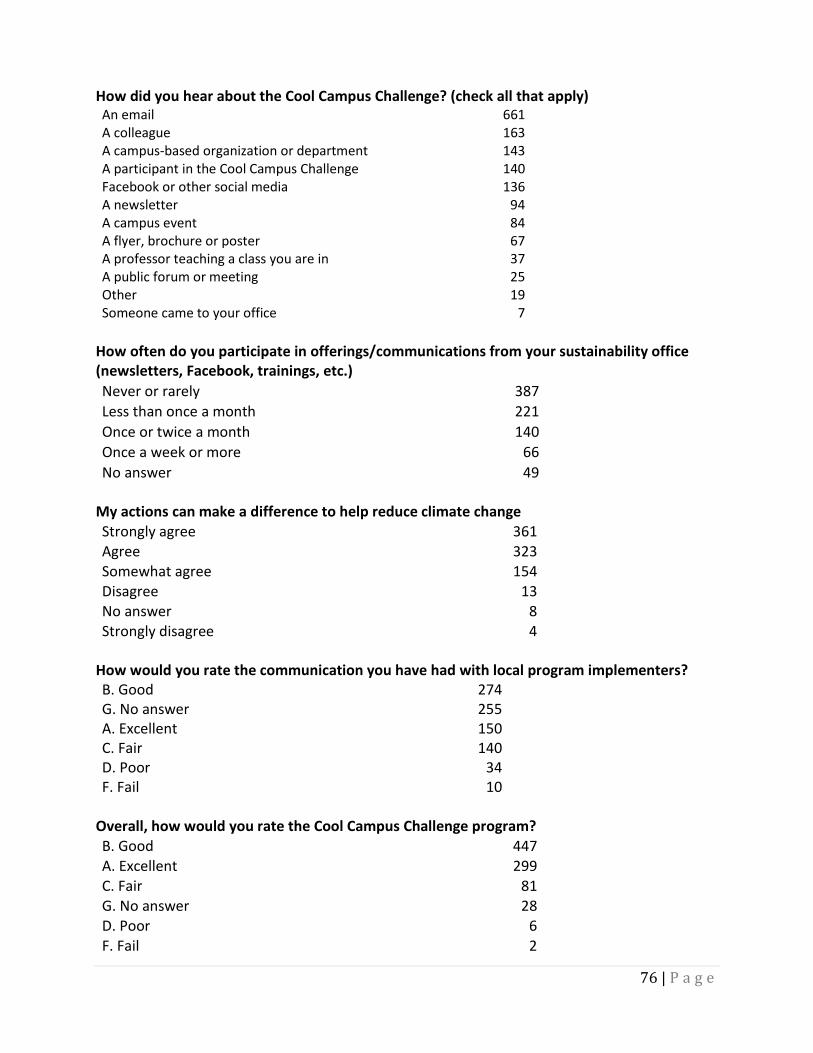
76 | P a g e
How did you hear about the Cool Campus Challenge? (check all that apply) An email 661 A colleague 163 A campus-based organization or department 143 A participant in the Cool Campus Challenge 140 Facebook or other social media 136 A newsletter 94 A campus event 84 A flyer, brochure or poster 67 A professor teaching a class you are in 37 A public forum or meeting 25 Other 19 Someone came to your office 7
How often do you participate in offerings/communications from your sustainability office (newsletters, Facebook, trainings, etc.) Never or rarely 387 Less than once a month 221 Once or twice a month 140 Once a week or more 66 No answer 49
My actions can make a difference to help reduce climate change Strongly agree 361 Agree 323 Somewhat agree 154 Disagree 13 No answer 8 Strongly disagree 4
How would you rate the communication you have had with local program implementers? B. Good 274 G. No answer 255 A. Excellent 150 C. Fair 140 D. Poor 34 F. Fail 10
Overall, how would you rate the Cool Campus Challenge program? B. Good 447 A. Excellent 299 C. Fair 81 G. No answer 28 D. Poor 6 F. Fail 2
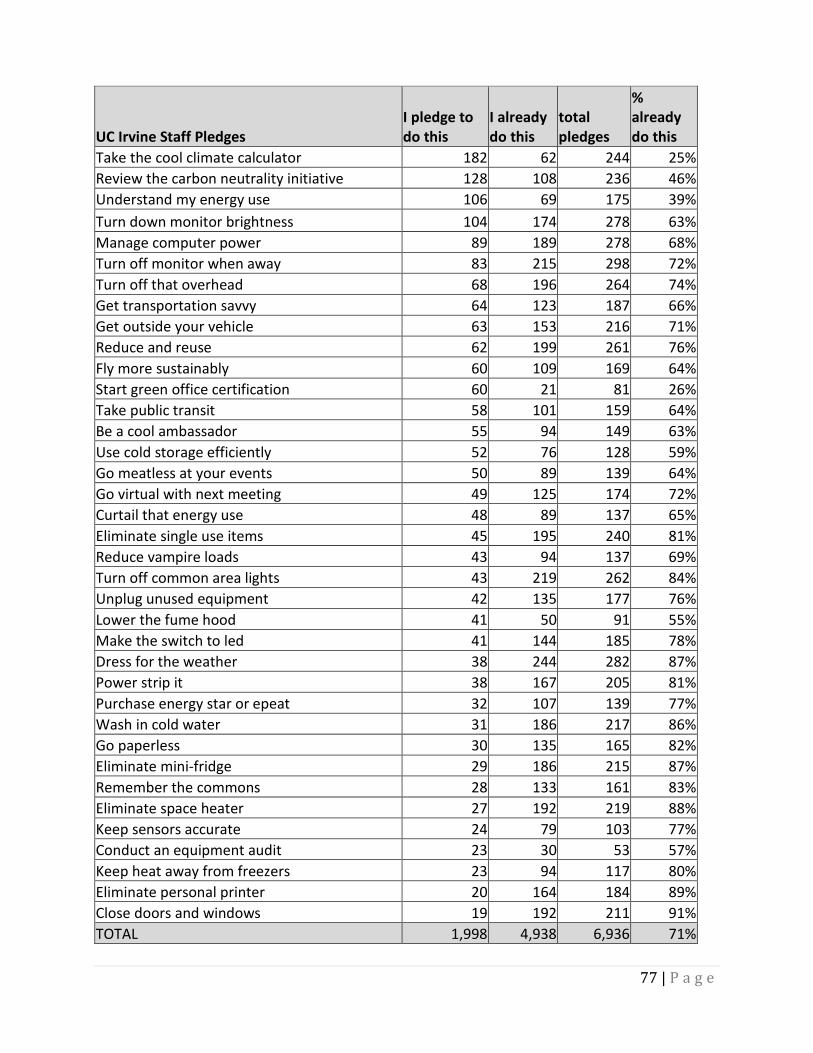
77 | P a g e
UC Irvine Staff Pledges I pledge to do this
I already do this
total pledges
% already do this
Take the cool climate calculator 182 62 244 25% Review the carbon neutrality initiative 128 108 236 46% Understand my energy use 106 69 175 39% Turn down monitor brightness 104 174 278 63% Manage computer power 89 189 278 68% Turn off monitor when away 83 215 298 72% Turn off that overhead 68 196 264 74% Get transportation savvy 64 123 187 66% Get outside your vehicle 63 153 216 71% Reduce and reuse 62 199 261 76% Fly more sustainably 60 109 169 64% Start green office certification 60 21 81 26% Take public transit 58 101 159 64% Be a cool ambassador 55 94 149 63% Use cold storage efficiently 52 76 128 59% Go meatless at your events 50 89 139 64% Go virtual with next meeting 49 125 174 72% Curtail that energy use 48 89 137 65% Eliminate single use items 45 195 240 81% Reduce vampire loads 43 94 137 69% Turn off common area lights 43 219 262 84% Unplug unused equipment 42 135 177 76% Lower the fume hood 41 50 91 55% Make the switch to led 41 144 185 78% Dress for the weather 38 244 282 87% Power strip it 38 167 205 81% Purchase energy star or epeat 32 107 139 77% Wash in cold water 31 186 217 86% Go paperless 30 135 165 82% Eliminate mini-fridge 29 186 215 87% Remember the commons 28 133 161 83% Eliminate space heater 27 192 219 88% Keep sensors accurate 24 79 103 77% Conduct an equipment audit 23 30 53 57% Keep heat away from freezers 23 94 117 80% Eliminate personal printer 20 164 184 89% Close doors and windows 19 192 211 91% TOTAL 1,998 4,938 6,936 71%
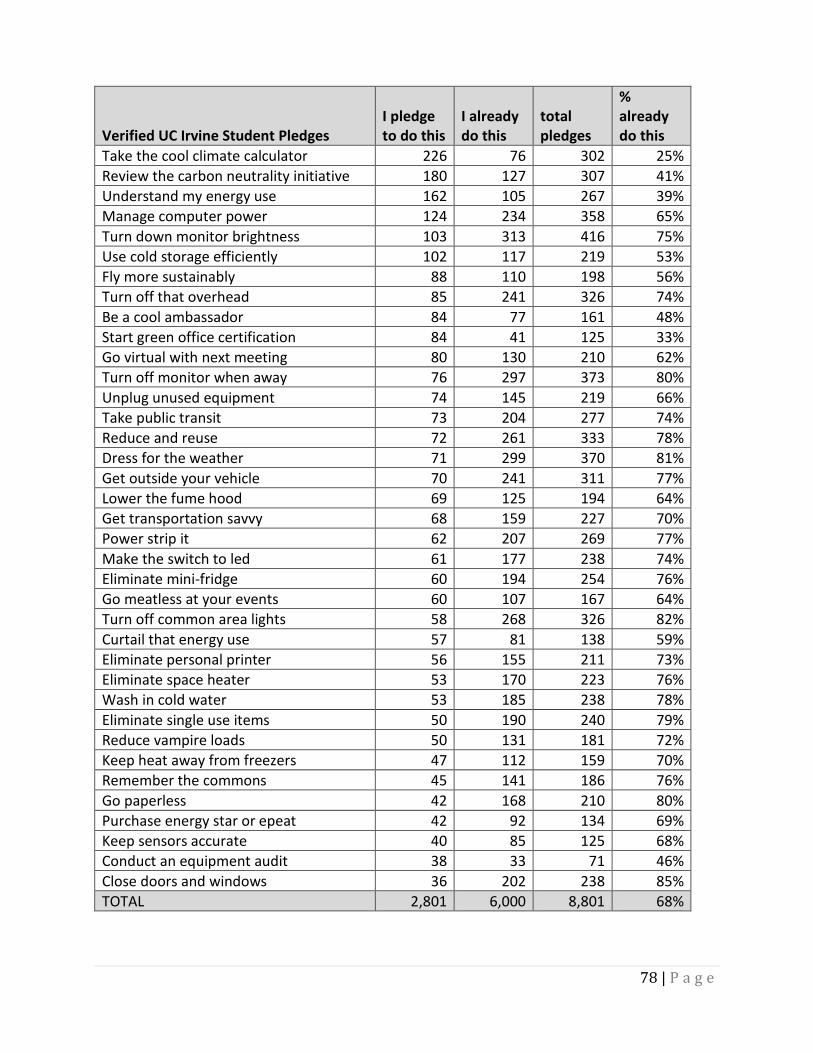
78 | P a g e
Verified UC Irvine Student Pledges I pledge to do this
I already do this
total pledges
% already do this
Take the cool climate calculator 226 76 302 25% Review the carbon neutrality initiative 180 127 307 41% Understand my energy use 162 105 267 39% Manage computer power 124 234 358 65% Turn down monitor brightness 103 313 416 75% Use cold storage efficiently 102 117 219 53% Fly more sustainably 88 110 198 56% Turn off that overhead 85 241 326 74% Be a cool ambassador 84 77 161 48% Start green office certification 84 41 125 33% Go virtual with next meeting 80 130 210 62% Turn off monitor when away 76 297 373 80% Unplug unused equipment 74 145 219 66% Take public transit 73 204 277 74% Reduce and reuse 72 261 333 78% Dress for the weather 71 299 370 81% Get outside your vehicle 70 241 311 77% Lower the fume hood 69 125 194 64% Get transportation savvy 68 159 227 70% Power strip it 62 207 269 77% Make the switch to led 61 177 238 74% Eliminate mini-fridge 60 194 254 76% Go meatless at your events 60 107 167 64% Turn off common area lights 58 268 326 82% Curtail that energy use 57 81 138 59% Eliminate personal printer 56 155 211 73% Eliminate space heater 53 170 223 76% Wash in cold water 53 185 238 78% Eliminate single use items 50 190 240 79% Reduce vampire loads 50 131 181 72% Keep heat away from freezers 47 112 159 70% Remember the commons 45 141 186 76% Go paperless 42 168 210 80% Purchase energy star or epeat 42 92 134 69% Keep sensors accurate 40 85 125 68% Conduct an equipment audit 38 33 71 46% Close doors and windows 36 202 238 85% TOTAL 2,801 6,000 8,801 68%
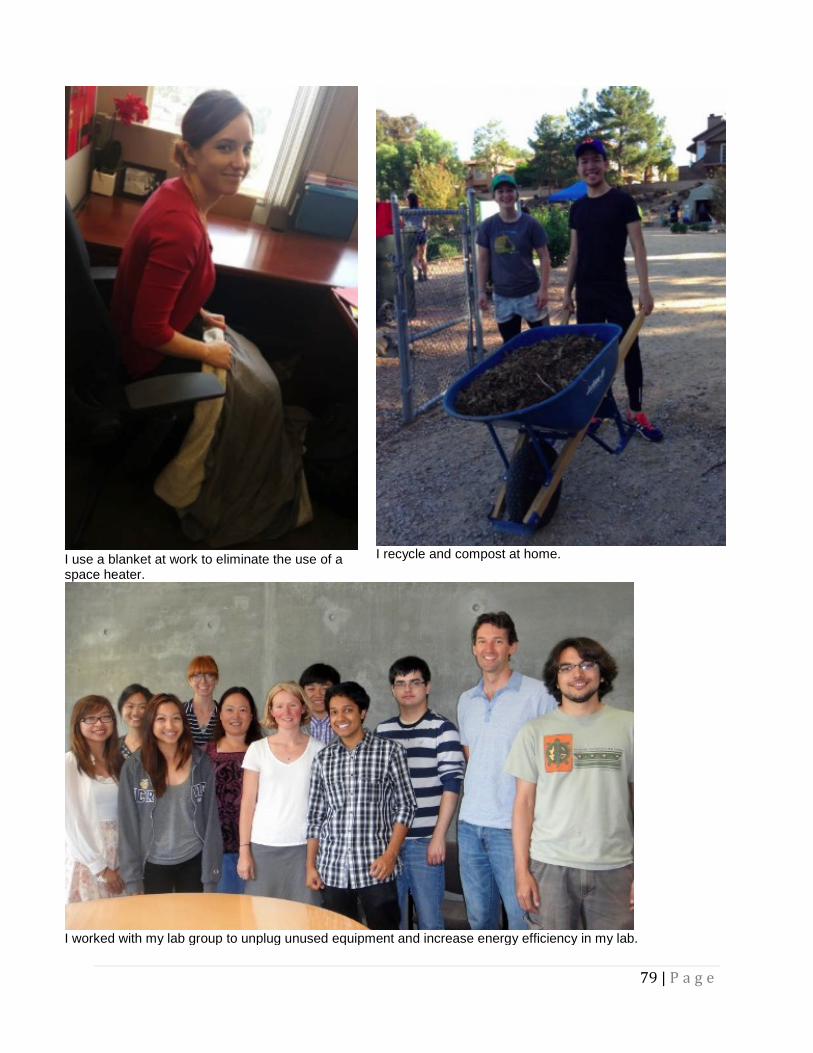
79 | P a g e
I use a blanket at work to eliminate the use of a space heater.
I recycle and compost at home.
I worked with my lab group to unplug unused equipment and increase energy efficiency in my lab.
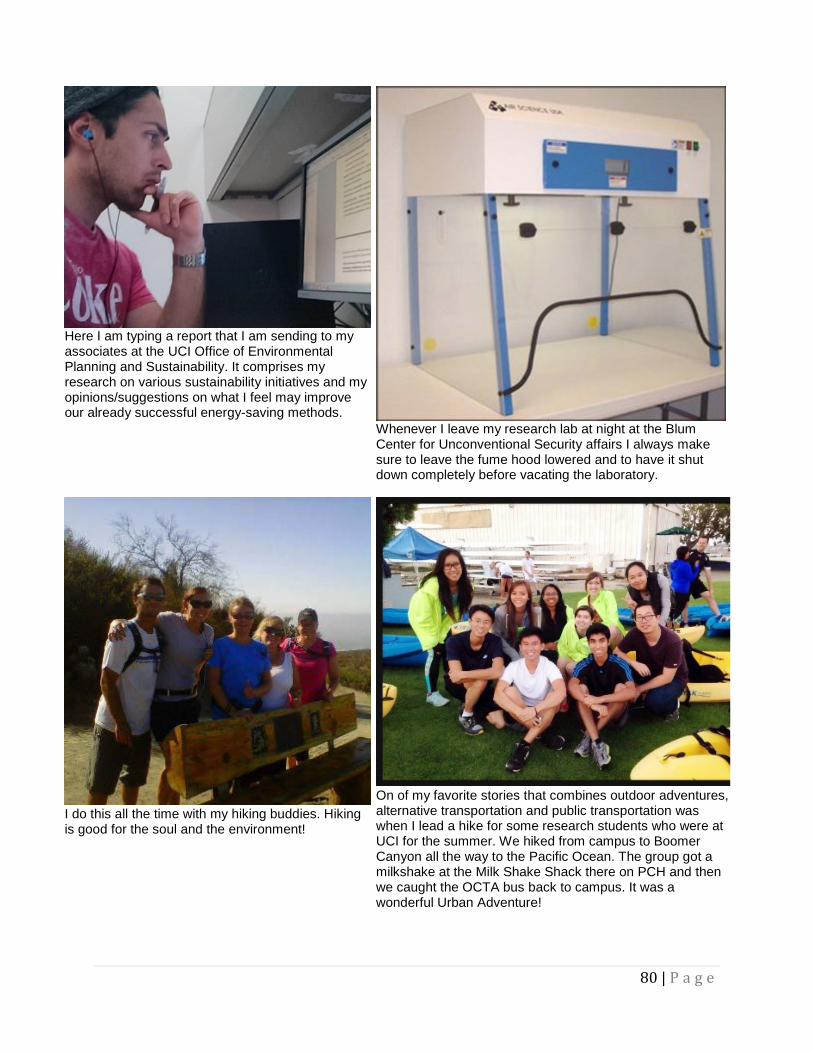
80 | P a g e
Here I am typing a report that I am sending to my associates at the UCI Office of Environmental Planning and Sustainability. It comprises my research on various sustainability initiatives and my opinions/suggestions on what I feel may improve our already successful energy-saving methods. Whenever I leave my research lab at night at the Blum
Center for Unconventional Security affairs I always make sure to leave the fume hood lowered and to have it shut down completely before vacating the laboratory.
I do this all the time with my hiking buddies. Hiking is good for the soul and the environment!
On of my favorite stories that combines outdoor adventures, alternative transportation and public transportation was when I lead a hike for some research students who were at UCI for the summer. We hiked from campus to Boomer Canyon all the way to the Pacific Ocean. The group got a milkshake at the Milk Shake Shack there on PCH and then we caught the OCTA bus back to campus. It was a wonderful Urban Adventure!
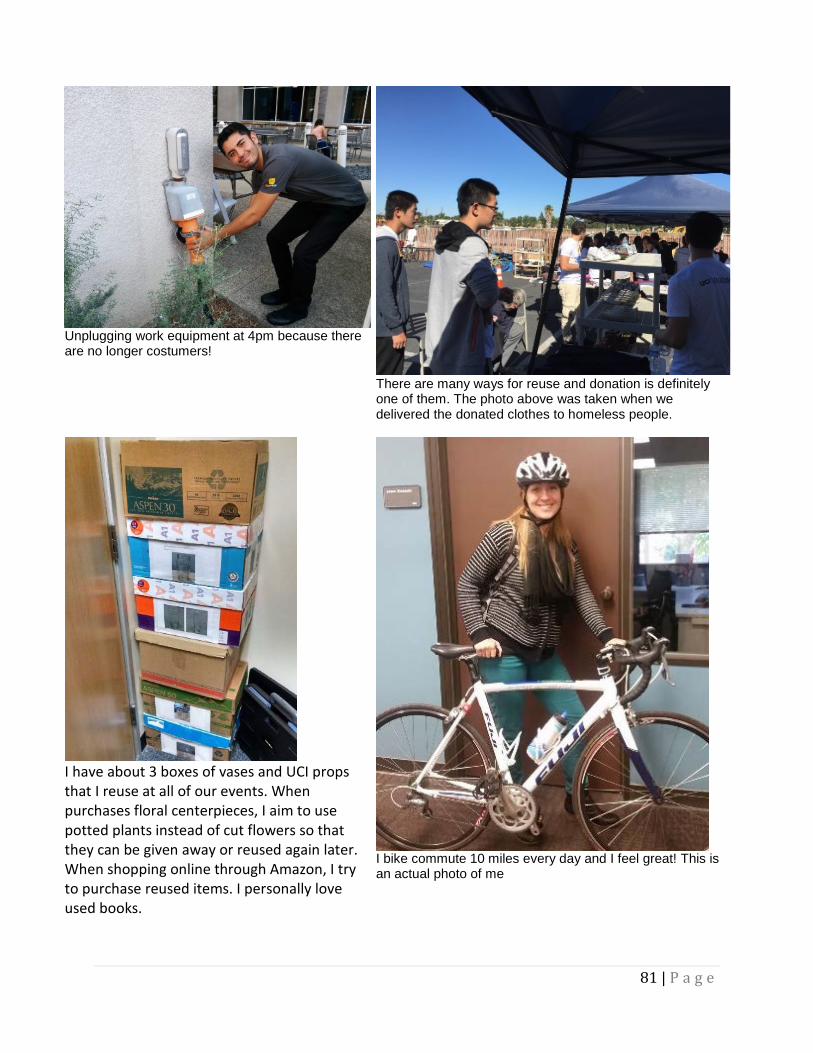
81 | P a g e
Unplugging work equipment at 4pm because there are no longer costumers!
There are many ways for reuse and donation is definitely one of them. The photo above was taken when we delivered the donated clothes to homeless people.
I have about 3 boxes of vases and UCI props that I reuse at all of our events. When purchases floral centerpieces, I aim to use potted plants instead of cut flowers so that they can be given away or reused again later. When shopping online through Amazon, I try to purchase reused items. I personally love used books.
I bike commute 10 miles every day and I feel great! This is an actual photo of me
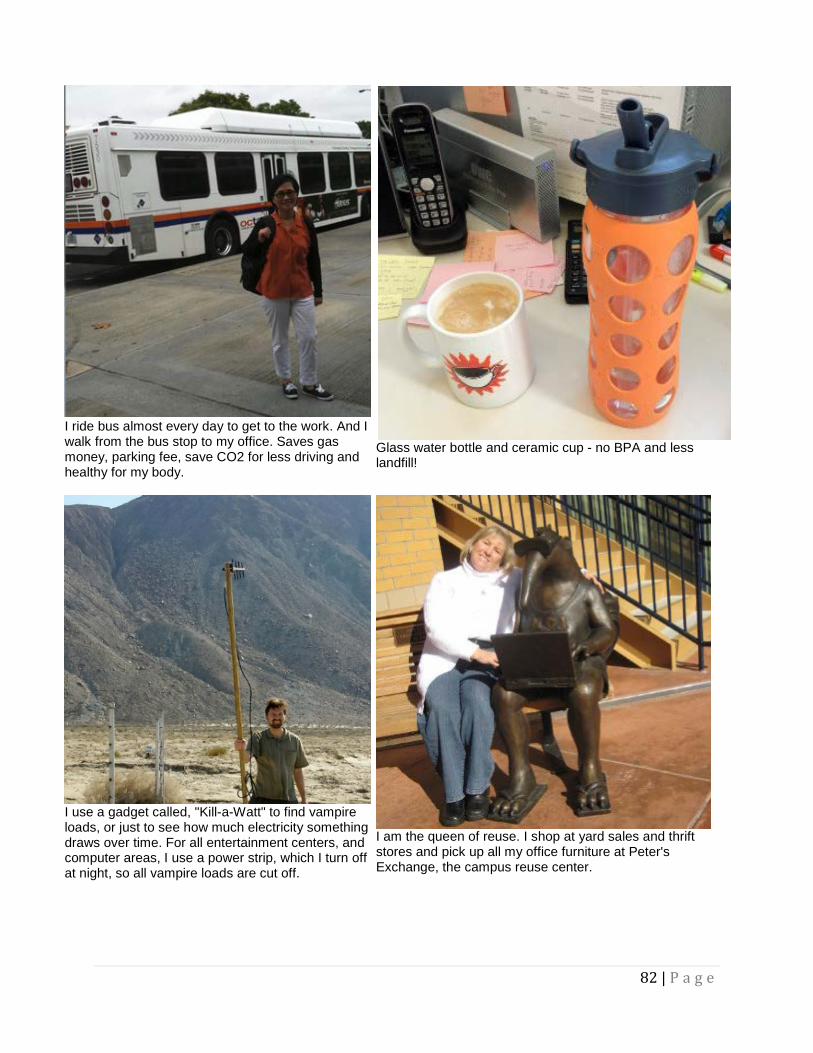
82 | P a g e
I ride bus almost every day to get to the work. And I walk from the bus stop to my office. Saves gas money, parking fee, save CO2 for less driving and healthy for my body.
Glass water bottle and ceramic cup - no BPA and less landfill!
I use a gadget called, "Kill-a-Watt" to find vampire loads, or just to see how much electricity something draws over time. For all entertainment centers, and computer areas, I use a power strip, which I turn off at night, so all vampire loads are cut off.
I am the queen of reuse. I shop at yard sales and thrift stores and pick up all my office furniture at Peter's Exchange, the campus reuse center.
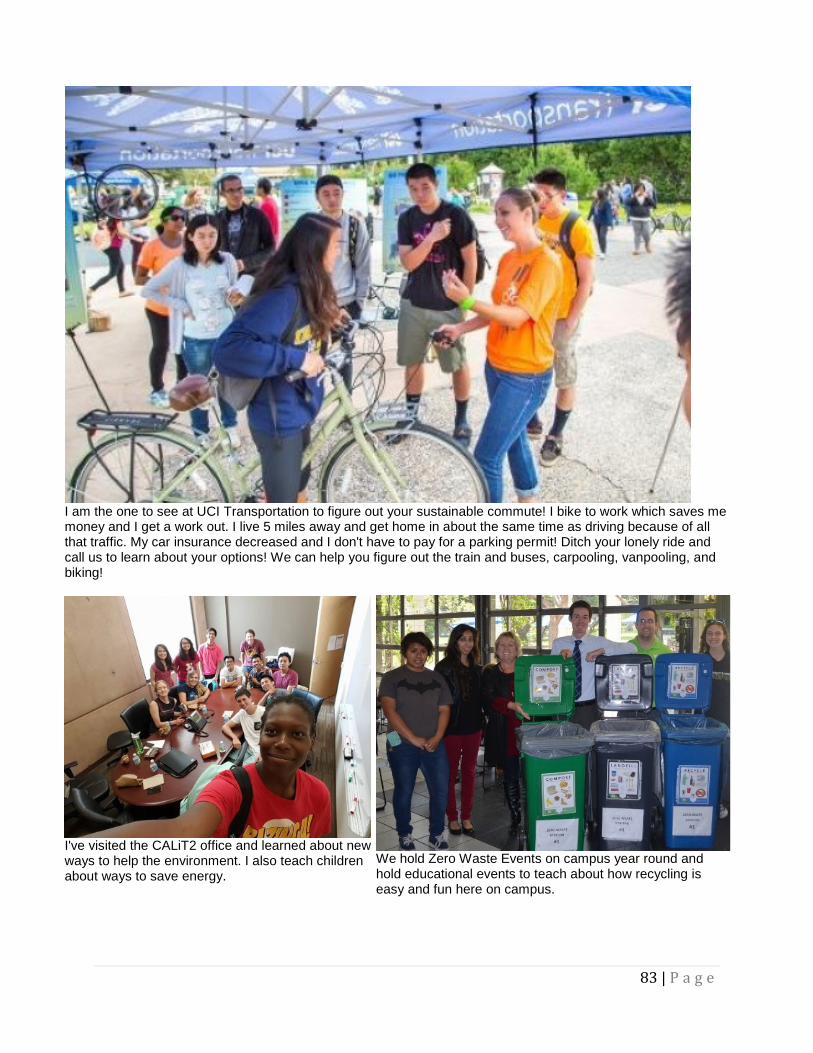
83 | P a g e
I am the one to see at UCI Transportation to figure out your sustainable commute! I bike to work which saves me money and I get a work out. I live 5 miles away and get home in about the same time as driving because of all that traffic. My car insurance decreased and I don't have to pay for a parking permit! Ditch your lonely ride and call us to learn about your options! We can help you figure out the train and buses, carpooling, vanpooling, and biking!
I've visited the CALiT2 office and learned about new ways to help the environment. I also teach children about ways to save energy.
We hold Zero Waste Events on campus year round and hold educational events to teach about how recycling is easy and fun here on campus.
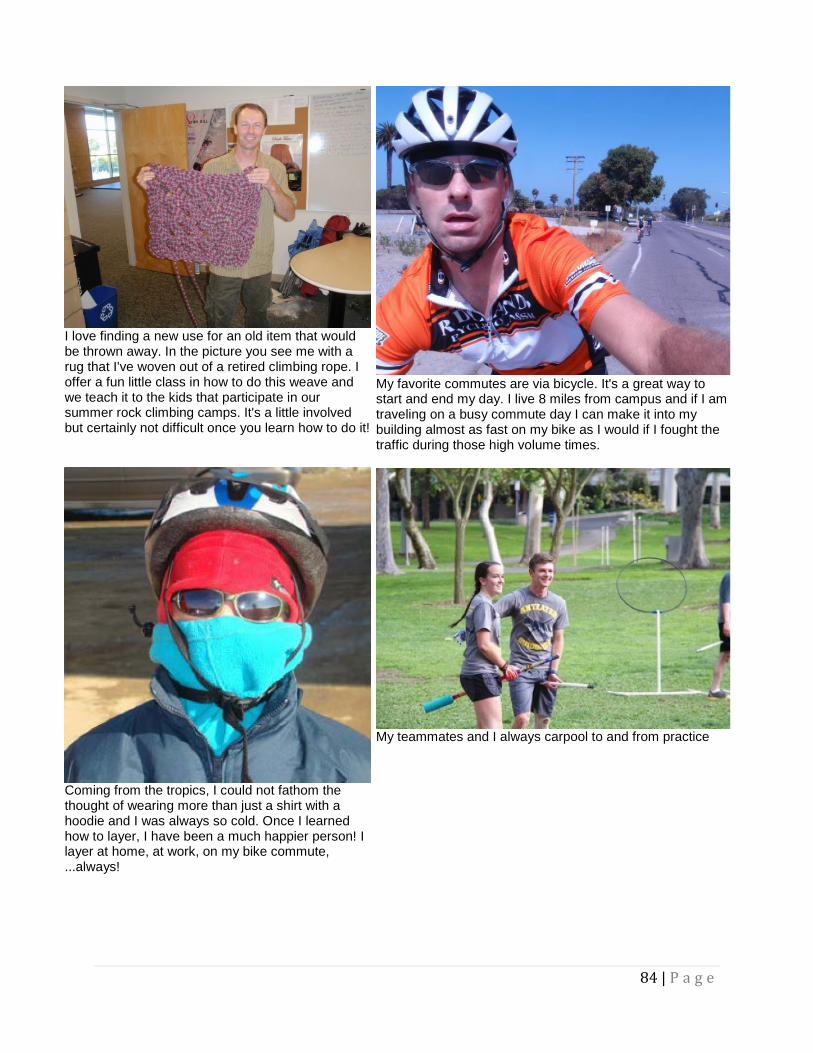
84 | P a g e
I love finding a new use for an old item that would be thrown away. In the picture you see me with a rug that I've woven out of a retired climbing rope. I offer a fun little class in how to do this weave and we teach it to the kids that participate in our summer rock climbing camps. It's a little involved but certainly not difficult once you learn how to do it!
My favorite commutes are via bicycle. It's a great way to start and end my day. I live 8 miles from campus and if I am traveling on a busy commute day I can make it into my building almost as fast on my bike as I would if I fought the traffic during those high volume times.
Coming from the tropics, I could not fathom the thought of wearing more than just a shirt with a hoodie and I was always so cold. Once I learned how to layer, I have been a much happier person! I layer at home, at work, on my bike commute, ...always!
My teammates and I always carpool to and from practice

85 | P a g e
Cool Campus Challenge 2015 Summary - UC Los Angeles Final Rankings Total Rank (of 10) Points 7,266,972 3 Participants 3086 2 Verified Pledges (new & already completed) 13994 3 Heroes / Events / Added Actions 1,565 3 Photos Uploaded 1504 2 Team members 1002 1 Participants
Affiliation Number % of total on campus Faculty 206 4% Staff 1,605 7% Students 1,275 3% Total 3,086 3% Participants by level Minions <500 points
Warriors 500 points
Magicians 2,000 points
Champions 50,000 points
Gurus 10,000 points
1,757 528 285 217 299 Teams Number of teams 75 Participants on teams 1002 Fraction of participants on teams 32% Top teams Rank Team Name Points 1 UCLA H&HS 667,350 2 UCLA Facilities Management 458,712 3 UCLA Events & Transportation 329,574 4 UCLA Library 277,616 5 M1A: Food 200,768 6 UCLA Grand Challenges 155,630 7 UCLA SRC 152,406 8 UCLA External Affairs 135,676 9 UCLA Institute of the Environment & Sustainability 127,478 10 UCLA Graduate Division 120,024 Greenhouse Gas Savings (metric tons CO2e)
Scopes 1 & 2 Scope 3 Total Already completed & verified 862 1,771 2,632 Pledged & verified 333 582 915 Total 1,195 2,352 3,547
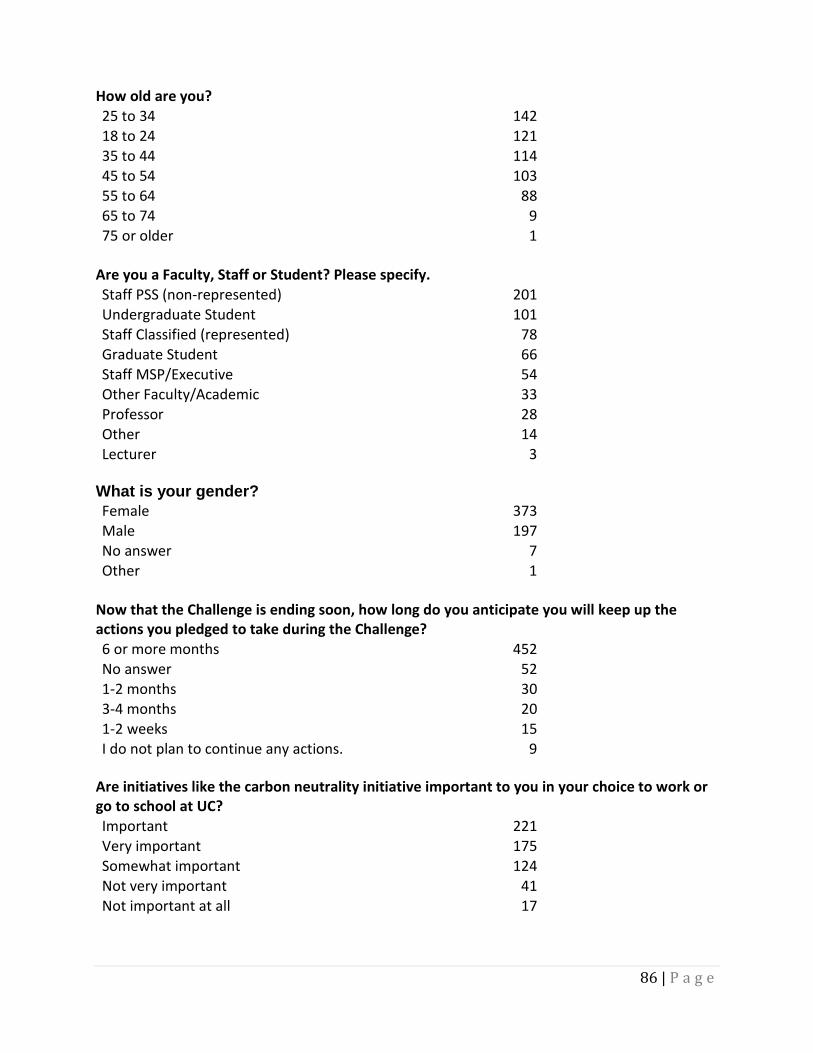
86 | P a g e
How old are you? 25 to 34 142 18 to 24 121 35 to 44 114 45 to 54 103 55 to 64 88 65 to 74 9 75 or older 1
Are you a Faculty, Staff or Student? Please specify. Staff PSS (non-represented) 201 Undergraduate Student 101 Staff Classified (represented) 78 Graduate Student 66 Staff MSP/Executive 54 Other Faculty/Academic 33 Professor 28 Other 14 Lecturer 3
What is your gender? Female 373 Male 197 No answer 7 Other 1
Now that the Challenge is ending soon, how long do you anticipate you will keep up the actions you pledged to take during the Challenge? 6 or more months 452 No answer 52 1-2 months 30 3-4 months 20 1-2 weeks 15 I do not plan to continue any actions. 9
Are initiatives like the carbon neutrality initiative important to you in your choice to work or go to school at UC? Important 221 Very important 175 Somewhat important 124 Not very important 41 Not important at all 17
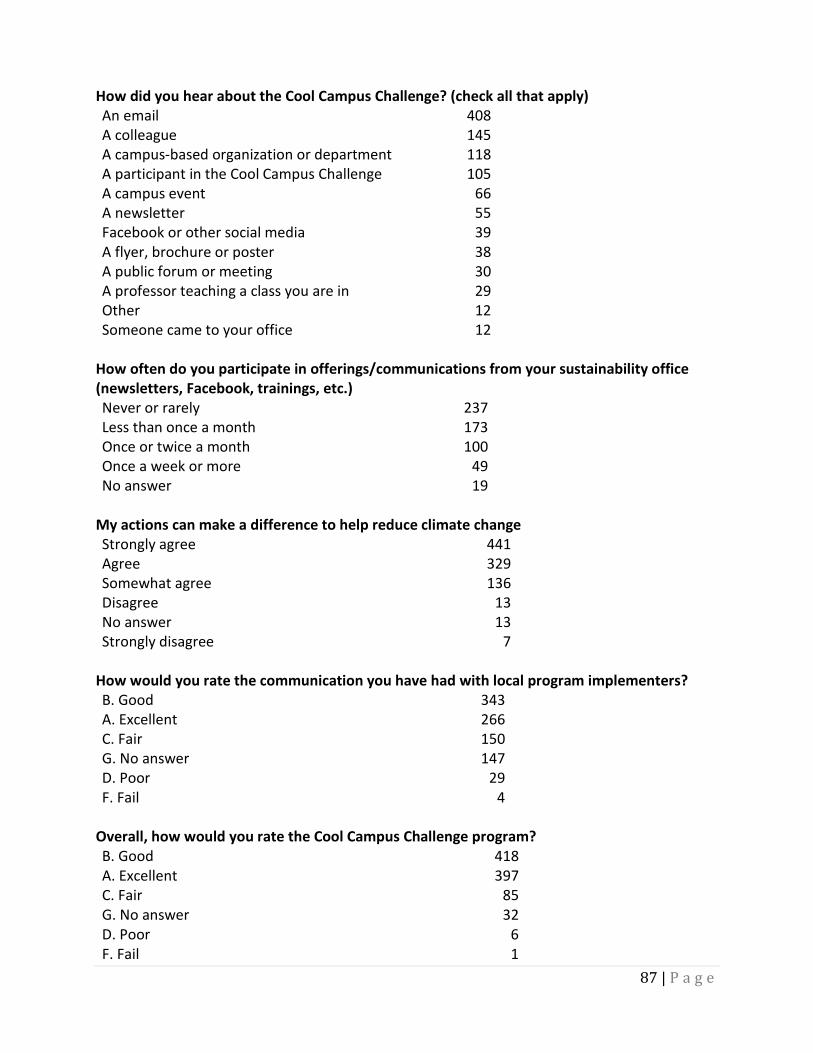
87 | P a g e
How did you hear about the Cool Campus Challenge? (check all that apply) An email 408 A colleague 145 A campus-based organization or department 118 A participant in the Cool Campus Challenge 105 A campus event 66 A newsletter 55 Facebook or other social media 39 A flyer, brochure or poster 38 A public forum or meeting 30 A professor teaching a class you are in 29 Other 12 Someone came to your office 12
How often do you participate in offerings/communications from your sustainability office (newsletters, Facebook, trainings, etc.) Never or rarely 237 Less than once a month 173 Once or twice a month 100 Once a week or more 49 No answer 19
My actions can make a difference to help reduce climate change Strongly agree 441 Agree 329 Somewhat agree 136 Disagree 13 No answer 13 Strongly disagree 7
How would you rate the communication you have had with local program implementers? B. Good 343 A. Excellent 266 C. Fair 150 G. No answer 147 D. Poor 29 F. Fail 4
Overall, how would you rate the Cool Campus Challenge program? B. Good 418 A. Excellent 397 C. Fair 85 G. No answer 32 D. Poor 6 F. Fail 1
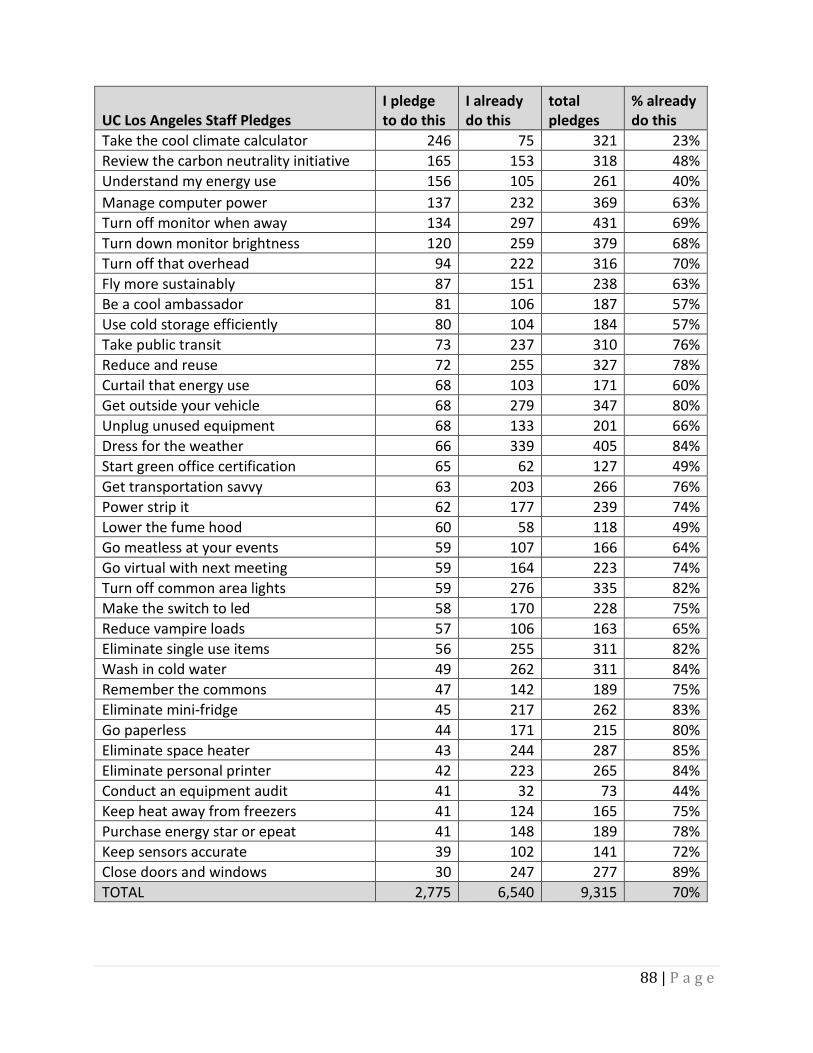
88 | P a g e
UC Los Angeles Staff Pledges I pledge to do this
I already do this
total pledges
% already do this
Take the cool climate calculator 246 75 321 23% Review the carbon neutrality initiative 165 153 318 48% Understand my energy use 156 105 261 40% Manage computer power 137 232 369 63% Turn off monitor when away 134 297 431 69% Turn down monitor brightness 120 259 379 68% Turn off that overhead 94 222 316 70% Fly more sustainably 87 151 238 63% Be a cool ambassador 81 106 187 57% Use cold storage efficiently 80 104 184 57% Take public transit 73 237 310 76% Reduce and reuse 72 255 327 78% Curtail that energy use 68 103 171 60% Get outside your vehicle 68 279 347 80% Unplug unused equipment 68 133 201 66% Dress for the weather 66 339 405 84% Start green office certification 65 62 127 49% Get transportation savvy 63 203 266 76% Power strip it 62 177 239 74% Lower the fume hood 60 58 118 49% Go meatless at your events 59 107 166 64% Go virtual with next meeting 59 164 223 74% Turn off common area lights 59 276 335 82% Make the switch to led 58 170 228 75% Reduce vampire loads 57 106 163 65% Eliminate single use items 56 255 311 82% Wash in cold water 49 262 311 84% Remember the commons 47 142 189 75% Eliminate mini-fridge 45 217 262 83% Go paperless 44 171 215 80% Eliminate space heater 43 244 287 85% Eliminate personal printer 42 223 265 84% Conduct an equipment audit 41 32 73 44% Keep heat away from freezers 41 124 165 75% Purchase energy star or epeat 41 148 189 78% Keep sensors accurate 39 102 141 72% Close doors and windows 30 247 277 89% TOTAL 2,775 6,540 9,315 70%
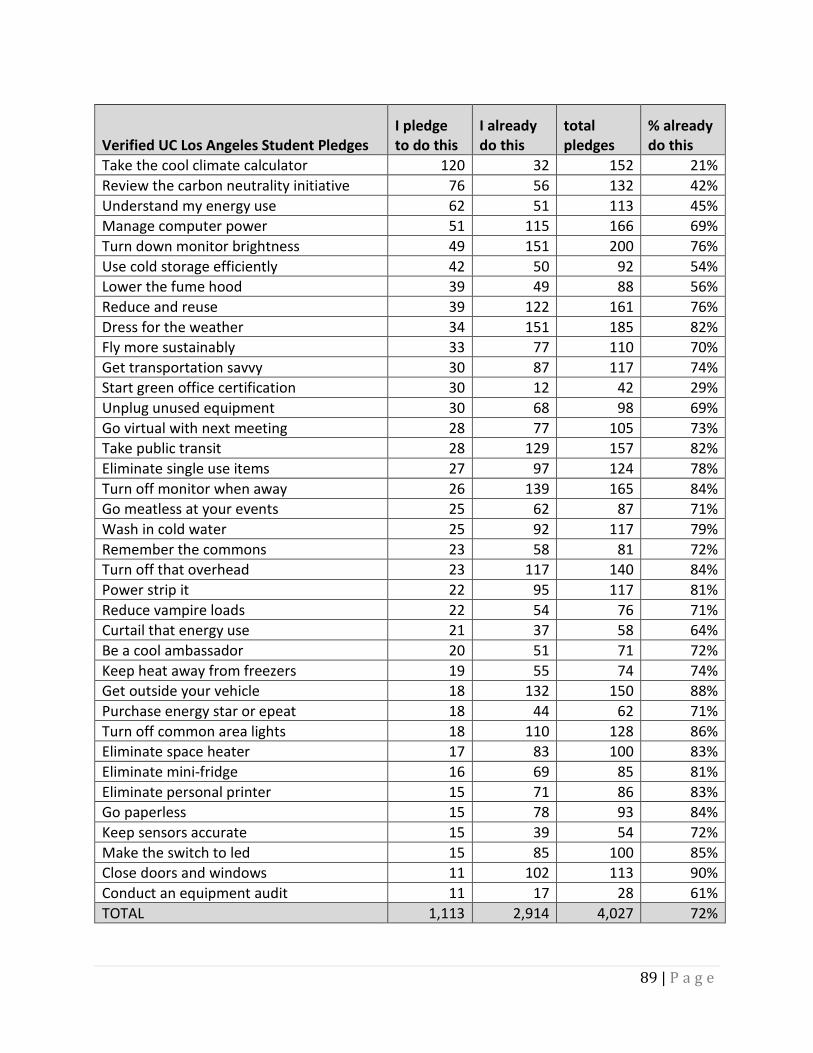
89 | P a g e
Verified UC Los Angeles Student Pledges I pledge to do this
I already do this
total pledges
% already do this
Take the cool climate calculator 120 32 152 21% Review the carbon neutrality initiative 76 56 132 42% Understand my energy use 62 51 113 45% Manage computer power 51 115 166 69% Turn down monitor brightness 49 151 200 76% Use cold storage efficiently 42 50 92 54% Lower the fume hood 39 49 88 56% Reduce and reuse 39 122 161 76% Dress for the weather 34 151 185 82% Fly more sustainably 33 77 110 70% Get transportation savvy 30 87 117 74% Start green office certification 30 12 42 29% Unplug unused equipment 30 68 98 69% Go virtual with next meeting 28 77 105 73% Take public transit 28 129 157 82% Eliminate single use items 27 97 124 78% Turn off monitor when away 26 139 165 84% Go meatless at your events 25 62 87 71% Wash in cold water 25 92 117 79% Remember the commons 23 58 81 72% Turn off that overhead 23 117 140 84% Power strip it 22 95 117 81% Reduce vampire loads 22 54 76 71% Curtail that energy use 21 37 58 64% Be a cool ambassador 20 51 71 72% Keep heat away from freezers 19 55 74 74% Get outside your vehicle 18 132 150 88% Purchase energy star or epeat 18 44 62 71% Turn off common area lights 18 110 128 86% Eliminate space heater 17 83 100 83% Eliminate mini-fridge 16 69 85 81% Eliminate personal printer 15 71 86 83% Go paperless 15 78 93 84% Keep sensors accurate 15 39 54 72% Make the switch to led 15 85 100 85% Close doors and windows 11 102 113 90% Conduct an equipment audit 11 17 28 61% TOTAL 1,113 2,914 4,027 72%
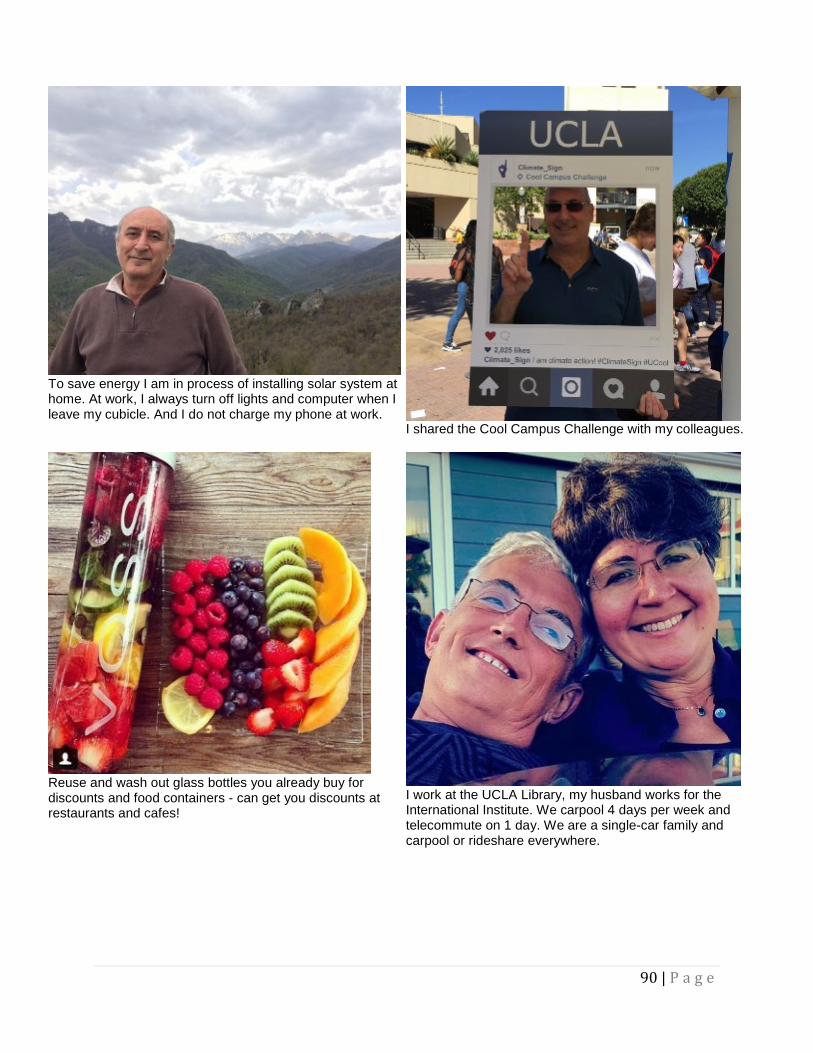
90 | P a g e
To save energy I am in process of installing solar system at home. At work, I always turn off lights and computer when I leave my cubicle. And I do not charge my phone at work.
I shared the Cool Campus Challenge with my colleagues.
Reuse and wash out glass bottles you already buy for discounts and food containers - can get you discounts at restaurants and cafes!
I work at the UCLA Library, my husband works for the International Institute. We carpool 4 days per week and telecommute on 1 day. We are a single-car family and carpool or rideshare everywhere.
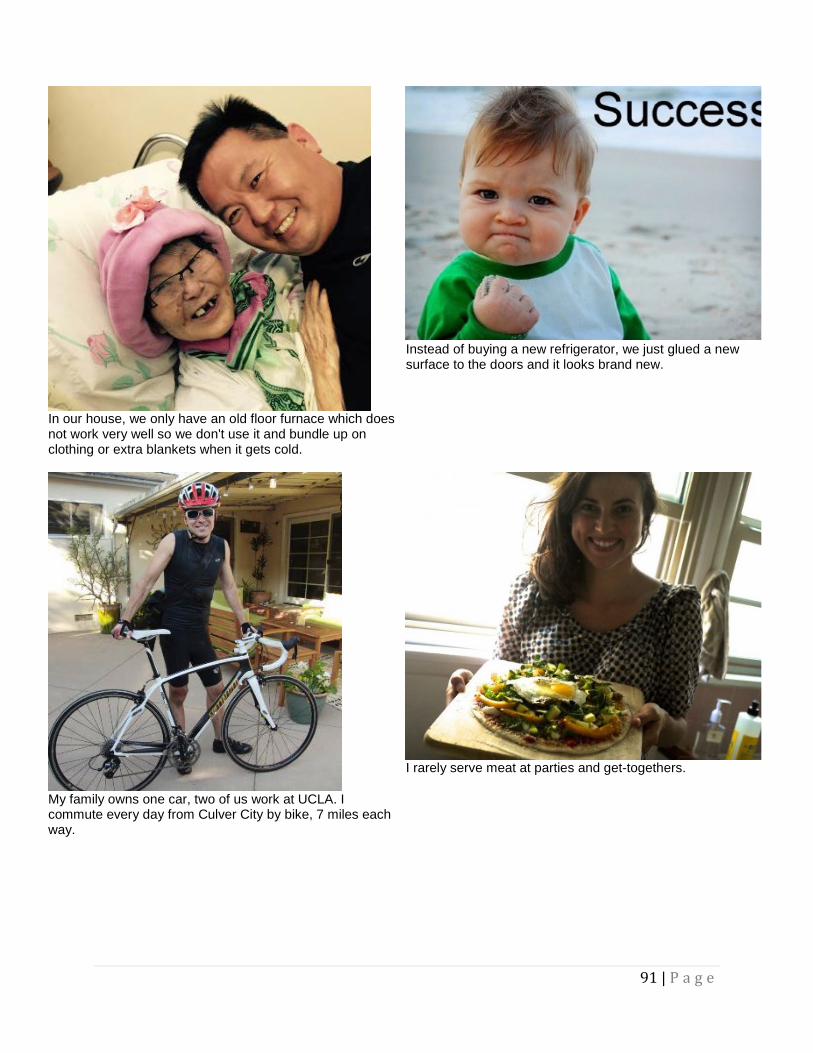
91 | P a g e
In our house, we only have an old floor furnace which does not work very well so we don't use it and bundle up on clothing or extra blankets when it gets cold.
Instead of buying a new refrigerator, we just glued a new surface to the doors and it looks brand new.
My family owns one car, two of us work at UCLA. I commute every day from Culver City by bike, 7 miles each way.
I rarely serve meat at parties and get-togethers.
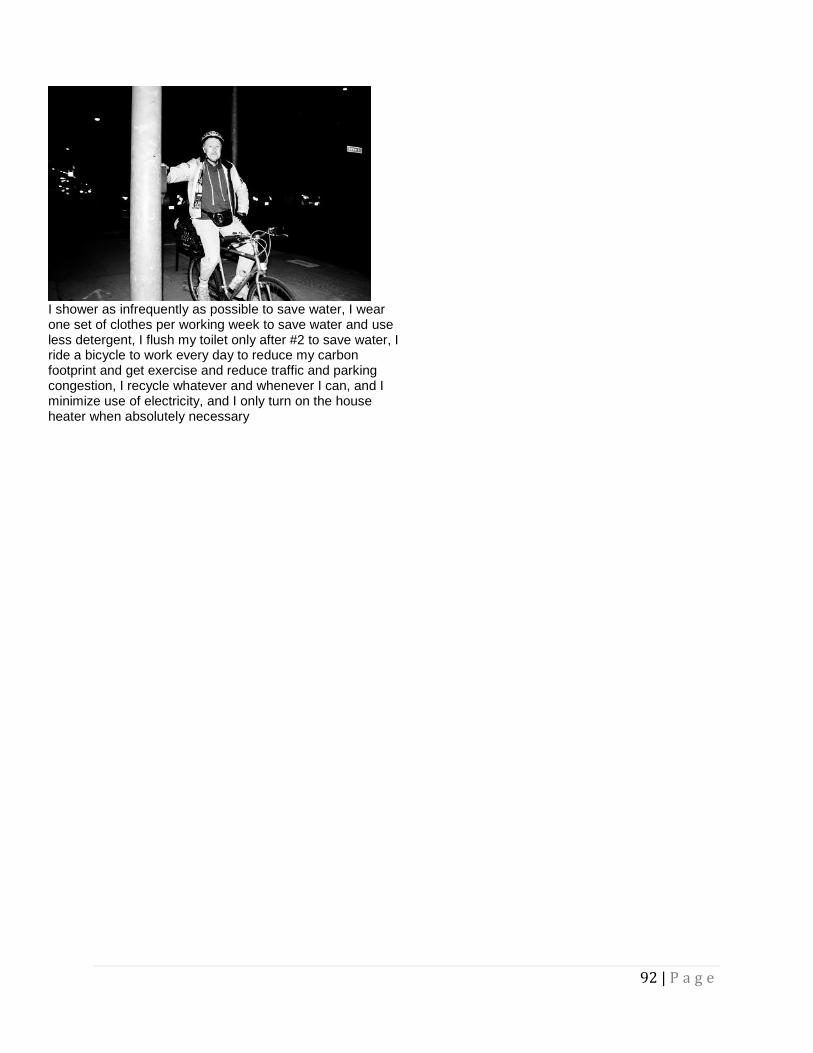
92 | P a g e
I shower as infrequently as possible to save water, I wear one set of clothes per working week to save water and use less detergent, I flush my toilet only after #2 to save water, I ride a bicycle to work every day to reduce my carbon footprint and get exercise and reduce traffic and parking congestion, I recycle whatever and whenever I can, and I minimize use of electricity, and I only turn on the house heater when absolutely necessary

93 | P a g e
Cool Campus Challenge 2015 Summary - UC Merced Final Rankings Total Rank (of 10) Points 8,122,388 2nd Participants 2,539 3 Verified Pledges (new & already completed) 15169 2 Heroes / Events / Added Actions 2,553 1 Photos Uploaded 670 9 Team members 835 2 Participants
Affiliation Number % of total on campus Faculty 53 13% Staff 341 32% Students 2145 35% Total 2539 33% Participants by level Minions <500 points
Warriors 500 points
Magicians 2,000 points
Champions 50,000 points
Gurus 10,000 points
1,124 560 196 183 476 Teams Number of teams 30 Participants on teams 835 Fraction of participants on teams 33% Top teams Rank Team Name Points 1 Theta Tau at UCM 811,722 2 Delta Delta Delta 628,942 3 UCM School of Natural Sciences 606,442 4 UCM Earth Systems Science 313,022 5 Ohana at UC Merced 301,808 6 UCM Housing 249,298 7 UCM School of Engineering 210,666 8 Dance Coalition at UC Merced 167,398 9 UC Merced Sustainability Council 165,694 10 UC Merced Library 150,970 Greenhouse Gas Savings (metric tons CO2e)
Scopes 1 & 2 Scope 3 Total Already completed & verified 867 1,542 2,409 Pledged & verified 598 1,232 1,831 Total 1,465 2,774 4,239
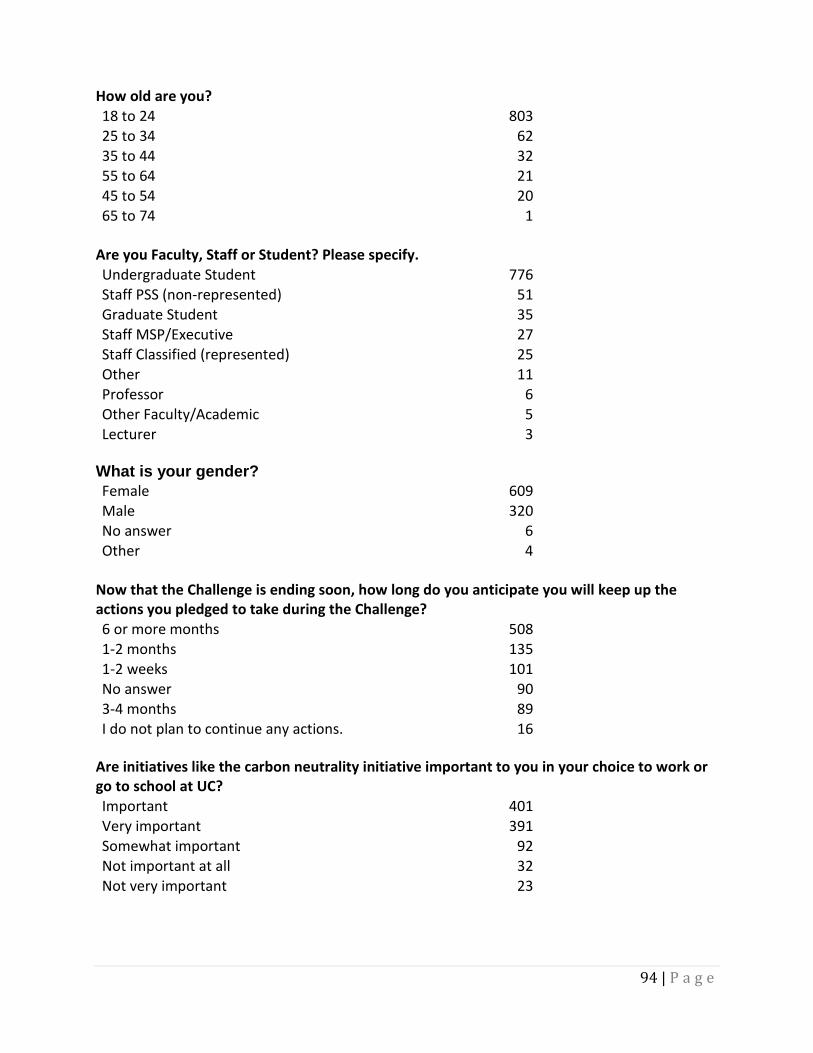
94 | P a g e
How old are you? 18 to 24 803 25 to 34 62 35 to 44 32 55 to 64 21 45 to 54 20 65 to 74 1
Are you Faculty, Staff or Student? Please specify. Undergraduate Student 776 Staff PSS (non-represented) 51 Graduate Student 35 Staff MSP/Executive 27 Staff Classified (represented) 25 Other 11 Professor 6 Other Faculty/Academic 5 Lecturer 3
What is your gender? Female 609 Male 320 No answer 6 Other 4
Now that the Challenge is ending soon, how long do you anticipate you will keep up the actions you pledged to take during the Challenge? 6 or more months 508 1-2 months 135 1-2 weeks 101 No answer 90 3-4 months 89 I do not plan to continue any actions. 16
Are initiatives like the carbon neutrality initiative important to you in your choice to work or go to school at UC? Important 401 Very important 391 Somewhat important 92 Not important at all 32 Not very important 23
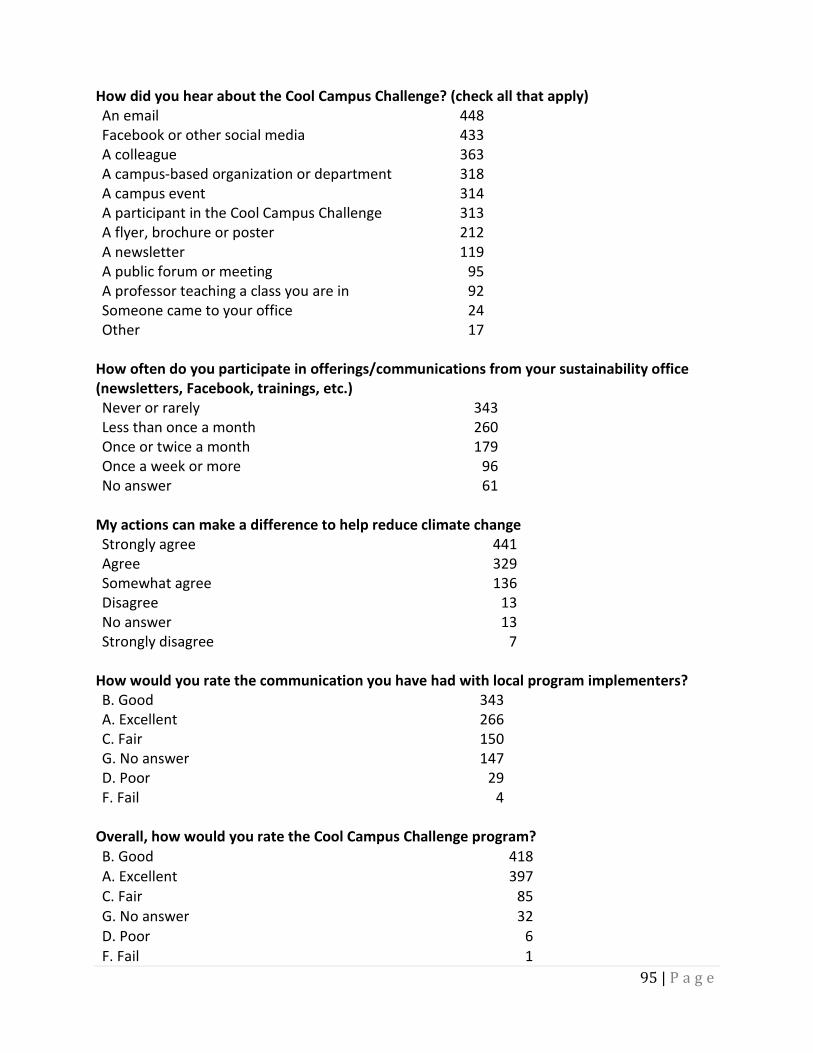
95 | P a g e
How did you hear about the Cool Campus Challenge? (check all that apply) An email 448 Facebook or other social media 433 A colleague 363 A campus-based organization or department 318 A campus event 314 A participant in the Cool Campus Challenge 313 A flyer, brochure or poster 212 A newsletter 119 A public forum or meeting 95 A professor teaching a class you are in 92 Someone came to your office 24 Other 17
How often do you participate in offerings/communications from your sustainability office (newsletters, Facebook, trainings, etc.) Never or rarely 343 Less than once a month 260 Once or twice a month 179 Once a week or more 96 No answer 61
My actions can make a difference to help reduce climate change Strongly agree 441 Agree 329 Somewhat agree 136 Disagree 13 No answer 13 Strongly disagree 7
How would you rate the communication you have had with local program implementers? B. Good 343 A. Excellent 266 C. Fair 150 G. No answer 147 D. Poor 29 F. Fail 4
Overall, how would you rate the Cool Campus Challenge program? B. Good 418 A. Excellent 397 C. Fair 85 G. No answer 32 D. Poor 6 F. Fail 1
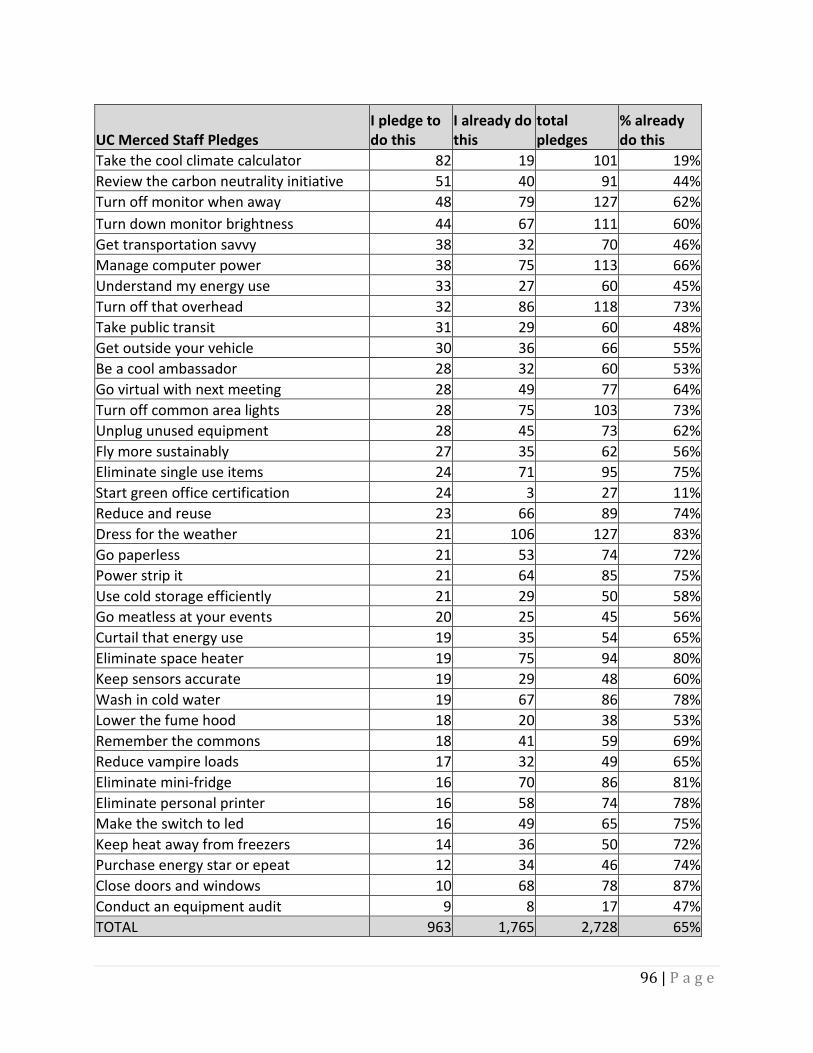
96 | P a g e
UC Merced Staff Pledges I pledge to do this
I already do this
total pledges
% already do this
Take the cool climate calculator 82 19 101 19% Review the carbon neutrality initiative 51 40 91 44% Turn off monitor when away 48 79 127 62% Turn down monitor brightness 44 67 111 60% Get transportation savvy 38 32 70 46% Manage computer power 38 75 113 66% Understand my energy use 33 27 60 45% Turn off that overhead 32 86 118 73% Take public transit 31 29 60 48% Get outside your vehicle 30 36 66 55% Be a cool ambassador 28 32 60 53% Go virtual with next meeting 28 49 77 64% Turn off common area lights 28 75 103 73% Unplug unused equipment 28 45 73 62% Fly more sustainably 27 35 62 56% Eliminate single use items 24 71 95 75% Start green office certification 24 3 27 11% Reduce and reuse 23 66 89 74% Dress for the weather 21 106 127 83% Go paperless 21 53 74 72% Power strip it 21 64 85 75% Use cold storage efficiently 21 29 50 58% Go meatless at your events 20 25 45 56% Curtail that energy use 19 35 54 65% Eliminate space heater 19 75 94 80% Keep sensors accurate 19 29 48 60% Wash in cold water 19 67 86 78% Lower the fume hood 18 20 38 53% Remember the commons 18 41 59 69% Reduce vampire loads 17 32 49 65% Eliminate mini-fridge 16 70 86 81% Eliminate personal printer 16 58 74 78% Make the switch to led 16 49 65 75% Keep heat away from freezers 14 36 50 72% Purchase energy star or epeat 12 34 46 74% Close doors and windows 10 68 78 87% Conduct an equipment audit 9 8 17 47% TOTAL 963 1,765 2,728 65%
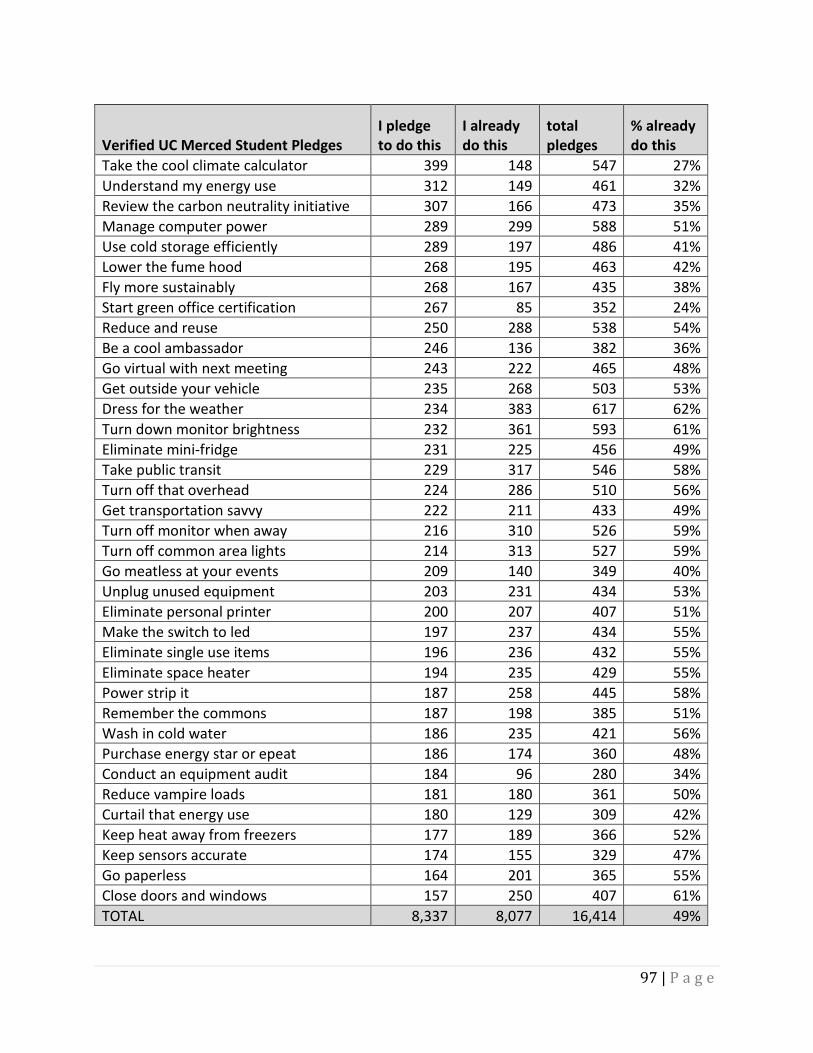
97 | P a g e
Verified UC Merced Student Pledges I pledge to do this
I already do this
total pledges
% already do this
Take the cool climate calculator 399 148 547 27% Understand my energy use 312 149 461 32% Review the carbon neutrality initiative 307 166 473 35% Manage computer power 289 299 588 51% Use cold storage efficiently 289 197 486 41% Lower the fume hood 268 195 463 42% Fly more sustainably 268 167 435 38% Start green office certification 267 85 352 24% Reduce and reuse 250 288 538 54% Be a cool ambassador 246 136 382 36% Go virtual with next meeting 243 222 465 48% Get outside your vehicle 235 268 503 53% Dress for the weather 234 383 617 62% Turn down monitor brightness 232 361 593 61% Eliminate mini-fridge 231 225 456 49% Take public transit 229 317 546 58% Turn off that overhead 224 286 510 56% Get transportation savvy 222 211 433 49% Turn off monitor when away 216 310 526 59% Turn off common area lights 214 313 527 59% Go meatless at your events 209 140 349 40% Unplug unused equipment 203 231 434 53% Eliminate personal printer 200 207 407 51% Make the switch to led 197 237 434 55% Eliminate single use items 196 236 432 55% Eliminate space heater 194 235 429 55% Power strip it 187 258 445 58% Remember the commons 187 198 385 51% Wash in cold water 186 235 421 56% Purchase energy star or epeat 186 174 360 48% Conduct an equipment audit 184 96 280 34% Reduce vampire loads 181 180 361 50% Curtail that energy use 180 129 309 42% Keep heat away from freezers 177 189 366 52% Keep sensors accurate 174 155 329 47% Go paperless 164 201 365 55% Close doors and windows 157 250 407 61% TOTAL 8,337 8,077 16,414 49%
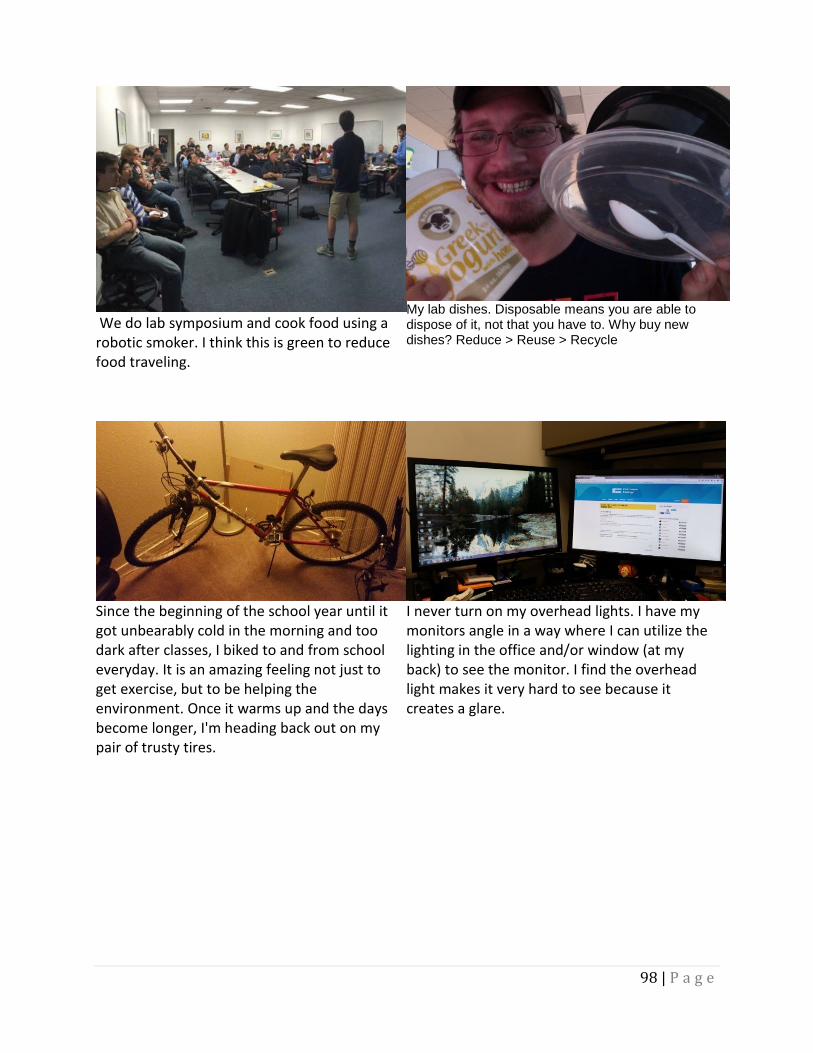
98 | P a g e
We do lab symposium and cook food using a robotic smoker. I think this is green to reduce food traveling.
My lab dishes. Disposable means you are able to dispose of it, not that you have to. Why buy new dishes? Reduce > Reuse > Recycle
Since the beginning of the school year until it got unbearably cold in the morning and too dark after classes, I biked to and from school everyday. It is an amazing feeling not just to get exercise, but to be helping the environment. Once it warms up and the days become longer, I'm heading back out on my pair of trusty tires.
I never turn on my overhead lights. I have my monitors angle in a way where I can utilize the lighting in the office and/or window (at my back) to see the monitor. I find the overhead light makes it very hard to see because it creates a glare.
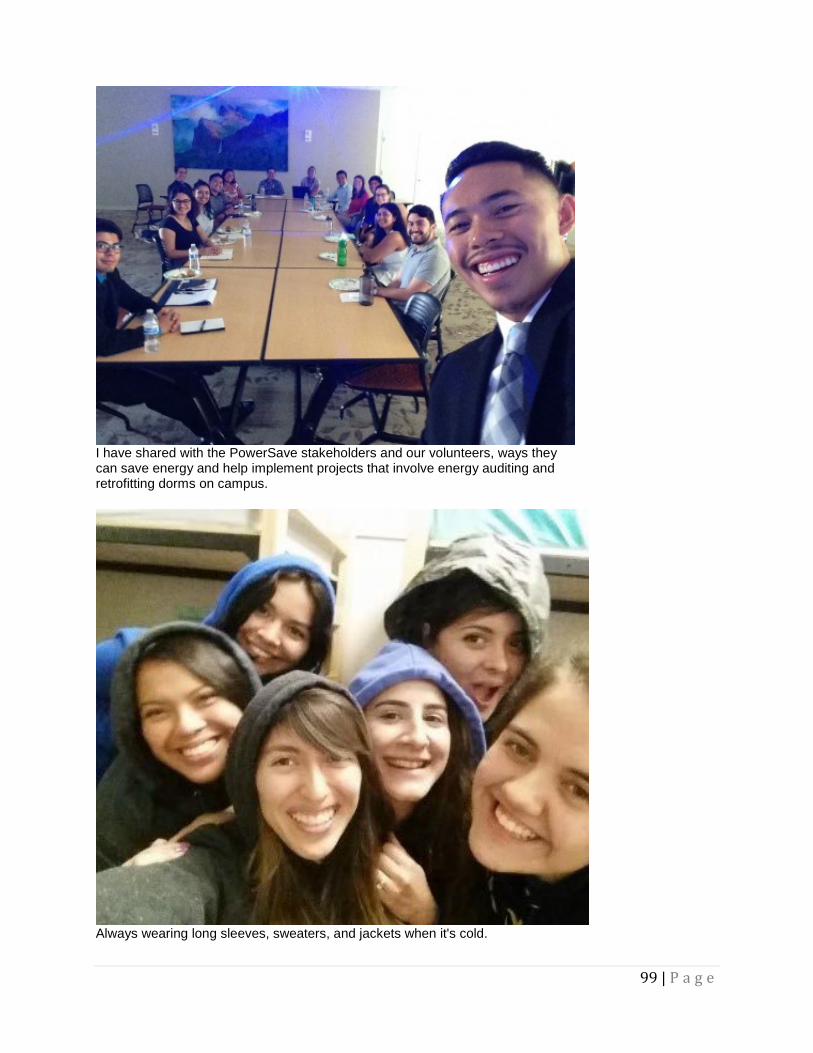
99 | P a g e
I have shared with the PowerSave stakeholders and our volunteers, ways they can save energy and help implement projects that involve energy auditing and retrofitting dorms on campus.
Always wearing long sleeves, sweaters, and jackets when it's cold.
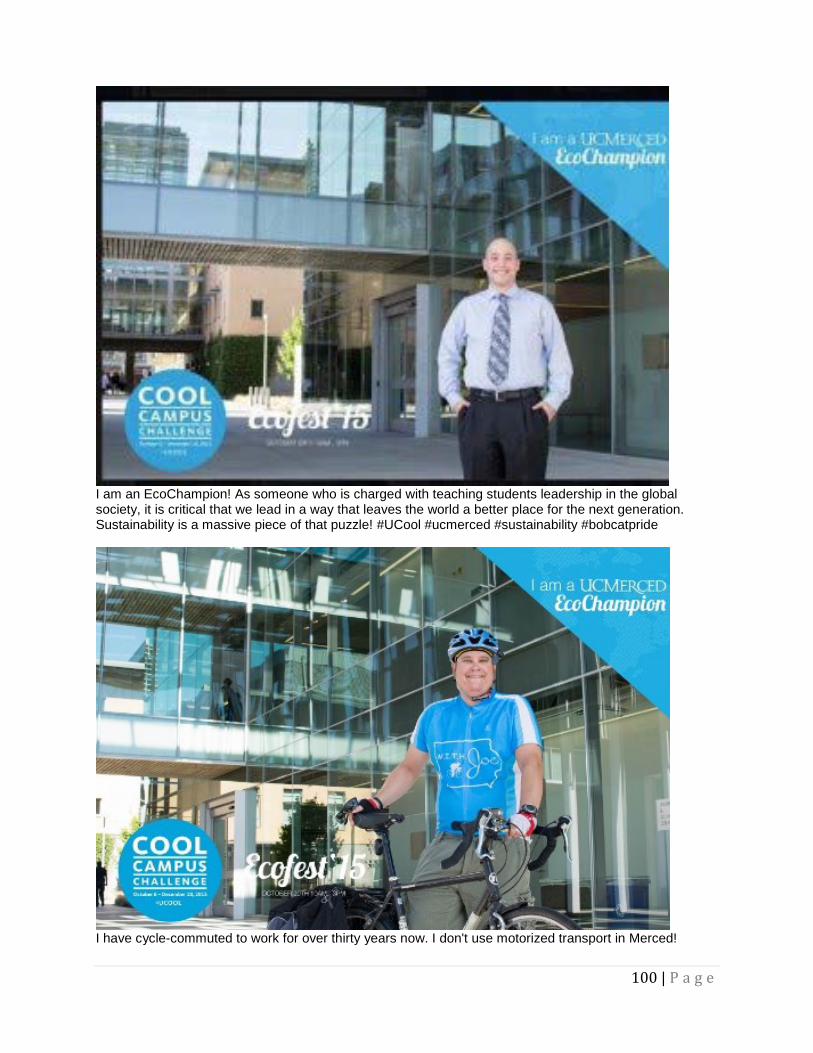
100 | P a g e
I am an EcoChampion! As someone who is charged with teaching students leadership in the global society, it is critical that we lead in a way that leaves the world a better place for the next generation. Sustainability is a massive piece of that puzzle! #UCool #ucmerced #sustainability #bobcatpride
I have cycle-commuted to work for over thirty years now. I don't use motorized transport in Merced!
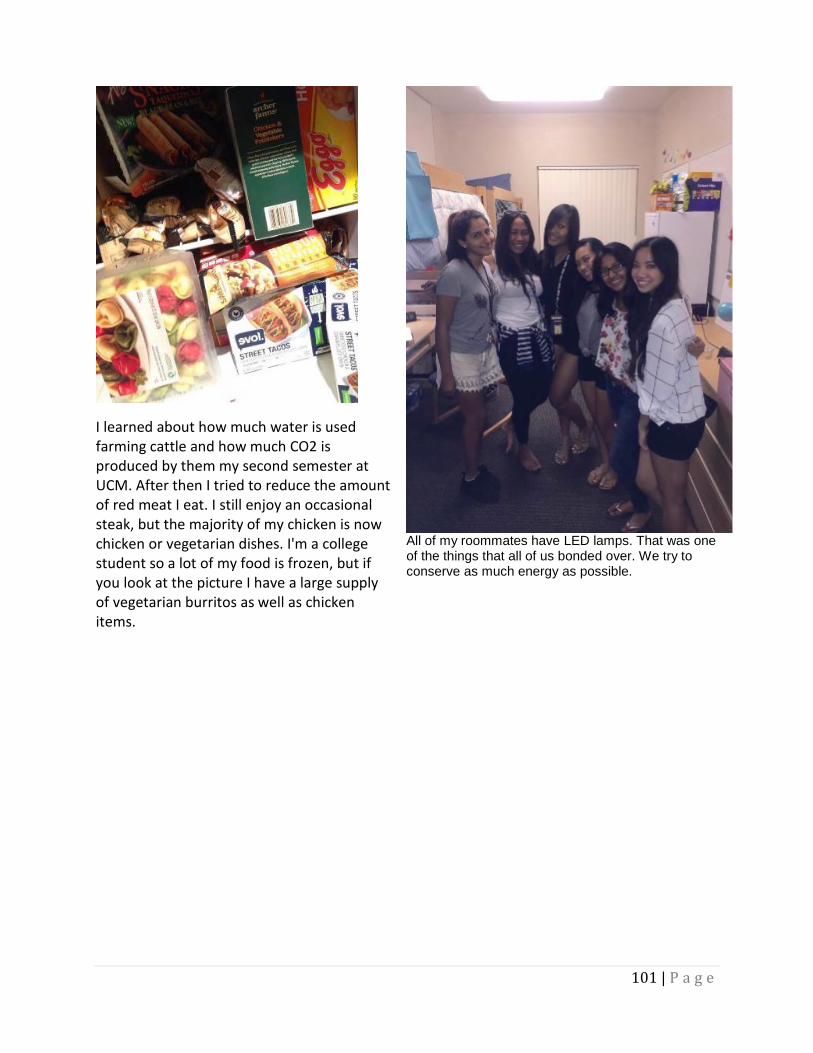
101 | P a g e
I learned about how much water is used farming cattle and how much CO2 is produced by them my second semester at UCM. After then I tried to reduce the amount of red meat I eat. I still enjoy an occasional steak, but the majority of my chicken is now chicken or vegetarian dishes. I'm a college student so a lot of my food is frozen, but if you look at the picture I have a large supply of vegetarian burritos as well as chicken items.
All of my roommates have LED lamps. That was one of the things that all of us bonded over. We try to conserve as much energy as possible.
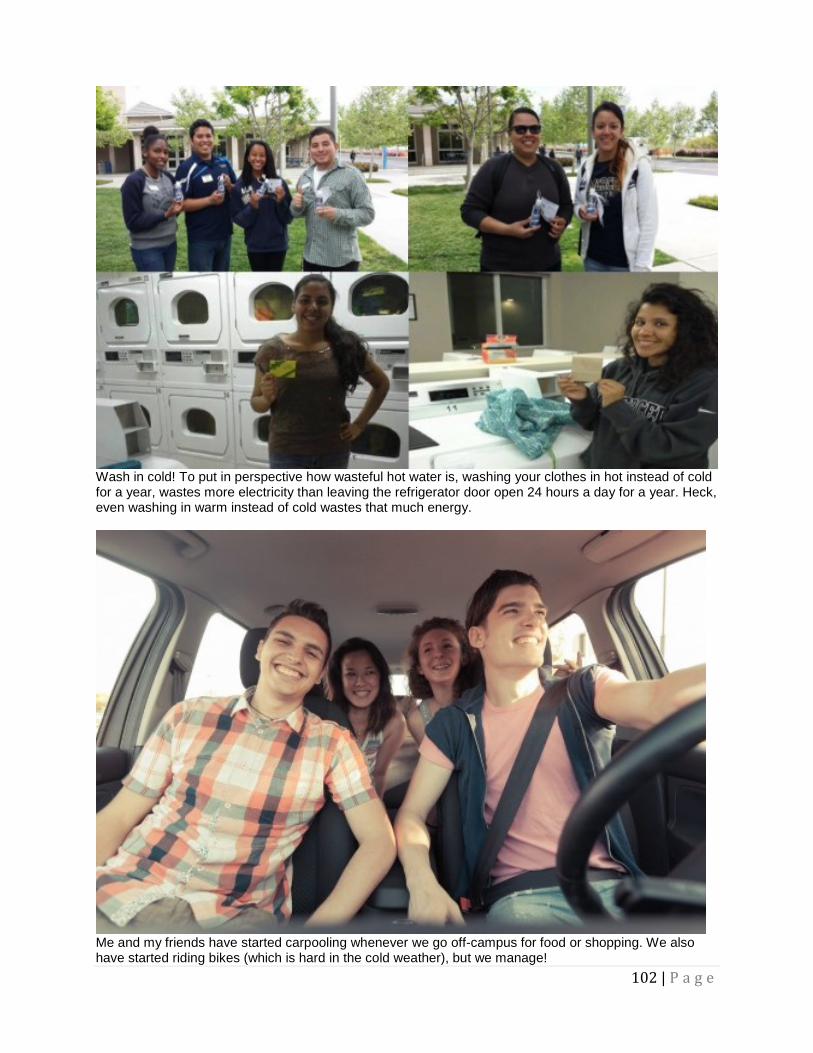
102 | P a g e
Wash in cold! To put in perspective how wasteful hot water is, washing your clothes in hot instead of cold for a year, wastes more electricity than leaving the refrigerator door open 24 hours a day for a year. Heck, even washing in warm instead of cold wastes that much energy.
Me and my friends have started carpooling whenever we go off-campus for food or shopping. We also have started riding bikes (which is hard in the cold weather), but we manage!
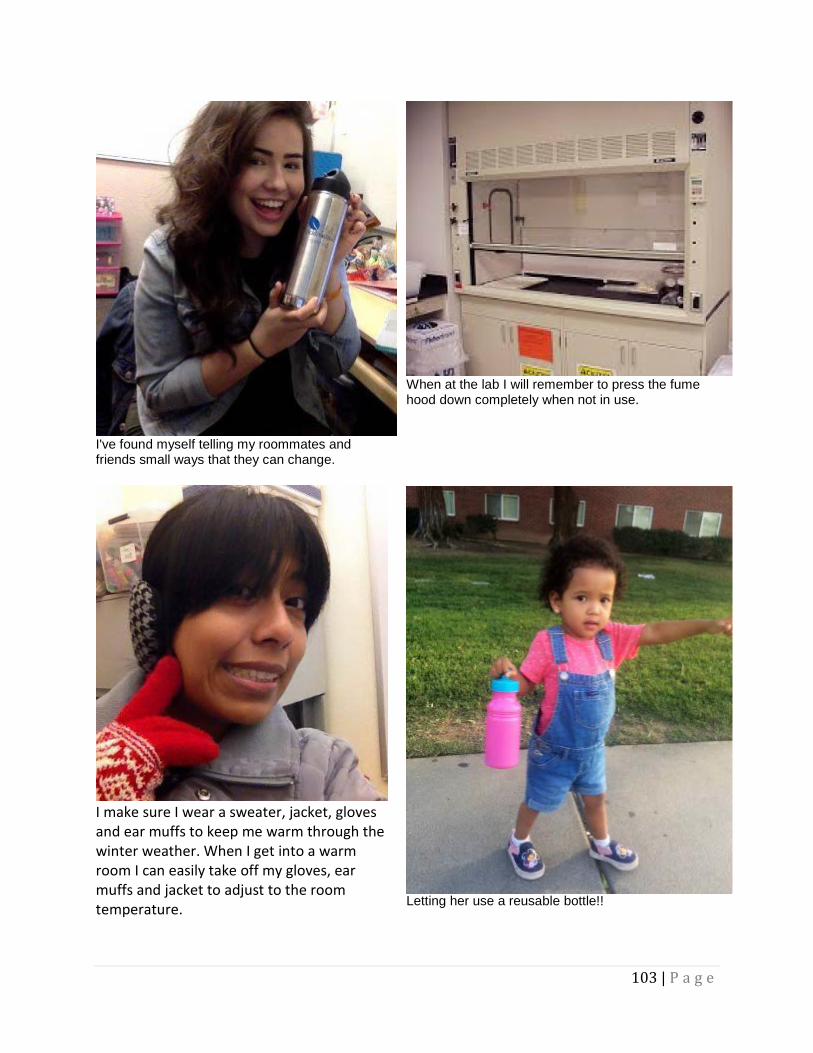
103 | P a g e
I've found myself telling my roommates and friends small ways that they can change.
When at the lab I will remember to press the fume hood down completely when not in use.
I make sure I wear a sweater, jacket, gloves and ear muffs to keep me warm through the winter weather. When I get into a warm room I can easily take off my gloves, ear muffs and jacket to adjust to the room temperature. Letting her use a reusable bottle!!
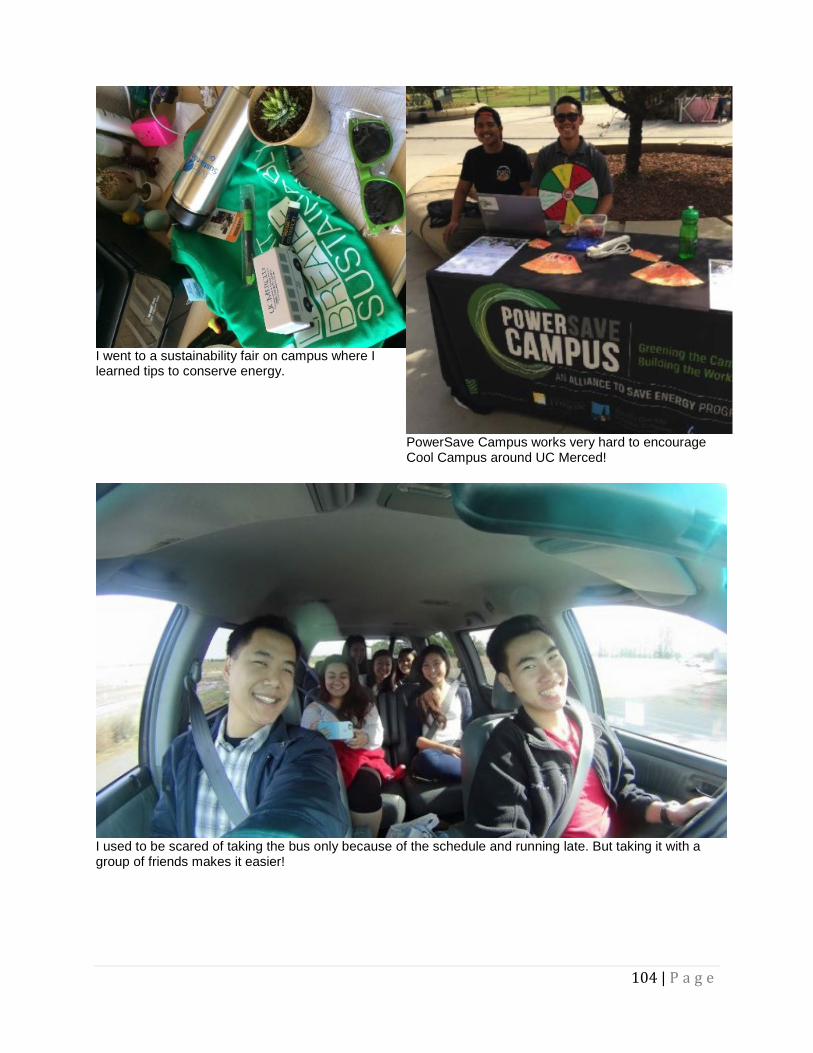
104 | P a g e
I went to a sustainability fair on campus where I learned tips to conserve energy.
PowerSave Campus works very hard to encourage Cool Campus around UC Merced!
I used to be scared of taking the bus only because of the schedule and running late. But taking it with a group of friends makes it easier!
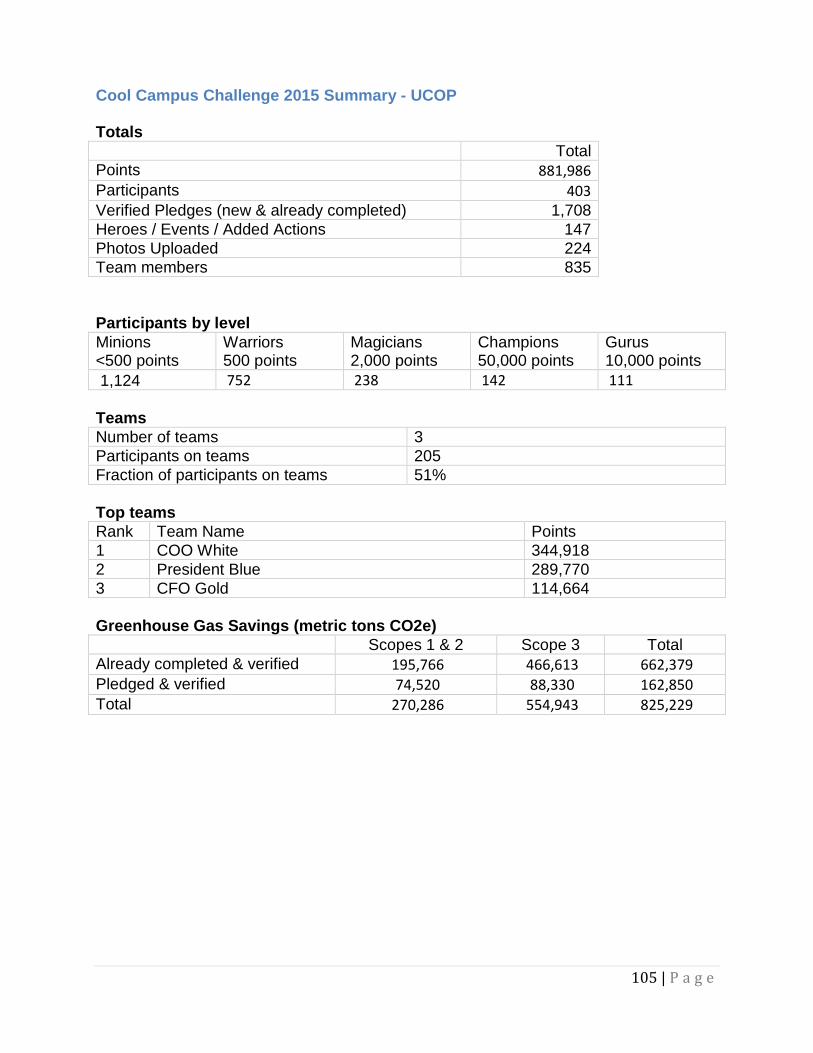
105 | P a g e
Cool Campus Challenge 2015 Summary - UCOP Totals Total Points 881,986 Participants 403 Verified Pledges (new & already completed) 1,708 Heroes / Events / Added Actions 147 Photos Uploaded 224 Team members 835 Participants by level Minions <500 points
Warriors 500 points
Magicians 2,000 points
Champions 50,000 points
Gurus 10,000 points
1,124 752 238 142 111 Teams Number of teams 3 Participants on teams 205 Fraction of participants on teams 51% Top teams Rank Team Name Points 1 COO White 344,918 2 President Blue 289,770 3 CFO Gold 114,664 Greenhouse Gas Savings (metric tons CO2e)
Scopes 1 & 2 Scope 3 Total Already completed & verified 195,766 466,613 662,379 Pledged & verified 74,520 88,330 162,850 Total 270,286 554,943 825,229
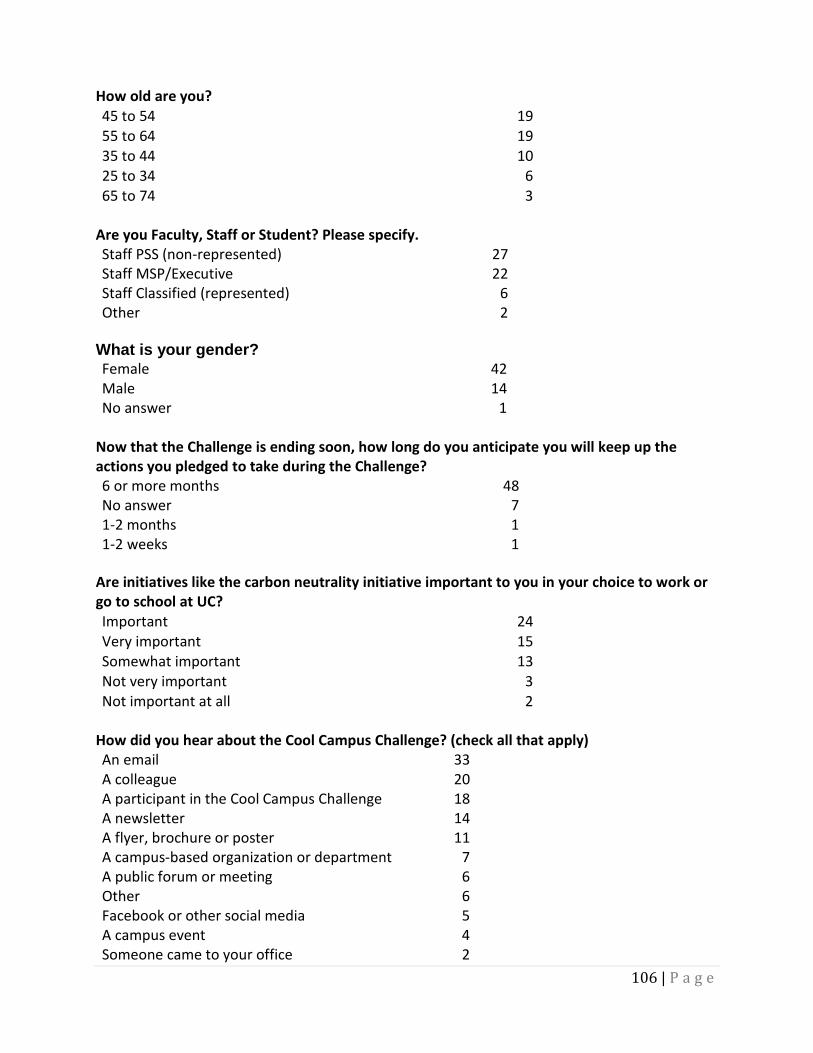
106 | P a g e
How old are you? 45 to 54 19 55 to 64 19 35 to 44 10 25 to 34 6 65 to 74 3
Are you Faculty, Staff or Student? Please specify. Staff PSS (non-represented) 27 Staff MSP/Executive 22 Staff Classified (represented) 6 Other 2
What is your gender? Female 42 Male 14 No answer 1
Now that the Challenge is ending soon, how long do you anticipate you will keep up the actions you pledged to take during the Challenge? 6 or more months 48 No answer 7 1-2 months 1 1-2 weeks 1
Are initiatives like the carbon neutrality initiative important to you in your choice to work or go to school at UC? Important 24 Very important 15 Somewhat important 13 Not very important 3 Not important at all 2
How did you hear about the Cool Campus Challenge? (check all that apply) An email 33 A colleague 20 A participant in the Cool Campus Challenge 18 A newsletter 14 A flyer, brochure or poster 11 A campus-based organization or department 7 A public forum or meeting 6 Other 6 Facebook or other social media 5 A campus event 4 Someone came to your office 2
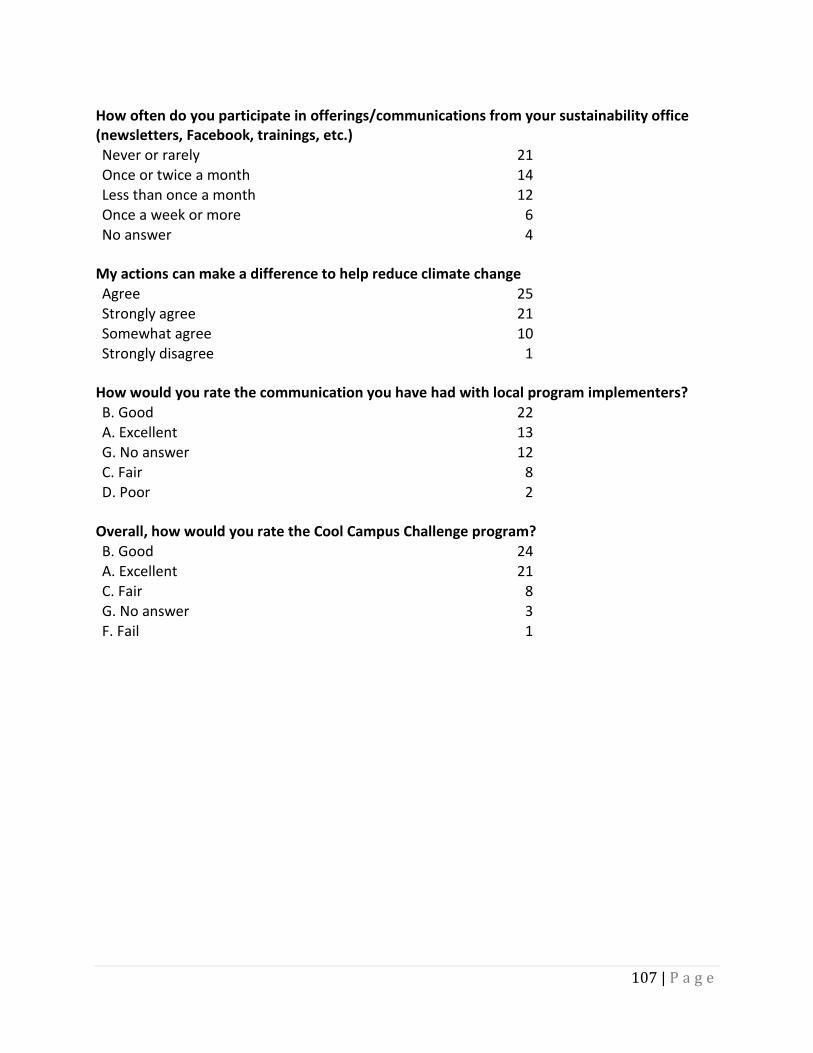
107 | P a g e
How often do you participate in offerings/communications from your sustainability office (newsletters, Facebook, trainings, etc.) Never or rarely 21 Once or twice a month 14 Less than once a month 12 Once a week or more 6 No answer 4
My actions can make a difference to help reduce climate change Agree 25 Strongly agree 21 Somewhat agree 10 Strongly disagree 1
How would you rate the communication you have had with local program implementers? B. Good 22 A. Excellent 13 G. No answer 12 C. Fair 8 D. Poor 2
Overall, how would you rate the Cool Campus Challenge program? B. Good 24 A. Excellent 21 C. Fair 8 G. No answer 3 F. Fail 1
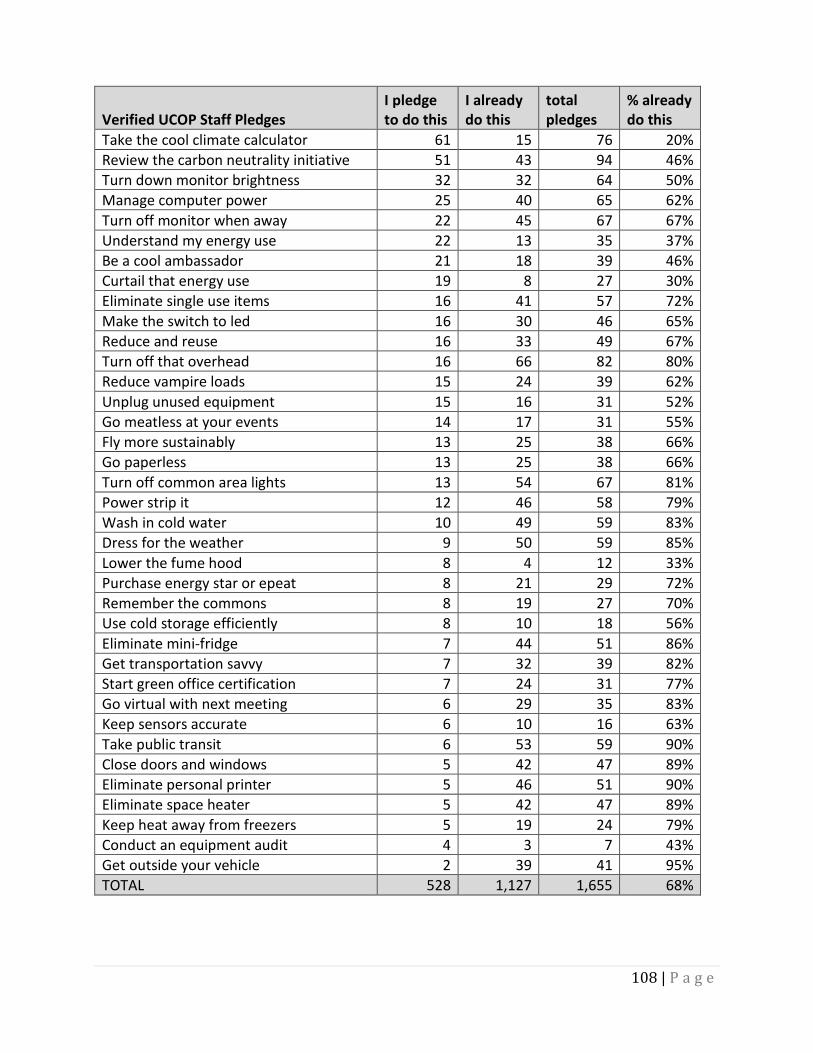
108 | P a g e
Verified UCOP Staff Pledges I pledge to do this
I already do this
total pledges
% already do this
Take the cool climate calculator 61 15 76 20% Review the carbon neutrality initiative 51 43 94 46% Turn down monitor brightness 32 32 64 50% Manage computer power 25 40 65 62% Turn off monitor when away 22 45 67 67% Understand my energy use 22 13 35 37% Be a cool ambassador 21 18 39 46% Curtail that energy use 19 8 27 30% Eliminate single use items 16 41 57 72% Make the switch to led 16 30 46 65% Reduce and reuse 16 33 49 67% Turn off that overhead 16 66 82 80% Reduce vampire loads 15 24 39 62% Unplug unused equipment 15 16 31 52% Go meatless at your events 14 17 31 55% Fly more sustainably 13 25 38 66% Go paperless 13 25 38 66% Turn off common area lights 13 54 67 81% Power strip it 12 46 58 79% Wash in cold water 10 49 59 83% Dress for the weather 9 50 59 85% Lower the fume hood 8 4 12 33% Purchase energy star or epeat 8 21 29 72% Remember the commons 8 19 27 70% Use cold storage efficiently 8 10 18 56% Eliminate mini-fridge 7 44 51 86% Get transportation savvy 7 32 39 82% Start green office certification 7 24 31 77% Go virtual with next meeting 6 29 35 83% Keep sensors accurate 6 10 16 63% Take public transit 6 53 59 90% Close doors and windows 5 42 47 89% Eliminate personal printer 5 46 51 90% Eliminate space heater 5 42 47 89% Keep heat away from freezers 5 19 24 79% Conduct an equipment audit 4 3 7 43% Get outside your vehicle 2 39 41 95% TOTAL 528 1,127 1,655 68%
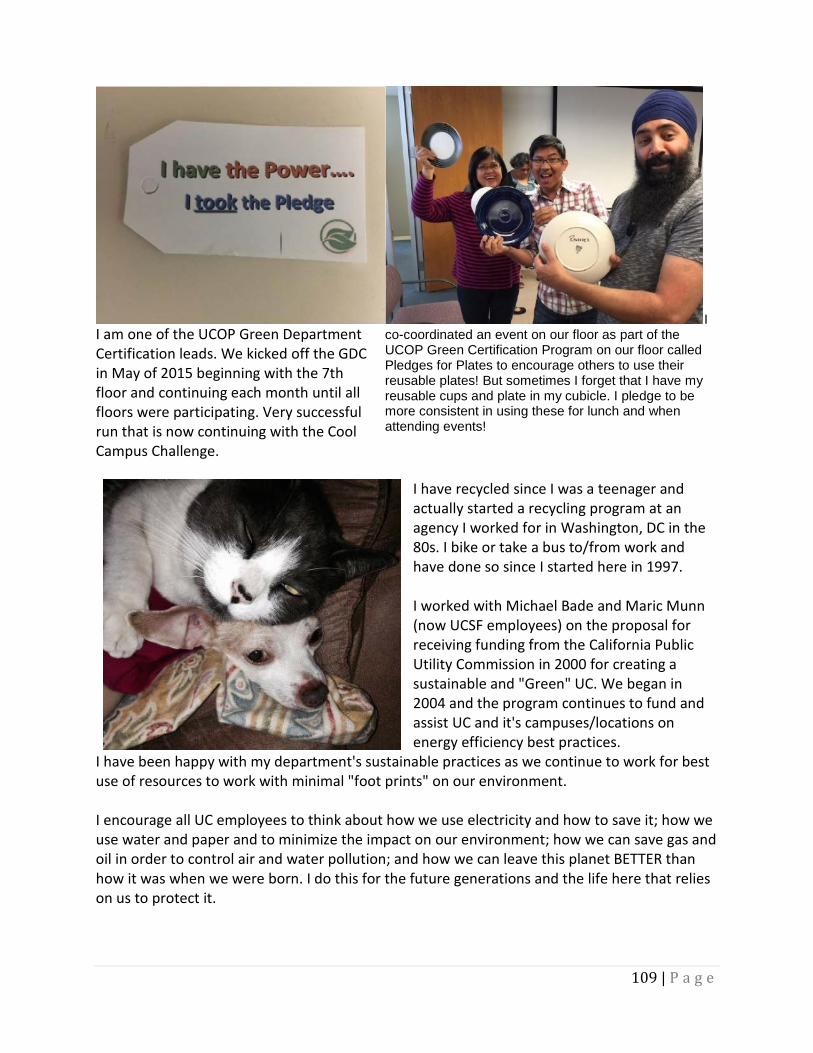
109 | P a g e
I am one of the UCOP Green Department Certification leads. We kicked off the GDC in May of 2015 beginning with the 7th floor and continuing each month until all floors were participating. Very successful run that is now continuing with the Cool Campus Challenge.
I co-coordinated an event on our floor as part of the UCOP Green Certification Program on our floor called Pledges for Plates to encourage others to use their reusable plates! But sometimes I forget that I have my reusable cups and plate in my cubicle. I pledge to be more consistent in using these for lunch and when attending events!
I have recycled since I was a teenager and actually started a recycling program at an agency I worked for in Washington, DC in the 80s. I bike or take a bus to/from work and have done so since I started here in 1997. I worked with Michael Bade and Maric Munn (now UCSF employees) on the proposal for receiving funding from the California Public Utility Commission in 2000 for creating a sustainable and "Green" UC. We began in 2004 and the program continues to fund and assist UC and it's campuses/locations on energy efficiency best practices.
I have been happy with my department's sustainable practices as we continue to work for best use of resources to work with minimal "foot prints" on our environment. I encourage all UC employees to think about how we use electricity and how to save it; how we use water and paper and to minimize the impact on our environment; how we can save gas and oil in order to control air and water pollution; and how we can leave this planet BETTER than how it was when we were born. I do this for the future generations and the life here that relies on us to protect it.
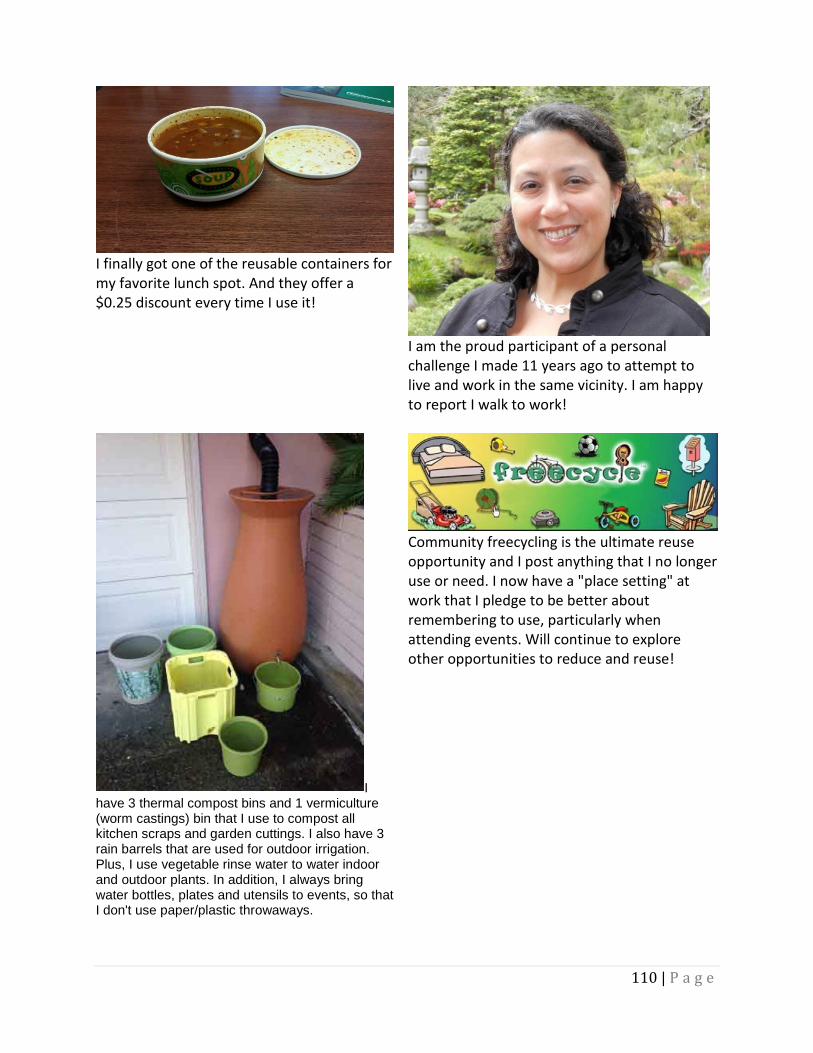
110 | P a g e
I finally got one of the reusable containers for my favorite lunch spot. And they offer a $0.25 discount every time I use it!
I am the proud participant of a personal challenge I made 11 years ago to attempt to live and work in the same vicinity. I am happy to report I walk to work!
I have 3 thermal compost bins and 1 vermiculture (worm castings) bin that I use to compost all kitchen scraps and garden cuttings. I also have 3 rain barrels that are used for outdoor irrigation. Plus, I use vegetable rinse water to water indoor and outdoor plants. In addition, I always bring water bottles, plates and utensils to events, so that I don't use paper/plastic throwaways.
Community freecycling is the ultimate reuse opportunity and I post anything that I no longer use or need. I now have a "place setting" at work that I pledge to be better about remembering to use, particularly when attending events. Will continue to explore other opportunities to reduce and reuse!
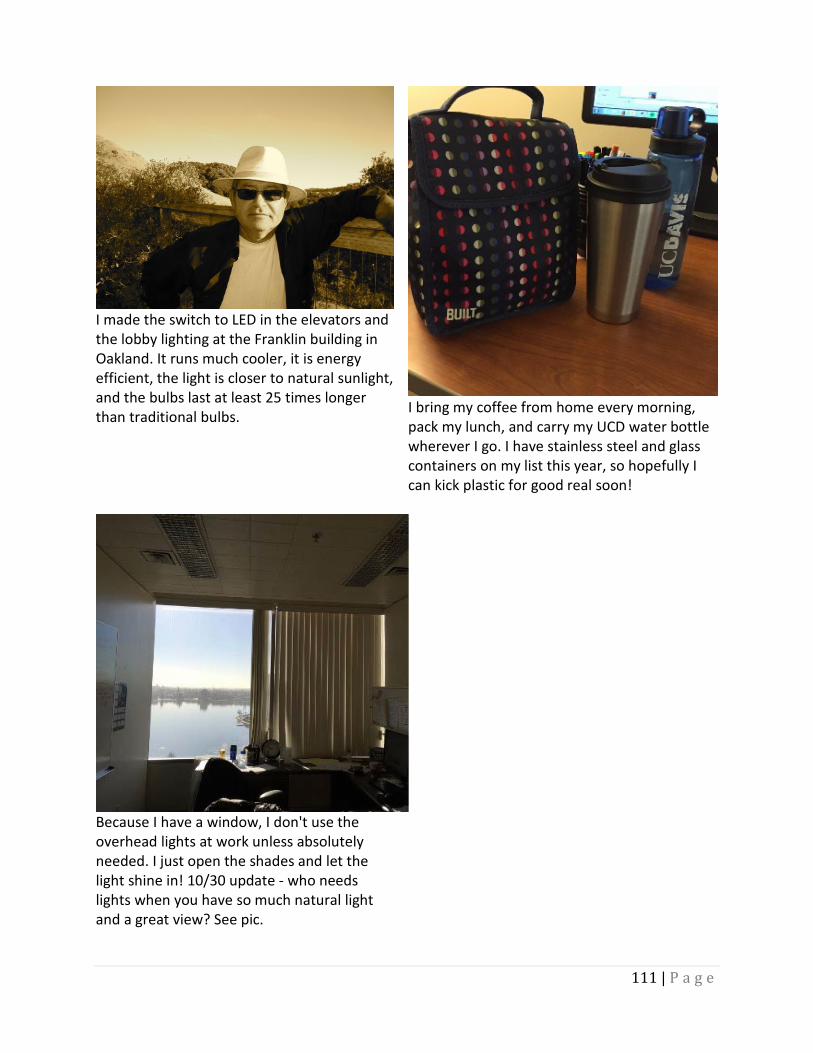
111 | P a g e
I made the switch to LED in the elevators and the lobby lighting at the Franklin building in Oakland. It runs much cooler, it is energy efficient, the light is closer to natural sunlight, and the bulbs last at least 25 times longer than traditional bulbs.
I bring my coffee from home every morning, pack my lunch, and carry my UCD water bottle wherever I go. I have stainless steel and glass containers on my list this year, so hopefully I can kick plastic for good real soon!
Because I have a window, I don't use the overhead lights at work unless absolutely needed. I just open the shades and let the light shine in! 10/30 update - who needs lights when you have so much natural light and a great view? See pic.
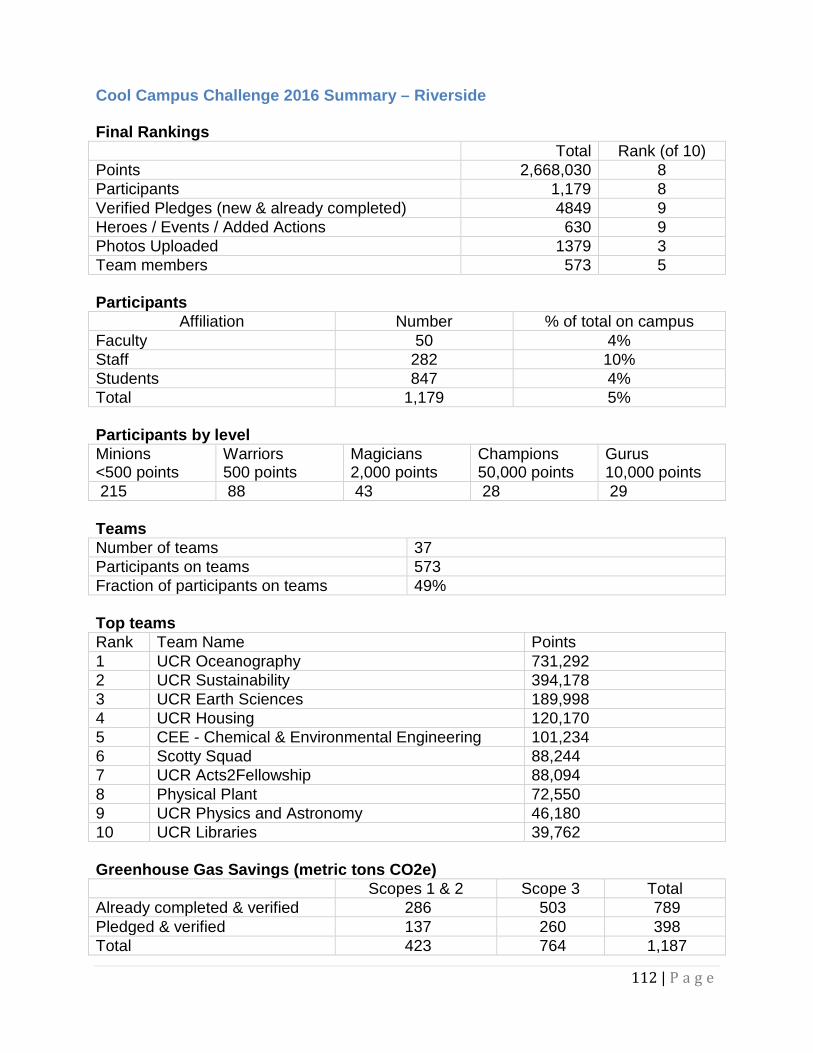
112 | P a g e
Cool Campus Challenge 2016 Summary – Riverside Final Rankings Total Rank (of 10) Points 2,668,030 8 Participants 1,179 8 Verified Pledges (new & already completed) 4849 9 Heroes / Events / Added Actions 630 9 Photos Uploaded 1379 3 Team members 573 5 Participants
Affiliation Number % of total on campus Faculty 50 4% Staff 282 10% Students 847 4% Total 1,179 5% Participants by level Minions <500 points
Warriors 500 points
Magicians 2,000 points
Champions 50,000 points
Gurus 10,000 points
215 88 43 28 29 Teams Number of teams 37 Participants on teams 573 Fraction of participants on teams 49% Top teams Rank Team Name Points 1 UCR Oceanography 731,292 2 UCR Sustainability 394,178 3 UCR Earth Sciences 189,998 4 UCR Housing 120,170 5 CEE - Chemical & Environmental Engineering 101,234 6 Scotty Squad 88,244 7 UCR Acts2Fellowship 88,094 8 Physical Plant 72,550 9 UCR Physics and Astronomy 46,180 10 UCR Libraries 39,762 Greenhouse Gas Savings (metric tons CO2e)
Scopes 1 & 2 Scope 3 Total Already completed & verified 286 503 789 Pledged & verified 137 260 398 Total 423 764 1,187
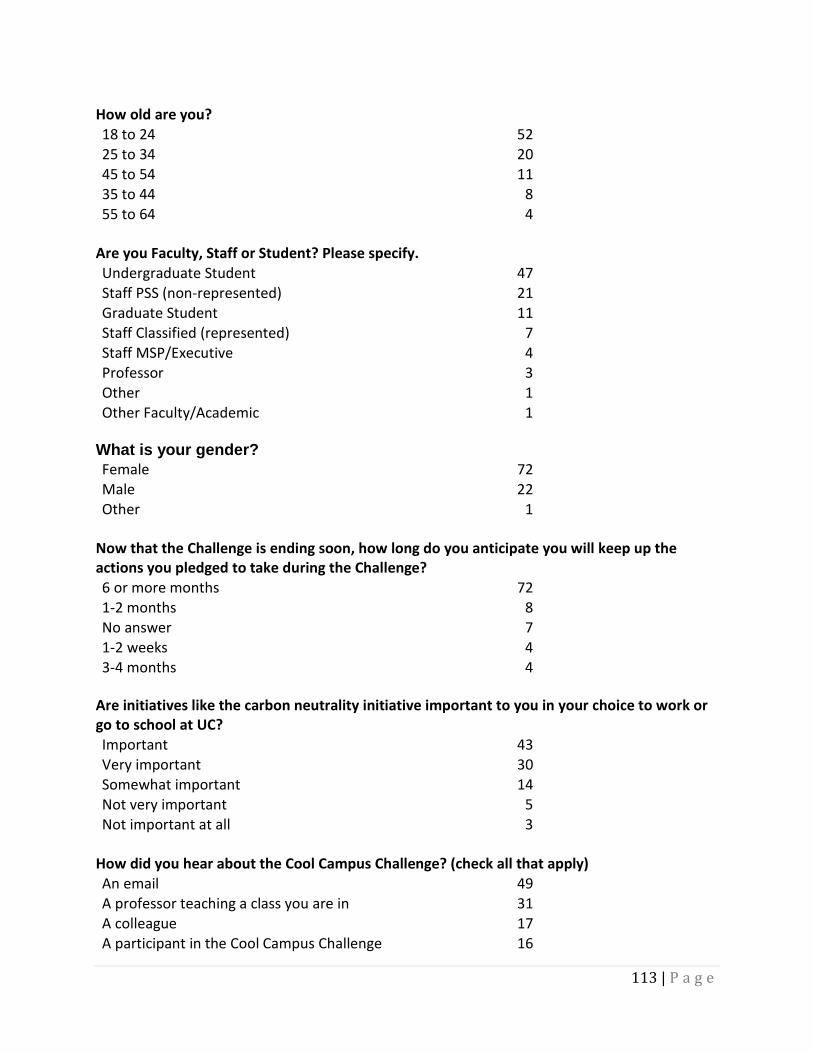
113 | P a g e
How old are you? 18 to 24 52 25 to 34 20 45 to 54 11 35 to 44 8 55 to 64 4
Are you Faculty, Staff or Student? Please specify. Undergraduate Student 47 Staff PSS (non-represented) 21 Graduate Student 11 Staff Classified (represented) 7 Staff MSP/Executive 4 Professor 3 Other 1 Other Faculty/Academic 1
What is your gender? Female 72 Male 22 Other 1
Now that the Challenge is ending soon, how long do you anticipate you will keep up the actions you pledged to take during the Challenge? 6 or more months 72 1-2 months 8 No answer 7 1-2 weeks 4 3-4 months 4
Are initiatives like the carbon neutrality initiative important to you in your choice to work or go to school at UC? Important 43 Very important 30 Somewhat important 14 Not very important 5 Not important at all 3
How did you hear about the Cool Campus Challenge? (check all that apply) An email 49 A professor teaching a class you are in 31 A colleague 17 A participant in the Cool Campus Challenge 16
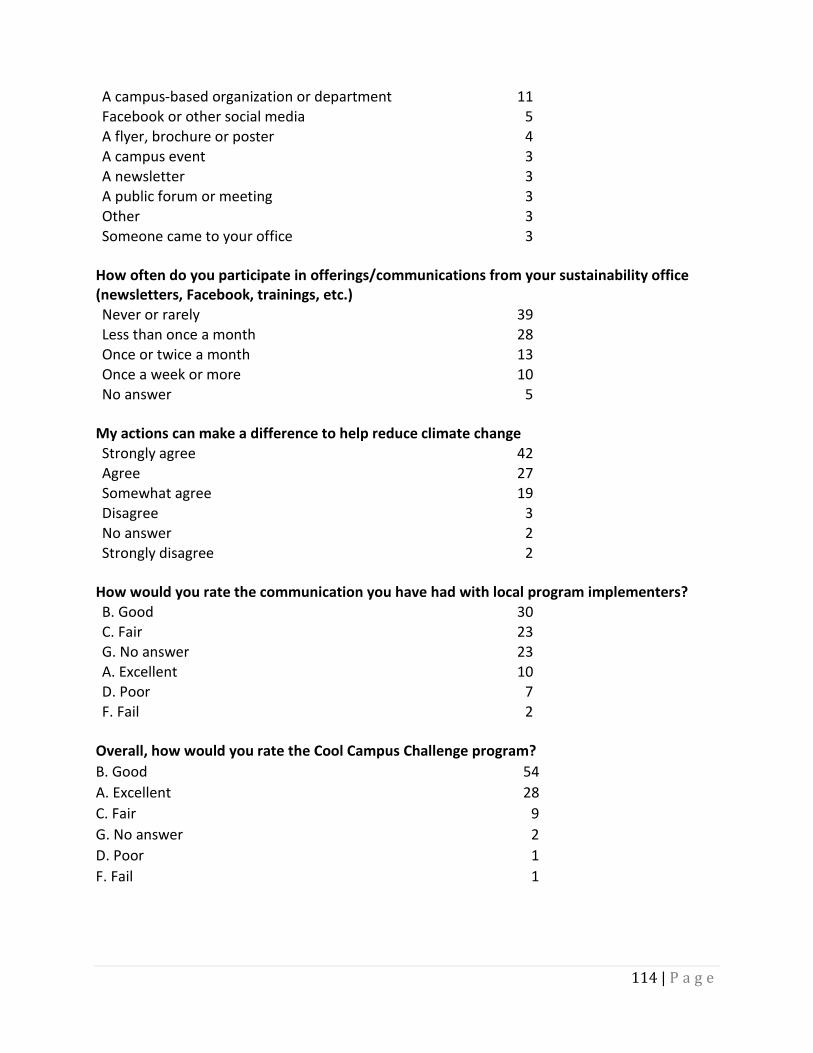
114 | P a g e
A campus-based organization or department 11 Facebook or other social media 5 A flyer, brochure or poster 4 A campus event 3 A newsletter 3 A public forum or meeting 3 Other 3 Someone came to your office 3
How often do you participate in offerings/communications from your sustainability office (newsletters, Facebook, trainings, etc.) Never or rarely 39 Less than once a month 28 Once or twice a month 13 Once a week or more 10 No answer 5
My actions can make a difference to help reduce climate change Strongly agree 42 Agree 27 Somewhat agree 19 Disagree 3 No answer 2 Strongly disagree 2
How would you rate the communication you have had with local program implementers? B. Good 30 C. Fair 23 G. No answer 23 A. Excellent 10 D. Poor 7 F. Fail 2
Overall, how would you rate the Cool Campus Challenge program? B. Good 54 A. Excellent 28 C. Fair 9 G. No answer 2 D. Poor 1 F. Fail 1
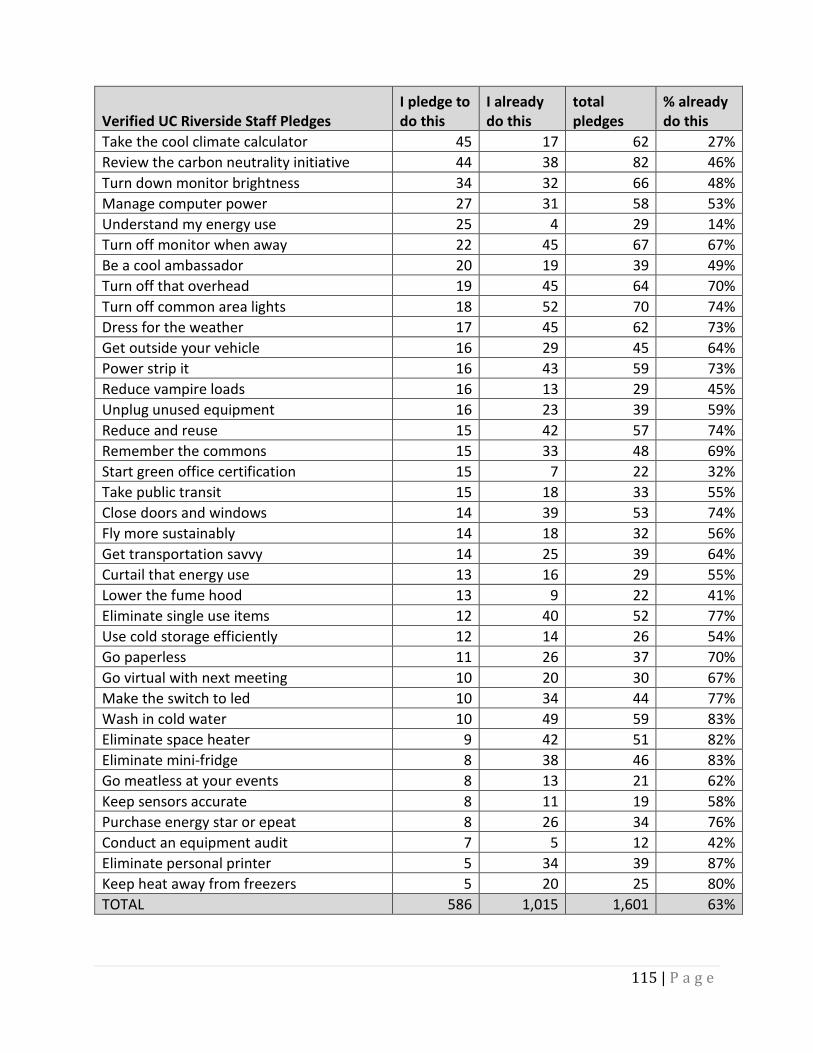
115 | P a g e
Verified UC Riverside Staff Pledges I pledge to do this
I already do this
total pledges
% already do this
Take the cool climate calculator 45 17 62 27% Review the carbon neutrality initiative 44 38 82 46% Turn down monitor brightness 34 32 66 48% Manage computer power 27 31 58 53% Understand my energy use 25 4 29 14% Turn off monitor when away 22 45 67 67% Be a cool ambassador 20 19 39 49% Turn off that overhead 19 45 64 70% Turn off common area lights 18 52 70 74% Dress for the weather 17 45 62 73% Get outside your vehicle 16 29 45 64% Power strip it 16 43 59 73% Reduce vampire loads 16 13 29 45% Unplug unused equipment 16 23 39 59% Reduce and reuse 15 42 57 74% Remember the commons 15 33 48 69% Start green office certification 15 7 22 32% Take public transit 15 18 33 55% Close doors and windows 14 39 53 74% Fly more sustainably 14 18 32 56% Get transportation savvy 14 25 39 64% Curtail that energy use 13 16 29 55% Lower the fume hood 13 9 22 41% Eliminate single use items 12 40 52 77% Use cold storage efficiently 12 14 26 54% Go paperless 11 26 37 70% Go virtual with next meeting 10 20 30 67% Make the switch to led 10 34 44 77% Wash in cold water 10 49 59 83% Eliminate space heater 9 42 51 82% Eliminate mini-fridge 8 38 46 83% Go meatless at your events 8 13 21 62% Keep sensors accurate 8 11 19 58% Purchase energy star or epeat 8 26 34 76% Conduct an equipment audit 7 5 12 42% Eliminate personal printer 5 34 39 87% Keep heat away from freezers 5 20 25 80% TOTAL 586 1,015 1,601 63%
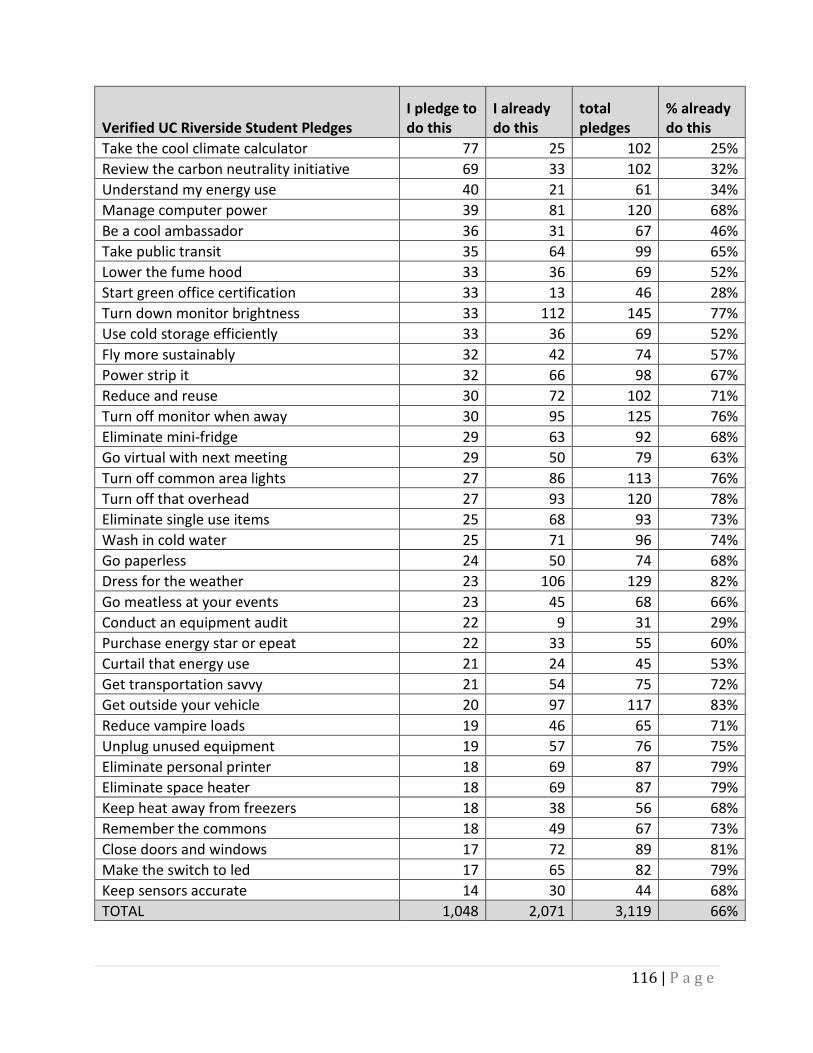
116 | P a g e
Verified UC Riverside Student Pledges I pledge to do this
I already do this
total pledges
% already do this
Take the cool climate calculator 77 25 102 25% Review the carbon neutrality initiative 69 33 102 32% Understand my energy use 40 21 61 34% Manage computer power 39 81 120 68% Be a cool ambassador 36 31 67 46% Take public transit 35 64 99 65% Lower the fume hood 33 36 69 52% Start green office certification 33 13 46 28% Turn down monitor brightness 33 112 145 77% Use cold storage efficiently 33 36 69 52% Fly more sustainably 32 42 74 57% Power strip it 32 66 98 67% Reduce and reuse 30 72 102 71% Turn off monitor when away 30 95 125 76% Eliminate mini-fridge 29 63 92 68% Go virtual with next meeting 29 50 79 63% Turn off common area lights 27 86 113 76% Turn off that overhead 27 93 120 78% Eliminate single use items 25 68 93 73% Wash in cold water 25 71 96 74% Go paperless 24 50 74 68% Dress for the weather 23 106 129 82% Go meatless at your events 23 45 68 66% Conduct an equipment audit 22 9 31 29% Purchase energy star or epeat 22 33 55 60% Curtail that energy use 21 24 45 53% Get transportation savvy 21 54 75 72% Get outside your vehicle 20 97 117 83% Reduce vampire loads 19 46 65 71% Unplug unused equipment 19 57 76 75% Eliminate personal printer 18 69 87 79% Eliminate space heater 18 69 87 79% Keep heat away from freezers 18 38 56 68% Remember the commons 18 49 67 73% Close doors and windows 17 72 89 81% Make the switch to led 17 65 82 79% Keep sensors accurate 14 30 44 68% TOTAL 1,048 2,071 3,119 66%
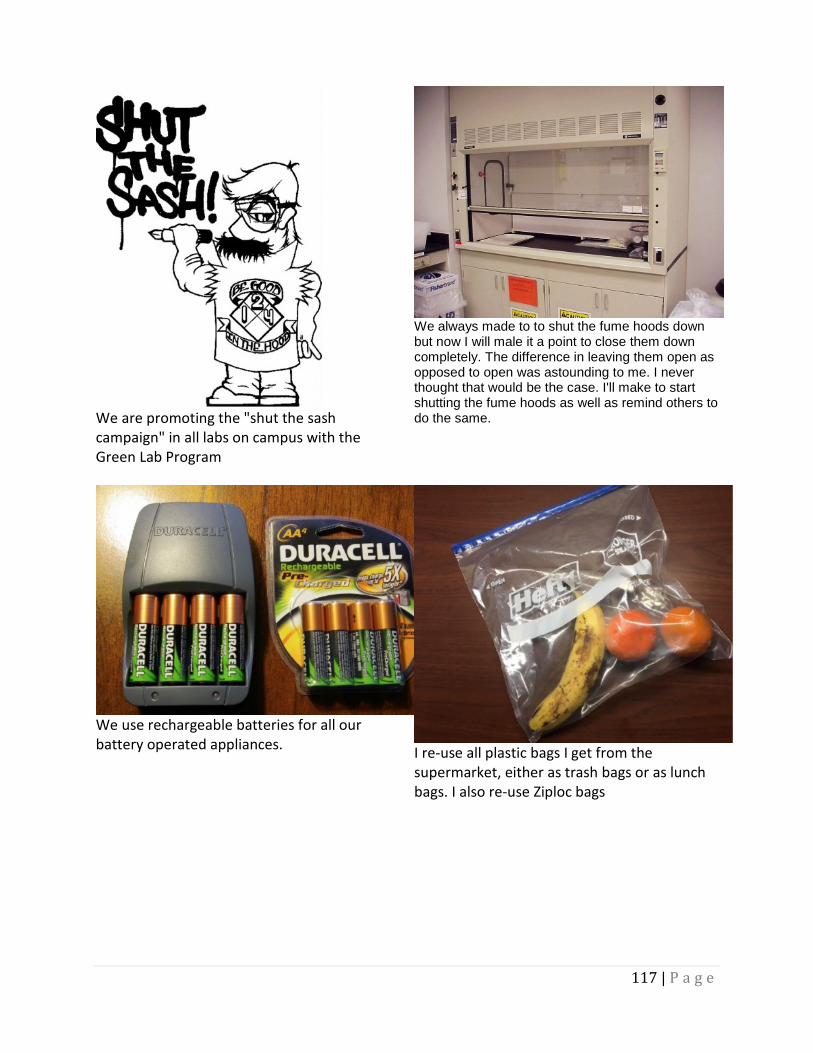
117 | P a g e
We are promoting the "shut the sash campaign" in all labs on campus with the Green Lab Program
We always made to to shut the fume hoods down but now I will male it a point to close them down completely. The difference in leaving them open as opposed to open was astounding to me. I never thought that would be the case. I'll make to start shutting the fume hoods as well as remind others to do the same.
We use rechargeable batteries for all our battery operated appliances. I re-use all plastic bags I get from the
supermarket, either as trash bags or as lunch bags. I also re-use Ziploc bags
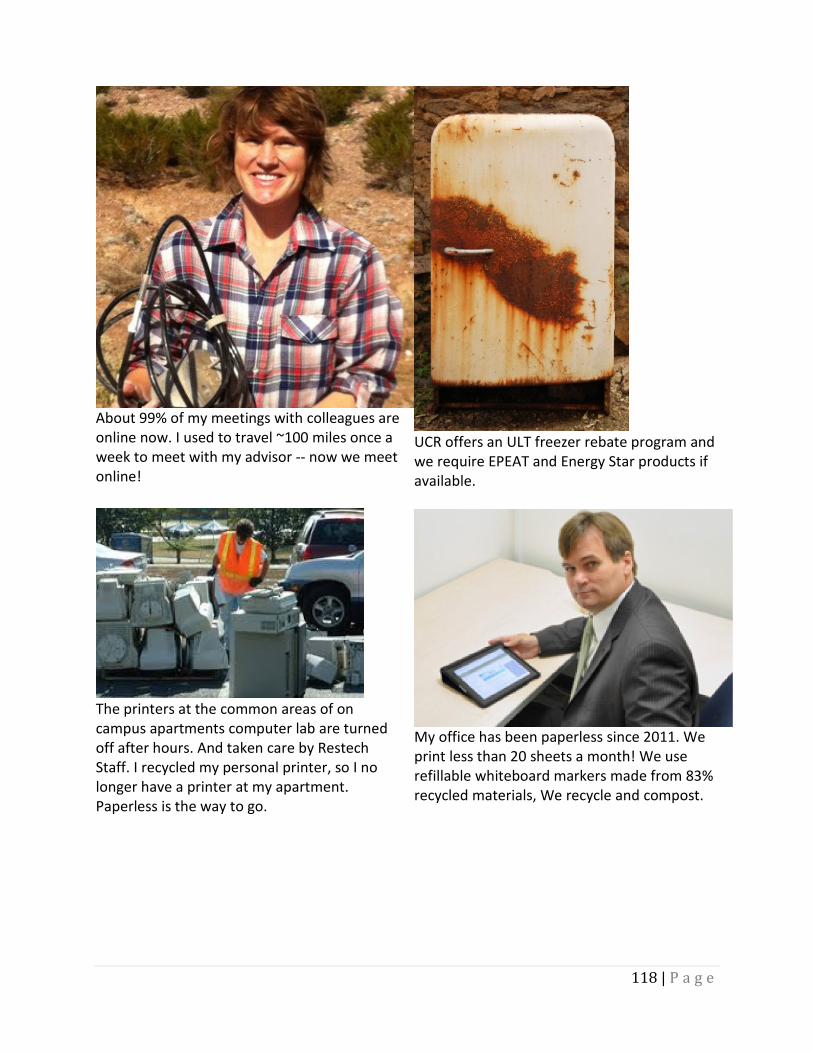
118 | P a g e
About 99% of my meetings with colleagues are online now. I used to travel ~100 miles once a week to meet with my advisor -- now we meet online!
UCR offers an ULT freezer rebate program and we require EPEAT and Energy Star products if available.
The printers at the common areas of on campus apartments computer lab are turned off after hours. And taken care by Restech Staff. I recycled my personal printer, so I no longer have a printer at my apartment. Paperless is the way to go.
My office has been paperless since 2011. We print less than 20 sheets a month! We use refillable whiteboard markers made from 83% recycled materials, We recycle and compost.
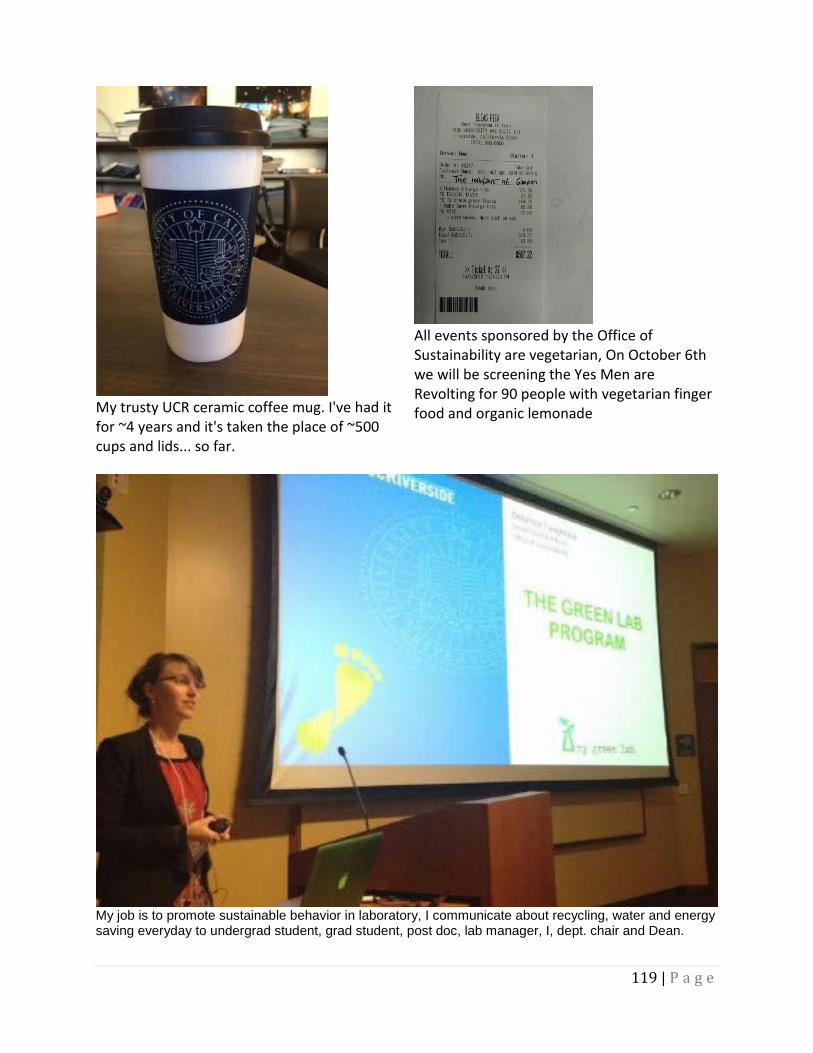
119 | P a g e
My trusty UCR ceramic coffee mug. I've had it for ~4 years and it's taken the place of ~500 cups and lids... so far.
All events sponsored by the Office of Sustainability are vegetarian, On October 6th we will be screening the Yes Men are Revolting for 90 people with vegetarian finger food and organic lemonade
My job is to promote sustainable behavior in laboratory, I communicate about recycling, water and energy saving everyday to undergrad student, grad student, post doc, lab manager, I, dept. chair and Dean.

120 | P a g e
Cool Campus Challenge 2015 Summary – San Diego Final Rankings Total Rank (of 10) Points 2,649,530 9th Participants 1,155 9 Verified Pledges (new & already completed) 5136 8 Heroes / Events / Added Actions 644 8 Photos Uploaded 746 8 Team members 388 9 Participants
Affiliation Number % of total on campus Faculty 39 1% Staff 509 4% Students 607 2% Total 1,155 2% Participants by level Minions <500 points
Warriors 500 points
Magicians 2,000 points
Champions 50,000 points
Gurus 10,000 points
772 147 80 78 102 Teams Number of teams 37 Participants on teams 573 Fraction of participants on teams 49% Top teams Rank Team Name Points 1 UCSD BFS 387,262 2 Muir College 142,116 3 UCSD EHS Environmental Affairs 130,772 4 Eleanor Roosevelt College 111,600 5 Warren College 87,188 6 UCSD Sustainability 86,094 7 UCSD Library 78,346 8 SIO 25 76,172 9 Muir College Council (MCC) 74,336 10 UCSD Tzu Ching 50,858 Greenhouse Gas Savings (metric tons CO2e)
Scopes 1 & 2 Scope 3 Total Already completed & verified 286 503 789 Pledged & verified 137 260 398 Total 423 764 1,187
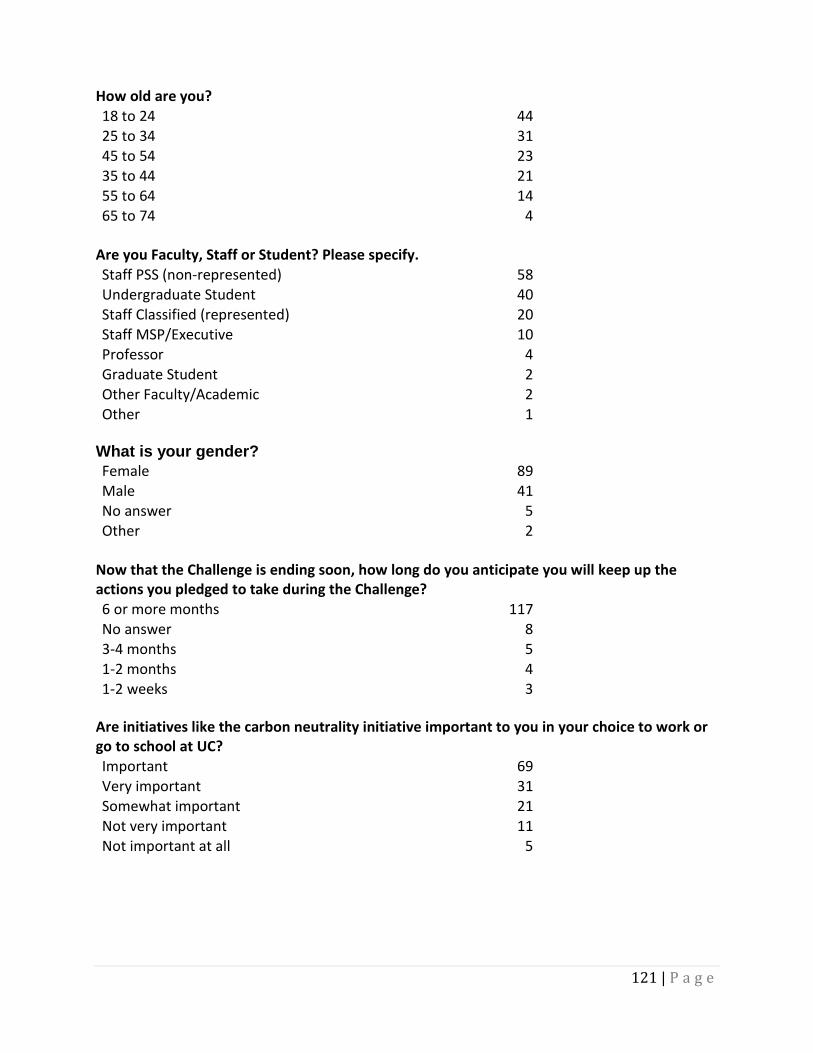
121 | P a g e
How old are you? 18 to 24 44 25 to 34 31 45 to 54 23 35 to 44 21 55 to 64 14 65 to 74 4
Are you Faculty, Staff or Student? Please specify. Staff PSS (non-represented) 58 Undergraduate Student 40 Staff Classified (represented) 20 Staff MSP/Executive 10 Professor 4 Graduate Student 2 Other Faculty/Academic 2 Other 1
What is your gender? Female 89 Male 41 No answer 5 Other 2
Now that the Challenge is ending soon, how long do you anticipate you will keep up the actions you pledged to take during the Challenge? 6 or more months 117 No answer 8 3-4 months 5 1-2 months 4 1-2 weeks 3
Are initiatives like the carbon neutrality initiative important to you in your choice to work or go to school at UC? Important 69 Very important 31 Somewhat important 21 Not very important 11 Not important at all 5
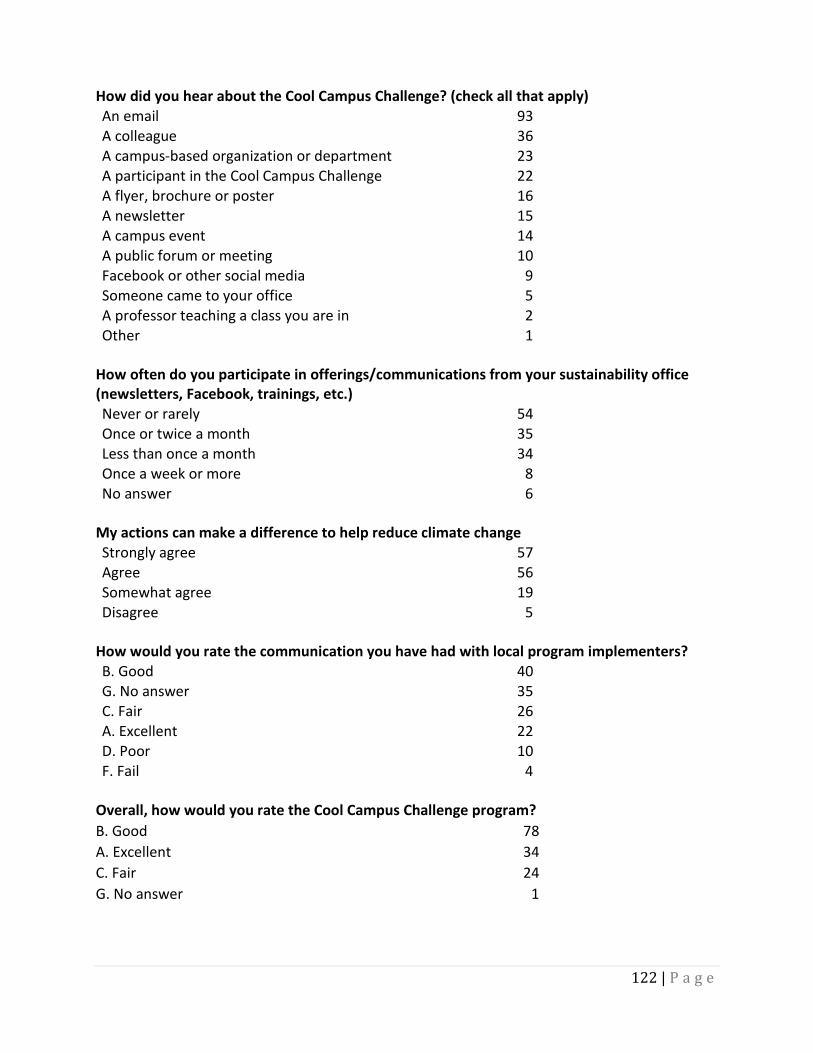
122 | P a g e
How did you hear about the Cool Campus Challenge? (check all that apply) An email 93 A colleague 36 A campus-based organization or department 23 A participant in the Cool Campus Challenge 22 A flyer, brochure or poster 16 A newsletter 15 A campus event 14 A public forum or meeting 10 Facebook or other social media 9 Someone came to your office 5 A professor teaching a class you are in 2 Other 1
How often do you participate in offerings/communications from your sustainability office (newsletters, Facebook, trainings, etc.) Never or rarely 54 Once or twice a month 35 Less than once a month 34 Once a week or more 8 No answer 6
My actions can make a difference to help reduce climate change Strongly agree 57 Agree 56 Somewhat agree 19 Disagree 5
How would you rate the communication you have had with local program implementers? B. Good 40 G. No answer 35 C. Fair 26 A. Excellent 22 D. Poor 10 F. Fail 4
Overall, how would you rate the Cool Campus Challenge program? B. Good 78 A. Excellent 34 C. Fair 24 G. No answer 1
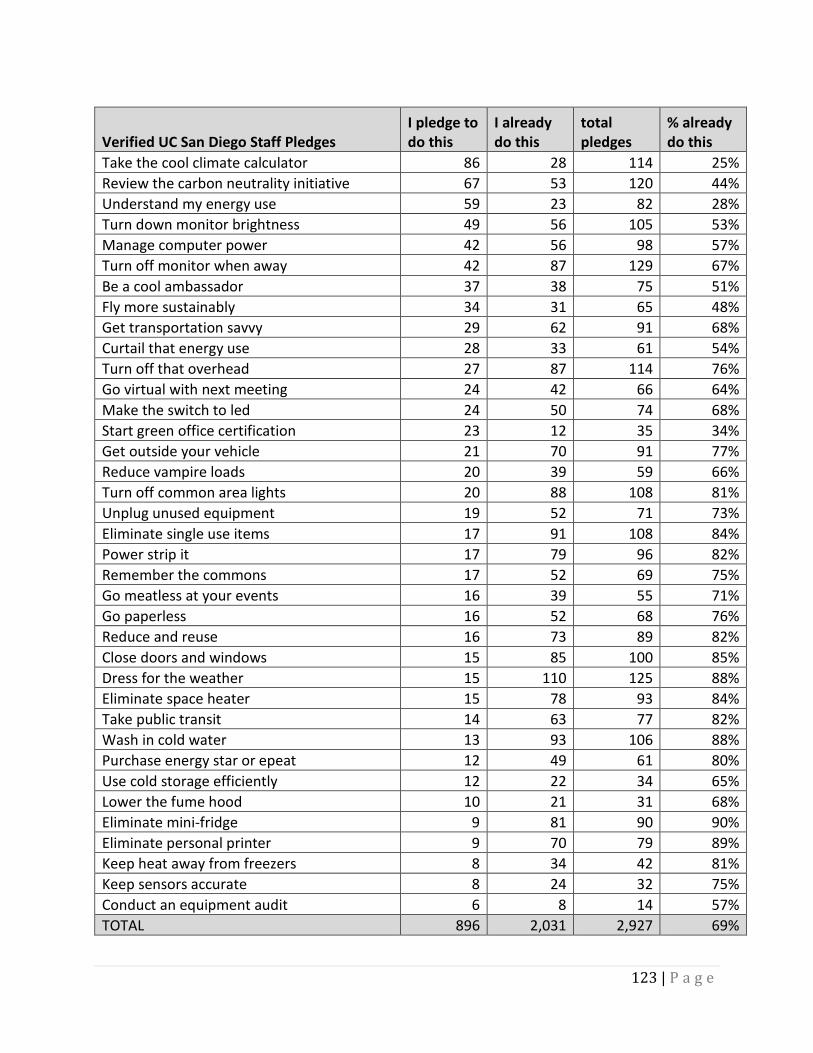
123 | P a g e
Verified UC San Diego Staff Pledges I pledge to do this
I already do this
total pledges
% already do this
Take the cool climate calculator 86 28 114 25% Review the carbon neutrality initiative 67 53 120 44% Understand my energy use 59 23 82 28% Turn down monitor brightness 49 56 105 53% Manage computer power 42 56 98 57% Turn off monitor when away 42 87 129 67% Be a cool ambassador 37 38 75 51% Fly more sustainably 34 31 65 48% Get transportation savvy 29 62 91 68% Curtail that energy use 28 33 61 54% Turn off that overhead 27 87 114 76% Go virtual with next meeting 24 42 66 64% Make the switch to led 24 50 74 68% Start green office certification 23 12 35 34% Get outside your vehicle 21 70 91 77% Reduce vampire loads 20 39 59 66% Turn off common area lights 20 88 108 81% Unplug unused equipment 19 52 71 73% Eliminate single use items 17 91 108 84% Power strip it 17 79 96 82% Remember the commons 17 52 69 75% Go meatless at your events 16 39 55 71% Go paperless 16 52 68 76% Reduce and reuse 16 73 89 82% Close doors and windows 15 85 100 85% Dress for the weather 15 110 125 88% Eliminate space heater 15 78 93 84% Take public transit 14 63 77 82% Wash in cold water 13 93 106 88% Purchase energy star or epeat 12 49 61 80% Use cold storage efficiently 12 22 34 65% Lower the fume hood 10 21 31 68% Eliminate mini-fridge 9 81 90 90% Eliminate personal printer 9 70 79 89% Keep heat away from freezers 8 34 42 81% Keep sensors accurate 8 24 32 75% Conduct an equipment audit 6 8 14 57% TOTAL 896 2,031 2,927 69%
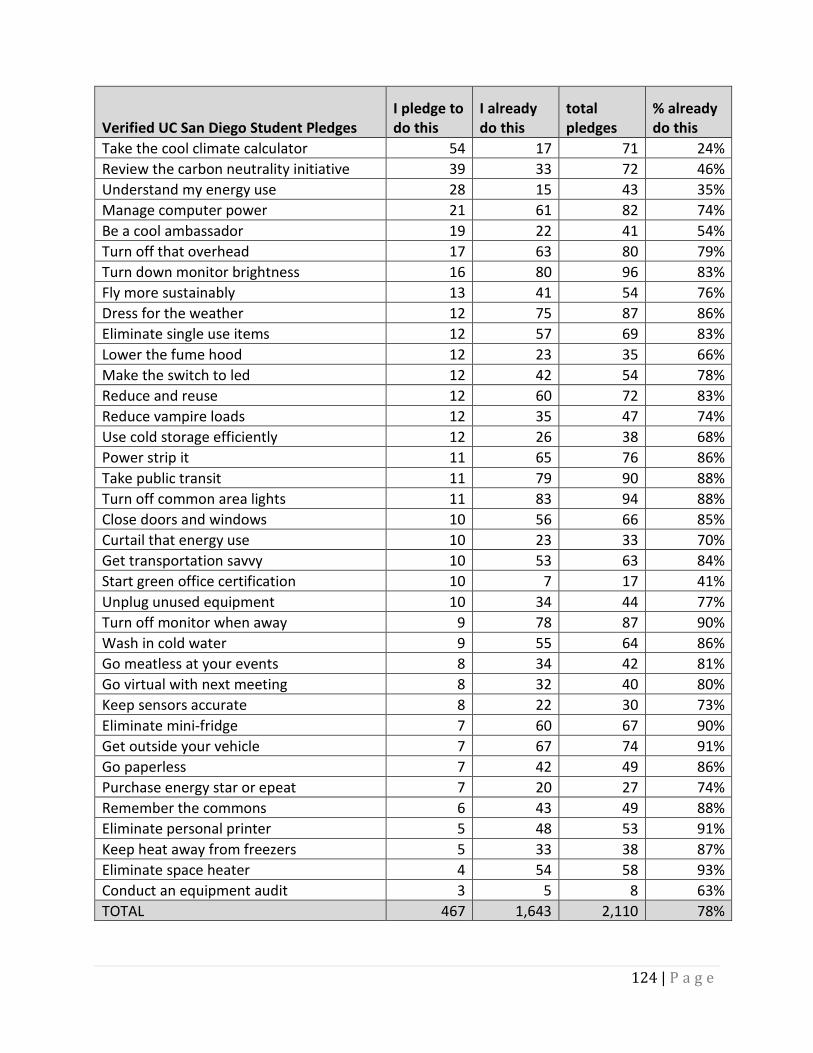
124 | P a g e
Verified UC San Diego Student Pledges I pledge to do this
I already do this
total pledges
% already do this
Take the cool climate calculator 54 17 71 24% Review the carbon neutrality initiative 39 33 72 46% Understand my energy use 28 15 43 35% Manage computer power 21 61 82 74% Be a cool ambassador 19 22 41 54% Turn off that overhead 17 63 80 79% Turn down monitor brightness 16 80 96 83% Fly more sustainably 13 41 54 76% Dress for the weather 12 75 87 86% Eliminate single use items 12 57 69 83% Lower the fume hood 12 23 35 66% Make the switch to led 12 42 54 78% Reduce and reuse 12 60 72 83% Reduce vampire loads 12 35 47 74% Use cold storage efficiently 12 26 38 68% Power strip it 11 65 76 86% Take public transit 11 79 90 88% Turn off common area lights 11 83 94 88% Close doors and windows 10 56 66 85% Curtail that energy use 10 23 33 70% Get transportation savvy 10 53 63 84% Start green office certification 10 7 17 41% Unplug unused equipment 10 34 44 77% Turn off monitor when away 9 78 87 90% Wash in cold water 9 55 64 86% Go meatless at your events 8 34 42 81% Go virtual with next meeting 8 32 40 80% Keep sensors accurate 8 22 30 73% Eliminate mini-fridge 7 60 67 90% Get outside your vehicle 7 67 74 91% Go paperless 7 42 49 86% Purchase energy star or epeat 7 20 27 74% Remember the commons 6 43 49 88% Eliminate personal printer 5 48 53 91% Keep heat away from freezers 5 33 38 87% Eliminate space heater 4 54 58 93% Conduct an equipment audit 3 5 8 63% TOTAL 467 1,643 2,110 78%
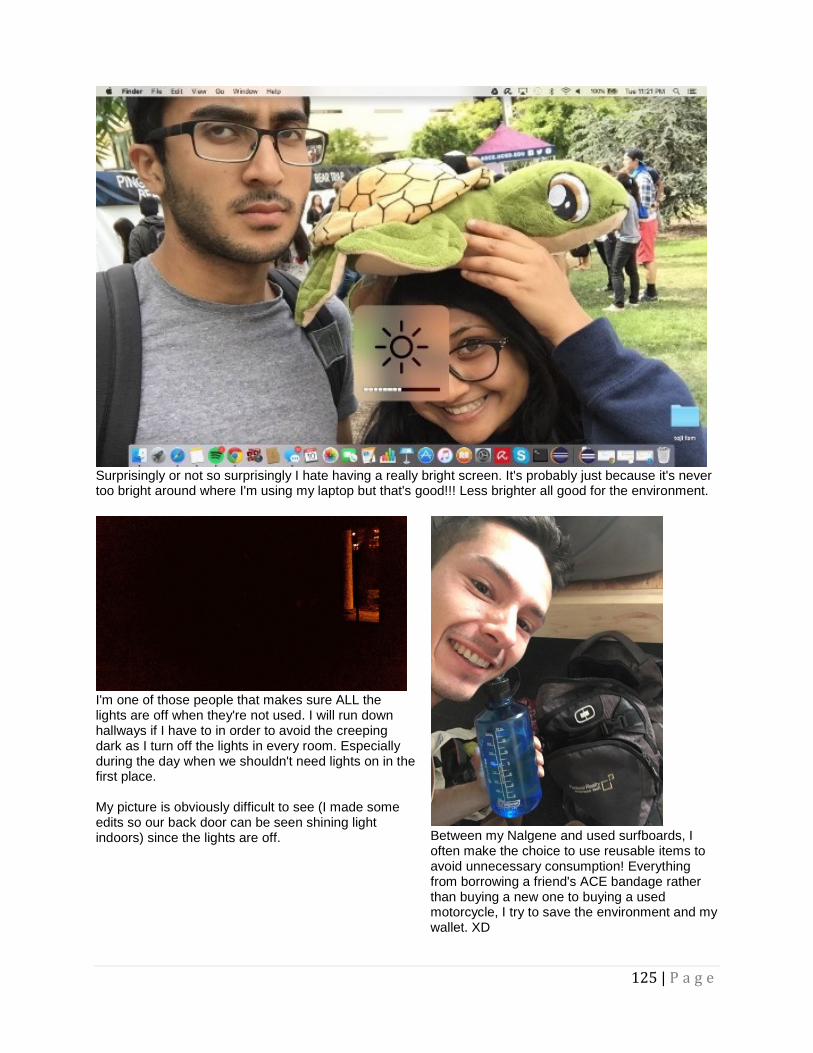
125 | P a g e
Surprisingly or not so surprisingly I hate having a really bright screen. It's probably just because it's never too bright around where I'm using my laptop but that's good!!! Less brighter all good for the environment.
I'm one of those people that makes sure ALL the lights are off when they're not used. I will run down hallways if I have to in order to avoid the creeping dark as I turn off the lights in every room. Especially during the day when we shouldn't need lights on in the first place. My picture is obviously difficult to see (I made some edits so our back door can be seen shining light indoors) since the lights are off.
Between my Nalgene and used surfboards, I often make the choice to use reusable items to avoid unnecessary consumption! Everything from borrowing a friend's ACE bandage rather than buying a new one to buying a used motorcycle, I try to save the environment and my wallet. XD
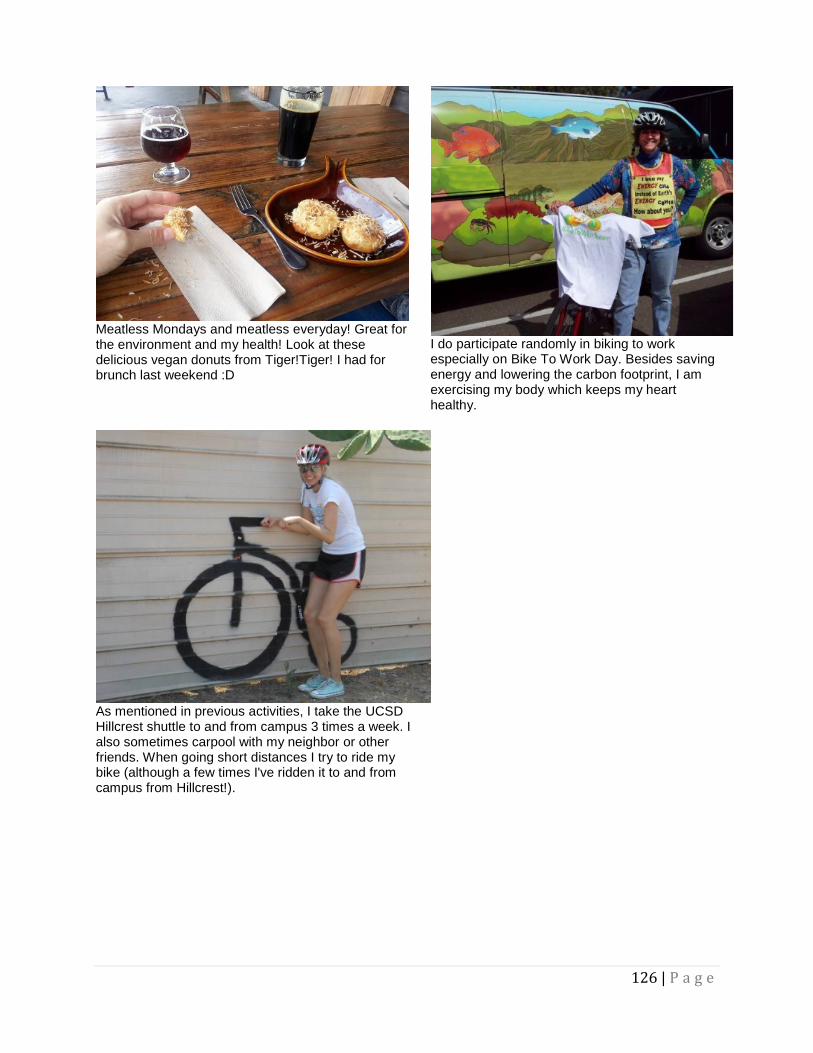
126 | P a g e
Meatless Mondays and meatless everyday! Great for the environment and my health! Look at these delicious vegan donuts from Tiger!Tiger! I had for brunch last weekend :D
I do participate randomly in biking to work especially on Bike To Work Day. Besides saving energy and lowering the carbon footprint, I am exercising my body which keeps my heart healthy.
As mentioned in previous activities, I take the UCSD Hillcrest shuttle to and from campus 3 times a week. I also sometimes carpool with my neighbor or other friends. When going short distances I try to ride my bike (although a few times I've ridden it to and from campus from Hillcrest!).
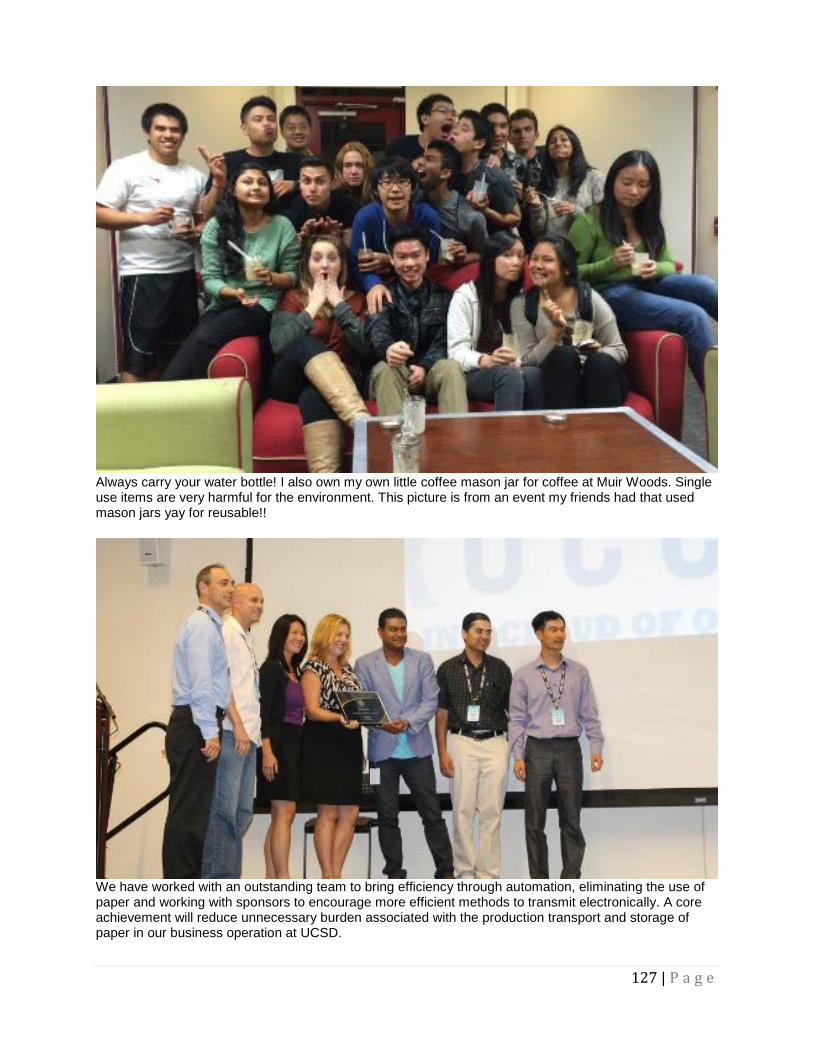
127 | P a g e
Always carry your water bottle! I also own my own little coffee mason jar for coffee at Muir Woods. Single use items are very harmful for the environment. This picture is from an event my friends had that used mason jars yay for reusable!!
We have worked with an outstanding team to bring efficiency through automation, eliminating the use of paper and working with sponsors to encourage more efficient methods to transmit electronically. A core achievement will reduce unnecessary burden associated with the production transport and storage of paper in our business operation at UCSD.
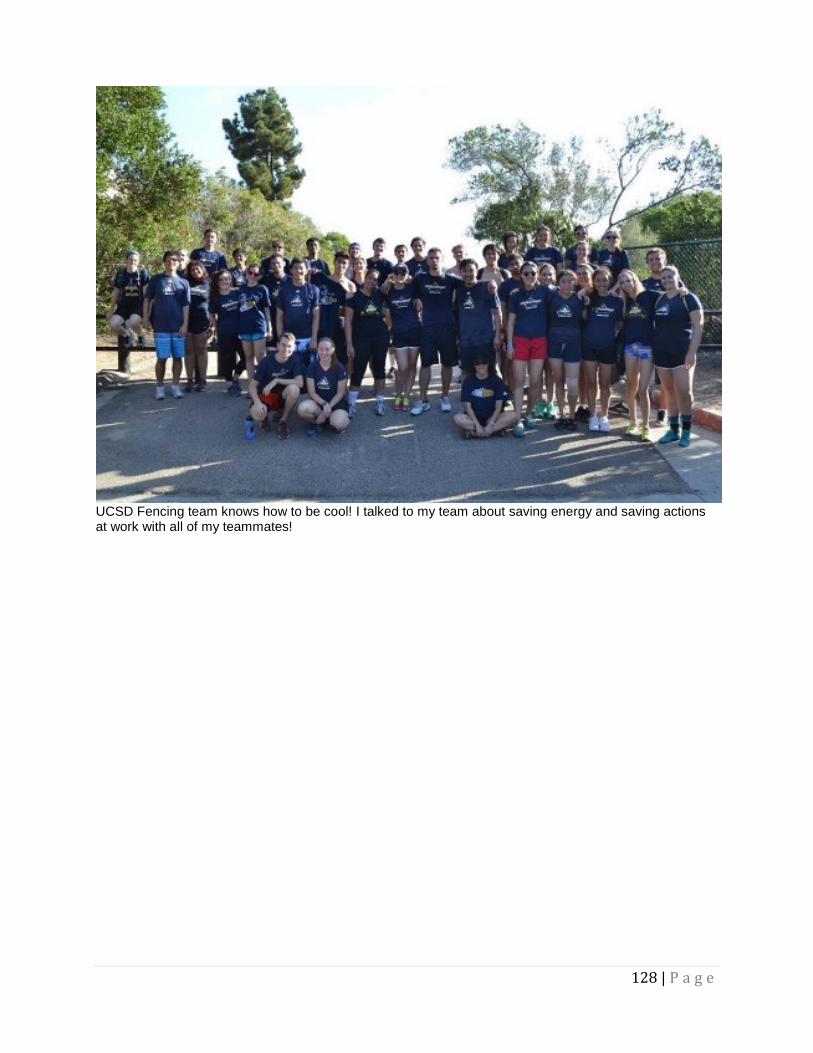
128 | P a g e
UCSD Fencing team knows how to be cool! I talked to my team about saving energy and saving actions at work with all of my teammates!
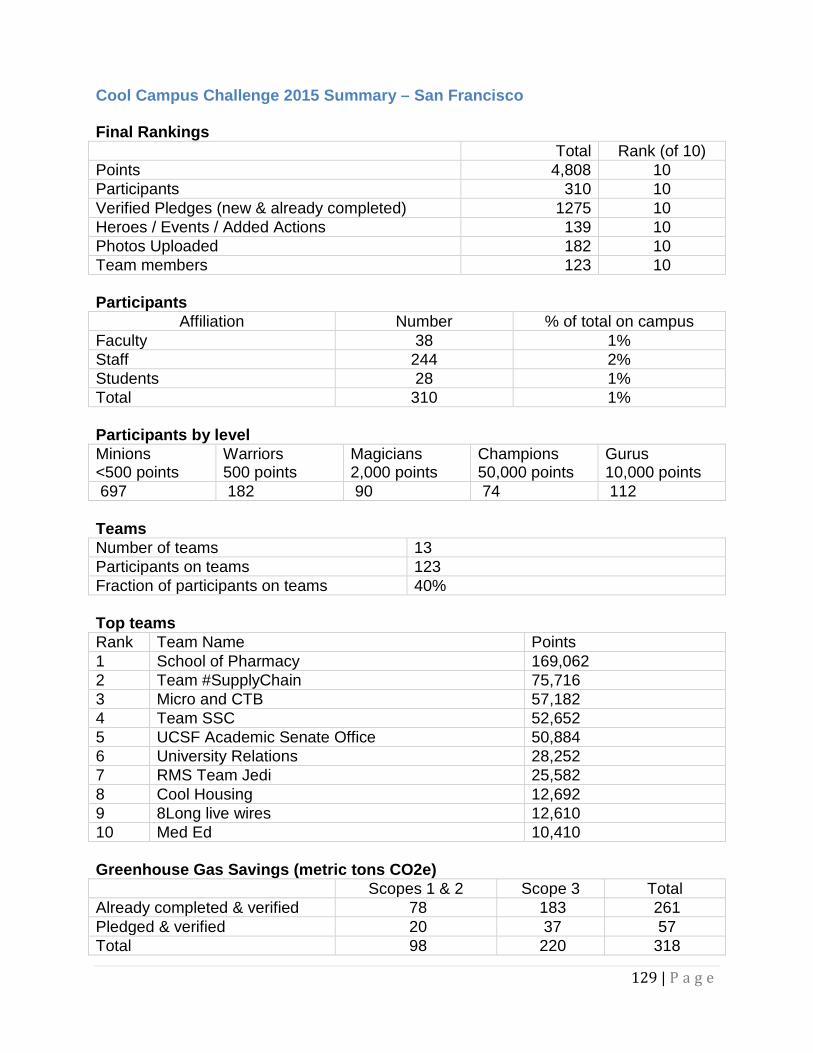
129 | P a g e
Cool Campus Challenge 2015 Summary – San Francisco Final Rankings Total Rank (of 10) Points 4,808 10 Participants 310 10 Verified Pledges (new & already completed) 1275 10 Heroes / Events / Added Actions 139 10 Photos Uploaded 182 10 Team members 123 10 Participants
Affiliation Number % of total on campus Faculty 38 1% Staff 244 2% Students 28 1% Total 310 1% Participants by level Minions <500 points
Warriors 500 points
Magicians 2,000 points
Champions 50,000 points
Gurus 10,000 points
697 182 90 74 112 Teams Number of teams 13 Participants on teams 123 Fraction of participants on teams 40% Top teams Rank Team Name Points 1 School of Pharmacy 169,062 2 Team #SupplyChain 75,716 3 Micro and CTB 57,182 4 Team SSC 52,652 5 UCSF Academic Senate Office 50,884 6 University Relations 28,252 7 RMS Team Jedi 25,582 8 Cool Housing 12,692 9 8Long live wires 12,610 10 Med Ed 10,410 Greenhouse Gas Savings (metric tons CO2e)
Scopes 1 & 2 Scope 3 Total Already completed & verified 78 183 261 Pledged & verified 20 37 57 Total 98 220 318
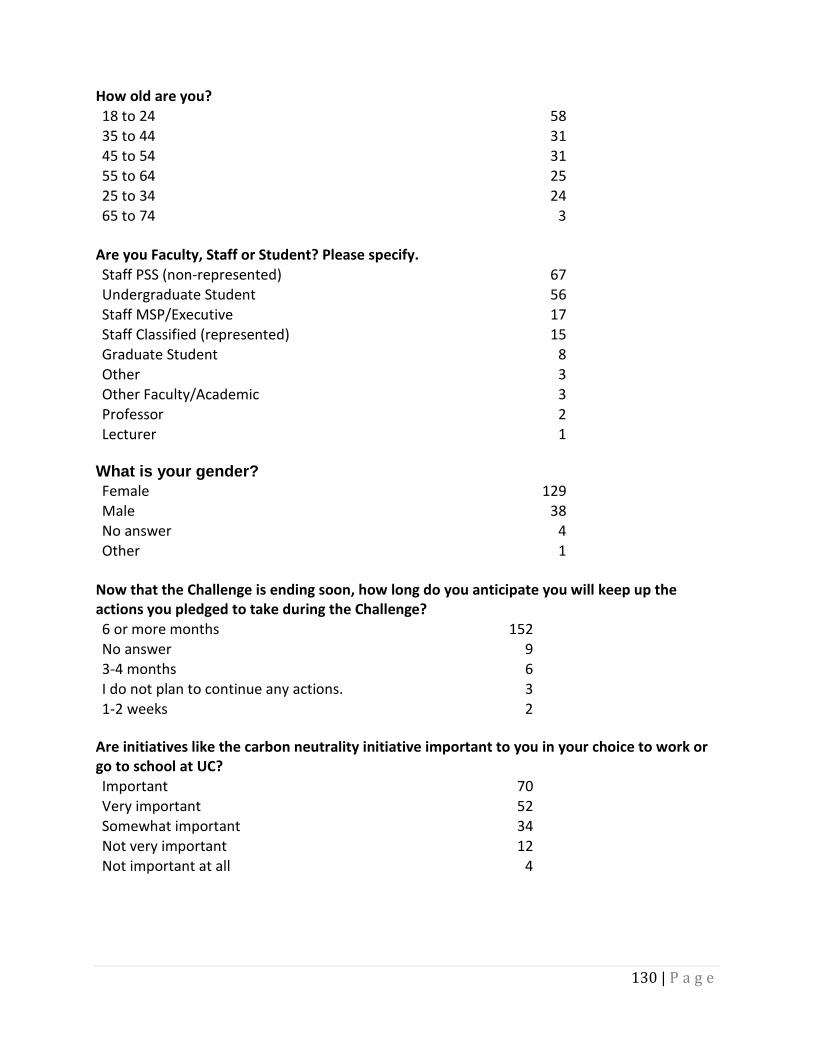
130 | P a g e
How old are you? 18 to 24 58 35 to 44 31 45 to 54 31 55 to 64 25 25 to 34 24 65 to 74 3
Are you Faculty, Staff or Student? Please specify. Staff PSS (non-represented) 67 Undergraduate Student 56 Staff MSP/Executive 17 Staff Classified (represented) 15 Graduate Student 8 Other 3 Other Faculty/Academic 3 Professor 2 Lecturer 1
What is your gender? Female 129 Male 38 No answer 4 Other 1
Now that the Challenge is ending soon, how long do you anticipate you will keep up the actions you pledged to take during the Challenge? 6 or more months 152 No answer 9 3-4 months 6 I do not plan to continue any actions. 3 1-2 weeks 2
Are initiatives like the carbon neutrality initiative important to you in your choice to work or go to school at UC? Important 70 Very important 52 Somewhat important 34 Not very important 12 Not important at all 4
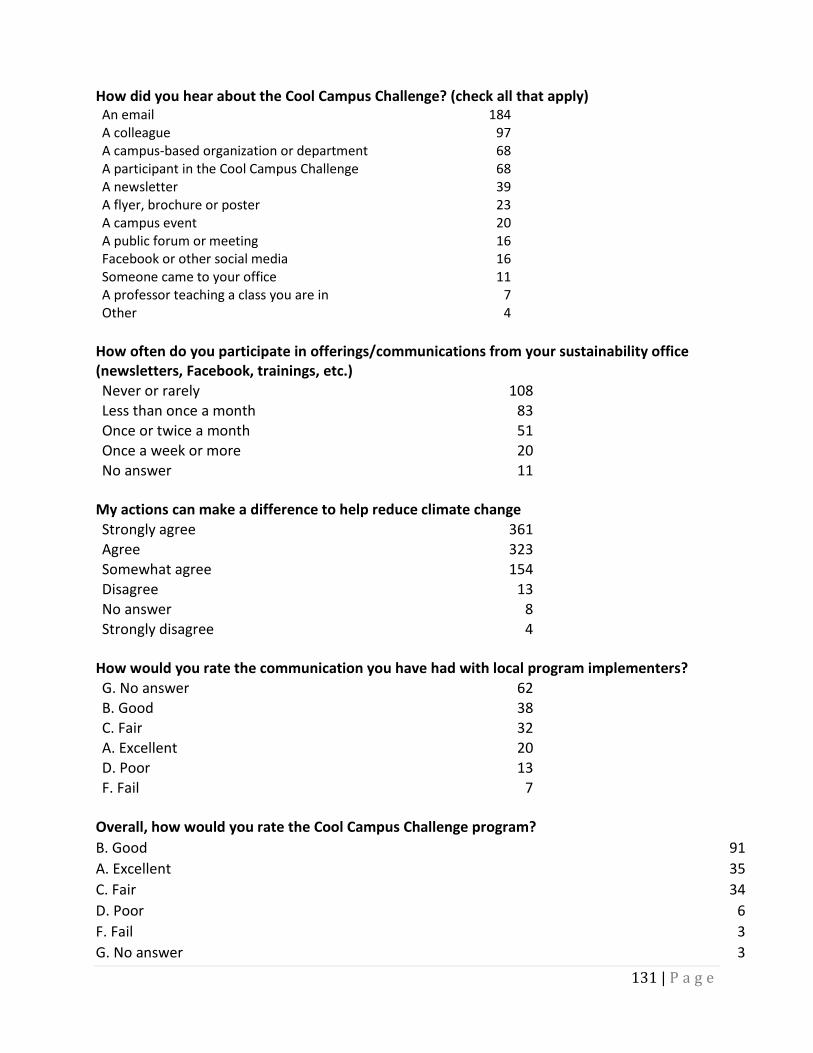
131 | P a g e
How did you hear about the Cool Campus Challenge? (check all that apply) An email 184 A colleague 97 A campus-based organization or department 68 A participant in the Cool Campus Challenge 68 A newsletter 39 A flyer, brochure or poster 23 A campus event 20 A public forum or meeting 16 Facebook or other social media 16 Someone came to your office 11 A professor teaching a class you are in 7 Other 4
How often do you participate in offerings/communications from your sustainability office (newsletters, Facebook, trainings, etc.) Never or rarely 108 Less than once a month 83 Once or twice a month 51 Once a week or more 20 No answer 11
My actions can make a difference to help reduce climate change Strongly agree 361 Agree 323 Somewhat agree 154 Disagree 13 No answer 8 Strongly disagree 4
How would you rate the communication you have had with local program implementers? G. No answer 62 B. Good 38 C. Fair 32 A. Excellent 20 D. Poor 13 F. Fail 7
Overall, how would you rate the Cool Campus Challenge program? B. Good 91 A. Excellent 35 C. Fair 34 D. Poor 6 F. Fail 3 G. No answer 3
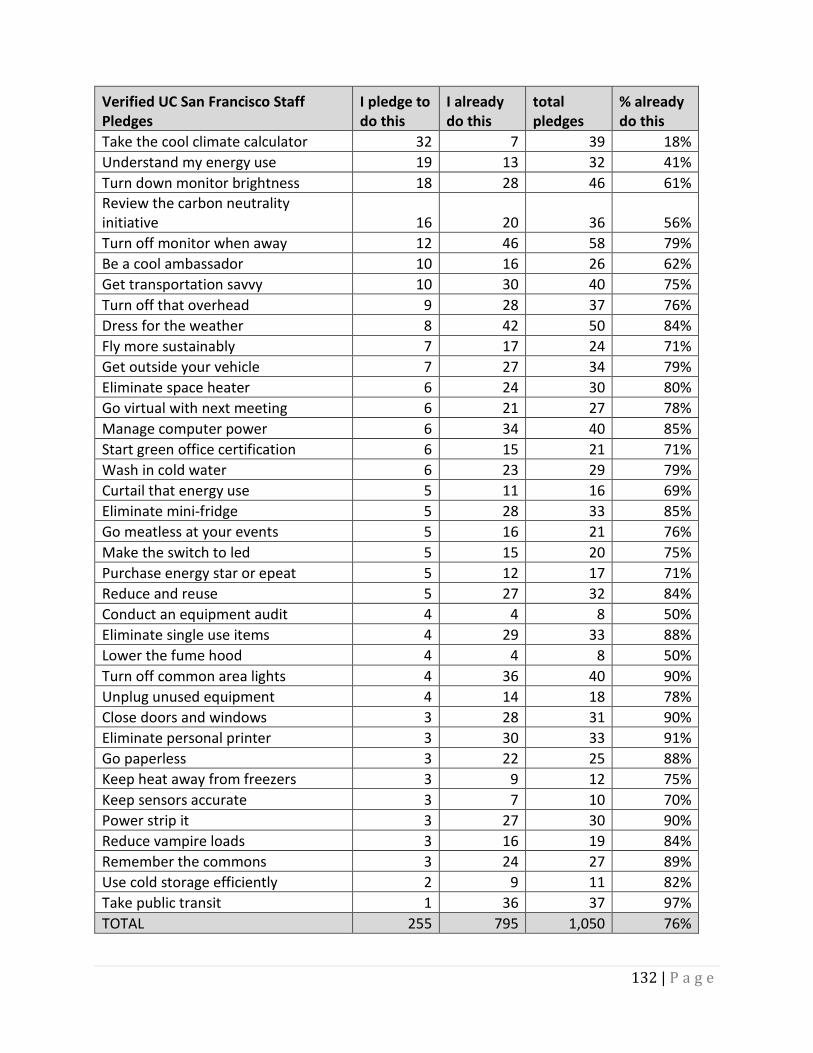
132 | P a g e
Verified UC San Francisco Staff Pledges
I pledge to do this
I already do this
total pledges
% already do this
Take the cool climate calculator 32 7 39 18% Understand my energy use 19 13 32 41% Turn down monitor brightness 18 28 46 61% Review the carbon neutrality initiative 16 20 36 56% Turn off monitor when away 12 46 58 79% Be a cool ambassador 10 16 26 62% Get transportation savvy 10 30 40 75% Turn off that overhead 9 28 37 76% Dress for the weather 8 42 50 84% Fly more sustainably 7 17 24 71% Get outside your vehicle 7 27 34 79% Eliminate space heater 6 24 30 80% Go virtual with next meeting 6 21 27 78% Manage computer power 6 34 40 85% Start green office certification 6 15 21 71% Wash in cold water 6 23 29 79% Curtail that energy use 5 11 16 69% Eliminate mini-fridge 5 28 33 85% Go meatless at your events 5 16 21 76% Make the switch to led 5 15 20 75% Purchase energy star or epeat 5 12 17 71% Reduce and reuse 5 27 32 84% Conduct an equipment audit 4 4 8 50% Eliminate single use items 4 29 33 88% Lower the fume hood 4 4 8 50% Turn off common area lights 4 36 40 90% Unplug unused equipment 4 14 18 78% Close doors and windows 3 28 31 90% Eliminate personal printer 3 30 33 91% Go paperless 3 22 25 88% Keep heat away from freezers 3 9 12 75% Keep sensors accurate 3 7 10 70% Power strip it 3 27 30 90% Reduce vampire loads 3 16 19 84% Remember the commons 3 24 27 89% Use cold storage efficiently 2 9 11 82% Take public transit 1 36 37 97% TOTAL 255 795 1,050 76%
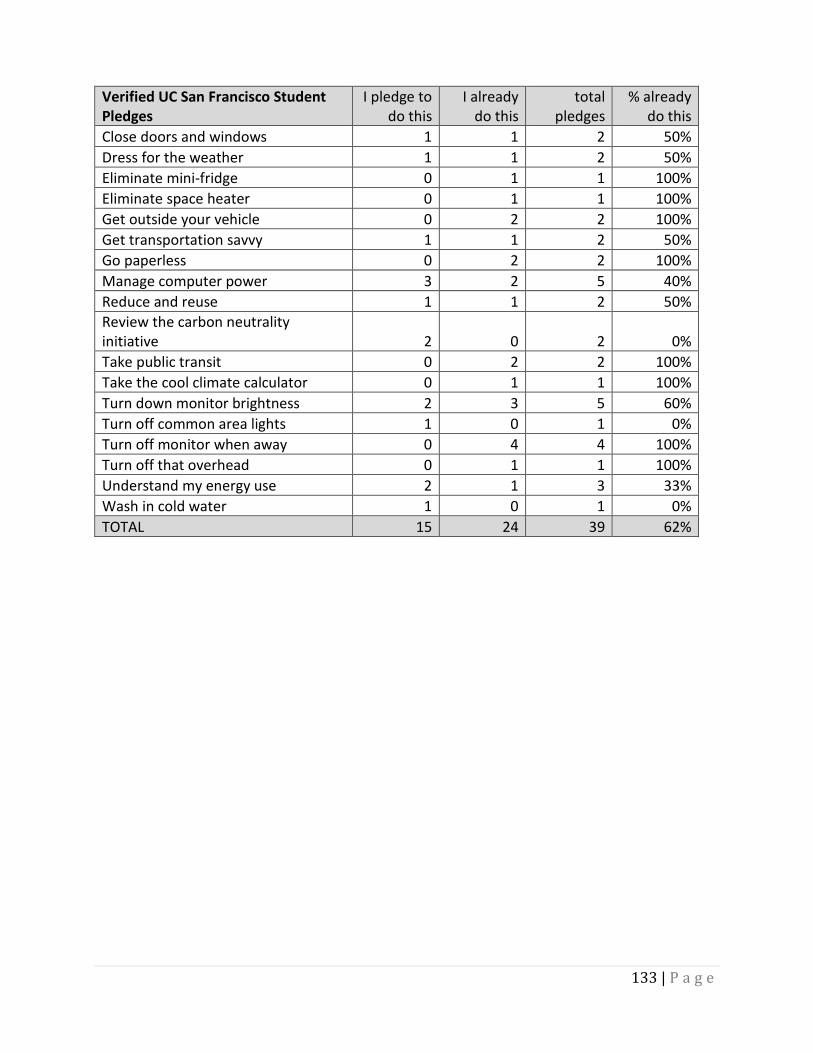
133 | P a g e
Verified UC San Francisco Student Pledges
I pledge to do this
I already do this
total pledges
% already do this
Close doors and windows 1 1 2 50% Dress for the weather 1 1 2 50% Eliminate mini-fridge 0 1 1 100% Eliminate space heater 0 1 1 100% Get outside your vehicle 0 2 2 100% Get transportation savvy 1 1 2 50% Go paperless 0 2 2 100% Manage computer power 3 2 5 40% Reduce and reuse 1 1 2 50% Review the carbon neutrality initiative 2 0 2 0% Take public transit 0 2 2 100% Take the cool climate calculator 0 1 1 100% Turn down monitor brightness 2 3 5 60% Turn off common area lights 1 0 1 0% Turn off monitor when away 0 4 4 100% Turn off that overhead 0 1 1 100% Understand my energy use 2 1 3 33% Wash in cold water 1 0 1 0% TOTAL 15 24 39 62%
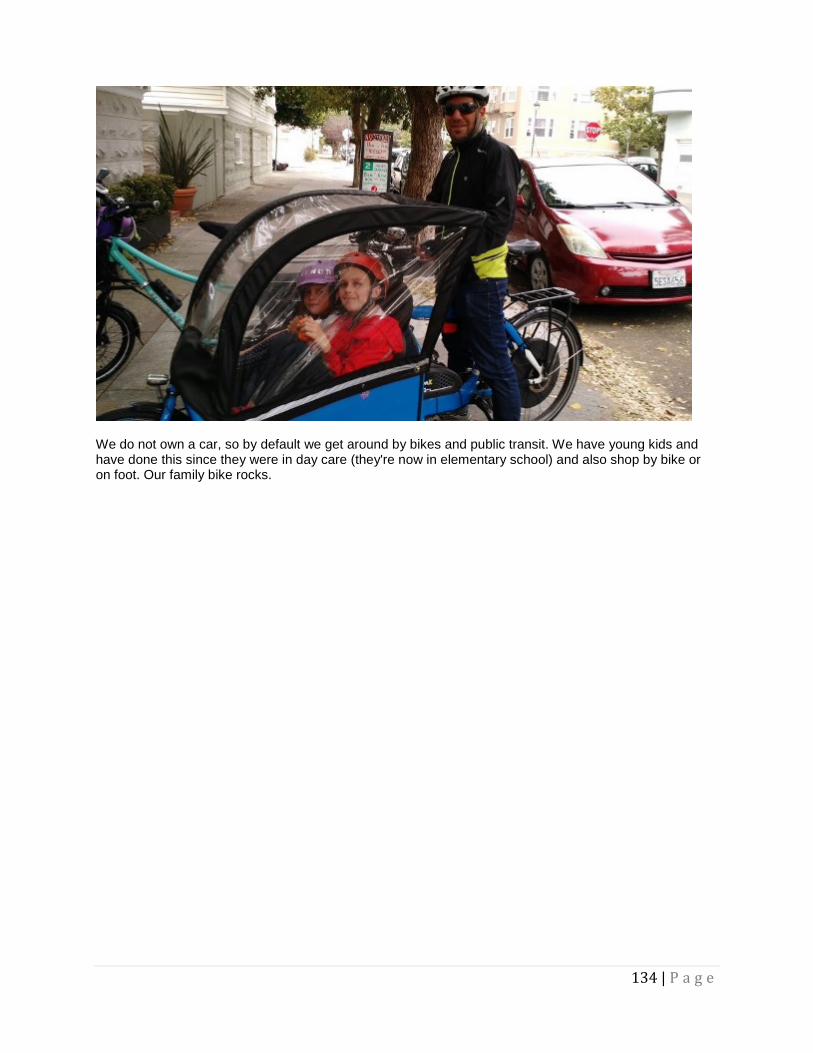
134 | P a g e
We do not own a car, so by default we get around by bikes and public transit. We have young kids and have done this since they were in day care (they're now in elementary school) and also shop by bike or on foot. Our family bike rocks.

135 | P a g e
Cool Campus Challenge 2016 Summary – Santa Barbara Final Rankings Total Rank (of 10) Points 3,807,854 6 Participants 1,423 7 Verified Pledges (new & already completed) 7351 6 Heroes / Events / Added Actions 919 6 Photos Uploaded 1102 5 Team members 576 4 Participants
Affiliation Number % of total on campus Faculty 25 2% Staff 509 14% Students 889 4% Total 1423 2% Participants by level Minions <500 points
Warriors 500 points
Magicians 2,000 points
Champions 50,000 points
Gurus 10,000 points
181 52 27 27 23 Teams Number of teams 72 Participants on teams 576 Fraction of participants on teams 40% Top teams Rank Team Name Points 1 Environmental Affairs Board 328,258 2 RHA Coord. Board 247,402 3 Human Resources 230,326 4 UCen 212,252 5 San Cat 7th North Floor 195,532 6 Geography 161,884 7 Business & Financial Services 111,232 8 Facilities Management 84,566 9 Library 74,486 10 Student Health 67,516 Greenhouse Gas Savings (metric tons CO2e)
Scopes 1 & 2 Scope 3 Total Already completed & verified 441 773 1,215 Pledged & verified 179 303 482 Total 621 1,076 1,696
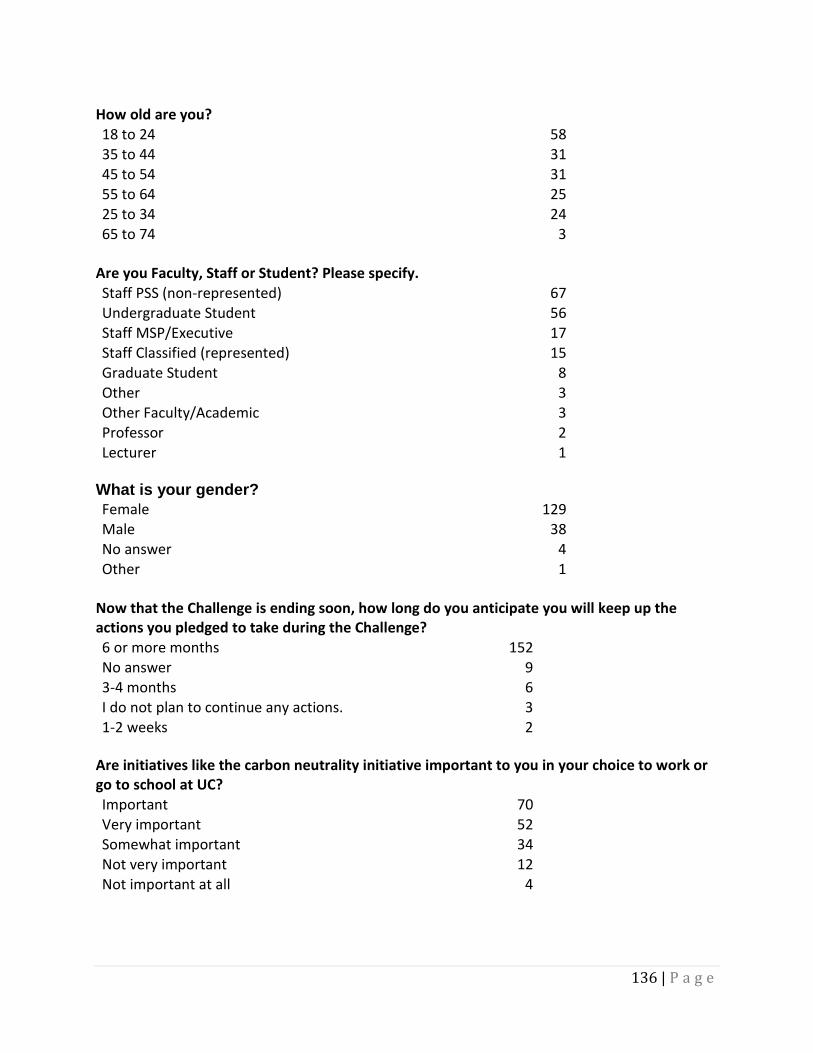
136 | P a g e
How old are you? 18 to 24 58 35 to 44 31 45 to 54 31 55 to 64 25 25 to 34 24 65 to 74 3
Are you Faculty, Staff or Student? Please specify. Staff PSS (non-represented) 67 Undergraduate Student 56 Staff MSP/Executive 17 Staff Classified (represented) 15 Graduate Student 8 Other 3 Other Faculty/Academic 3 Professor 2 Lecturer 1
What is your gender? Female 129 Male 38 No answer 4 Other 1
Now that the Challenge is ending soon, how long do you anticipate you will keep up the actions you pledged to take during the Challenge? 6 or more months 152 No answer 9 3-4 months 6 I do not plan to continue any actions. 3 1-2 weeks 2
Are initiatives like the carbon neutrality initiative important to you in your choice to work or go to school at UC? Important 70 Very important 52 Somewhat important 34 Not very important 12 Not important at all 4
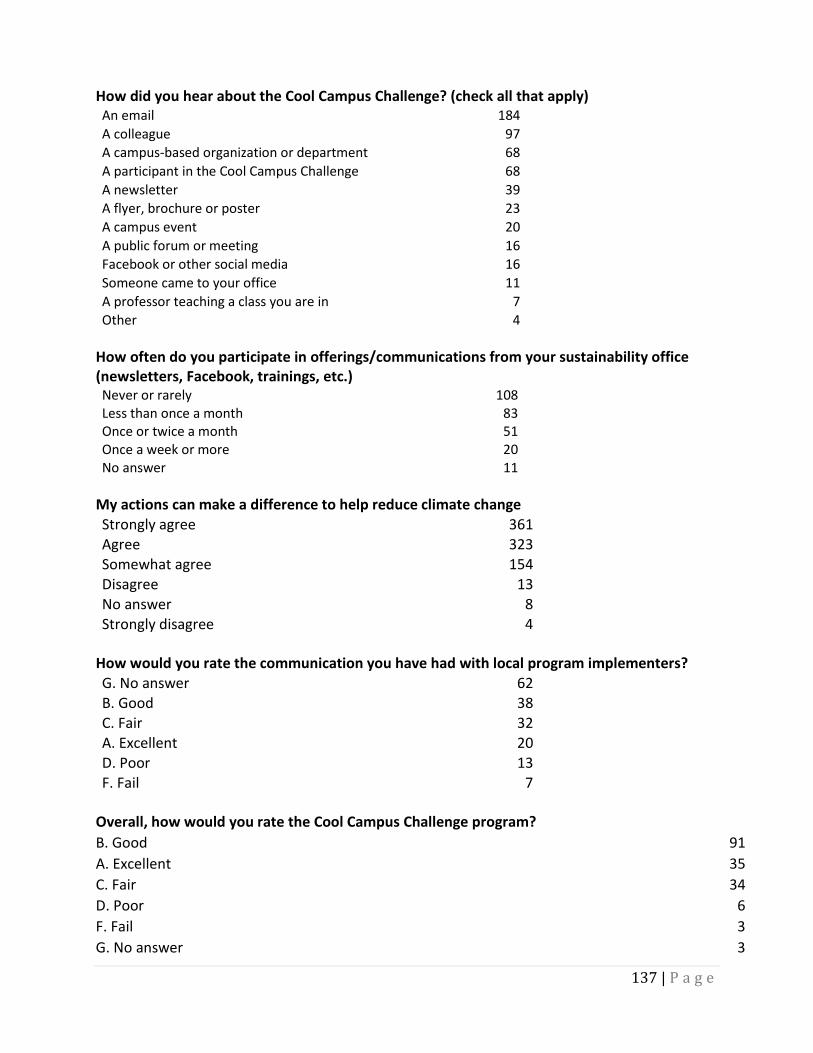
137 | P a g e
How did you hear about the Cool Campus Challenge? (check all that apply) An email 184 A colleague 97 A campus-based organization or department 68 A participant in the Cool Campus Challenge 68 A newsletter 39 A flyer, brochure or poster 23 A campus event 20 A public forum or meeting 16 Facebook or other social media 16 Someone came to your office 11 A professor teaching a class you are in 7 Other 4
How often do you participate in offerings/communications from your sustainability office (newsletters, Facebook, trainings, etc.) Never or rarely 108 Less than once a month 83 Once or twice a month 51 Once a week or more 20 No answer 11
My actions can make a difference to help reduce climate change Strongly agree 361 Agree 323 Somewhat agree 154 Disagree 13 No answer 8 Strongly disagree 4
How would you rate the communication you have had with local program implementers? G. No answer 62 B. Good 38 C. Fair 32 A. Excellent 20 D. Poor 13 F. Fail 7
Overall, how would you rate the Cool Campus Challenge program? B. Good 91 A. Excellent 35 C. Fair 34 D. Poor 6 F. Fail 3 G. No answer 3
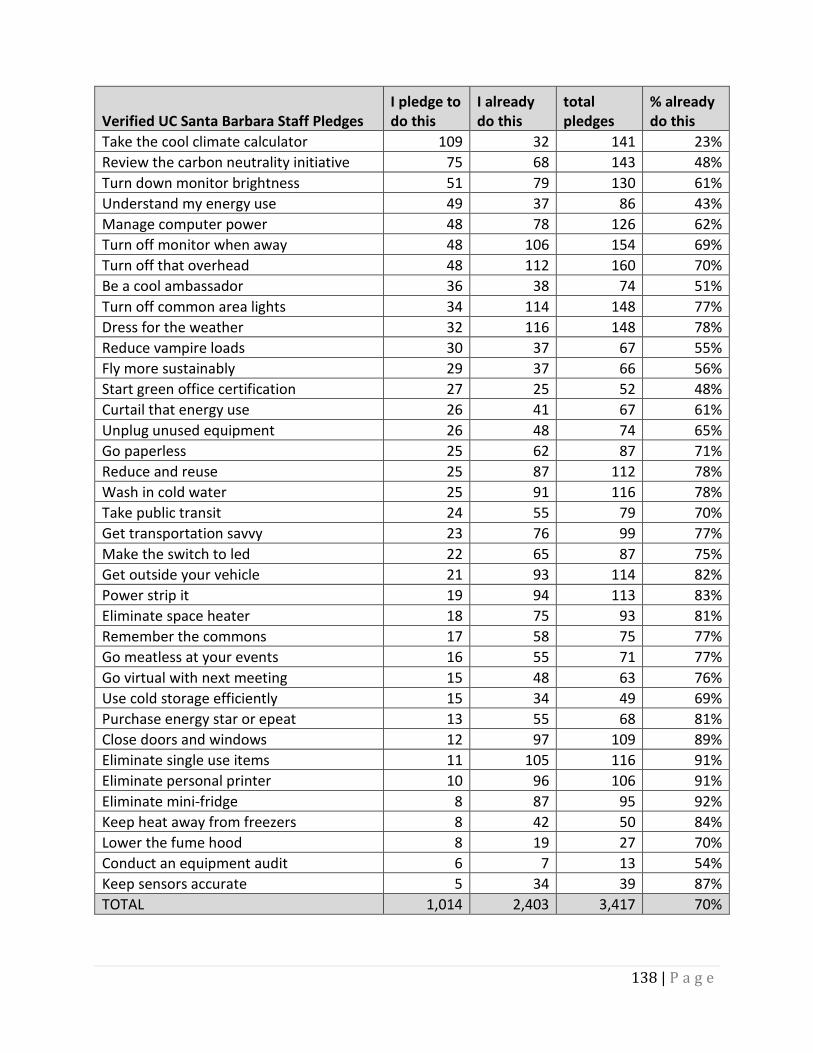
138 | P a g e
Verified UC Santa Barbara Staff Pledges I pledge to do this
I already do this
total pledges
% already do this
Take the cool climate calculator 109 32 141 23% Review the carbon neutrality initiative 75 68 143 48% Turn down monitor brightness 51 79 130 61% Understand my energy use 49 37 86 43% Manage computer power 48 78 126 62% Turn off monitor when away 48 106 154 69% Turn off that overhead 48 112 160 70% Be a cool ambassador 36 38 74 51% Turn off common area lights 34 114 148 77% Dress for the weather 32 116 148 78% Reduce vampire loads 30 37 67 55% Fly more sustainably 29 37 66 56% Start green office certification 27 25 52 48% Curtail that energy use 26 41 67 61% Unplug unused equipment 26 48 74 65% Go paperless 25 62 87 71% Reduce and reuse 25 87 112 78% Wash in cold water 25 91 116 78% Take public transit 24 55 79 70% Get transportation savvy 23 76 99 77% Make the switch to led 22 65 87 75% Get outside your vehicle 21 93 114 82% Power strip it 19 94 113 83% Eliminate space heater 18 75 93 81% Remember the commons 17 58 75 77% Go meatless at your events 16 55 71 77% Go virtual with next meeting 15 48 63 76% Use cold storage efficiently 15 34 49 69% Purchase energy star or epeat 13 55 68 81% Close doors and windows 12 97 109 89% Eliminate single use items 11 105 116 91% Eliminate personal printer 10 96 106 91% Eliminate mini-fridge 8 87 95 92% Keep heat away from freezers 8 42 50 84% Lower the fume hood 8 19 27 70% Conduct an equipment audit 6 7 13 54% Keep sensors accurate 5 34 39 87% TOTAL 1,014 2,403 3,417 70%
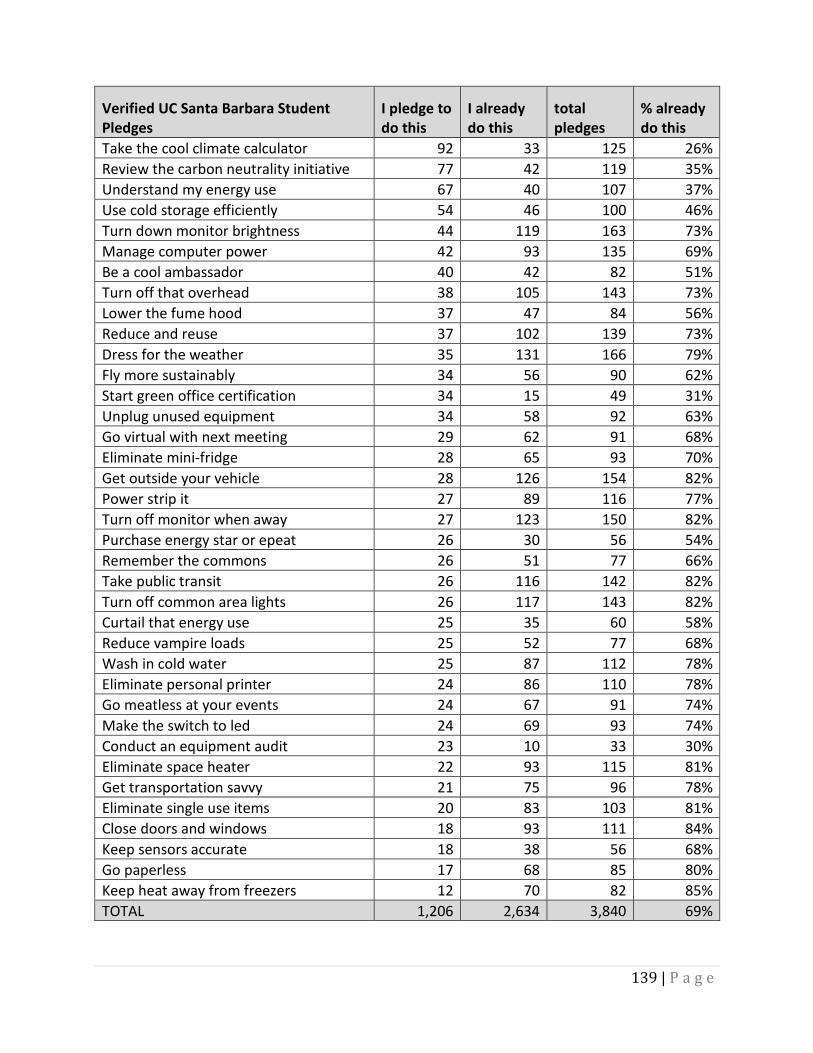
139 | P a g e
Verified UC Santa Barbara Student Pledges
I pledge to do this
I already do this
total pledges
% already do this
Take the cool climate calculator 92 33 125 26% Review the carbon neutrality initiative 77 42 119 35% Understand my energy use 67 40 107 37% Use cold storage efficiently 54 46 100 46% Turn down monitor brightness 44 119 163 73% Manage computer power 42 93 135 69% Be a cool ambassador 40 42 82 51% Turn off that overhead 38 105 143 73% Lower the fume hood 37 47 84 56% Reduce and reuse 37 102 139 73% Dress for the weather 35 131 166 79% Fly more sustainably 34 56 90 62% Start green office certification 34 15 49 31% Unplug unused equipment 34 58 92 63% Go virtual with next meeting 29 62 91 68% Eliminate mini-fridge 28 65 93 70% Get outside your vehicle 28 126 154 82% Power strip it 27 89 116 77% Turn off monitor when away 27 123 150 82% Purchase energy star or epeat 26 30 56 54% Remember the commons 26 51 77 66% Take public transit 26 116 142 82% Turn off common area lights 26 117 143 82% Curtail that energy use 25 35 60 58% Reduce vampire loads 25 52 77 68% Wash in cold water 25 87 112 78% Eliminate personal printer 24 86 110 78% Go meatless at your events 24 67 91 74% Make the switch to led 24 69 93 74% Conduct an equipment audit 23 10 33 30% Eliminate space heater 22 93 115 81% Get transportation savvy 21 75 96 78% Eliminate single use items 20 83 103 81% Close doors and windows 18 93 111 84% Keep sensors accurate 18 38 56 68% Go paperless 17 68 85 80% Keep heat away from freezers 12 70 82 85% TOTAL 1,206 2,634 3,840 69%
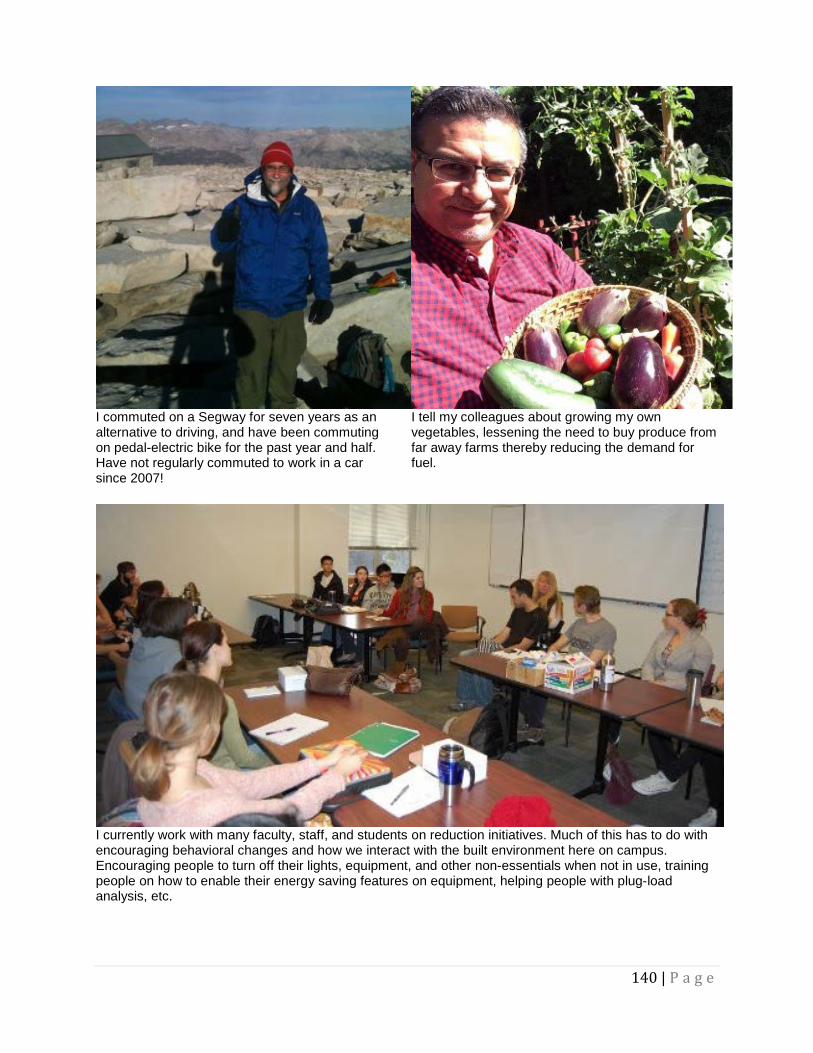
140 | P a g e
I commuted on a Segway for seven years as an alternative to driving, and have been commuting on pedal-electric bike for the past year and half. Have not regularly commuted to work in a car since 2007!
I tell my colleagues about growing my own vegetables, lessening the need to buy produce from far away farms thereby reducing the demand for fuel.
I currently work with many faculty, staff, and students on reduction initiatives. Much of this has to do with encouraging behavioral changes and how we interact with the built environment here on campus. Encouraging people to turn off their lights, equipment, and other non-essentials when not in use, training people on how to enable their energy saving features on equipment, helping people with plug-load analysis, etc.
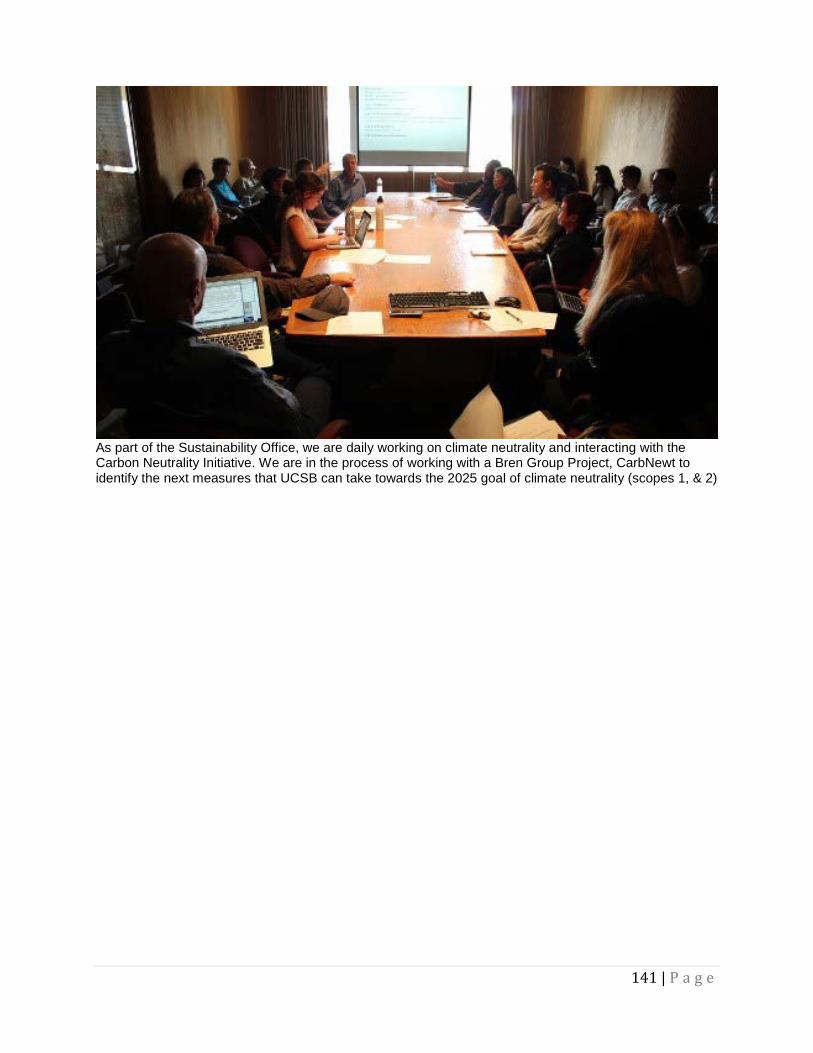
141 | P a g e
As part of the Sustainability Office, we are daily working on climate neutrality and interacting with the Carbon Neutrality Initiative. We are in the process of working with a Bren Group Project, CarbNewt to identify the next measures that UCSB can take towards the 2025 goal of climate neutrality (scopes 1, & 2)
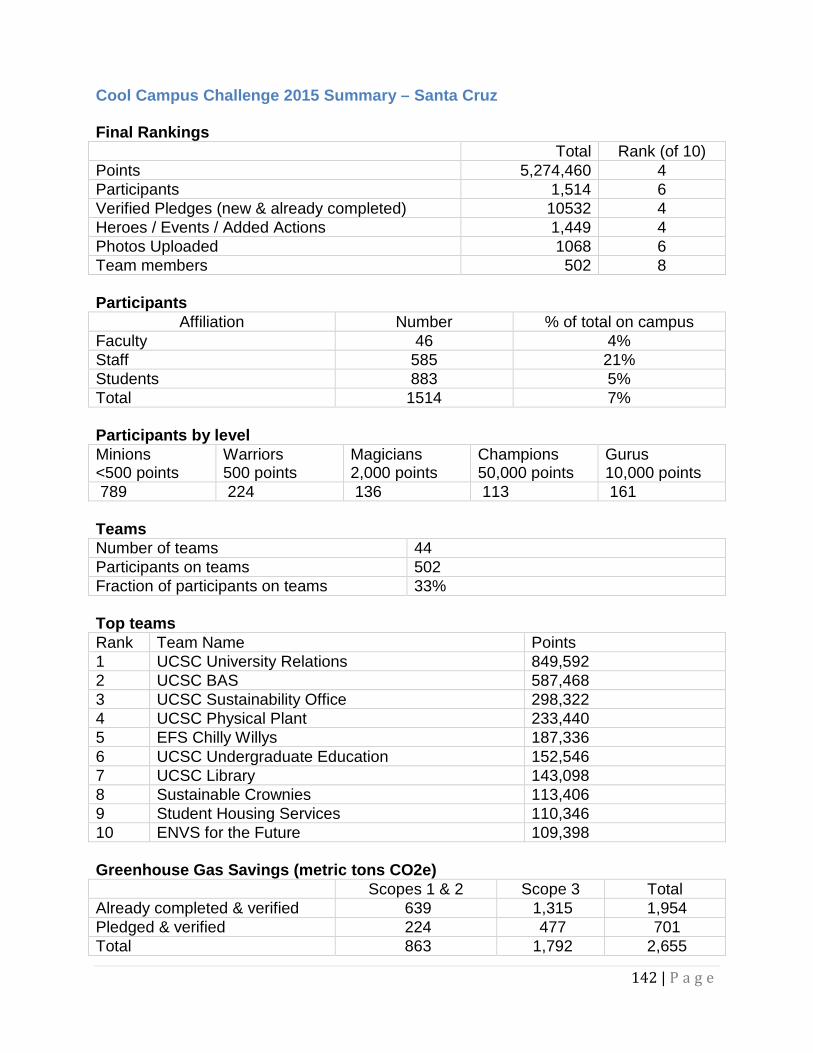
142 | P a g e
Cool Campus Challenge 2015 Summary – Santa Cruz Final Rankings Total Rank (of 10) Points 5,274,460 4 Participants 1,514 6 Verified Pledges (new & already completed) 10532 4 Heroes / Events / Added Actions 1,449 4 Photos Uploaded 1068 6 Team members 502 8 Participants
Affiliation Number % of total on campus Faculty 46 4% Staff 585 21% Students 883 5% Total 1514 7% Participants by level Minions <500 points
Warriors 500 points
Magicians 2,000 points
Champions 50,000 points
Gurus 10,000 points
789 224 136 113 161 Teams Number of teams 44 Participants on teams 502 Fraction of participants on teams 33% Top teams Rank Team Name Points 1 UCSC University Relations 849,592 2 UCSC BAS 587,468 3 UCSC Sustainability Office 298,322 4 UCSC Physical Plant 233,440 5 EFS Chilly Willys 187,336 6 UCSC Undergraduate Education 152,546 7 UCSC Library 143,098 8 Sustainable Crownies 113,406 9 Student Housing Services 110,346 10 ENVS for the Future 109,398 Greenhouse Gas Savings (metric tons CO2e)
Scopes 1 & 2 Scope 3 Total Already completed & verified 639 1,315 1,954 Pledged & verified 224 477 701 Total 863 1,792 2,655

143 | P a g e
How old are you? 18 to 24 58 35 to 44 31 45 to 54 31 55 to 64 25 25 to 34 24 65 to 74 3
Are you Faculty, Staff or Student? Please specify. Staff PSS (non-represented) 67 Undergraduate Student 56 Staff MSP/Executive 17 Staff Classified (represented) 15 Graduate Student 8 Other 3 Other Faculty/Academic 3 Professor 2 Lecturer 1
What is your gender? Female 129 Male 38 No answer 4 Other 1
Now that the Challenge is ending soon, how long do you anticipate you will keep up the actions you pledged to take during the Challenge? 6 or more months 152 No answer 9 3-4 months 6 I do not plan to continue any actions. 3 1-2 weeks 2
Are initiatives like the carbon neutrality initiative important to you in your choice to work or go to school at UC? Important 70 Very important 52 Somewhat important 34 Not very important 12 Not important at all 4
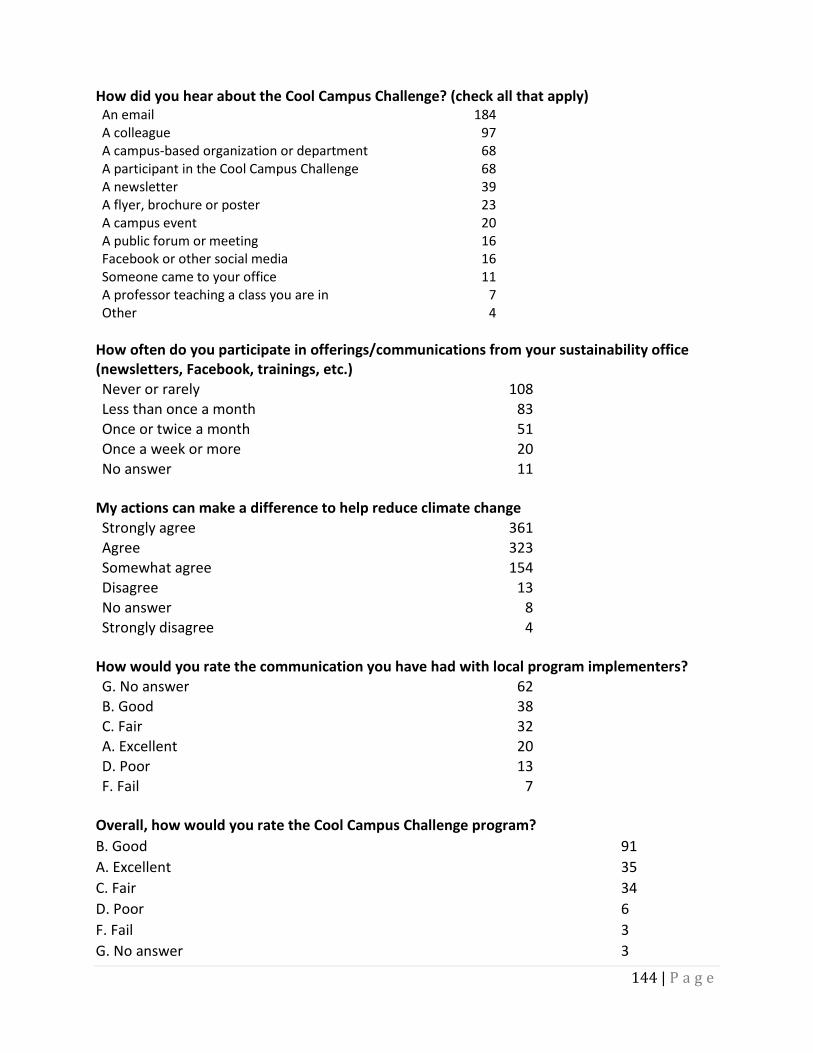
144 | P a g e
How did you hear about the Cool Campus Challenge? (check all that apply) An email 184 A colleague 97 A campus-based organization or department 68 A participant in the Cool Campus Challenge 68 A newsletter 39 A flyer, brochure or poster 23 A campus event 20 A public forum or meeting 16 Facebook or other social media 16 Someone came to your office 11 A professor teaching a class you are in 7 Other 4
How often do you participate in offerings/communications from your sustainability office (newsletters, Facebook, trainings, etc.) Never or rarely 108 Less than once a month 83 Once or twice a month 51 Once a week or more 20 No answer 11
My actions can make a difference to help reduce climate change Strongly agree 361 Agree 323 Somewhat agree 154 Disagree 13 No answer 8 Strongly disagree 4
How would you rate the communication you have had with local program implementers? G. No answer 62 B. Good 38 C. Fair 32 A. Excellent 20 D. Poor 13 F. Fail 7
Overall, how would you rate the Cool Campus Challenge program? B. Good 91 A. Excellent 35 C. Fair 34 D. Poor 6 F. Fail 3 G. No answer 3
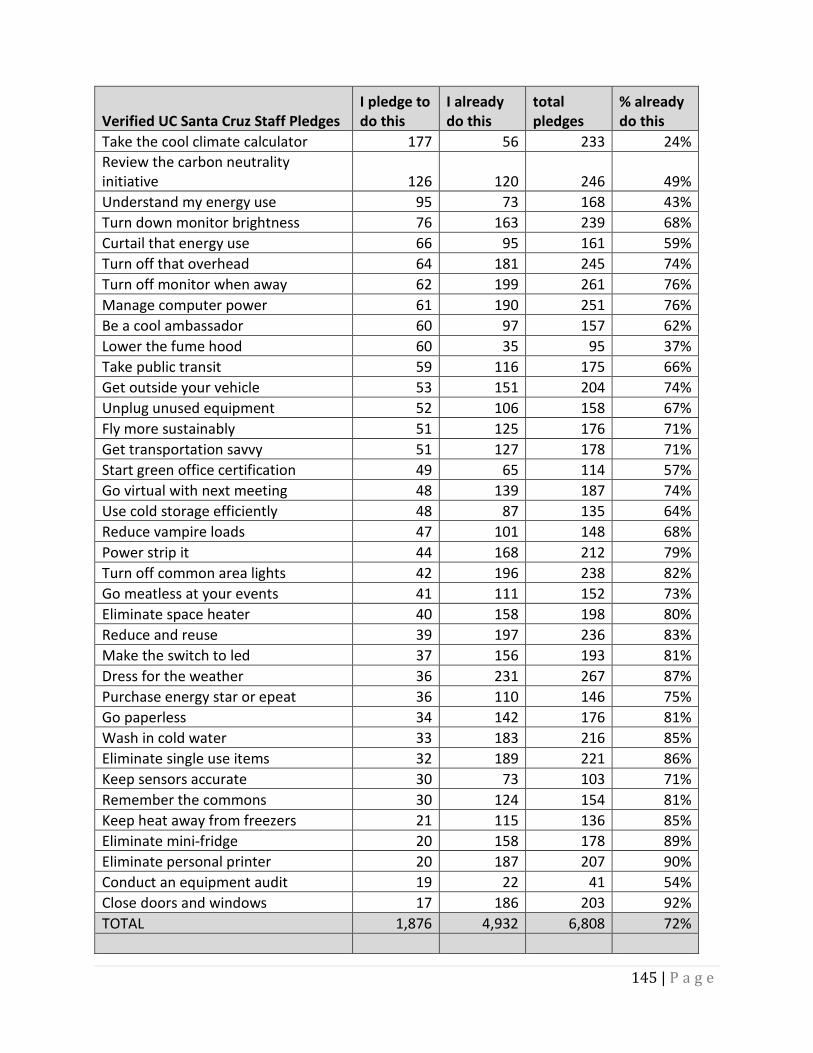
145 | P a g e
Verified UC Santa Cruz Staff Pledges I pledge to do this
I already do this
total pledges
% already do this
Take the cool climate calculator 177 56 233 24% Review the carbon neutrality initiative 126 120 246 49% Understand my energy use 95 73 168 43% Turn down monitor brightness 76 163 239 68% Curtail that energy use 66 95 161 59% Turn off that overhead 64 181 245 74% Turn off monitor when away 62 199 261 76% Manage computer power 61 190 251 76% Be a cool ambassador 60 97 157 62% Lower the fume hood 60 35 95 37% Take public transit 59 116 175 66% Get outside your vehicle 53 151 204 74% Unplug unused equipment 52 106 158 67% Fly more sustainably 51 125 176 71% Get transportation savvy 51 127 178 71% Start green office certification 49 65 114 57% Go virtual with next meeting 48 139 187 74% Use cold storage efficiently 48 87 135 64% Reduce vampire loads 47 101 148 68% Power strip it 44 168 212 79% Turn off common area lights 42 196 238 82% Go meatless at your events 41 111 152 73% Eliminate space heater 40 158 198 80% Reduce and reuse 39 197 236 83% Make the switch to led 37 156 193 81% Dress for the weather 36 231 267 87% Purchase energy star or epeat 36 110 146 75% Go paperless 34 142 176 81% Wash in cold water 33 183 216 85% Eliminate single use items 32 189 221 86% Keep sensors accurate 30 73 103 71% Remember the commons 30 124 154 81% Keep heat away from freezers 21 115 136 85% Eliminate mini-fridge 20 158 178 89% Eliminate personal printer 20 187 207 90% Conduct an equipment audit 19 22 41 54% Close doors and windows 17 186 203 92% TOTAL 1,876 4,932 6,808 72%
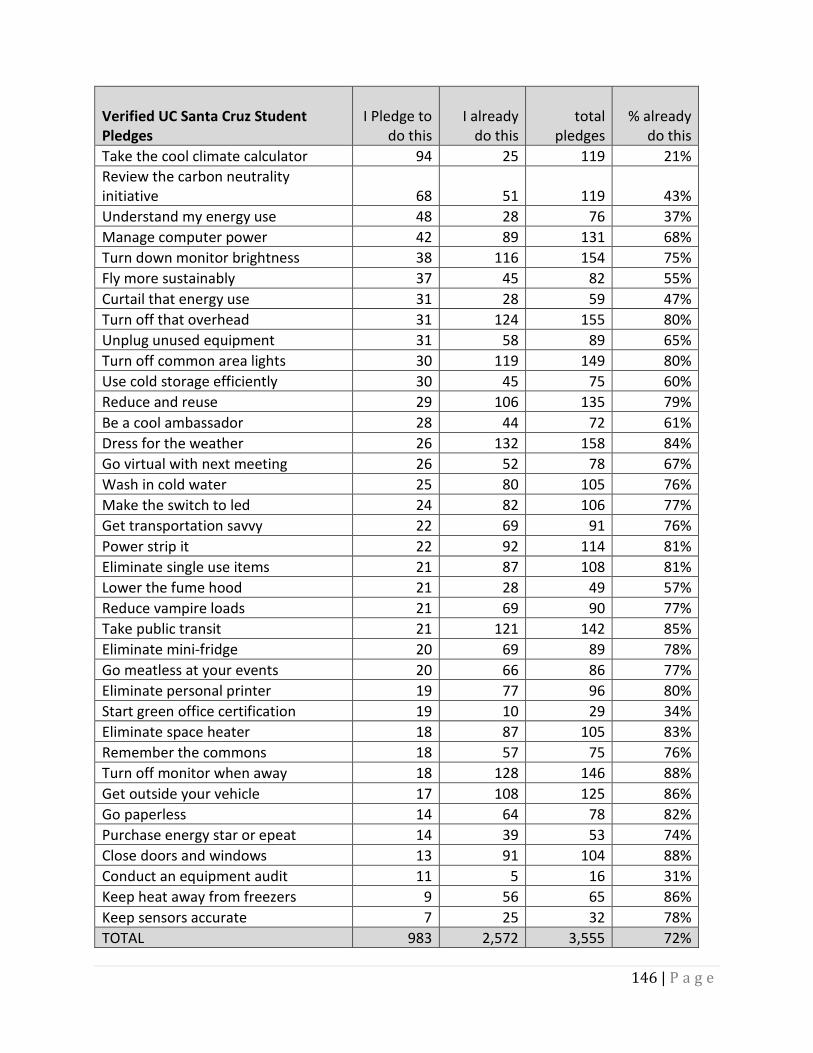
146 | P a g e
Verified UC Santa Cruz Student Pledges
I Pledge to do this
I already do this
total pledges
% already do this
Take the cool climate calculator 94 25 119 21% Review the carbon neutrality initiative 68 51 119 43% Understand my energy use 48 28 76 37% Manage computer power 42 89 131 68% Turn down monitor brightness 38 116 154 75% Fly more sustainably 37 45 82 55% Curtail that energy use 31 28 59 47% Turn off that overhead 31 124 155 80% Unplug unused equipment 31 58 89 65% Turn off common area lights 30 119 149 80% Use cold storage efficiently 30 45 75 60% Reduce and reuse 29 106 135 79% Be a cool ambassador 28 44 72 61% Dress for the weather 26 132 158 84% Go virtual with next meeting 26 52 78 67% Wash in cold water 25 80 105 76% Make the switch to led 24 82 106 77% Get transportation savvy 22 69 91 76% Power strip it 22 92 114 81% Eliminate single use items 21 87 108 81% Lower the fume hood 21 28 49 57% Reduce vampire loads 21 69 90 77% Take public transit 21 121 142 85% Eliminate mini-fridge 20 69 89 78% Go meatless at your events 20 66 86 77% Eliminate personal printer 19 77 96 80% Start green office certification 19 10 29 34% Eliminate space heater 18 87 105 83% Remember the commons 18 57 75 76% Turn off monitor when away 18 128 146 88% Get outside your vehicle 17 108 125 86% Go paperless 14 64 78 82% Purchase energy star or epeat 14 39 53 74% Close doors and windows 13 91 104 88% Conduct an equipment audit 11 5 16 31% Keep heat away from freezers 9 56 65 86% Keep sensors accurate 7 25 32 78% TOTAL 983 2,572 3,555 72%

147 | P a g e