conversion optimization willa fogarty
TRANSCRIPT

MASTER THE ESSENTIALS OF CONVERSION OPTIMIZATIONBY WILLA FOGARTY

“IF YOU CAN’T DESCRIBE WHAT YOU ARE DOING AS A PROCESS, YOU DON’T KNOW WHAT YOU’RE DOING.”
W. EDWARDS DEMING
CONVERSION LESSON #1: THE MINDSET OF AN OPTIMIZER
What do we optimize for?
Do NOT optimize for conversions alone.
Reduce your product price to $.99 and your conversions will inevitably go up.
THEN WHAT AM I OPTIMIZING FOR??
GROWTH. IT’S ABOUT GROWTH.
How do we optimize our website so that our business will grow?

IT’S ABOUT BETTERMARKETING
There are two approaches to improving a website:
1. Go in and change what you think is a good idea to change—hope your sales will go up.
2. Start by figuring out which pages cause the drop off. Once you understand WHERE the problem is, you can identify WHAT the problem is.
Which one would you choose?

DUH. THE SECOND ONE.
That’s right!
You should seek to understand your customer better: their needs, concerns and what is going on inside their minds.
You can gather quantifiable information in order to understand what people are doing on your site and the impact that each action has on the revenue.

YEAH, THAT MAKES SENSE
You can do better marketing if you actually
understand what the market wants and focus on pages that have the biggest problems.

SO HOW DOES ONE BECOME A GOOD OPTIMIZER?
Step 1. Accept these undeniable truths:
• Your opinion doesn’t matter.
• You don’t know what will work.
• There are no magic templates for higher conversion.
Stop thinking in tactics and start thinking in processes.
Step 2. Turn your unsupported, baseless opinions into data-informed, educated hypotheses.
• Focus on KNOWING what’s happening and understanding WHY.
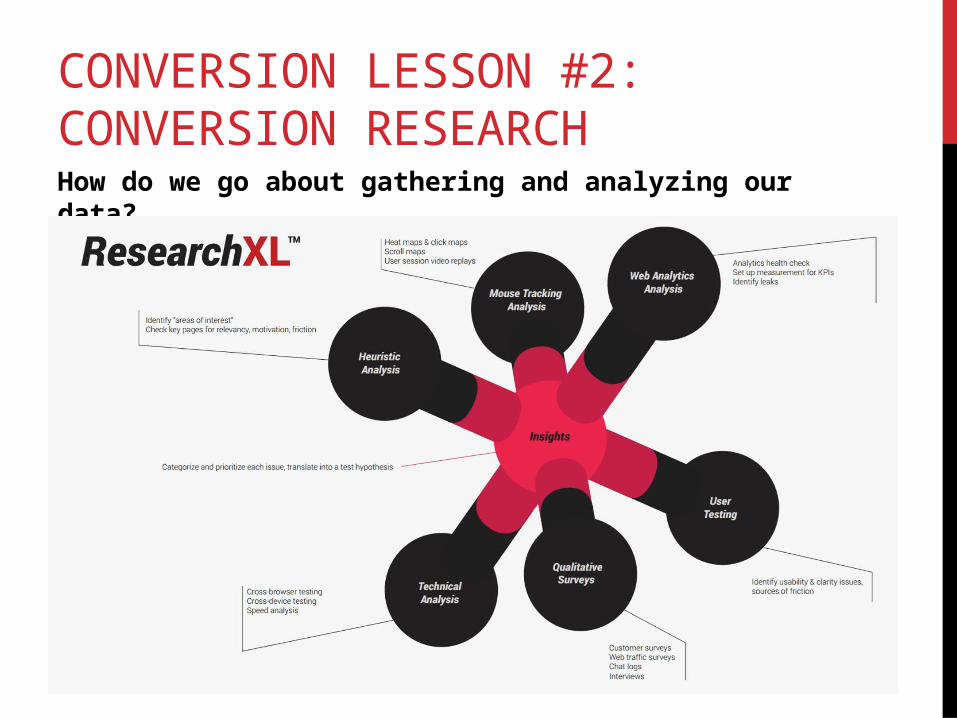
CONVERSION LESSON #2: CONVERSION RESEARCHHow do we go about gathering and analyzing our data?

RESEARCH XL
Step 1: Technical Analysis
• Cross-browser testing
• Cross-device testing
• Speed analysis
Step 2: Heuristic Analysis
• Areas of interest
• Check key pages for relevancy, friction issues
Step 3: Web Analytics Analysis
• Health check
• Identify KPI’s and leaks
Step 4: Mouse Tracking Analysis
• Heat, click, & scroll maps
• User session video replays
Step 5: Qualitative Research
• Customer, web traffic surveys
• Interviews
Step 6: User Testing
• Identify usability and clarity issues
Step 7: Sum Up
• Categorize and prioritize each issue
• Translate into a test hypothesis
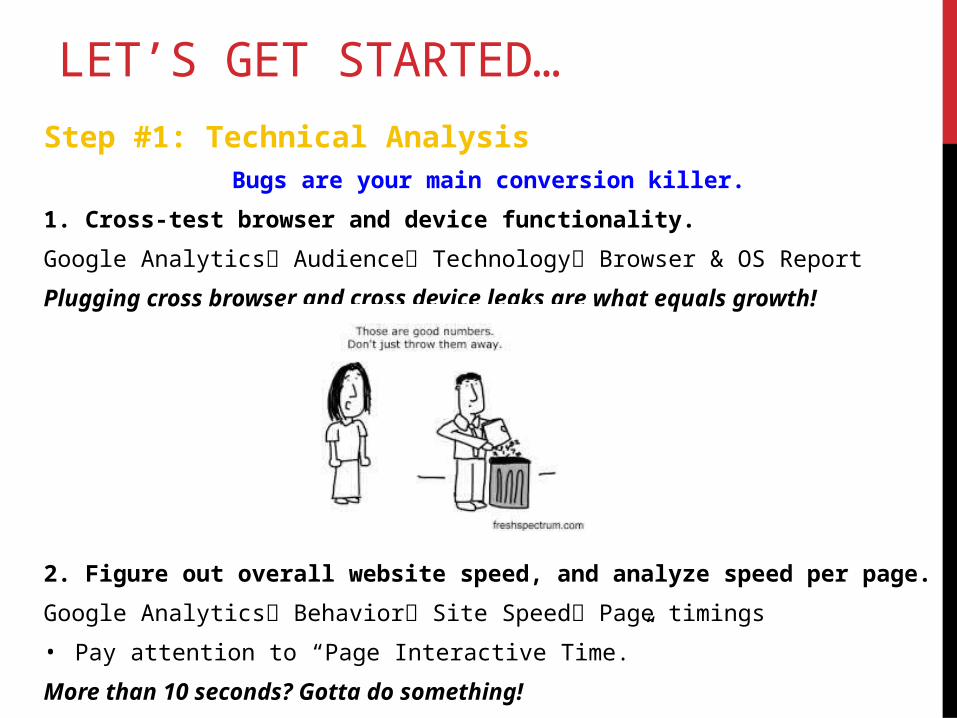
LET’S GET STARTED…
Step #1: Technical AnalysisBugs are your main conversion killer.
1. Cross-test browser and device functionality.
Google Analytics Audience Technology Browser & OS Report
Plugging cross browser and cross device leaks are what equals growth!
2. Figure out overall website speed, and analyze speed per page.
Google Analytics Behavior Site Speed Page timings
• Pay attention to “Page Interactive Time.”
More than 10 seconds? Gotta do something!

STILL HOLDING ON TO THAT USELESS OPINION?
Step #2: Heuristic AnalysisA.k.a. the closest you will get to validating an opinion—an experience based assessment where the outcome is not guaranteed to be optimal, but might be good enough.
In essence, you/optimizers review a website page by page in a VERY structured way looking for:
• Relevancy
• Clarity
• Value
• Friction
• Distraction
But remember: whatever you write down is merely an area of interest.

CONVERSION LESSON #3 GOOGLE ANALYTICS FOR CROStep 3: Web Analytics AnalysisGone are the days when a brilliant idea was enough in marketing. Now you need to know the specific impact of every idea.
From Google Analytics we can learn:
• What people are doing.
• The impact and performance of every feature, widget & page.
• Where the site is leaking money.
But we won’t know WHY. It’s up to YOU to pull insights from the data.

GOOGLE ANALYTICS CONTINUED…Tips and Tricks:
• Averages lie—look at distributions, segments, and comparisons.
• Always use absolute numbers next to ratios.
• Measure the important stuff a.k.a. your KPI’s & goals.
• If you have no goals set up, you’re a voluntary idiot.
• Set up goals for ALL key actions (purchase, lead generation, etc.).
• Use Google Tag Manager to set up event tracking.
• Find leaks by identifying specific pages and steps that are losing money.

CONVERSION LESSON #4: MOUSE TRACKING & HEAT-MAPS
Step 4: Mouse Tracking Analysis You can record what people do with their mouse/ track-pad and quantify that information.
BUT you need enough of a sample size per page or screen BEFORE you can trust any results.
• Heat-Map is a graphical representation of data where the individual values are contained in a matrix and represented as colors. HOWEVER accuracy is always questionable.
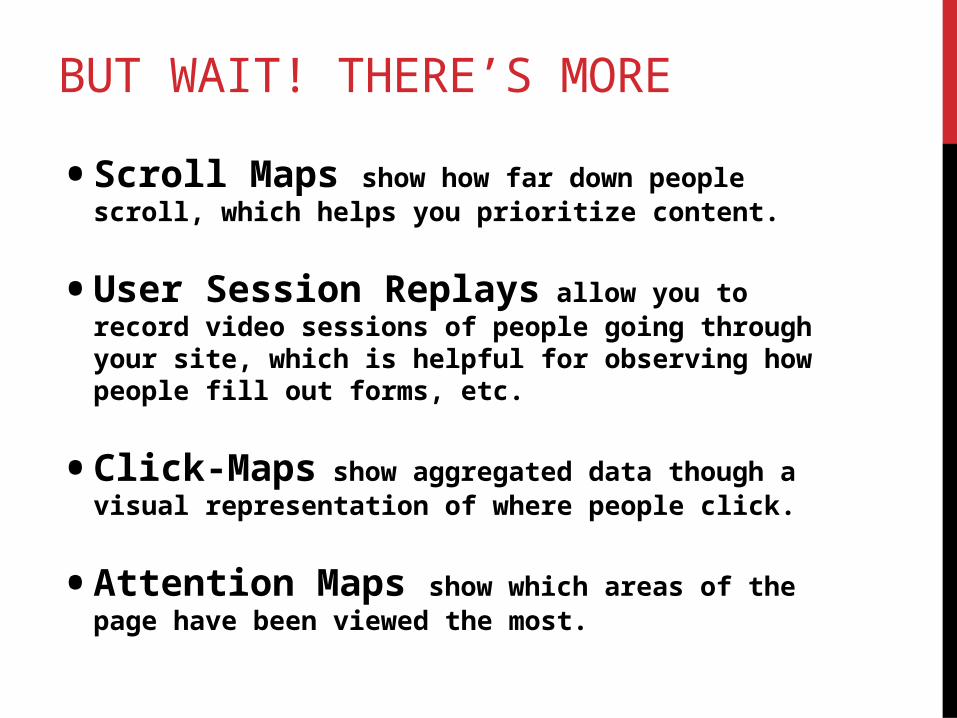
BUT WAIT! THERE’S MORE
• Scroll Maps show how far down people scroll, which helps you prioritize content.
• User Session Replays allow you to record video sessions of people going through your site, which is helpful for observing how people fill out forms, etc.
• Click-Maps show aggregated data though a visual representation of where people click.
• Attention Maps show which areas of the page have been viewed the most.

CONVERSION LESSON #5: USING WEBSITE SURVEYS
Step 5: Qualitative Research There are two ways to survey your web traffic:
1. Exit survey: hit them with a popup when they’re about to leave.
2. On-page survey: ask them to fill out a survey as they’re on a specific page.
ASK about the fears, doubts, and hesitations customers are experiencing on a specific page.
Every page on your site has one job, and your survey question should be about that one page, one job.
SURVEY TIPS…START WITH determining the most wanted action for the page.
THEN come up with a question that asks about friction.
E.g. “What’s keeping you from buying this right now?”
Try to come up with multiple different wordings to the question.
• Ask questions in the form of Y/N to start out.
• 100-200 responses is ideal.
Look for trends in people’s responses.
CONVERSION LESSON #6: USER TESTINGStep 6: User TestingObserve actual people use and interact with your website while commenting their thought process out loud.
START WITH creating test protocol—tasks that you want your user to complete (4-5 tasks per test is average).
THEN have your user complete key actions (e.g. signing up for something, or completing a purchase).
You generally want to include 3 types of tasks in the test protocol:
• Specific task
• Broad task
• Funnel completion
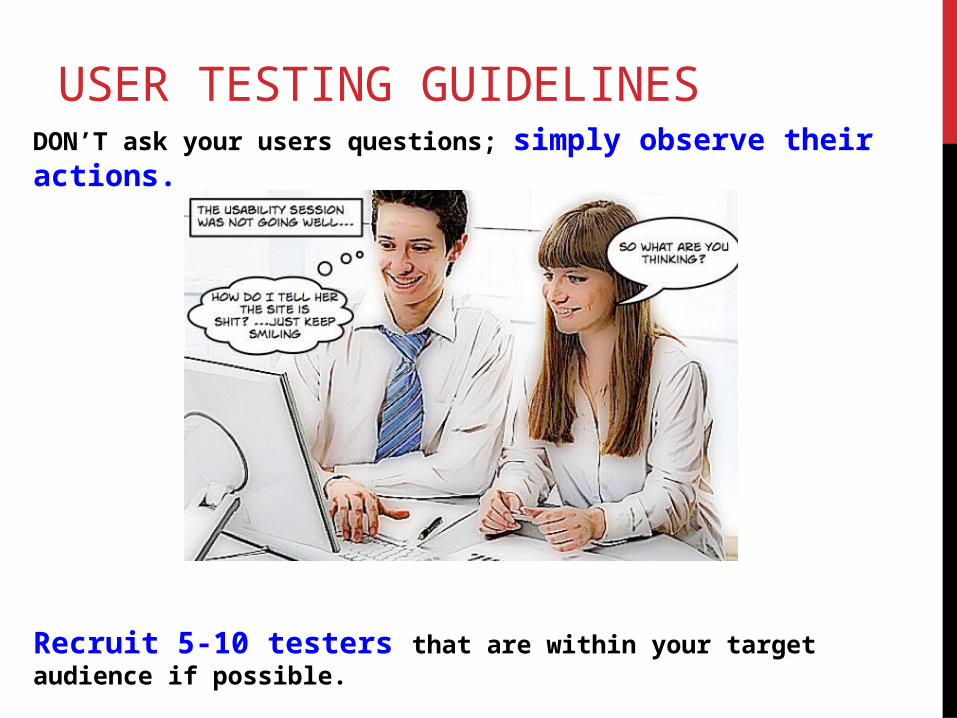
USER TESTING GUIDELINES DON’T ask your users questions; simply observe their actions.
Recruit 5-10 testers that are within your target audience if possible.
CONVERSION LESSON #7: FROM DATA TO TEST HYPOTHESES
Congrats! You have completed the Research XL Framework! Once you go
through steps 1-6, you will identify issues:
Allocate every finding into one of these five buckets:
1. Test (traffic, leakage)
2. Instrument (beef up the analytics reporting)
3. Hypothesize (something isn’t working, but there is no clear solution)
4. Just Do It (issues with an easy fix)
5. Investigate (dig deeper on the issue, ask more questions)
SO YOU’VE GOT 99 PROBLEMS…
Prioritize!
• Start with high priority items and leave low priority for last.
• Use a ranking system of 1-5
(5 being the most critical).
There are 2 criteria to keep in mind:1. Ease of implementation.
2. Opportunity score (subjective opinion on how big of a lift you might get).
Translate the issue into a hypothesis, and conduct further investigation.
All hypotheses should be derived from your conversion research.
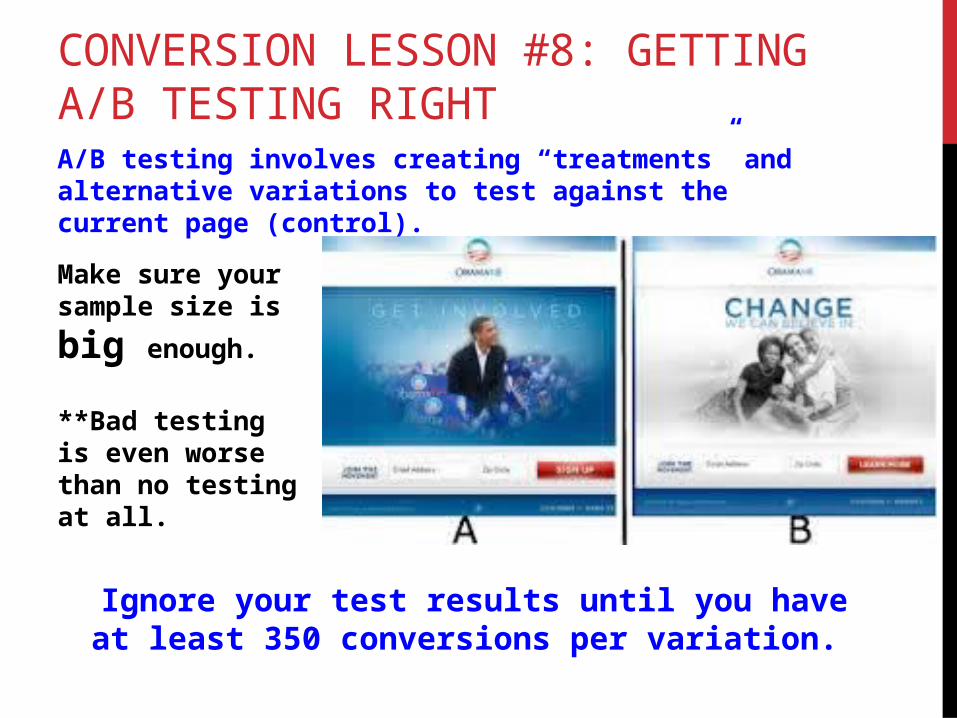
CONVERSION LESSON #8: GETTING A/B TESTING RIGHT
Make sure your
sample size is big enough.
**Bad testing is even worse than no testing at all.
Ignore your test results until you have at least 350 conversions per variation.
A/B testing involves creating “treatments” and alternative variations to test against the current page (control).
LOOK FOR 95% CONFIDENCE
We want to see if one of the variations is better than the
control, a.k.a. statistical significance.
Statistical significance is the probability that a test result is accurate and not due to chance alone.
There is no substitution for experience. Start running tests now.
CONVERSION LESSON #9: LEARNING FROM THE TEST RESULTS
Iterative testing is the name of the game:
10 tests to a sizeable win is not uncommon.
It’s about learning.

KEEP SWIMMINGBut my test results are inconclusive…??!
• Your hypothesis may be wrong or your test wasn’t as bold or brave enough in shifting away from the original design.
• Analyze the segments.
• Consider how the variations performed across the different segments.
Learn from failure. Brainstorm a new test.

TO SUM UP…
CONVERSION OPTIMIZATION IS A PROCESS.

“FALL IN LOVE WITH THE PROCESS AND THE RESULTS WILL COME.”
Eric Thomas