conversion of ethanol to acetone & other produces using nano … · ethyl acetate, acetone and...
TRANSCRIPT
Vol.3, No.6, 471-477 (2011) Natural Science http://dx.doi.org/10.4236/ns.2011.36065
Copyright © 2011 SciRes. OPEN ACCESS
Conversion of ethanol to acetone & other produces using nano-sensor SnO2 (110): Ab initio DFT
Leila Mahdavian
Department of Chemistry, Doroud Branch, Islamic Azad University, Doroud, Iran; [email protected], [email protected]
Received 3 February 2011; revised 18 March 2011; accepted 2 April 2011.
ABSTRACT
The material considered in this study, SnO2 (110), has a widespread use as gas sensor and oxygen vacancies are known to act as active catalytic sites for the adsorption of small mo-lecules. In the following calculations crystal line SnO2 nano-crystal have been considered. The grains lattice, which has the rutile structure of the bulk material, includes oxygen vacancies and depositing a gaseous molecule, either ethanol, above an atom on the grain surface, generates the adsorbed system. The conduc-tance has a functional relationship with the structure and the distance molecule of the na-no- crystal and its dependence on these quanti-ties parallels the one of the binding energy. The calculations have quantum mechanical detail and are based on a semi-empirical (MNDO me-thod), which is applied to the evaluation of both the electronic structure and of the conductance. We study the structural, total energy, thermo-dynamic and conductive properties of absorp-tion C2H5OH on nano-crystal, which convert to acetaldehyde and acetone.
Keywords: Ethanol; Gas Sensor; SnO2 (110); Electrical Resistance; Semi-Empirical (MNDO).
1. INTRODUCTION
The products of the ethanol dehydrogenation reaction (C2H5OH H2 + products) depend upon the ensem-ble size of SnO2 [1]. Isolated SnO2 (110) catalyze only the dehydrogenation to acetaldehyde, whereas multiple Cu ensembles show high yields of ethyl acetate in addi-tion to acetaldehyde for surface. Many reactive gases know metal oxides of gas sensors for their sensitivity but they are also ill famed for their cross-sensitivity. A well recognized way for distinguishing gases is using the fact that different kinds of gases tend to react with different ease at the sensor surface and that these therefore give
rise to differently shaped gas sensitivity/surface tem-perature characteristics [2]. In fact, the results obtained using the nano-spheres clearly demonstrate only the products of mono atomically dispersed Cu (only acetal-dehyde is observed) with an apparently improved effi-ciency [3]. For this reason, it has become popular to ap-ply temperature modulation techniques to metal oxide gas sensors in which the surface temperature is rapidly scanned through a range of temperatures in which there is a strong variation of the gas sensitivity with surface temperature [4-7].
Accordingly, it is important to understand the role of alcohol vapor in the sensing mechanism. The goal of this work is to improve the detection of surface species of SnO2 thick film gas sensors under their working condi-tions using computer calculation, and to correlate the sensor signals with the relative changes of the electrical resistance (Ω). Development of ethanol sensors based on thin film technology offers the advantages of greater sensitivity, shorter response time and lower costs.
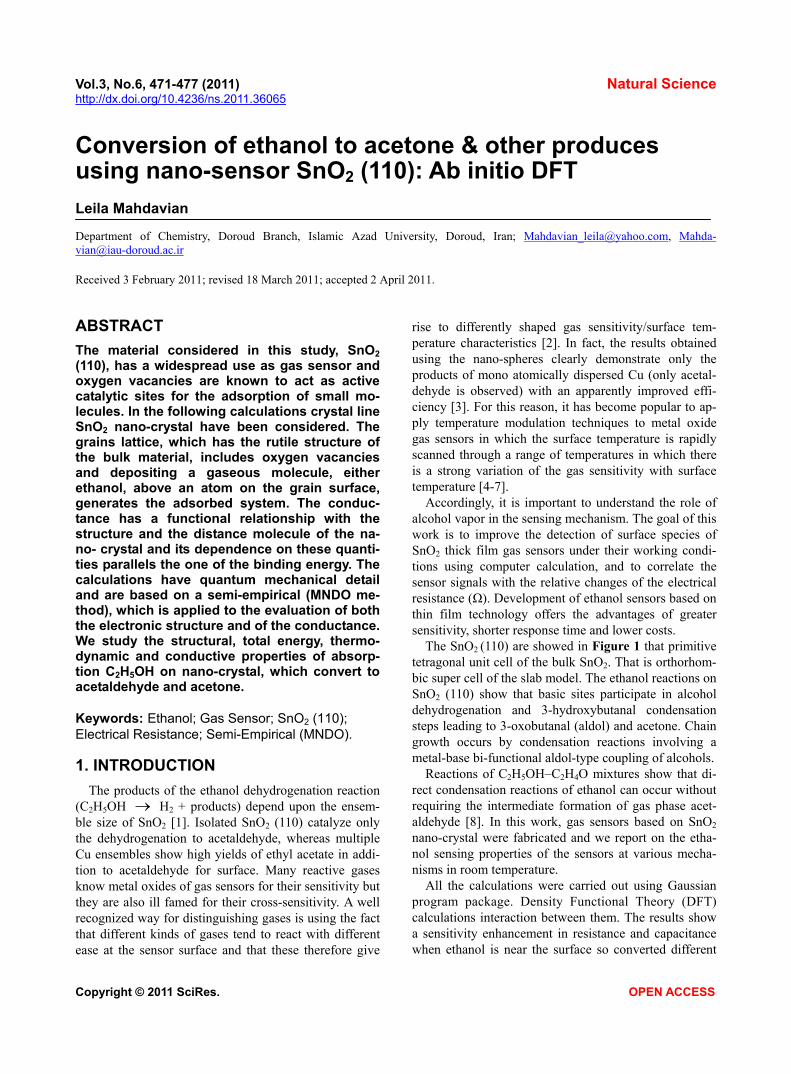
The SnO2 (110) are showed in Figure 1 that primitive tetragonal unit cell of the bulk SnO2. That is orthorhom-bic super cell of the slab model. The ethanol reactions on SnO2 (110) show that basic sites participate in alcohol dehydrogenation and 3-hydroxybutanal condensation steps leading to 3-oxobutanal (aldol) and acetone. Chain growth occurs by condensation reactions involving a metal-base bi-functional aldol-type coupling of alcohols.
Reactions of C2H5OH–C2H4O mixtures show that di-rect condensation reactions of ethanol can occur without requiring the intermediate formation of gas phase acet-aldehyde [8]. In this work, gas sensors based on SnO2 nano-crystal were fabricated and we report on the etha-nol sensing properties of the sensors at various mecha-nisms in room temperature.
All the calculations were carried out using Gaussian program package. Density Functional Theory (DFT) calculations interaction between them. The results show a sensitivity enhancement in resistance and capacitance when ethanol is near the surface so converted different
L. Mahdavian / Natural Science 3 (2011) 471-477
Copyright © 2011 SciRes. OPEN ACCESS
472
(c)
Figure 1. (a) Primitive tetragonal unit cell of the bulk SnO2, (b) Optimized configuration Side-view of SnO2 (110) and (c) the surface adsorption sites for interaction with ethanol.
products.
2. THE COMPUTATIONAL METHODS
The geometry optimizations were performed using an all-electron linear combination of atomic orbital density functional theory (DFT) calculations using the Gaussian program package. In density function theory the exact exchange Hartree-Fock (HF) for a single determinant is replaced by a more general expression the exchange correlation functional which can include terms account-ing for both exchange energy and the electron correla-tion which is omitted from Hartree-Fock theory:
( ) ( )1 2 ( )KS j CE hp P E E (1)
where, ( )E is the exchange function and ( )CE is the correlation functional. The correlation unction of Lee, Yang and Parr includes both local and nonlocal term. For the Minimum energy structures and cluster size, we em-ploy commercial soft ware from MSI [9] and carry out both linear combinations of atomic orbital (LCAO) and plane wave pseudo potential (PWPP) calculations at the DFT± GGA level. The LCAO basis functions are one-electron orbital of free atoms and free ions [10]. Another advantage is that for specific and well-parame- terized molecular systems, these methods can calculate values that are closer to experiment than lower level ab initio techniques.
Semi-empirical quantum mechanics method used for calculation all thermodynamic parameters of this inter-action. Because, we can use the information obtained from semi-empirical calculations to investigate many thermodynamic and kinetic aspects of chemical pro- cesses. Energies and geometries of molecules have clear relationships to chemical phenomena.
The accuracy of semi-empirical quantum mechanics method depends on the database used to parameterize the method. Configuration Interaction (or electron cor-relation) improves energy calculations using CNDO, INDO, MINDO/3, MNDO, AM1, PM3, ZINDO/1, and ZINDO/S for these electron configurations. The heat of formation is calculated for these methods by subtracting atomic heats of formation from the binding energy. MNDO has been used widely to calculate heats of for-mation, molecular geometries, dipole moments, ioniza-tion energies, electron affinities, and other properties [11, 12]. MNDO gives better results for some classes of mo-lecule, such as some phosphorus compounds. Closed-shell singlet ground states Half-electron, excited singlet states Half-electron, doublet, triplet, and quartet open-
shell ground states. MNDO is a Modified Neglect of Diatomic Overlap
method based on the neglect of diatomic differential overlap (NDDO) approximation. In order to compute the average properties from a microscopic description of a real system, one shall evaluate integrals over phase space. It may be calculated for an N-particle system in an ensemble with distribution function P(rN), the ex-perimental value of a property A(rN) from:
N N N NA r A r P r dr (2)
The problem with direct evaluation of this mul-ti-dimensional integral (apart of the huge number of phase space points as a sample) is that most of the con-figurations sampled contribute nothing to the integral. Having energy is so high that the probability of their occurrence is vanishing small [13,14].
The RMS gradient that is reported is just the root- mean square average of the Cartesian components of the gradient vector. For multi-dimensional potential energy surfaces a convenient measure of the gradient vector is the root-mean-square (RMS) gradient described by RMS Gradient:
1 22 2 2
13
A A A A
E E EN
X Y Z (3)
For a molecular mechanics calculation the energy and the gradient are essentially the only quantities available from a single point calculation. Ball-and-stick models of the (110) surface are showed in Figure 1 that converting of ethanol to other products on SnO2 (110) simulated by program package and the adsorption, electric, binding nuclear energy, RMS gradient, heat of formation and Gibbs free energy are calculated by MNDO methods in semi empirical quantum by Gaussian program package. The electric resistance for them is following as:
L. Mahdavian / Natural Science 3 (2011) 471-477
Copyright © 2011 SciRes. OPEN ACCESS
473
elecE RI (4)
where, elecE is electric energy (V), R ( ) is electric re-
sistance and I (A) is electric intensity that is q
It
and
q(C) is electric charge and t is time interaction, in ex-perimental data, it is so:
elecE tR
nF (5)
where, n, F and t are electron number of conversion, faraday constant and time (h) respectively.
3. RESULTS AND DISCUSSION
Therefore, the surface energies of several low-index facets of SnO2 also known as rutile or tetragonal phase, space group P42mnm, lattice parameters are a = b = 4.7374 oA and c = 3.1864 oA. In the bulk all Sn atoms are six fold coordinated to threefold coordinated oxygen atoms. The surface energies of low index SnO2 surfaces with a termination that maintains the bulk composition have been calculated (Figure 1) [15-20].
Semi conducting sensors offer an inexpensive and simple method for monitoring gases. The change of the electrical conductivity of semi conducting materials upon exposure to reducing gas C2H5OH has been used for gas detection. Therefore, SnO2 have been used util-izing as the sensing material in pressure, flow, thermal,
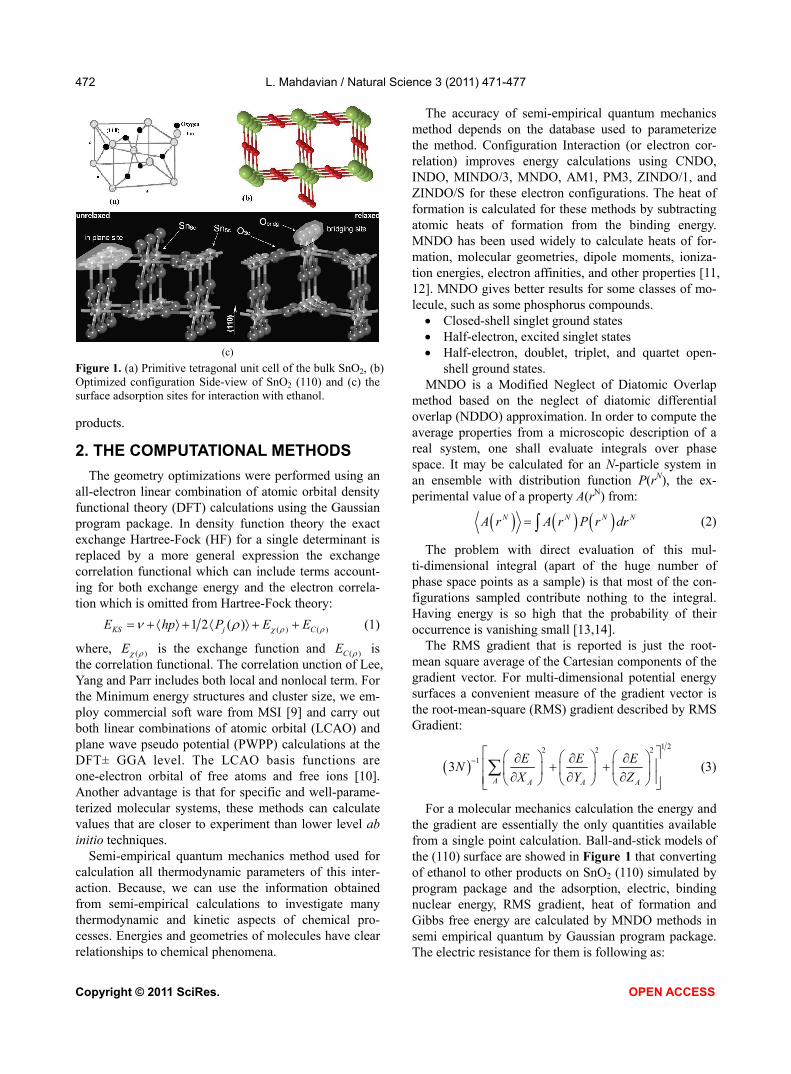
gas, optical, mass, position, stress, strain, chemical, and biological sensors [21-23]. Ethanol near SnO2 surface was converted other products such as: acetaldehyde, ethyl acetate, acetone and etc, which is shown in Figure 2. The mechanism conversion ethanol to other produces on nano-crystal SnO2 (110) are investigated with MNDO methods. The other methods in DFT can not calculate these parameters for SnO2 with 24 Sn atoms and theirs calculation are most heavy.
3.1. The Interaction of Ethanol with SnO2
3.1.1. Formation of Acetaldehyde It by the oxidative dehydrogenation of ethanol de-
pends critically upon the reaction step that requires the oxide surface to acquire a negative charge. It is well ac-cepted that upon adsorption, the O–H bond of the alco-hol dissociates hydrolytically to yield an ethoxide and a proton as follows in Figure 3.
This type of interaction is more known as an acid-base interaction, where the H atom of the acid (in this case ethanol) interacts with one surface O
2– (the base). Si-multaneously, the Sn
4+ site (acting as Lewis acid) inter-
acts with the O (2p) orbital of the oxygen of the ad sorbed ethanol molecule.
A sequential reaction scheme, where ethanol dehy-drogenates to form gas phase acetaldehyde, which then undergoes self-condensation reactions into products, is not considered, because it is not consistent with the
Figure 2. Products of interaction: Ethanol+ SnO2.
L. Mahdavian / Natural Science 3 (2011) 471-477
Copyright © 2011 SciRes. OPEN ACCESS
474
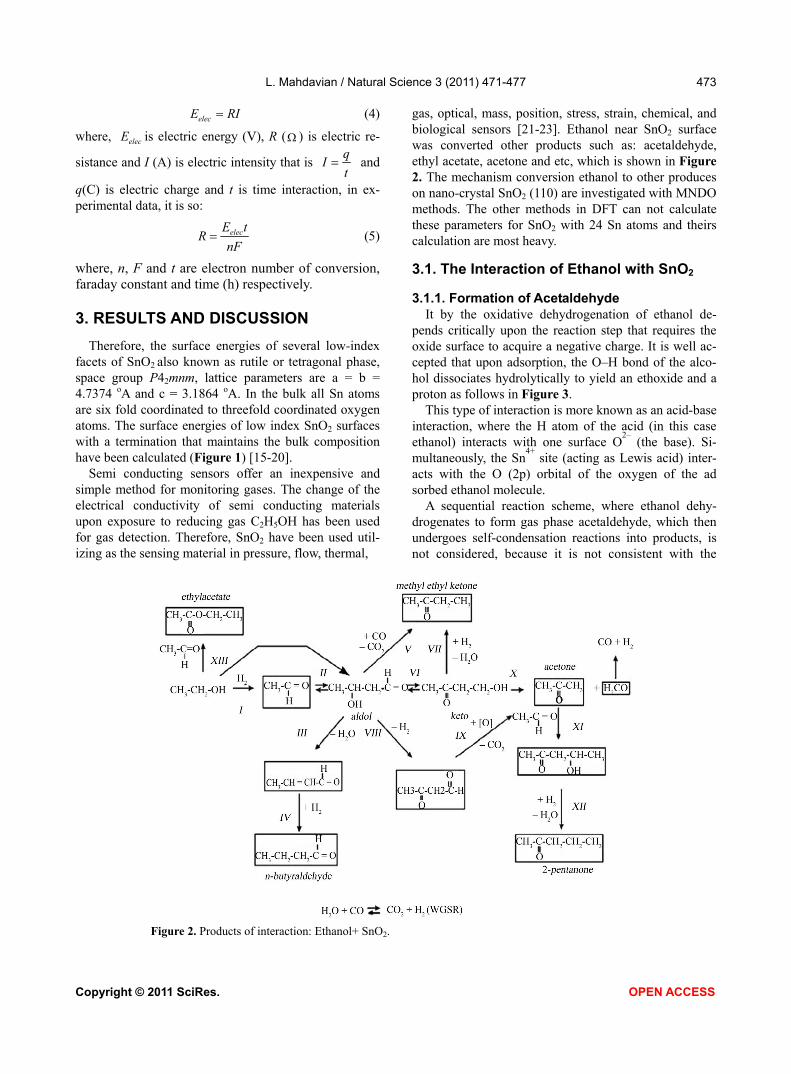
Figure 3. The mechanism converted ethanol to acetaldehyde on SnO2 (110) by seven steps. sharp initial increase in product site-yield curves (Figure 1). The proposed mechanism involves the initial dissoci-ate adsorption of ethanol on SnO2 to form ethoxide and hydrogen species. Hydrogen species can then is removed by migration to surface sites, recombination with another hydrogen ad atom, and adsorption as H2. Additional C–H bond cleavage events in ethoxide species can then occur and the hydrogen atoms formed are transferred to oxy-gen ions and form surface acetaldehyde species. Ball- and-stick model of this interaction for DFT calculation is seen in Figure 4. We calculated that the conductance and thermodynamic properties this interaction on SnO2 sam-ples that could be substantially increased or decreased in exposure to ethanol by DFT, which the results are showed Table 1. After adsorption of ethanol on surface and transition electron between them, the electric resis-tance to time (h) decreased that showed in Figure 5.
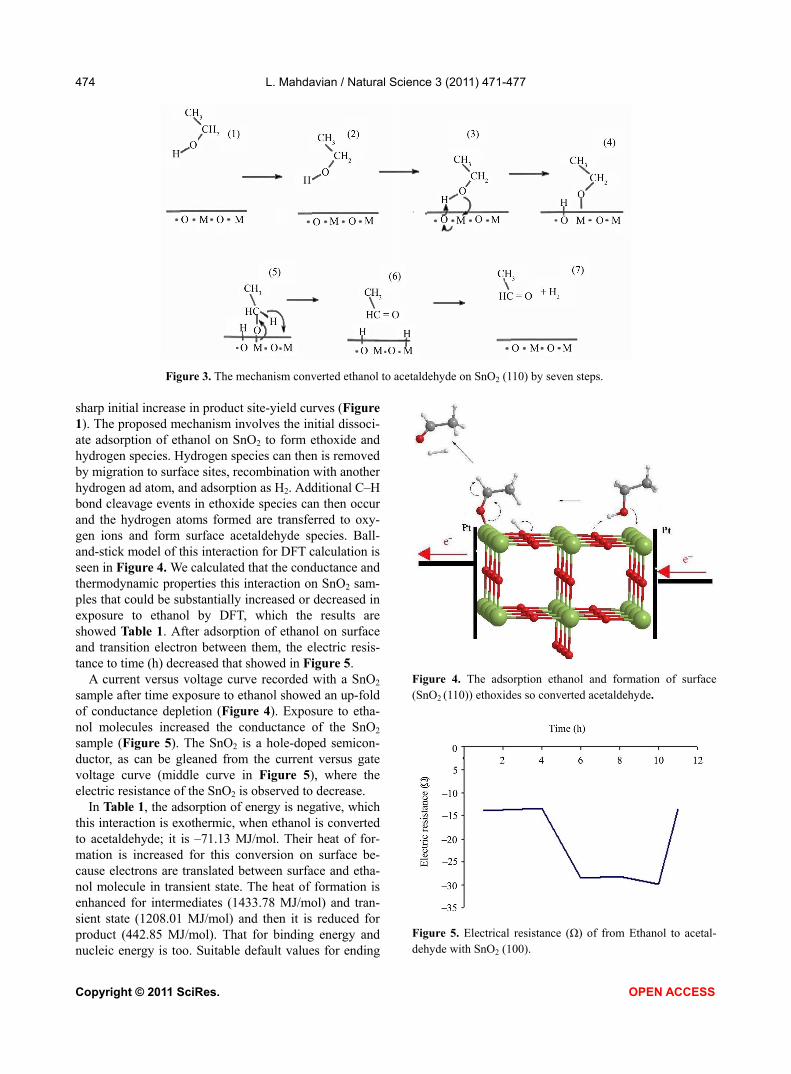
A current versus voltage curve recorded with a SnO2 sample after time exposure to ethanol showed an up-fold of conductance depletion (Figure 4). Exposure to etha-nol molecules increased the conductance of the SnO2 sample (Figure 5). The SnO2 is a hole-doped semicon-ductor, as can be gleaned from the current versus gate voltage curve (middle curve in Figure 5), where the electric resistance of the SnO2 is observed to decrease.
In Table 1, the adsorption of energy is negative, which this interaction is exothermic, when ethanol is converted to acetaldehyde; it is –71.13 MJ/mol. Their heat of for-mation is increased for this conversion on surface be-cause electrons are translated between surface and etha-nol molecule in transient state. The heat of formation is enhanced for intermediates (1433.78 MJ/mol) and tran-sient state (1208.01 MJ/mol) and then it is reduced for product (442.85 MJ/mol). That for binding energy and nucleic energy is too. Suitable default values for ending
Figure 4. The adsorption ethanol and formation of surface (SnO2 (110)) ethoxides so converted acetaldehyde.
Figure 5. Electrical resistance (Ω) of from Ethanol to acetal-dehyde with SnO2 (100).
L. Mahdavian / Natural Science 3 (2011) 471-477
Copyright © 2011 SciRes. OPEN ACCESS
475
Table.1. The properties thermodynamic of interaction ethanol with SnO2 (110).
Ethanol on SnO2 (110) - based sensor to acetaldehyde
Time(h) E ads
(MJ/mol) RMS
Kcal/mol.oAEelec(V)
E bin (MJ /mol)
1 –297.27 1699 –1489.79 963.60 4 –292.09 1357 –1437.89 1433.78 6 –268.30 1546 –1526.91 992.56 8 –71.13 1421 –1507.98 1189.73
10 –83.66 1363 –1601.32 424.57 11 –153.89 1665 –1444.12 1106.97
Time(h) H
(MJ /mol) Gele
(MJ /mol) E nuc
(MJ /mol)
1 981.88 –10142.46 9845.20 4 1452.07 –9789.16 9962.09 6 1010.85 –10395.19 10126.89 8 1208.01 –10266.33 10195.19
10 442.85 –10901.73 10065.43 11 1125.25 –9831.54 9677.64
an optimization calculation are either an RMS gradient of 0.1 Mcal/mol. Å or a maximum number of cycles that is 15 times the number of atoms involved in the calcula-tion. In general, we must use a gradient limit. For im-proved precision, use a lower gradient limit. For most organic molecules, this will result in an acceptance ratio of about 0.9, which means that about 50% of all moves are accepted. This result shows why surfaces that pro-mote oxidative dehydrogenation reactions tend to be those containing reducible and reoxidisable cations. The residual hydrogen from ethanol adsorption generally desorbs either as H2.
3.1.2. Formation of Ethyl Acetate Now, in environment of reaction, there are ethanol and
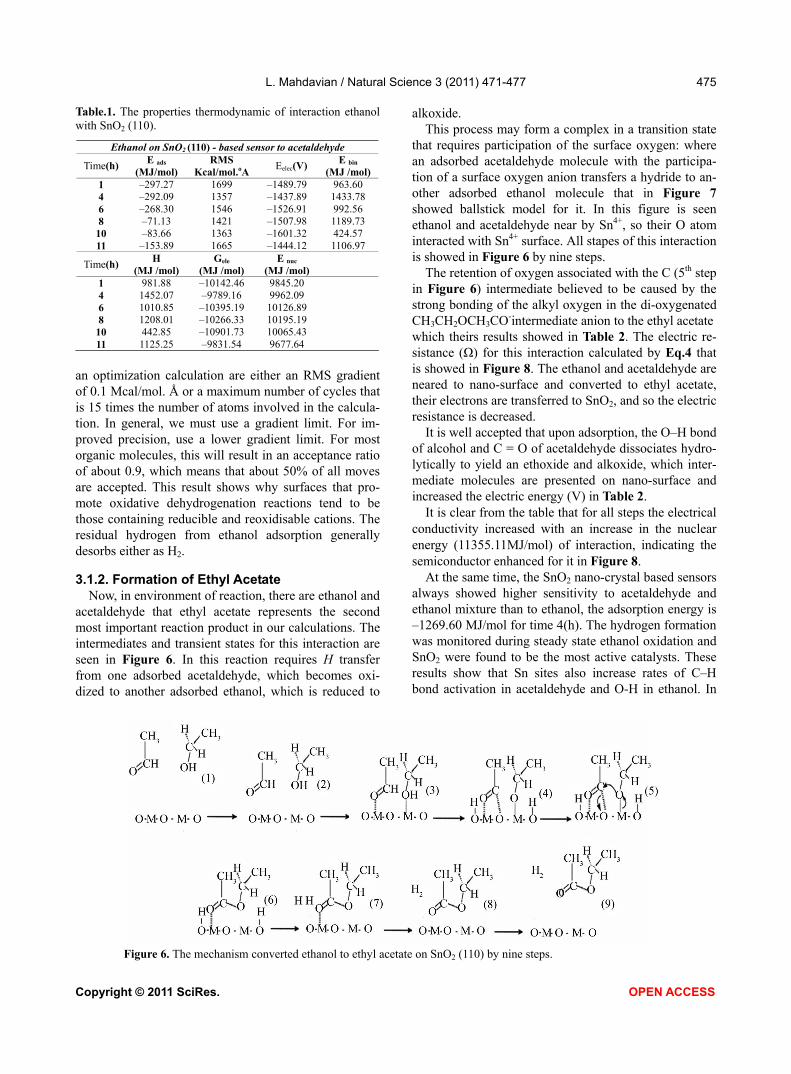
acetaldehyde that ethyl acetate represents the second most important reaction product in our calculations. The intermediates and transient states for this interaction are seen in Figure 6. In this reaction requires H transfer from one adsorbed acetaldehyde, which becomes oxi-dized to another adsorbed ethanol, which is reduced to
alkoxide. This process may form a complex in a transition state
that requires participation of the surface oxygen: where an adsorbed acetaldehyde molecule with the participa-tion of a surface oxygen anion transfers a hydride to an-other adsorbed ethanol molecule that in Figure 7 showed ballstick model for it. In this figure is seen ethanol and acetaldehyde near by Sn4+, so their O atom interacted with Sn4+ surface. All stapes of this interaction is showed in Figure 6 by nine steps.
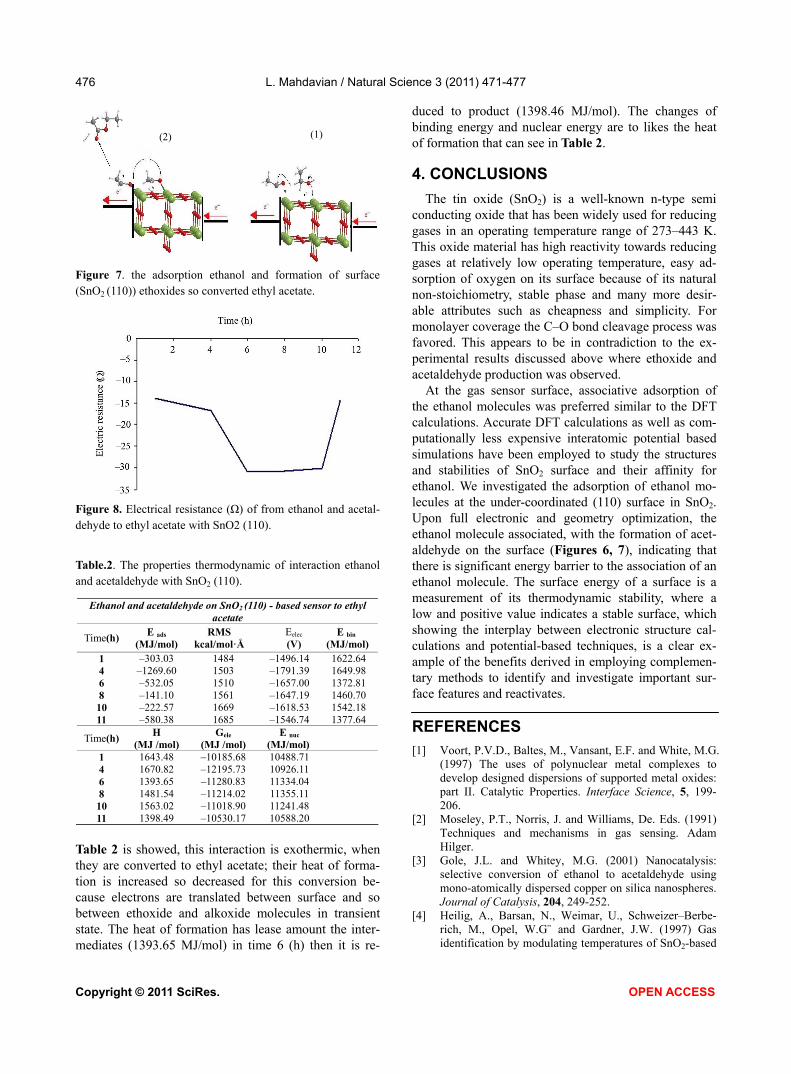
The retention of oxygen associated with the C (5th step in Figure 6) intermediate believed to be caused by the strong bonding of the alkyl oxygen in the di-oxygenated CH3CH2OCH3CO-intermediate anion to the ethyl acetate which theirs results showed in Table 2. The electric re-sistance (Ω) for this interaction calculated by Eq.4 that is showed in Figure 8. The ethanol and acetaldehyde are neared to nano-surface and converted to ethyl acetate, their electrons are transferred to SnO2, and so the electric resistance is decreased.
It is well accepted that upon adsorption, the O–H bond of alcohol and C = O of acetaldehyde dissociates hydro-lytically to yield an ethoxide and alkoxide, which inter-mediate molecules are presented on nano-surface and increased the electric energy (V) in Table 2.
It is clear from the table that for all steps the electrical conductivity increased with an increase in the nuclear energy (11355.11MJ/mol) of interaction, indicating the semiconductor enhanced for it in Figure 8.
At the same time, the SnO2 nano-crystal based sensors always showed higher sensitivity to acetaldehyde and ethanol mixture than to ethanol, the adsorption energy is –1269.60 MJ/mol for time 4(h). The hydrogen formation was monitored during steady state ethanol oxidation and SnO2 were found to be the most active catalysts. These results show that Sn sites also increase rates of C–H bond activation in acetaldehyde and O-H in ethanol. In
Figure 6. The mechanism converted ethanol to ethyl acetate on SnO2 (110) by nine steps.
L. Mahdavian / Natural Science 3 (2011) 471-477
Copyright © 2011 SciRes. OPEN ACCESS
476
Figure 7. the adsorption ethanol and formation of surface (SnO2 (110)) ethoxides so converted ethyl acetate.
Figure 8. Electrical resistance (Ω) of from ethanol and acetal-dehyde to ethyl acetate with SnO2 (110).
Table.2. The properties thermodynamic of interaction ethanol and acetaldehyde with SnO2 (110).
Ethanol and acetaldehyde on SnO2 (110) - based sensor to ethyl acetate
Time(h) E ads
(MJ/mol) RMS
kcal/mol·Å Eelec
(V) E bin
(MJ/mol)1 –303.03 1484 –1496.14 1622.64 4 –1269.60 1503 –1791.39 1649.98 6 –532.05 1510 –1657.00 1372.81 8 –141.10 1561 –1647.19 1460.70 10 –222.57 1669 –1618.53 1542.18 11 –580.38 1685 –1546.74 1377.64
Time(h) H
(MJ /mol) Gele
(MJ /mol) E nuc
(MJ/mol)
1 1643.48 –10185.68 10488.71 4 1670.82 –12195.73 10926.11 6 1393.65 –11280.83 11334.04 8 1481.54 –11214.02 11355.11 10 1563.02 –11018.90 11241.48 11 1398.49 –10530.17 10588.20
Table 2 is showed, this interaction is exothermic, when they are converted to ethyl acetate; their heat of forma-tion is increased so decreased for this conversion be-cause electrons are translated between surface and so between ethoxide and alkoxide molecules in transient state. The heat of formation has lease amount the inter-mediates (1393.65 MJ/mol) in time 6 (h) then it is re-
duced to product (1398.46 MJ/mol). The changes of binding energy and nuclear energy are to likes the heat of formation that can see in Table 2.
4. CONCLUSIONS
The tin oxide (SnO2) is a well-known n-type semi conducting oxide that has been widely used for reducing gases in an operating temperature range of 273–443 K. This oxide material has high reactivity towards reducing gases at relatively low operating temperature, easy ad-sorption of oxygen on its surface because of its natural non-stoichiometry, stable phase and many more desir-able attributes such as cheapness and simplicity. For monolayer coverage the C–O bond cleavage process was favored. This appears to be in contradiction to the ex-perimental results discussed above where ethoxide and acetaldehyde production was observed.
At the gas sensor surface, associative adsorption of the ethanol molecules was preferred similar to the DFT calculations. Accurate DFT calculations as well as com-putationally less expensive interatomic potential based simulations have been employed to study the structures and stabilities of SnO2 surface and their affinity for ethanol. We investigated the adsorption of ethanol mo-lecules at the under-coordinated (110) surface in SnO2. Upon full electronic and geometry optimization, the ethanol molecule associated, with the formation of acet-aldehyde on the surface (Figures 6, 7), indicating that there is significant energy barrier to the association of an ethanol molecule. The surface energy of a surface is a measurement of its thermodynamic stability, where a low and positive value indicates a stable surface, which showing the interplay between electronic structure cal-culations and potential-based techniques, is a clear ex-ample of the benefits derived in employing complemen-tary methods to identify and investigate important sur-face features and reactivates.
REFERENCES
[1] Voort, P.V.D., Baltes, M., Vansant, E.F. and White, M.G. (1997) The uses of polynuclear metal complexes to develop designed dispersions of supported metal oxides: part II. Catalytic Properties. Interface Science, 5, 199- 206.
[2] Moseley, P.T., Norris, J. and Williams, De. Eds. (1991) Techniques and mechanisms in gas sensing. Adam Hilger.
[3] Gole, J.L. and Whitey, M.G. (2001) Nanocatalysis: selective conversion of ethanol to acetaldehyde using mono-atomically dispersed copper on silica nanospheres. Journal of Catalysis, 204, 249-252.
[4] Heilig, A., Barsan, N., Weimar, U., Schweizer–Berbe- rich, M., Opel, W.G¨ and Gardner, J.W. (1997) Gas identification by modulating temperatures of SnO2-based
(2) (1)
L. Mahdavian / Natural Science 3 (2011) 471-477
Copyright © 2011 SciRes. OPEN ACCESS
477
thick film sensors. Sensors and Actuators B: Chemical, 43, 45-51. doi:10.1016/S0925-4005(97)00096-8
[5] Jaegle, M., ollenstein, J.W¨., Meisinger, T., B¨ottner, H., M¨uller, G., Becker, Th. and Braunm¨uhl, C.B.V. (1999) Micromachined thin film gas sensors in temperature pulsed operation mode. Sensors and Actuators B: Chemi- cal, 57, 130-134. doi:10.1016/S0925-4005(99)00074-X
[6] Faglia, G. (1998) Michromachined gas sensors operated by fast pulsed temperature mode for environmental pollutants. Proceedings 6th Micro Systems Technologies, VDE-Verlag, Berlin, pp. S703-S705.
[7] Hellmich, W., M¨uller, G., Braunm¨uhl, Ch.B.V., Doll, T. and Eisele, I. (1997) Field effect-induced gas sensitivity changes in metal oxides. Sensors and Actuators B: Chemical, 43, 132-139. doi:10.1016/S0925-4005(97)00195-0
[8] Idriss, H. (2004) Ethanol Reactions over the Surfaces of Noble Metal/Cerium Oxide Catalysts. Platinum Metals Rev, 48,105-115. doi:10.1595/147106704X1603
[9] DMol3 and CASTEP. Molecular Simulations, San Diego. 1998.
[10] Rantala, T.T., Rantalab, T.S. and Lantto, V. (2000) Electronic structure of SnO2 (110) surface. Materials Science in Semiconductor Processing, 3, 103-107. doi:10.1016/S1369-8001(00)00021-4
[11] Gobernado-Mitre, I., Klassen, B., Aroca, R and DeSaja, J. A. (2005) Vibrational spectra and structure of perchlori- nated metal-free phthalocyanine and lutetium bisphthalo- cyanine. Journal of Raman Spectroscopy, 24, 903-908.
[12] Zverev, V.V., Islamov, R.G., Islamova, F.K. and Vakar, V.M. (1989) Photoelectron spectrum and quantum- chemical structural analysis of N-methyl-N-methoxydia- zene-N-oxide. Journal of Structural Chemistry, 30, 228- 233.
[13] Tiana, G., Sutto, L and Broglia, R.A. (2007) Statistical mechanics and its applications. Physical: A, 380, 241- 251.
[14] Mahdavian, L., Monajjemi, M. and Mangkorntong, N. (2009) Sensor response to alcohol and chemical mecha- nism of carbon nanotube gas sensors. Fullerenes, Nano- tubes and Carbon Nanostructures, 17, 484-495. doi:10.1080/15363830903130044
[15] Mangkorntong, N., Mahdavian, L., Mollaamin, F. and Monajjemi, M. (2008) Sensing of methanol and ethanol
with nano-structured SnO2 (110) in gas phase: monte carlo simulation. Journal of Physical and Theoretical Chemistry (IAU.Iran), 4, 197-203.
[16] Bolzan, A.A., Fong, C., Kennedy, B.J. and Howard, C.J. (1997) Flame spray synthesis of tin dioxide nanoparticles for gas sensing. Acta Crystallographica Section B: Struc- tural Science, 53, 373-380. doi:10.1107/S0108768197001468
[17] Wang, N., Lin, H., Li, J., Zhang, L., Li, X., Wu, J. and Lin, Ch. (2003) Strong orange luminescence from a novel hexagonal ZnO nanosheet film grown on alumi- num substrate by a simple wet-chemical approach. Jour- nal of the American Ceramic Society, 90, 635-637. doi:10.1111/j.1551-2916.2006.01418.x
[18] Oviedo, J. and Gillan, M.J. (2000) Energetics and structure of stoichiometric. SnO2 surfaces studied by first-principles calculations. Surface Science, 463, 93- 101. doi:10.1016/S0039-6028(00)00612-9
[19] Mulheran, P.A. and Harding, J.H. (1992) The stability of SnO2 surfaces. Modelling and Simulation in Materials Science and Engineering, 1, 39-43. doi:10.1088/0965-0393/1/1/004
[20] Slater, B., Catlow, C.R., Gay, D.H., Williams, D.E. and Dusastre, V. (1999) Study of surface segregation of antimony on SnO2 surfaces by computer simulation tehniques. The Journal of Physical Chemistry B, 103, 10644-10650. doi:10.1021/jp9905528
[21] Li, J., Lu, Y., Ye, Q., Cinke, M., Han, J. and Yyappan, M.Me. (2003) Carbon nanotube sensors for gas and organic vapor detection. NanoLetters, 3, 929-933. doi:10.1021/nl034220x
[22] Liu, M., Shi, G., Zhang, L., Zhao, G. and Jin, L. (2008) Electrode modified with toluidine blue-doped silica na- noparticles, and its use for enhanced amperometric sensing of hemoglobin. Analytical Biochemistry, 391, 1951-1959.
[23] Fu, Q. and Liu, J. (2005) integrated single-walled carbon nanotube/microfluidic devices for the study of the sens-ing mechanism of nanotube sensors. The Journal of Physical Chemistry B, 109, 13406-13408. doi:10.1021/jp0525686