convergence of information technology and ... - · pdf fileconverged systems that combine...
TRANSCRIPT

Printed in Japan (H) XX-E345 0913www.hitachi.com/rev
HITACHI REVIEW Carried on the Web
HITACHI REVIEWVolume 62 Number 7 September 2013
Convergence of Information Technology and Control Systems for Social Innovation Business
HITACHI REVIEW

Hitachi Review Vol. 62 (2013), No. 7 352
RAPID regional population growth, particularly in
emerging economies, is prompting concerns about
resource shortages and damage to the environment.
Meanwhile, aging social infrastructure has been
recognized as a tangible problem in developed
economies especially. To overcome the various issues
we currently face and build sustainable societies, work
is being undertaken around the world on smart grids,
smart cities, and other new social infrastructure with
the aims of diversifying and making effective use
of resources, and optimizing the operation of urban
infrastructure.
This new social infrastructure is giving consumers
a more important role than they have had in the past.
Smart grids, for example, allow consumers to also
act as suppliers by generating electric power from
renewable or other energy sources, and may also
require demand to be adjusted to match supply. In
response to this paradigm shift in social infrastructure,
it is necessary to come up with solutions that achieve
system-wide optimization to satisfy the wants and
needs of different stakeholders, including both
suppliers and consumers. Hitachi believes that the
sophisticated application of information technology
(IT) is essential to achieving this goal.
Hitachi has for many years been involved in
the provision of information and control systems
for social infrastructure such as energy, water, and
transportation. Based on this experience, our Social
Innovation Business in recent years has involved
converged systems that combine information and
control. That is, the objective of our work has been the
“global supply of safe and secure social infrastructure
enhanced by the use of IT.”
This issue of Hitachi Review describes initiatives
involving systems that converge information and
control and use advanced IT to underpin this
paradigm shift in social infrastructure. It also features
a special contribution by Leon R. Roose from the
University of Hawaii, entitled “Securing Paradise in
Hawaii,” that describes a smart grid demonstration
project underway in Hawaii. Other articles describe
Hitachi’s latest work on solution development in the
fields of energy, water, operation and maintenance
services and the software platforms that provide the
foundations for these initiatives, including simulation,
data analysis techniques, and security technology.
Another article looks at Hitachi’s involvement in
international standardization.
Through this issue of Hitachi Review, it is my
hope that you will be able to learn something of
Hitachi’s activities targeted at our Social Innovation
Business, and that our platform technologies and other
solutions prove useful to your business or in social
infrastructure innovation.
Toru KimuraCOOInfrastructure Solutions BusinessInfrastructure Systems CompanyHitachi, Ltd.
IT Underpinning Paradigm Shift in Social Infrastructure

special contribution
Securing Paradise in HawaiiA Japan — Hawaii Partnership to Develop Smart Technologies and Unlock a Renewable Energy Future
Leon R. Roose
INTRODUCTION
AS a life-long Hawaii resident, I am blessed with the opportunity to live in a true island “paradise.”
Hawaii is a land of seemingly endless beaches and surrounding ocean that you can swim and surf in year round, where days of ample sunshine are cooled by consistent trade winds that keep hot weather at bay. The enjoyable climate in Hawaii is the perfect setting for a day outdoors, whether you find yourself relaxing beachside sipping your favorite beverage of choice, or trekking along a lush mountain hillside beneath the soaring Koolau cliffs that have been carved over the millennia to perfection by countless waterfalls.
If you want to see things from an ocean vantage point, take one of the many tours ranging from Pearl Harbor excursions, sunset cruises, whale watching experiences, a ride on a glass bottom boat, or even climb aboard a submarine and view ocean wonders from below. Whether it is tours, fishing, horseback riding, shows, restaurants, or shopping galore, there are many things to do and experience in Hawaii.
Steeped in history, you can visit Iolani Palace, the only true royal palace in the United States, or go to the Pali Lookout and experience breathtaking views of Kaneohe Bay while learning about the history of King
Kamehameha, his unification of the Hawaiian islands and establishment of the monarchy. In traveling about the islands, one will not only see the beautiful blend of ethnicities in the faces of island residents and taste the rich cultural diversity of the local cuisine, but also experience a unique spirit of aloha bestowed to locals and visitors alike.
Even if you lived in Hawaii your entire life as I have, you wouldn’t be able to do and experience everything available. There is something for everyone to do and enjoy. Everything we dream of when we think of our “perfect” life. Well, almost perfect ….
PARADISE IN PERIL?
That envisioned perfection is lost when one considers that Hawaii, like many island or isolated communities across the wor ld, is faced with a profound and fundamental challenge. It is a challenge that threatens the entire Hawaiian economy, its environment, its security, and the quality of life of its residents. That challenge is the overdependence on oil; and imported oil, to be precise. Yes, that black, sticky, oozing stuff that is the product of dinosaurs of long ago. Imported oil is the primary means by which Hawaii powers its modern society. We ship in and burn though oil at an astounding rate. Hawaii today is roughly 90% dependent on fossil fuels, the vast majority of which is oil, with a third of all imports going directly to the production of electricity across our islands. The other two-thirds primarily supplies aircraft fuel demands and automobile and marine transport needs. The overdependence on oil has placed Hawaii in a precarious and costly predicament.
Hawaiian Electric Company (HECO), with a service territory that covers the most populated island of Oahu, is a vertically integrated investor-owned electric utility with two wholly-owned subsidiary utilities, Maui Electric
Hitachi Review Vol. 62 (2013), No. 7 353

hydro, biomass, waste-to-energy, and biofuels are available in Hawaii today, and emerging technologies such as wave and ocean thermal energy conversion are the focus of continuing research and development (R&D) work.
SUCCESS OF STAKEHOLDER ALIGNMENT AND BOLD ENERGY POLICY
Most Aggressive Clean Energy Goals in United StatesRecognizing the need for an energy paradigm shift in
Hawaii, local and national government joined with the Hawaii utilities to chart a new direction for energy policy and development. This alignment of stakeholder interests and establishment of an aggressive 70% clean energy target for Hawaii by the year 2030, with 30% realized by reduction in energy use through energy efficiency and 40% by electricity produced from renewable energy resources, were set in 2008 under the Hawaii Clean Energy Initiative (HCEI) energy agreement. The HCEI process was strongly supported by the U.S. Department of Energy and the energy agreement was ultimately signed by the Hawaiian Electr ic companies, the Governor of Hawaii, the Hawaii Department of Business, Economic Development & Tourism, and the Hawaii Office of Consumer Advocacy. The Hawaii Legislature then mandated these Renewable Portfolio Standards (RPS) goals into state law.
Today, this alignment of stakeholder interest and bold policy has resulted in Hawaii having the most aggressive RPS goals in the country. Backed by policy-driven renewable energy incentives (in the form of feed-in tariffs, a popular net energy metering program, and generous state and federal tax credits) and combined with the high cost of electricity, these RPS goals have ignited a red-hot market in renewable energy development in Hawaii.
With these policy measures now in place, long-term fixed-price contracts for new renewables offer a growing hedge against rising oil prices. Absent the risk of a fuel component, the fixed price of many renewables today such as geothermal, wind, and solar energy is competitive with the volatile and uncertain prices of oil-fired generation. The last several years have seen rapid growth in the development of renewable energy projects in Hawaii, particularly wind and solar energy technologies. At the close of 2011, the Hawaiian Electric companies reported 12 percent of electricity sales from renewable resources, a significant step in the right direction.
special contribution 354
Company (MECO), and Hawaii Electric Light Company (HELCO). MECO serves the county of Maui (Maui, Lanai and Molokai islands), and HELCO serves Hawaii Island. Together, HECO and its subsidiaries serve 95% of the State of Hawaii’s nearly 1.4 million residents. There are no transmission interconnections between the islands so each island’s generating system must stand alone without backup from its neighbor island utility grids. And with 2,500 miles of open ocean between Hawaii and Los Angeles, and 3,900 miles separating Hawaii from Japan, Hawaii’s extreme isolation places it at the end of a long and risk-exposed oil supply chain. This risky dependence on an increasingly scarce commodity for its energy production has resulted in the highest and most volatile electricity rates in the United States.
As a point of reference, residential electricity rates on the islands of Molokai and Lanai topped 44 cents/kWh in March, 2012, while rates on Hawaii island and Maui exceeded 42 cents/kWh and 36 cents/kWh, respectively. On the island of Oahu, where rates are the lowest, residents paid 33 cents/kWh to keep their lights on. In contrast, average residential rates in the United States over the same time period were 11 – 12 cents/kWh. This high cost of electricity ripples throughout the Hawaiian economy and is reflected in the cost of all goods and services. Since the significant run-up in world oil prices in 2008, the price of paradise in Hawaii has undoubtedly gone up, eating away at household incomes and eroding business profitability.
However, as is often the case when one is confronted with a great challenge, significant opportunity for change and improvement resides therein. That opportunity for Hawaii is found in the significant renewable energy resource potential that exists across the islands. Proven commercial technologies like wind, solar, geothermal,

Growth in New Wind Energy and Solar Photovoltaic Development in Hawaii
In 2011 and 2012 alone, 99 MW of new wind projects came on-line on the island of Oahu, and 42 MW of new wind developments were added to the island of Maui, bringing the total wind energy on Maui, for example, to 72 MW. With these latest additions of wind power projects, there is now more than 200 MW of wind power in commercial operation across the Hawaiian islands today. This is significant, when one considers that the annual peak electricity demand on Hawaii island is less than 200 MW.
Photovoltaic (PV) development has been growing at an exponential rate in Hawaii for several years now. At the end of 2011, more than 10,000 customer-sited PV systems on Oahu, Hawaii Island, and in Maui County totaled more than 78 MW. In 2012, the year closed with Hawaiian Electric reporting more than 171 MW of PV installed across its service territory. In effect, over the last two years alone, rooftop PV installations have doubled year over year across the state, and that growth trend continues into 2013.
MAKING MAUI’S SMART GRID
With the rapid proliferation of renewable energy resources on each of the isolated power grids across the Hawaiian Islands, significant focus is being brought to the effective integration of large amounts of intermittent and variable renewable energy resources such as wind and solar power (both utility scale and distributed applications).
At present, the island of Maui has a notable 72 MW
of wind energy, more than 25 MW of PV, and 12 MW of biomass generation in operation. In context, this power feeds a grid with an annual peak demand of approximately 200 MW and a minimum load at night of only 85 MW. Undoubtedly, the Maui power system has a high penetration of renewable energy, most of which is intermittent and variable in nature. With the operational challenges posed by these renewable resources, the power grid on Maui is quickly becoming a center of Research, Test, and Evaluation (RT&E) activities for the development of smart energy technologies, control systems, and algorithms to enable continued growth in renewable energy developments.
Three exciting smart grid RT&E projects are underway on the island of Maui and when combined form the making of a Maui “smart grid.” Two of the projects are smart grid projects funded by the U.S. Department of Energy and led by the Hawaii Natural Energy Institute (HNEI), University of Hawaii, with the first focused on home energy use and distribution system management and the later on development of a standards-based smart inverter (a device that converts DC power to AC power) and related communications and control technology to enable high penetration of rooftop PV on distribution circuits.
The third project on Maui is a smart grid project funded by the New Energy and Industrial Technology Development Organization (NEDO) of Japan and focused on enabling high levels of distributed PV and electric vehicles on Maui, where the installed wind capacity is already 35% of peak and 85% of minimum system demand. Hitachi, the lead technology provider for the NEDO-funded project, has been working in close collaboration with its Hawaii partners and project
Hitachi Review Vol. 62 (2013), No. 7 355

stakeholders.Through such collaborative engagements, which
involve the government, utilities, community volunteers, academia, and global industry giants like Hitachi, new technology and clean energy “know-how” is being developed on Maui while real-world solutions to the islands’ pressing energy needs are being realized. The end-goal of these multi-disciplinary projects is to develop new technologies and operating strategies for rapid transition from RT&E to full commercial deployment in Hawaii and abroad. Executing these demonstration projects in close collaboration with the local utility on a live electric grid (in contrast to research conducted solely in a virtual/simulated or closed laboratory environment) yields ideal conditions to prove novel concepts and learn lessons about advanced energy technologies and solutions.
A systems engineering approach is brought to all three projects to execute a well-structured and phased design process that incorporates RT&E objectives and an implementation strategy of working closely with MECO, the Maui community, and other key stakeholders like HNEI. To realize an integrated smart grid architecture, the approach will utilize and explore the best available smart grid technology concepts in topic areas such as:(1) Advanced sensing and measurement to provide planning and operational visibility that extends to the edge of the power grid and supports programs and activities that benefit both grid operation and end-users, such as demand side management and load control(2) Advanced components and subsystems such as energy storage, power electronics and advanced-function inverters for high renewable penetration, and grid-to-vehicle and vehicle-to-grid technologies(3) Integrated communications and security covering both the physical and cyber layers(4) Advanced control methods and topologies such as coordinated system control layers and distributed controls, grid automation, and adaptive protection and control to address the expansion of distributed resources and two-way power flow(5) Decision and operations support tools, such as renewable resource energy forecasting aimed to improve operational efficiencies and reliability (through, for example, tighter management of operating reserves), forecasting of demand response, distributed generation and storage resources, and dispatch of active and reactive power though distributed energy resources to optimize voltage profile and power flow losses.
Ultimately, focus will be brought on extending the lessons learned in Hawaii to the broader Pacific-Asia region, leveraging funding, collaboration, and knowledge exchange opportunities to the fullest.
CONCLUSION
The common mission today is to decisively and irreversibly get Hawaii off of imported oil for electricity and ground transportation. To achieve that mission, our aim is not just to meet the RPS goals, but to exceed them. We will aggressively reduce our energy use and add as much renewable energy as possible, as soon as possible, at prices that provide more stable and lower energy costs. Investing to support renewable energy now will provide greater energy security and environmental and economic well-being for Hawaii’s future.
With the daily progress being made, I am optimistic that the paradise found in Hawaii will remain secure for the long-term. I hold this optimism with the knowledge that capable and dedicated individuals working in collaboration can and will solve the energy challenges we face today. And the solutions that will be derived in the process of unlocking a renewable energy future for Hawaii will ultimately be a gift to others, charting a promising path for our collective future.
special contribution 356
Leon R. Roose
Mr. Roose joined the faculty of the Hawaii Natural Energy Institute (HNEI),
School of Ocean and Earth Science and Technology, University of
Hawaii at Manoa, in 2012 as a Specialist in the integration and analysis
of energy technologies and power systems. Prior to joining HNEI, he was
with the Hawaiian Electric Company for 19 years serving in numerous
management roles, including responsibility for renewable energy planning
and integration, smart grid planning and projects, distribution planning,
transmission planning, generation resource planning and procurement,
the purchase and distribution of fuel to utility generating plants across
the service territory, and the negotiation of power purchase contracts for
the Hawaiian Electric utilities. Mr. Roose also directed major programs
across all three companies, including Hawaiian Electric’s commitment
to integrate large-scale wind energy resources via a proposed HVDC
undersea cable linking the islands. He is also a licensed attorney and
worked in private law practice in Hawaii and has held the position of
Associate General Counsel at Hawaiian Electric. He holds a B.S. in
Electrical Engineering and a J.D. from the University of Hawaii.

Hitachi Review Vol. 62 (2013), No. 7 357
Convergence of Information Technology and Control Systems Supporting Paradigm Shift in Social Infrastructure
Yoshiki Kakumoto, Ph. D.
Takahiro Fujishiro, Ph. D.
Yoshihito Yoshikawa
Takashi Fukumoto, Ph. D.
PARADIGM SHIFT IN SOCIAL INFRASTRUCTUREGIVEN the environmental, demographic, and various other issues that social infrastructure faces, taking a consumer-oriented approach is becoming increasingly important.
With energy infrastructure, there is a trend away from rigid service structures that operate unidirectionally from suppliers to consumers and toward collaborative structures in which both sides interact. In the case of smart grids, for example, prosumers(a) act as suppliers of electric power that they generate from renewable or other sources of energy. In Japan, as a response to the power shortages that resulted from the Great East Japan Earthquake, consumers have collaborated with suppliers to keep the electric power system working reliably, including measures such as saving power and managing demand. Inevitably, this collaboration between consumers and suppliers involves the participation of stakeholders with different interests. The managers responsible for the overall system must find an optimum system-wide solution that satisfies different factors, such as balancing supply vs. demand, requirements vs. service levels, and viability vs. economics, and that takes account of numerous constraints, including the different considerations of the environment, suppliers, and consumers.
Meanwhile, in developed economies in particular, social infrastructure equipment is aging. The efficient maintenance of equipment is an important issue for both suppliers and consumers.
Hitachi has experience with the construction of information and control systems for energy, water, transportation, and other forms of social infrastructure.
In recent years, Hitachi has been working on the development of social infrastructure systems that converge information and control as part of its Social Innovation Business, the goal of which is, “the global supply of social infrastructure that is safe, secure, and enhanced by the use of information technology (IT)” (see Fig. 1).
This issue of Hitachi Review describes Hitachi’s recent work on the technologies and other solutions that it seeks to use in response to the paradigm shift in comprehensively optimized social infrastructure, from the perspectives of both suppliers and consumers.
TRENDS IN SOCIAL INFRASTRUCTUREThis section describes the problems behind the
paradigm shift in comprehensively optimized social infrastructure, and the new social infrastructure systems that support this paradigm shift.
Demographic ProblemsThe United Nations has predicted that global
population will increase from approximately 7.0 billion now to around 9.3 billion in 2050. Emerging economies are experiencing not only population growth but also increasing urbanization, with approximately 69% of the world’s population expected to be living in cities by 2050. Similarly, the global gross domestic product (GDP) is expected to grow from $US74 trillion in 2010 to $US141 trillion in 2030, with Asia accounting for roughly half of this total [based on data from the International Monetary Fund (IMF) and other sources collated by the Hitachi Research Institute].
It is anticipated that these changes will also bring problems such as global shortages of fossil fuels, water, and other resources, and the degradation of urban environments due to overcrowding. In seeking to overcome these problems and create sustainable societies, the issues that need to be resolved in
(a) Prosumers A word coined by combining “producer” and “consumer,” meaning
a consumer who also acts as a producer. In the energy field, it refers to consumers who also produce energy, by generating electric power from renewable energy, for example.

Convergence of Information Technology and Control Systems Supporting Paradigm Shift in Social Infrastructure 358
the future are becoming increasingly prominent, including resource diversification, more efficient use of resources, recycling, and making cities more compact(1).
Countries around the world are engaging in a variety of activities aimed at developing new social infrastructure systems for overcoming these challenges. Smart grids are an example of one such measure for dealing with energy resources(2), and progress is being made on initiatives such as the development and demonstration of technology for implementing these power systems, together with policies encouraging the use of renewable energy. Other examples from the field of water resources include measures that support water reuse, including water recycling and large-scale seawater desalination.
Aging of Social InfrastructureThe top priorities for social infrastructure operators
(suppliers) include ensuring safety and maintaining service levels, and they have spent a lot of effort on maintenance in the past. Accordingly, there has always been a strong demand for ensuring that maintenance is cost-effective while still maintaining safety and the level of service.
Meanwhile, the problem of aging equipment and machinery on both the supply and demand sides of social infrastructure is becoming increasingly evident in developed economies in particular. In Japan, for example, the quantity of social infrastructure built more than 50 years ago is predicted to increase rapidly in the future. Examples include road bridges, river works, and sewage plants. Inevitably, this is expected to result in an increase in spending on maintenance
and upgrades, with predictions that if expenditure continues at current levels, it will exceed the FY2010 budget for new capital spending by the late 2030s(3).
Ensuring that maintenance is both efficient and effective requires total management that extends from the routine through to the medium and long term. Measures for asset management (meaning the efficient management of capital investment in equipment and machinery) have already been introduced(4), and there is a need to extend it to a wide range of equipment and machinery belonging to both suppliers and consumers.
NEW SOCIAL INFRASTRUCTURE SYSTEMSThis section gives an overview of new social
infrastructure systems such as smart grids and asset management, and considers the challenges facing their implementation.
Smart GridsConsumers can turn themselves into prosumers
and participate in the supply of electric power through greater production and effective utilization of renewable energy, which also provides a means of resource diversification, and also through energy savings and other measures for using energy efficiently. Because renewable energy is influenced by the natural environment, generation can exceed demand at some times and be inadequate at others. In addition to balancing supply and demand by using batteries to store excess electric power, other ways of dealing with this include “demand response” (DR) whereby suppliers adjust the level of demand by requesting consumers to shift or cut peak demand(5). Fig. 2 shows an example of cutting peak demand for electric power.
Traffic management system
Water management system
Energy management system
Business applications
MDM Knowledgeservice EAM
Information and control platform
Information and control infrastructure
GIS
Info
r-m
atio
n
Supp
lier
Con
sum
er
Con
trol
Tariffcalculation
Operation andmaintenance
Electric powerdistribution system
Distributed powersupply management
Demandresponse
EV chargingfacility
Office orretail building
Home
MDM: meter data management EAM: enterprise asset management GIS: geographic information system EV: electric vehicle
Fig. 1—Social Infrastructure Systems that Converge Information and Control.Hitachi is using advanced IT to converge information and control systems and help resolve the new issues faced by social infrastructure.

Hitachi Review Vol. 62 (2013), No. 7 359
The system responsible for overall control obtains information about consumer loads from smart meters and other sensors. If a shortage of electric power is predicted, it then either issues requests to consumers to reduce their power consumption or controls their equipment remotely. The supplier pays incentives to consumers in proportion to the amount by which they reduce power consumption.
Asset ManagementWhile standard practice in the past for maintaining
the equipment and machinery used for social infrastructure has been to conduct periodic inspections in person, a more desirable approach is to inspect this equipment as and when needed based on its condition. Fig. 3 shows a new approach to asset management involving the combined utilization of the diverse data obtained from sensors and other measurement devices together with information from other sources. The
system presents this composite data in map format and provides an assessment of equipment condition based on analysis and diagnostic functions. It also provides clear information on parameters such as failure rates and maintenance costs for purposes such as capital investment and maintenance planning for equipment and machinery.
Delivering this series of processes in the form of an IT-based service aids asset management for the equipment and machinery used by the suppliers who operate social infrastructure, and also that belonging to consumers such as factories, office buildings, or homes.
Challenges for New Social Infrastructure Systems
Taking a smart grid as an example, the system responsible for overall management has two areas that are difficult to control. The first is the natural environment, including sunlight and wind. Because the
Data onmovementsof people
Weatherand disasterinformation
Storage ofactual data
Information andcontrol infrastructure
Service operators
Smart meterLoad information
Charging information
BillingRequest reduction in use
Generation information
Control level of supply
Charging and discharging information
Consumers
Electricenergy storage
Generation
Minimize demand without inconvenience.
Incorporate into generation plans.
• Demand prediction• Optimization
Demandresponse system
Fig. 2—Demand Response.“Demand response” means consumers and suppliers cooperating to adjust the balance of supply and demand for electric power by shifting or cutting peaks in consumer power consumption.
Managers
Management
Location
Turbines, pumps, motors, ...
Usageinformation
Administration
Maintenance
Optimization
Capitalinvestment
Maintenance costsWork progress and outcomesWorkflowMaintenance
planning
Productivity
Mai
nten
ance
pol
icie
s
Infrastructure assetmanagement system
Storage ofactual data
Infrastructureinformation (big data)
Maintenance records ...
Operations information Vibration, strain, ...
Weather anddisaster
information
Geospatialinformation
Consumers
Vehicles
Equipment and machinery Facilities and buildings
• Presentation• Analysis• Simulation
Fig. 3—Asset Management.Asset management helps improve the efficiency of social infrastructure maintenance through the combined utilization of data obtained from sensors and other measurement devices with various information from other sources.

Convergence of Information Technology and Control Systems Supporting Paradigm Shift in Social Infrastructure 360
amount of electric power generated from these sources cannot be determined in advance, there are concerns about their impact on the power system. Accordingly, the installation of large amounts of renewable energy capacity will need to be accompanied by accurate techniques for predicting power output and estimating the status of the grid.
The other difficulty relates to how suppliers handle the requests they issue to consumers. If variations in the output of renewable energy are to be dealt with by adjusting demand, there is a risk that these adjustments will be inadequate because of a mismatch between what the supplier requests and the specific requirements of different consumers. This means there is a need for arrangements that are beneficial to both suppliers and consumers, and that satisfy requirements such as grid stability (as required by the supplier) and the provision of incentives (that benefit the consumer) simultaneously and in realtime(b) (see Fig. 4).
Also, asset management requires technology for the collection and analysis of information from large numbers of sensors so that it can accurately assess the status of the machinery and other equipment and utilize this information for timely maintenance. It is also necessary to deliver services in ways that suit the different phases of the social infrastructure lifecycle, including installation, growth, and maturity.
A common feature of these functions, whether it be predicting the natural environment, analyzing consumer behavior patterns, or collecting large quantities of data for analysis and service delivery, is that they all require the use of advanced IT.
USE OF ADVANCED IT TO CONVERGE INFORMATION AND CONTROL
The recent breakthroughs in information platforms described below mean that, compared to the past, very large amounts of computing resource are now available at low cost.(1) In addition to improvements in per-server performance, computing power with high speed and capacity has been made available by the emergence of technologies for large-scale distributed processing such as virtualization and cloud architectures.(2) Fixed line and wireless communications with high speed and capacity, such as optical and machine-to-machine (M2M) communication systems, have become available, allowing measurement data to be collected in realtime from smart meters and other measurement devices.(3) With advances in semiconductor technology, a wide range of sensors suitable for use in social infrastructure have been made smaller and more sophisticated with a wider range of functions, including radio frequency identification (RFID) tags, temperature sensors, strain gauges, and gas detectors.
It is easy to imagine how this latest advanced IT can be utilized in information and control systems to resolve the issues facing new social infrastructure systems. Fig. 5 shows the system configuration framework. The framework includes use of high-capacity local area networks (LANs), M2M communications, and sensors and other measurement devices installed in the social infrastructure to collect information from it in much greater quantity and level of detail than was ever possible in the past. In other words, this is what has come to be known as “big data.”
The information and control infrastructure is made up of standard functions for the management and analysis of this big data, and for the effective use of the associated information and knowledge in business applications. Specific functions include meter data management (MDM) for collecting and managing sensing data from sensors and other measurement devices and supplying it to other systems; knowledge service functions that perform analysis, diagnosis, and simulation of this data so that it can be put to
(b) Realtime The term “realtime” is used here to indicate that processing is executed
as soon as it is requested. Control systems typically need to operate with cycle times in the range of milliseconds. In this issue of Hitachi Review, however, “realtime” is used in the wider sense of the on-demand delivery of the required services when they are needed.
• Optimization of capital investment
• Maintain earnings.
• Offer incentives for cooperation.
• Appropriate tariffsEnsure
economicperformance.
Ensureviability.
System-wideoptimization
• Ensure convenience and comfort.
• Maintain access to important facilities.
• Stability of power system
ConsumersSuppliers
Fig. 4—Requirements of Suppliers and Consumers.It is necessary to ensure both economic performance and viability in the form of system-wide optimization by satisfying the requirements of both suppliers and consumers, simultaneously and in realtime.

Hitachi Review Vol. 62 (2013), No. 7 361
requires knowledge and know-how from the relevant industries. Hitachi aims to work with infrastructure operators to supply operational know-how by drawing on its past experience in the construction of social infrastructure systems.
ACTIVITIES BY HITACHIHitachi is working on packaging the products it
offers for social infrastructure systems created from a convergence of information and control by expanding beyond systems and components to also include services, and is implementing this strategy through activities such as smart grid demonstrations in Japan and elsewhere. The following sections introduce the technologies and other solutions covered in this issue of Hitachi Review.
Energy SolutionsSome of the functions of demand response are
already in use overseas, and activities in Japan include four regional demonstrations(c). Also, a service for minimizing peak demand was introduced in 2012 in response to the constrained supply of electric power, with Hitachi participating as an operator of demand response schemes. This involved a service for limiting consumer demand through coordination with aggregators that handle energy management for groups
practical use; enterprise asset management (EAM) for managing the various equipment (assets) used in social infrastructure; and geographic information systems (GISs) that use maps for the visual display of information about assets and the results of analysis and diagnostic processing. The information and control platform not only coordinates these non-application-specific functions and business applications, it also supports efficient operation by coordinating the operation of different social infrastructure.
In these ways, information and control infrastructure incorporating the latest advanced IT in its back-end systems supplies valuable information and knowledge required for information and control applications in realtime. This allows information and control functions to interoperate in realtime (what Hitachi calls “the convergence of information and control”) and provides suppliers and consumers with added value by completing sophisticated tasks that were not possible in the past. That is, it makes it possible both to maintain power system stability on smart grids and deliver incentives to consumers, simultaneously and in realtime, and also to provide for timely maintenance of social infrastructure by performing analysis and diagnostics on large quantities of sensing data.
Meanwhile, infrastructure operators and equipment suppliers in Japan have worked together to develop different system technologies and build social infrastructure systems. As an equipment supplier, Hitachi has experience in the construction of social infrastructure systems in a variety of fields.
The use of big data for analysis, diagnosis, and simulation as described above to identify value
Big data MDM Knowledgeservice EAM GIS
Information and control infrastructure
Business applications
Information and control platform
Billingmanagement
Data collectionand storage
Information andknowledge delivery
Asset andequipment
management
Energy, transportation,and water
Buildings andfactories
Charging stationHomes
Equipmentoperation
Monitoringand control
High-capacity LAN or M2M communications
Social infrastructure
LAN: local area network M2M: machine to machine
Fig. 5—Framework for Systems that Utilize Advanced IT to Converge Information and Control.“Convergence” means that information and control functions interoperate in realtime to provide suppliers and consumers with added value by completing sophisticated tasks that were not possible in the past.
(c) Four regional demonstrations These smart community demonstrations are being undertaken at
Kitakyushu City, Kansai Science City (Keihanna), Toyota City, and Yokohama City. The energy management system demonstrations are currently in progress and combine home energy management systems (HEMS), building and energy management systems (BEMS), EVs, and other technologies for applications that include demand response and giving users access to information on energy use.

Convergence of Information Technology and Control Systems Supporting Paradigm Shift in Social Infrastructure 362
maturity. An article in this issue describes an example application of these services to a railway system (see page 370).
Knowledge Service FunctionsHitachi is developing knowledge service functions
that supply operation and maintenance services and industry-specific solutions for social infrastructure. Simulation technologies being developed to support energy solutions include a smart grid simulator and energy network simulation techniques that handle both electric power and heat (see page 376).
To make use of big data, Hitachi is working on the development of “things,” “people,” and “concepts” analysis techniques and services. An article in this issue describes an application for big data involving equipment such as gas turbines and building facilities that deals with “things” (equipment and machinery) from the perspectives of information and control (see page 384).
Information and Control Platform and Information Security Technology
Interoperation between different types of social infrastructure such as electric power and transportation provides various forms of value to consumers. Hitachi is developing information and control platforms that provide a wide range of data required by systems in realtime while also maintaining the interconnectivity, reliability, and expandability of the interoperating social infrastructure (see page 389).
Maintaining security is an important consideration for social infrastructure systems. Hitachi has experience in the development of various systems and other technologies for security, with current cyber security developments for social infrastructure including advanced encryption techniques that impose a low processing load, and security technologies that reduce the operational load on social infrastructure systems (see page 397).
Global DeploymentThe public and private sectors in Japan have
increasingly been working together to deploy Japanese social infrastructure in emerging economies and other parts of the world. There is also a rapidly strengthening global trend toward requiring social infrastructure to comply with international standards. If Japan is to proceed with the deployment of its social infrastructure internationally, there is a need to work on service standards that define the scope of
of buildings in response to requests from electric power companies to change the level of demand.
Water SolutionsHitachi’s activities include seawater desalination
and water treatment businesses in India and elsewhere. It is also promoting its Intelligent Water System concept for using advanced IT in water infrastructure (such as water treatment and distribution facilities) as a way of overcoming problems such as water shortages, the aging of water infrastructure, and dwindling numbers of technical personnel. This focuses on water to optimize the overall system for the flow of water, energy, and information, and includes development work in the fields of business management, water infrastructure operation, water treatment control, and water treatment equipment (see page 364).
Transportation SolutionsHitachi has experience with the implementation
of intelligent transport systems (ITS) and telematics systems that deliver a variety of information from center systems to vehicle-mounted devices. To help resolve urban environmental problems, Hitachi is also participating in demonstrations that provide operational support for the reduction of carbon dioxide (CO2) emissions from public transportation. Meanwhile, the Japan-U.S. Island Grid Project of the New Energy and Industrial Technology Development Organization (NEDO) currently in progress in Hawaii is trialing the coordination of EV management with the electric power distribution system so that EVs can be used to make efficient use of renewable energy (see page 353).
Operation and Maintenance ServicesTo ensure the efficient operation and maintenance
(O&M) of social infrastructure, Hitachi is also proceeding with the development of O&M services that utilize advanced IT to supply extensive know-how and knowledge in the field of operation and maintenance. Social infrastructure has been developed to different levels in different parts of the world. The objectives of these O&M services are to work in collaboration with infrastructure operators to supply highly flexible services for this social infrastructure, and to deliver the services in ways that can adapt to the circumstances in each country, such as changes in the business environment faced by social infrastructure operators, and in accordance with the relevant stage of development such as installation, growth, or

Hitachi Review Vol. 62 (2013), No. 7 363
to become sufficiently clear. Hitachi has experience in the supply of technologies such as those for highly reliable realtime techniques, network control, and autonomous decentralized systems. Hitachi intends to help overcome various problems and other challenges that manifest on a global scale by continuing to focus on advanced IT for these technologies and on implementing information and control convergence systems that are as closely interlinked as their name suggests.
REFERENCES(1) T. Onishi et al, “Low-carbon Cities: Future Urban
Development,” Gakugei Publishing (Jan. 2010) in Japanese.(2) Energy Forum, “The Impact of the Smart Revolution,” (Apr.
2010) in Japanese.(3) “Formulation of Basic Technology Plan of Ministry of Land,
Infrastructure, Transport and Tourism” (Apr. 2008), http://www.mlit.go.jp/kisha/kisha08/13/130414_.html in Japanese.
(4) Y. Takishita et al, “Application of ICT to Lifecycle Support for Construction Machinery,” Hitachi Review 62, pp. 107–112 (Mar. 2013).
(5) A. Yokoyama, “Technology for Building Smart Grids and its Standardization,” Japanese Standards Association (Jun. 2010) in Japanese.
different businesses so that they can be demarcated. Japanese social infrastructure operators and equipment suppliers are working with the relevant government agencies on the presentation of proposals to the International Organization for Standardization (ISO), International Electrotechnical Commission (IEC), International Telecommunication Union (ITU), and other international standards bodies in fields such as smart grids and smart cities. Hitachi is also cooperating with these activities (see page 402).
BUILDING SMART INFRASTRUCTUREThe topics covered in this article have included the
macro trends associated with social infrastructure, the issues that need to be resolved to achieve a paradigm shift in social infrastructure, and what Hitachi is doing to create a convergence of information and control that utilizes advanced IT. This advanced IT (specifically, large-scale distributed processing technology) is used in the field of information systems, including data centers, search engines, and smartphone applications. However, the deployment of these technologies in the information and control systems that support social infrastructure such as electric power, water, and transportation is a task for the future, and the social impact and other wider consequences of this has yet
Takahiro Fujishiro, Ph. D.Joined Hitachi, Ltd. in 1993, and now works at the Business Planning Department, Smart Business Strategy Planning, Smart Information Systems Division, Information & Telecommunication Systems Company. He is currently engaged in strategy planning for smart information business. Dr. Fujishiro is a member of The Institute of Electronics, Information and Communication Engineers (IEICE)
Takashi Fukumoto, Ph. D.Joined Hitachi, Ltd. in 1994, and now works at the Social Infrastructure Systems Research Department, Yokohama Research Laboratory. He is currently engaged in research and development of system development technology for public infrastructure. Dr. Fukumoto is a member of the IEEJ.
Yoshiki Kakumoto, Ph. D.Joined Hitachi, Ltd. in 1989, and now works at the Planning & Administration Department, Technology & Business Development Corporate Technology, Infrastructure Systems Company. He is currently engaged in R&D planning and management. Dr. Kakumoto is a member of The Institute of Electrical Engineers of Japan (IEEJ) and the Information Processing Society of Japan (IPSJ).
Yoshihito YoshikawaJoined Hitachi Consulting Co., Ltd. in 2006, and now works at the Infrastructure Systems Engineering Department, Power Information & Control Systems Division, Infrastructure Systems Company, Hitachi, Ltd. He is currently engaged in the planning of smart city business strategy.
ABOUT THE AUTHORS

Hitachi Review Vol. 62 (2013), No. 7 364
Water Environment Solutions for Sustainable Development of Social Infrastructure
Takahiro Tachi
Hideyuki Tadokoro, PE-Jp
Hiromitsu Kurisu, Dr. Info.
Shinsuke Takahashi, Dr. Eng.
Hiroto Yokoi
OVERVIEW: Fresh water suitable for drinking and other uses in daily life is unevenly distributed across the planet, estimated to make only about 0.01% of the Earth’s total water. Water shortages are becoming more severe around the world as populations increase and become more urban. In Japan, meanwhile, the aging of water and sewage infrastructure and the dwindling numbers of technical personnel have become pressing issues. In response, Hitachi is promoting its intelligent water system concept that seeks to optimize water services at the city or regional level by converging information and control systems with water treatment facilities and other distribution infrastructure to overcome the challenges posed by water infrastructure in Japan and throughout the world. In doing so, it is seeking to consolidate the products it offers in each of the fields that play a role in these services, including business operations, water supply management, flood control, water treatment control, and water treatment equipment.
INTRODUCTIONMODERN society is underpinned by a wide range of social infrastructure, including electric power, communications, transportation, education, water supply, and sewage. As an essential requirement for life, water has a particularly important role. The 21st century has been called the “water century,” and there is a need to maintain a healthy water cycle and ensure that everyone has safe and secure access to water.
Hitachi has been supplying products, systems, and services that contribute to various water-related fields for nearly a century, including the protection of water resources, flood control, water supply, sewage, wastewater treatment, and water recycling.
This article provides an update on developments in the water industry in Japan and elsewhere, and describes Hitachi’s activities associated with its promotion of the intelligent water system concept, particularly in relation to information and control technology.
WATER INDUSTRY DEVELOPMENTSDevelopments and Issues in Water Industry outside Japan
Many regions of the world suffer from water shortages. Fresh water suitable for drinking and other uses in daily life is unevenly distributed, and estimated to make up only about 0.01% of all the Earth’s water. Equatorial and tropical regions in particular often
suffer from water shortages, either in absolute terms due to low rainfall, or due to economic factors that limit access to safe water supplies.
The World Health Organization estimated that approximately 800 million people globally lacked access to wells or other safe water supplies in 2010. Similarly, the number of people lacking access to sewage systems or other basic sanitation was put at approximately 2.5 billion(1). How to improve these figures and meet the growth in demand for water poses a challenge. The reasons for this growing demand include population growth, urbanization and other forms of population concentration, and rising living standards. It has been predicted that water requirements in 2025 will have increased by 30% compared to 2000(2).
Against this background, it is anticipated that the global market for water services will increase from 36.2 trillion yen in 2007 to 86.5 trillion yen in 2025, with Asia and the Middle East accounting for a growing proportion of this total [see Fig. 1(a)]. The overall market can be broadly divided into volume markets offering large scale, and rapidly rising growth markets. The volume markets are becoming increasingly competitive, with European “water majors” (large water companies) already operating comprehensive water businesses, and also local companies entering the market. The growth markets, meanwhile, offer business opportunities for Japanese

Hitachi Review Vol. 62 (2013), No. 7 365
companies with expertise in water treatment and other technologies for boosting efficiency, and Hitachi is proceeding with the deployment of its water industry solutions.
Developments and Issues in Water Industry in Japan
Japan is rich in water resources, with 97.5% of the population being connected to water supplies (as of the end of FY2010)(3) and 75.8% to sewage services (as of the end of FY2011)(4)*.
While the water infrastructure is safe, secure, and efficient, how to deal with the aging of infrastructure and the handing on of know-how have become pressing issues. The water treatment facilities, networks of water pipes, and various other infrastructure built in large quantities during the post-war era of rapid growth are now increasingly exceeding their design life and are in need of updating. Outside the major cities, however, the water distribution and sewage businesses run by local governments suffer from a lack of management resources. Meanwhile, trends such as the aging population, falling birthrate, and changing lifestyles are reducing water demand and constraining their income. Also, capital investment in water and sewage operations has been falling in recent years [see Fig. 1(b)]. The Great East Japan Earthquake in
March 2011 did considerable damage to water supply and sewage infrastructure, some of which are still being repaired.
A variety of initiatives are underway to overcome these challenges, including consolidating business activities and operating over wider areas, planned upgrades to infrastructure, and public-private partnerships. Hitachi has supplied a large amount of water supply and sewage equipment in Japan, as well as maintenance, administration, and other services. Hitachi intends to continue this work to help maintain a healthy water environment and achieve the sustainable development of water infrastructure.
HITACHI’S WATER INDUSTRY SOLUTIONSIntelligent Water System Concept
Hitachi supplies solutions to the water industry that help resolve the various issues it faces, including products and systems for mechanical, electrical, information, and control applications together with services that handle certain aspects of water supply and sewage business operations. The basic philosophy behind these activities is what Hitachi calls the “intelligent water system.”
Rather than working at the level of individual treatment plants or other infrastructure, this approach aims to optimize overall operation by making effective use of limited water resources across entire cities or regions. Specifically, Hitachi’s objectives include the efficient management of water resources, energy
Managementand
operation
By region
EPC,materials
36.2trillion yen
86.5trillion yen Central
andSouth
America
Water supply business (covered by law)Sewage business
(trillion yen)
Europe
NorthAmerica
Asia andOceania
Middle Eastand
Africa
38.0
3.0
2.5
2.0
1.5
1.0
0.5
0.02005 2006 2007 2008 2009 2010 (year)
3.8%
6.0%
2007 2025(prediction)
Source: Report of Study Group for International Development ofthe Water Business, Ministry of Economy, Trade and Industry
Source: Japan Water Research Center, Suido HotNews Issue 319
(a) Market outlook for international water business (b) Investment in Japan in water supplyand sewage construction
48.519.3
16.9
Average annualgrowth from2007 to 2025
EPC: engineering procurement, and construction
Fig. 1—International and Japanese Markets for Water Infrastructure.Growth is anticipated in the emerging economies. In Japan, meanwhile, the amount of aging infrastructure in need of upgrading is on the rise while capital investment continues to decline.
* The figures for the end of FY2011 exclude Iwate and Fukushima Prefectures because the survey could not be conducted due to the Great East Japan Earthquake.

Water Environment Solutions for Sustainable Development of Social Infrastructure 366
savings, and protection of the environment through both the convergence of information and control systems and the wide-area coordination of water treatment, distribution, and other infrastructure (see Fig. 2).
The water business is heavily dependent on the natural environment as a source of water, and is characterized by the diverse needs of both operators and consumers. It is necessary to supply appropriate systems and services that take account of the circumstances in the country or region concerned, such as its culture, laws, economics, public sanitation, and energy market. For this reason, a wide range of problem solving techniques are required among the elements that make up the intelligent water system.
Components of Intelligent Water SystemHitachi is working on linking together the
technologies, systems, services, and other components that make up an intelligent water system. Table 1 lists some of these components. Hitachi is investigating the functions and other developments needed in five different fields. These are: (1) business management to support the planning and operation of water businesses, (2) water supply management to support operational planning of the intake, treatment, and distribution of water, and also sewage treatment and water recycling, (3) flood control, including flood prediction and rain water run-off, (4) water treatment control, including the electrical equipment, information, and control
used at water treatment and sewage plants, and (5) water treatment equipment, including the plant and machinery used for water treatment.
Hitachi is combining these different fields to provide a range of options that covers everything from planning to design, construction, and operation, and is helping overcome the challenges facing the water industry by offering solutions that suit the requirements of the area being serviced.
TECHNOLOGIES USED IN INTELLIGENT WATER SYSTEM
This section looks at examples of water supply management and water treatment control, two core components of the intelligent water system.(1) Water supply management planning and water distribution control system
Two water distribution solutions commercialized by Hitachi are a water supply management (planning) system and water distribution control system. Their benefits include helping provide a reliable water supply, cut operating costs, and reduce the load on the environment.
The water supply management (planning) system helps determine operational parameters, including the daily volume of water to treat and distribute, based on information such as the weather, turbidity of intake water, equipment status, and water demand. A particular feature of the system is that it uses multi-variable optimization to formulate a superior overall
Information systems Monitoring and control system
Surface waterCatchmentmonitoring
Centralizedmonitoringand control
Groundwater
Water treatmentplant
Smart meter
Water supplySewage system
Graywater system
Industrial water supplyFactory wastewaterRecycled water
Water recycling plant
Treated water
Discharge
Factorywastewater
Wastewatertreatment plant
Sewage
Seawater
Treated water
Discharge
Rain waterWater recycling plantSeawater desalination
plant
Domestic watersupply
Industrial waterPressure gauge,
flow meter,water quality sensor
Sewage treatmentcontrol with
low environmentalload
Sewagetreatment plant
Pumps
Business planning supportAsset managementPipe informationmanagement systemCustomer informationmanagement system, etc.
Water source andcatchment monitoringWater supply managementplanningWater distribution controlCentralized monitoring andcontrol, etc.
Fig. 2—Example Intelligent Water System.Water use within a region can be optimized by the interoperation of water treatment systems with information and control systems.

Hitachi Review Vol. 62 (2013), No. 7 367
plan despite conflicting objectives such as reliability and reducing the load on the environment.
The water distribution control system uses data from water pressure sensors installed along mainline pipes to analyze flow rates and pressures across the
entire pipe network, online and in realtime, and also to control valve settings and pump discharge pressures at reservoirs in the distribution system. Not only does this provide up-to-date information on the distribution of water pressures across the entire system, the realtime availability of this information to the control system allows detailed control of the water pressure distribution in response to fluctuations in demand. By keeping water pressures at an appropriate level (minimum required pressure), the benefits of the system also include reducing leakage and pump power consumption (see Fig. 3). Installations in Japan have achieved savings of about 10%.
These systems have already been installed at water distribution businesses in Japan, where they are helping save energy and improve operational efficiency.(2) River basin simulation
Technologies for assessing and predicting the condition of rivers, groundwater, and other water sources deliver benefits in applications such as catchment disaster management and for helping with various planning tasks and infrastructure operation.
Hitachi has implemented practical river flow simulations that can model water quality problems in the headwaters of river systems to estimate factors such as when and in what concentrations contaminants will reach downstream locations, and that use this information to aid decision making on whether measures such as halting water intake are needed. The system incorporates two separate simulators for realtime and detailed predictions respectively, and also a database of past incidents to help respond quickly when similar problems recur.
Monitoring andcontrol system
Measured valueOnline Offline
Calculation ofoptimum pumppressure
GIS
Network flow analysis Demandassignment
Demanddata
Billingmanagement
systemParameter
tuning
Databaseupdate
Set-point value
Reservoir
Pressuresensor
PumpValve Water pipe network
Consumer
Smartmetersystem (future function)
Water distribution control system
GIS: geographic information system
Fig. 3—Overview of Water Distribution Control System.The system uses sensors for continuous monitoring of pressures in the water pipe network, and simulates the water pressure distribution across the entire network. The calculation results are utilized in automatic control of pump operation in close to realtime.
Field Example systems or services Example benefits
Business management
•Systemplanningengineering
•Operationalplanningsupport system
•EAM•Pipedrawing
management•Customerinformation
management•Billingmanagement
•Greaterbusinessefficiency
•Smoothingofinvestment
•Serviceimprovements
Water supply management
•Riverbasinsimulation•Watersupply
management (plan)•Waterdistribution
control
•Reliablewatersupply•Reducedloadon
environment
Flood control •Floodsimulation•Rainwaterandrunoff •Publicsafety
Water treatment control
•Monitoringandcontrol•Waterquality
management•Operationaloutsourcing
service
•Greaterreliabilityandefficiency
Water treatment equipment
•Watertreatmentequipment
•Sewagetreatmentequipment
•Wastewatertreatmentequipment
•Membrane-basedwatertreatment equipment
•Seawaterdesalinationequipment
•Greaterreliabilityandefficiency
TABLE 1. Components of Intelligent Water SystemHitachi is working to implement the intelligent water system concept by linking together the various different technologies, systems, and services.
EAM: enterprise asset management

Water Environment Solutions for Sustainable Development of Social Infrastructure 368
that reduce the load on the environment, not only by minimizing the emission of greenhouse gases due to the power consumed by pumps and blowers in the water treatment process, but also by reducing nitrous oxide (N2O) emissions. Operational control technologies can reduce the load on the environment without needing to make major upgrades to the treatment plant.
CONCLUSIONSThis article has provided an update on developments
in the water industry, and described Hitachi’s activities associated with its promotion of the intelligent water system concept, particularly in relation to information and control technology.
The intelligent water system concept focuses on water and seeks to achieve the system-wide optimization of water, information, and energy flows at the city or regional level. It is closely related to Hitachi’s construction activities in the field of smart cities, where its aim is to achieve a well-balanced relationship between people and the Earth.
Hitachi is working on initiatives that are linked to common issues for urban infrastructure, including the adoption of smart meters that provide a detailed breakdown of demand, the convergence of information and control systems, and international standardization in the field of smart cities.
By proposing new ways of doing things, Hitachi intends to continue making a contribution to the sustainable development of water infrastructure, and to maintaining a healthy water environment in Japan and the rest of the world.
Other current developments include a water pollution trend prediction system that helps with the planning of infrastructural work by predicting medium- and long-term trends in water pollution across an entire catchment, and a water circulation simulation that uses integrated models that consider both ground and surface water to help predict groundwater flows and the distribution of water resources.(3) Water treatment control technology
To offer a wide range of solutions at the city or regional level that integrate water treatment plants with information and control systems, the operational control techniques for water treatment plants also need to do what they can to improve reliability and efficiency.
Water treatment plants that take water from rivers (surface water) sometimes use manual interventions to cope with the sudden changes in water turbidity that occur after rainfall, such as adding coagulant or decreasing water intake. Hitachi has developed and tested a new control technique for determining the appropriate rate of coagulant injection needed to deal with sudden changes in water turbidity (see Fig. 4). Adding the right amount of coagulant not only reduces the load on the environment, by expanding the range of turbidity levels that can be controlled, it also helps ensure a safe and secure water supply despite the dwindling numbers of experienced plant operators and the contracting out of treatment plant operation to third parties.
In the case of sewage treatment, Hitachi is also developing sewage treatment control technologies
FF
Turbidity
Intakewater
Mixing pond Flocculationpond
Settlingpond
Turbidity
Treated water
Coagulant(PACl)
PACl0 ± PACl
FB Target for residual aluminumTarget for turbidity after treatment bysedimentation
(Microfloc)
(Floc separation)
PACl + suspendedsolids
Measurement of residual aluminum
Microfloc separation system
FF: feed-forward FB: feedback PAC1: polyaluminum chloride
Fig. 4—Control System for Addition of Water Treatment Chemicals in Response to High Turbidity.Based on the turbidity of the intake water and the level of aluminum in the treated water, the system calculates the appropriate rate of coagulant injection needed to deal with sudden changes in water turbidity.

Hitachi Review Vol. 62 (2013), No. 7 369
by Distribution Systems,” http://www.mhlw.go.jp/topics/bukyoku/kenkou/suido/database/kihon/fukyu.html in Japanese.
(4) Ministry of Land, Infrastructure, Transport and Tourism, “Provision of Sewage Services as of End FY2011,” http://www.mlit.go.jp/report/press/mizukokudo13_hh_000169.html in Japanese.
REFERENCES(1) “WHO/UNICEF Joint Monitoring Programme (JMP) for
Water Supply and Sanitation,” http://www.wssinfo.org/(2) “World Water Resources and their Use a Joint SHI/
UNESCO product,” http://webworld.unesco.org/water/ihp/db/shiklomanov/
(3) Ministry of Health, Labour, and Welfare, “FY2010 Statistics on Numbers of Water Consumers and Proportion Served
Hideyuki Tadokoro, PE-JpJoined Hitachi, Ltd. in 1982, and now works at the Social Infrastructure Systems Division, Infrastructure Systems Company. He is currently engaged in the development of monitoring and control systems for water supply and sewage. Mr. Tadokoro is a member of The Institute of Electrical Engineers of Japan (IEEJ) and The Society of Instrument and Control Engineers (SICE).
Shinsuke Takahashi, Dr. Eng.Joined Hitachi, Ltd. in 1985, and now works at the Social Infrastructure Systems Research Department, Yokohama Research Laboratory. He is currently engaged in R&D on water supply scheduling and condition-based maintenance of waterworks. Dr. Takahashi is a member of the IEEJ and the SICE.
Takahiro TachiJoined Hitachi, Ltd. in 1984, and now works at the Social Infrastructure Systems Division, Infrastructure Systems Company. He is currently engaged in general management of R&D on water environment. Mr. Tachi is a member of The Society of Environmental Instrumentation Control and Automation (EICA) and the Catalysis Society of Japan.
Hiromitsu Kurisu, Dr. Info.Joined Hitachi, Ltd. in 1988, and now works at the Project Promotion Department, Water Environment Solutions Business Management Division, Infrastructure Systems Company. He is currently engaged in the business development of water supply and sewage systems. Dr. Kurisu is a member of the IEEJ and the EICA.
ABOUT THE AUTHORS
Hiroto YokoiJoined Hitachi, Ltd. in 1995, and now works at the Material Research Center, Hitachi Research Laboratory. He is currently engaged in R&D on water purification and wastewater treatment. Mr. Yokoi is a member of the EICA.

Hitachi Review Vol. 62 (2013), No. 7 370
O&M Service for Sustainable Social Infrastructure
Toshiyuki Moritsu, Ph. D.
Takahiro Fujishiro, Ph. D.
Katsuya Koda
Tatsuya Kutsuna
OVERVIEW: Hitachi is developing O&M services delivered through a cloud-based convergence of control and information technologies for operation and maintenance, together with their associated services. By using these O&M services, social infrastructure business operators can efficiently implement systems for operation and management on the cloud. By delivering O&M services throughout the world, Hitachi is helping create operation and maintenance systems that can keep up with the growth of social infrastructure in each country or region, and with changes in the associated business environment.
INTRODUCTIONGIVEN the growing cost of maintaining and updating infrastructure in developed economies and the increasing urbanization in emerging economies, there is a need for efficient operation and maintenance of energy, water, transportation, mining, cities, and other social infrastructure. A survey by the Ministry of Land, Infrastructure, Transport and Tourism(1) estimated that the cost of maintaining, managing, and updating infrastructure in Japan will reach approximately 65% of the infrastructure budget by 2030. This trend is not only visible in Japan, but applies across all developed economies that were among the first to develop their infrastructure. Also, because the proportion of people in middle-income or higher brackets (annual income of $US3,000 or more) will reach approximately 70% of the global population by 2030 (compared to 40% in 2010), rapid progress is anticipated in the provision of social infrastructure in response to future urbanization and other trends in emerging economies. Meanwhile, the risk of shrinking workforces due to aging populations in developed economies in particular is making the efficient operation and maintenance of the social infrastructure into an important future social issue.
Against this background, Hitachi is developing operation and maintenance (O&M) services that are delivered through a cloud-based convergence of control and information technologies for operation and maintenance, together with their associated services. By using these O&M services, social infrastructure business operators can efficiently implement systems that collect and analyze detailed information about the equipment, facilities, and workers involved with operation and maintenance, apply it in the field for tasks such as preventive maintenance and operational
management, and use it to assist with business operation and management.
This article considers the issues facing the future operation and maintenance of social infrastructure, provides an overview of the operation and maintenance requirements and functions needed to implement O&M services and of the services that can satisfy these requirements and deliver the functions, and presents an example application from the railway industry.
OPERATION AND MAINTENANCE TASKS PERFORMED BY O&M SERVICE
Two features of O&M services provided by Hitachi are their high level of adaptability to business changes, and that these comprehensive services extend from equipment-level operation and maintenance up to business operations and management.
As social infrastructure provides the foundations for daily life and economic activity, its reliable, long-term provision is essential. Similarly, it must be able to respond flexibly to the various potential changes that may occur over the course of social infrastructure business operations, in areas such as the nature of the business, its governance, and the business environment.
Another feature of operating an O&M business for social infrastructure is that the various stages from equipment-level micro-management up to business operations and other macro-level management are coexistent and interdependent. This makes it important to perform the centralized collection and utilization of information with many different levels of granularity.
Given this background, the following sections describe the social changes that O&M services are likely to face and the functions they need to deliver.

Hitachi Review Vol. 62 (2013), No. 7 371
Social Changes to which O&M Services Must Adapt
By considering the changing nature of operation and maintenance work, changes to its governance, and changes in the environment in which it operates, Hitachi has collated the changes likely to be faced by social infrastructure as it moves through the four phases of installation, growth, maturity, and decay or stability (see Fig. 1). In the case of a city, for example, the city grows as infrastructure is built to cope with its rising population. As the population peaks, the city enters its mature phase followed by a period of decay or stability. Operation and maintenance also goes through numerous changes over the course of this process.Changing nature of operation and maintenance work(1) Establishment and refining of operation and maintenance processes (1-a)
Along with the introduction and growth of the relevant business, the associated operation and maintenance processes are also established and refined. While this involves being able to proceed by trial and error, Hitachi’s O&M services make it possible to change the nature of the operation and maintenance work and the processes (procedures) used, flexibly and based on the results of reviewing current practice.(2) Increasing standardization of operation and maintenance processes (1-b)
As operation and maintenance processes are established along with the growth of business, the nature of the work and the processes used are increasingly standardized. Hitachi’s O&M services are designed to facilitate standardization.Changes in governance of operation and maintenance(1) Entry of new operators (1-c)
As business grows, increasing numbers of new operators enter the market. Hitachi’s O&M services are able to provide standard services to facilitate the entry of new operators and are able to make enhancements to suit the needs of individual companies.(2) Increasing consolidation and reorganization of operators (1-d)
As business matures, operators increasingly consolidate or reorganize to reap economies of scale. Mechanisms are provided that allow this consolidation and reorganization to proceed efficiently, including ways of facilitating the integration of operation and maintenance work and processes.
(3) Greater outsourcing of non-core business (1-e)As business matures, it becomes increasingly clear
which areas are core business and which are non-core, with greater outsourcing to external suppliers. Mechanisms are provided to allow changes in which organizations are responsible for performing specific operation and maintenance tasks.Changes in environment for operation and maintenance(1) Starting small, and expansion in scope of operation and maintenance work (1-f)
When new business is introduced on a small scale, their operation and maintenance must also start from a similarly small base. Flexible system scalability is provided so that, as the scope of a business grows, its operation and maintenance can expand accordingly.(2) Changes in operational location in response to changes to cost structures or other aspects of the market environment (1-g)
The location from which a business is performed may change in response to changes to cost structures or other aspects of the market environment. One example is how mining business moves as resources are depleted in one location and discovered in another. Another possibility is the use of remote monitoring and operation, for example, to shift operation and maintenance work to locations where labor costs are lower. Hitachi’s O&M services provide the flexibility to shift to new locations.
Phases of socialinfrastructure
business
Changing natureof operation and
maintenancework
Changes ingovernance ofoperation andmaintenance
Changes inenvironment foroperation andmaintenance
Installation
Establishment and refining of operation and maintenance processes (1-a)
Increasing standardization of operation and maintenance processes (1-b)
Entry of new operators (1-c)
Increasing consolidation and reorganization of operators (1-d)
Greater outsourcing of non-core business (1-e)
Starting small, and expansion in scope of operation and maintenance work (1-f)
Changes in operational location in response to changes to cost structures or other aspects of the market environment (1-g)
Growth Maturity Decay or stability
Fig. 1—Evolution of Social Infrastructure Business and Changes in Operation and Maintenance.Business practices need to cope with a variety of changes as social infrastructure goes through the processes of installation, growth, maturity, and decay or stability.
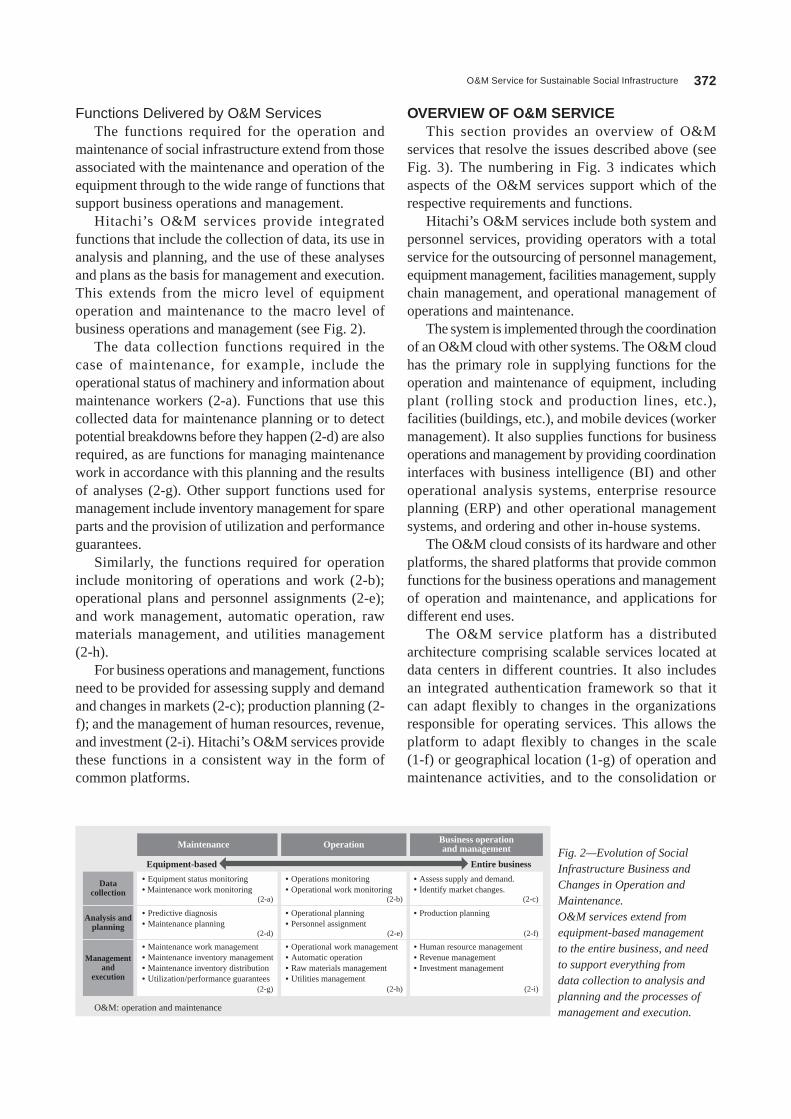
O&M Service for Sustainable Social Infrastructure 372
Functions Delivered by O&M ServicesThe functions required for the operation and
maintenance of social infrastructure extend from those associated with the maintenance and operation of the equipment through to the wide range of functions that support business operations and management.
Hitachi’s O&M services provide integrated functions that include the collection of data, its use in analysis and planning, and the use of these analyses and plans as the basis for management and execution. This extends from the micro level of equipment operation and maintenance to the macro level of business operations and management (see Fig. 2).
The data collection functions required in the case of maintenance, for example, include the operational status of machinery and information about maintenance workers (2-a). Functions that use this collected data for maintenance planning or to detect potential breakdowns before they happen (2-d) are also required, as are functions for managing maintenance work in accordance with this planning and the results of analyses (2-g). Other support functions used for management include inventory management for spare parts and the provision of utilization and performance guarantees.
Similarly, the functions required for operation include monitoring of operations and work (2-b); operational plans and personnel assignments (2-e); and work management, automatic operation, raw materials management, and utilities management (2-h).
For business operations and management, functions need to be provided for assessing supply and demand and changes in markets (2-c); production planning (2-f); and the management of human resources, revenue, and investment (2-i). Hitachi’s O&M services provide these functions in a consistent way in the form of common platforms.
OVERVIEW OF O&M SERVICEThis section provides an overview of O&M
services that resolve the issues described above (see Fig. 3). The numbering in Fig. 3 indicates which aspects of the O&M services support which of the respective requirements and functions.
Hitachi’s O&M services include both system and personnel services, providing operators with a total service for the outsourcing of personnel management, equipment management, facilities management, supply chain management, and operational management of operations and maintenance.
The system is implemented through the coordination of an O&M cloud with other systems. The O&M cloud has the primary role in supplying functions for the operation and maintenance of equipment, including plant (rolling stock and production lines, etc.), facilities (buildings, etc.), and mobile devices (worker management). It also supplies functions for business operations and management by providing coordination interfaces with business intelligence (BI) and other operational analysis systems, enterprise resource planning (ERP) and other operational management systems, and ordering and other in-house systems.
The O&M cloud consists of its hardware and other platforms, the shared platforms that provide common functions for the business operations and management of operation and maintenance, and applications for different end uses.
The O&M service platform has a distributed architecture comprising scalable services located at data centers in different countries. It also includes an integrated authentication framework so that it can adapt flexibly to changes in the organizations responsible for operating services. This allows the platform to adapt flexibly to changes in the scale (1-f) or geographical location (1-g) of operation and maintenance activities, and to the consolidation or
Datacollection
• Equipment status monitoring• Maintenance work monitoring
• Operations monitoring• Operational work monitoring
• Assess supply and demand.• Identify market changes.
• Predictive diagnosis• Maintenance planning
• Operational planning• Personnel assignment
• Production planning
• Maintenance work management• Maintenance inventory management• Maintenance inventory distribution• Utilization/performance guarantees
• Operational work management• Automatic operation• Raw materials management• Utilities management
• Human resource management • Revenue management• Investment management
(2-a) (2-b) (2-c)
(2-d) (2-e) (2-f)
(2-g) (2-h) (2-i)
Analysis andplanning
Managementand
execution
Maintenance Operation Business operationand management
Entire businessEquipment-based
O&M: operation and maintenance
Fig. 2—Evolution of Social Infrastructure Business and Changes in Operation and Maintenance.O&M services extend from equipment-based management to the entire business, and need to support everything from data collection to analysis and planning and the processes of management and execution.

Hitachi Review Vol. 62 (2013), No. 7 373
reorganization of operators (1-d) or changes resulting from the outsourcing of some work (1-e).
The common platform consists of an information-control platform, equipment management, asset management, and big data analysis functions. The information-control platform provides standard interfaces for handling operation and maintenance data, data interfacing coordination (format standardization and conversion), and access control and other security functions. This minimizes the range of areas affected and the scope of system changes required when it is necessary to make improvements or comply with the standardization of operation and maintenance processes (1-b), or to integrate data following the consolidation or reorganization of operators (1-d).
The equipment management functions determine the location and other status information for equipment and facilities being managed and the workers involved, and issue control instructions [(2-a) and (2-b)]. Asset management includes collecting data about equipment management functions, presenting information about operation and maintenance work, and performing integrated management. It also includes the management of human resources, revenue, and investment based on actual operational data performed in coordination with operational management, and the
management of raw materials, spare parts, and product dispatch performed in coordination with ordering and other in-house systems [(2-g), (2-h), and (2-i)].
Big data analysis provides functions for analyzing equipment operation and deterioration based on equipment management information. These functions are used for tasks such as preventive maintenance and operational planning [(2-d) and (2-e)]. It also supplies operational information to operational analysis systems and uses this for tasks such as incorporating information about actual operation into production planning (2-f). In the other direction, it controls the operation of on-site equipment based on business operations and management data [(2-c) and (2-f)].
Implementing applications for specific end uses on this common platform reduces the required investment in systems when new operators enter the market or when operators consolidate or reorganize [(1-c) and (1-d)].
Meanwhile, human resource services supplied by the O&M service include upstream design for operation and maintenance and services that utilize the availability of the O&M cloud, including analysis and planning or business operation and support services such as outsourcing. Also, measures made possible by the provision of system consulting services, such
Human resourcemanagement
Equipmentmanagement
Facilitiesmanagement
Business support and outsourcing (upstream design, analysis, planning, outsourcing, etc.)
System-wide 1-a, 1-e
O&M service
System consulting (migration, business process improvement, etc.)
Supply chainmanagement
Other systems
Operational analysis (BI, etc.)
Operational management(ERP, etc.)
In-house systems(ordering, etc.)
Equipment
System (O&M cloud)
Common platform
Big data analysis (equipment operation, degradation, etc.)
Equipment management
Platform
Integrated authentication
Monitoringand control
Coordination
Coordination
National DCsNational DCsNational DCsNational DCs(1-d, 1-e)
1-f, 1-g
2-a, 2-b
1-c, 1-d
2-d, 2-e
2-g, 2-h
1-b,�(1-d)
2-iAsset management
Information-control platform (security, standard interfaces, data interfacing)
Railway industry application Mining industry application Other industry-specificapplications
Plant
Facilities
Mobile devices(people)
Business operationsand management
Equipment operation and maintenance
Operationalmanagement
…
Services
2-c, 2-f
Fig. 3—Overview of O&M Service.Hitachi’s O&M services provide systems created through integration with the O&M cloud and other systems, and the business support, outsourcing, and system consulting services that use these systems.
DC: data center BI: business intelligence ERP: enterprise resource planning

O&M Service for Sustainable Social Infrastructure 374
algorithms that have formalized the knowledge of experts in the form of mathematical and statistical calculations to perform comprehensive diagnostics and generate predictions. This helps prevent unexpected problems, allows parts inventory to be managed appropriately, and improves the efficiency of preventive maintenance and administration work.
CONCLUSIONSThis article has described Hitachi’s O&M
services for the operation and maintenance of social infrastructure businesses.
In addition to the rolling stock maintenance example described in this article, Hitachi intends to deploy its O&M services in a wide range of applications in the future, including the integrated management of energy for buildings or communities; the control of turbines, pumps, and other equipment at industrial plants; and operations management and remote control for vehicles used at mines.
By supplying O&M services, Hitachi intends to support social infrastructure operators in Japan and elsewhere so that they can respond flexibly to social changes and deliver medium- to long-term foundations for society. Through these activities, Hitachi believes it can contribute to the development of sustainable societies by seeking to be a “best solution partner” in the field of social infrastructure.
as migration away from existing on-premises systems or business process improvement, include flexible changes to operation and maintenance tasks (1-a) and the outsourcing of non-core processes (1-e).
By supplying these systems and services, O&M services supply a wide range of operation and maintenance services that extend from equipment management to business operations and management in a way that can respond flexibly to changes in the business environment.
EXAMPLE APPLICATION FOR ROLLING STOCK MAINTENANCE
This section describes an example O&M service for rolling stock maintenance in the railway industry (see Fig. 4).
The rolling stock maintenance system consists of on-train servers and an off-train management service. The on-train servers collect data from sensors on the rolling stock, and forward the information to the management service. The management service is implemented as an application on the common platform for O&M services. It collects the rolling stock information from the on-train servers in realtime and uses it for online monitoring and analysis.
This makes it possible to identify degradation or other changes in the operational status of equipment or parts in a timely manner. The system also uses
Online monitoringfunction
Realtime statusmonitoring and early
fault response and repair
Faster work,lower costs
Analysis functions(preventive maintenance)
Integrated managementapplication for rolling
stock information
Operation and maintenance planning
application
Common platform
Big data analysis
Equipment management Asset management
Information and control platform
Platform
Management service (off-train)
On-train server
O&M service
Perform maintenance atcorrect timings for each
type of equipment.
Reducemaintenance costs.
Fig. 4—Example O&M Service for Rolling Stock Maintenance.This O&M service for the maintenance of rolling stock uses online monitoring for the early detection of faults and analysis functions for preventive maintenance.

Hitachi Review Vol. 62 (2013), No. 7 375
(2) Nomura Research Institute, Ltd. News Release, “3.52 Billion People Set to Move from the BoP (Low Income) to the MoP (Middle Income) in the Next 25 Years” (Dec. 2011),
http://www.nri.co.jp/english/news/2011/111219.html
REFERENCES(1) Ministry of Land, Infrastructure, Transport and Tourism
White Paper 2005, http://www.mlit.go.jp/hakusyo/mlit/h17/index.html in Japanese.
Takahiro Fujishiro, Ph. D.Joined Hitachi, Ltd. in 1993, and now works at the Business Planning Department, Smart Business Strategy Planning, Smart Information Systems Division, Information & Telecommunication Systems Company. He is currently engaged in strategy planning for smart information business. Dr. Fujishiro is a member of The Institute of Electronics, Information and Communication Engineers (IEICE).
Tatsuya KutsunaJoined Hitachi Electronics Services Co., Ltd. (currently Hitachi Systems, Ltd.) in 1981, and now works at the O&M Service Project Division, Service Businesses Incubation Division, Social Innovation Business Project Division, Hitachi, Ltd. He is currently engaged in service business development for Hitachi Group.
Toshiyuki Moritsu, Ph. D.Joined Hitachi, Ltd. in 1995, and now works at the Business Planning Department, Smart Business Strategy Planning, Smart Information Systems Division, Information & Telecommunication Systems Company. He is currently engaged in strategy planning for smart information business. Dr. Moritsu is a member of The Institute of Electrical Engineers of Japan (IEEJ).
Katsuya KodaJoined Hitachi, Ltd. in 1984, and now works at the Smart Business Strategy Planning, Smart Information Systems Division, Information & Telecommunication Systems Company. He is currently engaged in strategy planning for smart information business.
ABOUT THE AUTHORS

Hitachi Review Vol. 62 (2013), No. 7 376
Energy Simulation Technologies for Optimization of Social Infrastructure
Yasushi Tomita
Tatsuki Inuzuka
Tsutomu Kawamura, Dr. Eng.
Michiki Nakano
OVERVIEW: The need for energy infrastructure that has low carbon emissions, is economical, and provides security of supply is increasingly evident. This has created a demand for energy infrastructure with system-wide optimization achieved through the coordination of district heating and cooling systems and wide-area power systems from consumer utility systems. Hitachi is implementing multi-utility energy infrastructure with system-wide optimization through the lifecycle of the infrastructure by fusing various different energy analysis and control techniques for energy efficiency and power system control aimed at districts or factories and other buildings.
INTRODUCTIONTHROUGHOUT the world, energy infrastructure faces demands for lower carbon emissions through the greater adoption of renewable energy, electric vehicles (EVs), and other new technologies; for economic performance in the face of rising fuel prices and the increasing cost of complying with carbon emission reduction measures; and for security of supply in the event of large power outages or earthquakes.
Energy infrastructure is built through the interconnection of different systems. These include power systems that supply consumers over a wide area with electric power from centralized power plants, district heating and cooling systems that supply the consumers in a community with hot or cold water from a centralized heat source, and utility systems at consumer sites that produce hot and chilled water, steam, and other utilities from primary energy sources. Recent years have seen increasing moves aimed at creating energy infrastructure in which these systems are coordinated to optimize overall operation.
Hitachi has been implementing multi-utility energy infrastructure with system-wide optimization throughout the lifecycle of the infrastructure by enhancing and fusing measures that it has built up over time, such as energy analysis and control techniques for power system control and energy efficiency at the district level or at factories and other buildings (see Fig. 1).
Simulation technologies essential to the development of these total solutions include a smart grid simulator that can perform flexible analyses of the interactions with consumers, particularly in regard to power systems, a district energy system simulator
for the optimum control of multi-utility networks for district heat and electric power, and a simulator for analyzing the energy efficiency of utility systems for use in the energy-efficient design of multi-utility systems for consumers.
Load dispatch center
Solar power
Electric power
EV
Home
BuildingInformation
HeatGas Electric power
Wind power
Wind power
Factory
Electric powerChilled waterHot waterSteamAir
Energy center
Overall optimization coordinated with district
Regional optimization through arrangements for sharing all different forms of energy
Coordination
Coordination
Coordination
Wide-areapower systems
District energynetwork
Consumer utility system
Fig. 1—Energy Infrastructure.The energy infrastructure is built from the interconnection of wide-area power systems, district energy networks, and consumer utility systems.
EV: electric vehicle

Hitachi Review Vol. 62 (2013), No. 7 377
This article describes simulation technologies that support the design, control, diagnosis, maintenance, and repair lifecycle of energy infrastructure, with a scope that extends from consumers to districts and power systems.
SMART GRID SIMULATOROverview
Smart grids are seen as representing the next generation of electric power distribution systems for supporting the creation of a low-carbon society and the highly efficient supply of electric power while also maintaining security of supply. For example, the greater diversity of power sources and loads, such as the increasing connection of renewable energy to the grid or the growing use of EVs, demands a reliable and economic supply of electric power. Before actually implementing such systems, however, it is necessary to study the methods available, taking account of a variety of constraints. To deal with this situation and offer timely solutions, Hitachi has developed a smart grid simulator that it can use as an engineering environment for analyzing the effectiveness of installing various control equipment and systems.
ConfigurationWhile performing analysis and evaluation prior
to implementation is essential to achieving the reliable and planned operation of a power system, running experiments on a live grid in the early stages is difficult. Instead, what are needed are simulators that can model the actual grid, perform numerical calculations of the supply and demand for electric power under given conditions, and then present the results in an intelligible format. While simulators of this type have been developed in the past, they have not been able to cope adequately with large grid configurations while also providing flexible equipment configuration.
The new smart grid simulator uses a distributed agent architecture and consists of a power flow computation engine and a data visualization function for displaying the calculation results.(1) Power flow calculation engine
This calculates the flow of power through the power system. The engine has a distributed agent architecture made up of separate modules that model the distribution grid, voltage control equipment, consumer equipment (such as electric water heaters and EVs), photovoltaic power plants, consumers, and various control systems. These modules execute
independently and concurrently when performing a power flow calculation, and pass messages between themselves to coordinate their operation (see Fig. 2). The calculation engine has a single master module, with all other modules being slave modules. The modules are coordinated by passing messages. The master module performs overall management of the simulation, including timing control.
This configuration provides flexibility in the modeling of the systems being analyzed, and allows prototypes to be implemented quickly. Examples include simulations for analyzing the impact of renewable energy on a power system, voltage stabilization control, and demand-side management. It also simplifies maintenance tasks such as adding or removing functions, and facilitates expansion of the simulation through the use of distributed modules(1).
The simulator models time-axis changes in power flow across the grid by executing the power flow calculation cyclically to represent the passage of time. Specifically, it alternates between the power flow computation that calculates the grid power flow and the calculation of equipment states. These equipment states refer to values such as consumer loads, the power produced by distributed generation, and the output of control equipment. The master module performs the power flow calculation and the slave modules calculate the equipment states. That is, the slave modules use the results of the power flow calculation from the previous cycle to calculate the equipment states for the current timing, and then the master module uses these results to perform the next cycle of the power flow calculation.
Master module (power flow calculation)
Slave modules (equipment state calculations)
Power flow calculationmodule
Voltage control equipment module
Consumermodule
Inter-module data exchange bus
Input/output I/F
Input/output I/F Input/output I/F
Consumermodule
Input/output I/F
Fig. 2—Distributed Agent Architecture.Control systems and other equipment are implemented as independent modules.
I/F: interface

Energy Simulation Technologies for Optimization of Social Infrastructure 378
One type of control device is the voltage control equipment used to adjust the voltage of the distribution grid (see Table 1). This equipment is simulated by a slave module that calculates the equipment states from the past grid power flow and equipment state information. When using distributed control in which each voltage control device operates autonomously, the results of each calculation are then sent as messages to make the information available to other modules. Other control techniques include centralized control and coordinated control. In centralized control, equipment state information is managed centrally and control signals are issued based on a top-down configuration. Coordinated control, in contrast, is performed by adjacent control devices communicating with each other. A feature of the simulator is that it has the flexibility to support a wide range of different control techniques.(2) Data visualization functions
The new simulator includes data visualization functions to present its calculation results in an intelligible format (see Fig. 3). These include map mode for displaying the power system geographically and grid mode for highlighting its structure. By switching between screens, the user can view the variation in photovoltaic power generation output with changing weather conditions, the consequent fluctuations in the grid voltage, and the results of stabilization control by the voltage stabilization equipment. The system combines intelligible displays and easy operation, with functions available at the click of a mouse. Examples include a profile display of the grid voltage along power lines and the day-by-day voltage at a particular node. It also includes alarm functions, including the use of color coding to highlight instances where the grid voltage is high or low. These functions are implemented using hypertext markup language 5 (HTML 5).
Example ApplicationThis section describes the use of the smart grid
simulator in the development of a prototype system for the local production and consumption of photovoltaic power. There are concerns about the impact that excess power and reverse power flows will have on power systems if greater use is made of photovoltaic power generation. Accordingly, this prototype system is designed to absorb mismatches between supply and demand by using excess power from local photovoltaic power generation to operate electric water heaters and store heat. A feature of the system is that it maximizes overall efficiency and the ability to absorb fluctuations by controlling the number of electric water heaters in operation (multiple unit control) based on factors such as the demand for hot water and the efficiency characteristics of the water heaters in each home.
Table 2 lists the modules used in the prototype simulation. The power flow calculation module collects demand data modeled by the consumer module and uses it to determine states across the entire distribution grid. Similarly, the consumer module obtains the voltages at grid connection points modeled by the power flow calculation module and calculates the power output limits set by the function for preventing over-voltage on the photovoltaic power generation plant. In this way, the modules interoperate to perform the simulation (see Fig. 4).
This prototype was then used for a case study of ordinary households that found that performing
Modelmovementof clouds
Display powerflows.
Photovoltaicpanels
Operation ofvoltage stabilizationequipment (SVR) Voltage profile
Switch betweenmap or
grid display.
Fig. 3—Example Data Visualization Screens.The results of the power flow calculations are displayed in an intelligible format.
Voltage control equipment Function
LRT Switching between transformer taps at distribution substations to adjust voltage
SVR Switching between transformer taps on distribution grid power lines to adjust voltage (similar to LRT)
SVC Adjustment of reactive power output on distribution grid power lines (similar to SVR)
TABLE 1. Voltage Control EquipmentThe table lists the main types of voltage control equipment and their functions.
LRT: load ratio control transformer SVR: step voltage regulator SVC: static var compensator
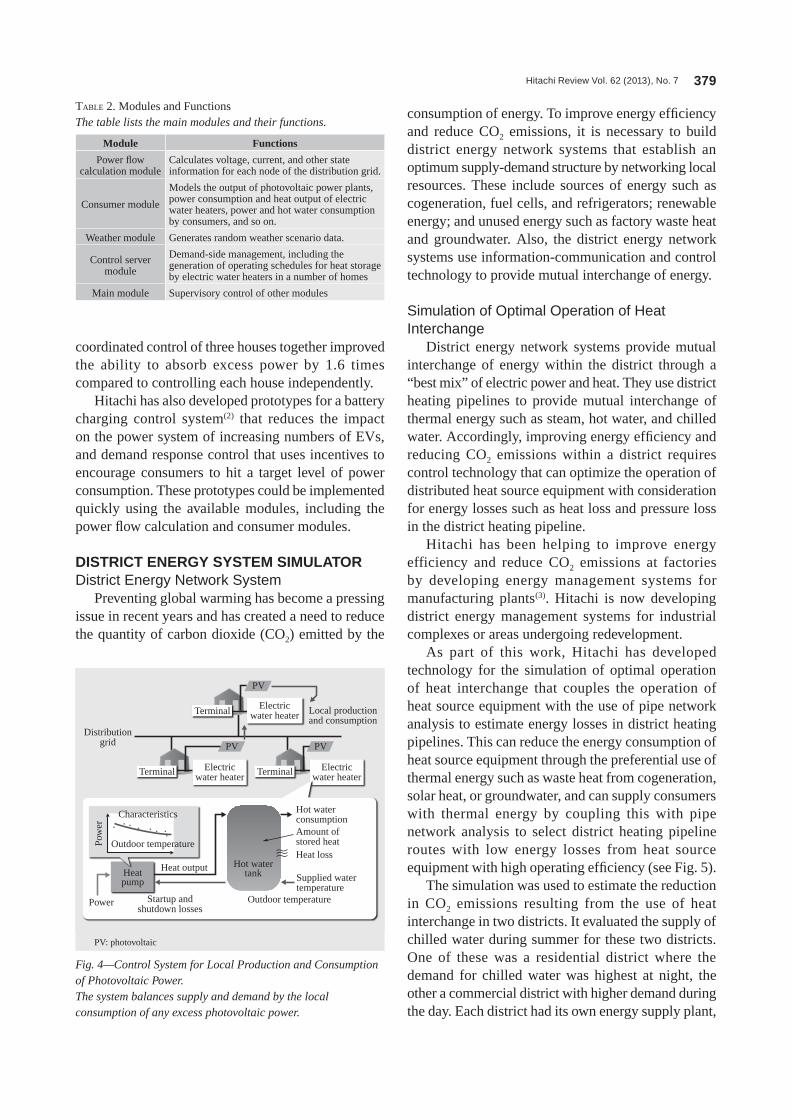
Hitachi Review Vol. 62 (2013), No. 7 379
coordinated control of three houses together improved the ability to absorb excess power by 1.6 times compared to controlling each house independently.
Hitachi has also developed prototypes for a battery charging control system(2) that reduces the impact on the power system of increasing numbers of EVs, and demand response control that uses incentives to encourage consumers to hit a target level of power consumption. These prototypes could be implemented quickly using the available modules, including the power flow calculation and consumer modules.
DISTRICT ENERGY SYSTEM SIMULATORDistrict Energy Network System
Preventing global warming has become a pressing issue in recent years and has created a need to reduce the quantity of carbon dioxide (CO2) emitted by the
consumption of energy. To improve energy efficiency and reduce CO2 emissions, it is necessary to build district energy network systems that establish an optimum supply-demand structure by networking local resources. These include sources of energy such as cogeneration, fuel cells, and refrigerators; renewable energy; and unused energy such as factory waste heat and groundwater. Also, the district energy network systems use information-communication and control technology to provide mutual interchange of energy.
Simulation of Optimal Operation of Heat Interchange
District energy network systems provide mutual interchange of energy within the district through a “best mix” of electric power and heat. They use district heating pipelines to provide mutual interchange of thermal energy such as steam, hot water, and chilled water. Accordingly, improving energy efficiency and reducing CO2 emissions within a district requires control technology that can optimize the operation of distributed heat source equipment with consideration for energy losses such as heat loss and pressure loss in the district heating pipeline.
Hitachi has been helping to improve energy efficiency and reduce CO2 emissions at factories by developing energy management systems for manufacturing plants(3). Hitachi is now developing district energy management systems for industrial complexes or areas undergoing redevelopment.
As part of this work, Hitachi has developed technology for the simulation of optimal operation of heat interchange that couples the operation of heat source equipment with the use of pipe network analysis to estimate energy losses in district heating pipelines. This can reduce the energy consumption of heat source equipment through the preferential use of thermal energy such as waste heat from cogeneration, solar heat, or groundwater, and can supply consumers with thermal energy by coupling this with pipe network analysis to select district heating pipeline routes with low energy losses from heat source equipment with high operating efficiency (see Fig. 5).
The simulation was used to estimate the reduction in CO2 emissions resulting from the use of heat interchange in two districts. It evaluated the supply of chilled water during summer for these two districts. One of these was a residential district where the demand for chilled water was highest at night, the other a commercial district with higher demand during the day. Each district had its own energy supply plant,
Module Functions
Power flow calculation module
Calculates voltage, current, and other state information for each node of the distribution grid.
Consumer module
Models the output of photovoltaic power plants, power consumption and heat output of electric water heaters, power and hot water consumption by consumers, and so on.
Weather module Generates random weather scenario data.
Control server module
Demand-side management, including the generation of operating schedules for heat storage by electric water heaters in a number of homes
Main module Supervisory control of other modules
TABLE 2. Modules and FunctionsThe table lists the main modules and their functions.
Distributiongrid
Characteristics
Heatpump
Hot watertank
Outdoor temperaturePow
er
Power
Heat output
Hot waterconsumptionAmount ofstored heatHeat loss
Supplied watertemperature
Startup andshutdown losses
Outdoor temperature
Terminal
Terminal Terminal
Electricwater heater Local production
and consumption
Electricwater heater
Electricwater heater
PV
PV PV
Fig. 4—Control System for Local Production and Consumption of Photovoltaic Power.The system balances supply and demand by the local consumption of any excess photovoltaic power.
PV: photovoltaic

Energy Simulation Technologies for Optimization of Social Infrastructure 380
by pumps, it is necessary to optimize the pump speeds and the valve openness at each consumer site.
To simulate water distribution systems, Hitachi has already developed a water distribution simulator with a scope that extends from the reservoir to the consumer. When developing the optimization simulator for the energy consumed by pumps used for hot and chilled water, Hitachi developed a simulation technique that minimizes the energy consumed by pumps used for hot and chilled water by extending the functions of the water distribution simulator to include the pressure and flow rate balance of pipe networks as constraints, and to optimize the speed of each pump and the valve openness at each consumer site(4).
To confirm the energy saving produced by this method, Hitachi ran a calculation for an energy network consisting of two energy supply plants and three consumers (see Fig. 8). The calculation found that optimizing the pump speeds and the valve openness of the flow control valves at the consumer sites reduced the energy consumed by pumps by approximately 54% compared to the case when the pumps ran at rated speed (see Fig. 9).
By using a combined simulation of the above heat interchanges, it is possible to perform optimal operation planning of distributed heat sources to improve energy efficiency and reduce CO2 emissions across the entire district.
with the commercial district also having a roughly constant, 24-hour-a-day supply of waste hot water from an incineration plant. Also, the energy supply plant in the residential district was assumed to have an efficiency 10% higher than that in the commercial district (see Fig. 6).
Whereas plant 2 in the commercial district only used the waste hot water from the incineration plant during the day if heat interchange was disabled, when heat interchange was enabled, the waste hot water was used effectively across the two districts 24 hours a day. Also, preferential use was made of the more efficient heat source equipment at plant 1 in the residential district. These results showed that, while using heat interchange resulted in extra CO2 emissions due to the heat loss in the district heating pipeline and the energy consumed by pumps used for chilled water and waste hot water, total CO2 emissions were still 32% lower than when heat interchange was not used (see Fig. 7).
Optimization Simulation of Energy Consumed by Pumps Used for Hot and Chilled Water
District energy network systems use pumps to transfer thermal energy via district heating pipelines in the form of hot or chilled water. To provide a reliable supply of hot or chilled water to consumers, pump control in the past involved maintaining a constant pressure at the heat exchangers located at the consumer site and running pumps at their rated speed. This required a high water supply pressure and resulted in the energy consumed by pumps being higher than necessary. To reduce the energy consumed
Gas
GasSteam
Chilledwater
Gas
Photovoltaic panel
Centrifugal chiller
Waste heat recoveryabsorption chiller / heater
Absorption chiller / heater
Boiler
Cogeneration
Fuel cell
Solar heat collector
Grid powerElectricpower
Hotwater
Fig. 5—Optimum Operation of Heat Source Equipment.The CO2 emitted by a district can be reduced by making preferential use of renewable energy and waste heat, and by optimizing the operation of heat source equipment with consideration for energy losses in district heating pipelines.
District 1 (residential)
High demand forchilled water at night
ConsumersMutual interchange
of chilled water
Mutual interchangeof waste hot waterPlant 1
(high efficiency)Plant 2
(low efficiency)
Incineration plant (waste hot water)
Photovoltaicpanel Solar heat
collector
Consumers
High demand forchilled water during day
Chi
lled
wat
erde
man
d
Chi
lled
wat
erde
man
d
Time Time
District 2 (commercial)
Fig. 6—Calculation Conditions for Study of Heat Interchange Benefits.The study calculated the reduction in CO2 emissions that would result from the mutual interchange of heat between two districts with different thermal demand characteristics and plant operating efficiencies.

Hitachi Review Vol. 62 (2013), No. 7 381
Potential ways of saving energy include adjusting the operational settings on equipment, upgrading machinery to more efficient models, use of more advanced system control techniques such as multiple
SIMULATOR FOR ANALYZING ENERGY EFFICIENCY OF UTILITY SYSTEMS
For factories and other buildings that use large amounts of electric power or heat, saving energy not only cuts costs, it is also an important social responsibility in relation to environmental problems. This section describes energy analysis simulation techniques for designing energy-efficient consumer utility systems (see Fig. 10).
Energy Efficiency for Consumer Utility SystemsConsumers use a variety of utilities for purposes
such as production processes, air conditioning systems, lighting, and office automation equipment. These include electric power, chilled water, hot water, steam, and compressed air. Utility systems obtain primary forms of energy, such as electric power, gas, or fuel oil, and convert them into the required utility. Utility systems are complex, consisting of refrigerators, air compressors, fans, pumps, boilers, cogeneration, and other components connected together by piping, and in some cases including mechanisms for sharing resources between different utilities. System configurations are also designed to suit the consumer’s level of demand for utilities.
Pressure tank
Heatsource
Heatsource
Heatappliance
Heatappliance
Heatappliance
Energy supply plant A
Energy supply plant B
Consumer A
Consumer B
Consumer C
Heat exchanger
Heat exchanger
Heat exchanger
Fig. 8—Calculation Conditions for Optimizing Energy Consumed by Pumps.The calculation was performed for an energy network consisting of two energy supply plants and three consumers.
0
15
30
12 24 0
15
30
12 24
0
15
30
12 24 0
15
30
12 24
Without heat interchange
Cogeneration (electric power) centrifugal chiller
Absorption chiller / heater
Cogeneration (electric power) centrifugal chiller
Absorption chiller / heater
Absorption chiller / heater Incineration plant (waste hot water) waste heat recovery absorption chiller / heater
Incineration plant (waste hot water) waste heat recovery absorption chiller / heater
Without heat interchange
Using heat interchange
Time (h)
Time (h) Time (h)
Time (h)
Cogeneration (waste hot water) waste heat recovery absorption chiller / heater
Cogeneration (waste hot water) waste heat recovery absorption chiller / heater
Cogeneration (electric power) centrifugal chiller
Energy consumed by pump Heat loss from pipes
Cogeneration (waste hot water) waste heat recovery absorption chiller / heater
Boiler (steam) waste heat recovery absorption chiller / heater
Cogeneration (waste hot water) waste heat recovery absorption chiller / heater
Incineration plant (waste hot water) waste heat recovery absorption chiller / heater
Plant 1
Plant 2 Plant 2
Plant 1
Chi
lled
wat
er s
uppl
y (M
W)
Chi
lled
wat
er s
uppl
y (M
W)
Chi
lled
wat
er s
uppl
y (M
W)
Chi
lled
wat
er s
uppl
y (
MW
)
Using heat interchange
CO2: 43 t/d
Reduction in CO2 emissions: 32%
CO2: 29 t/d
Fig. 7—Results of Calculating Heat Interchange Benefits.The study demonstrated the benefits of the preferential use of waste hot water and more efficient heat source equipment in terms of lower CO2 emissions.CO2: carbon dioxide

Energy Simulation Technologies for Optimization of Social Infrastructure 382
typical week from each season of the year, for a given system configuration and using load data for each of these one-hour intervals, and then to collate the results into annual totals.
To provide a general-purpose method for automatically generating energy quantity formulas for a given system configuration, the simulator consists of a generalized data model with an object model architecture that characterizes the multi-utility energy conversion process in terms of the combination of equipment characteristics, energy flow connections, and system control, and a network state calculation model that handles all the interconnections between different utility systems, state values, and other variables. The user specifies the equipment and interconnections from a graphical user interface (GUI), using drag and drop to build a system configuration block by block from a tool box containing the different equipment, control devices, piping, and other components.
The simulator also provides various support functions, including an equipment database (DB), a function that provides guidance on measures for improving energy efficiency, and functions for outputting the simulation results. The equipment DB contains the characteristics of each model for different types of equipment and allows the user to try different models by selecting from a list. The energy efficiency guidance function provides a menu
unit control, and improving the energy flow by using techniques such as waste heat recovery. Before proceeding with any of these, it is important to be able to analyze the energy savings in order to assess the cost-benefit ratios.
Features of Simulator for Analyzing Energy Efficiency
To estimate energy savings, the simulator for analyzing the energy efficiency of utility systems calculates a comparison of the total annual consumptions of primary energy before and after the energy-saving measures are implemented. The core function of the simulator is to calculate primary energy consumption at one-hour time intervals for a
701.3
322.3
0 200 400 600 800 (kW)
Pump APump B
Rated operation
Optimizedoperation
Fig. 9—Results of Calculation Optimizing Energy Consumed by Pumps.The calculation found that optimizing pump speeds and the valve openness of flow control valves at consumer sites reduced the energy consumed by pumps by approximately 54%.
Consumer data
Load data
Generate model.
System control structure
Energy use calculation model
Load demand structure
Equipment characteristics
Flow interconnection structure
State calculation
GUI Results of energy calculation
Calculation resultsConfigure equipment.
Load dataTariffs• Electric power, gas, fuel
Energy useCost
Electrical systems, chilled water systems, hot water systems, steam systems, compressed air systems, and CGS
Configure energy efficiency measures.• Replace equipment.• Improve energy flow.• Adjust control parameters.(Includes guidance function)
Fig. 10—Overview of Simulator for Analyzing Energy Efficiency of Utility Systems.The simulator estimates annual consumption of primary energy for a given utility system configuration.
GUI: graphical user interface CGS: cogeneration system

Hitachi Review Vol. 62 (2013), No. 7 383
the balancing of supply and demand. Hitachi intends to continue using the latest simulation technology to contribute to the implementation of efficient and reliable low-carbon energy systems.
REFERENCES(1) H. Kobayashi et al., “Development of Distributed Agent
Analysis System for Electric Power Distribution Grid,” 2012 Conference on Electric Power Technology and Electric Power Grid Technology, The Institute of Electrical Engineers of Japan (Aug. 2012) in Japanese.
(2) T. Ishida, “Feasible Study for the Availability of Electric Vehicles for the Stable Operation in Power System Network,” EVTeC’11, SS-5-20117248 (May 2011).
(3) H. Kawano et al., “Energy Saving and CO2 Reduction Solution toward Manufacturing Plants,” Hitachi Hyoron 92, pp. 426–431 (Jun. 2010) in Japanese.
(4) M. Nakano et al., “Technique for Minimizing Energy for Transportation of Heated or Chilled Water in District Heating and Cooling Systems,” National Conference of The Institute of Electrical Engineers of Japan, No. 3-097 (Mar. 2013) in Japanese.
of energy efficiency measures. When the user selects one of these, the function searches the network for potential equipment in the specified utility system where the measure can be used and suggests what settings to use for the change. This helps share the knowledge of experts in energy efficiency.
In the future, Hitachi intends to add to these models of equipment and energy efficiency know-how to make the simulator more useful in practice and to expand its scope of application.
CONCLUSIONSThis article has described simulation technologies
that support the design, control, diagnosis, maintenance, and repair lifecycle of energy infrastructure, with a scope that extends from consumers to districts and power systems.
There is a need for the timely development and proposal of total solutions for energy infrastructure with system-wide optimization achieved through various forms of coordination such as multi-utility and
Tatsuki InuzukaJoined Hitachi, Ltd. in 1981, and now works at the ES1 Unit, Department of Energy Management Systems, Hitachi Research Laboratory. He is currently engaged in the research and development of smart grids. Mr. Inuzuka is a member of The Institute of Electronics, Information and Communication Engineers (IEICE) and the IEEE.
Michiki NakanoJoined Hitachi, Ltd. in 2006, and now works at the Social Infrastructure Systems Research Department, Yokohama Research Laboratory. He is currently engaged in the research and development for social infrastructure systems. Mr. Nakano is a member of the IEEJ.
Yasushi TomitaJoined Hitachi, Ltd. in 1990, and now works at the ES2 Unit, Department of Energy Management Systems, Hitachi Research Laboratory. He is currently engaged in the research and development of energy infrastructure systems. Mr. Tomita is a member of The Institute of Electrical Engineers of Japan (IEEJ) and IEEE.
Tsutomu Kawamura, Dr. Eng.Joined Hitachi, Ltd. in 1989, and now works at the ES2 Unit, Department of Energy Management Systems, Hitachi Research Laboratory. He is currently engaged in the research and development of energy solutions.
ABOUT THE AUTHORS

Hitachi Review Vol. 62 (2013), No. 7 384
Social Innovation through Utilization of Big Data
Shuntaro Hitomi
Keiro Muro
OVERVIEW: The analysis and utilization of large amounts of actual operational data collected from equipment and devices have made it practical to realize the possibilities of converging and advancing the control and information systems. An effective approach to analyze and utilize big data efficiently is to determine the events that must be discovered through data analysis to achieve business objectives, and then select the appropriate mathematical analysis algorithms based on available data, thereby building an analysis method. Hitachi has formed a team specializing in data analysis with extensive experience in product manufacturing, maintenance, and operations, while bringing together a tremendous amount of mathematical analysis technology research in order to promote the achievement of social innovation through the utilization of big data.
INTRODUCTIONADVANCEMENTS in information technology (IT) have caused the amount of data we can access to increase dramatically. In other words, factors such as faster computational processing through IT, expanded network environments for data transmission including the Internet and wireless communications, and increased capacity in the storage devices used to store data for a certain period of time have made it a realistic prospect to handle larger amounts of actual data than previous systems could handle. As a result, major opportunities have opened up for collecting and analyzing these massive amounts of data for utilization in the improvement of business quality.
This article describes new services that are implemented in the public infrastructure sector through the collection and analysis of large amounts of data, as well as case studies.
PUBLIC INFRASTRUCTURE AND BIG DATAAge of “Things” Big DataBig data of “things,” “people,” and “concepts”
As the amounts of data that can be handled increase, the data types available are also expanding (see Fig. 1). Hitachi sees big data as being divided into three categories, “things,” “people,” and “concepts.” In addition to the analysis of production management, inventory management, and other types of back office
Electric powermeters
Equipmentmonitoring
Environment andweather
Logistical tracking
Using IC cards
Diagnostic imagesand medical records
Back office business data(Production management,
inventory management, etc.)
Operationalinformation
Car navigation systemsGPS
Monitoredvideo
Tweets
Health andbody temperature
Smart phones Concepts
People
Things
SNS
Movement ofpeople
Telephonecall logs
Shopping
Big Data
Downloading video,still image,
and audio content
GPS: global positioning system SNS: social networking service IC: integrated circuit
Fig. 1—Big Data = Data of “Things, “People,” and “Concepts.”The world of data that can be processed with information technology (IT) is growing day by day.

Hitachi Review Vol. 62 (2013), No. 7 385
business data (“concepts” big data, or abstract things), which IT has traditionally been strong in, the big data that is generated from the actions of individual people (“people” big data), such as text messages posted to social networking services (SNS) and other forms of social media as well as location, movements, and other information that can be acquired from smartphones and other devices, can now be utilized through the application of IT.
Furthermore, it has also become practical to gather, analyze, and utilize the data generated through the operation of “things,” including the operational information of transportation systems and the global positioning system (GPS) information of car navigation systems, as well as actual operational data obtained from sensors installed with the purpose of monitoring and controlling a variety of different mechanical equipment (“things” big data), without the need to discard such information each time.Convergence of information and control as implemented through utilization of “things” big data
One of the major features of “things” big data is that it is a record of device operation derived from the actual use of devices in society, unlike the test result data that is from previously envisioned situations and a certain set length of time derived from sources such as equipment tests and trial operation. By appropriately analyzing this data, it is possible to accurately evaluate the current state of devices that are actually operating, and to analyze the effectiveness of a device maintenance business or the influence of operations.
Although in the past, it was difficult to obtain the actual detailed operational data of devices in certain fields, the individual know-how of those in charge of operations and maintenance businesses who directly handled the devices during actual operations has led through various trial-and-error processes and contrivances during device maintenance and operation to this know-how being both accumulated and passed down throughout organizations. The effects described below can be expected as the result of incorporating the analysis and utilization of this actual operational data, which is the “things” big data itself:(1) The effects and influence of maintenance policies or operational changes can be evaluated and feedback can be created using actual operational data. This can be used to accelerate improvements in maintenance and operations.(2) Appropriate maintenance and operation modification methods can be automatically predicted
and determined based on an evaluation of the current state of devices, which is derived through data analysis. Also, maintenance and operational know-how that had to be passed down individually in the past can now be replaced with a method of analyzing the data of maintenance and operational know-how, which is an effective way of sharing and passing down know-how.(3) The results of collecting and analyzing a wide range of device positional and operational information data, energy consumption data, and other data can be used to automate operations, balance supply and demand, support human activities, and otherwise converge and increase the sophistication of information and control systems.
Hitachi’s Efforts in Utilization of “Things” Big DataChallenges facing data analysis
A valid method for effectively implementing data analysis and utilization is to construct a data analysis procedure by following these steps: (1) determine the events that should be derived through data analysis in order to achieve business objectives, (2) obtain and select the data that can be used for this purpose, and (3) select and tune the necessary mathematical analysis algorithms.
While executing this series of steps, it is important to master the properties and usage methods of many mathematical analysis algorithms, to possess a wide range of knowledge, and to understand how usable data reflects device states and physical properties (information specific to the devices). In particular, evaluation and verification are indispensable parts of the algorithm selection and tuning process, and in some cases, a long period of trial and error is necessary. This knowledge and information is useful for correctly interpreting what physical or business significance the indices that act as criteria for discovering events have, and as a result, can be utilized for quickly discovering analytical methods commensurate with the objectives.
In the past, a system that was widely used included measuring data for mechanical devices under test or trial operation environments, securing device design quality, and applying manufacturing process control. Due to Hitachi’s many years of experience in the research, development and manufacturing of countless mechanical devices, the group possesses a wide range of information regarding the physical properties of devices, and a wealth of knowledge about the mathematical analysis algorithms necessary for data analysis.

Social Innovation through Utilization of Big Data 386
Challenges specific to “things” big dataTwo new challenges must be conquered in order
to expand the scope beyond test result data obtained from equipment testing and trial operations, to the construction of data analysis methods for analyzing and utilizing actual data from operations.(1) A wide range of external environmental factors affect data, and many different events related to actual operating devices can affect the actual operational data. This is why it is necessary to appropriately select which event’s occurrence to focus on from among a large number of possible events, and to find out how that event is reflected in the data.(2) In many cases, it is difficult to adjust sensors or add new ones in order to obtain data that is useful for the analysis, as devices are actually operating in different parts of society. Even under these conditions, it is still necessary to efficiently separate the occurrence of target events from the noise that also exists in the data, which is caused by other factors.
In order to meet the challenges described above, it is important to have extensive knowledge and information regarding the site of actual operations or the maintenance business where the “things” or devices are being used. It is also important to have a comprehensive data utilization procedure in order to effectively use this knowledge and information.
Hitachi has extensive experience in maintenance and after-sales support businesses for its own products, and also has a line of products and services where it provides operational monitoring support that allows it to remotely gather and accumulate operational data. It is through its experience analyzing information from the sites of maintenance and operations as well as accumulated operational data
that Hitachi has built the powerful data utilization techniques (mathematical analysis methods, IT processing technologies, and data analysis and utilization method construction processes) necessary for utilizing “things” big data.
BIG DATA UTILIZATION SOLUTION CASE STUDIES
Hitachi’s utilization of “things” big data is described below, along with case studies.
Remote Monitoring of Gas TurbinesIn order to provide equipment operation support
and quick troubleshooting via long-term service agreements (LTSA), Hitachi has been offering remote monitoring services since 2003 with a focus on gas turbine plants (see Fig. 2).
With a remote monitoring system, analog sensor data from the control panels of power generation equipment delivered to the customer as well as digital data from equipment control signals and other sources is acquired in one-second intervals and forwarded to the monitoring center for storage once per day. A total of between approximately 300 and 2,000 points of analog and digital data is generated by each plant in a single day, amounting to from several hundred megabytes to several gigabytes of time-series data. This time-series data is utilized in creating monthly reports, responding to maintenance inquiries, and assisting design. As the data is retained for a long period of time (15 years or more), its accumulated amount can be in the order of the terabytes (thousands of gigabytes).
It will be necessary to efficiently utilize these huge amounts of data in the future in order to increase
Hitachi cloud center
Data acquired from sensorsCollection
Monitoringand analysis
Storage andmanagement
Utilization
Monitoring center
Operational information
Temperature,vibration,
and pressure
Hitachi Worksin Japan
Operational report
Gas turbine
Monitoring and analysis of operational state200 to 300 sensors per unit
Internet/VPN
VPN: virtual private network
Fig. 2—Gas Turbine Remote Monitoring and Maintenance Business.Trial operation monitoring and preventive maintenance based on data monitoring and analysis contribute to improvements in rates of operation.

Hitachi Review Vol. 62 (2013), No. 7 387
the sophistication of monitoring and diagnosis so that customer service be improved. For this reason, Hitachi is developing technology that can store this time-series data in a highly compressed form while at the same time enabling fast search, and is introducing this technology at monitoring centers for demonstration. Using this technology makes it possible to provide services with a high level of added value, and both lower in cost and faster than before to launch. Hitachi is also researching and developing technology that can provide early anomaly detection, in order to further improve the reliability of plant operations.
Maintenance, Operation, and Management of Chillers
Hitachi already provides a service to acquire and remotely monitor the operational data of industrial chillers, and is proceeding with efforts to analyze this operational data further for use in improving its equipment operation and maintenance business (see Fig. 3). Sensor data acquired from inside the chiller for the purpose of controlling the equipment is used as actual operational data, and is collected and accumulated for a long period of time. Concurrently, by-the-minute records are being collected regarding equipment adjustment and maintenance work, and this makes it possible to know the long-term history of which chillers were maintained and adjusted when and how.
Actual operational data for chillers has traditionally been the target of automatic monitoring. An alarm would be triggered at a remote monitoring center whenever a threshold value was exceeded, and this was useful for equipment maintenance and inspection
businesses. With simple threshold monitoring, however, it is only possible to begin maintenance after the anomaly has occurred, such as abnormal equipment stoppages or obvious performance degradations.
This is why Hitachi has been analyzing previous chiller alarm and maintenance history logs as a test to determine the causal relationships before and after problems occur in actual operational data, on an experimental basis. As a result of this analysis, it was shown that the actual operational data of the equipment before the alarm occurred would clearly approach the alarm condition, and Hitachi worked to create indices to clarify this type of trend. By monitoring these indices, it is possible to evaluate equipment degradation and assist with timely maintenance before an anomaly occurs.
These indices are still under development, and the challenge that remains before they can be put to practical use is to ensure that as long as the equipment model for which they were designed is being used, that they can diagnose both accurately and with a high level of reliability the degree of anomalous behavior and the amount of time left before an anomaly occurs, regardless of the installation or usage conditions. Efforts to establish these indices and put them to practical use are continuing.
HITACHI’S BIG DATA ANALYSIS AND UTILIZATION SERVICES
In data analysis efforts, it is important to clarify the goal of determining what information must be extracted from the data to realize concrete benefits for actual business. To this end, it is also important to receive the support of a team of data analysis specialists who are proficient in a variety of different
Industrial chillers
Data obtainedfrom sensors
Storage andmanagement
Monitoring
AnalysisUtilization
Monitoring rule improvements
Work log
Analysis team
Operation andmaintenance personnel
Feedback to operationand maintenance business
Operational information
Operation and maintenance logs
Control signaland alarm logs
Fig. 3—Maintenance, Operation, and Management of Chillers.Equipment monitoring, operation, and maintenance businesses are being improved by analyzing actual operational data and work log data.

Social Innovation through Utilization of Big Data 388
of “things” in order to provide this service, which achieves the utilization of “things” big data.
CONCLUSIONSThis article discussed a new service that is
implemented through the collection and analysis of large amounts of data in the public infrastructure field, and described case studies.
The utilization of “things” data is a key technology that will open up possibilities in the improvement and optimization of maintenance and operation businesses based on actual data, and in the application of diagnostic results to control in real time, which will enable sophisticated operational automation.
Hitachi will continue striving to promote the utilization of big data by applying its extensive knowledge regarding the manufacturing industry with teams of specialists in mathematical analysis technology, as part of its overall efforts to achieve social innovation through the analysis of data in the public infrastructure field, based on the utilization of “things” data.
data analysis methods in addition to knowledge and understanding of related to business.
Hitachi announced a “data analysis service” in June 2012 in order to support the creation of new business value from big data. This service constructs and provides data analysis methods that match business details and actual data that can be used. Its objective is supporting the resolution of the customer’s business challenges by teams of data analysis specialists who bring together Hitachi’s extensive store of mathematical analysis technology, data analysis experience, product manufacturing experience, and knowledge derived from constructing systems for a variety of different customers (see Fig. 4).
This data analysis service is aimed at a wide range of fields including finance, the public sector, communications, and logistics, and works to achieve a convergence of information and control through the aggressive utilization of “things” data in both industry and control. Hitachi brings together and applies its many years of accumulated knowledge in the manufacturing, operation, and maintenance
Vision construction
Scope of data analyst activities
Developing the processand KPI towards
achievement of vision
Verification ofaccomplishments with
respect to vision
Achievementof vision
Scope of SE activities
Milestone YES YES
Utilization scenarioformulation
Practical applicationverification System installation
Businessvalue
Output
Viability ofvalue
creation
Output
Clarificationof created
value
Output
Datautilization
vision
Output
System integrationAnalysis method verificationHypothesis framing
System verificationBusiness modeling
Scenario verification
SE: system engineer KPI: key performance indicator
Fig. 4—Details of Hitachi’s Data Analytics Service Activities.The data analysis method is constructed and verified in order to understand the customer’s trade and resolve customer’s business challenges (achieve the customer’s vision).
Keiro MuroJoined Hitachi, Ltd. in 1993, and now works at the Social Information Systems Research Department, Central Research Laboratory. He is currently engaged in research into time-series data management systems and time-series data analysis systems for machine maintenance and energy management systems. Mr. Muro is a member of the Information Processing Society of Japan (IPSJ).
Shuntaro HitomiJoined Hitachi, Ltd. in 1999, and now works at the Emerging Business Laboratory, Business Innovation, Smart Information Systems Division, Information & Telecommunication Systems Company. He is currently engaged in the development of big data analytics services.
ABOUT THE AUTHORS

Hitachi Review Vol. 62 (2013), No. 7 389
Information and Control Platform for Smarter Social Infrastructure
Kazuaki Iwamura
Yoshihiro Mizuno
Yuichi Mashita
OVERVIEW: The information-control platforms that support efficient operation by coordinating the different types of social infrastructure in smart cities fulfill the following three roles: (1) obtaining an overview of the entire operation by collecting, managing, and sharing large quantities of data from the operation and maintenance of social infrastructure, (2) use of this data to generate new data that can be used in solutions, and (3) providing the foundations for the expansion of services for social infrastructure operation. Hitachi is working on the development of information-control platforms like these for use as core systems for smart cities.
INTRODUCTIONRECENT years have seen progress around the world on the construction of smart cities that can operate electric power, water, transportation, healthcare, and other social infrastructure efficiently, including by cutting waste in the supply and consumption of energy and other resources, and that can reduce emissions of greenhouse gases that place a load on the environment(1). Hitachi has participated in such projects globally, where it has been working on the development of a new generation of social infrastructure to help deliver a comfortable way of life.
Two features differentiate the social infrastructure in a smart city from that of the past. The first is the ability to monitor supply and consumption across all social infrastructure so that it can be operated efficiently based on an understanding of the interrelationships between all its different parts. The second is that safe and reliable operation of social infrastructure can be achieved through the collection of maintenance information about faults and other degradation so that potential problems can be identified in advance and repairs or replacements implemented.
New types of platform systems have an important role in this approach of system-wide operation of social infrastructure, allowing the collection and consolidation of information about the supply and consumption of energy and resources and its use in facilitating the resolution of any problems, including the use of control techniques. Accordingly, Hitachi is working on the development of information-control platforms that can serve as these core systems for smart cities(2).
This article describes progress on the development of information-control platforms, examples of their application, and the directions for future development.
INFORMATION-CONTROL PLATFORMSFeatures of Smart City Social Infrastructure
Smart cities have the following features.(1) Wider range of social infrastructure and opportunities for choice
New types of social infrastructure are being constructed and linked together with those that are already in place. In the field of electric power infrastructure, for example, renewable energy sources such as photovoltaic or wind power are being incorporated into the electric power system. Other examples include the growing use of seawater desalination and water recycling (in the water sector), and also the adoption of environmentally conscious electric vehicles (EV) that do not emit any exhaust gas (in the transportation sector). These trends are increasing the number of different forms of infrastructure available in a smart city, and with this come greater opportunities for consumers to choose the options that best suit their lifestyle.(2) Advanced social infrastructure operation based on information
Information from consumers’ electricity or water meters can be read remotely by suppliers via a communication network, and the large quantities of information collected can then be utilized in applications such as the control of electric power or water distribution. In particular, “peak cut” measures can be adopted when the supply of electric power has difficulty keeping up with demand, such as having

Information and Control Platform for Smarter Social Infrastructure 390
consumers reduce their consumption or supply electric power they have generated back to the grid. In addition to operational information, the regular collection of status-related maintenance information from social infrastructure can also be used to ensure that equipment is replaced or repaired when problems are identified so that it will continue to operate reliably.
As the number of different types of social infrastructure increases and sophisticated ways of using information become available, these developments make it possible to optimize operations across an entire region. Meanwhile, the concept of a social system coordinator (SSC) has also been proposed as a way of managing operations at a regional level as well as supporting the use of all social infrastructure by consumers(3) (see Fig. 1).
A new type of business entity, an SSC is an organization that provides services to customers. An SSC selects social infrastructure and delivers it to consumers in a way that is tailored to their lifestyle and preferences. It coordinates the operation of social infrastructure in ways that benefit the entire region, such as saving electric power, reducing emissions of greenhouse gases, or achieving zero emissions.
To operate social infrastructure at a regional level, an SSC collects information on its use and
maintenance, and then generates the information required for its operation. Information-control platforms provide the core systems for this generation of added-value information.
Requirements for Core SystemsThis section describes the key requirements for
core systems such as information-control platforms(2).(1) Interoperability
Because these systems collect data from many different types of social infrastructure, each with different data collection timings, protocols, and security measures, standard methods are used. There is also a need to provide for shared use by using a database to store data that, even if it is of the same type, may have been collected from equipment supplied by different vendors.(2) Reliability
Reliability is an essential requirement for services such as electric power or urban transportation infrastructure. It is necessary to be able to connect via the telecommunications infrastructure to specific equipment as and when required, both during routine operation and at times of emergency. This requires the ability to connect across various different networks. In the case of data used in control, the ability to connect within a specified time limit must be guaranteed.
Electric powerElectric power transmission
Combine
Electric powertransmission
Water treatment
Combine Combine Combine
Renewableenergy
Renewableenergy
RecycledwaterDesalination
New transportationEVs, etc.
RailwaysBuses
Regionalhealthcare
Advancedhealthcare
Traditional flowchart for provision of social infrastructure
Flowchart for provisionof social infrastructurein a smart city
Water useWater treatment
TransportationRailways and buses
Residents
Residents
SSC
City managers (social infrastructure suppliers)
HealthcareRegional healthcare
City managers (social infrastructure suppliers)
SSC: social system coordinator EV: electric vehicle
Fig. 1—Expansion in Use of Social Infrastructure in Smart Cities.Smart cities provide consumers with a choice from an increasing number of different types of social infrastructure. SSCs help consumers to make choices that suit their lifestyle, and support operation at a regional level.

Hitachi Review Vol. 62 (2013), No. 7 391
(3) Sustainable urban growthProviding ongoing support for a growing city
requires scalable systems that can keep up with the expansion and enhancement of social infrastructure. To ensure that social infrastructure can operate reliably, there is also a need to collect maintenance data and use it for diagnostic applications to identify potential faults or other degradation.
Roles of Information-control PlatformsTo satisfy the above requirements, information-
control platforms must fulfill the following roles (see Fig. 2).(1) Collection of information on social infrastructure
This involves collecting and processing data relating to the problems, maintenance, control, and use of different types of social infrastructure, and then storing it for use as shared data. Sharing can give access to data that was previously unavailable, allowing it to be used to identify correlations or new applications.
In particular, the forwarding of control data for storage allows it to be collated along with control system operation to determine causality. The accumulation of causality information can be used to predict the flow-on effects of different forms of control on the entire region. The collation of information on electricity distribution control and its operation could be used to identify appropriate ways of supplying electric power to regions with high demand due to large numbers of EV chargers, for example.(2) Contribution to solutions
This involves analyzing collected data and converting it into new forms that are easy for applications to use. It incorporates the following functions that can be applied to different types of data.
(a) InterpolationThe data available for collection will not necessarily
be complete and cover the entire region. For example, it may not be possible to collect electric power or water usage from all households. To overcome this problem, interpolation is used to produce estimates for the entire region from incomplete data. Also, large amounts of data may contain abnormal values that are the result of equipment faults. Such data is removed or corrected.
(b) Regional property extractionThe large amounts of collected data represent the
properties (characteristics) of the region. Accordingly, changes in the data can be analyzed to identify these properties. Specific examples include analyzing trends based on consumption data for electric power, water,
or other services, or data on congestion or crowding of vehicles or people. Using this sort of data analysis to generate data for specific purposes can make it easier for applications to use.(3) Service platforms
These are platforms for running the applications associated with new social infrastructure services that use the collected and synthesized data. For example, integration between information-control platforms and service applications that support the use of electric power can provide easy access to the power consumption data needed for formulating power saving plans. Similarly, if service applications for maintenance management are also integrated, the ability to collect data on the operation of electric power distribution equipment means that the data can be used for predictive diagnosis of degradation or faults.
FUNCTIONAL CONFIGURATIONSystem Functions
Fig. 3 shows the configuration of an information-control platform, comprising core functions for the collection, distribution, and processing of data and also business interfaces. The following sections describe each of these functions in detail.(1) Data collection and distribution
(a) Data collection, distribution, and integrationThis function performs the periodic or on-demand
collection and distribution of information. For example, data is collected periodically from smart meters for electric power or water. Similarly, facility monitoring data (journal data) containing information about equipment faults is collected at short intervals, whereas data collection for equipment maintenance
Support for useof electric power
Maintenancemanagement
Data processing
Data collectionand distribution
Leased line/M2M
Hig
h-sp
eed
tran
smis
sion
Internet/M2M
Supplier equipment
Controlinformation
Consumer equipment
Supplyinformation
Consumption/usage information
Adding valueto data
Sharedinformation
Power distributionautomation
Fig. 2—Structure of Information-control Platforms.Information-control platforms not only collect and distribute information from various types of social infrastructure, they also help expand services by adding value to data.
M2M: machine to machine

Information and Control Platform for Smarter Social Infrastructure 392
data is only performed when a change occurs. The collected information is converted and then stored in a database in the form of general-purpose data items suitable for sharing. The correspondences between converted data items and their associated shared data items are pre-defined for each operator in the form of relationships between operator-defined data and general-purpose data items.
(b) Control information busA bus-based configuration is used for the transfer
of control data. This ensures that control data reaches the intended equipment within a predefined time (latency guarantee), while also passing through the information-control platform.(2) Data processing
(a) Identification (ID) managementInterconnections between equipment and the
network are managed based on a unique number assigned to each device. This function keeps track of the devices connected to the network and their operational status, and this allows it to identify devices for control or maintenance purposes.
(b) Communication quality managementThis function ensures that reliable communication
routes are available and guarantees that data reaches the systems to which it is sent (accessibility guarantee). For control equipment, this guarantees that control
data will arrive within the requested time. Also, use of an information-control platform enhances reliability across all the systems that support a smart city. Hitachi has also proposed machine-to-machine (M2M) techniques for interconnecting between devices and is taking steps toward their international standardization.
(c) Operational monitoringThis function manages the collection of journals
(logs of equipment operation), including whether or not equipment is in service (working/suspending). It also uses the journal data to look for indicators of potential equipment faults.
(d) Spatial-temporal managementThis function provides integration with geographic
information systems (GISs). It can be used to identify the location of equipment and other social infrastructure. It can also manage time-series and archived data to specify links to data that changes over time.(3) Business interfaces
These provide application programming interfaces (APIs) for integration with other applications, such as enterprise asset management (EAM) systems or applications that manage electric power or EVs. By abstracting these interfaces in the form of APIs, functions can continue to operate even if the operating system (OS) or other standard applications
Data display
Application
Electric powermanagement
EVmanagement
Business interfaces
ID managementData
processing
Data collectionand distribution
Communication quality management
Commoninterfaces
Common data analysis
Information-controlplatform
Statisticalcalculation
Trend analysis
Knowledgeacquisition
Operational monitoring
Control information bus
Secu
rity
Control systemsFixed sensors
(HEMS and field sensors, etc.)Mobile sensors
(smartphones, etc.)
Data collection, distribution and integration
M2M wireless, fixed-wire, or IP network
Big data(collected periodically or on-demand)
Spatial-temporal management
Equipment configuration and attributesMaintenance information
EAM Customer andbilling management
Fig. 3—Functional Configuration of Information-control Platforms.The main functions of an information-control platform are the collection, distribution, and processing of data; business interfaces; and security. These functions are used in conjunction with common data analysis functions that create data required for coordination of applications.
EAM: enterprise asset management ID: identification IP: Internet Protocol HEMS: home energy management system

Hitachi Review Vol. 62 (2013), No. 7 393
ways of using the social infrastructure in these various different circumstances.(2) Coordination of applications
It is possible to help optimize operation by supporting interoperation through access to data available for sharing between applications, and by using the results of executing one application as feedback for execution of a different application. For example, equipment load data for electric power distribution can be utilized for equipment maintenance.
STEPS FOR IMPLEMENTING INFORMATION-CONTROL PLATFORMS, AND EXAMPLE APPLICATIONS
Smart cities are currently being built in Japan and other countries, and these projects include the deployment of information-control platforms. The following sections describe the steps involved in implementing these platforms, and give an example of their use in coordinating infrastructure for electric power and EVs.
ImplementationThe functions of information-control platforms are
implemented in stages in accordance with the level of social infrastructure provision. The following sections describe the steps involved in their implementation.Step 1: collection of data for sharing
This function uses techniques such as M2M communications to collect status data from both social infrastructure and consumer equipment over communication networks. The collected data is stored in a shared database.Step 2: application coordination
This seeks to use data sharing as the basis for coordinating the operation of application systems. One example might be the implementation of an operation support application for coordinating charging of EVs with the electricity supply in cases where EV charging may be concentrated in particular areas or at particular times.Step 3: acquisition and use of operational knowledge
When the amount of data collected has become large enough, the data can be analyzed to identify knowledge about trends. For example, it can provide information about changes over time in congestion or the consumption of electric power and other services. The knowledge obtained can then be used for purposes such as optimization of the electricity supply across entire regions or the mitigation of traffic jams.
are changed. It also provides for compliance with international standard regulations, including those set by the International Electrotechnical Commission (IEC) for managing electric power.(4) Security
These are certification and encryption functions that comply with relevant national standards. In addition to preventing impersonation, falsification, and other security breaches, these functions also ensure that information-control platform users are provided with trustworthy data.
Common Data AnalysisThe following common data analysis functions
are used in conjunction with information-control platforms to facilitate the use by applications of the large amounts of collected data.(1) Statistical calculation
These are techniques of spatial statistics that take account of regional characteristics to estimate data from an entire region based on a representative sample.(2) Trend analysis
This uses historic data to predict variations (such as rate of change) in collected data, and then predicts variations in future data. This can be used to predict things like electric power consumption, water use, how congestion will vary over the course of a day, or equipment problems.(3) Knowledge acquisition
This identifies patterns in the variation of characteristic values for a region. For example, the consumption of electric power or water is likely to follow particular patterns depending on the place, time, or period. Knowledge acquisition extracts these patterns from historic data on consumption.
New Features of Information-control PlatformsThe following new features are made possible by
adopting a functional configuration unlike that of past core systems (see Fig. 3).(1) Fusion of data saving and creation
The sharing of collected data not only allows the overall status of social infrastructure to be determined, it also allows the use of data analysis to create new added-value data from accumulated data in ways that go beyond what can be done with databases. For example, an analysis of historic data to determine the operating characteristics of social infrastructure based on how it is used (factors such as city center or suburbs, time of year, weekday or holiday, and the time of day) can provide the basis for proposing

Information and Control Platform for Smarter Social Infrastructure 394
techniques used for managing this data(4) in the form of spatial-temporal management functions allows the system not only to keep track of information such as equipment locations and changes over time, but also to perform tasks to which existing GISs are not well suited, such as the analysis of large amounts of data.
One example made possible through integration with a GIS is the use of diagnostics in the maintenance and management of natural gas trunk pipelines. As a single trunk pipeline may span thousands of kilometers, it can include large amounts of aging plant and numerous cases of corrosion or other forms of deterioration. This means that an information-control platform can collate large amounts of data about the pipeline and use it to perform safety diagnosis for defects on pipes. This data includes information about corrosion and cathodic protection on the pipeline, and also its shape, the material properties of its pipes, and its use for the transportation of natural gas(5) (see Fig. 5).(2) Integration with EAM
While it is inevitable that social infrastructure will age and degrade, it is not practical to update aging social infrastructure equipment all at once. Instead, measures are put in place for the early detection of abnormalities on equipment, and to resolve the problems without any shutdown in social infrastructure operation. Accordingly, the EAM systems that manage equipment integrate with operational systems via the information-control
Electric Power Supply and Demand Management for Coordination of EVs and Electricity Supply
This section describes an electric power supply and demand management application that coordinates EV management with the electricity supply (see Fig. 4).
The features of the overall system are as follows.(1) The grid power plants that provide the base-load power are augmented by renewable photovoltaic and wind power.(2) The system supports not only conventional uses of electric power, but also new forms of electric power consumption that incorporate the charging of EVs.(3) A micro distribution management system (μDMS) is used to achieve household power savings. The information-control platform collects information about electric power consumption for the entire region, and also location and level of battery charge information from EVs. It then uses interoperation between applications to help optimize electric power consumption for the region and to advise EVs on which charging stations to use.(4) The business interfaces of the information-control platform are utilized to add or expand applications and services, such as EV management and regional distribution management systems (DMS).
FUTURE DEVELOPMENTSThe use of information-control platforms in actual
projects results in the collection of large amounts of data. While this corresponds to steps 1 and 2 above, making use of this data (step 3) is also important. The following sections describe potential ways of utilizing or deploying this data, namely integration with GIS, EAM, and meter data management (MDM), and use of the data in big data processing and in applying cloud computing systems, two fields that are experiencing rapid growth throughout the world.
Integration with GIS, EAM, and MDM(1) Integration with GIS
GISs are used both as platforms for managing position-related information using an electronic map as a base, and as display systems for data visualization. As social infrastructure such as roads, railway lines, and pipelines that extend over long distances may be constructed on contoured land, they sometimes need to be considered in three-dimensional terms. Also, because infrastructure is subject to change, systems must be able to cope with data that has planar, three-dimensional, and time axes. Implementing the
EV management Regional DMS
Information-control platform
M2M network
Renewable energy (PV and wind)
Substation, transformers
Homes or buildings
Charging station recommended to EVs
Electric powermanagement
µDMS
Fig. 4—Application of Information-control Platforms to Electric Power Supply and Demand Management.The information-control platform collects information on electric power consumption for an electricity supply that includes renewable energy, and on electricity supply and consumption by homes, buildings, EV charging, and other loads. It also coordinates interoperation between applications such as EV management and consumer management.
DMS: distribution management system PV: photovoltaic

Hitachi Review Vol. 62 (2013), No. 7 395
terabytes or petabytes worth of historic and other data that can be used to assess the condition of infrastructure and other information about the region. Big data can be divided into the following two categories.
(a) Sources of data that have a static location but changing attributes: electric power, equipment status, etc.
(b) Sources of data that are mobile and have changing attributes: flows of traffic or people, etc.
The analysis of this data can be used to acquire knowledge about the region, such as trends in electric power or water consumption or the locations where traffic congestion occurs.
In-memory processing is a technique for placing data in memory so that it can be processed at high speed. It has an important role for speeding up the analysis of large amounts of data. However, because memory capacities are limited, a way of preventing loss of prediction accuracy is to select only important data that will influence the analysis.(2) Use in applying cloud computing systems
The advantages to users of applying cloud computing systems to information-control platforms include data management and easier access to added-value services provided through the enhancement of applications. Hitachi intends to make greater use of cloud-based systems in the future to expand services.
CONCLUSIONSThis article has described progress on the
development of information-control platforms, examples of their application, and the directions for future development.
Construction is proceeding on smart cities that can deliver a good quality of life and reduce the load on the environment by combining new elements such as renewable energy, EVs, and equipment maintenance with conventional social infrastructure such as electric power and urban transportation to operate new social infrastructure efficiently. Efficient operation of the entire social infrastructure is achieved through the use of information-control platforms to coordinate the operation of both control and information systems. A characteristic of information-control platforms is that they combine: (1) the consolidation and sharing of large amounts of data, (2) integration with data analysis to enhance the operation of social infrastructure, and (3) interfaces for the expansion of new services. By supplying these information-control platforms, Hitachi is contributing to the creation and running of new smart cities.
platform. The use of collected operational data (data suitable for uses such as equipment diagnosis) allows changes in the equipment used for social infrastructure to be detected and appropriate maintenance initiated.(3) Integration with MDM
When the installation of smart meters capable of bidirectional communications makes it possible to see each household’s usage of electric power, water, and gas, this information can be used to assess the use of energy and other resources across the region and the results utilized to make savings. While the number of meters will depend on the size of the region, in the largest cases this will be in the tens of millions. By using information-control platforms to collect this information efficiently, it can be applied in the analysis of regional trends in supply and demand of electric power.
Use with Advanced IT Practices(1) Use in big data processing
Interest is growing in the processing of big data(6) as a way of analyzing the large amounts of data on social infrastructure and putting it to use in operations. When the implementation of information-control platforms provides for the collection of information on the supply and use of electric power and water, equipment status, and traffic and other transportation infrastructure across an entire smart city, the resulting accumulation of
Safety diagnosis chart
Safety markers forindividual cases of
corrosion (● symbol)
Pipe replacementand repair diagram
List of residualpipe lifetimes
Distribution of corrosion in pipeline
Satellite images (ASTER)©METI and NASA 2013 ALL RIGHTS RESERVED Distributed by J-spacesystems
Fig. 5—Use for Management of Pipeline Maintenance through Integration with GIS.The appropriate timing for pipe replacement can be determined through management of factors such as corrosion and cathodic protection potentials on large pipelines.
METI: Ministry of Economy, Trade and Industry NASA: National Aeronautics and Space Administration ASTER: An optical sensor developed by METI for resource exploration and attached to NASA’s TERRA Earth observation satelliteJ-spacesystems: Japan Space Systems

Information and Control Platform for Smarter Social Infrastructure 396
Mining and Geographical Knowledge Services, ICSDM 2011 (2011).
(5) K. Iwamura et al., “Development of Spatial-Temporal Pipeline Integrity and Risk Management System based on 4 Dimensional GIS (4D-GIS),” Proceedings of International Pipeline Conference 2008, IPC 2008 (2008).
(6) K. Iwamura, “Role of IT Platforms in Smart City Infrastructure Operation and Potential Applications for Big Data,” 2012 Series of Seminars on “Big Data and Smart Society,” Seminar 3, Potential for Big Data in Urban Management, pp. 55–68, Information Processing Society of Japan (Sep. 2012) in Japanese.
REFERENCES(1) Y. Yoshikawa et al., “Hitachi’s Vision of the Smart City,”
Hitachi Review 61, pp. 111–118 (May 2012).(2) Y. Mizuno et al., “Information & Control Technology
Platform for Public Infrastructure,” Hitachi Review 61, pp. 167–171 (May 2012).
(3) K. Iwamura et al., “Coordination of Urban and Service Infrastructures for Smart Cities,” Hitachi Review 61, pp. 126–133 (May 2012).
(4) K. Iwamura et al., “4D-GIS (4 dimensional GIS) as Spatial-Temporal Data Mining Platform and its Application to Management and Monitoring of Large-Scale Infrastructures,” 2011 1st IEEE International Conference on Spatial Data
Yoshihiro MizunoJoined Hitachi, Ltd. in 1991, and now works at the Smart System Middleware Solutions Department, Smart System Middleware Solutions, Smart Information Systems Division, Information & Telecommunication Systems Company. He is currently engaged in the development of the smart city platform.
Kazuaki IwamuraJoined Hitachi, Ltd. in 1983, and now works at the Smart System Middleware Solutions Department, Smart System Middleware Solutions, Smart Information Systems Division, Information & Telecommunication Systems Company. He is currently engaged in the development of the smart city platform and geographic information systems. Mr. Iwamura is a member of The Institute of Electronics, Information and Communication Engineers (IEICE) and The Japan Society for Industrial and Applied Mathematics (JSIAM).
Yuichi MashitaJoined Hitachi, Ltd. in 1991, and now works at the Smart System Middleware Solutions Department, Smart System Middleware Solutions, Smart Information Systems Division, Information & Telecommunication Systems Company. He is currently
engaged in the development of the smart city platform.
ABOUT THE AUTHORS

Hitachi Review Vol. 62 (2013), No. 7 397
Cyber Security Technologies for Social Infrastructure Systems
Tadashi Kaji, Dr. Info
Tsutomu Yamada
Toshihiko Nakano, Dr. Eng.
Susumu Serita
OVERVIEW: Cyber security threats have emerged as a growing concern for all forms of social infrastructure in recent years. Based on its “2×3 Concept,” Hitachi has formulated security guidelines to cover each of the design, development, implementation, and operation phases. Technologies being developed by Hitachi to ensure security in all corners of the social infrastructure, right down to the control equipment and other field devices with limited capabilities, include high-speed encryption techniques, the Enocoro*1 low-power stream encryption technique, and device authentication techniques. Also under development in response to the sophisticated cyber threats now being faced are techniques for reducing the workload associated with security operation, including analysing large amounts of log or communications data to detect any viruses lurking in the system.
INTRODUCTIONINFORMATION technology (IT) is being used to boost the efficiency of social infrastructure throughout the world, with equipment being networked at an accelerating pace. Along with this networking of social infrastructure, the cyber security threats that were once an issue only for corporate information systems have now emerged as a growing concern for all forms of social infrastructure. Since the appearance of the Stuxnet virus in 2010, in particular, persistent and sustained targeted attacks that combine a number of different methods and are directed at a specific organization have caused real damage.
In addition to countering these sophisticated cyber attacks while maintaining operation, social infrastructure systems must also be relied on to be capable of going to a safe state (such as a system shutdown) in the event of their becoming compromised. To achieve this, it is important to build in security functions from the development stage to prevent any deviation from predetermined state transitions due to a threat.
However, the nature of cyber attacks evolves on a daily basis and therefore it is essential for social infrastructure systems with long operating lives to take account of the emergence of threats that were
not able to be considered in the initial design. This is making the security measures used during system operation more important. Another factor with social infrastructure systems is that devices installed in the field tend to have very limited system resources (in terms of their processing power or power consumption, for example), and this often complicates the task of implementing security measures.
This article describes Hitachi’s approach to ensuring security along with its technologies for providing security measures that encompass all social infrastructure systems, and technologies that support safe and secure operation.
HITACHI’S APPROACH TO SECURITY—2×3 SECURITY GUARANTEE MODEL—
Ensuring the security of social infrastructure systems, particularly the control systems that form part of this infrastructure, requires both the incorporation of security functions at the development phase and the implementation of security measures during the operation phase. The 2×3 security guarantee model(1) provides the basic philosophy for achieving this.
The 2×3 security guarantee model is an approach to maintaining leak-proof security through measures for dealing with and countering threats at two phases of the system life cycle (development and operation) and considered from three different perspectives (functions, environment, and people and organizations) (see Fig. 1).
*1 Enocoro is an extension of development work conducted by the “Research and Development of Technology for Secure Distribution and Storage of Large Amounts of Data” (FY2005 to FY2007) sponsored by the National Institute of Information and Communications Technology. Enocoro is a trademark of Hitachi, Ltd.

Cyber Security Technologies for Social Infrastructure Systems 398
Security at Development PhaseThe process for building security into systems at
the development phase is to identify potential security threats, and then to combine a multi-layered mix of countermeasures (“defense in depth”) considered in terms of the three perspectives (functions, environment, and people and organizations) that can be incorporated as part of the systems functions.
Based on security concepts defined in the International Electrotechnical Commission (IEC) standard IEC 62443(2), designing security functions that provide defense in depth requires that the system be divided up into a number of zones, each of which operates under its own security policies, and that the necessary security measures then be considered and implemented separately for each of these zones. By providing safe pipe connections (“conduits”) between zones and implementing security measures at their entries and exits (“conduit gates”), this prevents unauthorized users from gaining access to a zone.
In addition to security measures based on this system configuration, Hitachi also believes that, for each service provided by social infrastructure systems, appropriate protections and other security measures are required for the integrity and availability of the functions that make up the service and the
information flows between these functions, and therefore has produced security guidelines for their design, development, and implementation. These guidelines specify the implementation of security measures that are appropriate to the importance of the system and its customer requirements, and they comply with major Japanese and international security standards, including the Special Publications (SP) 800 series published by the US National Institute of Standards and Technology (NIST) and the IEC’s IEC 62443 series.
Security at Operation PhaseThe process at the operation phase is to assess
the health of the system and respond rapidly to any problems that arise in order to maintain the security that was built in at the development phase.
As well as incorporating sufficient security functions at the development phase, the security measures in the operation phase are growing in importance for countering sophisticated modern cyber threats. To maintain the security that was built in at the development phase, the operation phase functions assess the security health of the system by collecting and analyzing data from many different points in the system. This allows them to quickly detect and
Security in development phase (establishing security)
Feedback (security improvements and enhancements)
Security in operational phase (maintaining security)
Problem
Implement control
Organizations and people
Environment
Functions
Securitymeasuresfor system
Security functionpolicies
Physical securitypolicies
Security measures
Security strategy
Security requirements
…Business
Zone Information flow Services
Service availabilityService completeness
Privacy guarantee ComplianceFair competition
Monitoring for unauthorized activityAudit
VPNAccess control
Flow protectionInformation protection
Completeness of functionsAvailability of functions
Residents
Conduit gate
Government agencies
Organizationalsecurity policies
Logs, etc. Actions
Dataanalysis
Datacollection
Decideon actions
Implemen-tation
VPN: virtual private network
Fig. 1—2×3 Security Guarantee Model.The model provides leak-proof security through measures for dealing with and countering threats in two phases (development and operation) and considered from three different perspectives (functions, environment, and people and organizations).

Hitachi Review Vol. 62 (2013), No. 7 399
counter any problems that arise. Information is also fed back from the operation to the development phase to enhance and strengthen security.
SECURITY TECHNOLOGIES ABLE TO COVER ALL CORNERS OF SOCIAL INFRASTRUCTURE
Countering sophisticated cyber threats requires security measures that extend to all corners of the social infrastructure.
However, social infrastructure systems are often constrained by very limited system resources in terms of factors such as processing power or power consumption.
To ensure that security measures can cover all corners of social infrastructure systems, Hitachi is developing encryption, authentication, and other techniques suitable for use on these resource-constrained devices.
Enocoro Low-power Stream EncryptionEnocoro is a low-power stream encryption
technique developed in 2007. It was adopted in the ISO/IEC 29192 international standard for lightweight cryptography (encryption for small devices) in 2012(3).
One element in Enocoro encryption processing is the substitution box (S-box) that requires only half as many gates to implement as the advanced encryption standard (AES), and shortens the critical path to allow the use of low-power consumption logic cells (see Fig. 2).
As a result, Enocoro can execute data encryption with only about one-tenth the power consumption of AES, the de facto standard.
Lightweight Encryption ImplementationIn addition to developing the lightweight algorithm
described above, another important factor in implementing encrypted communications on devices with limited resources is technology that can provide a lightweight and fast implementation.
Hitachi has developed lightweight encryption technology that achieves high speed and low processing load by generating the random number string required for encryption in advance and limiting the scope of encryption to the minimum required (see Fig. 3).
This technology is able to deliver approximately 20 times the speed of a standard implementation using AES. Specifically, because it can encrypt 1,500 bytes of data in approximately 40 μs, Hitachi’s technology
allows encrypted communications to be adopted in situations where it would have been considered impractical in the past due to the processing overhead being too high.
SECURITY TECHNIQUES FOR REDUCING LOAD ON SYSTEM OPERATION
The requirements for the system operation phase are to assess the state of system security and counter any problems that arise.
However, recent cyber attacks have adopted various techniques for covering up their activities and these make it very difficult to identify threats hiding inside the system.
Hitachi is working on the development of techniques that use concepts from applied mathematics to detect problems by analyzing large quantities of logs and communication data. Specific examples include ways of detecting computer viruses hiding inside the system, and evaluating the state of system security.
S
Output
S-box is half the size of AES.L
SSS
Fig. 2—Basic Configuration of Enocoro.The S-box requires only half as many gates as AES and has a shorter critical path to allow use of low-power logic cells.
S: substitution box S-box: substitution box L: linear conversion AES: advanced encryption standard
Pre-processing
(1) Generate random number string in advance.
(2) Control scope of encryption
Header Encrypted data
Encryption processing
Plain data
Block selection
IV +1
Random number generator
…
…
…
…
…
Encryption unit
+1
Fig. 3—Overview of Lightweight Encryption Implementation.This technique achieves high speed and low processing load by generating the random number string required for encryption in advance and limiting the scope of encryption to the minimum required.
IV: initial vector

Cyber Security Technologies for Social Infrastructure Systems 400
Analysis of Logs to Detect Unauthorized Communications
Computer viruses have certain characteristics that are different to conventional programs. For example, a virus might periodically connect to its command and control (C&C) server to transmit collected information or receive attack instructions.
In addition to analyzing the characteristics of such computer viruses, Hitachi is also developing techniques that use these characteristics as a basis for automatically identifying log entries that are suggestive of virus activity from the large quantities of log data output by the system. One example is a method Hitachi has developed that exploits this characteristic of periodically communicating with a C&C server, and that works by performing a frequency analysis of the log to find cases of automated access among the large volume of log entries (see Fig. 4).
Use of Packet Analysis to Detect Unauthorized Communications
Along with log analysis, Hitachi is also developing techniques for detecting unauthorized communications that use deep packet inspection (DPI) to check the content of data packets.
An issue with DPI is that, because it often requires complex arithmetic processing, analyzing large quantities of data imposes a heavy processing load. Hitachi’s technique overcomes this problem
and is able to detect unauthorized communications on broadband networks in realtime by selectively narrowing down which of the packets passing over the network to analyze, and by performing its analysis in accordance with a detection procedure definition file.
Hitachi has applied the technique to the detection of communication by peer-to-peer (P2P) file sharing software*2 and demonstrated that it can detect such traffic on a 10 Gbit/s network with a high level of accuracy (99.78%)(4) (see Fig. 5).
Cleansing using methods such asa white list of known safe sites
Time Time Time
Frequencyanalysis
Logs for 1 day period Narrow down
Acc
ess
time
Acc
ess
time
Acc
ess
time
Narrow down
Identify automatedaccess.
Fig. 4—Analysis of Logs to Detect Unauthorized Communications.Given that a characteristic of computer viruses is that they periodically connect to a command and control (C&C) server, this technique performs a frequency analysis of log data to find cases of automated access among a large volume of log entries.
*2 This work was conducted as part of the “Research and Development on Detection and Prevention of Information Leakages through Computer Networks” research sponsored by the Ministry of Internal Affairs and Communications.
PacketPacket
Session
A-B communications
Pass on as FP
Yes
NoC-D communications
Packet
Packet
FP
Example encryption module
For Winny
…
For WinMX For perfect dark
Extract fir st packetafter connection.
Execute detection as specifiedby detection procedure definition file.
Flowanalysis Filtering Decoding Detection
Detection procedure definition file (script)
Check result
Flowinformation
Session information Encryption module
Public key encryption
Symmetric key encryption
Hash function
RSA
RCx
MD-x
DSA
xDES
SHA-x
ECDSA
AES
CRC-x
Procedure
Node A
Node C
Node B
Node D
Result
Fig. 5—Use of Packet Analysis to Detect P2P Communications.Peer-to-peer (P2P) communications can be detected with a high level of accuracy by selectively narrowing down which packets to check, and then decoding the selected packets and analyzing their content.
FP: fast packet RSA: Rivest Shamir Adleman DSA: digital signature algorithm ECDSA: elliptic curve digital signature algorithm DES: data encryption standard MD: message digest SHA: secure hash algorithm CRC: cyclic redundancy check

Hitachi Review Vol. 62 (2013), No. 7 401
CONCLUSIONSThis article has described Hitachi’s approach to
ensuring security along with its technologies for providing security measures that encompass all social infrastructure systems, and technologies that support safe and secure operation.
In the future Hitachi intends to contribute to providing safe social infrastructure that everyone can use with confidence by continuing to research and develop security technologies for countering the ever-evolving threats.
REFERENCES(1) H. Endo, “HITACHI Security Concept for Industrial Control
Systems,” 33rd Annual Conference of the Canadian Nuclear Society (CNS2012) (Jan. 2012).
(2) “IEC 62443-2-1: Industrial Communication Networks - Network and System Security - Part 2-1: Establishing an Industrial Automation and Control System Security Program” (Nov. 2010).
(3) “IEC-News Release: IEC and ISO Adopt Lower Power Encryption Standard Enocoro Stream Cipher” (Nov. 2012), http://www.iec.ch/newslog/2012/nr1912.htm
(4) Hitachi News Release, “Development of Software for Detecting P2P File Sharing Traffic on 10-Gbit/s Broadband” (Jul. 2010), http://www.hitachi.co.jp/New/cnews/month/2010/07/0701.html in Japanese.
(5) S. Kai et al., “Development of Qualification of Security Status Suitable for Cloud Computing System,” MetriSec ‘12 Proceedings of the 4th International Workshop on Security Measurements and Metrics, pp. 17–24 (Sep. 2012).
Evaluation of State of System Security*3
The larger systems get, the more they experience all sorts of different events on a daily basis. This makes it increasingly difficult for system operators to correctly assess and respond to the security implications of each event.
Hitachi is developing technology for evaluating the state of security in large systems such as those used in social infrastructure by considering the events that occur in the system in terms of how they impact the security performance as envisaged at the design stage(5).
Specifically, the technology estimates and displays the state of security based on the level of impact of events that occur in the system. A security incident such as an information leak, for example, would be interpreted as a case in which the designed security performance (keeping particular information private) was unable to be maintained.
Evaluating the state of security not only provides operators with early notification of warning signs, it also identifies which of the many such signs have the potential to lead to serious consequences.
*3 This technology incorporates results from the “Research and Development of Security Technology for Encouraging Migration to Cloud to Improve Disaster Readiness” research sponsored by the Ministry of Internal Affairs and Communications.
Tsutomu YamadaJoined Hitachi, Ltd. in 1994, and now works at the Department of Energy Management Systems Research, Hitachi Research Laboratory. He is currently engaged in the research and development of embedded computer and network architectures, and control system security. Mr. Yamada is a member of the IEEE, International Society of Automation (ISA), The Institute of Electronics, Information and Communication Engineers (IEICE), and The Society of Instrument and Control Engineers (SICE).
Susumu SeritaJoined Hitachi, Ltd. in 2007, and now works at the Service Innovation Research Department, Yokohama Research Laboratory. He is currently engaged in the research and development of security technologies for the use of big data.
Tadashi Kaji, Dr. Info.Joined Hitachi, Ltd. in 1996, and now works at the Enterprise Systems Research Department, Yokohama Research Laboratory. He is currently engaged in the research and development of information security technology. Dr. Kaji is a member of the IEEE Computer Society.
Toshihiko Nakano, Dr. Eng.Joined Hitachi, Ltd. in 1980, and now works at the Control System Security Center, Infrastructure Systems Company. He is currently engaged in the development of security for social infrastructure systems. Dr. Nakano is a member of The Institute of Electrical Engineers of Japan (IEEJ).
ABOUT THE AUTHORS

Hitachi Review Vol. 62 (2013), No. 7 402
International Standardization Activities Supporting Global Deployment of Social Infrastructure Systems
Kiyoshi Mizukami
Hisanori Mishima
OVERVIEW: The scope of application of international standards has been growing as people seek ways of resolving global issues. There has also been a trend in recent times toward the introduction of standards for services. These service standards are intended to apply not to individual technologies but to actual services in a particular field. There is also a strengthening move toward international standardization of social infrastructure systems, a field that in the past did not need to take account of international standards. Hitachi is actively involved in international standardization. In the field of smart cities, Japan proposed the establishment of an ISO committee for standardizing indicators used to evaluate the performance of community infrastructure, resulting in the creation of the new ISO/TC 268/SC1 subcommittee. As a member of the Japanese team, Hitachi assisted with the proposal to establish this committee and with the writing of standards.
INTRODUCTIONCHANGES are taking place in the field of international standardization, both in the approach to standardization and the type of things for which standards are being created. Likewise, driven by factors such as infrastructure exports and World Trade Organization (WTO) agreements, there is a growing move toward international standardization for social infrastructure systems, a field that has not needed to take account of such standards in the past. Because this new trend is seeking to use international standards to define specific fields of business activity (in contrast to standardization aimed at the adoption of common technologies), there is a need for those involved to fundamentally re-evaluate their understanding of these standards and strategies for complying with them.
Japan is also responding to these moves toward the use of international standards to define specific fields of business activity by making its own proposals. One example was the proposal to establish a new committee at the International Organization for Standardization (ISO) to look at smart community infrastructure. This led to the creation in 2012 of an ISO technical committee (TC) and an associated subcommittee (SC) (ISO/TC 268/SC1: smart community infrastructures), with Japan receiving the secretariat and chairperson appointments. The subcommittee’s first standard, ISO technical report (TR) 37150 is currently being drafted.
This article describes the changing trends in the field of international standardization, the growing
moves toward the international standardization of social infrastructure systems, the activities of the new ISO/TC 268/SC1 subcommittee established in response to a Japanese proposal, and the future direction of work on international standardization.
CHANGING TRENDS IN INTERNATIONAL STANDARDIZATION
In the past, most international standards applied to products. That is, they specified things like product shape, dimensions, materials, composition, quality, and performance. Recently, however, there has been an increase in the number of new committees and standardization work that deal with “service standards.”
Rather than a specific technology alone, service standards are about defining standards for services in a particular field. The following lists some of the major new TCs recently established by ISO and the International Electrotechnical Commission (IEC) to consider service standards.(1) ISO/TC 223: societal security(2) ISO/TC 224: service activities relating to drinking water supply systems and wastewater systems - quality criteria of the service and performance indicators(3) ISO/TC 228: tourism and related services(4) ISO/TC 232: learning services outside formal education(5) ISO/TC 260: human resource management
For example, whereas a TC that deals with water quality measurement already existed (ISO/TC 147:

Hitachi Review Vol. 62 (2013), No. 7 403
water quality), the new TC 224 committee was set up to consider water supply and wastewater services, an area that falls outside the scope of TC 147.
The objectives and philosophies behind the drafting of these service standards are completely different to those of existing product standards.
Product standards have as their starting point existing products and technologies. The objective of this type of standardization is to facilitate the worldwide use of products by the adoption of common product specifications to ensure mutual compatibility. Accordingly, the important consideration for standardization is how to incorporate all of the leading technologies proposed by each of the members.
The starting point for service standards, on the other hand, is the definition of the service (business activity). This type of standardization seeks to define the scope covered by the particular service activity, and to ensure that services can be delivered in an internationally consistent way to create better societal systems. Because the scope of the service becomes formally defined by the international standard once it has been published, important considerations during the standardization process include how to demarcate the service from surrounding activities, and whether the standard correctly encompasses the service’s scope. This leads directly to market expansion.
Based on an understanding these changing trends in recent international standardization and that proposing the standardization of a service will lead to the scope of that service becoming prescribed by an international standard, a fundamental change is necessary in how people think about these standards and their strategies for complying with them (see Table 1).
GROWING IMPORTANCE OF INTERNATIONAL STANDARDIZATION TO SOCIAL INFRASTRUCTURE SYSTEMS
The trend toward service standardization is becoming particularly evident in the field of social infrastructure systems.
Because social infrastructure is built in a particular location (in a particular country), Japan’s social infrastructure, for example, does not generally extend outside Japan and therefore, while its construction may take account of national technical standards, it has rarely needed to be concerned with international standards. Recently, however, factors such as infrastructure exports (meaning exports by Japanese companies) and WTO agreements (for overseas suppliers in the Japanese market) have increasingly made it necessary to consider compliance with international standards.
In the case of exports by Japanese companies, unless associated with the construction of a city on a greenfields site, they need to consider compatibility with the existing infrastructure in the destination country. Rather than insisting that the recipient accept products designed for the exporting nation, the main way to ensure this compatibility is to adopt international standards.
The following sections discuss compliance with international standards.
WTO, TBT, and GP AgreementsThe WTO requires member nations to comply with
agreements on Technical Barriers to Trade (TBT) and Government Procurement (GP).
The purpose of TBT agreements is to eliminate technical barriers to trade, and they oblige the parties to use international standards as a basis for their national standards. Similarly, GP agreements oblige the parties to use international standards when specifying the requirements for government procurement.
Because Japan is a member of the WTO, it is in a situation where it has to comply with international standards even for domestic social infrastructure.
Case Study of Achieving Compliance with International Standards in Japan’s Advanced Infrastructure Services
ISO/TC 224 (Service activities relating to drinking water supply systems and wastewater systems) was established in 2002 in response to a 2001 proposal by France for the formulation of measurement guidelines for water and wastewater service providers. The scope
Product standards Service standards
What is being standardized
Product shape, dimensions, materials,
composition, quality, and performance, etc.
Content and scope of services
ObjectivesProduct compatibility
and international adoption
International consistency in service content and
level
Considerations
Widespread adoption made possible by
common specifications, and ability to enhance
market competitiveness through differentiation
Demarcation from surrounding areas, and that the international
standard correctly encompasses the scope
of the service
TABLE 1. Differences between Product and Service StandardizationDifferences between product and service standards include different objectives and applicability, and different considerations when proposing standards.

International Standardization Activities Supporting Global Deployment of Social Infrastructure Systems 404
of this committee included the definition of indicators for the quantitative evaluation of water and wastewater services. Depending on how these indicators were defined, there was a risk that the standard would prevent Japan from maintaining its high level of water and wastewater services.
For example, although Japanese water is safe to drink straight from the tap, if the international standard were to specify service levels lower than those that currently apply in Japan, it would not be permitted under WTO agreements to prevent suppliers who supplied water that complied with international standards but was not suitable for drinking from entering the Japanese market. While this is an extreme example, if such an outcome were to be realized, the impacts on Japanese society would be immeasurable. This meant it was necessary to defend Japan’s high level of water and wastewater services.
Accordingly, Japan issued guidelines (national standards) for water business operations and for improving sewage system management services that complied with the international standards being formulated at the time, and lobbied to have these included in the international standards. As a result, they were included in the citations for the ISO 24510 series of standards issued in 2007. This meant that existing national service levels could be maintained in a way that was compliant with the international standards.
Japanese Proposal for International Standardization for Smart Cities
The above examples demonstrate how the trend toward international standardization is impacting the field of social infrastructure. When considered from a passive standpoint, this situation requires that steps be taken in relation to two particular aspects of international standards: (1) compliance with international standards, and (2) defending against the establishment of international standards that affect the scope of domestic services.
Meanwhile, steps have also been taken toward Japan proposing new service standards. The following section describes one of these: the proposal for ISO/TC 268/SC1 (smart community infrastructures).
ISO/TC 268/SC1 SMART COMMUNITY INFRASTRUCTURESBackground to Proposal for New Subcommittee
Smart city projects are currently in progress in various parts of the world, with various interested
organizations promoting their own concepts. With regard to questions such as what defines a smart city or what sort of things and setups can be treated as “smart,” however, there is only a vague consensus and no international standards. In other words, the international procurement and construction of community infrastructure is proceeding without any international standards having been established to provide benchmarks for the procurement process. This has made the task of setting international standards for smart infrastructure an urgent one. The establishment of international standards provides a basis for TBT and GP agreements and helps create an active international market for infrastructure procurement.
With this in mind, Japan proposed the establishment of a subcommittee to consider indicators for evaluating smart community infrastructure in 2011. The ISO/TC 268/SC1 (smart community infrastructures) subcommittee was subsequently set up in 2012 with Japan receiving both the secretariat and chairperson appointments.
International Standards for Smart Community Infrastructure
As of January 2013, ISO/TC 268/SC1 was in the process of considering its first standard (ISO/TR 37150). This standard, for smart community infrastructure metrics, is to be issued in the form of a TR on the future directions for the systematization of international standards. This section describes what it is that is to be standardized, and the methods to be used in the investigation.What is to be standardized
The necessary starting point for the discussion is to decide what is meant by smart community infrastructure. To this end, the concept of a three-layer model of a city has been adopted (see Fig. 1). Table 2 defines the three layers.
ISO/TR 37150 places an emphasis on being able to be improved or enhanced by technology, and targets standardization primarily at the community infrastructure layer, the role of which is to support the community service and facility layers.Investigation methods
Because the concepts that provide the basis for standards, such as what is meant by smart community infrastructure and what is to be treated as “smart,” need to be derived in an objective manner that is satisfactory to all the countries involved, the following methods were adopted for presenting the direction to be taken for the system of standards.
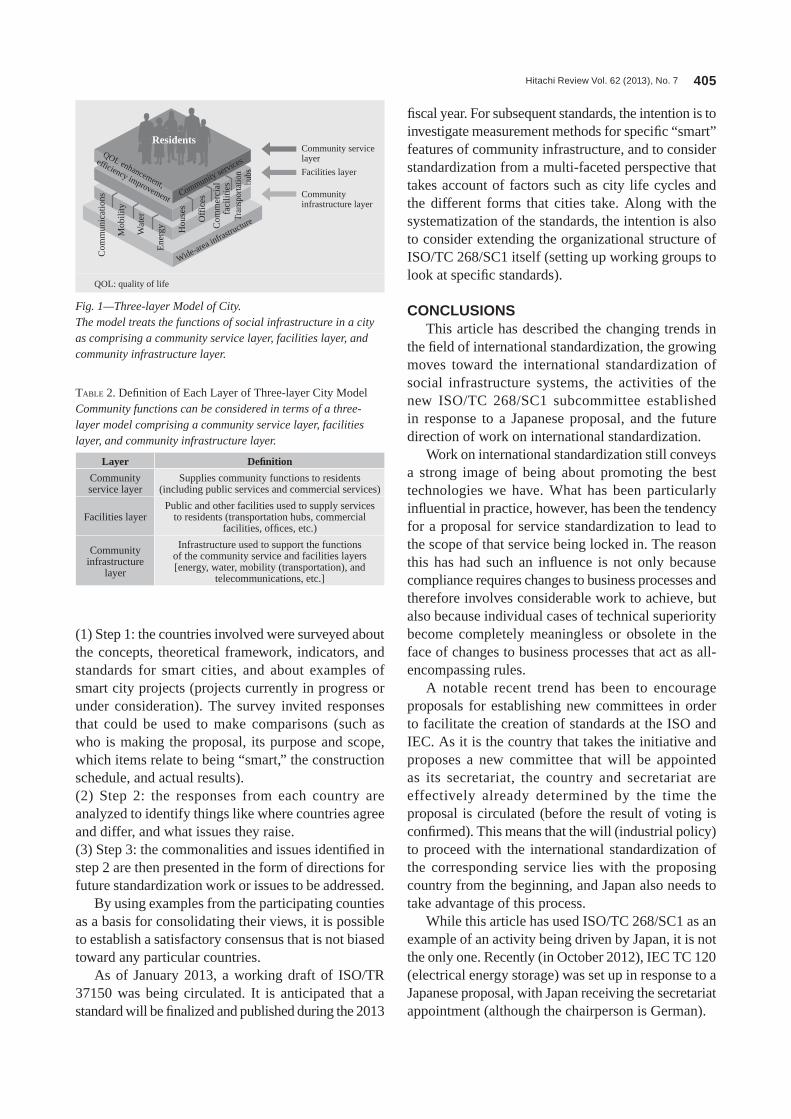
Hitachi Review Vol. 62 (2013), No. 7 405
(1) Step 1: the countries involved were surveyed about the concepts, theoretical framework, indicators, and standards for smart cities, and about examples of smart city projects (projects currently in progress or under consideration). The survey invited responses that could be used to make comparisons (such as who is making the proposal, its purpose and scope, which items relate to being “smart,” the construction schedule, and actual results).(2) Step 2: the responses from each country are analyzed to identify things like where countries agree and differ, and what issues they raise.(3) Step 3: the commonalities and issues identified in step 2 are then presented in the form of directions for future standardization work or issues to be addressed.
By using examples from the participating counties as a basis for consolidating their views, it is possible to establish a satisfactory consensus that is not biased toward any particular countries.
As of January 2013, a working draft of ISO/TR 37150 was being circulated. It is anticipated that a standard will be finalized and published during the 2013
fiscal year. For subsequent standards, the intention is to investigate measurement methods for specific “smart” features of community infrastructure, and to consider standardization from a multi-faceted perspective that takes account of factors such as city life cycles and the different forms that cities take. Along with the systematization of the standards, the intention is also to consider extending the organizational structure of ISO/TC 268/SC1 itself (setting up working groups to look at specific standards).
CONCLUSIONSThis article has described the changing trends in
the field of international standardization, the growing moves toward the international standardization of social infrastructure systems, the activities of the new ISO/TC 268/SC1 subcommittee established in response to a Japanese proposal, and the future direction of work on international standardization.
Work on international standardization still conveys a strong image of being about promoting the best technologies we have. What has been particularly influential in practice, however, has been the tendency for a proposal for service standardization to lead to the scope of that service being locked in. The reason this has had such an influence is not only because compliance requires changes to business processes and therefore involves considerable work to achieve, but also because individual cases of technical superiority become completely meaningless or obsolete in the face of changes to business processes that act as all-encompassing rules.
A notable recent trend has been to encourage proposals for establishing new committees in order to facilitate the creation of standards at the ISO and IEC. As it is the country that takes the initiative and proposes a new committee that will be appointed as its secretariat, the country and secretariat are effectively already determined by the time the proposal is circulated (before the result of voting is confirmed). This means that the will (industrial policy) to proceed with the international standardization of the corresponding service lies with the proposing country from the beginning, and Japan also needs to take advantage of this process.
While this article has used ISO/TC 268/SC1 as an example of an activity being driven by Japan, it is not the only one. Recently (in October 2012), IEC TC 120 (electrical energy storage) was set up in response to a Japanese proposal, with Japan receiving the secretariat appointment (although the chairperson is German).
Community service layer
Residents
Community infrastructure layer
Tran
spor
tatio
n hu
bs
Com
mer
cial
faci
litie
s
Off
ices
Hou
ses
Ene
rgy
Wat
er
Mob
ility
Com
mun
icat
ions
Facilities layerefficiency improvement
QOL enhancement,Community services
Wide-area infrastructure
Fig. 1—Three-layer Model of City.The model treats the functions of social infrastructure in a city as comprising a community service layer, facilities layer, and community infrastructure layer.
QOL: quality of life
Layer Definition
Community service layer
Supplies community functions to residents (including public services and commercial services)
Facilities layerPublic and other facilities used to supply services
to residents (transportation hubs, commercial facilities, offices, etc.)
Community infrastructure
layer
Infrastructure used to support the functions of the community service and facilities layers [energy, water, mobility (transportation), and
telecommunications, etc.]
TABLE 2. Definition of Each Layer of Three-layer City ModelCommunity functions can be considered in terms of a three-layer model comprising a community service layer, facilities layer, and community infrastructure layer.

International Standardization Activities Supporting Global Deployment of Social Infrastructure Systems 406
the future, Hitachi intends to continue working with government and industry to contribute to activities that are conductive to the global deployment of social infrastructure.
IEC TC 120 has only just begun its activities. The questions of its scope of activities and its demarcation from other TCs are still under consideration.
Hitachi is participating in standardization work such as that of ISO/TC 268/SC1 and IEC TC 120. In
Hisanori MishimaJoined Hitachi, Ltd. in 1985, and now works at the External Relations & Management of Standardization Department, Strategic Planning Division, Infrastructure Systems Company. He is currently engaged in the promotion of the international standardization in the field of social infrastructure, especially for smart grids and smart cities.
Kiyoshi MizukamiJoined Hitachi, Ltd. in 1979, and now works at the External Relations & Management of Standardization Department, Strategic Planning Division, Infrastructure Systems Company. He is currently engaged in strategic planning for research and development, and promotion of international standardization in the field of social infrastructure.
ABOUT THE AUTHORS