convenience sample summary report national … · national high school sports-related injury...
TRANSCRIPT
CONVENIENCE SAMPLE SUMMARY REPORT
NATIONAL HIGH SCHOOL SPORTS-RELATED INJURY SURVEILLANCE STUDY
2012-2013 School Year
Compiled by:
R. Dawn Comstock, PhD
Christy L. Collins, MA
Dustin Currie, BS
2
Acknowledgements
We thank the certified athletic trainers (ATs) for their hard work and dedication in providing us
with complete and accurate data. Without their efforts, this study would not have been possible.
We would like to thank the National Federation of State High School Associations (NFHS) for
their support of this project. The content of this report was funded in part by the Centers for
Disease Control and Prevention (CDC) grants #R49/CE000674-01 and #R49/CE001172-01. The
content of this report is solely the responsibility of the authors and does not necessarily represent
the official views of the CDC. We would also like to acknowledge the generous research funding
contributions of the National Federation of State High School Associations (NFHS), National
Operating Committee on Standards for Athletic Equipment (NOCSAE), and DonJoy Orthotics.
Note
The analyses presented here provide only a brief summary of collected data, with the feasibility
of a more detailed presentation limited by the extensive breadth and detail contained in the
dataset. The principal investigator, Dr. R. Dawn Comstock, is happy to provide further
information or to discuss research partnership opportunities upon request.
For reprints/further information contact: R. Dawn Comstock, PhD Associate Professor Epidemiology, Colorado School of Public Health Pediatric Injury Prevention, Education, and Research (PIPER) program Center for Injury Research and Policy 700 Children's Drive Columbus, Ohio, 43205 (614) 355-5850 phone (614) 355-5897 fax [email protected]
3
Chapter Page
I. Introduction and Methodology 17
1.1 Project Overview 18 1.2 Background and Significance 18 1.3 Specific Aims 19 1.4 Project Design 20 1.5 Sample Recruitment 21 1.6 Data Collection 23 1.7 Data Management 24 1.8 Data Analysis 24
II. Overall Injury Epidemiology 26
III. Boys’ Football Injury Epidemiology 36
IV. Boys’ Soccer Injury Epidemiology 44
V. Girls’ Soccer Injury Epidemiology 52
VI. Girls’ Volleyball Injury Epidemiology 60
VII. Boys’ Basketball Injury Epidemiology 68
VIII. Girls’ Basketball Injury Epidemiology 76
IX. Boys’ Wrestling Injury Epidemiology 84
X. Boys’ Baseball Injury Epidemiology 91
XI. Girls’ Softball Injury Epidemiology 99
XII. Girls’ Field Hockey Injury Epidemiology 107
XIII. Boys’ Ice Hockey Injury Epidemiology 115
XIV. Boys’ Lacrosse Injury Epidemiology 123
XV. Girls’ Lacrosse Injury Epidemiology 131
XVI. Boys’ Swimming Injury Epidemiology 139
XVII. Girls’ Swimming Injury Epidemiology 146
XVIII. Boys’ Track Injury Epidemiology 153
XIX. Girls’ Track Injury Epidemiology 160

4
XX. Boys’ Cross Country Injury Epidemiology 167
XXI. Girls’ Cross Country Injury Epidemiology 174
XXII. Cheerleading Injury Epidemiology 181
XXIII. Gender Differences within Sports 188
23.1 Boys’ and Girls’ Soccer 189 23.2 Boys’ and Girls’ Basketball 192 23.3 Boys’ Baseball and Girls’ Softball 195 23.4 Boys’ and Girls’ Swimming 198 23.5 Boys’ and Girls’ Track and Field 201 23.6 Boys’ and Girls’ Cross Country 204
XXIV. Reporter Demographics & Compliance 207
XXV. Summary 210
5
List of Tables and Figures
Tables Page
Overall Injury Epidemiology 2.1 Injury Rates by Sport and Type of Exposure 27 2.2 Proportion of Injuries Resulting in Time Loss 29 2.3 Demographic Characteristics of Injured Athletes by Sex 30 2.4 Body Site of Injury by Type of Exposure 31 2.5 Most Commonly Injured Ankle Structures 32 2.6 Most Commonly Injured Knee Structures 32 2.7 Ten Most Common Injury Diagnoses by Type of Exposure 33 2.8 Injuries Requiring Surgery by Type of Exposure 34 2.9 Time during Season of Injury 34 2.10 Practice-Related Variables 35 2.11 Methods for Injury Evaluation and Assessment 35
Boys’ Football Injury Epidemiology 3.1 Football Injury Rates by Type of Exposure 37 3.2 Demographic Characteristics of Injured Football Athletes 37 3.3 Body Site of Football Injuries by Type of Exposure 38 3.4 Ten Most Common Football Injury Diagnoses by Type of Exposure 39 3.5 Football Injuries Requiring Surgery by Type of Exposure 40 3.6 Time during Season of Football Injuries 40 3.7 Competition-Related Variables for Football Injuries 41 3.8 Practice-Related Variables for Football Injuries 41 3.9 Activities Leading to Football Injuries by Type of Exposure 42
Boys’ Soccer Injury Epidemiology 4.1 Boys’ Soccer Injury Rates by Type of Exposure 45 4.2 Demographic Characteristics of Injured Boys’ Soccer Athletes 45 4.3 Body Site of Boys’ Soccer Injuries by Type of Exposure 46 4.4 Ten Most Common Boys’ Soccer Injury Diagnoses by Type of Exposure 47 4.5 Boys’ Soccer Injuries Requiring Surgery by Type of Exposure 48 4.6 Time during Season of Boys’ Soccer Injuries 48 4.7 Competition-Related Variables for Boys’ Soccer Injuries 49 4.8 Practice-Related Variables for Boys’ Soccer Injuries 49 4.9 Activities Leading to Boys’ Soccer Injuries by Type of Exposure 50
Girls’ Soccer Injury Epidemiology 5.1 Girls’ Soccer Injury Rates by Type of Exposure 53 5.2 Demographic Characteristics of Injured Girls’ Soccer Athletes 53 5.3 Body Site of Girls’ Soccer Injuries by Type of Exposure 54 5.4 Ten Most Common Girls’ Soccer Injury Diagnoses by Type of Exposure 55 5.5 Girls’ Soccer Injuries Requiring Surgery by Type of Exposure 56 5.6 Time during Season of Girls’ Soccer Injuries 56 5.7 Competition-Related Variables for Girls’ Soccer Injuries 57 5.8 Practice-Related Variables for Girls’ Soccer Injuries 57

6
5.9 Activities Leading to Girls’ Soccer Injuries by Type of Exposure 58
Girls’ Volleyball Injury Epidemiology 6.1 Volleyball Injury Rates by Type of Exposure 61 6.2 Demographic Characteristics of Injured Volleyball Athletes 61 6.3 Body Site of Volleyball Injuries by Type of Exposure 62 6.4 Ten Most Common Volleyball Injury Diagnoses by Type of Exposure 63 6.5 Volleyball Injuries Requiring Surgery by Type of Exposure 64 6.6 Time during Season of Volleyball Injuries 64 6.7 Competition-Related Variables for Volleyball Injuries 65 6.8 Practice-Related Variables for Volleyball Injuries 65 6.9 Activities Leading to Volleyball Injuries by Type of Exposure 66
Boys’ Basketball Injury Epidemiology 7.1 Boys’ Basketball Injury Rates by Type of Exposure 69 7.2 Demographic Characteristics of Injured Boys’ Basketball Athletes 69 7.3 Body Site of Boys’ Basketball Injuries by Type of Exposure 70 7.4 Ten Most Common Boys’ Basketball Injury Diagnoses by Type of Exposure 71 7.5 Boys’ Basketball Injuries Requiring Surgery by Type of Exposure 72 7.6 Time during Season of Boys’ Basketball Injuries 72 7.7 Competition-Related Variables for Boys’ Basketball Injuries 73 7.8 Practice-Related Variables for Boys’ Basketball Injuries 73 7.9 Activities Leading to Boys’ Basketball Injuries by Type of Exposure 74
Girls’ Basketball Injury Epidemiology 8.1 Girls’ Basketball Injury Rates by Type of Exposure 77 8.2 Demographic Characteristics of Injured Girls’ Basketball Athletes 77 8.3 Body Site of Girls’ Basketball Injuries by Type of Exposure 78 8.4 Ten Most Common Girls’ Basketball Injury Diagnoses by Type of Exposure 79 8.5 Girls’ Basketball Injuries Requiring Surgery by Type of Exposure 80 8.6 Time during Season of Girls’ Basketball Injuries 80 8.7 Competition-Related Variables for Girls’ Basketball Injuries 81 8.8 Practice-Related Variables for Girls’ Basketball Injuries 81 8.9 Activities Leading to Girls’ Basketball Injuries by Type of Exposure 82 Boys’ Wrestling Injury Epidemiology 9.1 Wrestling Injury Rates by Type of Exposure 85 9.2 Demographic Characteristics of Injured Wrestlers 85 9.3 Body Site of Wrestling Injuries by Type of Exposure 86 9.4 Ten Most Common Wrestling Injury Diagnoses by Type of Exposure 87 9.5 Wrestling Injuries Requiring Surgery by Type of Exposure 88 9.6 Time during Season of Wrestling Injuries 88 9.7 Competition-Related Variables for Wrestling Injuries 89 9.8 Practice-Related Variables for Wrestling Injuries 89 9.9 Activities Leading to Wrestling Injuries by Type of Exposure 90
7
Boys’ Baseball Injury Epidemiology 10.1 Baseball Injury Rates by Type of Exposure 92 10.2 Demographic Characteristics of Injured Baseball Athletes 92 10.3 Body Site of Baseball Injuries by Type of Exposure 93 10.4 Ten Most Common Baseball Injury Diagnoses by Type of Exposure 94 10.5 Baseball Injuries Requiring Surgery by Type of Exposure 95 10.6 Time during Season of Baseball Injuries 95 10.7 Competition-Related Variables for Baseball Injuries 96 10.8 Practice-Related Variables for Baseball Injuries 97 10.9 Activities Leading to Baseball Injuries by Type of Exposure 98
Girls’ Softball Injury Epidemiology 11.1 Softball Injury Rates by Type of Exposure 100 11.2 Demographic Characteristics of Injured Softball Athletes 100 11.3 Body Site of Softball Injuries by Type of Exposure 101 11.4 Ten Most Common Softball Injury Diagnoses by Type of Exposure 102 11.5 Softball Injuries Requiring Surgery by Type of Exposure 103 11.6 Time during Season of Softball Injuries 103 11.7 Competition-Related Variables for Softball Injuries 104 11.8 Practice-Related Variables for Softball Injuries 105 11.9 Activities Leading to Softball Injuries by Type of Exposure 106
Girls’ Field Hockey Injury Epidemiology 12.1 Field Hockey Injury Rates by Type of Exposure 108 12.2 Demographic Characteristics of Injured Field Hockey Athletes 108 12.3 Body Site of Field Hockey Injuries by Type of Exposure 109 12.4 Ten Most Common Field Hockey Injury Diagnoses by Type of Exposure 110 12.5 Field Hockey Injuries Requiring Surgery by Type of Exposure 111 12.6 Time during Season of Field Hockey Injuries 111 12.7 Competition-Related Variables for Field Hockey Injuries 112 12.8 Practice-Related Variables for Field Hockey Injuries 112 12.9 Activities Leading to Field Hockey Injuries by Type of Exposure 113 Boys’ Ice Hockey Injury Epidemiology 13.1 Ice Hockey Injury Rates by Type of Exposure 116 13.2 Demographic Characteristics of Injured Ice Hockey Athletes 116 13.3 Body Site of Ice Hockey Injuries by Type of Exposure 117 13.4 Ten Most Common Ice Hockey Injury Diagnoses by Type of Exposure 118 13.5 Ice Hockey Injuries Requiring Surgery by Type of Exposure 119 13.6 Time during Season of Ice Hockey Injuries 119 13.7 Competition-Related Variables for Ice Hockey Injuries 120 13.8 Practice-Related Variables for Ice Hockey Injuries 121 13.9 Activities Leading to Ice Hockey Injuries by Type of Exposure 122
8
Boys’ Lacrosse Injury Epidemiology 14.1 Boys’ Lacrosse Injury Rates by Type of Exposure 124 14.2 Demographic Characteristics of Injured Boys’ Lacrosse Athletes 124 14.3 Body Site of Boys’ Lacrosse Injuries by Type of Exposure 125 14.4 Ten Most Common Boys’ Lacrosse Injury Diagnoses by Type of Exposure 126 14.5 Boys’ Lacrosse Injuries Requiring Surgery by Type of Exposure 127 14.6 Time during Season of Boys’ Lacrosse Injuries 127 14.7 Competition-Related Variables for Boys’ Lacrosse Injuries 128 14.8 Practice-Related Variables for Boys’ Lacrosse Injuries 129 14.9 Activities Leading to Boys’ Lacrosse Injuries by Type of Exposure 130
Girls’ Lacrosse Injury Epidemiology 15.1 Girls’ Lacrosse Injury Rates by Type of Exposure 132 15.2 Demographic Characteristics of Injured Girls’ Lacrosse Athletes 132 15.3 Body Site of Girls’ Lacrosse Injuries by Type of Exposure 133 15.4 Ten Most Common Girls’ Lacrosse Injury Diagnoses by Type of Exposure 134 15.5 Girls’ Lacrosse Injuries Requiring Surgery by Type of Exposure 135 15.6 Time during Season of Girls’ Lacrosse Injuries 135 15.7 Competition-Related Variables for Girls’ Lacrosse Injuries 136 15.8 Practice-Related Variables for Girls’ Lacrosse Injuries 136 15.9 Activities Leading to Girls’ Lacrosse Injuries by Type of Exposure 137
Boys’ Swimming Injury Epidemiology 16.1 Boys’ Swimming Injury Rates by Type of Exposure 140 16.2 Demographic Characteristics of Injured Boys’ Swimming Athletes 140 16.3 Body Site of Boys’ Swimming Injuries by Type of Exposure 141 16.4 Ten Most Common Boys’ Swimming Injury Diagnoses by Type of Exposure 142 16.5 Boys’ Swimming Injuries Requiring Surgery by Type of Exposure 143 16.6 Time during Season of Boys’ Swimming Injuries 143 16.7 Pool Location for Boys’ Swimming Injuries 144 16.8 Practice-Related Variables for Boys’ Swimming Injuries 144 16.9 Activities Leading to Boys’ Swimming Injuries by Type of Exposure 145 Girls’ Swimming Injury Epidemiology 17.1 Girls’ Swimming Injury Rates by Type of Exposure 147 17.2 Demographic Characteristics of Injured Girls’ Swimming Athletes 147 17.3 Body Site of Girls’ Swimming Injuries by Type of Exposure 148 17.4 Ten Most Common Girls’ Swimming Injury Diagnoses by Type of Exposure 149 17.5 Girls’ Swimming Injuries Requiring Surgery by Type of Exposure 150 17.6 Time during Season of Girls’ Swimming Injuries 150 17.7 Pool Location for Girls’ Swimming Injuries 151 17.8 Practice-Related Variables for Girls’ Swimming Injuries 151 17.9 Activities Leading to Girls’ Swimming Injuries by Type of Exposure 151
9
Boys’ Track Injury Epidemiology 18.1 Boys’ Track Injury Rates by Type of Exposure 154 18.2 Demographic Characteristics of Injured Boys’ Track Athletes 154 18.3 Body Site of Boys’ Track Injuries by Type of Exposure 155 18.4 Ten Most Common Boys’ Track Injury Diagnoses by Type of Exposure 156 18.5 Boys’ Track Injuries Requiring Surgery by Type of Exposure 157 18.6 Time during Season of Boys’ Track Injuries 157 18.7 Practice-Related Variables for Boys’ Track Injuries 158 18.8 Activities Leading to Boys’ Track Injuries by Type of Exposure 158 Girls’ Track Injury Epidemiology 19.1 Girls’ Track Injury Rates by Type of Exposure 161 19.2 Demographic Characteristics of Injured Girls’ Track Athletes 161 19.3 Body Site of Girls’ Track Injuries by Type of Exposure 162 19.4 Ten Most Common Girls’ Track Injury Diagnoses by Type of Exposure 163 19.5 Girls’ Track Injuries Requiring Surgery by Type of Exposure 164 19.6 Time during Season of Girls’ Track Injuries 164 19.7 Practice-Related Variables for Girls’ Track Injuries 165 19.8 Activities Leading to Girls’ Track Injuries by Type of Exposure 165 Boys’ Cross Country Injury Epidemiology 20.1 Boys’ Cross Country Injury Rates by Type of Exposure 168 20.2 Demographic Characteristics of Injured Boys’ Cross Country Athletes 168 20.3 Body Site of Boys’ Cross Country Injuries by Type of Exposure 169 20.4 Ten Most Common Boys’ Cross Country Injury Diagnoses by Type of Exposure 170 20.5 Boys’ Cross Country Injuries Requiring Surgery by Type of Exposure 171 20.6 Time during Season of Boys’ Cross Country Injuries 171 20.7 Practice-Related Variables for Boys' Cross Country Injuries 172 20.8 Activities Leading to Boys’ Cross Country Injuries by Type of Exposure 172 Girls’ Cross Country Injury Epidemiology 21.1 Girls’ Cross Country Injury Rates by Type of Exposure 175 21.2 Demographic Characteristics of Injured Girls’ Cross Country Athletes 175 21.3 Body Site of Girls’ Cross Country Injuries by Type of Exposure 176 21.4 Ten Most Common Girls’ Cross Country Injury Diagnoses by Type of Exposure 177 21.5 Girls’ Cross Country Injuries Requiring Surgery by Type of Exposure 178 21.6 Time during Season of Girls’ Cross Country Injuries 178 21.7 Practice-Related Variables for Girls’ Cross Country Injuries 179 21.8 Activities Leading to Girls’ Cross Country Injuries by Type of Exposure 179

10
Cheerleading Injury Epidemiology 22.1 Cheerleading Injury Rates by Type of Exposure 182 22.2 Demographic Characteristics of Injured Cheerleading Athletes 182 22.3 Body Site of Cheerleading Injuries by Type of Exposure 183 22.4 Ten Most Common Cheerleading Injury Diagnoses by Type of Exposure 184 22.5 Cheerleading Injuries Requiring Surgery by Type of Exposure 185 22.6 Time during Season of Cheerleading Injuries 185 22.7 Practice-Related Variables for Cheerleading Injuries 186 22.8 Activities Leading to Cheerleading Injuries by Type of Exposure 186

Gender Differences within Sports 23.1 Comparison of Boys’ and Girls’ Soccer Injury Rates 189 23.10 Comparison of Body Sites of Boys’ and Girls’ Soccer Injuries 189 23.11 Comparison of Diagnoses of Boys’ and Girls’ Soccer Injuries 190 23.12 Most Common Boys’ and Girls’ Soccer Injury Diagnoses 190 23.13 Comparison of Time Loss of Boys’ and Girls’ Soccer Injuries 190 23.14 Comparison of Mechanisms of Boys’ and Girls’ Soccer Injuries 191 23.15 Comparison of Activities of Boys’ and Girls’ Soccer Injuries 191
23.2 Comparison of Boys’ and Girls’ Basketball Injury Rates 192 23.20 Comparison of Body Sites of Boys’ and Girls’ Basketball Injuries 192 23.21 Comparison of Diagnoses of Boys’ and Girls’ Basketball Injuries 193 23.22 Most Common Boys’ and Girls’ Basketball Injury Diagnoses 193 23.23 Comparison of Time Loss of Boys’ and Girls’ Basketball Injuries 193 23.24 Comparison of Mechanisms of Boys’ and Girls’ Basketball Injuries 194 23.25 Comparison of Activities of Boys’ and Girls’ Basketball Injuries 194
23.3 Comparison of Boys’ Baseball and Girls’ Softball Injury Rates 195 23.30 Comparison of Body Sites of Boys’ Baseball and Girls’ Softball Injuries 195 23.31 Comparison of Diagnoses of Boys’ Baseball and Girls’ Softball Injuries 196 23.32 Most Common Boys’ Baseball and Girls’ Softball Injury Diagnoses 196 23.33 Comparison of Time Loss of Boys’ Baseball and Girls’ Softball Injuries 196 23.34 Comparison of Mechanisms of Boys’ Baseball and Girls’ Softball Injuries 197 23.35 Comparison of Activities of Boys’ Baseball and Girls’ Softball Injuries 197
23.4 Comparison of Boys’ and Girls’ Swimming Injury Rates 198 23.40 Comparison of Body Sites of Boys’ and Girls’ Swimming Injuries 198 23.41 Comparison of Diagnoses of Boys’ and Girls’ Swimming Injuries 199 23.42 Most Common Boys’ and Girls’ Swimming Injury Diagnoses 199 23.43 Comparison of Time Loss of Boys’ and Girls’ Swimming Injuries 199 23.44 Comparison of Mechanisms of Boys’ and Girls’ Swimming Injuries 200 23.45 Comparison of Activities of Boys’ and Girls’ Swimming Injuries 200 23.5 Comparison of Boys’ and Girls’ Track Injury Rates 201 23.50 Comparison of Body Sites of Boys’ and Girls’ Track Injuries 201 23.51 Comparison of Diagnoses of Boys’ and Girls’ Track Injuries 202 23.52 Most Common Boys’ and Girls’ Track Injury Diagnoses 202 23.53 Comparison of Time Loss of Boys’ and Girls’ Track Injuries 202 23.54 Comparison of Mechanisms of Boys’ and Girls’ Track Injuries 203 23.55 Comparison of Activities of Boys’ and Girls’ Track Injuries 203

12
23.6 Comparison of Boys’ and Girls’ Cross Country Injury Rates 204 23.60 Comparison of Body Sites of Boys’ and Girls’ Cross Country Injuries 204 23.61 Comparison of Diagnoses of Boys’ and Girls’ Cross Country Injuries 205 23.62 Most Common Boys’ and Girls’ Cross Country Injury Diagnoses 205 23.63 Comparison of Time Loss of Boys’ and Girls’ Cross Country Injuries 205 23.64 Comparison of Mechanisms of Boys’ and Girls’ Cross Country Injuries 206 23.65 Comparison of Activities of Boys’ and Girls’ Cross Country Injuries 206
13
Figures
Overall Injury Epidemiology 2.1 Injury Diagnosis by Type of Exposure 31 2.2 Time Loss by Type of Exposure 33 2.3 New and Recurring Injuries by Type of Exposure 34 Boys’ Football Injury Epidemiology 3.1 Diagnosis of Football Injuries by Type of Exposure 38 3.2 Time Loss of Football Injuries by Type of Exposure 39 3.3 History of Football Injuries by Type of Exposure 40 3.4 Player Position of Football Injuries by Type of Exposure 42 3.5 Activity Resulting in Football Injuries by Injury Diagnosis 43 Boys’ Soccer Injury Epidemiology 4.1 Type of Boys’ Soccer Injuries by Type of Exposure 46 4.2 Time Loss of Boys’ Soccer Injuries by Type of Exposure 47 4.3 History of Boys’ Soccer Injuries by Type of Exposure 48 4.4 Player Position of Boys’ Soccer Injuries by Type of Exposure 50 4.5 Activity Resulting in Boys’ Soccer Injuries by Injury Diagnosis 51 Girls’ Soccer Injury Epidemiology 5.1 Diagnosis of Girls’ Soccer Injuries by Type of Exposure 54 5.2 Time Loss of Girls’ Soccer Injuries by Type of Exposure 55 5.3 History of Girls’ Soccer Injuries by Type of Exposure 56 5.4 Player Position of Girls’ Soccer Injuries by Type of Exposure 58 5.5 Activity Resulting in Girls’ Soccer Injuries by Injury Diagnosis 59 Girls’ Volleyball Injury Epidemiology 6.1 Diagnosis of Volleyball Injuries by Type of Exposure 62 6.2 Time Loss of Volleyball Injuries by Type of Exposure 63 6.3 History of Volleyball Injuries by Type of Exposure 64 6.4 Player Position of Volleyball Injuries by Type of Exposure 66 6.5 Activity Resulting in Volleyball Injuries by Injury Diagnosis 67 Boys’ Basketball Injury Epidemiology 7.1 Diagnosis of Boys’ Basketball Injuries by Type of Exposure 70 7.2 Time Loss of Boys’ Basketball Injuries by Type of Exposure 71 7.3 History of Boys’ Basketball Injuries by Type of Exposure 72 7.4 Player Position of Boys’ Basketball Injuries by Type of Exposure 74 7.5 Activity Resulting in Boys’ Basketball Injuries by Injury Diagnosis 75 Girls’ Basketball Injury Epidemiology 8.1 Diagnosis of Girls’ Basketball Injuries by Type of Exposure 78 8.2 Time Loss of Girls’ Basketball Injuries by Type of Exposure 79 8.3 History of Girls’ Basketball Injuries by Type of Exposure 80 8.4 Player Position of Girls’ Basketball Injuries by Type of Exposure 82

14
8.5 Activity Resulting in Girls’ Basketball Injuries by Injury Diagnosis 83 Boys’ Wrestling Injury Epidemiology 9.1 Diagnosis of Wrestling Injuries by Type of Exposure 86 9.2 Time Loss of Wrestling Injuries by Type of Exposure 87 9.3 History of Wrestling Injuries by Type of Exposure 88 9.4 Activity Resulting in Wrestling Injuries by Injury Diagnosis 90 Boys’ Baseball Injury Epidemiology 10.1 Diagnosis of Baseball Injuries by Type of Exposure 93 10.2 Time Loss of Baseball Injuries by Type of Exposure 94 10.3 History of Baseball Injuries by Type of Exposure 95 10.4 Player Position of Baseball Injuries by Type of Exposure 97 10.5 Activity Resulting in Baseball Injuries by Injury Diagnosis 98 Girls’ Softball Injury Epidemiology 11.1 Diagnosis of Softball Injuries by Type of Exposure 101 11.2 Time Loss of Softball Injuries by Type of Exposure 102 11.3 History of Softball Injuries by Type of Exposure 103 11.4 Player Position of Softball Injuries by Type of Exposure 105 11.5 Activity Resulting in Softball Injuries by Injury Diagnosis 106 Girls’ Field Hockey Injury Epidemiology 12.1 Diagnosis of Girls’ Field Hockey Injuries by Type of Exposure 109 12.2 Time Loss of Girls’ Field Hockey Injuries by Type of Exposure 110 12.3 History of Girls’ Field Hockey Injuries by Type of Exposure 111 12.4 Player Position of Girls’ Field Hockey Injuries by Type of Exposure 113 12.5 Activity Resulting in Girls’ Field Hockey Injuries by Injury Diagnosis 114 Boys’ Ice Hockey Injury Epidemiology 13.1 Diagnosis of Boys’ Ice Hockey Injuries by Type of Exposure 117 13.2 Time Loss of Boys’ Ice Hockey Injuries by Type of Exposure 118 13.3 History of Boys’ Ice Hockey Injuries by Type of Exposure 119 13.4 Player Position of Boys’ Ice Hockey Injuries by Type of Exposure 121 13.5 Activity Resulting in Boys’ Ice Hockey Injuries by Injury Diagnosis 122 Boys’ Lacrosse Injury Epidemiology 14.1 Diagnosis of Boys’ Lacrosse Injuries by Type of Exposure 125 14.2 Time Loss of Boys’ Lacrosse Injuries by Type of Exposure 126 14.3 History of Boys’ Lacrosse Injuries by Type of Exposure 127 14.4 Player Position of Boys’ Lacrosse Injuries by Type of Exposure 129 14.5 Activity Resulting in Boys’ Lacrosse Injuries by Injury Diagnosis 130
15
Girls’ Lacrosse Injury Epidemiology 15.1 Diagnosis of Girls’ Lacrosse Injuries by Type of Exposure 133 15.2 Time Loss of Girls’ Lacrosse Injuries by Type of Exposure 134 15.3 History of Girls’ Lacrosse Injuries by Type of Exposure 135 15.4 Player Position of Girls’ Lacrosse Injuries by Type of Exposure 137 15.5 Activity Resulting in Girls’ Lacrosse Injuries by Injury Diagnosis 138 Boys’ Swimming Injury Epidemiology 16.1 Diagnosis of Boys’ Swimming Injuries by Type of Exposure 141 16.2 Time Loss of Boys’ Swimming Injuries by Type of Exposure 142 16.3 History of Boys’ Swimming Injuries by Type of Exposure 143 16.4 Activity Resulting in Boys’ Swimming Injuries by Injury Diagnosis 145 Girls’ Swimming Injury Epidemiology 17.1 Diagnosis of Girls’ Swimming Injuries by Type of Exposure 148 17.2 Time Loss of Girls’ Swimming Injuries by Type of Exposure 149 17.3 History of Girls’ Swimming Injuries by Type of Exposure 150 17.4 Activity Resulting in Girls’ Swimming Injuries by Injury Diagnosis 152 Boys’ Track Injury Epidemiology 18.1 Diagnosis of Boys’ Track Injuries by Type of Exposure 155 18.2 Time Loss of Boys’ Track Injuries by Type of Exposure 156 18.3 History of Boys’ Track Injuries by Type of Exposure 157 18.4 Activity Resulting in Boys’ Track Injuries by Injury Diagnosis 159 Girls’ Track Injury Epidemiology 19.1 Diagnosis of Girls’ Track Injuries by Type of Exposure 162 19.2 Time Loss of Girls’ Track Injuries by Type of Exposure 163 19.3 History of Girls’ Track Injuries by Type of Exposure 164 19.4 Activity Resulting in Girls’ Track Injuries by Injury Diagnosis 166 Boys’ Cross Country Injury Epidemiology 20.1 Diagnosis of Boys' Cross Country Injuries by Type of Exposure 169 20.2 Time Loss of Boys’ Cross Country Injuries by Type of Exposure 170 20.3 History of Boys’ Cross Country Injuries by Type of Exposure 171 20.4 Activity Resulting in Boys’ Cross Country Injuries by Injury Diagnosis 173 Girls’ Cross Country Injury Epidemiology 21.1 Diagnosis of Girls’ Cross Country Injuries by Type of Exposure 176 21.2 Time Loss of Girls’ Cross Country Injuries by Type of Exposure 177 21.3 History of Girls’ Cross Country Injuries by Type of Exposure 178 21.4 Activity Resulting in Girls’ Cross Country Injuries by Injury Diagnosis 180

16
Cheerleading Injury Epidemiology 22.1 Diagnosis of Cheerleading Injuries by Type of Exposure 183 22.2 Time Loss of Cheerleading Injuries by Type of Exposure 184 22.3 History of Cheerleading Injuries by Type of Exposure 185 22.4 Activity Resulting in Cheerleading Injuries by Injury Diagnosis 187

I. Introduction & Methodology

18
1.1 Project Overview
To combat the epidemic of obesity among youth in the United States (US), adolescents
must be encouraged to get up off the couch and participate in physically active sports, recreation,
and leisure activities. Participation in high school sports, one of the most popular physical
activities among adolescents, has grown rapidly from an estimated 4.0 million participants in
1971-72 to an estimated 7.7 million in 2011-12. While the health benefits of a physically active
lifestyle including participating in sports are undeniable, high school athletes are at risk of
sports-related injury because a certain endemic level of injury can be expected among
participants of any physical activity. The challenge to injury epidemiologists is to reduce injury
rates among high school athletes to the lowest possible level without discouraging adolescents
from engaging in this important form of physical activity. This goal can best be accomplished
by investigating the etiology of preventable injuries; by developing, implementing, and
evaluating protective interventions using such science-based evidence; and by responsibly
reporting epidemiologic findings while promoting a physically active lifestyle among
adolescents.
1.2 Background and Significance
High school sports play an important role in the adoption and maintenance of a physically
active lifestyle among millions of US adolescents. Too often injury prevention in this population
is overlooked as sports-related injuries are thought to be unavoidable. In reality, sports-related
injuries are largely preventable through the application of preventive interventions based on
evidence-based science. The morbidity, mortality, and disability caused by high school sports-
related injuries can be reduced through the development of effective prevention strategies and
through programmatic decisions based on injury prevention. However, such efforts rely upon
19
accurate national estimates of injury incidence, injury rate calculations, and risk and protective
factor data. Previously, no injury surveillance system capable of providing researchers with the
needed quality of injury and exposure data for high school sports-related injuries existed.
Since the 2005-06 school year, Dr. R. Dawn Comstock has conducted the National High
School Sports-Related Injury Surveillance System to monitor injuries among US high school
athletes participating in boys’ football, boys’ and girls’ soccer, boys’ and girls’ volleyball, boys’
and girls’ basketball, boys’ wrestling, boys’ baseball, girls’ softball, girls’ field hockey, girls’
gymnastics, boys’ ice hockey, boys’ and girls’ lacrosse, boys’ and girls’ swimming & diving,
boys’ and girls’ track & field, boys’ and girls’ cross country, and cheerleading. This surveillance
has been conducted using the time- and cost-efficient RIOTM (Reporting Information Online)
surveillance system. This study during the 2012-13 academic year was funded by the Centers for
Disease Control and Prevention (CDC), National Operating Committee on Standards for Athletic
Equipment (NOCSAE), and the National Federation of State High School Associations (NFHS).
1.3 Specific Aims
The continuing objectives of this study are to continue the National High School Sports-
Related Injury Surveillance System among a nationally representative sample of US high
schools. The specific aims of this study are:
A) To determine the incidence (number) of injuries among US high school boys’ football,
boys’ and girls’ soccer, girls’ volleyball, boys’ and girls’ basketball, boys’ wrestling,
boys’ baseball, girls’ softball, girls’ field hockey, boys’ ice hockey, boys’ and girls’
lacrosse, boys’ and girls’ swimming & diving, boys’ and girls’ track & field, boys’ and
girls’ cross country, and cheerleading athletes.

20
B) To calculate the rate of injuries per 1,000 athlete-competitions, per 1,000 athlete-
practices, and per 1,000 athlete-exposures for US high school athletes in the 18 sports of
interest.
C) To provide detailed information about the injuries sustained by US high school athletes
including the type, site, severity, initial and subsequent treatment/care, outcome, etc.
D) To provide detailed information about the injury events including athlete demographics,
position played, phase of play/activity, etc.
E) To identify potential risk or protective factors.
1.4 Project Design
The National High School Sports-Related Injury Surveillance System defined an injury as:
A) An injury that occurred as a result of participation in an organized high school
competition, practice, or performance and
B) Required medical attention by a team physician, certified athletic trainer, personal
physician, or emergency department/urgent care facility and
C) Resulted in restriction of the high school athlete’s participation for one or more days
beyond the day of injury and
D) Any fracture, concussion, or dental injury regardless of whether or not it resulted in
restriction of the student-athlete's participation.
An athlete exposure was defined as one athlete participating in one practice, competition or
performance where he or she is exposed to the possibility of athletic injury. Exposure was
expressed in three parts:

21
A) Number of athlete-practices = the sum of the number of athletes at each practice during
the past week. For example, if 20 athletes practiced on Monday through Thursday and 18
practiced on Friday, the number of athlete-practices would equal 98.
B) Number of athlete-competitions = the sum of the number of athletes at each competition
during the past week. For example, if 9 athletes played in a Freshman game, 12 in a JV
game, and 14 in a Varsity game, the number of athlete-competitions would equal 35.
C) Number of athlete-performances = the sum of the number of cheerleading athletes at each
performance during the past week. For example, if 9 cheerleading athletes performed 3
times in one weekend, the number of athlete-performances would equal 27.
1.5 Sample Recruitment
The National Athletic Trainers’ Association (NATA) membership list was used to identify
eligible reporters - certified athletic trainers (AT) who provide care for high school athletes and
who have a valid e-mail address. Each eligible reporter received an e-mail introducing the study
and inviting them to participate. A three stage sampling methodology was used to select study
schools from all schools with ATs who expressed an interest in participating as reporters.
1) All schools were categorized into 8 sampling strata by geographic location (northeast,
Midwest, south, and west) and high school size (enrollment <= 1,000 or > 1,000
students). Participant schools were then randomly selected from each substrata to obtain
100 study schools to report for each of the 9 sports included in the original National High
School Sports-Related Injury Surveillance Study (boys’ football, soccer, basketball,
wrestling, and baseball and girls’ soccer, volleyball, basketball, and softball). This subset
of 100 study schools were the randomly selected, nationally representative sample.
22
2) All schools not selected in step 1 who offered any of the more rarely offered 9 sports
included in the expansion of the National High School Sports-Related Injury Surveillance
Study (girls’ field hockey, and lacrosse and boys’ ice hockey and lacrosse) were selected
for the convenience sample in an attempt to obtain as large a sample as possible reporting
for these more rarely offered sports.
3) A random sample of all schools not selected in step 1 or step 2 who offered the remaining
sports of interest in the expansion of the National High School Sports-Related Injury
Surveillance Study (boys’ and girls’ track & field, swimming & diving, cross country,
and cheerleading) were selected in an attempt to ensure at least 100 schools were
reporting for each of the 20 sports of interest.
This three step sampling methodology resulted in a large, nationally disperse convenience
sample of US high schools. Participating ATs were offered a $300-$400 honorarium depending
on the number of sports reported along with individualized injury reports following the study’s
conclusion.

23
As a result of the convenience sample methodology, different schools reported for the
different sports of interest. See table below:
School Participation by Sport, High School Sports-Related Injury Surveillance Study, US,
2012-13 School Year.*
# Schools in
Random Sample # Schools in
Convenience Sample # Schools Total
Original Sports Football 92 71 163 Boys’ Soccer 87 66 153 Girls’ Soccer 84 63 147 Girls’ Volleyball 90 71 161 Boys’ Basketball 97 74 171 Girls’ Basketball 96 75 171 Wrestling 81 68 149 Baseball 91 60 151 Softball 92 63 155 New Sports Field Hockey 21 34 55 Ice Hockey 12 20 32 Boys’ Lacrosse 19 37 56 Girls’ Lacrosse 19 36 55 Boys’ Swimming and Diving 36 56 92 Girls’ Swimming and Diving 38 55 93 Boys’ Track and Field 67 73 140 Girls’ Track and Field 66 72 138 Boys’ Cross Country 58 71 129 Girls’ Cross Country 58 78 136 Cheerleading 50 77 127 Total 100 108 208
*Numbers only include schools who actually reported data for the 2012-13 school year.
1.6 Data Collection
Each AT that enrolled their school in National High School Sports-Related Injury
Surveillance System received an email every Monday throughout the study period reminding
them to enter their school’s data into the surveillance system. Each participating AT was asked
to complete 45 weekly exposure reports: one for each week from July 30, 2012 through June 9,
2013. Exposure reports collected exposure information (number of athlete-competitions and
athlete-practices) and the number of reportable injuries sustained by student athletes of each
24
sport that was currently in session at their school. For each reportable injury, the AT was asked
to complete an injury report. The injury report collected detailed information about the injured
player (e.g., age, year in school, etc.), the injury (e.g. site, type, severity, etc.) and the injury
event (e.g., position played, phase of play, etc.). This internet-based surveillance tool provided
ATs with the ability to view all their submitted data throughout the study and update reports as
needed (e.g., need for surgery, days till resuming play, etc.).
1.7 Data Management
In an effort to decrease loss-to follow up, a log of reporters’ utilization of the internet-
based injury surveillance system was maintained throughout the study period. Reporters who
repeatedly failed to log on to complete the weekly exposure and injury reports or who had errors
with their reporting were contacted by the study staff and either reminded to report, asked to
correct errors, or assessed for their willingness to continue participating in the study.
1.8 Data Analysis
Data were analyzed using SAS software, version 9.3 and SPSS, version 19.0. Although
fractures, concussions, and dental injuries resulting in <1 day time loss were collected, unless
otherwise noted, analyses in this report excluded these injuries.
Injury rates were calculated as the ratio of unweighted case counts per 1,000 athlete-
exposures, and they were compared using rate ratios (RR) with 95% confidence intervals (CI).
Following is an example of the RR calculation comparing the rate of injury in boys’ soccer to the
rate of injury in girls’ soccer:
# boys’ soccer injuries / total # boys’ soccer athlete-exposures RR = ------------------------------------------------------------------------------ # girls’ soccer injuries / total # girls’ soccer athlete-exposures

25
Injury proportions were compared using injury proportion ratios (IPR) and corresponding
confidence intervals. Following is an example of the IPR calculation comparing the proportion of
male soccer concussions to the proportion of female soccer concussions:
# boys’ soccer concussions / total # boys’ soccer injuries
IPR = ----------------------------------------------------------------------- # girls’ soccer concussions / total # girls’ soccer injuries
An RR or IPR >1.00 suggests a risk association while an RR or IPR <1.00 suggests a protective
association. CI not including 1.00 were considered statistically significant

26
II. Overall Injury Epidemiology

27
Table 2.1 Injury Rates by Sport and Type of Exposure, High School Sports-Related Injury
Surveillance Study, US, 2012-13 School Year*
# Injuries # Exposures Injury rate (per
1,000 AEs)
Overall total 7,962 4,649,958 1.71
Competition 4,121 1,149,996 3.58
Practice 3,818 3,448,934 1.11
Performance 23 51,028 0.45
Boys’ football total 3,144 814,862 3.86
Competition 1,679 138,335 12.14
Practice 1,465 676,527 2.17
Boys’ soccer total 416 291,519 1.43
Competition 270 87,862 3.07
Practice 146 203,657 0.72
Girls’ soccer total 556 238,852 2.33
Competition 412 72,161 5.71
Practice 144 166,691 0.86
Girls’ volleyball total 284 279,165 1.02
Competition 111 94,448 1.18
Practice 173 184,717 0.94
Boys’ basketball total 568 376,827 1.51
Competition 300 114,787 2.61
Practice 268 262,040 1.02
Girls’ basketball total 581 298,208 1.95
Competition 326 94,049 3.47
Practice 255 204,159 1.25
Boys’ wrestling total 574 272,077 2.11
Competition 231 72,909 3.17
Practice 343 199,168 1.72
Boys’ baseball total 246 288,730 0.85
Competition 131 99,222 1.32
Practice 115 189,508 0.61
Girls' softball total 240 205,072 1.17
Competition 131 70,041 1.87
Practice 109 135,031 0.81
Girls’ Field Hockey total 123 83,070 1.48
Competition 58 27,324 2.12
Practice 65 55,746 1.17

28
Table 2.1 (Continued) Injury Rates by Sport and Type of Exposure, High School Sports-
Related Injury Surveillance Study, US, 2012-13 School Year*
# Injuries # Exposures Injury rate
(per 1,000 AEs)
Boys’ Ice Hockey total 117 57,852 2.02
Competition 98 19,039 5.15
Practice 19 38,813 0.49
Boys’ Lacrosse total 209 112,372 1.86
Competition 132 35,268 3.74
Practice 77 77,104 1.00
Girls’ Lacrosse total 102 82,424 1.24
Competition 65 26,995 2.41
Practice 37 55,429 0.67
Boys’ Swimming total 12 105,362 0.11
Competition 1 18,773 0.05
Practice 11 86,589 0.13
Girls’ Swimming total 30 114,803 0.26
Competition 10 21,033 0.48
Practice 20 93,770 0.21
Boys’ Track total 157 287,667 0.55
Competition 60 55,368 1.08
Practice 97 232,299 0.42
Girls’ Track total 203 236,271 0.86
Competition 48 44,163 1.09
Practice 155 192,108 0.81
Boys’ Cross Country total 84 129,244 0.65
Competition 17 21,845 0.78
Practice 67 107,399 0.62
Girls’ Cross Country total 124 113,000 1.10
Competition 22 19,519 1.13
Practice 102 93,481 1.09
Cheerleading total 192 262,581 0.73
Competition 19 16,855 1.13
Practice 150 194,698 0.77
Performance 23 51,028 0.45
*Only includes injuries resulting in ≥1 days’ time loss.

29
Table 2.2 Proportion of Injuries Resulting in Time Loss, High School Sports-Related
Injury Surveillance Study, US, 2012-13 School Year*
≥1 day time loss <1 day time loss Total
Overall 98.1% 1.9% 100%
Boys’ football 98.2% 1.8% 100%
Boys’ soccer 98.1% 1.9% 100%
Girls’ soccer 97.7% 2.3% 100%
Girls’ volleyball 97.6% 2.4% 100%
Boys’ basketball 97.3% 2.7% 100%
Girls’ basketball 97.6% 2.4% 100%
Boys’ wrestling 98.8% 1.2% 100%
Boys’ baseball 96.1% 3.9% 100%
Girls’ softball 98.4% 1.6% 100%
Girls' field hockey 98.4% 1.6% 100%
Boys' ice hockey 100.0% 0.0% 100%
Boys' lacrosse 99.5% 0.5% 100%
Girls' lacrosse 99.0% 1.0% 100%
Boys' swimming 100.0% 0.0% 100%
Girls' swimming 96.8% 3.2% 100%
Boys' track 98.7% 1.3% 100%
Girls' track 99.0% 1.0% 100%
Cheerleading 99.0% 1.0% 100%
Boys’ cross country 96.6% 3.4% 100%
Girls’ cross country 96.9% 3.1% 100%
*By study definition, non-time loss injuries were fractures, concussions, and dental injuries. Because they accounted for less than 2% of all injuries, they are not included in any other analyses.
30
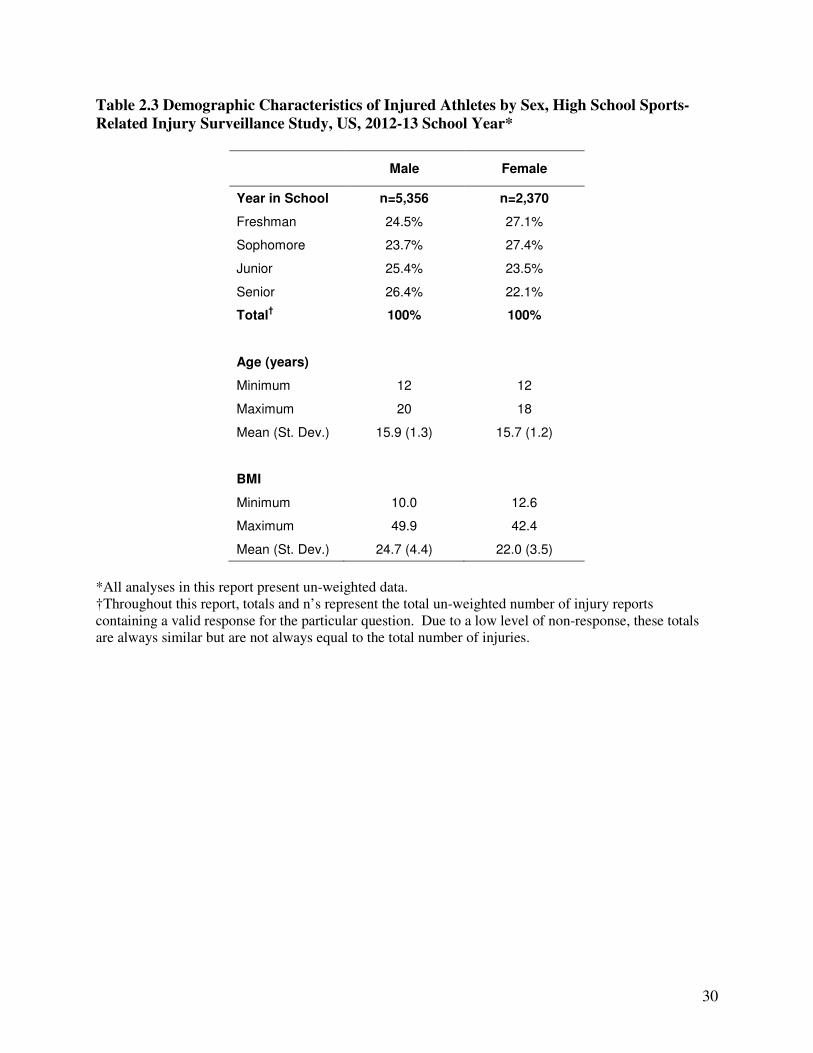
Table 2.3 Demographic Characteristics of Injured Athletes by Sex, High School Sports-
Related Injury Surveillance Study, US, 2012-13 School Year*
Male Female
Year in School n=5,356 n=2,370
Freshman 24.5% 27.1%
Sophomore 23.7% 27.4%
Junior 25.4% 23.5%
Senior 26.4% 22.1%
Total† 100% 100%
Age (years)
Minimum 12 12
Maximum 20 18
Mean (St. Dev.) 15.9 (1.3) 15.7 (1.2)
BMI
Minimum 10.0 12.6
Maximum 49.9 42.4
Mean (St. Dev.) 24.7 (4.4) 22.0 (3.5)
*All analyses in this report present un-weighted data. †Throughout this report, totals and n’s represent the total un-weighted number of injury reports containing a valid response for the particular question. Due to a low level of non-response, these totals are always similar but are not always equal to the total number of injuries.

31
Figure 2.1 Injury Diagnosis by Type of Exposure, High School Sports-Related Injury
Surveillance Study, US, 2012-13 School Year
Table 2.4 Body Site of Injury by Type of Exposure, High School Sports-Related Injury
Surveillance Study, US, 2012-13 School Year
Competition Practice Overall*
n % n % n %
Body Site
Head/face 1,175 28.5% 764 20.0% 1,943 24.4%
Ankle 642 15.6% 579 15.2% 1,224 15.4%
Knee 634 15.4% 487 12.8% 1,125 14.1%
Hip/thigh/upper leg 328 8.0% 475 12.4% 804 10.1%
Shoulder 299 7.3% 262 6.9% 563 7.1%
Hand/wrist 283 6.9% 267 7.0% 552 6.9%
Lower leg 152 3.7% 261 6.8% 414 5.2%
Trunk 158 3.8% 242 6.3% 402 5.1%
Foot 119 2.9% 150 3.9% 272 3.4%
Arm/elbow 133 3.2% 137 3.6% 270 3.4%
Neck 90 2.2% 78 2.0% 168 2.1%
Other 104 2.5% 115 3.0% 220 2.8%
Total 4,117 100% 3,817 100% 7,957 100%
*Overall includes cheerleading performance related injuries however performance injuries do not have an individual column due to them totaling less than 1.0% of all injuries. †Totals and n’s are not always equal due to slight rounding or missing responses.
40%
10%9%
26%
15%
Competition n=4,116
Strain/sprain
Contusion
Fracture
Concussion
Other
44%
7%7%
17%
25%
Practice n=3,814

32
Table 2.5 Most Commonly Injured Ankle Structures, High School Sports-Related Injury
Surveillance Study, US, 2012-13 School Year
Male Female Total
n % of ankle
injuries n
% of ankle
injuries n
% of ankle
injuries
Ankle Ligament
Anterior talofibular ligament 492 70.1% 368 75.3% 860 72.2%
Calcaneofibular ligament 210 29.9% 156 31.9% 366 30.7%
Anterior tibiofibular ligament 169 24.1% 98 20.0% 267 22.4%
Posterior talofibular ligament 64 9.1% 58 11.9% 122 10.2%
Deltoid ligament 66 9.4% 35 7.2% 101 8.5%
Posterior tibiofibular ligament 31 4.4% 20 4.1% 51 4.3%
Total Ankle Injuries 702 489 1,191
*Multiple responses allowed per injury report. †Totals and n’s are not always equal due to slight rounding or missing responses.
Table 2.6 Most Commonly Injured Knee Structures, High School Sports-Related Injury
Surveillance Study, US, 2012-13 School Year
Male Female Total
n % of knee
injuries n
% of knee
injuries n
% of knee
injuries
Knee Ligament
Medial collateral ligament 239 32.3% 53 15.4% 292 27.0%
Anterior cruciate ligament 142 19.2% 113 32.8% 255 23.5%
Patella/patellar tendon 151 20.4% 92 26.7% 243 22.4%
Torn cartilage (meniscus) 151 20.4% 69 20.1% 220 20.3%
Lateral collateral ligament 50 6.8% 20 5.8% 70 6.5%
Posterior cruciate ligament 11 1.5% 10 2.9% 21 1.9%
Total Knee Injuries 739 344 1,083
*Multiple responses allowed per injury report. †Totals and n’s are not always equal due to slight rounding or missing responses.
33
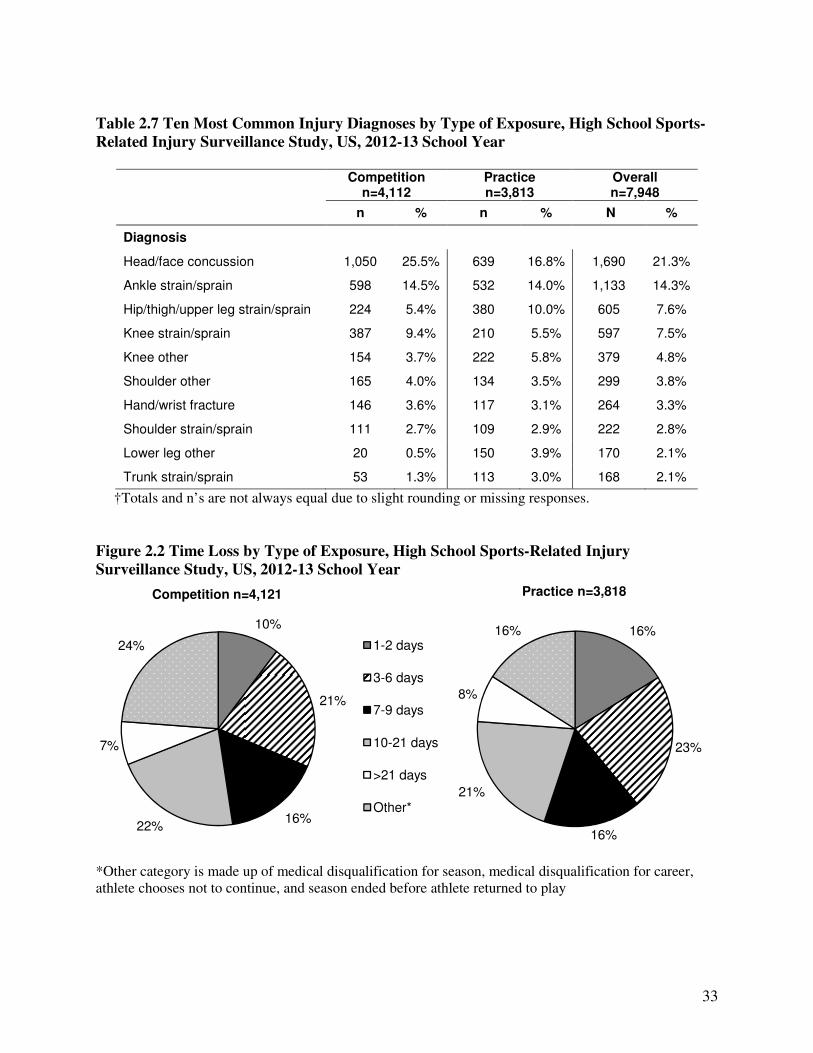
Table 2.7 Ten Most Common Injury Diagnoses by Type of Exposure, High School Sports-
Related Injury Surveillance Study, US, 2012-13 School Year
Competition
n=4,112 Practice n=3,813
Overall n=7,948
n % n % N %
Diagnosis
Head/face concussion 1,050 25.5% 639 16.8% 1,690 21.3%
Ankle strain/sprain 598 14.5% 532 14.0% 1,133 14.3%
Hip/thigh/upper leg strain/sprain 224 5.4% 380 10.0% 605 7.6%
Knee strain/sprain 387 9.4% 210 5.5% 597 7.5%
Knee other 154 3.7% 222 5.8% 379 4.8%
Shoulder other 165 4.0% 134 3.5% 299 3.8%
Hand/wrist fracture 146 3.6% 117 3.1% 264 3.3%
Shoulder strain/sprain 111 2.7% 109 2.9% 222 2.8%
Lower leg other 20 0.5% 150 3.9% 170 2.1%
Trunk strain/sprain 53 1.3% 113 3.0% 168 2.1%
†Totals and n’s are not always equal due to slight rounding or missing responses.
Figure 2.2 Time Loss by Type of Exposure, High School Sports-Related Injury
Surveillance Study, US, 2012-13 School Year
*Other category is made up of medical disqualification for season, medical disqualification for career, athlete chooses not to continue, and season ended before athlete returned to play
10%
21%
16%22%
7%
24%
Competition n=4,121
1-2 days
3-6 days
7-9 days
10-21 days
>21 days
Other*
16%
23%
16%
21%
8%
16%
Practice n=3,818
34
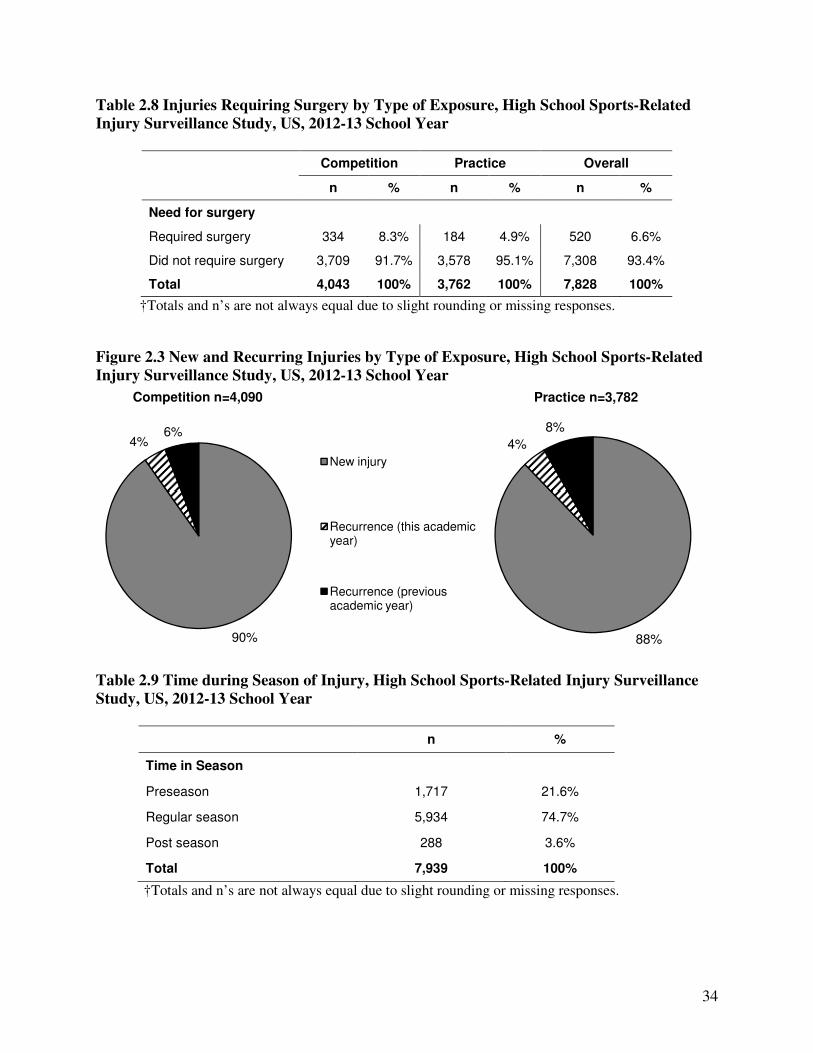
Table 2.8 Injuries Requiring Surgery by Type of Exposure, High School Sports-Related
Injury Surveillance Study, US, 2012-13 School Year
Competition Practice Overall
n % n % n %
Need for surgery
Required surgery 334 8.3% 184 4.9% 520 6.6%
Did not require surgery 3,709 91.7% 3,578 95.1% 7,308 93.4%
Total 4,043 100% 3,762 100% 7,828 100%
†Totals and n’s are not always equal due to slight rounding or missing responses.
Figure 2.3 New and Recurring Injuries by Type of Exposure, High School Sports-Related
Injury Surveillance Study, US, 2012-13 School Year
Table 2.9 Time during Season of Injury, High School Sports-Related Injury Surveillance
Study, US, 2012-13 School Year
n %
Time in Season
Preseason 1,717 21.6%
Regular season 5,934 74.7%
Post season 288 3.6%
Total 7,939 100%
†Totals and n’s are not always equal due to slight rounding or missing responses.
90%
4%6%
Competition n=4,090
New injury
Recurrence (this academic year)
Recurrence (previous academic year)
88%
4%
8%
Practice n=3,782

35
Table 2.10 Practice-Related Variables, High School Sports-Related Injury Surveillance
Study, US, 2012-13 School Year
n %
Time in Practice
First ½ hour 412 11.6%
Second ½ hour 694 19.5%
1-2 hours into practice 2,065 58.0%
> 2 hours into practice 391 11.0%
Total 3,562 100%
†Totals and n’s are not always equal due to slight rounding or missing responses.
Table 2.11 Methods for Injury Evaluation and Assessment, High School Sports-Related
Injury Surveillance Study, US, 2012-13 School Year
n %
% of Injuries Evaluated by:*
Certified athletic trainer 7,420 93.2%
General physician 2,773 34.8%
Orthopedic physician 2,603 32.7%
Neurologist 115 1.4%
Physician’s assistant 113 1.4%
Chiropractor 99 1.2%
Nurse practitioner 47 0.6%
Dentist/oral surgeon 21 0.3%
Other 266 3.3%
Total 7,962
% of Injuries Assessed by:*
Evaluation 7,804 98.0%
X-ray 2,723 34.2%
MRI 826 10.4%
CT-scan 316 4.0%
Surgery 88 1.1%
Blood work/lab test 76 1.0%
Other 59 0.7%
Total 7,962
*Multiple responses allowed per injury report. †Totals and n’s are not always equal due to slight rounding or missing responses.
36
III. Boys’ Football Injury Epidemiology

37
Table 3.1 Football Injury Rates by Type of Exposure, High School Sports-Related Injury
Surveillance Study, US, 2012-13 School Year
# Injuries # Exposures Injury rate
(per 1,000 athlete-exposures)
Total 3,144 814,862 3.86
Competition 1,679 138,335 12.14
Practice 1,465 676,527 2.17
Table 3.2 Demographic Characteristics of Injured Football Athletes, High School Sports-
Related Injury Surveillance Study, US, 2012-13 School Year*
Year in School n=3,102
Freshman 25.9%
Sophomore 23.5%
Junior 25.6%
Senior 25.0%
Total† 100%
Age (years)
Minimum 13
Maximum 19
Mean (St. Dev.) 15.8 (1.2)
BMI
Minimum 16.0
Maximum 49.9
Mean (SE) 25.7 (4.7)
*All analyses in this report present un-weighted data †Throughout this report, totals and n’s represent the total un-weighted number of injury reports containing a valid response for the particular question. Due to a low level of non-response, these totals are always similar but are not always equal to the total number of injuries.
38
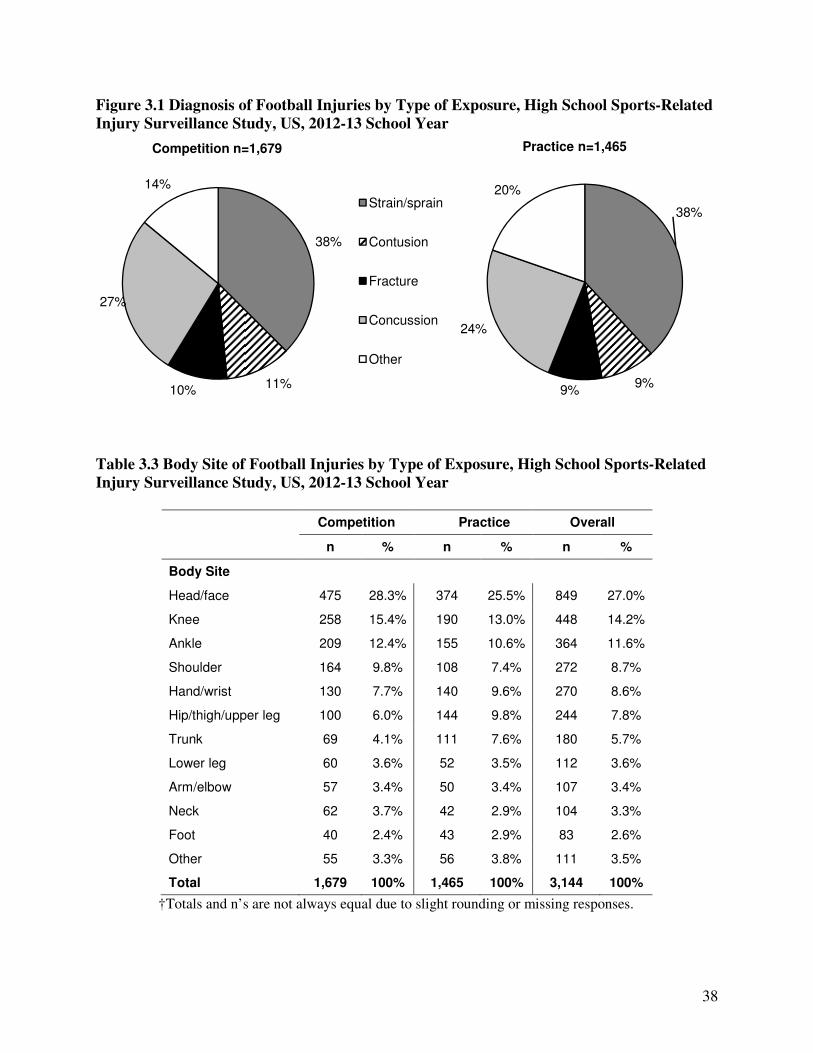
Figure 3.1 Diagnosis of Football Injuries by Type of Exposure, High School Sports-Related
Injury Surveillance Study, US, 2012-13 School Year
Table 3.3 Body Site of Football Injuries by Type of Exposure, High School Sports-Related
Injury Surveillance Study, US, 2012-13 School Year
Competition Practice Overall
n % n % n %
Body Site
Head/face 475 28.3% 374 25.5% 849 27.0%
Knee 258 15.4% 190 13.0% 448 14.2%
Ankle 209 12.4% 155 10.6% 364 11.6%
Shoulder 164 9.8% 108 7.4% 272 8.7%
Hand/wrist 130 7.7% 140 9.6% 270 8.6%
Hip/thigh/upper leg 100 6.0% 144 9.8% 244 7.8%
Trunk 69 4.1% 111 7.6% 180 5.7%
Lower leg 60 3.6% 52 3.5% 112 3.6%
Arm/elbow 57 3.4% 50 3.4% 107 3.4%
Neck 62 3.7% 42 2.9% 104 3.3%
Foot 40 2.4% 43 2.9% 83 2.6%
Other 55 3.3% 56 3.8% 111 3.5%
Total 1,679 100% 1,465 100% 3,144 100%
†Totals and n’s are not always equal due to slight rounding or missing responses.
38%
11%10%
27%
14%
Competition n=1,679
Strain/sprain
Contusion
Fracture
Concussion
Other
38%
9%9%
24%
20%
Practice n=1,465
39
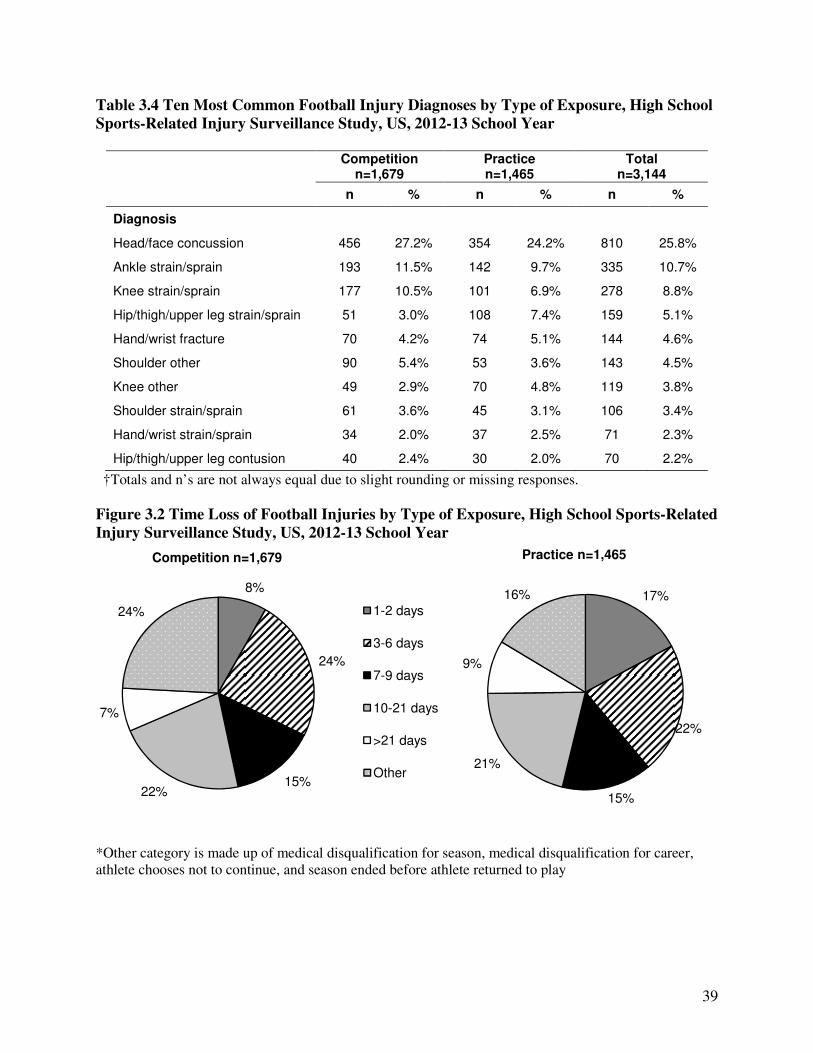
Table 3.4 Ten Most Common Football Injury Diagnoses by Type of Exposure, High School
Sports-Related Injury Surveillance Study, US, 2012-13 School Year
Competition
n=1,679 Practice n=1,465
Total n=3,144
n % n % n %
Diagnosis
Head/face concussion 456 27.2% 354 24.2% 810 25.8%
Ankle strain/sprain 193 11.5% 142 9.7% 335 10.7%
Knee strain/sprain 177 10.5% 101 6.9% 278 8.8%
Hip/thigh/upper leg strain/sprain 51 3.0% 108 7.4% 159 5.1%
Hand/wrist fracture 70 4.2% 74 5.1% 144 4.6%
Shoulder other 90 5.4% 53 3.6% 143 4.5%
Knee other 49 2.9% 70 4.8% 119 3.8%
Shoulder strain/sprain 61 3.6% 45 3.1% 106 3.4%
Hand/wrist strain/sprain 34 2.0% 37 2.5% 71 2.3%
Hip/thigh/upper leg contusion 40 2.4% 30 2.0% 70 2.2%
†Totals and n’s are not always equal due to slight rounding or missing responses.
Figure 3.2 Time Loss of Football Injuries by Type of Exposure, High School Sports-Related
Injury Surveillance Study, US, 2012-13 School Year
*Other category is made up of medical disqualification for season, medical disqualification for career, athlete chooses not to continue, and season ended before athlete returned to play
8%
24%
15%22%
7%
24%
Competition n=1,679
1-2 days
3-6 days
7-9 days
10-21 days
>21 days
Other
17%
22%
15%
21%
9%
16%
Practice n=1,465
40
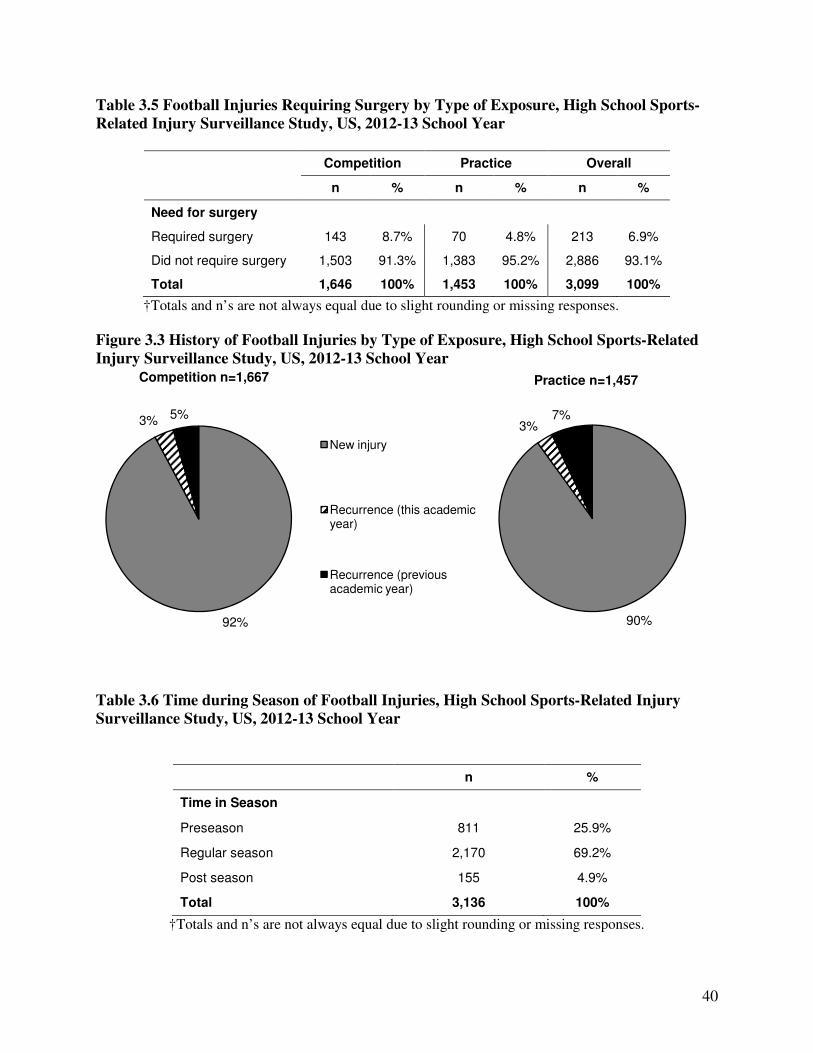
Table 3.5 Football Injuries Requiring Surgery by Type of Exposure, High School Sports-
Related Injury Surveillance Study, US, 2012-13 School Year
Competition Practice Overall
n % n % n %
Need for surgery
Required surgery 143 8.7% 70 4.8% 213 6.9%
Did not require surgery 1,503 91.3% 1,383 95.2% 2,886 93.1%
Total 1,646 100% 1,453 100% 3,099 100%
†Totals and n’s are not always equal due to slight rounding or missing responses.
Figure 3.3 History of Football Injuries by Type of Exposure, High School Sports-Related
Injury Surveillance Study, US, 2012-13 School Year
Table 3.6 Time during Season of Football Injuries, High School Sports-Related Injury
Surveillance Study, US, 2012-13 School Year
n %
Time in Season
Preseason 811 25.9%
Regular season 2,170 69.2%
Post season 155 4.9%
Total 3,136 100%
†Totals and n’s are not always equal due to slight rounding or missing responses.
92%
3%5%
Competition n=1,667
New injury
Recurrence (this academic year)
Recurrence (previous academic year)
90%
3%7%
Practice n=1,457
41
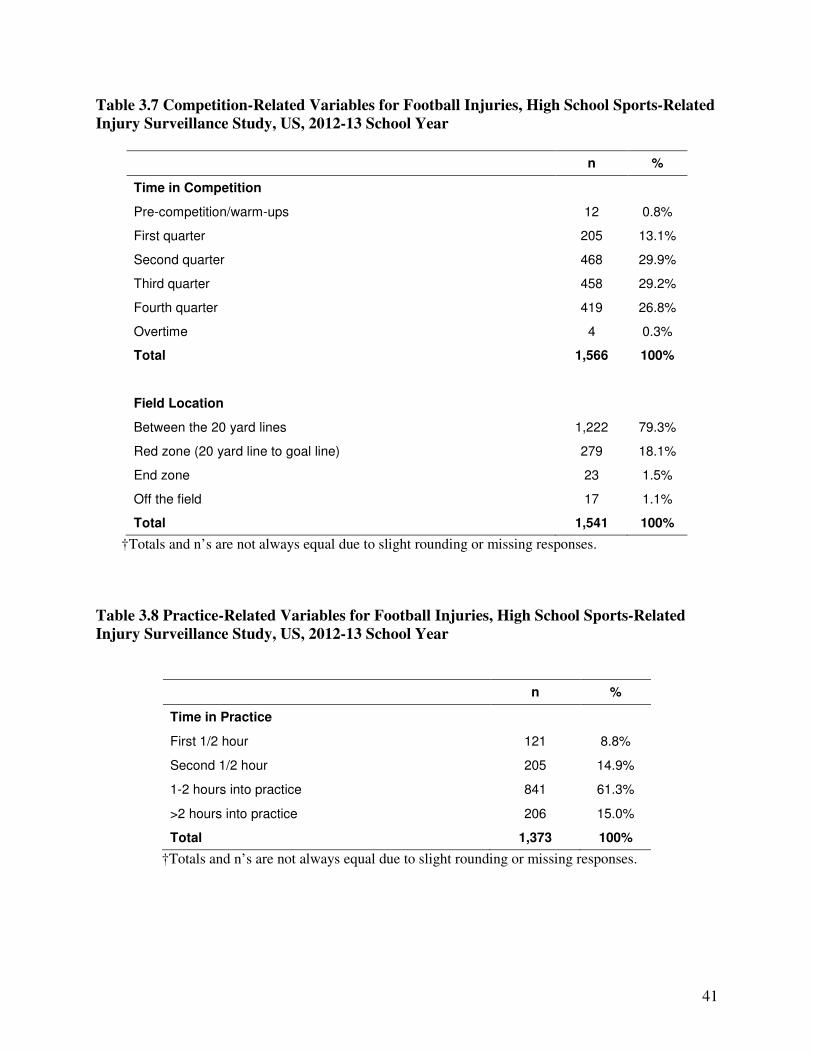
Table 3.7 Competition-Related Variables for Football Injuries, High School Sports-Related
Injury Surveillance Study, US, 2012-13 School Year
n %
Time in Competition
Pre-competition/warm-ups 12 0.8%
First quarter 205 13.1%
Second quarter 468 29.9%
Third quarter 458 29.2%
Fourth quarter 419 26.8%
Overtime 4 0.3%
Total 1,566 100%
Field Location
Between the 20 yard lines 1,222 79.3%
Red zone (20 yard line to goal line) 279 18.1%
End zone 23 1.5%
Off the field 17 1.1%
Total 1,541 100%
†Totals and n’s are not always equal due to slight rounding or missing responses.
Table 3.8 Practice-Related Variables for Football Injuries, High School Sports-Related
Injury Surveillance Study, US, 2012-13 School Year
n %
Time in Practice
First 1/2 hour 121 8.8%
Second 1/2 hour 205 14.9%
1-2 hours into practice 841 61.3%
>2 hours into practice 206 15.0%
Total 1,373 100%
†Totals and n’s are not always equal due to slight rounding or missing responses.

42
Figure 3.4 Player Position of Football Injuries by Type of Exposure, High School Sports-
Related Injury Surveillance Study, US, 2012-13 School Year
Table 3.9 Activities Leading to Football Injuries by Type of Exposure, High School Sports-
Related Injury Surveillance Study, US, 2012-13 School Year
Competition Practice Overall
n % n % n %
Activity
Being tackled 550 34.1% 298 21.1% 848 28.1%
Tackling 416 25.6% 261 18.5% 674 22.3%
Blocking 226 14.0% 245 17.4% 471 15.6%
Being blocked 167 10.4% 110 7.8% 277 9.2%
N/A (e.g., overuse, heat illness, etc.) 39 2.4% 190 13.5% 229 7.6%
Stepped on/fell on/kicked 98 6.1% 69 4.9% 167 5.5%
Rotation around a planted foot/inversion 46 2.9% 74 5.2% 120 4.0%
Uneven playing surface 8 .5% 25 1.8% 33 1.1%
Contact with ball 3 0.2% 21 1.5% 24 0.8%
Contact with blocking sled/dummy - 0.0% 14 1.0% 14 0.5%
Contact with goal posts/yard marker/etc. 2 0.1% 3 0.2% 5 0.2%
Other 59 3.7% 102 7.2% 161 5.3%
Total 1,611 100% 1,412 100% 3,023 100%
†Totals and n’s are not always equal due to slight rounding or missing responses.
20%
14%
8%
6%10%
42%
Competition n=1,584
RB/slotback
Linebacker
Defensive tackle/NG
Defensive end
Flanker/WR
Other
15%
14%
10%
6%13%
42%
Practice n=1,363

43
Figure 3.5 Activity Resulting in Football Injuries by Injury Diagnosis, High School Sports-
Related Injury Surveillance Study, US, 2012-13 School Year
0% 10% 20% 30% 40% 50% 60% 70% 80% 90% 100%
Other
Concussion
Fracture
Contusion
Strain/sprain
Being tackled Tackling Blocking Being blocked N/A(overuse, heat, etc) Other

44
IV. Boys’ Soccer Injury Epidemiology

45
Table 4.1 Boys’ Soccer Injury Rates by Type of Exposure, High School Sports-Related
Injury Surveillance Study, US, 2012-13 School Year
# Injuries # Exposures Injury rate
(per 1,000 athlete-exposures)
Total 416 291,519 1.43
Competition 270 87,862 3.07
Practice 146 203,657 0.72
Table 4.2 Demographic Characteristics of Injured Boys’ Soccer Athletes, High School
Sports-Related Injury Surveillance Study, US, 2012-13 School Year*
Year in School n=416
Freshman 20.1%
Sophomore 25.5%
Junior 22.1%
Senior 32.4%
Total† 100%
Age (years)
Minimum 12
Maximum 18
Mean (St. Dev.) 16.0 (1.31)
BMI
Minimum 10.0
Maximum 40.5
Mean (St. Dev.) 22.5 (2.88)
*All analyses in this report present data un-weighted †Throughout this report, totals and n’s represent the total un-weighted numbers of injury reports containing a valid response for the particular question. Due to a low level of non-response, these totals are always similar but are not always equal to the total number of injuries.

46
Figure 4.1 Diagnosis of Boys’ Soccer Injuries by Type of Exposure, High School Sports-
Related Injury Surveillance Study, US, 2012-13 School Year
Table 4.3 Body Site of Boys’ Soccer Injuries by Type of Exposure, High School Sports-
Related Injury Surveillance Study, US, 2012-13 School Year
Competition Practice Overall
n % n % n %
Body Site
Head/face 79 29.3% 19 13.0% 98 23.6%
Ankle 51 18.9% 22 15.1% 73 17.5%
Knee 36 13.3% 25 17.1% 61 14.7%
Hip/thigh/upper leg 25 9.3% 35 24.0% 60 14.4%
Lower leg 24 8.9% 10 6.8% 34 8.2%
Foot 20 7.4% 12 8.2% 32 7.7%
Hand/wrist 10 3.7% 6 4.1% 16 3.8%
Trunk 6 2.2% 8 5.5% 14 3.4%
Shoulder 6 2.2% 2 1.4% 8 1.9%
Arm/elbow 6 2.2% 1 0.7% 7 1.7%
Neck 1 0.4% 2 1.4% 3 0.7%
Other 6 2.2% 4 2.7% 10 2.4%
Total 270 100% 146 100% 416 100%
†Totals and n’s are not always equal due to slight rounding or missing responses.
36%
15%13%
24%
12%
Competition n=270
Strain/sprain
Contusion
Fracture
Concussion
Other
56%
8%
5%
9%
23%
Practice n=146

47
Table 4.4 Ten Most Common Boys’ Soccer Injury Diagnoses by Type of Exposure, High
School Sports-Related Injury Surveillance Study, US, 2012-13 School Year
Competition
n=270 Practice n=146
Total n=416
n % n % n %
Diagnosis
Head/face concussion 66 24.4% 13 8.9% 79 19.0%
Ankle strain/sprain 46 17.0% 21 14.4% 67 16.1%
Hip/thigh/upper leg strain/sprain 17 6.3% 29 19.9% 46 11.1%
Knee strain/sprain 15 5.6% 13 8.9% 28 6.7%
Knee other 10 3.7% 10 6.8% 20 4.8%
Head/face other 7 2.6% 5 3.4% 12 2.9%
Knee contusion 10 3.7% 2 1.4% 12 2.9%
Lower leg contusion 11 4.1% 1 0.7% 12 2.9%
Foot strain/sprain 7 2.6% 4 2.7% 11 2.6%
Foot contusion 5 1.9% 4 2.7% 9 2.2%
†Totals and n’s are not always equal due to slight rounding or missing responses.
Figure 4.2 Time Loss of Boys’ Soccer Injuries by Type of Exposure, High School Sports-
Related Injury Surveillance Study, US, 2012-13 School Year
*Other category is made up of medical disqualification for season, medical disqualification for career, athlete chooses not to continue, and season ended before athlete returned to play
11%
20%
20%22%
6%
21%
Competition n=270
1-2 days
3-6 days
7-9 days
10-21 days
>21 days
Other
16%
20%
24%
14%
8%
18%
Practice n=146

48
Table 4.5 Boys’ Soccer Injuries Requiring Surgery by Type of Exposure, High School
Sports-Related Injury Surveillance Study, US, 2012-13 School Year
Competition Practice Overall
n % n % n %
Need for surgery
Required surgery 22 8.3% 7 5.0% 29 7.2%
Did not require surgery 242 91.7% 134 95.0% 376 92.8%
Total 264 100% 141 100% 405 100%
†Totals and n’s are not always equal due to slight rounding or missing responses.
Figure 4.3 History of Boys’ Soccer Injuries by Type of Exposure, High School Sports-
Related Injury Surveillance Study, US, 2012-13 School Year
Table 4.6 Time during Season of Boys’ Soccer Injuries, High School Sports-Related Injury
Surveillance Study, US, 2012-13 School Year
n %
Time in Season
Preseason 86 20.9%
Regular season 309 75.0%
Post season 17 4.1%
Total 412 100%
†Totals and n’s are not always equal due to slight rounding or missing responses.
92%
2%6%
Competition n=267
New injury
Recurrence (this academic year)
Recurrence (previous academic year)
90%
3%7%
Practice n=145
49
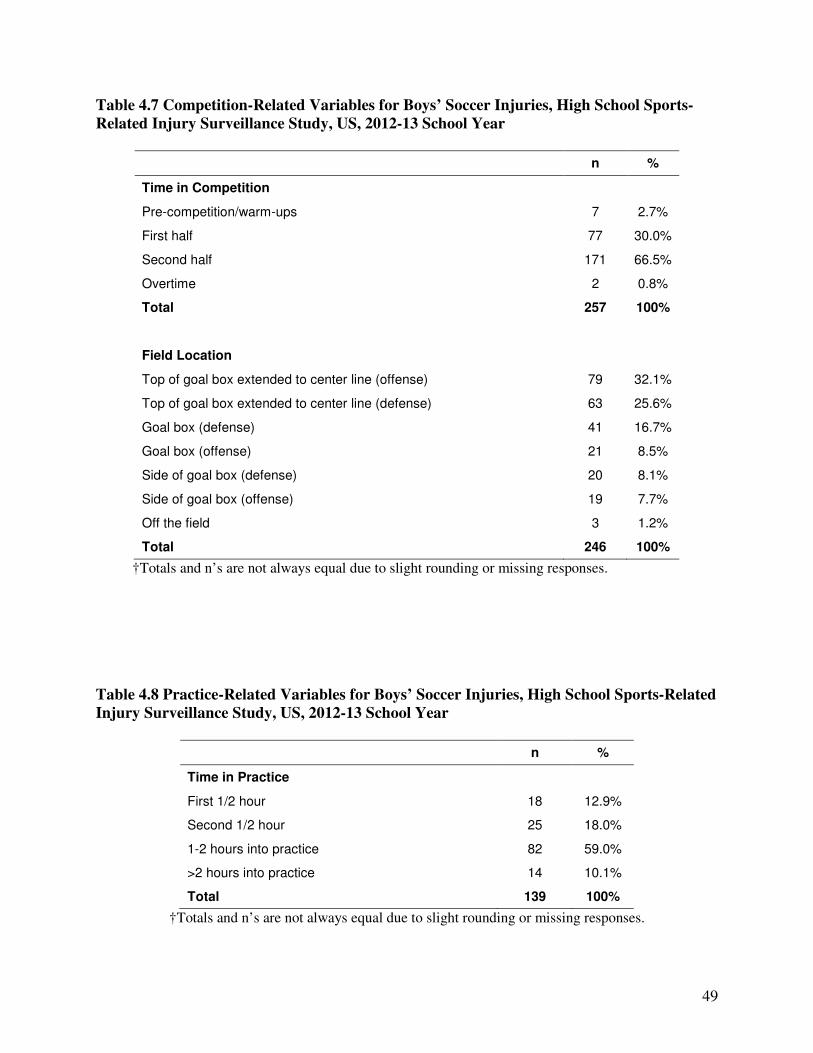
Table 4.7 Competition-Related Variables for Boys’ Soccer Injuries, High School Sports-
Related Injury Surveillance Study, US, 2012-13 School Year
n %
Time in Competition
Pre-competition/warm-ups 7 2.7%
First half 77 30.0%
Second half 171 66.5%
Overtime 2 0.8%
Total 257 100%
Field Location
Top of goal box extended to center line (offense) 79 32.1%
Top of goal box extended to center line (defense) 63 25.6%
Goal box (defense) 41 16.7%
Goal box (offense) 21 8.5%
Side of goal box (defense) 20 8.1%
Side of goal box (offense) 19 7.7%
Off the field 3 1.2%
Total 246 100%
†Totals and n’s are not always equal due to slight rounding or missing responses.
Table 4.8 Practice-Related Variables for Boys’ Soccer Injuries, High School Sports-Related
Injury Surveillance Study, US, 2012-13 School Year
n %
Time in Practice
First 1/2 hour 18 12.9%
Second 1/2 hour 25 18.0%
1-2 hours into practice 82 59.0%
>2 hours into practice 14 10.1%
Total 139 100%
†Totals and n’s are not always equal due to slight rounding or missing responses.

50
Figure 4.4 Player Position of Boys’ Soccer Injuries by Type of Exposure, High School
Sports-Related Injury Surveillance Study, US, 2012-13 School Year
Table 4.9 Activities Leading to Boys’ Soccer Injuries by Type of Exposure, High School
Sports-Related Injury Surveillance Study, US, 2012-13 School Year
Competition Practice Overall
n % n % n %
Activity
General play 53 20.1% 48 33.6% 101 24.8%
Defending 39 14.8% 8 5.6% 47 11.5%
Chasing loose ball 32 12.1% 11 7.7% 43 10.6%
Heading ball 30 11.4% 10 7.0% 40 9.8%
Ball handling/dribbling 29 11.0% 10 7.0% 39 9.6%
Goaltending 30 11.4% 8 5.6% 38 9.3%
Passing (foot) 19 7.2% 4 2.8% 23 5.7%
Conditioning - 0.0% 18 12.6% 18 4.4%
Receiving pass 12 4.5% 4 2.8% 16 3.9%
Shooting (foot) 7 2.7% 8 5.6% 15 3.7%
Receiving a slide tackle 5 1.9% 5 3.5% 10 2.5%
Blocking shot 3 1.1% 3 2.1% 6 1.5%
Attempting a slide tackle 3 1.1% - 0.0% 3 0.7%
Other 2 0.8% 6 4.2% 8 2.0%
Total 264 100% 143 100% 407 100%
†Totals and n’s are not always equal due to slight rounding or missing responses.
40%
24%
22%
13%
Competition n=259
Midfield
Forward
Defense
Goalkeeper
Other
45%
21%
20%
9%
5%
Practice=140
51
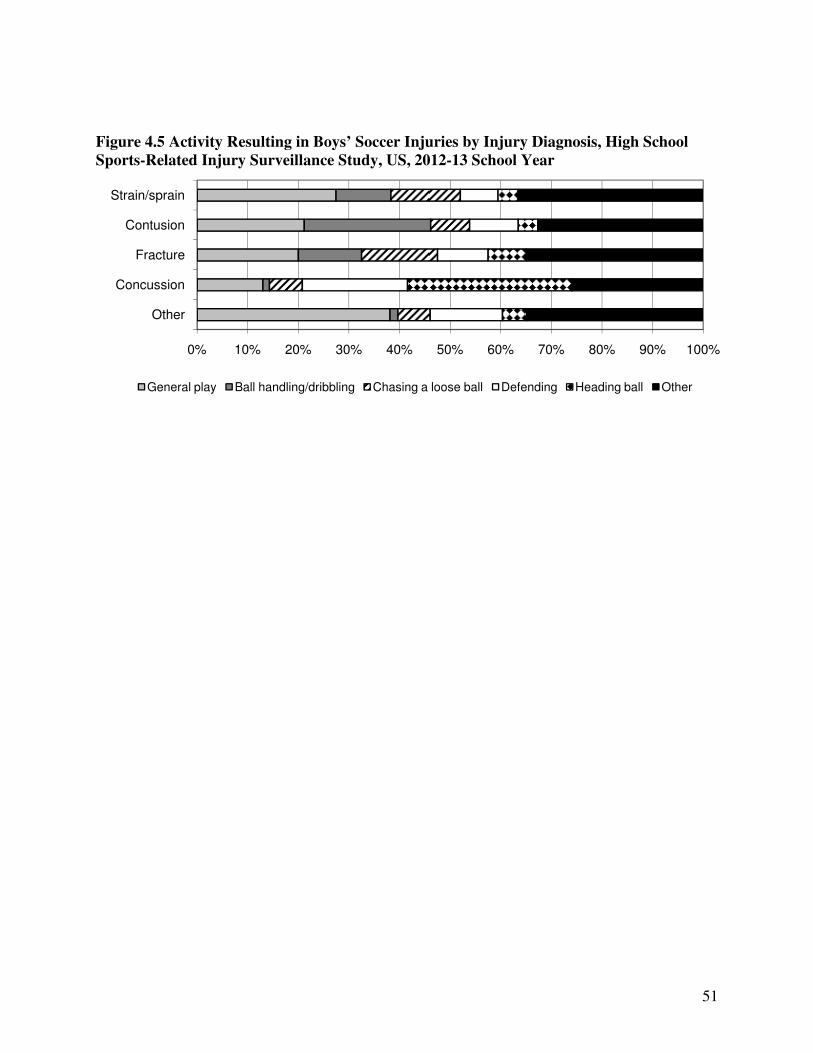
Figure 4.5 Activity Resulting in Boys’ Soccer Injuries by Injury Diagnosis, High School
Sports-Related Injury Surveillance Study, US, 2012-13 School Year
0% 10% 20% 30% 40% 50% 60% 70% 80% 90% 100%
Other
Concussion
Fracture
Contusion
Strain/sprain
General play Ball handling/dribbling Chasing a loose ball Defending Heading ball Other

52
V. Girls’ Soccer Injury Epidemiology
53
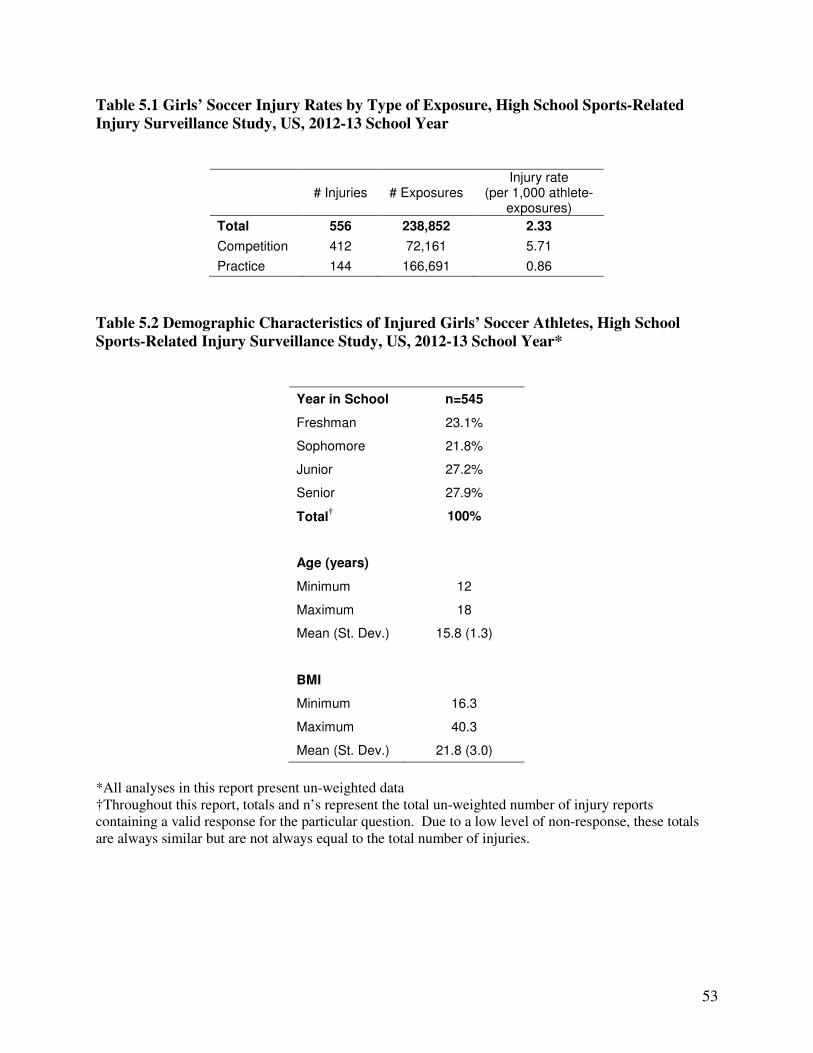
Table 5.1 Girls’ Soccer Injury Rates by Type of Exposure, High School Sports-Related
Injury Surveillance Study, US, 2012-13 School Year
# Injuries # Exposures Injury rate
(per 1,000 athlete-exposures)
Total 556 238,852 2.33
Competition 412 72,161 5.71
Practice 144 166,691 0.86
Table 5.2 Demographic Characteristics of Injured Girls’ Soccer Athletes, High School
Sports-Related Injury Surveillance Study, US, 2012-13 School Year*
Year in School n=545
Freshman 23.1%
Sophomore 21.8%
Junior 27.2%
Senior 27.9%
Total† 100%
Age (years)
Minimum 12
Maximum 18
Mean (St. Dev.) 15.8 (1.3)
BMI
Minimum 16.3
Maximum 40.3
Mean (St. Dev.) 21.8 (3.0)
*All analyses in this report present un-weighted data †Throughout this report, totals and n’s represent the total un-weighted number of injury reports containing a valid response for the particular question. Due to a low level of non-response, these totals are always similar but are not always equal to the total number of injuries.
54
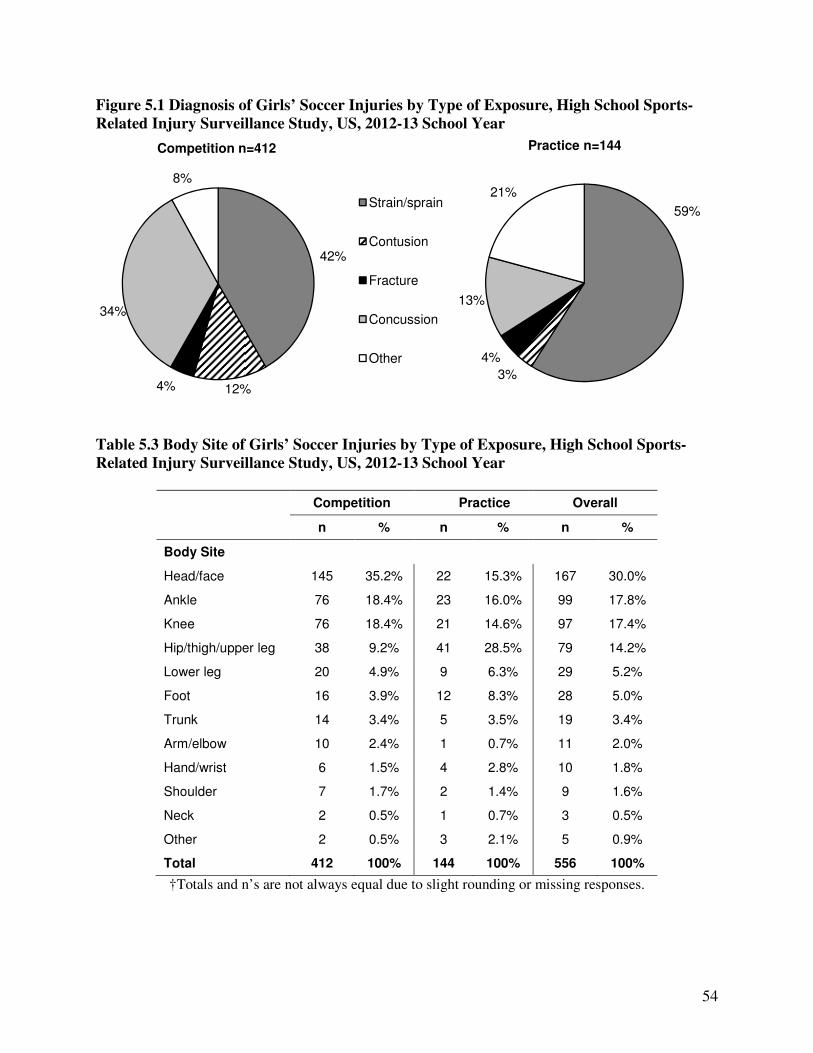
Figure 5.1 Diagnosis of Girls’ Soccer Injuries by Type of Exposure, High School Sports-
Related Injury Surveillance Study, US, 2012-13 School Year
Table 5.3 Body Site of Girls’ Soccer Injuries by Type of Exposure, High School Sports-
Related Injury Surveillance Study, US, 2012-13 School Year
Competition Practice Overall
n % n % n %
Body Site
Head/face 145 35.2% 22 15.3% 167 30.0%
Ankle 76 18.4% 23 16.0% 99 17.8%
Knee 76 18.4% 21 14.6% 97 17.4%
Hip/thigh/upper leg 38 9.2% 41 28.5% 79 14.2%
Lower leg 20 4.9% 9 6.3% 29 5.2%
Foot 16 3.9% 12 8.3% 28 5.0%
Trunk 14 3.4% 5 3.5% 19 3.4%
Arm/elbow 10 2.4% 1 0.7% 11 2.0%
Hand/wrist 6 1.5% 4 2.8% 10 1.8%
Shoulder 7 1.7% 2 1.4% 9 1.6%
Neck 2 0.5% 1 0.7% 3 0.5%
Other 2 0.5% 3 2.1% 5 0.9%
Total 412 100% 144 100% 556 100%
†Totals and n’s are not always equal due to slight rounding or missing responses.
42%
12%4%
34%
8%
Competition n=412
Strain/sprain
Contusion
Fracture
Concussion
Other
59%
3%
4%
13%
21%
Practice n=144
55
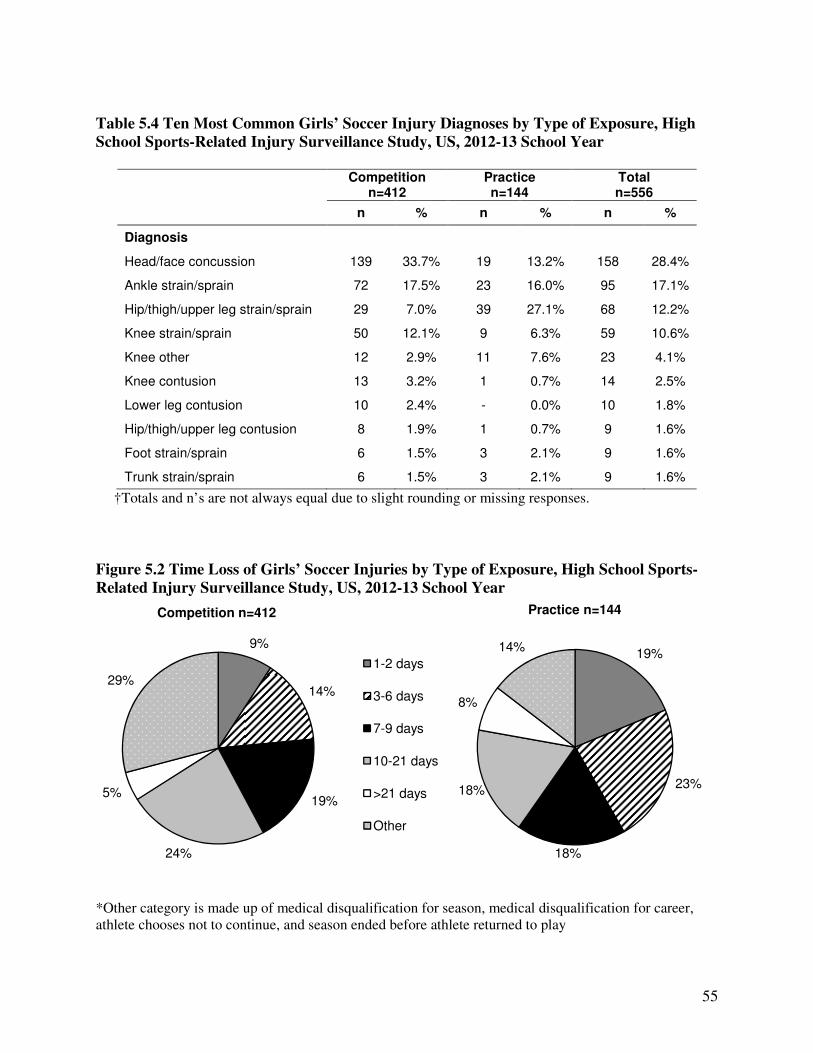
Table 5.4 Ten Most Common Girls’ Soccer Injury Diagnoses by Type of Exposure, High
School Sports-Related Injury Surveillance Study, US, 2012-13 School Year
Competition
n=412 Practice n=144
Total n=556
n % n % n %
Diagnosis
Head/face concussion 139 33.7% 19 13.2% 158 28.4%
Ankle strain/sprain 72 17.5% 23 16.0% 95 17.1%
Hip/thigh/upper leg strain/sprain 29 7.0% 39 27.1% 68 12.2%
Knee strain/sprain 50 12.1% 9 6.3% 59 10.6%
Knee other 12 2.9% 11 7.6% 23 4.1%
Knee contusion 13 3.2% 1 0.7% 14 2.5%
Lower leg contusion 10 2.4% - 0.0% 10 1.8%
Hip/thigh/upper leg contusion 8 1.9% 1 0.7% 9 1.6%
Foot strain/sprain 6 1.5% 3 2.1% 9 1.6%
Trunk strain/sprain 6 1.5% 3 2.1% 9 1.6%
†Totals and n’s are not always equal due to slight rounding or missing responses.
Figure 5.2 Time Loss of Girls’ Soccer Injuries by Type of Exposure, High School Sports-
Related Injury Surveillance Study, US, 2012-13 School Year
*Other category is made up of medical disqualification for season, medical disqualification for career, athlete chooses not to continue, and season ended before athlete returned to play
9%
14%
19%
24%
5%
29%
Competition n=412
1-2 days
3-6 days
7-9 days
10-21 days
>21 days
Other
19%
23%
18%
18%
8%
14%
Practice n=144

56
Table 5.5 Girls’ Soccer Injuries Requiring Surgery by Type of Exposure, High School
Sports-Related Injury Surveillance Study, US, 2012-13 School Year
Competition Practice Overall
n % n % n %
Need for surgery
Required surgery 34 8.4% 7 4.9% 41 7.5%
Did not require surgery 373 91.6% 135 95.1% 508 92.5%
Total 407 100% 142 100% 549 100%
†Totals and n’s are not always equal due to slight rounding or missing responses.
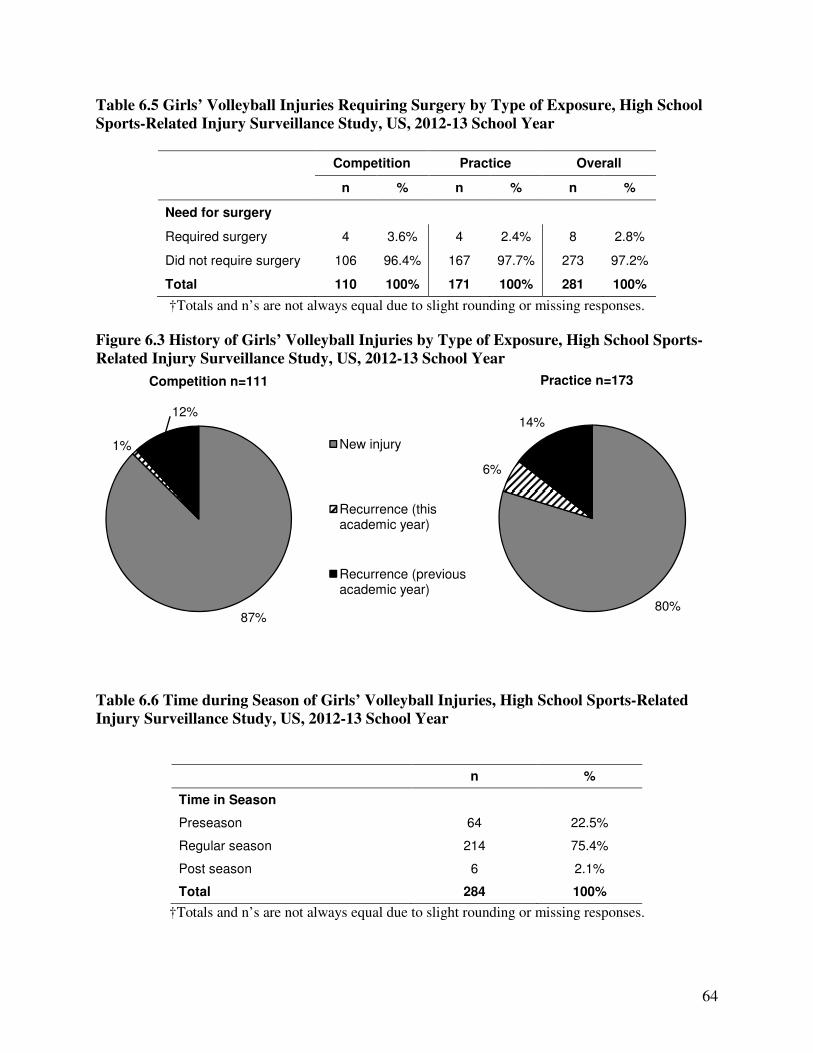
Figure 5.3 History of Girls’ Soccer Injuries by Type of Exposure, High School Sports-
Related Injury Surveillance Study, US, 2012-13 School Year
Table 5.6 Time during Season of Girls’ Soccer Injuries, High School Sports-Related Injury
Surveillance Study, US, 2012-13 School Year
n %
Time in Season
Preseason 100 18.0%
Regular season 426 76.8%
Post season 29 5.2%
Total 555 100%
†Totals and n’s are not always equal due to slight rounding or missing responses.
89%
3%8%
Competition n=411
New injury
Recurrence (this academic year)
Recurrence (previous academic year)
82%
4%
14%
Practice n=141

57
Table 5.7 Competition-Related Variables for Girls’ Soccer Injuries, High School Sports-
Related Injury Surveillance Study, US, 2012-13 School Year
n %
Time in Competition
Pre-competition/warm-ups 4 1.0%
First half 127 33.2%
Second half 250 65.4%
Overtime 1 0.3%
Total 382 100%
Field Location
Top of goal box extended to center line (offense) 137 35.8%
Top of goal box extended to center line (defense) 85 22.2%
Goal box (defense) 57 14.9%
Side of goal box (defense) 42 11.0%
Goal box (offense) 29 7.6%
Side of goal box (offense) 26 6.8%
Off the field 7 1.8%
Total 383 100%
†Totals and n’s are not always equal due to slight rounding or missing responses.
Table 5.8 Practice-Related Variables for Girls’ Soccer Injuries, High School Sports-Related
Injury Surveillance Study, US, 2012-13 School Year
n %
Time in Practice
First 1/2 hour 14 10.4%
Second 1/2 hour 37 27.4%
1-2 hours into practice 77 57.0%
>2 hours into practice 7 5.2%
Total 135 100%
†Totals and n’s are not always equal due to slight rounding or missing responses.

58
Figure 5.4 Player Position of Girls’ Soccer Injuries by Type of Exposure, High School
Sports-Related Injury Surveillance Study, US, 2012-13 School Year
Table 5.9 Activities Leading to Girls’ Soccer Injuries by Type of Exposure, High School
Sports-Related Injury Surveillance Study, US, 2012-13 School Year
Competition Practice Overall
n % n % n %
Activity
General play 85 21.5% 42 29.6% 127 23.6%
Defending 74 18.7% 10 7.0% 84 15.6%
Ball handling/dribbling 52 13.1% 11 7.7% 63 11.7%
Chasing loose ball 39 9.8% 13 9.2% 52 9.7%
Heading ball 35 8.8% 6 4.2% 41 7.6%
Goaltending 30 7.6% 5 3.5% 35 6.5%
Receiving pass 30 7.6% 4 2.8% 34 6.3%
Passing (foot) 19 4.8% 10 7.0% 29 5.4%
Shooting (foot) 12 3.0% 15 10.6% 27 5.0%
Conditioning - 0.0% 21 14.8% 21 3.9%
Blocking shot 8 2.0% 2 1.4% 10 1.9%
Attempting a slide tackle 4 1.0% 1 0.7% 5 0.9%
Receiving a slide tackle 3 0.8% - 0.0% 3 0.6%
Other 5 1.3% 2 1.4% 7 1.3%
Total 396 100% 142 100% 538 100%
†Totals and n’s are not always equal due to slight rounding or missing responses.
36%
32%
22%
9% 1%
Competition n=389
Midfield
Forward
Defense
Goalkeeper
Other
41%
32%
21%
6% 0%
Practice n=139
59
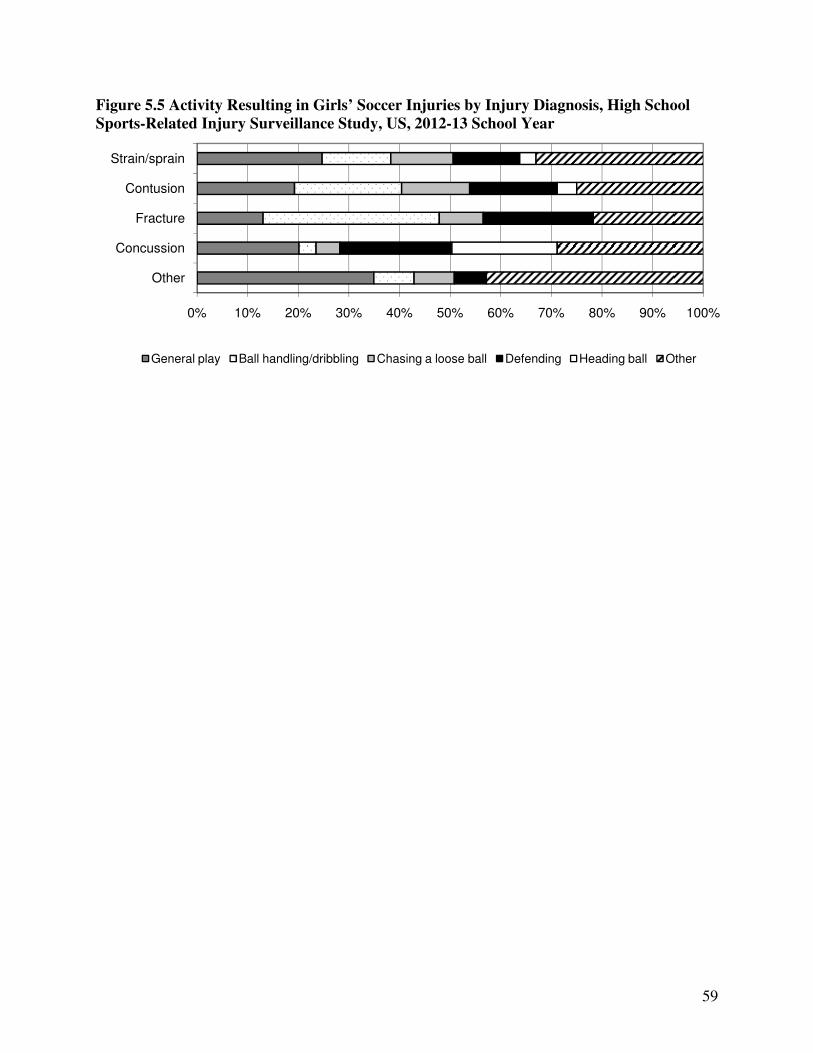
Figure 5.5 Activity Resulting in Girls’ Soccer Injuries by Injury Diagnosis, High School
Sports-Related Injury Surveillance Study, US, 2012-13 School Year
0% 10% 20% 30% 40% 50% 60% 70% 80% 90% 100%
Other
Concussion
Fracture
Contusion
Strain/sprain
General play Ball handling/dribbling Chasing a loose ball Defending Heading ball Other
60
VI. Girls’ Volleyball Injury Epidemiology

61
Table 6.1 Girls’ Volleyball Injury Rates by Type of Exposure, High School Sports-Related
Injury Surveillance Study, US, 2012-13 School Year
# Injuries # Exposures Injury rate
(per 1,000 athlete-exposures)
Total 284 279,165 1.02
Competition 111 94,448 1.18
Practice 173 184,717 0.94
Table 6.2 Demographic Characteristics of Injured Girls’ Volleyball Athletes, High School
Sports-Related Injury Surveillance Study, US, 2012-13 School Year*
Year in School n=276
Freshman 24.6%
Sophomore 28.3%
Junior 24.6%
Senior 22.5%
Total† 100%
Age (years)
Minimum 13
Maximum 18
Mean (St. Dev.) 15.6 (1.2)
BMI
Minimum 16.2
Maximum 42.4
Mean (St. Dev.) 22.1 (3.2)
*All analyses in this report present un-weighted data. †Throughout this report, totals and n’s represent the total un-weighted number of injury reports containing a valid response for the particular question. Due to a low level of non-response, these totals are always similar but are not always equal to the total number of injuries.

62
Figure 6.1 Diagnosis of Girls’ Volleyball Injuries by Type of Exposure, High School Sports-
Related Injury Surveillance Study, US, 2012-13 School Year
Table 6.3 Body Site of Girls’ Volleyball Injuries by Type of Exposure, High School Sports-
Related Injury Surveillance Study, US, 2012-13 School Year
Competition Practice Overall
n % n % n %
Body Site
Ankle 45 40.5% 71 41.0% 116 40.8%
Head/face 27 24.3% 24 13.9% 51 18.0%
Knee 10 9.0% 18 10.4% 28 9.9%
Hand/wrist 15 13.5% 9 5.2% 24 8.5%
Shoulder 4 3.6% 10 5.8% 14 4.9%
Foot 4 3.6% 10 5.8% 14 4.9%
Trunk 4 3.6% 9 5.2% 13 4.6%
Lower leg - 0.0% 10 5.8% 10 3.5%
Hip/thigh/upper leg 1 0.9% 6 3.5% 7 2.5%
Arm/elbow 1 0.9% 2 1.2% 3 1.1%
Other - 0.0% 4 2.3% 4 1.4%
Total 111 100% 173 100% 284 100%
†Totals and n’s are not always equal due to slight rounding or missing responses.
60%2%
6%
23%
9%
Competition n=111
Strain/sprain
Contusion
Fracture
Concussion
Other
61%
2%
4%
14%
19%
Practice n=173

63
Table 6.4 Ten Most Common Girls’ Volleyball Injury Diagnoses by Type of Exposure,
High School Sports-Related Injury Surveillance Study, US, 2012-13 School Year
Competition
n=111 Practice
n=173 Total n=284
n % n % n %
Diagnosis
Ankle strain/sprain 44 39.6% 68 39.3% 112 39.4%
Head/face concussion 26 23.4% 24 13.9% 50 17.6%
Hand/wrist strain/sprain 9 8.1% 6 3.5% 15 5.3%
Knee strain/sprain 6 5.4% 9 5.2% 15 5.3%
Knee other 4 3.6% 7 4.0% 11 3.9%
Shoulder other 3 2.7% 6 3.5% 9 3.2%
Trunk strain/sprain 3 2.7% 4 2.3% 7 2.5%
Lower leg strain/sprain - 0.0% 7 4.0% 7 2.5%
Hand/wrist fracture 5 4.5% 2 1.2% 7 2.5%
Foot strain/sprain 2 1.8% 3 1.7% 5 1.8%
Figure 6.2 Time Loss of Girls’ Volleyball Injuries by Type of Exposure, High School
Sports-Related Injury Surveillance Study, US, 2012-13 School Year
*Other category is made up of medical disqualification for season, medical disqualification for career, athlete chooses not to continue, and season ended before athlete returned to play
13%
23%
21%
26%
4%
13%
Competition n=111
1-2 days
3-6 days
7-9 days
10-21 days
> 21 days
Other
18%
28%
17%
20%
7%
10%
Practice n=173
64
Table 6.5 Girls’ Volleyball Injuries Requiring Surgery by Type of Exposure, High School
Sports-Related Injury Surveillance Study, US, 2012-13 School Year
Competition Practice Overall
n % n % n %
Need for surgery
Required surgery 4 3.6% 4 2.4% 8 2.8%
Did not require surgery 106 96.4% 167 97.7% 273 97.2%
Total 110 100% 171 100% 281 100%
†Totals and n’s are not always equal due to slight rounding or missing responses.
Figure 6.3 History of Girls’ Volleyball Injuries by Type of Exposure, High School Sports-
Related Injury Surveillance Study, US, 2012-13 School Year
Table 6.6 Time during Season of Girls’ Volleyball Injuries, High School Sports-Related
Injury Surveillance Study, US, 2012-13 School Year
n %
Time in Season
Preseason 64 22.5%
Regular season 214 75.4%
Post season 6 2.1%
Total 284 100%
†Totals and n’s are not always equal due to slight rounding or missing responses.
87%
12%
Competition n=111
New injury
Recurrence (this academic year)
Recurrence (previous academic year)
80%
6%
14%
Practice n=173
1%

65
Table 6.7 Competition-Related Variables for Girls’ Volleyball Injuries, High School
Sports-Related Injury Surveillance Study, US, 2012-13 School Year
n %
Time in Competition
Pre-competition/warm-ups 19 18.3%
First set 15 14.4%
Second set 38 36.5%
Third set 27 26.0%
Fourth set 5 4.8%
Total 104 100%
Court Location
Middle forward 28 27.5%
Right forward 20 19.6%
Left forward 18 17.6%
Left back 17 16.7%
At the net 9 8.8%
Outside the playable area 6 5.9%
Outside court (your side) 2 2.0%
Outside court (opponent’s side) 1 1.0%
Right back (server) 1 1.0%
Total 102 100%
†Totals and n’s are not always equal due to slight rounding or missing responses.
Table 6.8 Practice-Related Variables for Girls’ Volleyball Injuries, High School Sports-
Related Injury Surveillance Study, US, 2012-13 School Year
n %
Time in Practice
First 1/2 hour 25 15.2%
Second 1/2 hour 33 20.0%
1-2 hours into practice 91 55.2%
>2 hours into practice 16 9.7%
Total 165 100%
†Totals and n’s are not always equal due to slight rounding or missing responses.

66
Figure 6.4 Player Position of Girls’ Volleyball Injuries by Type of Exposure, High School
Sports-Related Injury Surveillance Study, US, 2012-13 School Year
Table 6.9 Activities Leading to Girls’ Volleyball Injuries by Type of Exposure, High School
Sports-Related Injury Surveillance Study, US, 2012-13 School Year
Competition Practice Overall
n % n % n %
Activity
Blocking 38 34.9% 50 30.1% 88 32.0%
General play 16 14.7% 48 28.9% 64 23.3%
Digging 23 21.1% 25 15.1% 48 17.5%
Spiking 9 8.3% 14 8.4% 23 8.4%
Setting 5 4.6% 5 3.0% 10 3.6%
Passing 3 2.8% 6 3.6% 9 3.3%
Serving 2 1.8% 6 3.6% 8 2.9%
Conditioning - 0.0% 8 4.8% 8 2.9%
Other 13 11.9% 4 2.4% 17 6.2%
Total 109 100% 166 100% 275 100%
†Totals and n’s are not always equal due to slight rounding or missing responses.
29%
32%
13%
10%
8%
8%
Competition n=107
Outside hitter
Middle blocker
Setter
Libero
Opposite/diagonal player
Other
41%
25%
11%
9%
12%2%
Practice n=160
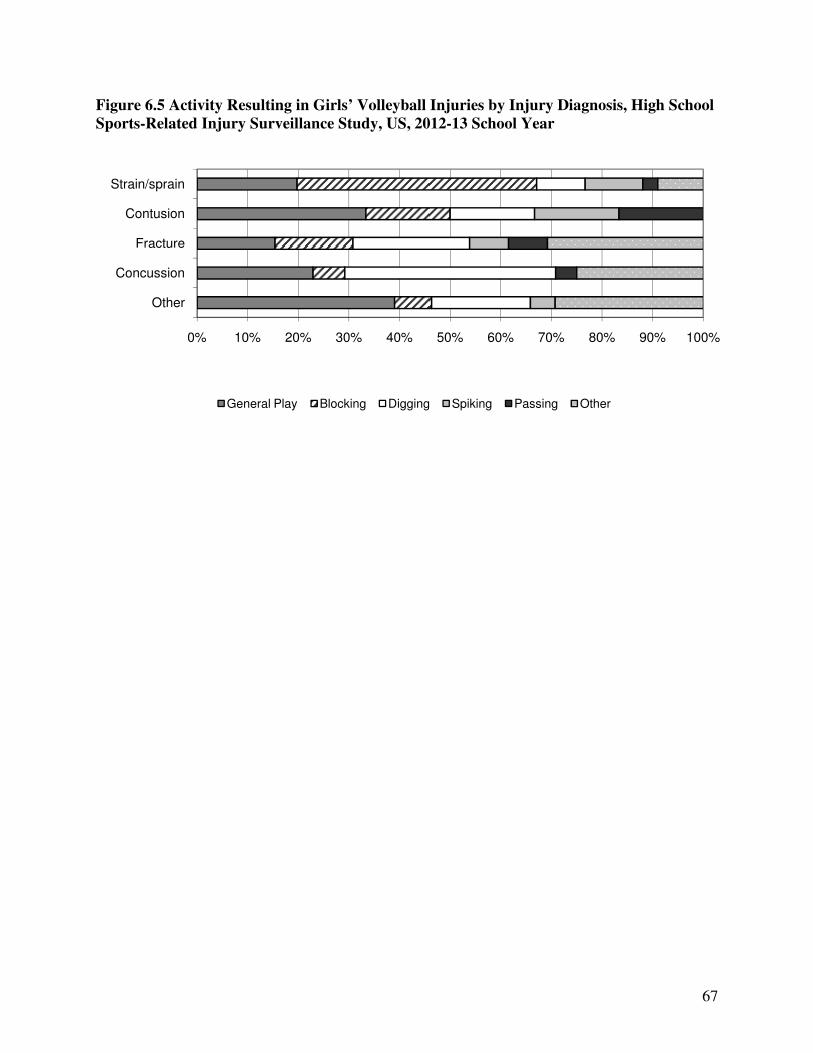
67
Figure 6.5 Activity Resulting in Girls’ Volleyball Injuries by Injury Diagnosis, High School
Sports-Related Injury Surveillance Study, US, 2012-13 School Year
0% 10% 20% 30% 40% 50% 60% 70% 80% 90% 100%
Other
Concussion
Fracture
Contusion
Strain/sprain
General Play Blocking Digging Spiking Passing Other
68
VII. Boys’ Basketball Injury Epidemiology

69
Table 7.1 Boys’ Basketball Injury Rates by Type of Exposure, High School Sports-Related
Injury Surveillance Study, US, 2012-13 School Year
# Injuries # Exposures Injury rate
(per 1,000 athlete-exposures)
Total 568 376,827 1.51
Competition 300 114,787 2.61
Practice 268 262,040 1.02
Table 7.2 Demographic Characteristics of Injured Boys’ Basketball Athletes, High School
Sports-Related Injury Surveillance Study, US, 2012-13 School Year*
Year in School n=559
Freshman 24.0%
Sophomore 25.4%
Junior 26.7%
Senior 24.0%
Total† 100%
Age (years)
Minimum 13
Maximum 19
Mean (St. Dev.) 15.9 (1.3)
BMI
Minimum 15.8
Maximum 42.6
Mean (St. Dev.) 23.0 (3.4)
*All analyses in this report present un-weighted data. †Throughout this report, totals and n’s represent the total un-weighted number of injury reports containing a valid response for the particular question. Due to a low level of non-response, these totals are always similar but are not always equal to the total number of injuries.
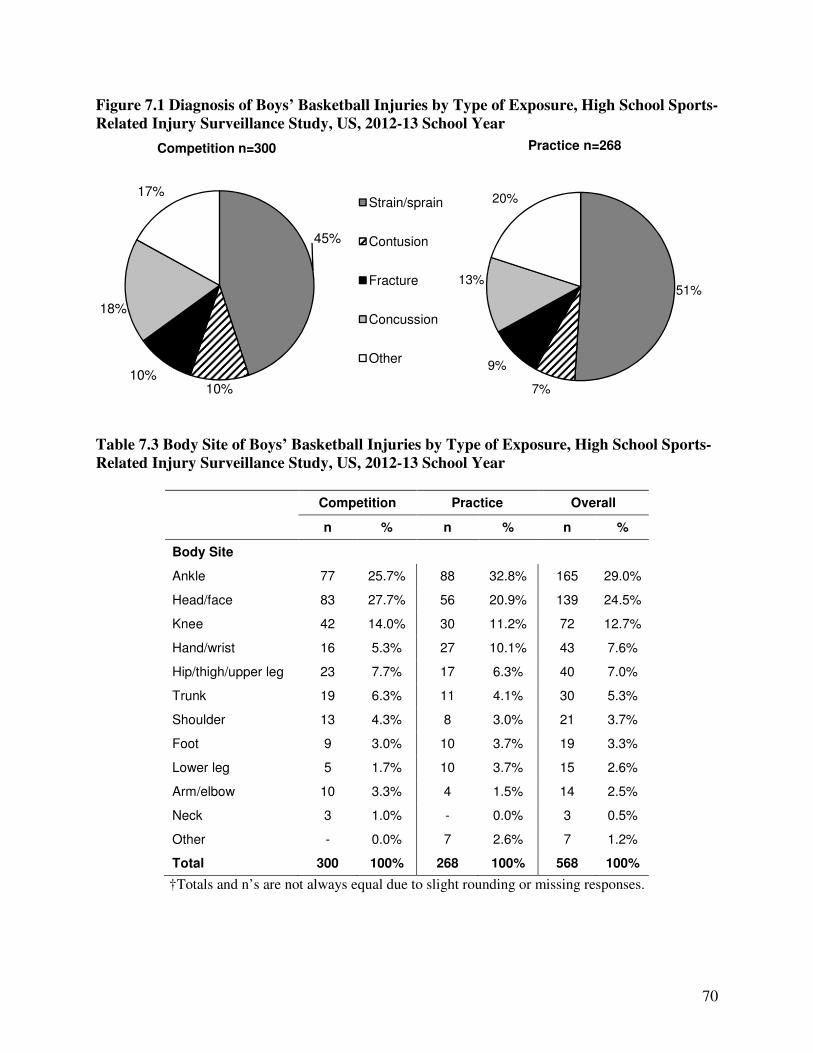
70
Figure 7.1 Diagnosis of Boys’ Basketball Injuries by Type of Exposure, High School Sports-
Related Injury Surveillance Study, US, 2012-13 School Year
Table 7.3 Body Site of Boys’ Basketball Injuries by Type of Exposure, High School Sports-
Related Injury Surveillance Study, US, 2012-13 School Year
Competition Practice Overall
n % n % n %
Body Site
Ankle 77 25.7% 88 32.8% 165 29.0%
Head/face 83 27.7% 56 20.9% 139 24.5%
Knee 42 14.0% 30 11.2% 72 12.7%
Hand/wrist 16 5.3% 27 10.1% 43 7.6%
Hip/thigh/upper leg 23 7.7% 17 6.3% 40 7.0%
Trunk 19 6.3% 11 4.1% 30 5.3%
Shoulder 13 4.3% 8 3.0% 21 3.7%
Foot 9 3.0% 10 3.7% 19 3.3%
Lower leg 5 1.7% 10 3.7% 15 2.6%
Arm/elbow 10 3.3% 4 1.5% 14 2.5%
Neck 3 1.0% - 0.0% 3 0.5%
Other - 0.0% 7 2.6% 7 1.2%
Total 300 100% 268 100% 568 100%
†Totals and n’s are not always equal due to slight rounding or missing responses.
45%
10%10%
18%
17%
Competition n=300
Strain/sprain
Contusion
Fracture
Concussion
Other
51%
7%
9%
13%
20%
Practice n=268
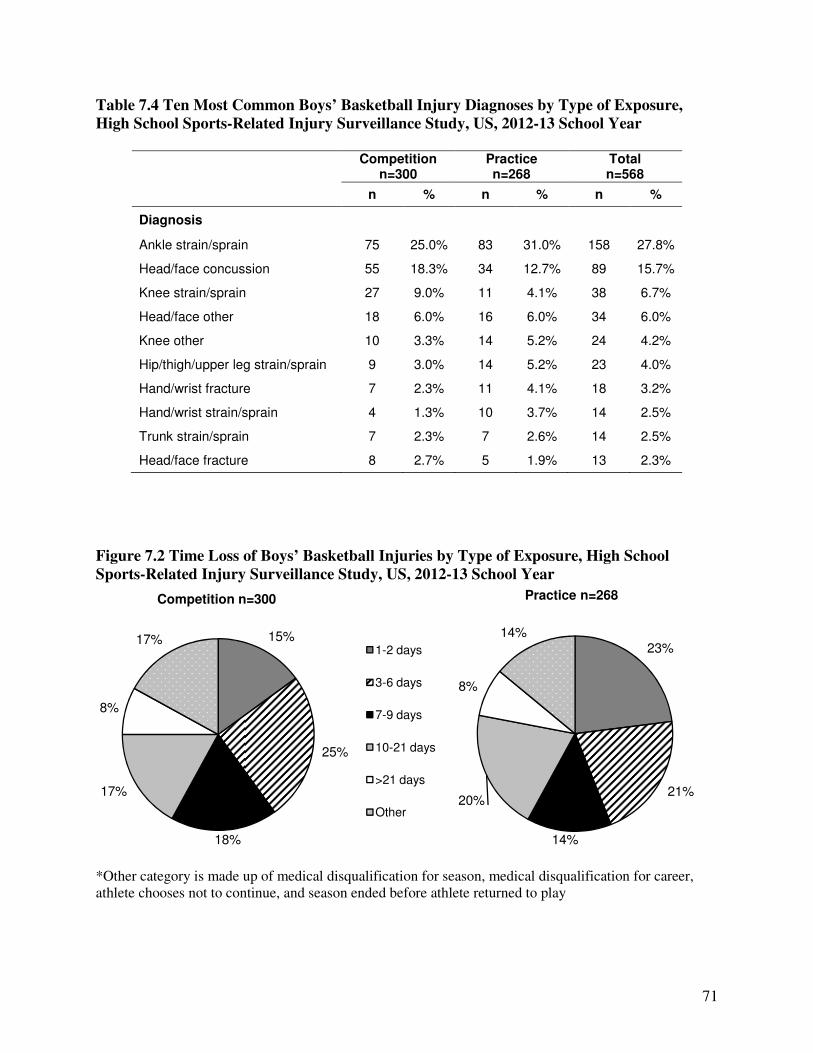
71
Table 7.4 Ten Most Common Boys’ Basketball Injury Diagnoses by Type of Exposure,
High School Sports-Related Injury Surveillance Study, US, 2012-13 School Year
Competition
n=300 Practice n=268
Total n=568
n % n % n %
Diagnosis
Ankle strain/sprain 75 25.0% 83 31.0% 158 27.8%
Head/face concussion 55 18.3% 34 12.7% 89 15.7%
Knee strain/sprain 27 9.0% 11 4.1% 38 6.7%
Head/face other 18 6.0% 16 6.0% 34 6.0%
Knee other 10 3.3% 14 5.2% 24 4.2%
Hip/thigh/upper leg strain/sprain 9 3.0% 14 5.2% 23 4.0%
Hand/wrist fracture 7 2.3% 11 4.1% 18 3.2%
Hand/wrist strain/sprain 4 1.3% 10 3.7% 14 2.5%
Trunk strain/sprain 7 2.3% 7 2.6% 14 2.5%
Head/face fracture 8 2.7% 5 1.9% 13 2.3%
Figure 7.2 Time Loss of Boys’ Basketball Injuries by Type of Exposure, High School
Sports-Related Injury Surveillance Study, US, 2012-13 School Year
*Other category is made up of medical disqualification for season, medical disqualification for career, athlete chooses not to continue, and season ended before athlete returned to play
15%
25%
18%
17%
8%
17%
Competition n=300
1-2 days
3-6 days
7-9 days
10-21 days
>21 days
Other
23%
21%
14%
20%
8%
14%
Practice n=268

72
Table 7.5 Boys’ Basketball Injuries Requiring Surgery by Type of Exposure, High School
Sports-Related Injury Surveillance Study, US, 2012-13 School Year
Competition Practice Overall
n % n % n %
Need for surgery
Required surgery 29 9.8% 17 6.5% 46 8.3%
Did not require surgery 267 90.2% 243 93.5% 510 91.7%
Total 296 100% 260 100% 556 100%
†Totals and n’s are not always equal due to slight rounding or missing responses.
Figure 7.3 History of Boys’ Basketball Injuries by Type of Exposure, High School Sports-
Related Injury Surveillance Study, US, 2012-13 School Year
Table 7.6 Time during Season of Boys’ Basketball Injuries, High School Sports-Related
Injury Surveillance Study, US, 2012-13 School Year
n %
Time in Season
Preseason 96 17.0%
Regular season 448 79.4%
Post season 20 3.5%
Total 564 100%
†Totals and n’s are not always equal due to slight rounding or missing responses.
88%
6%6%
Competition n=298
New injury
Recurrence (this academic year)
Recurrence (previous academic year)
87%
4%
9%
Practice n=266

73
Table 7.7 Competition-Related Variables for Boys’ Basketball Injuries, High School
Sports-Related Injury Surveillance Study, US, 2012-13 School Year
n %
Time in Competition
Pre-competition-warm-ups 10 3.5%
First quarter 27 9.4%
Second quarter 79 27.4%
Third quarter 98 34.0%
Fourth quarter 74 25.7%
Total 288 100%
Court Location
Inside lane (offense) 81 28.7%
Inside lane (defense) 75 26.6%
Between 3 pt arc and lane (offense) 33 11.7%
Between 3 pt arc and lane (defense) 29 10.3%
Outside 3 point arc - offense 24 8.5%
Outside 3 point arc - defense 19 6.7%
Backcourt 12 4.3%
Out of bounds 8 2.8%
Off the court 1 0.4%
Total 282 100%
†Totals and n’s are not always equal due to slight rounding or missing responses.
Table 7.8 Practice-Related Variables for Boys’ Basketball Injuries, High School Sports-
Related Injury Surveillance Study, US, 2012-13 School Year
n %
Time in Practice
First 1/2 hour 27 10.8%
Second 1/2 hour 59 23.7%
1-2 hours into practice 145 58.2%
>2 hours into practice 18 7.2%
Total 249 100%
†Totals and n’s are not always equal due to slight rounding or missing responses.

74
Figure 7.4 Player Position of Boys’ Basketball Injuries by Type of Exposure, High School
Sports-Related Injury Surveillance Study, US, 2012-13 School Year
Table 7.9 Activities Leading to Boys’ Basketball Injuries by Type of Exposure, High School
Sports-Related Injury Surveillance Study, US, 2012-13 School Year
Competition Practice Overall
n % n % n %
Activity
Rebounding 67 22.9% 59 23.0% 126 22.9%
Defending 77 26.3% 37 14.4% 114 20.7%
General play 40 13.7% 69 26.8% 109 19.8%
Shooting 44 15.0% 24 9.3% 68 12.4%
Chasing loose ball 34 11.6% 19 7.4% 53 9.6%
Ball handling/dribbling 18 6.1% 7 2.7% 25 4.5%
Receiving pass 6 2.0% 17 6.6% 23 4.2%
Conditioning 0 0.0% 13 5.1% 13 2.4%
Passing 0 0.0% 3 1.2% 3 0.5%
Other 7 2.4% 9 3.5% 16 2.9%
Total 293 100% 257 100% 550 100%
†Totals and n’s are not always equal due to slight rounding or missing responses.
48%
38%
14%
Competition n=290
Guard
Forward
Center
39%
44%
17%
Practice n=254

75
Figure 7.5 Activity Resulting in Boys’ Basketball Injuries by Injury Diagnosis, High School
Sports-Related Injury Surveillance Study, US, 2012-13 School Year
0% 10% 20% 30% 40% 50% 60% 70% 80% 90% 100%
Other
Concussion
Fracture
Contusion
Strain/sprain
Rebounding General play Defending Shooting Chasing loose ball Other

76
VIII. Girls’ Basketball Injury Epidemiology

77
Table 8.1 Girls’ Basketball Injury Rates by Type of Exposure, High School Sports-Related
Injury Surveillance Study, US, 2012-13 School Year
# Injuries # Exposures Injury rate
(per 1,000 athlete-exposures)
Total 581 298,208 1.95
Competition 326 94,049 3.47
Practice 255 204,159 1.25
Table 8.2 Demographic Characteristics of Injured Girls’ Basketball Athletes, High School
Sports-Related Injury Surveillance Study, US, 2012-13 School Year*
Year in School n=571
Freshman 32.4%
Sophomore 29.8%
Junior 17.2%
Senior 20.7%
Total† 100%
Age (years)
Minimum 13
Maximum 18
Mean (St. Dev.) 15.5 (1.2)
BMI
Minimum 15.5
Maximum 38.8
Mean (St. Dev.) 22.2 (3.2)
*All analyses in this report present un-weighted data. †Throughout this report, totals and n’s represent the total un-weighted number of injury reports containing a valid response for the particular question. Due to a low level of non-response, these totals are always similar but are not always equal to the total number of injuries.

78
Figure 8.1 Diagnosis of Girls’ Basketball Injuries by Type of Exposure, High School
Sports-Related Injury Surveillance Study, US, 2012-13 School Year
Table 8.3 Body Site of Girls’ Basketball Injuries by Type of Exposure, High School Sports-
Related Injury Surveillance Study, US, 2012-13 School Year
Competition Practice Overall
n % n % n %
Body Site
Ankle 83 25.5% 82 32.2% 165 28.4%
Head/face 106 32.6% 37 14.5% 143 24.7%
Knee 69 21.2% 37 14.5% 106 18.3%
Hand/wrist 21 6.5% 17 6.7% 38 6.6%
Hip/thigh/upper leg 10 3.1% 20 7.8% 30 5.2%
Trunk 8 2.5% 17 6.7% 25 4.3%
Foot 9 2.8% 12 4.7% 21 3.6%
Shoulder 6 1.8% 13 5.1% 19 3.3%
Lower leg 6 1.8% 12 4.7% 18 3.1%
Arm/elbow 6 1.8% 4 1.6% 10 1.7%
Neck 1 0.3% 2 0.8% 3 0.5%
Other - 0.0% 2 0.8% 2 0.3%
Total 325 100% 255 100% 580 100%
†Totals and n’s are not always equal due to slight rounding or missing responses.
46%
6%8%
28%
12%
Competition n=325
Strain/sprain
Contusion
Fracture
Concussion
Other
55%
6%
5%
12%
22%
Practice n=253
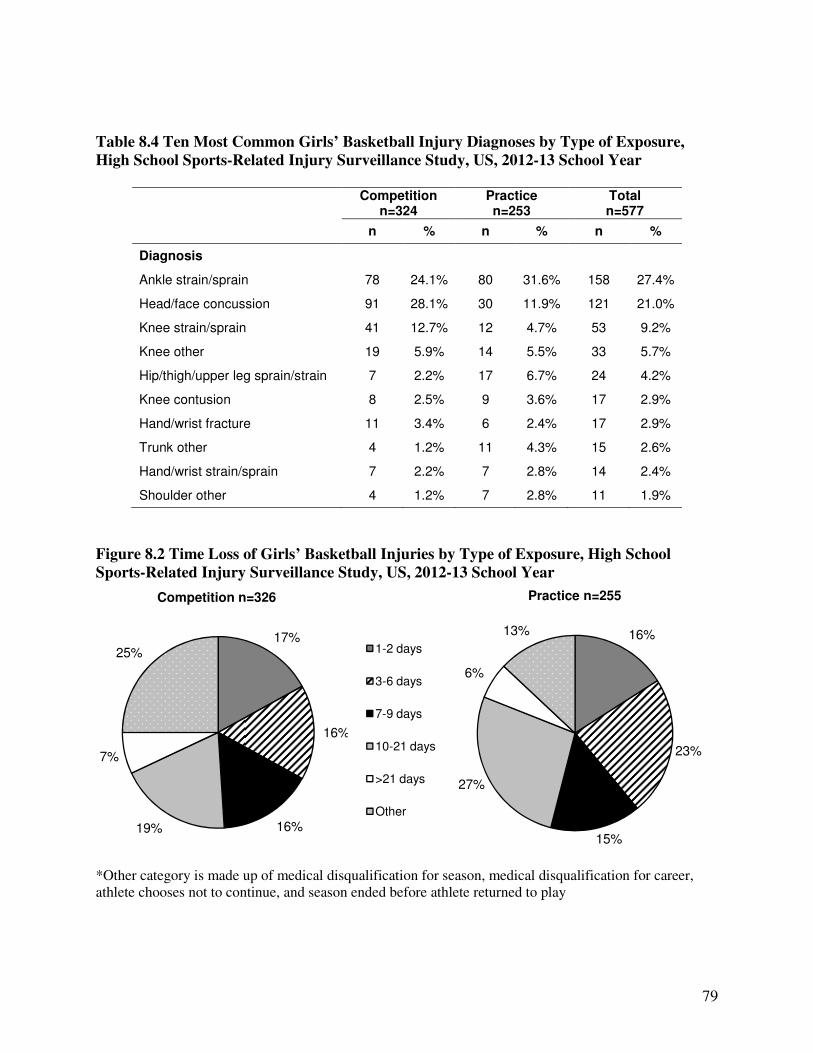
79
Table 8.4 Ten Most Common Girls’ Basketball Injury Diagnoses by Type of Exposure,
High School Sports-Related Injury Surveillance Study, US, 2012-13 School Year
Competition
n=324 Practice n=253
Total n=577
n % n % n %
Diagnosis
Ankle strain/sprain 78 24.1% 80 31.6% 158 27.4%
Head/face concussion 91 28.1% 30 11.9% 121 21.0%
Knee strain/sprain 41 12.7% 12 4.7% 53 9.2%
Knee other 19 5.9% 14 5.5% 33 5.7%
Hip/thigh/upper leg sprain/strain 7 2.2% 17 6.7% 24 4.2%
Knee contusion 8 2.5% 9 3.6% 17 2.9%
Hand/wrist fracture 11 3.4% 6 2.4% 17 2.9%
Trunk other 4 1.2% 11 4.3% 15 2.6%
Hand/wrist strain/sprain 7 2.2% 7 2.8% 14 2.4%
Shoulder other 4 1.2% 7 2.8% 11 1.9%
Figure 8.2 Time Loss of Girls’ Basketball Injuries by Type of Exposure, High School
Sports-Related Injury Surveillance Study, US, 2012-13 School Year
*Other category is made up of medical disqualification for season, medical disqualification for career, athlete chooses not to continue, and season ended before athlete returned to play
17%
16%
16%19%
7%
25%
Competition n=326
1-2 days
3-6 days
7-9 days
10-21 days
>21 days
Other
16%
23%
15%
27%
6%
13%
Practice n=255

80
Table 8.5 Girls’ Basketball Injuries Requiring Surgery by Type of Exposure, High School
Sports-Related Injury Surveillance Study, US, 2012-13 School Year
Competition Practice Overall
n % n % n %
Need for surgery
Required surgery 35 10.9% 18 7.1% 53 9.2%
Did not require surgery 286 89.1% 235 92.9% 521 90.8%
Total 321 100% 253 100% 574 100%
†Totals and n’s are not always equal due to slight rounding or missing responses.
Figure 8.3 History of Girls’ Basketball Injuries by Type of Exposure, High School Sports-
Related Injury Surveillance Study, US, 2012-13 School Year
Table 8.6 Time during Season of Girls’ Basketball Injuries, High School Sports-Related
Injury Surveillance Study, US, 2012-13 School Year
n %
Time in Season
Preseason 105 18.1%
Regular season 470 80.9%
Post season 6 1.0%
Total 581 100%
†Totals and n’s are not always equal due to slight rounding or missing responses.
88%
4%
8%
Competition n=326
New injury
Recurrence (this academic year)
Recurrence (previous academic year)
81%
8%
11%
Practice n=255
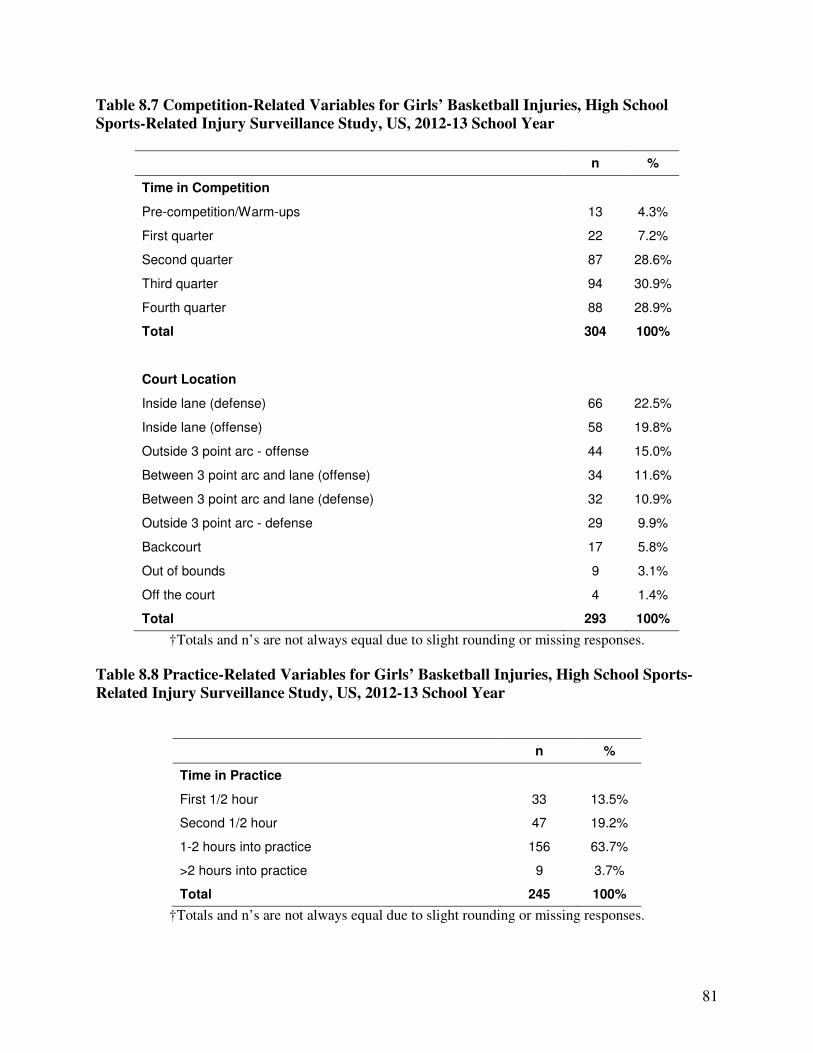
81
Table 8.7 Competition-Related Variables for Girls’ Basketball Injuries, High School
Sports-Related Injury Surveillance Study, US, 2012-13 School Year
n %
Time in Competition
Pre-competition/Warm-ups 13 4.3%
First quarter 22 7.2%
Second quarter 87 28.6%
Third quarter 94 30.9%
Fourth quarter 88 28.9%
Total 304 100%
Court Location
Inside lane (defense) 66 22.5%
Inside lane (offense) 58 19.8%
Outside 3 point arc - offense 44 15.0%
Between 3 point arc and lane (offense) 34 11.6%
Between 3 point arc and lane (defense) 32 10.9%
Outside 3 point arc - defense 29 9.9%
Backcourt 17 5.8%
Out of bounds 9 3.1%
Off the court 4 1.4%
Total 293 100%
†Totals and n’s are not always equal due to slight rounding or missing responses.
Table 8.8 Practice-Related Variables for Girls’ Basketball Injuries, High School Sports-
Related Injury Surveillance Study, US, 2012-13 School Year
n %
Time in Practice
First 1/2 hour 33 13.5%
Second 1/2 hour 47 19.2%
1-2 hours into practice 156 63.7%
>2 hours into practice 9 3.7%
Total 245 100%
†Totals and n’s are not always equal due to slight rounding or missing responses.

82
Figure 8.4 Player Position of Girls’ Basketball Injuries by Type of Exposure, High School
Sports-Related Injury Surveillance Study, US, 2012-13 School Year
Table 8.9 Activities Leading to Girls’ Basketball Injuries by Type of Exposure, High School
Sports-Related Injury Surveillance Study, US, 2012-13 School Year
Competition Practice Overall
n % n % n %
Activity
General play 69 22.3% 83 33.6% 152 27.3%
Defending 67 21.6% 32 13.0% 99 17.8%
Rebounding 56 18.1% 42 17.0% 98 17.6%
Chasing loose ball 41 13.2% 16 6.5% 57 10.2%
Shooting 28 9.0% 14 5.7% 42 7.5%
Ball handling/dribbling 25 8.1% 15 6.1% 40 7.2%
Receiving pass 16 5.2% 14 5.7% 30 5.4%
Conditioning - 0.0% 19 7.7% 19 3.4%
Passing 5 1.6% 5 2.0% 10 1.8%
Other 3 1.0% 7 2.8% 10 1.8%
Total 310 100% 247 100% 557 100%
†Totals and n’s are not always equal due to slight rounding or missing responses.
47%
39%
14%
Competition n=306
Guard
Forward
Center
50%
33%
17%
Practice n=247

83
Figure 8.5 Activity Resulting in Girls’ Basketball Injuries by Injury Diagnosis, High School
Sports-Related Injury Surveillance Study, US, 2012-13 School Year
0% 10% 20% 30% 40% 50% 60% 70% 80% 90% 100%
Other
Concussion
Fracture
Contusion
Strain/sprain
Rebounding Defending Shooting Chasing loose ball Other
84
IX. Wrestling Injury Epidemiology

85
Table 9.1 Wrestling Injury Rates by Type of Exposure, High School Sports-Related Injury
Surveillance Study, US, 2012-13 School Year
# Injuries # Exposures Injury rate
(per 1,000 athlete-exposures)
Total 574 272,077 2.11
Competition 231 72,909 3.17
Practice 343 199,168 1.72
Table 9.2 Demographic Characteristics of Injured Wrestlers, High School Sports-Related
Injury Surveillance Study, US, 2012-13 School Year*
Year in School n=558
Freshman 27.4%
Sophomore 22.2%
Junior 23.8%
Senior 26.5%
Total† 100%
Age (years)
Minimum 13
Maximum 18
Mean (St. Dev.) 15.9 (1.3)
BMI
Minimum 12.6
Maximum 44.7
Mean (St. Dev.) 23.7 (4.8)
*All analyses in this chapter present un-weighted data. †Throughout this report, totals and n’s represent the total un-weighted number of injury reports containing a valid response for the particular question. Due to a low level of non-response, these totals are always similar but are not always equal to the total number of injuries.

86
Figure 9.1 Diagnosis of Wrestling Injuries by Type of Exposure, High School Sports-
Related Injury Surveillance Study, US, 2012-13 School Year
Table 9.3 Body Site of Wrestling Injuries by Type of Exposure, High School Sports-Related
Injury Surveillance Study, US, 2012-13 School Year
Competition Practice Overall
n % n % n %
Body Site
Head/face 65 28.3% 82 23.9% 147 25.7%
Knee 41 17.8% 56 16.3% 97 16.9%
Shoulder 35 15.2% 44 12.8% 79 13.8%
Arm/elbow 15 6.5% 39 11.4% 54 9.4%
Trunk 15 6.5% 31 9.0% 46 8.0%
Hand/wrist 17 7.4% 23 6.7% 40 7.0%
Ankle 15 6.5% 21 6.1% 36 6.3%
Hip/thigh/upper leg 6 2.6% 14 4.1% 20 3.5%
Neck 6 2.6% 12 3.5% 18 3.1%
Lower leg 2 0.9% 6 1.7% 8 1.4%
Foot 3 1.3% 4 1.2% 7 1.2%
Other 10 4.3% 11 3.2% 21 3.7%
Total 230 100% 343 100% 573 100%
†Totals and n’s are not always equal due to slight rounding or missing responses.
34%
4%
12%22%
6%
23%
Competition n=231
Strain/sprain
Contusion
Fracture
Concussion
Skin infection
Other
35%
8%
6%16%
15%
20%
Practice n=343
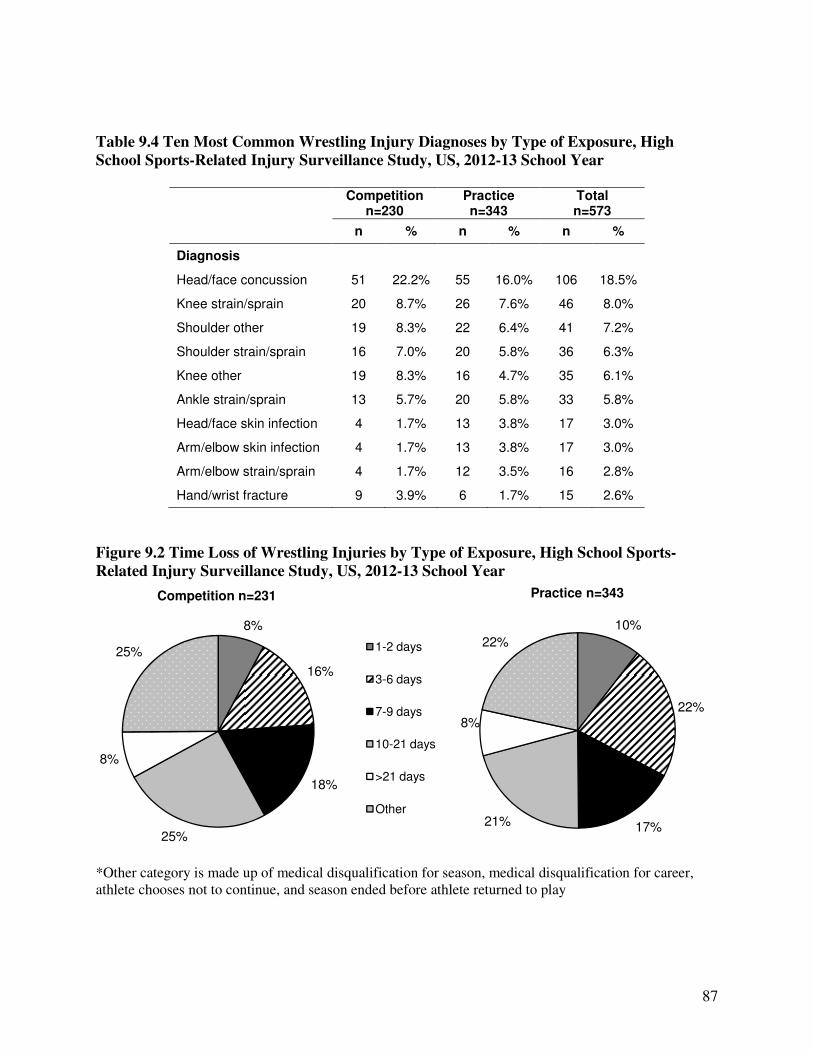
87
Table 9.4 Ten Most Common Wrestling Injury Diagnoses by Type of Exposure, High
School Sports-Related Injury Surveillance Study, US, 2012-13 School Year
Competition
n=230 Practice n=343
Total n=573
n % n % n %
Diagnosis
Head/face concussion 51 22.2% 55 16.0% 106 18.5%
Knee strain/sprain 20 8.7% 26 7.6% 46 8.0%
Shoulder other 19 8.3% 22 6.4% 41 7.2%
Shoulder strain/sprain 16 7.0% 20 5.8% 36 6.3%
Knee other 19 8.3% 16 4.7% 35 6.1%
Ankle strain/sprain 13 5.7% 20 5.8% 33 5.8%
Head/face skin infection 4 1.7% 13 3.8% 17 3.0%
Arm/elbow skin infection 4 1.7% 13 3.8% 17 3.0%
Arm/elbow strain/sprain 4 1.7% 12 3.5% 16 2.8%
Hand/wrist fracture 9 3.9% 6 1.7% 15 2.6%
Figure 9.2 Time Loss of Wrestling Injuries by Type of Exposure, High School Sports-
Related Injury Surveillance Study, US, 2012-13 School Year
*Other category is made up of medical disqualification for season, medical disqualification for career, athlete chooses not to continue, and season ended before athlete returned to play
8%
16%
18%
25%
8%
25%
Competition n=231
1-2 days
3-6 days
7-9 days
10-21 days
>21 days
Other
10%
22%
17%21%
8%
22%
Practice n=343

88
Table 9.5 Wrestling Injuries Requiring Surgery by Type of Exposure, High School Sports-
Related Injury Surveillance Study, US, 2012-13 School Year
Competition Practice Overall
n % n % n %
Need for surgery
Required surgery 15 6.7% 21 6.3% 36 6.5%
Did not require surgery 208 93.3% 314 93.7% 522 93.5%
Total 223 100% 335 100% 558 100%
†Totals and n’s are not always equal due to slight rounding or missing responses.
Figure 9.3 History of Wrestling Injuries by Type of Exposure, High School Sports-Related
Injury Surveillance Study, US, 2012-13 School Year
Table 9.6 Time during Season of Wrestling Injuries, High School Sports-Related Injury
Surveillance Study, US, 2012-13 School Year
n %
Time in Season
Preseason 83 14.5%
Regular season 464 81.0%
Post season 26 4.5%
Total 573 100%
†Totals and n’s are not always equal due to slight rounding or missing responses.
87%
5%
8%
Competition n=231
New injury
Recurrence (this academic year)
Recurrence (previous academic year)
90%
2%8%
Practice n=336

89
Table 9.7 Competition-Related Variables for Wrestling Injuries, High School Sports-
Related Injury Surveillance Study, US, 2012-13 School Year
n %
Time in Competition
Pre-competition/warm-ups 3 1.5%
First period 28 13.9%
Second period 90 44.8%
Third period 79 39.3%
Overtime 1 0.5%
Total 201 100%
Mat Location
Within 28 ft. circle 205 97.6%
Out of bounds 3 1.4%
Off the mat 2 1.0%
Total 210 100%
†Totals and n’s are not always equal due to slight rounding or missing responses.
Table 9.8 Practice-Related Variables for Wrestling Injuries, High School Sports-Related
Injury Surveillance Study, US, 2012-13 School Year
n %
Time in Practice
First 1/2 hour 58 18.0%
Second 1/2 hour 56 17.4%
1-2 hours into practice 158 49.1%
>2 hours into practice 50 15.5%
Total 322 100%
†Totals and n’s are not always equal due to slight rounding or missing responses.
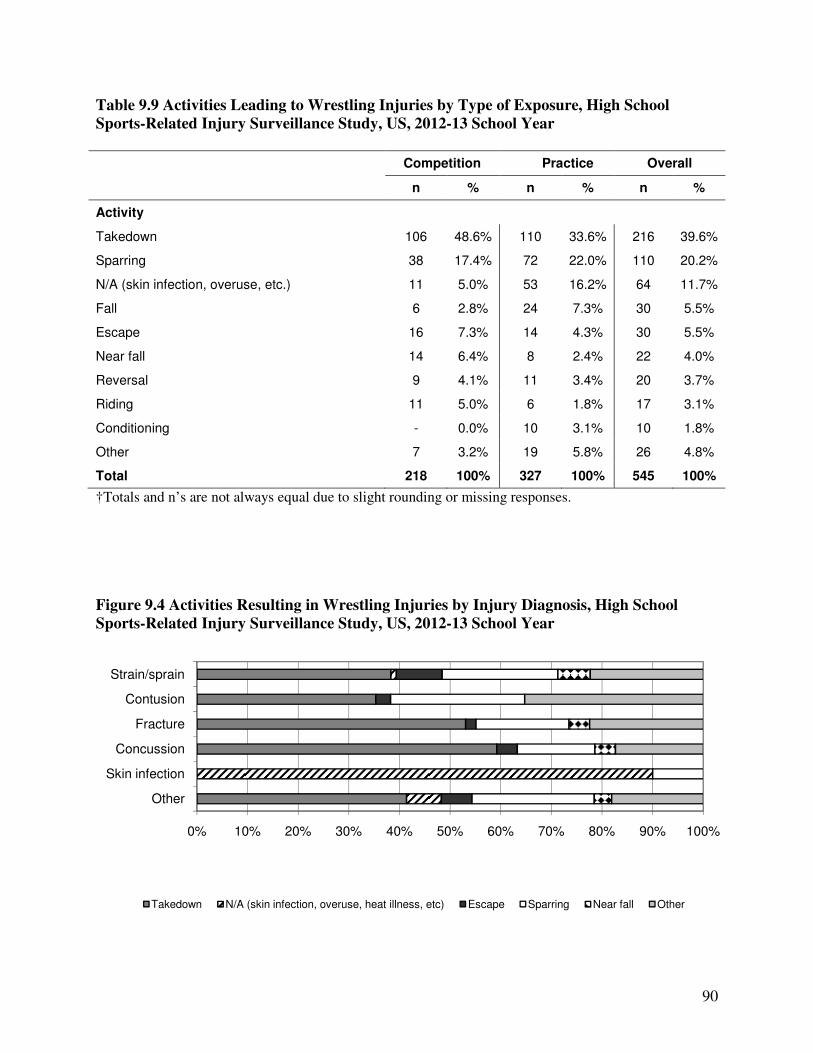
90
Table 9.9 Activities Leading to Wrestling Injuries by Type of Exposure, High School
Sports-Related Injury Surveillance Study, US, 2012-13 School Year
Competition Practice Overall
n % n % n %
Activity
Takedown 106 48.6% 110 33.6% 216 39.6%
Sparring 38 17.4% 72 22.0% 110 20.2%
N/A (skin infection, overuse, etc.) 11 5.0% 53 16.2% 64 11.7%
Fall 6 2.8% 24 7.3% 30 5.5%
Escape 16 7.3% 14 4.3% 30 5.5%
Near fall 14 6.4% 8 2.4% 22 4.0%
Reversal 9 4.1% 11 3.4% 20 3.7%
Riding 11 5.0% 6 1.8% 17 3.1%
Conditioning - 0.0% 10 3.1% 10 1.8%
Other 7 3.2% 19 5.8% 26 4.8%
Total 218 100% 327 100% 545 100%
†Totals and n’s are not always equal due to slight rounding or missing responses.
Figure 9.4 Activities Resulting in Wrestling Injuries by Injury Diagnosis, High School
Sports-Related Injury Surveillance Study, US, 2012-13 School Year
0% 10% 20% 30% 40% 50% 60% 70% 80% 90% 100%
Other
Skin infection
Concussion
Fracture
Contusion
Strain/sprain
Takedown N/A (skin infection, overuse, heat illness, etc) Escape Sparring Near fall Other

91
X. Baseball Injury Epidemiology
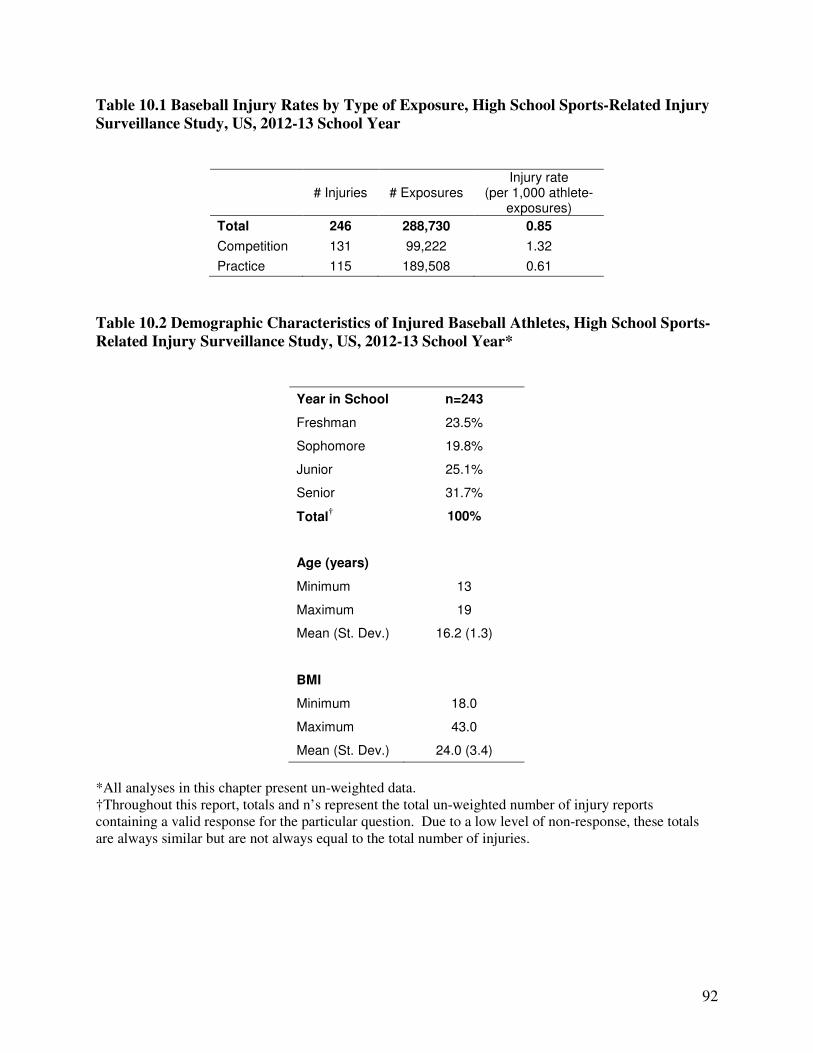
92
Table 10.1 Baseball Injury Rates by Type of Exposure, High School Sports-Related Injury
Surveillance Study, US, 2012-13 School Year
# Injuries # Exposures Injury rate
(per 1,000 athlete-exposures)
Total 246 288,730 0.85
Competition 131 99,222 1.32
Practice 115 189,508 0.61
Table 10.2 Demographic Characteristics of Injured Baseball Athletes, High School Sports-
Related Injury Surveillance Study, US, 2012-13 School Year*
Year in School n=243
Freshman 23.5%
Sophomore 19.8%
Junior 25.1%
Senior 31.7%
Total† 100%
Age (years)
Minimum 13
Maximum 19
Mean (St. Dev.) 16.2 (1.3)
BMI
Minimum 18.0
Maximum 43.0
Mean (St. Dev.) 24.0 (3.4)
*All analyses in this chapter present un-weighted data. †Throughout this report, totals and n’s represent the total un-weighted number of injury reports containing a valid response for the particular question. Due to a low level of non-response, these totals are always similar but are not always equal to the total number of injuries.
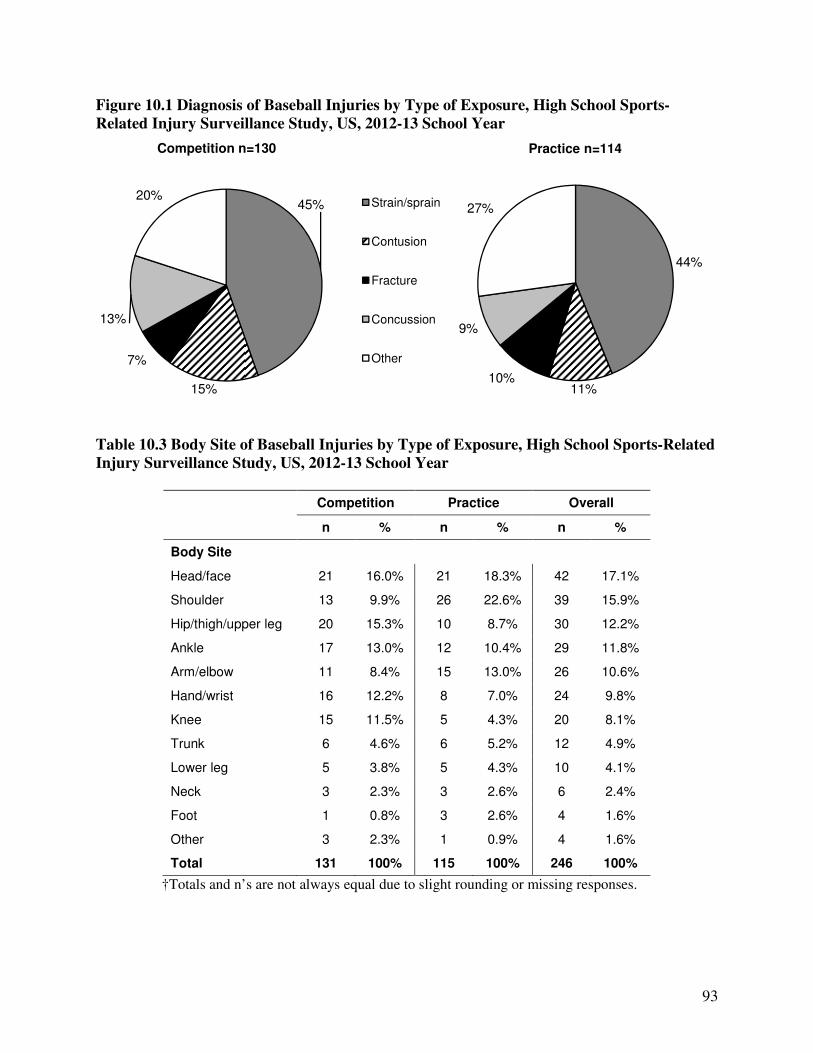
93
Figure 10.1 Diagnosis of Baseball Injuries by Type of Exposure, High School Sports-
Related Injury Surveillance Study, US, 2012-13 School Year
Table 10.3 Body Site of Baseball Injuries by Type of Exposure, High School Sports-Related
Injury Surveillance Study, US, 2012-13 School Year
Competition Practice Overall
n % n % n %
Body Site
Head/face 21 16.0% 21 18.3% 42 17.1%
Shoulder 13 9.9% 26 22.6% 39 15.9%
Hip/thigh/upper leg 20 15.3% 10 8.7% 30 12.2%
Ankle 17 13.0% 12 10.4% 29 11.8%
Arm/elbow 11 8.4% 15 13.0% 26 10.6%
Hand/wrist 16 12.2% 8 7.0% 24 9.8%
Knee 15 11.5% 5 4.3% 20 8.1%
Trunk 6 4.6% 6 5.2% 12 4.9%
Lower leg 5 3.8% 5 4.3% 10 4.1%
Neck 3 2.3% 3 2.6% 6 2.4%
Foot 1 0.8% 3 2.6% 4 1.6%
Other 3 2.3% 1 0.9% 4 1.6%
Total 131 100% 115 100% 246 100%
†Totals and n’s are not always equal due to slight rounding or missing responses.
45%
15%
7%
13%
20%
Competition n=130
Strain/sprain
Contusion
Fracture
Concussion
Other
44%
11%10%
9%
27%
Practice n=114

94
Table 10.4 Ten Most Common Baseball Injury Diagnoses by Type of Exposure, High
School Sports-Related Injury Surveillance Study, US, 2012-13 School Year
Competition
n=130 Practice
n=114 Total n=244
n % n % n %
Diagnosis
Head/face concussion 17 13.1% 10 8.8% 27 11.1%
Ankle strain/sprain 15 11.5% 9 7.9% 24 9.8%
Hip/thigh/upper leg strain/sprain 17 13.1% 6 5.3% 23 9.4%
Shoulder other 8 6.2% 11 9.6% 19 7.8%
Shoulder strain/sprain 4 3.1% 13 11.4% 17 7.0%
Trunk strain/sprain 6 4.6% 5 4.4% 11 4.5%
Arm/elbow other 3 2.3% 7 6.1% 10 4.1%
Arm/elbow strain/sprain 3 2.3% 6 5.3% 9 3.7%
Knee strain/sprain 5 3.8% 4 3.5% 9 3.7%
Hand/wrist fracture 6 4.6% 3 2.6% 9 3.7%
Figure 10.2 Time Loss of Baseball Injuries by Type of Exposure, High School Sports-
Related Injury Surveillance Study, US, 2012-13 School Year
*Other category is made up of medical disqualification for season, medical disqualification for career, athlete chooses not to continue, and season ended before athlete returned to play
18%
25%
8%
19%
8%
22%
Competition n=131
1-2 days
3-6 days
7-9 days
10-21 days
>21 days
Other
20%
19%
13%
23%
9%
16%
Practice n=115

95
Table 10.5 Baseball Injuries Requiring Surgery by Type of Exposure, High School Sports-
Related Injury Surveillance Study, US, 2012-13 School Year
Competition Practice Overall
n % n % n %
Need for surgery
Required surgery 4 3.1% 13 11.6% 17 7.1%
Did not require surgery 125 96.9% 99 88.4% 224 92.9%
Total 129 100% 112 100% 241 100%
†Totals and n’s are not always equal due to slight rounding or missing responses.
Figure 10.3 History of Baseball Injuries by Type of Exposure, High School Sports-Related
Injury Surveillance Study, US, 2012-13 School Year
Table 10.6 Time during Season of Baseball Injuries, High School Sports-Related Injury
Surveillance Study, US, 2012-13 School Year
n %
Time in Season
Preseason 54 22.0%
Regular season 186 75.9%
Post season 5 2.0%
Total 245 100.0%
†Totals and n’s are not always equal due to slight rounding or missing responses.
89%
8%3%
Competition n=129
New injury
Recurrence (this academic year)
Recurrence (previous academic year)
93%
4% 3%
Practice n=115
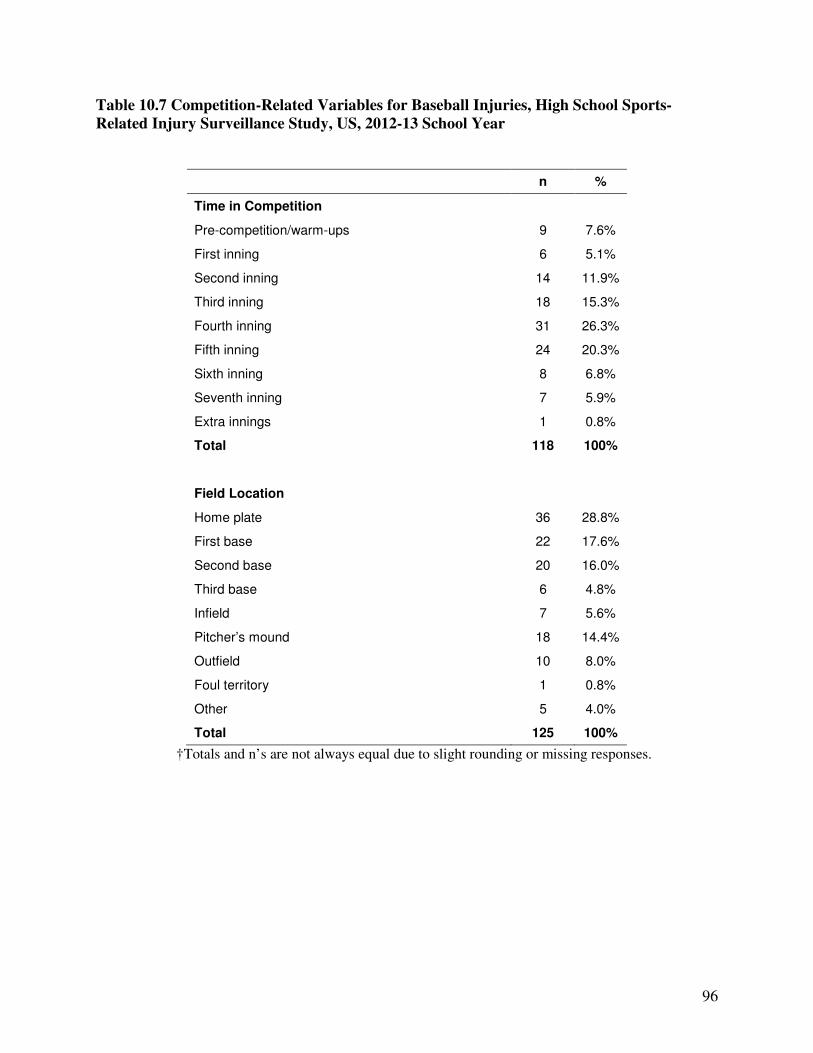
96
Table 10.7 Competition-Related Variables for Baseball Injuries, High School Sports-
Related Injury Surveillance Study, US, 2012-13 School Year
n %
Time in Competition
Pre-competition/warm-ups 9 7.6%
First inning 6 5.1%
Second inning 14 11.9%
Third inning 18 15.3%
Fourth inning 31 26.3%
Fifth inning 24 20.3%
Sixth inning 8 6.8%
Seventh inning 7 5.9%
Extra innings 1 0.8%
Total 118 100%
Field Location
Home plate 36 28.8%
First base 22 17.6%
Second base 20 16.0%
Third base 6 4.8%
Infield 7 5.6%
Pitcher’s mound 18 14.4%
Outfield 10 8.0%
Foul territory 1 0.8%
Other 5 4.0%
Total 125 100%
†Totals and n’s are not always equal due to slight rounding or missing responses.

97
Table 10.8 Practice-Related Variables for Baseball Injuries, High School Sports-Related
Injury Surveillance Study, US, 2012-13 School Year
n %
Time in Practice
First 1/2 hour 17 15.7%
Second 1/2 hour 26 24.1%
1-2 hours into practice 60 55.6%
>2 hours into practice 5 4.6%
Total 108 100%
†Totals and n’s are not always equal due to slight rounding or missing responses.
Figure 10.4 Player Position of Baseball Injuries by Type of Exposure, High School Sports-
Related Injury Surveillance Study, US, 2012-13 School Year
12%
16%
20%17%
4%
31%
Competition n=127
Base runner
Pitcher
Batter
Catcher
Shortstop
Other
12%
18%
3%
12%
5%
50%
Practice n=111
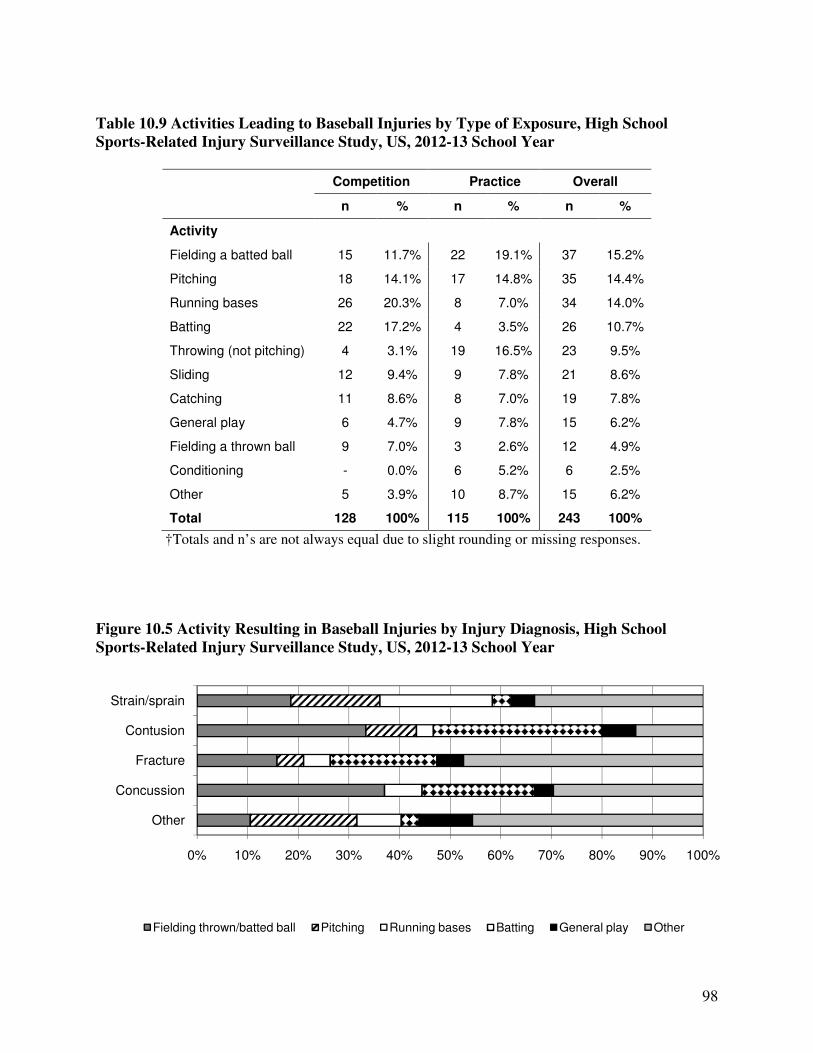
98
Table 10.9 Activities Leading to Baseball Injuries by Type of Exposure, High School
Sports-Related Injury Surveillance Study, US, 2012-13 School Year
Competition Practice Overall
n % n % n %
Activity
Fielding a batted ball 15 11.7% 22 19.1% 37 15.2%
Pitching 18 14.1% 17 14.8% 35 14.4%
Running bases 26 20.3% 8 7.0% 34 14.0%
Batting 22 17.2% 4 3.5% 26 10.7%
Throwing (not pitching) 4 3.1% 19 16.5% 23 9.5%
Sliding 12 9.4% 9 7.8% 21 8.6%
Catching 11 8.6% 8 7.0% 19 7.8%
General play 6 4.7% 9 7.8% 15 6.2%
Fielding a thrown ball 9 7.0% 3 2.6% 12 4.9%
Conditioning - 0.0% 6 5.2% 6 2.5%
Other 5 3.9% 10 8.7% 15 6.2%
Total 128 100% 115 100% 243 100%
†Totals and n’s are not always equal due to slight rounding or missing responses.
Figure 10.5 Activity Resulting in Baseball Injuries by Injury Diagnosis, High School
Sports-Related Injury Surveillance Study, US, 2012-13 School Year
0% 10% 20% 30% 40% 50% 60% 70% 80% 90% 100%
Other
Concussion
Fracture
Contusion
Strain/sprain
Fielding thrown/batted ball Pitching Running bases Batting General play Other

99
XI. Softball Injury Epidemiology

100
Table 11.1 Softball Injury Rates by Type of Exposure, High School Sports-Related Injury
Surveillance Study, US, 2012-13 School Year
# Injuries # Exposures Injury rate
(per 1,000 athlete-exposures)
Total 240 205,072 1.17
Competition 131 70,041 1.87
Practice 109 135,031 0.81
Table 11.2 Demographic Characteristics of Injured Softball Athletes, High School Sports-
Related Injury Surveillance Study, US, 2012-13 School Year*
Year in School n=240
Freshman 32.1%
Sophomore 26.3%
Junior 22.5%
Senior 19.2%
Total† 100%
Age (years)
Minimum 13
Maximum 18
Mean (St. Dev.) 15.8 (1.2)
BMI
Minimum 15.8
Maximum 40.4
Mean (St. Dev.) 23.7 (4.9)
*All analyses in this chapter present un-weighted data. †Throughout this report, totals and n’s represent the total un-weighted number of injury reports containing a valid response for the particular question. Due to a low level of non-response, these totals are always similar but are not always equal to the total number of injuries.
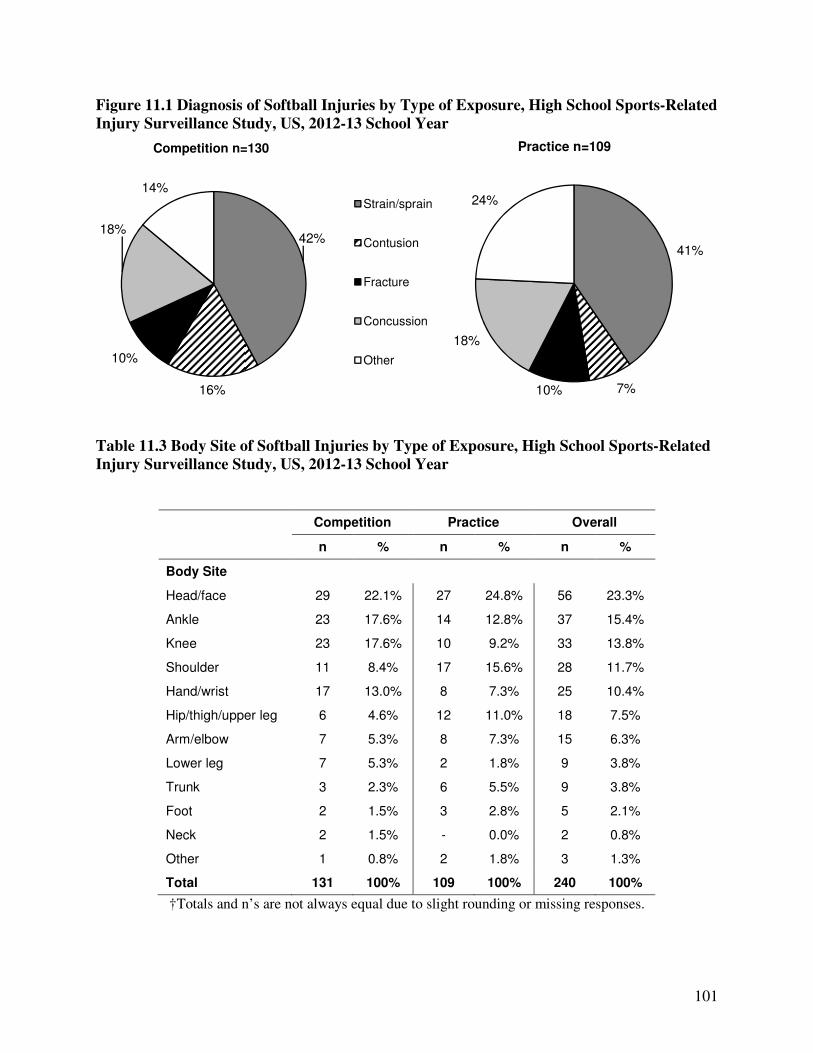
101
Figure 11.1 Diagnosis of Softball Injuries by Type of Exposure, High School Sports-Related
Injury Surveillance Study, US, 2012-13 School Year
Table 11.3 Body Site of Softball Injuries by Type of Exposure, High School Sports-Related
Injury Surveillance Study, US, 2012-13 School Year
Competition Practice Overall
n % n % n %
Body Site
Head/face 29 22.1% 27 24.8% 56 23.3%
Ankle 23 17.6% 14 12.8% 37 15.4%
Knee 23 17.6% 10 9.2% 33 13.8%
Shoulder 11 8.4% 17 15.6% 28 11.7%
Hand/wrist 17 13.0% 8 7.3% 25 10.4%
Hip/thigh/upper leg 6 4.6% 12 11.0% 18 7.5%
Arm/elbow 7 5.3% 8 7.3% 15 6.3%
Lower leg 7 5.3% 2 1.8% 9 3.8%
Trunk 3 2.3% 6 5.5% 9 3.8%
Foot 2 1.5% 3 2.8% 5 2.1%
Neck 2 1.5% - 0.0% 2 0.8%
Other 1 0.8% 2 1.8% 3 1.3%
Total 131 100% 109 100% 240 100%
†Totals and n’s are not always equal due to slight rounding or missing responses.
42%
16%
10%
18%
14%
Competition n=130
Strain/sprain
Contusion
Fracture
Concussion
Other
41%
7%10%
18%
24%
Practice n=109

102
Table 11.4 Ten Most Common Softball Injury Diagnoses by Type of Exposure, High School
Sports-Related Injury Surveillance Study, US, 2012-13 School Year
Competition
n=130 Practice
n=109 Total n=239
n % n % n %
Diagnosis
Head/face concussion 23 17.7% 20 18.3% 43 18.0%
Ankle strain/sprain 22 16.9% 12 11.0% 34 14.2%
Knee strain/sprain 17 13.1% 3 2.8% 20 8.4%
Shoulder other 8 6.2% 11 10.1% 19 7.9%
Hip/thigh/upper leg strain/sprain 4 3.1% 11 10.1% 15 6.3%
Hand/wrist fracture 8 6.2% 3 2.8% 11 4.6%
Shoulder strain/sprain 2 1.5% 6 5.5% 8 3.3%
Knee contusion 5 3.8% 3 2.8% 8 3.3%
Head/face contusion 4 3.1% 3 2.8% 7 2.9%
Hand/wrist strain/sprain 4 3.1% 2 1.8% 6 2.5%
Figure 11.2 Time Loss of Softball Injuries by Type of Exposure, High School Sports-
Related Injury Surveillance Study, US, 2012-13 School Year
*Other category is made up of medical disqualification for season, medical disqualification for career, athlete chooses not to continue, and season ended before athlete returned to play
12%
13%
16%
14%8%
38%
Competition n=131
1-2 days
3-6 days
7-9 days
10-21 days
>21 days
Other
11%
25%
21%
23%
4% 16%
Practice n=109

103
Table 11.5 Softball Injuries Requiring Surgery by Type of Exposure, High School Sports-
Related Injury Surveillance Study, US, 2012-13 School Year
Competition Practice Overall
n % n % n %
Need for surgery
Required surgery 11 8.5% 3 2.8% 14 5.9%
Did not require surgery 118 91.5% 104 97.2% 222 94.1%
Total 129 100% 107 100% 236 100%
†Totals and n’s are not always equal due to slight rounding or missing responses.
Figure 11.3 History of Softball Injuries by Type of Exposure, High School Sports-Related
Injury Surveillance Study, US, 2012-13 School Year
Table 11.6 Time during Season of Softball Injuries, High School Sports-Related Injury
Surveillance Study, US, 2012-13 School Year
n %
Time in Season
Preseason 61 25.4%
Regular season 174 72.5%
Post season 5 2.1%
Total 240 100%
†Totals and n’s are not always equal due to slight rounding or missing responses.
96%
1%3%
Competition n=130
New injury
Recurrence (this academic year)
Recurrence (previous academic year)
91%
7%
Practice n=107
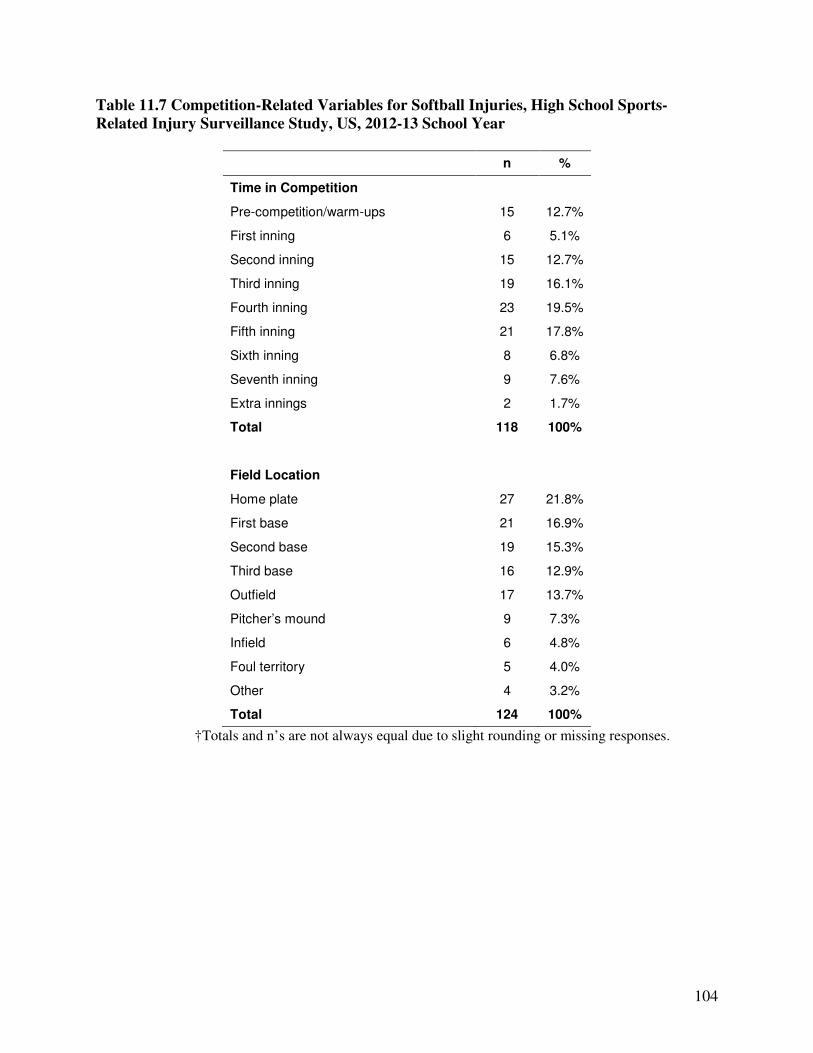
104
Table 11.7 Competition-Related Variables for Softball Injuries, High School Sports-
Related Injury Surveillance Study, US, 2012-13 School Year
n %
Time in Competition
Pre-competition/warm-ups 15 12.7%
First inning 6 5.1%
Second inning 15 12.7%
Third inning 19 16.1%
Fourth inning 23 19.5%
Fifth inning 21 17.8%
Sixth inning 8 6.8%
Seventh inning 9 7.6%
Extra innings 2 1.7%
Total 118 100%
Field Location
Home plate 27 21.8%
First base 21 16.9%
Second base 19 15.3%
Third base 16 12.9%
Outfield 17 13.7%
Pitcher’s mound 9 7.3%
Infield 6 4.8%
Foul territory 5 4.0%
Other 4 3.2%
Total 124 100%
†Totals and n’s are not always equal due to slight rounding or missing responses.

105
Table 11.8 Practice-Related Variables for Softball Injuries, High School Sports-Related
Injury Surveillance Study, US, 2012-13 School Year
n %
Time in Practice
First 1/2 hour 14 14.4%
Second 1/2 hour 18 18.6%
1-2 hours into practice 62 63.9%
>2 hours into practice 3 3.1%
Total 97 100%
†Totals and n’s are not always equal due to slight rounding or missing responses.
Figure 11.4 Player Position of Softball Injuries by Type of Exposure, High School Sports-
Related Injury Surveillance Study, US, 2012-13 School Year
15%
11%
11%
4%
6%
53%
Competition n=124
Pitcher
Base runner
Catcher
Right field
Second base
Other
7%
12%
13%
6%
7%
55%
Practice n=103

106
Table 11.9 Activities Leading to Softball Injuries by Type of Exposure, High School Sports-
Related Injury Surveillance Study, US, 2012-13 School Year
Competition Practice Overall
n % n % n %
Activity
Running bases 29 23.0% 19 17.6% 48 20.5%
Fielding a batted ball 23 18.3% 15 13.9% 38 16.2%
Catching 14 11.1% 11 10.2% 25 10.7%
Sliding 16 12.7% 5 4.6% 21 9.0%
Throwing (not pitching) 4 3.2% 17 15.7% 21 9.0%
Fielding a thrown ball 10 7.9% 8 7.4% 18 7.7%
General play 4 3.2% 12 11.1% 16 6.8%
Pitching 10 7.9% 5 4.6% 15 6.4%
Batting 8 6.3% 6 5.6% 14 6.0%
Conditioning 1 0.8% 8 7.4% 9 3.8%
Other 7 5.6% 2 1.9% 9 3.8%
Total 126 100% 108 100% 234 100%
†Totals and n’s are not always equal due to slight rounding or missing responses.
Figure 11.5 Activity Resulting in Softball Injuries by Injury Diagnosis, High School Sports-
Related Injury Surveillance Study, US, 2012-13 School Year
0% 10% 20% 30% 40% 50% 60% 70% 80% 90% 100%
Other
Concussion
Fracture
Contusion
Strain/sprain
Fielding thrown/batted ball Pitching Running bases Batting General play Other
107
XII. Girls’ Field Hockey Injury Epidemiology

108
Table 12.1 Girls’ Field Hockey Injury Rates by Type of Exposure, High School Sports-
Related Injury Surveillance Study, US, 2012-13 School Year
# Injuries # Exposures Injury rate
(per 1,000 athlete-exposures)
Total 123 83,070 1.48
Competition 58 27,324 2.12
Practice 65 55,746 1.17
Table 12.2 Demographic Characteristics of Injured Girls’ Field Hockey Athletes, High
School Sports-Related Injury Surveillance Study, US, 2012-13 School Year*
Year in School n=120
Freshman 15.8%
Sophomore 28.3%
Junior 25.8%
Senior 30.0%
Total† 100%
Age (years)
Minimum 13
Maximum 18
Mean (St. Dev.) 15.7 (1.3)
BMI
Minimum 16.1
Maximum 35.2
Mean (St. Dev.) 22.5 (3.5)
*All analyses in this chapter present un-weighted data. †Throughout this report, totals and n’s represent the total un-weighted number of injury reports containing a valid response for the particular question. Due to a low level of non-response, these totals are always similar but are not always equal to the total number of injuries.

109
Figure 12.1 Diagnosis of Girls’ Field Hockey Injuries by Type of Exposure, High School
Sports-Related Injury Surveillance Study, US, 2012-13 School Year
Table 12.3 Body Site of Girls’ Field Hockey Injuries by Type of Exposure, High School
Sports-Related Injury Surveillance Study, US, 2012-13 School Year
Competition Practice Overall
n % n % n %
Body Site
Head/face 19 33.3% 10 15.6% 29 24.0%
Hip/thigh/upper leg 3 5.3% 20 31.3% 23 19.0%
Knee 11 19.3% 6 9.4% 17 14.0%
Hand/wrist 12 21.1% 3 4.7% 15 12.4%
Ankle 4 7.0% 6 9.4% 10 8.3%
Lower leg 1 1.8% 9 14.1% 10 8.3%
Foot 3 5.3% 4 6.3% 7 5.8%
Trunk 1 1.8% 5 7.8% 6 5.0%
Shoulder 1 1.8% - 0.0% 1 0.8%
Other 2 3.5% 1 1.6% 3 2.5%
Total 57 100% 64 100% 121 100%
†Totals and n’s are not always equal due to slight rounding or missing responses.
22%
21%
9%
29%
19%
Competition n=58
Strain/sprain
Contusion
Fracture
Concussion
Other
49%
1%5%
11%
34%
Practice n=65

110
Table 12.4 Ten Most Common Girls’ Field Hockey Injury Diagnoses by Type of Exposure,
High School Sports-Related Injury Surveillance Study, US, 2012-13 School Year
Competition
n=57 Practice
n=64 Total n=121
n % n % n %
Diagnosis
Head/face concussion 17 29.8% 7 10.9% 24 19.8%
Hip/thigh/upper leg strain/sprain 2 3.5% 19 29.7% 21 17.4%
Ankle strain/sprain 4 7.0% 6 9.4% 10 8.3%
Knee other 5 8.8% 5 7.8% 10 8.3%
Lower leg other - 0.0% 8 12.5% 8 6.6%
Hand/wrist fracture 5 8.8% 2 3.1% 7 5.8%
Foot strain/sprain 2 3.5% 3 4.7% 5 4.1%
Knee contusion 4 7.0% 1 1.6% 5 4.1%
Head/face other 2 3.5% 2 3.1% 4 3.3%
Hand/wrist strain/sprain 2 3.5% 1 1.6% 3 2.5%
Figure 12.2 Time Loss of Girls’ Field Hockey Injuries by Type of Exposure, High School
Sports-Related Injury Surveillance Study, US, 2012-13 School Year
*Other category is made up of medical disqualification for season, medical disqualification for career, athlete chooses not to continue, and season ended before athlete returned to play
16%
26%
19%
17%
19%
Competition n=58
1-2 days
3-6 days
7-9 days
10-21 days
>21 days
Other
23%
22%
15%
23%
12%
5%
Practice n=65
3%

111
Table 12.5 Girls’ Field Hockey Injuries Requiring Surgery by Type of Exposure, High
School Sports-Related Injury Surveillance Study, US, 2012-13 School Year
Competition Practice Overall
n % n % n %
Need for surgery
Required surgery 2 3.6% 1 1.5% 3 2.5%
Did not require surgery 54 96.4% 64 98.5% 118 97.5%
Total 56 100% 65 100% 121 100%
†Totals and n’s are not always equal due to slight rounding or missing responses.
Figure 12.3 History of Girls’ Field Hockey Injuries by Type of Exposure, High School
Sports-Related Injury Surveillance Study, US, 2012-13 School Year
Table 12.6 Time during Season of Girls’ Field Hockey Injuries, High School Sports-Related
Injury Surveillance Study, US, 2012-13 School Year
n %
Time in Season
Preseason 34 27.9%
Regular season 87 71.3%
Post season 1 0.8%
Total 122 100%
†Totals and n’s are not always equal due to slight rounding or missing responses.
93%
2%
Competition n=58
New injury
Recurrence (this academic year)
Recurrence (previous academic year)
85%
9%
Practice n=65
5%
6%

112
Table 12.7 Competition-Related Variables for Girls’ Field Hockey Injuries, High School
Sports-Related Injury Surveillance Study, US, 2012-13 School Year
n %
Time in Competition
Pre-competition/warm-ups 1 1.8%
First half 15 26.8%
Second half 40 71.4%
Overtime - 0.0%
Total 56 100%
Field Location
Between 25-yard line and center line 24 42.9%
Within 25-yard line 13 23.2%
Within 16-yard arc 10 17.9%
Goal area/circle 6 10.7%
Sideline 2 3.6%
Other 1 1.8%
Total 56 100%
†Totals and n’s are not always equal due to slight rounding or missing responses.
Table 12.8 Practice-Related Variables for Girls’ Field Hockey Injuries, High School
Sports-Related Injury Surveillance Study, US, 2012-13 School Year
n %
Time in Practice
First 1/2 hour 5 8.1%
Second 1/2 hour 15 24.2%
1-2 hours into practice 34 54.8%
>2 hours into practice 8 12.9%
Total 62 100%
†Totals and n’s are not always equal due to slight rounding or missing responses.

113
Figure 12.4 Player Position of Girls’ Field Hockey Injuries by Type of Exposure, High
School Sports-Related Injury Surveillance Study, US, 2012-13 School Year
Table 12.9 Activities Leading to Girls’ Field Hockey Injuries by Type of Exposure, High
School Sports-Related Injury Surveillance Study, US, 2012-13 School Year
Competition Practice Overall
n % n % n %
Activity
General play 14 24.6% 21 34.4% 35 29.7%
Conditioning - 0.0% 20 32.8% 20 16.9%
Defending 14 24.6% 2 3.3% 16 13.6%
Ball handling/dribbling 9 15.8% 3 4.9% 12 10.2%
Chasing a loose ball 5 8.8% 2 3.3% 7 5.9%
Goaltending 3 5.3% 4 6.6% 7 5.9%
Passing 5 8.8% 1 1.6% 6 5.1%
Receiving pass 3 5.3% 1 1.6% 4 3.4%
Shooting 1 1.8% 2 3.3% 3 2.5%
Blocking shot 2 3.5% - 0.0% 2 1.7%
Other 1 1.8% 5 8.2% 6 5.1%
Total 57 100% 61 100% 118 100%
†Totals and n’s are not always equal due to slight rounding or missing responses.
44%
28%
19% 7%0%
Competition n=57
Midfielder
Defender (back/sweeper)
Forward
Goalkeeper
Non-positional/conditioning drill
Other
26%
24%21%
8%
21%
Practice n=65

114
Figure 12.5 Activity Resulting in Girls’ Field Hockey Injuries by Injury Diagnosis, High
School Sports-Related Injury Surveillance Study, US, 2012-13 School Year
0% 10% 20% 30% 40% 50% 60% 70% 80% 90% 100%
Other
Concussion
Fracture
Contusion
Strain/sprain
Defending General play Conditioning Ball handling/dribbling Chasing loose ball Other
115
XIII. Boys’ Ice Hockey Injury Epidemiology

116
Table 13.1 Boys’ Ice Hockey Injury Rates by Type of Exposure, High School Sports-
Related Injury Surveillance Study, US, 2012-13 School Year
# Injuries # Exposures Injury rate
(per 1,000 athlete-exposures)
Total 117 57,852 2.02
Competition 98 19,039 5.15
Practice 19 38,813 0.49
Table 13.2 Demographic Characteristics of Injured Boys’ Ice Hockey Athletes, High School
Sports-Related Injury Surveillance Study, US, 2012-13 School Year*
Year in School n=115
Freshman 14.8%
Sophomore 22.6%
Junior 33.9%
Senior 28.7%
Total† 100%
Age (years)
Minimum 13
Maximum 18
Mean (St. Dev.) 16.1 (1.3)
BMI
Minimum 17.8
Maximum 37.6
Mean (St. Dev.) 23.6 (2.9)
*All analyses in this chapter present un-weighted data. †Throughout this report, totals and n’s represent the total un-weighted number of injury reports containing a valid response for the particular question. Due to a low level of non-response, these totals are always similar but are not always equal to the total number of injuries.
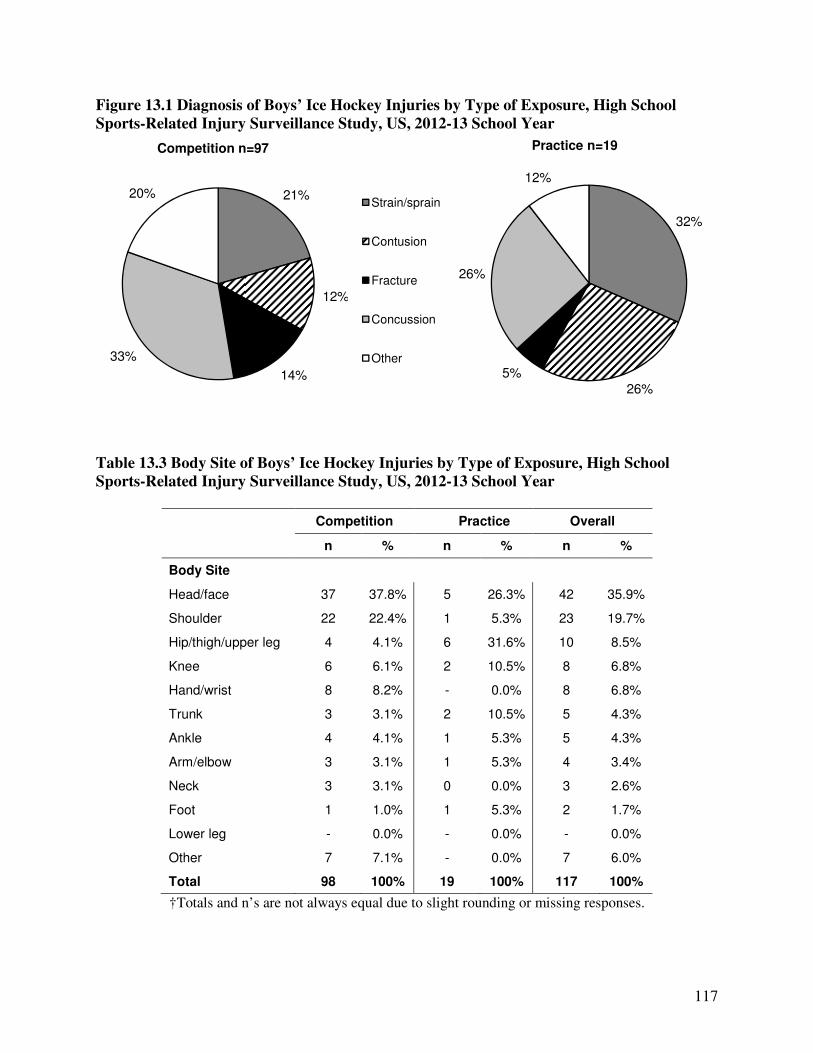
117
Figure 13.1 Diagnosis of Boys’ Ice Hockey Injuries by Type of Exposure, High School
Sports-Related Injury Surveillance Study, US, 2012-13 School Year
Table 13.3 Body Site of Boys’ Ice Hockey Injuries by Type of Exposure, High School
Sports-Related Injury Surveillance Study, US, 2012-13 School Year
Competition Practice Overall
n % n % n %
Body Site
Head/face 37 37.8% 5 26.3% 42 35.9%
Shoulder 22 22.4% 1 5.3% 23 19.7%
Hip/thigh/upper leg 4 4.1% 6 31.6% 10 8.5%
Knee 6 6.1% 2 10.5% 8 6.8%
Hand/wrist 8 8.2% - 0.0% 8 6.8%
Trunk 3 3.1% 2 10.5% 5 4.3%
Ankle 4 4.1% 1 5.3% 5 4.3%
Arm/elbow 3 3.1% 1 5.3% 4 3.4%
Neck 3 3.1% 0 0.0% 3 2.6%
Foot 1 1.0% 1 5.3% 2 1.7%
Lower leg - 0.0% - 0.0% - 0.0%
Other 7 7.1% - 0.0% 7 6.0%
Total 98 100% 19 100% 117 100%
†Totals and n’s are not always equal due to slight rounding or missing responses.
21%
12%
14%
33%
20%
Competition n=97
Strain/sprain
Contusion
Fracture
Concussion
Other
32%
26%
5%
26%
12%
Practice n=19

118
Table 13.4 Ten Most Common Boys’ Ice Hockey Injury Diagnoses by Type of Exposure,
High School Sports-Related Injury Surveillance Study, US, 2012-13 School Year
Competition
n=97 Practice
n=19 Total n=116
n % n % n %
Diagnosis
Head/face concussion 32 33.0% 5 26.3% 37 31.9%
Shoulder other 12 12.4% - 0.0% 12 10.3%
Shoulder strain/sprain 7 7.2% - 0.0% 7 6.0%
Hip/thigh/upper leg strain/sprain 2 2.1% 4 21.1% 6 5.2%
Other fracture 5 5.2% - 0.0% 5 4.3%
Ankle strain/sprain 4 4.1% 1 5.3% 5 4.3%
Hand/wrist fracture 5 5.2% - 0.0% 5 4.3%
Hip/thigh/upper leg contusion 2 2.1% 2 10.5% 4 3.4%
Trunk contusion 2 2.1% 2 10.5% 4 3.4%
Knee strain/sprain 2 2.1% 1 5.3% 3 2.6%
Figure 13.2 Time Loss of Boys’ Ice Hockey Injuries by Type of Exposure, High School
Sports-Related Injury Surveillance Study, US, 2012-13 School Year
*Other category is made up of medical disqualification for season, medical disqualification for career, athlete chooses not to continue, and season ended before athlete returned to play
7%
24%
17%25%
15%
12%
Competition n=98
1-2 days
3-6 days
7-9 days
10-21 days
>21 days
Other
47%16%
16%
11%
Practice n=19
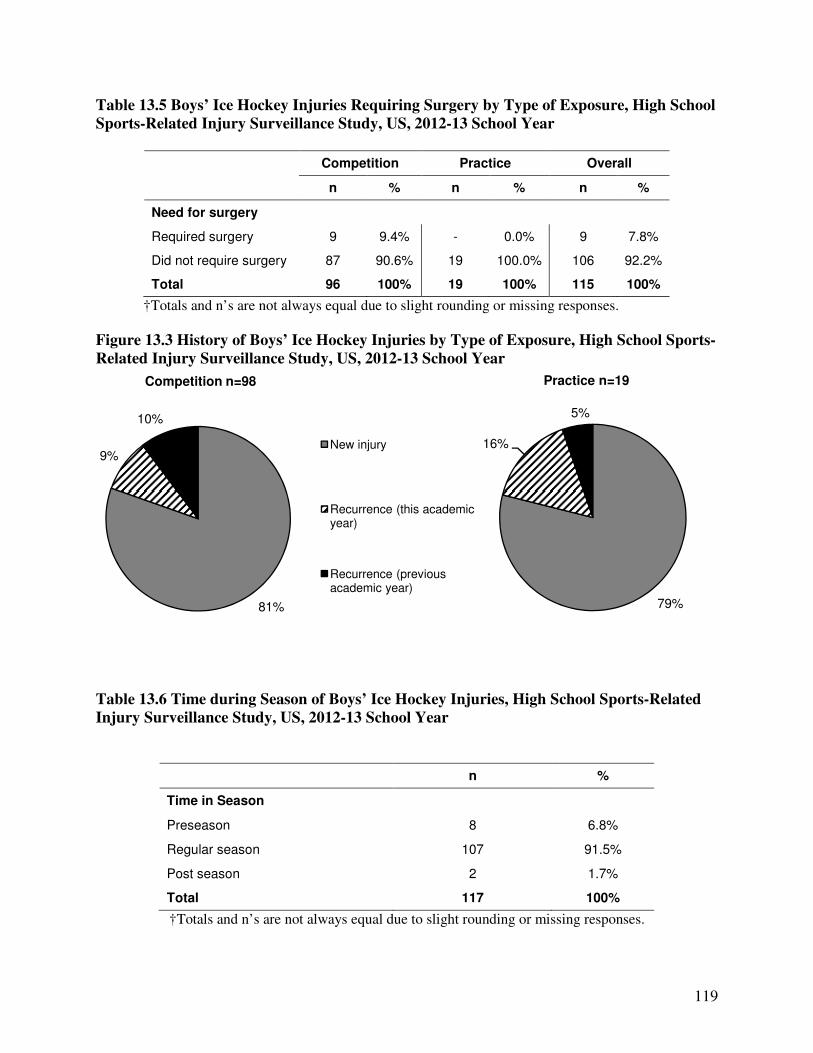
119
Table 13.5 Boys’ Ice Hockey Injuries Requiring Surgery by Type of Exposure, High School
Sports-Related Injury Surveillance Study, US, 2012-13 School Year
Competition Practice Overall
n % n % n %
Need for surgery
Required surgery 9 9.4% - 0.0% 9 7.8%
Did not require surgery 87 90.6% 19 100.0% 106 92.2%
Total 96 100% 19 100% 115 100%
†Totals and n’s are not always equal due to slight rounding or missing responses.
Figure 13.3 History of Boys’ Ice Hockey Injuries by Type of Exposure, High School Sports-
Related Injury Surveillance Study, US, 2012-13 School Year
Table 13.6 Time during Season of Boys’ Ice Hockey Injuries, High School Sports-Related
Injury Surveillance Study, US, 2012-13 School Year
n %
Time in Season
Preseason 8 6.8%
Regular season 107 91.5%
Post season 2 1.7%
Total 117 100%
†Totals and n’s are not always equal due to slight rounding or missing responses.
81%
9%
10%
Competition n=98
New injury
Recurrence (this academic year)
Recurrence (previous academic year)
79%
16%
5%
Practice n=19

120
Table 13.7 Competition-Related Variables for Boys’ Ice Hockey Injuries, High School
Sports-Related Injury Surveillance Study, US, 2012-13 School Year
n %
Time in Competition
Warm-ups - 0.0%
First period 19 21.6%
Second period 41 46.6%
Third period 28 31.8%
Overtime - 0.0%
Total 88 100%
Rink Location
Between goal line and blue line 35 43.2%
Corner 18 22.2%
Neutral zone 14 17.3%
Behind goal 6 7.4%
Face-off circle 4 4.9%
Goal area 2 2.5%
Bench 1 1.2%
Other 1 1.2%
Total 81 100%
†Totals and n’s are not always equal due to slight rounding or missing responses.
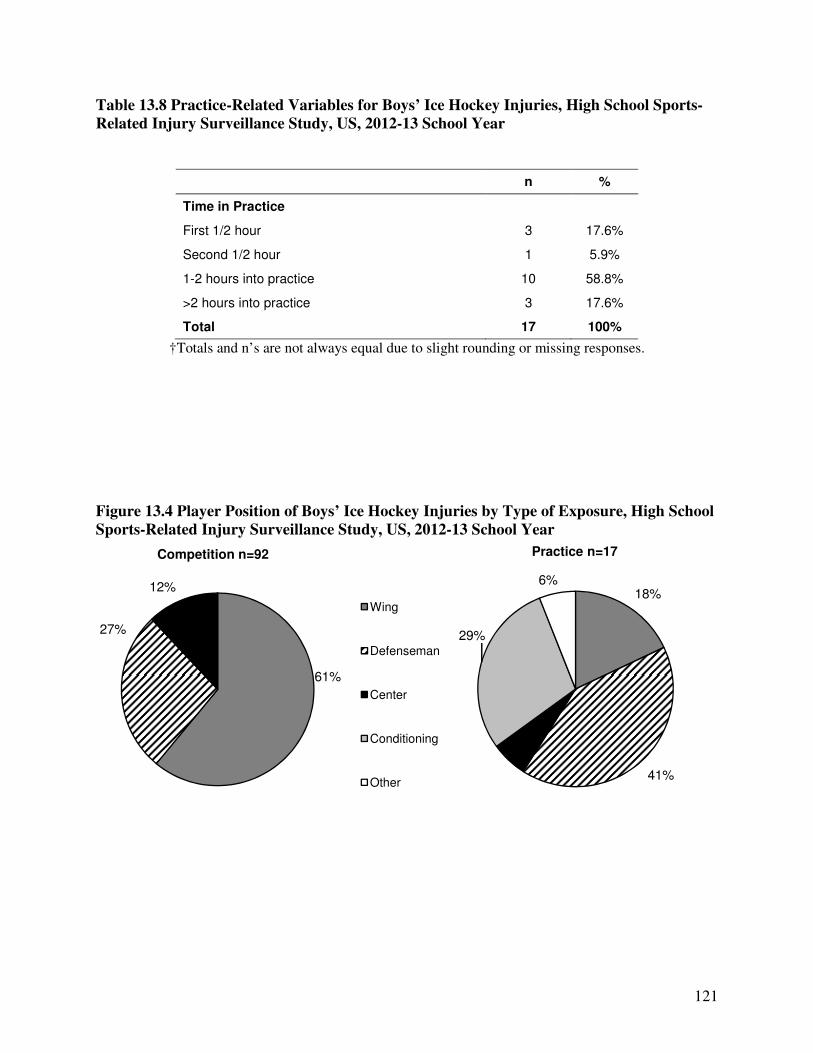
121
Table 13.8 Practice-Related Variables for Boys’ Ice Hockey Injuries, High School Sports-
Related Injury Surveillance Study, US, 2012-13 School Year
n %
Time in Practice
First 1/2 hour 3 17.6%
Second 1/2 hour 1 5.9%
1-2 hours into practice 10 58.8%
>2 hours into practice 3 17.6%
Total 17 100%
†Totals and n’s are not always equal due to slight rounding or missing responses.
Figure 13.4 Player Position of Boys’ Ice Hockey Injuries by Type of Exposure, High School
Sports-Related Injury Surveillance Study, US, 2012-13 School Year
61%
27%
12%
Competition n=92
Wing
Defenseman
Center
Conditioning
Other
18%
41%
29%
6%
Practice n=17
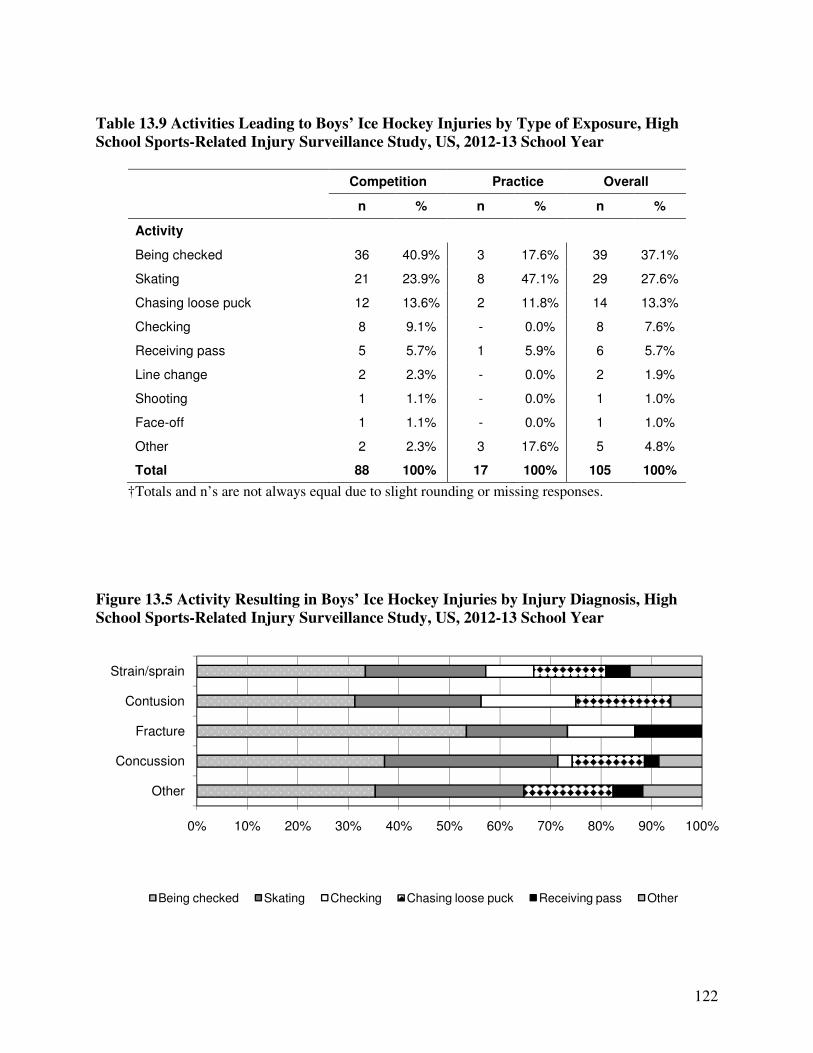
122
Table 13.9 Activities Leading to Boys’ Ice Hockey Injuries by Type of Exposure, High
School Sports-Related Injury Surveillance Study, US, 2012-13 School Year
Competition Practice Overall
n % n % n %
Activity
Being checked 36 40.9% 3 17.6% 39 37.1%
Skating 21 23.9% 8 47.1% 29 27.6%
Chasing loose puck 12 13.6% 2 11.8% 14 13.3%
Checking 8 9.1% - 0.0% 8 7.6%
Receiving pass 5 5.7% 1 5.9% 6 5.7%
Line change 2 2.3% - 0.0% 2 1.9%
Shooting 1 1.1% - 0.0% 1 1.0%
Face-off 1 1.1% - 0.0% 1 1.0%
Other 2 2.3% 3 17.6% 5 4.8%
Total 88 100% 17 100% 105 100%
†Totals and n’s are not always equal due to slight rounding or missing responses.
Figure 13.5 Activity Resulting in Boys’ Ice Hockey Injuries by Injury Diagnosis, High
School Sports-Related Injury Surveillance Study, US, 2012-13 School Year
0% 10% 20% 30% 40% 50% 60% 70% 80% 90% 100%
Other
Concussion
Fracture
Contusion
Strain/sprain
Being checked Skating Checking Chasing loose puck Receiving pass Other

123
XIV. Boys’ Lacrosse Injury Epidemiology

124
Table 14.1 Boys’ Lacrosse Injury Rates by Type of Exposure, High School Sports-Related
Injury Surveillance Study, US, 2012-13 School Year
# Injuries # Exposures Injury rate
(per 1,000 athlete-exposures)
Total 209 112,372 1.86
Competition 132 35,268 3.74
Practice 77 77,104 1.00
Table 14.2 Demographic Characteristics of Injured Boys’ Lacrosse Athletes, High School
Sports-Related Injury Surveillance Study, US, 2012-13 School Year*
Year in School n=206
Freshman 18.9%
Sophomore 25.2%
Junior 26.2%
Senior 29.6%
Total† 100%
Age (years)
Minimum 13
Maximum 20
Mean (St. Dev.) 16.3 (1.4)
BMI
Minimum 17.4
Maximum 34.5
Mean (St. Dev.) 24.0 (3.1)
*All analyses in this chapter present un-weighted data. †Throughout this report, totals and n’s represent the total un-weighted number of injury reports containing a valid response for the particular question. Due to a low level of non-response, these totals are always similar but are not always equal to the total number of injuries.

125
Figure 14.1 Diagnosis of Boys’ Lacrosse Injuries by Type of Exposure, High School Sports-
Related Injury Surveillance Study, US, 2012-13 School Year
Table 14.3 Body Site of Boys’ Lacrosse Injuries by Type of Exposure, High School Sports-
Related Injury Surveillance Study, US, 2012-13 School Year
Competition Practice Overall
n % n % n %
Body Site
Head/face 45 34.4% 10 13.0% 55 26.4%
Knee 19 14.5% 12 15.6% 31 14.9%
Hip/thigh/upper leg 10 7.6% 12 15.6% 22 10.6%
Ankle 7 5.3% 11 14.3% 18 8.7%
Hand/wrist 10 7.6% 6 7.8% 16 7.7%
Shoulder 11 8.4% 4 5.2% 15 7.2%
Lower leg 4 3.1% 6 7.8% 10 4.8%
Trunk 5 3.8% 3 3.9% 8 3.8%
Arm/elbow 4 3.1% 2 2.6% 6 2.9%
Neck 3 2.3% 1 1.3% 4 1.9%
Foot 1 0.8% 1 1.3% 2 1.0%
Other 12 9.2% 9 11.7% 21 10.1%
Total 131 100% 77 100% 208 100%
†Totals and n’s are not always equal due to slight rounding or missing responses.
24%
17%
16%
30%
14%
Competition, n=132
Strain/sprain
Contusion
Fracture
Concussion
Other
36%
16%13%
12%
23%
Practice n=77

126
Table 14.4 Ten Most Common Boys’ Lacrosse Injury Diagnoses by Type of Exposure, High
School Sports-Related Injury Surveillance Study, US, 2012-13 School Year
Competition
n=131 Practice
n=77 Total n=208
n % n % n %
Diagnosis
Head/face concussion 38 29.0% 9 11.7% 47 22.6%
Hip/thigh/upper leg strain/sprain 6 4.6% 11 14.3% 17 8.2%
Knee strain/sprain 11 8.4% 5 6.5% 16 7.7%
Ankle strain/sprain 6 4.6% 9 11.7% 15 7.2%
Other fracture 7 5.3% 5 6.5% 12 5.8%
Hand/wrist fracture 8 6.1% 1 1.3% 9 4.3%
Knee other 3 2.3% 5 6.5% 8 3.8%
Shoulder other 5 3.8% 2 2.6% 7 3.4%
Lower leg other 0 0.0% 6 7.8% 6 2.9%
Shoulder strain/sprain 4 3.1% 1 1.3% 5 2.4%
Figure 14.2 Time Loss of Boys’ Lacrosse Injuries by Type of Exposure, High School
Sports-Related Injury Surveillance Study, US, 2012-13 School Year
*Other category is made up of medical disqualification for season, medical disqualification for career, athlete chooses not to continue, and season ended before athlete returned to play
8%
21%
10%
18%
11%
32%
Competition n=132
1-2 days
3-6 days
7-9 days
10-21 days
> 21 days
Other
17%
23%
14%
22%
3%
21%
Practice n=77

127
Table 14.5 Boys’ Lacrosse Injuries Requiring Surgery by Type of Exposure, High School
Sports-Related Injury Surveillance Study, US, 2012-13 School Year
Competition Practice Overall
n % n % n %
Need for surgery
Required surgery 17 13.1% 8 10.5% 25 12.1%
Did not require surgery 113 86.9% 68 89.5% 181 87.9%
Total 130 100% 76 100% 206 100%
†Totals and n’s are not always equal due to slight rounding or missing responses.
Figure 14.3 History of Boys’ Lacrosse Injuries by Type of Exposure, High School Sports-
Related Injury Surveillance Study, US, 2012-13 School Year
Table 14.6 Time during Season of Boys’ Lacrosse Injuries, High School Sports-Related
Injury Surveillance Study, US, 2012-13 School Year
n %
Time in Season
Preseason 43 20.6%
Regular season 165 78.9%
Post season 1 0.5%
Total 209 100%
†Totals and n’s are not always equal due to slight rounding or missing responses.
88%
6%6%
Competition n=129
New injury
Recurrence (this academic year)
Recurrence (previous academic year)
86%
10%4%
Practice n=77

128
Table 14.7 Competition-Related Variables for Boys’ Lacrosse Injuries, High School Sports-
Related Injury Surveillance Study, US, 2012-13 School Year
n %
Time in Competition
Pre-competition/warm-ups 2 1.6%
First quarter 7 5.6%
Second quarter 39 31.5%
Third quarter 42 33.9%
Fourth quarter 34 27.4%
Overtime - 0.0%
Total 124 100%
Field Location
Midfield 53 42.7%
Goal area 32 25.8%
Defensive area 29 23.4%
Wing area 10 8.1%
Sideline - 0.0%
Total 124 100%
†Totals and n’s are not always equal due to slight rounding or missing responses.
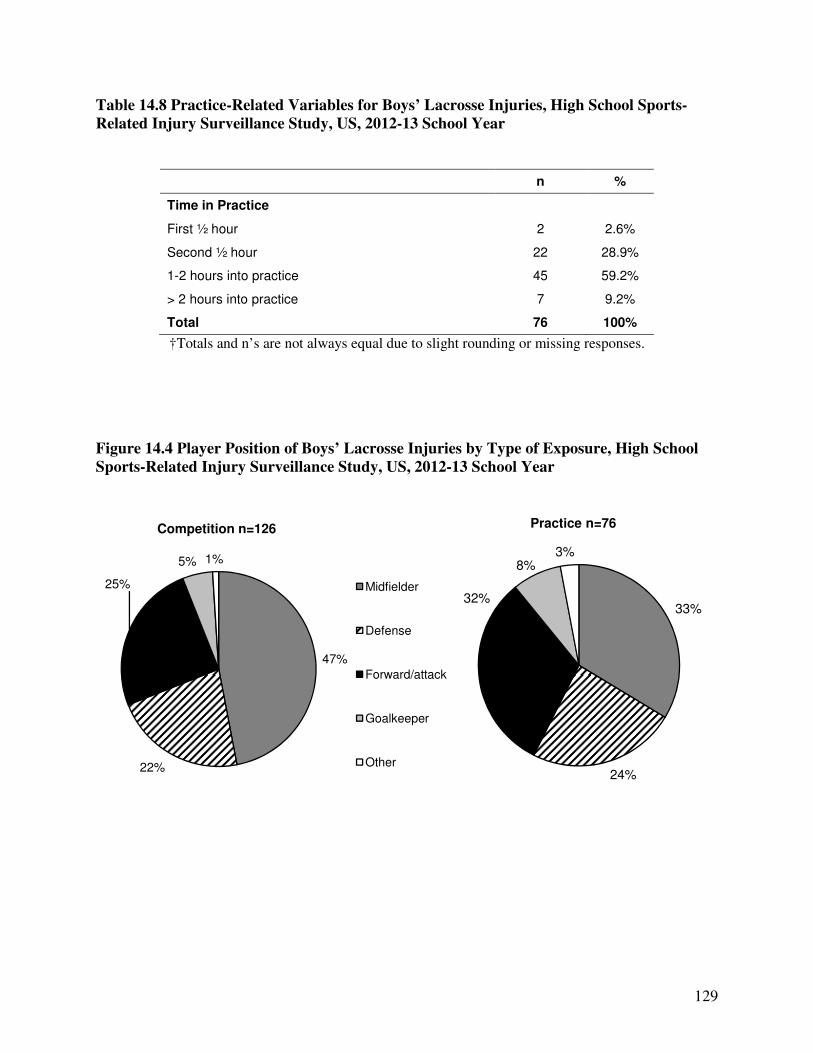
129
Table 14.8 Practice-Related Variables for Boys’ Lacrosse Injuries, High School Sports-
Related Injury Surveillance Study, US, 2012-13 School Year
n %
Time in Practice
First ½ hour 2 2.6%
Second ½ hour 22 28.9%
1-2 hours into practice 45 59.2%
> 2 hours into practice 7 9.2%
Total 76 100%
†Totals and n’s are not always equal due to slight rounding or missing responses.
Figure 14.4 Player Position of Boys’ Lacrosse Injuries by Type of Exposure, High School
Sports-Related Injury Surveillance Study, US, 2012-13 School Year
47%
22%
25%
5% 1%
Competition n=126
Midfielder
Defense
Forward/attack
Goalkeeper
Other
33%
24%
32%
3%
Practice n=76
8%

130
Table 14.9 Activities Leading to Boys’ Lacrosse Injuries by Type of Exposure, High School
Sports-Related Injury Surveillance Study, US, 2012-13 School Year
Competition Practice Overall
n % n % n %
Activity
General play 22 17.2% 21 27.6% 43 21.1%
Chasing loose ball 20 15.6% 4 5.3% 24 11.8%
Defending 12 9.4% 9 11.8% 21 10.3%
Body checking 13 10.2% 6 7.9% 19 9.3%
Being body checked 11 8.6% 5 6.6% 16 7.8%
Being crosse/stick checked 12 9.4% 4 5.3% 16 7.8%
Shooting 9 7.0% 5 6.6% 14 6.9%
Goaltending 6 4.7% 6 7.9% 12 5.9%
Ball handling/cradling 6 4.7% 5 6.6% 11 5.4%
Crosse/stick checking 6 4.7% - 0.0% 6 2.9%
Conditioning - 0.0% 5 6.6% 5 2.5%
Passing 3 2.3% 1 1.3% 4 2.0%
Receiving pass 3 2.3% - 0.0% 3 1.5%
Face-off 2 1.6% - 0.0% 2 1.0%
Blocking shot 1 0.8% 1 1.3% 2 1.0%
Other 2 1.6% 4 5.3% 6 2.9%
Total 128 100% 76 100% 204 100%
†Totals and n’s are not always equal due to slight rounding or missing responses.
Figure 14.5 Activity Resulting in Boys’ Lacrosse Injuries by Injury Diagnosis, High School
Sports-Related Injury Surveillance Study, US, 2012-13 School Year
0% 10% 20% 30% 40% 50% 60% 70% 80% 90% 100%
Other
Concussion
Fracture
Contusion
Strain/sprain
General play Defending Body checking Being body checked Ball handling/cradling Other
131
XV. Girls’ Lacrosse Injury Epidemiology

132
Table 15.1 Girls’ Lacrosse Injury Rates by Type of Exposure, High School Sports-Related
Injury Surveillance Study, US, 2012-13 School Year
# Injuries # Exposures Injury rate
(per 1,000 athlete-exposures)
Total 102 82,424 1.24
Competition 65 26,995 2.41
Practice 37 55,429 0.67
Table 15.2 Demographic Characteristics of Injured Girls’ Lacrosse Athletes, High School
Sports-Related Injury Surveillance Study, US, 2012-13 School Year*
Year in School n=99
Freshman 18.2%
Sophomore 31.3%
Junior 32.3%
Senior 18.2%
Total 100%
Age (years)
Minimum 14
Maximum 18
Mean (St. Dev.) 16.0 (1.0)
BMI
Minimum 16.2
Maximum 31.3
Mean (St. Dev.) 21.8 (3.3)
*All analyses in this chapter present un-weighted data. †Throughout this report, totals and n’s represent the total un-weighted number of injury reports containing a valid response for the particular question. Due to a low level of non-response, these totals are always similar but are not always equal to the total number of injuries.

133
Figure 15.1 Diagnosis of Girls’ Lacrosse Injuries by Type of Exposure, High School Sports-
Related Injury Surveillance Study, US, 2012-13 School Year
Table 15.3 Body Site of Girls’ Lacrosse Injuries by Type of Exposure, High School Sports-
Related Injury Surveillance Study, US, 2012-13 School Year
Competition Practice Overall
n % n % n %
Body Site
Head/face 32 49.2% 4 10.8% 36 35.3%
Ankle 9 13.8% 11 29.7% 20 19.6%
Knee 9 13.8% 5 13.5% 14 13.7%
Hip/thigh/upper leg 4 6.2% 7 18.9% 11 10.8%
Lower leg 3 4.6% 2 5.4% 5 4.9%
Hand/wrist 3 4.6% 1 2.7% 4 3.9%
Foot - 0.0% 4 10.8% 4 3.9%
Arm/elbow 2 3.1% - 0.0% 2 2.0%
Shoulder 2 3.1% - 0.0% 2 2.0%
Other 1 1.5% 1 2.7% 2 2.0%
Trunk - 0.0% 1 2.7% 1 1.0%
Neck - 0.0% 1 2.7% 1 1.0%
Total 65 100% 37 100% 102 100%
†Totals and n’s are not always equal due to slight rounding or missing responses.
34%
5%
8%
44%
9%
Competition n=65
Strain/sprain
Contusion
Fracture
Concussion
Other
52%
5%8%
11%
24%
Practice n=37

134
Table 15.4 Ten Most Common Girls’ Lacrosse Injury Diagnoses by Type of Exposure,
High School Sports-Related Injury Surveillance Study, US, 2012-13 School Year
Competition
n=65 Practice
n=37 Total n=102
n % n % n %
Diagnosis
Head/face concussion 29 44.6% 4 10.8% 33 32.4%
Ankle strain/sprain 7 10.8% 10 27.0% 17 16.7%
Hip/thigh/upper leg strain/sprain 4 6.2% 7 18.9% 11 10.8%
Knee strain/sprain 7 10.8% 1 2.7% 8 7.8%
Knee other 2 3.1% 4 10.8% 6 5.9%
Hand/wrist fracture 2 3.1% 1 2.7% 3 2.9%
Lower leg strain/sprain 3 4.6% - 0.0% 3 2.9%
Ankle fracture 2 3.1% - 0.0% 2 2.0%
Head/face other 2 3.1% - 0.0% 2 2.0%
Foot other - 0.0% 2 5.4% 2 2.0%
Figure 15.2 Time Loss of Girls’ Lacrosse Injuries by Type of Exposure, High School
Sports-Related Injury Surveillance Study, US, 2012-13 School Year
*Other category is made up of medical disqualification for season, medical disqualification for career, athlete chooses not to continue, and season ended before athlete returned to play
8%
20%
18%
3%
23%
Competition n=65
1-2 days
3-6 days
7-9 days
10-21 days
> 21 days
Other
8%
38%
8%
24%
6%
16%
Practice n=37

135
8%
Table 15.5 Girls’ Lacrosse Injuries Requiring Surgery by Type of Exposure, High School
Sports-Related Injury Surveillance Study, US, 2012-13 School Year
Competition Practice Overall
n % n % n %
Need for surgery
Required surgery 4 6.5% 2 5.6% 6 6.1%
Did not require surgery 58 93.5% 34 94.4% 92 93.9%
Total 62 100% 36 100% 98 100%
†Totals and n’s are not always equal due to slight rounding or missing responses.
Figure 15.3 History of Girls’ Lacrosse Injuries by Type of Exposure, High School Sports-
Related Injury Surveillance Study, US, 2012-13 School Year
Table 15.6 Time during Season of Girls’ Lacrosse Injuries, High School Sports-Related
Injury Surveillance Study, US, 2012-13 School Year
n %
Time in Season
Preseason 18 17.6%
Regular season 84 82.4%
Post season - 0.0%
Total 102 100%
†Totals and n’s are not always equal due to slight rounding or missing responses.
89%
3%
Competition n=63
New injury
Recurrence (this academic year)
Recurrence (previous academic year)
81%
8%
11%
Practice n=36
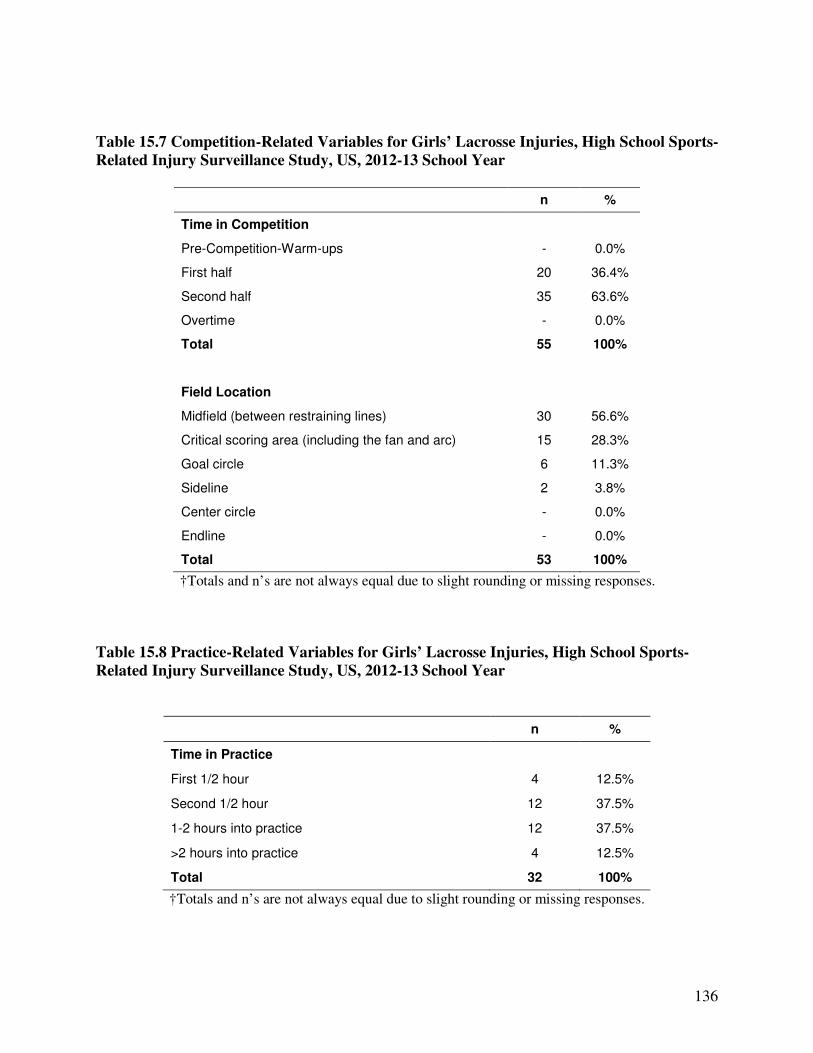
136
Table 15.7 Competition-Related Variables for Girls’ Lacrosse Injuries, High School Sports-
Related Injury Surveillance Study, US, 2012-13 School Year
n %
Time in Competition
Pre-Competition-Warm-ups - 0.0%
First half 20 36.4%
Second half 35 63.6%
Overtime - 0.0%
Total 55 100%
Field Location
Midfield (between restraining lines) 30 56.6%
Critical scoring area (including the fan and arc) 15 28.3%
Goal circle 6 11.3%
Sideline 2 3.8%
Center circle - 0.0%
Endline - 0.0%
Total 53 100%
†Totals and n’s are not always equal due to slight rounding or missing responses.
Table 15.8 Practice-Related Variables for Girls’ Lacrosse Injuries, High School Sports-
Related Injury Surveillance Study, US, 2012-13 School Year
n %
Time in Practice
First 1/2 hour 4 12.5%
Second 1/2 hour 12 37.5%
1-2 hours into practice 12 37.5%
>2 hours into practice 4 12.5%
Total 32 100%
†Totals and n’s are not always equal due to slight rounding or missing responses.
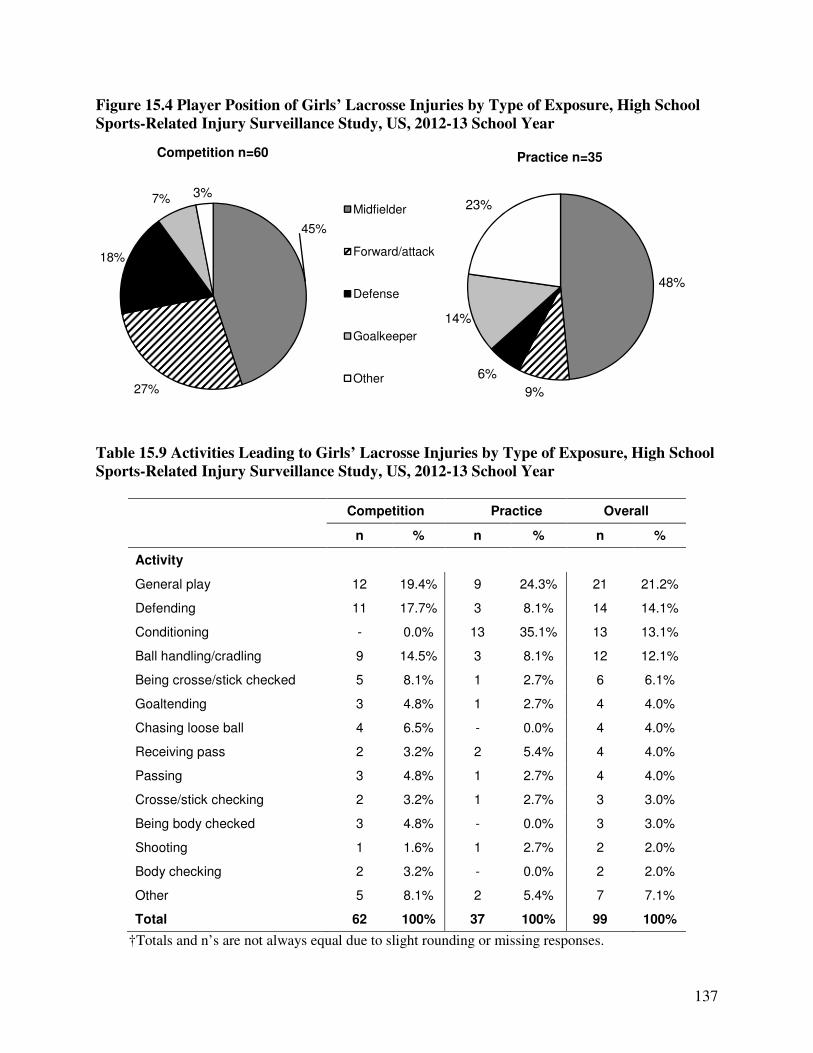
137
Figure 15.4 Player Position of Girls’ Lacrosse Injuries by Type of Exposure, High School
Sports-Related Injury Surveillance Study, US, 2012-13 School Year
Table 15.9 Activities Leading to Girls’ Lacrosse Injuries by Type of Exposure, High School
Sports-Related Injury Surveillance Study, US, 2012-13 School Year
Competition Practice Overall
n % n % n %
Activity
General play 12 19.4% 9 24.3% 21 21.2%
Defending 11 17.7% 3 8.1% 14 14.1%
Conditioning - 0.0% 13 35.1% 13 13.1%
Ball handling/cradling 9 14.5% 3 8.1% 12 12.1%
Being crosse/stick checked 5 8.1% 1 2.7% 6 6.1%
Goaltending 3 4.8% 1 2.7% 4 4.0%
Chasing loose ball 4 6.5% - 0.0% 4 4.0%
Receiving pass 2 3.2% 2 5.4% 4 4.0%
Passing 3 4.8% 1 2.7% 4 4.0%
Crosse/stick checking 2 3.2% 1 2.7% 3 3.0%
Being body checked 3 4.8% - 0.0% 3 3.0%
Shooting 1 1.6% 1 2.7% 2 2.0%
Body checking 2 3.2% - 0.0% 2 2.0%
Other 5 8.1% 2 5.4% 7 7.1%
Total 62 100% 37 100% 99 100%
†Totals and n’s are not always equal due to slight rounding or missing responses.
45%
27%
18%
7%
Competition n=60
Midfielder
Forward/attack
Defense
Goalkeeper
Other
48%
9%
6%
14%
23%
Practice n=35
3%
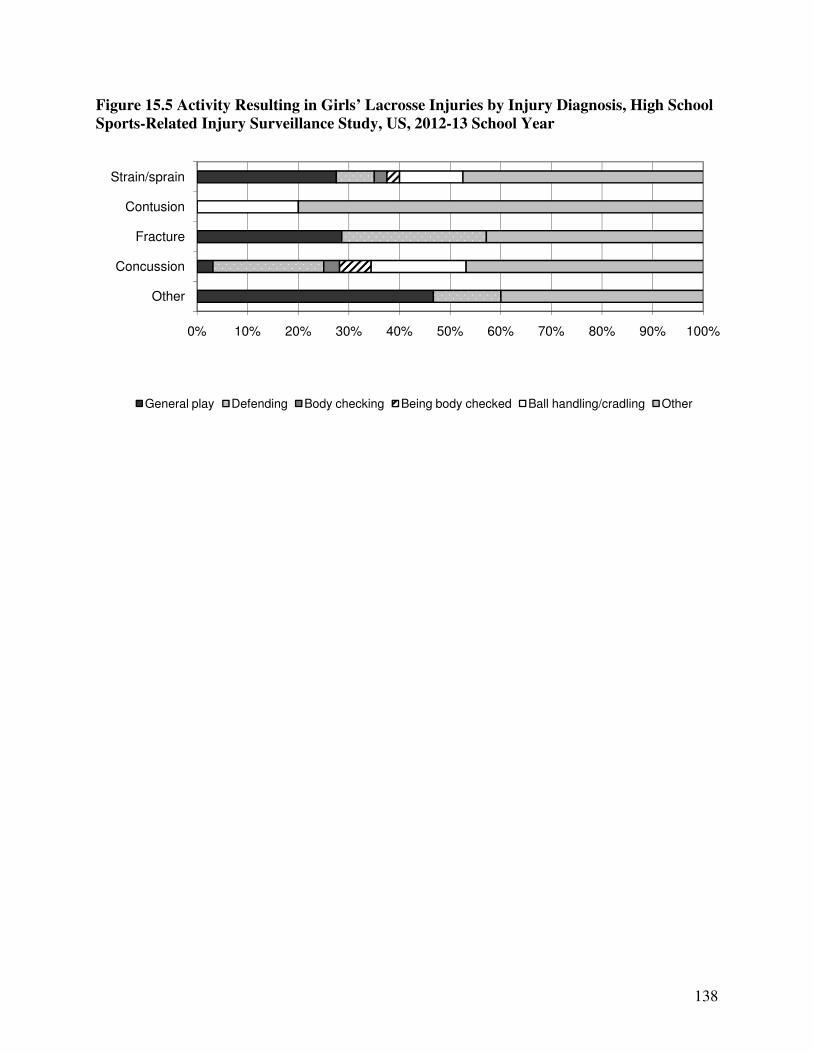
138
Figure 15.5 Activity Resulting in Girls’ Lacrosse Injuries by Injury Diagnosis, High School
Sports-Related Injury Surveillance Study, US, 2012-13 School Year
0% 10% 20% 30% 40% 50% 60% 70% 80% 90% 100%
Other
Concussion
Fracture
Contusion
Strain/sprain
General play Defending Body checking Being body checked Ball handling/cradling Other

139
XVI. Boys’ Swimming and Diving Injury Epidemiology

140
Table 16.1 Boys’ Swimming and Diving Injury Rates by Type of Exposure, High School
Sports-Related Injury Surveillance Study, US, 2012-13 School Year
# Injuries # Exposures Injury rate
(per 1,000 athlete-exposures)
Total 12 105,362 0.11
Competition 1 18,773 0.05
Practice 11 86,589 0.13
Table 16.2 Demographic Characteristics of Injured Boys’ Swimming and Diving Athletes,
High School Sports-Related Injury Surveillance Study, US, 2012-13 School Year*
Year in School n=11
Freshman 18.2%
Sophomore 36.4%
Junior 9.1%
Senior 36.4%
Total† 100%
Age (years)
Minimum 14
Maximum 18
Mean (St. Dev.) 15.7 (1.3)
BMI
Minimum 20.7
Maximum 25.1
Mean (St. Dev.) 22.1 (1.4)
*All analyses in this chapter present un-weighted data. †Throughout this report, totals and n’s represent the total un-weighted number of injury reports containing a valid response for the particular question. Due to a low level of non-response, these totals are always similar but are not always equal to the total number of injuries.

141
Figure 16.1 Diagnosis of Boys’ Swimming and Diving Injuries by Type of Exposure, High
School Sports-Related Injury Surveillance Study, US, 2012-13 School Year
Table 16.3 Body Site of Boys’ Swimming and Diving Injuries by Type of Exposure, High
School Sports-Related Injury Surveillance Study, US, 2012-13 School Year
Competition Practice Overall
n % n % n %
Body Site
Shoulder - 0.0% 6 54.5% 6 50.0%
Head/face - 0.0% 2 18.2% 2 16.7%
Knee - 0.0% 2 18.2% 2 16.7%
Hip/thigh/upper leg 1 100.0% - 0.0% 1 8.3%
Lower leg - 0.0% 1 9.1% 1 8.3%
Total 1 100% 11 100% 12 100%
†Totals and n’s are not always equal due to slight rounding or missing responses.
100%
Competition n=1
Strain/sprain
Concussion
Other
27%55%
Practice n=11
18%
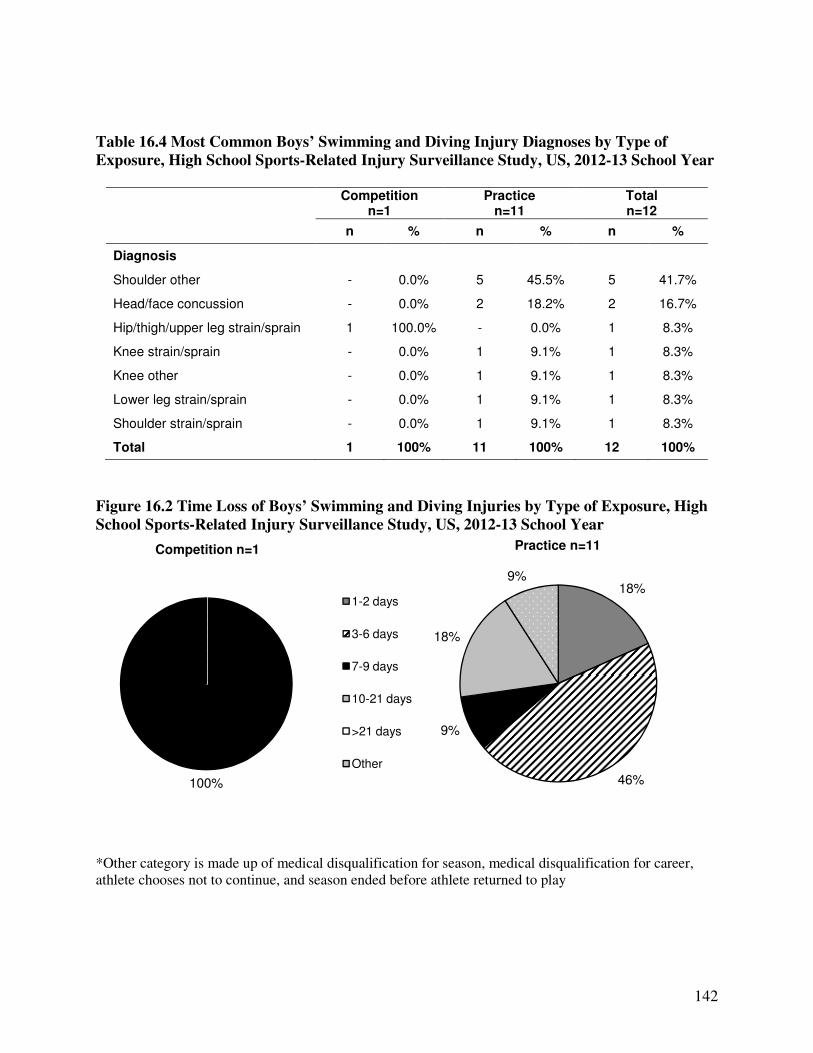
142
Table 16.4 Most Common Boys’ Swimming and Diving Injury Diagnoses by Type of
Exposure, High School Sports-Related Injury Surveillance Study, US, 2012-13 School Year
Competition
n=1 Practice
n=11 Total n=12
n % n % n %
Diagnosis
Shoulder other - 0.0% 5 45.5% 5 41.7%
Head/face concussion - 0.0% 2 18.2% 2 16.7%
Hip/thigh/upper leg strain/sprain 1 100.0% - 0.0% 1 8.3%
Knee strain/sprain - 0.0% 1 9.1% 1 8.3%
Knee other - 0.0% 1 9.1% 1 8.3%
Lower leg strain/sprain - 0.0% 1 9.1% 1 8.3%
Shoulder strain/sprain - 0.0% 1 9.1% 1 8.3%
Total 1 100% 11 100% 12 100%
Figure 16.2 Time Loss of Boys’ Swimming and Diving Injuries by Type of Exposure, High
School Sports-Related Injury Surveillance Study, US, 2012-13 School Year
*Other category is made up of medical disqualification for season, medical disqualification for career, athlete chooses not to continue, and season ended before athlete returned to play
100%
Competition n=1
1-2 days
3-6 days
7-9 days
10-21 days
>21 days
Other
18%
46%
9%
18%
9%
Practice n=11
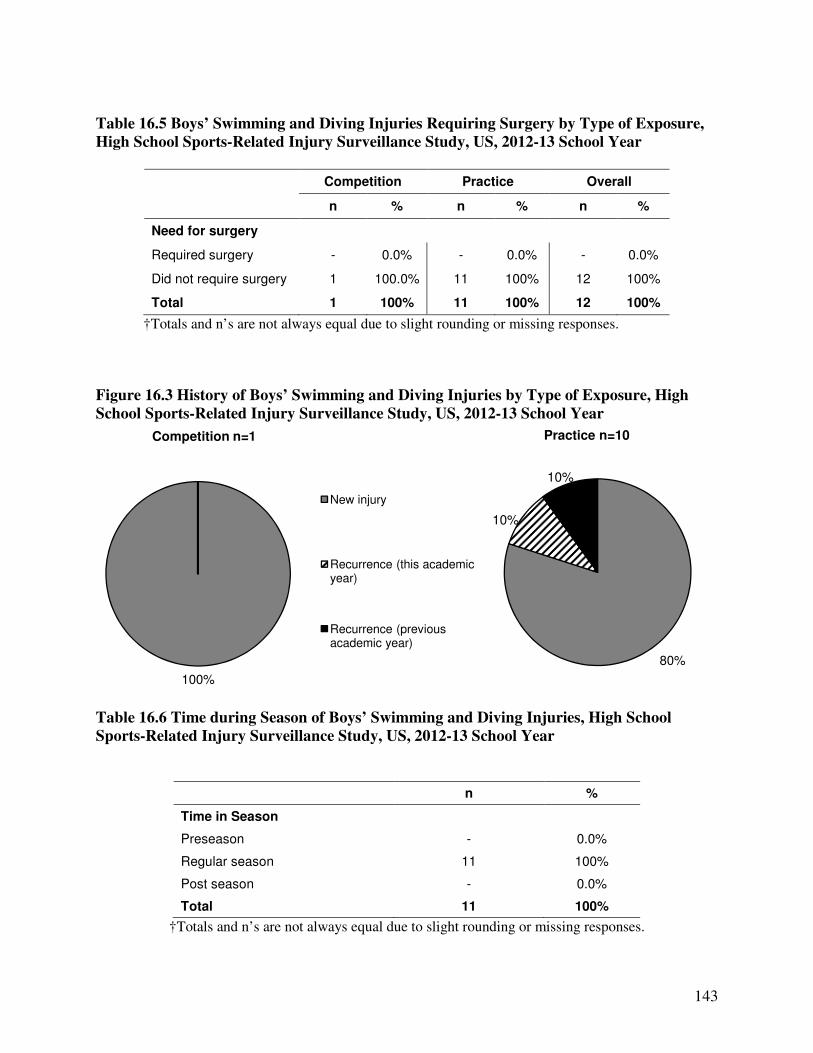
143
10%
10%
Table 16.5 Boys’ Swimming and Diving Injuries Requiring Surgery by Type of Exposure,
High School Sports-Related Injury Surveillance Study, US, 2012-13 School Year
Competition Practice Overall
n % n % n %
Need for surgery
Required surgery - 0.0% - 0.0% - 0.0%
Did not require surgery 1 100.0% 11 100% 12 100%
Total 1 100% 11 100% 12 100%
†Totals and n’s are not always equal due to slight rounding or missing responses.
Figure 16.3 History of Boys’ Swimming and Diving Injuries by Type of Exposure, High
School Sports-Related Injury Surveillance Study, US, 2012-13 School Year
Table 16.6 Time during Season of Boys’ Swimming and Diving Injuries, High School
Sports-Related Injury Surveillance Study, US, 2012-13 School Year
n %
Time in Season
Preseason - 0.0%
Regular season 11 100%
Post season - 0.0%
Total 11 100%
†Totals and n’s are not always equal due to slight rounding or missing responses.
100%
Competition n=1
New injury
Recurrence (this academic year)
Recurrence (previous academic year)
80%
Practice n=10
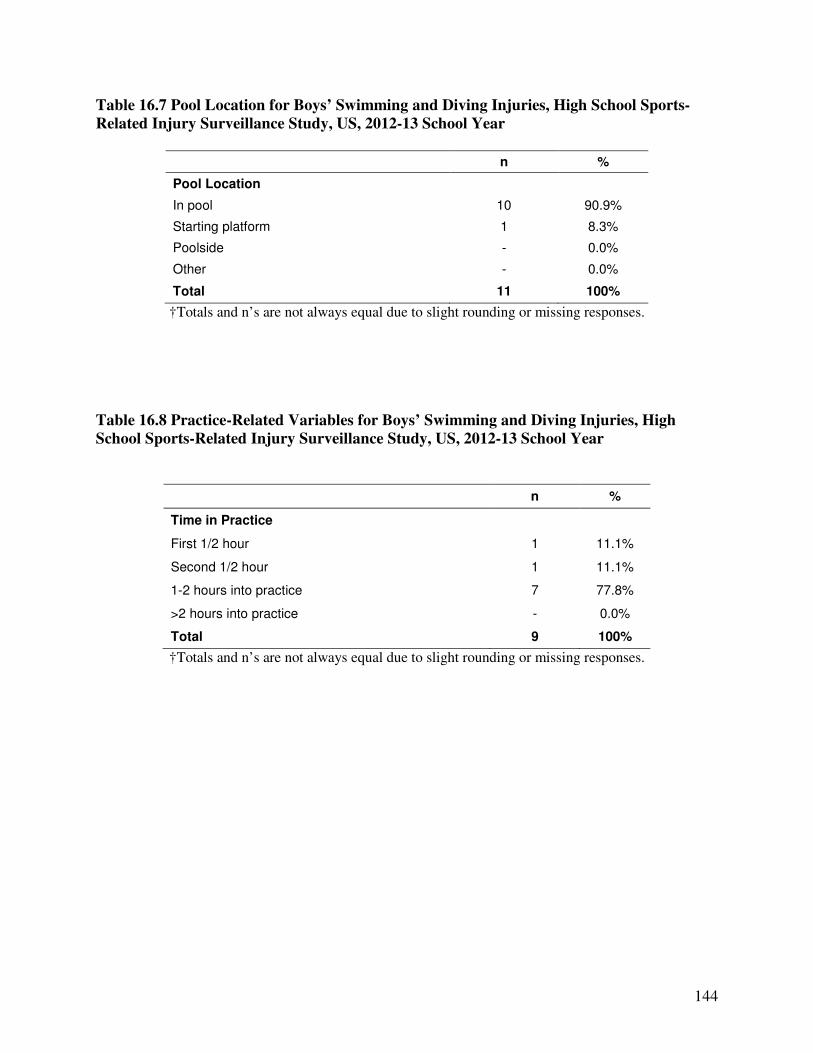
144
Table 16.7 Pool Location for Boys’ Swimming and Diving Injuries, High School Sports-
Related Injury Surveillance Study, US, 2012-13 School Year
n %
Pool Location
In pool 10 90.9%
Starting platform 1 8.3%
Poolside - 0.0%
Other - 0.0%
Total 11 100%
†Totals and n’s are not always equal due to slight rounding or missing responses.
Table 16.8 Practice-Related Variables for Boys’ Swimming and Diving Injuries, High
School Sports-Related Injury Surveillance Study, US, 2012-13 School Year
n %
Time in Practice
First 1/2 hour 1 11.1%
Second 1/2 hour 1 11.1%
1-2 hours into practice 7 77.8%
>2 hours into practice - 0.0%
Total 9 100%
†Totals and n’s are not always equal due to slight rounding or missing responses.

145
Table 16.9 Activities Leading to Boys’ Swimming and Diving Injuries by Type of Exposure,
High School Sports-Related Injury Surveillance Study, US, 2012-13 School Year
Competition Practice Overall
n % n % n %
Activity
Swimming - 0.0% 10 100.0% 10 90.9%
Start 1 100.0% - 0.0% 1 9.1%
Total 1 100% 11 100% 11 100%
†Totals and n’s are not always equal due to slight rounding or missing responses.
Figure 16.4 Activity Resulting in Boys’ Swimming and Diving Injuries by Injury Diagnosis,
High School Sports-Related Injury Surveillance Study, US, 2012-13 School Year
0% 10% 20% 30% 40% 50% 60% 70% 80% 90% 100%
Other
Concussion
Strain/sprain
Start Swimming
146
XVII. Girls’ Swimming and Diving Injury Epidemiology

147
Table 17.1 Girls’ Swimming and Diving Injury Rates by Type of Exposure, High School
Sports-Related Injury Surveillance Study, US, 2012-13 School Year
# Injuries # Exposures Injury rate
(per 1,000 athlete-exposures)
Total 30 114,803 0.26
Competition 10 21,033 0.48
Practice 20 93,770 0.21
Table 17.2 Demographic Characteristics of Injured Girls’ Swimming and Diving Athletes,
High School Sports-Related Injury Surveillance Study, US, 2012-13 School Year*
Year in School n=29
Freshman 27.6%
Sophomore 34.5%
Junior 24.1%
Senior 13.8%
Total† 100%
Age (years)
Minimum 14
Maximum 17
Mean (St. Dev.) 15.3 (1.1)
BMI
Minimum 18.3
Maximum 35.2
Mean (St. Dev.) 21.3 (3.6)
*All analyses in this chapter present un-weighted data. †Throughout this report, totals and n’s represent the total un-weighted number of injury reports containing a valid response for the particular question. Due to a low level of non-response, these totals are always similar but are not always equal to the total number of injuries.
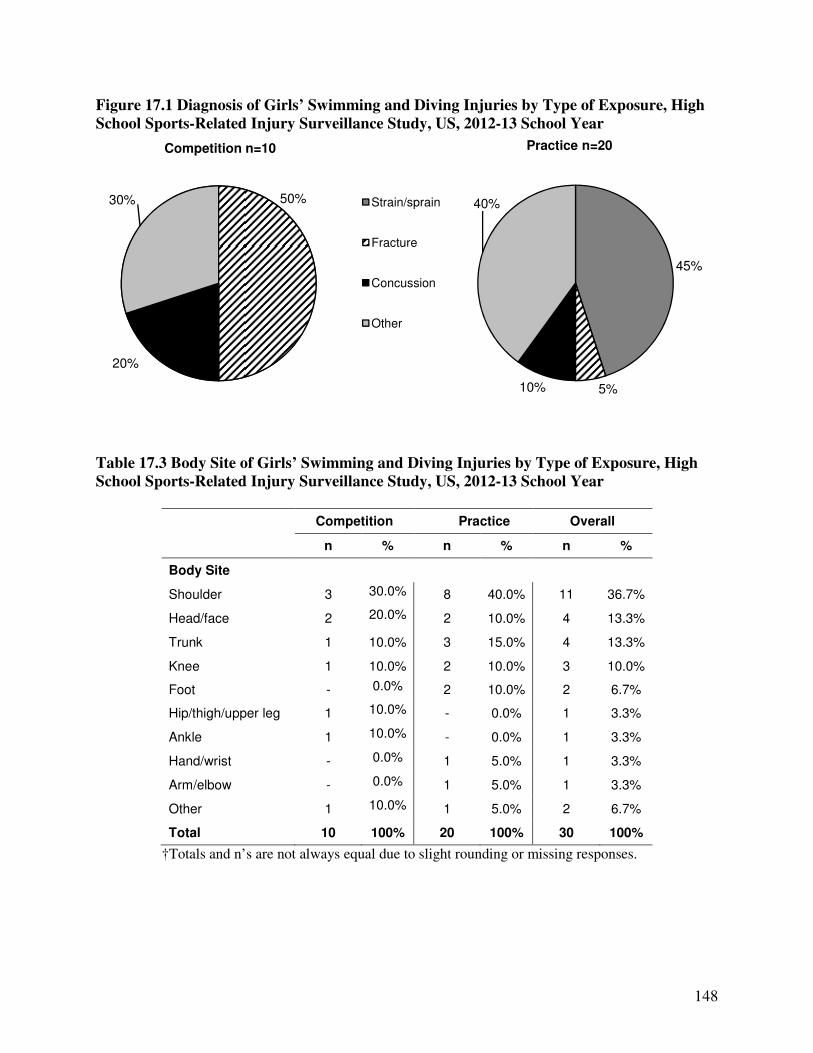
148
Figure 17.1 Diagnosis of Girls’ Swimming and Diving Injuries by Type of Exposure, High
School Sports-Related Injury Surveillance Study, US, 2012-13 School Year
Table 17.3 Body Site of Girls’ Swimming and Diving Injuries by Type of Exposure, High
School Sports-Related Injury Surveillance Study, US, 2012-13 School Year
Competition Practice Overall
n % n % n %
Body Site
Shoulder 3 30.0% 8 40.0% 11 36.7%
Head/face 2 20.0% 2 10.0% 4 13.3%
Trunk 1 10.0% 3 15.0% 4 13.3%
Knee 1 10.0% 2 10.0% 3 10.0%
Foot - 0.0% 2 10.0% 2 6.7%
Hip/thigh/upper leg 1 10.0% - 0.0% 1 3.3%
Ankle 1 10.0% - 0.0% 1 3.3%
Hand/wrist - 0.0% 1 5.0% 1 3.3%
Arm/elbow - 0.0% 1 5.0% 1 3.3%
Other 1 10.0% 1 5.0% 2 6.7%
Total 10 100% 20 100% 30 100%
†Totals and n’s are not always equal due to slight rounding or missing responses.
30%
Competition n=10
Strain/sprain
Fracture
Concussion
Other
45%
5%
40%
Practice n=20
20%
50%
10%

149
Table 17.4 Ten Most Common Girls’ Swimming and Diving Injury Diagnoses by Type of
Exposure, High School Sports-Related Injury Surveillance Study, US, 2012-13 School Year
Competition
n=10 Practice
n=20 Total n=30
n % n % n %
Diagnosis
Shoulder other 1 10.0% 5 25.0% 6 20.0%
Shoulder strain/sprain 2 20.0% 3 15.0% 5 16.7%
Head/face concussion 2 20.0% 2 10.0% 4 13.3%
Trunk strain/sprain 1 10.0% 3 15.0% 4 13.3%
Knee other 1 10.0% 1 5.0% 2 6.7%
Hip/thigh/upper leg strain/sprain 1 10.0% - 0.0% 1 3.3%
Knee strain/sprain - 0.0% 1 5.0% 1 3.3%
Ankle strain/sprain 1 10% - 0.0% 1 3.3%
Foot fracture - 0.0% 1 5.0% 1 3.3%
Arm/elbow strain/sprain - 0.0% 1 5.0% 1 3.3%
Figure 17.2 Time Loss of Girls’ Swimming and Diving Injuries by Type of Exposure, High
School Sports-Related Injury Surveillance Study, US, 2012-13 School Year
*Other category is made up of medical disqualification for season, medical disqualification for career, athlete chooses not to continue, and season ended before athlete returned to play
20%
10%
Competition n=10
1-2 days
3-6 days
7-9 days
10-21 days
>21 days
Other
15%
40%15%
20%
0%10%
Practice n=20
10%
10% 50%
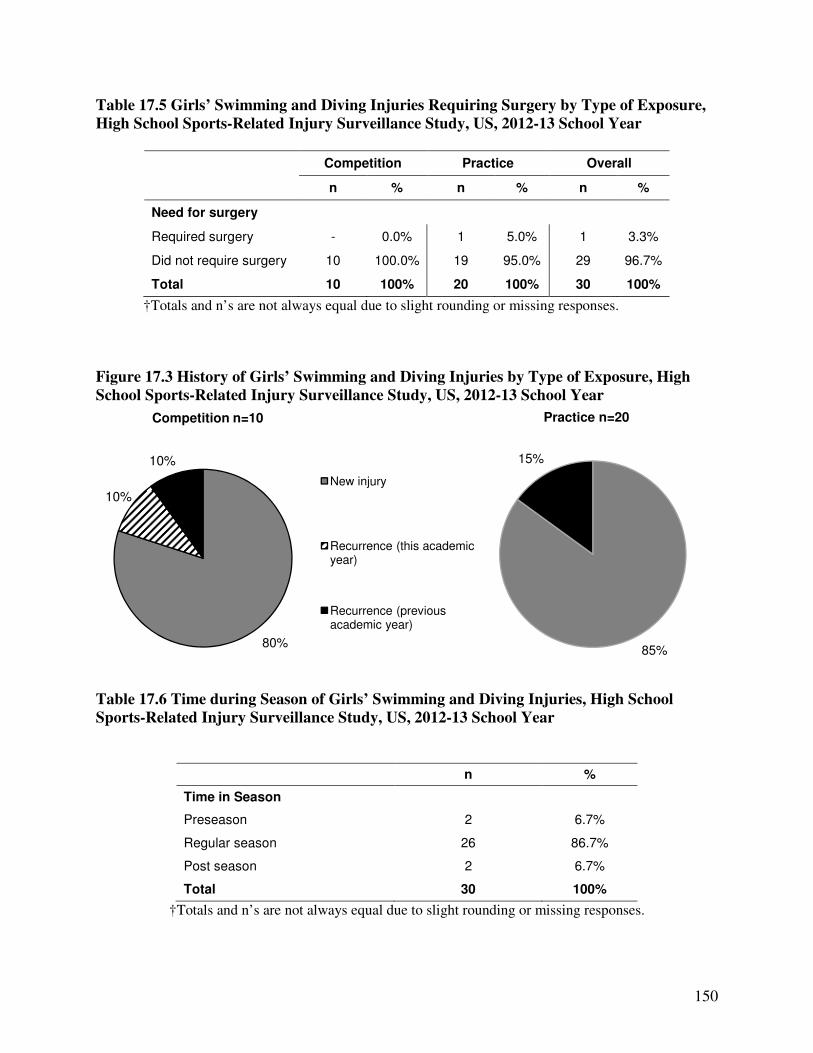
150
Table 17.5 Girls’ Swimming and Diving Injuries Requiring Surgery by Type of Exposure,
High School Sports-Related Injury Surveillance Study, US, 2012-13 School Year
Competition Practice Overall
n % n % n %
Need for surgery
Required surgery - 0.0% 1 5.0% 1 3.3%
Did not require surgery 10 100.0% 19 95.0% 29 96.7%
Total 10 100% 20 100% 30 100%
†Totals and n’s are not always equal due to slight rounding or missing responses.
Figure 17.3 History of Girls’ Swimming and Diving Injuries by Type of Exposure, High
School Sports-Related Injury Surveillance Study, US, 2012-13 School Year
Table 17.6 Time during Season of Girls’ Swimming and Diving Injuries, High School
Sports-Related Injury Surveillance Study, US, 2012-13 School Year
n %
Time in Season
Preseason 2 6.7%
Regular season 26 86.7%
Post season 2 6.7%
Total 30 100%
†Totals and n’s are not always equal due to slight rounding or missing responses.
80%
Competition n=10
New injury
Recurrence (this academic year)
Recurrence (previous academic year)
85%
15%
Practice n=20
10%
10%

151
Table 17.7 Competition-Related Variables for Girls’ Swimming and Diving Injuries, High
School Sports-Related Injury Surveillance Study, US, 2012-13 School Year
n %
Pool Location
In pool 23 79.3%
Starting platform/board/blocks 4 13.8%
Poolside 2 6.9%
Other - 0.0%
Total 29 100%
†Totals and n’s are not always equal due to slight rounding or missing responses.
Table 17.8 Practice-Related Variables for Girls’ Swimming and Diving Injuries, High
School Sports-Related Injury Surveillance Study, US, 2012-13 School Year
N %
Time in Practice
First 1/2 hour 2 10.5%
Second 1/2 hour 3 15.8%
1-2 hours into practice 13 68.4%
>2 hours into practice 1 5.3%
Total 19 100%
†Totals and n’s are not always equal due to slight rounding or missing responses.
Table 17.9 Activities Leading to Girls’ Swimming and Diving Injuries by Type of
Exposure, High School Sports-Related Injury Surveillance Study, US, 2012-13 School Year
Competition Practice Overall
n % N % n %
Activity
Swimming 8 80.0% 9 50.0% 17 60.7%
Diving off board/platform/block 2 20.0% 3 16.7% 5 17.9%
Flip turn off wall - 0.0% 1 5.6% 1 3.6%
Touch turn off wall - 0.0% 1 5.6% 1 3.6%
Other - 0.0% 3 16.7% 3 10.7%
Total 10 100% 18 100% 28 100%
†Totals and n’s are not always equal due to slight rounding or missing responses.

152
Figure 17.4 Activity Resulting in Girls’ Swimming and Diving Injuries by Injury Diagnosis,
High School Sports-Related Injury Surveillance Study, US, 2012-13 School Year
0% 10% 20% 30% 40% 50% 60% 70% 80% 90% 100%
Other
Concussion
Contusion
Strain/sprain
Diving off board/platform/starting platform Swimming Touch turn off wall Flip turn off wall Other

153
XVIII. Boys’ Track and Field Injury Epidemiology
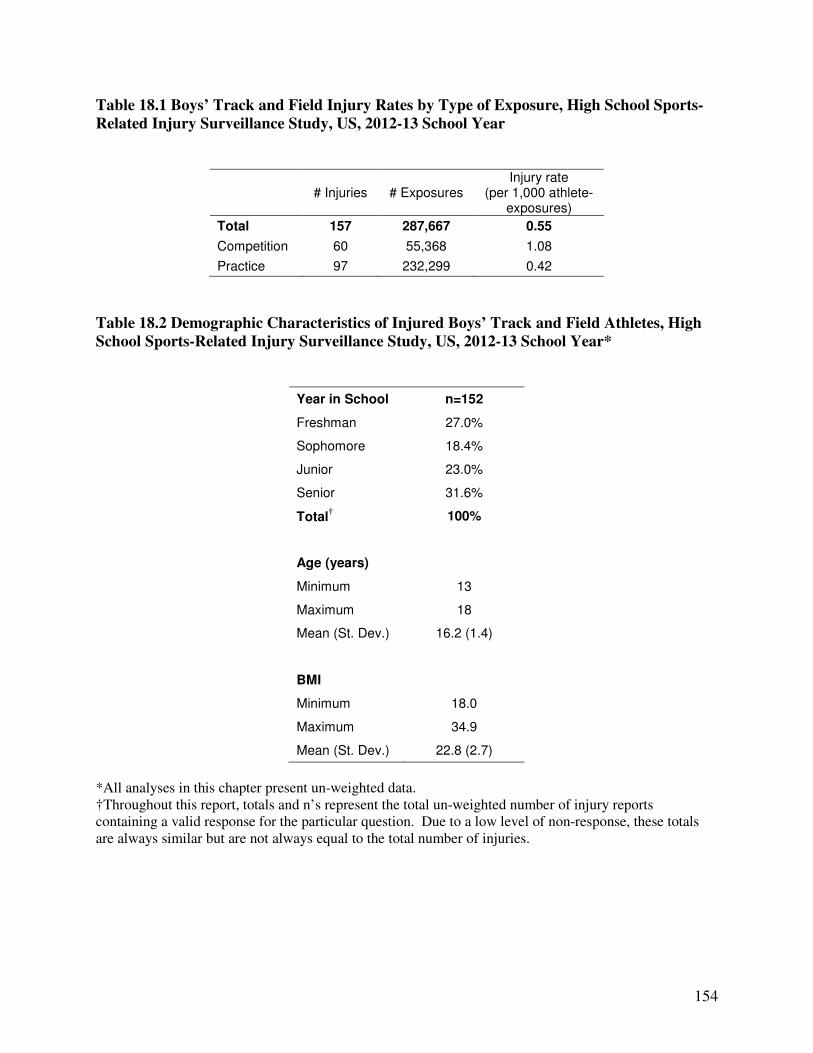
154
Table 18.1 Boys’ Track and Field Injury Rates by Type of Exposure, High School Sports-
Related Injury Surveillance Study, US, 2012-13 School Year
# Injuries # Exposures Injury rate
(per 1,000 athlete-exposures)
Total 157 287,667 0.55
Competition 60 55,368 1.08
Practice 97 232,299 0.42
Table 18.2 Demographic Characteristics of Injured Boys’ Track and Field Athletes, High
School Sports-Related Injury Surveillance Study, US, 2012-13 School Year*
Year in School n=152
Freshman 27.0%
Sophomore 18.4%
Junior 23.0%
Senior 31.6%
Total† 100%
Age (years)
Minimum 13
Maximum 18
Mean (St. Dev.) 16.2 (1.4)
BMI
Minimum 18.0
Maximum 34.9
Mean (St. Dev.) 22.8 (2.7)
*All analyses in this chapter present un-weighted data. †Throughout this report, totals and n’s represent the total un-weighted number of injury reports containing a valid response for the particular question. Due to a low level of non-response, these totals are always similar but are not always equal to the total number of injuries.

155
Figure 18.1 Diagnosis of Boys’ Track and Field Injuries by Type of Exposure, High School
Sports-Related Injury Surveillance Study, US, 2012-13 School Year
Table 18.3 Body Site of Boys’ Track and Field Injuries by Type of Exposure, High School
Sports-Related Injury Surveillance Study, US, 2012-13 School Year
Competition Practice Overall
n % n % n %
Body Site
Hip/thigh/upper leg 44 73.3% 34 35.1% 78 49.7%
Lower leg - 0.0% 20 20.6% 20 12.7%
Knee 5 8.3% 13 13.4% 18 11.5%
Ankle 4 6.7% 12 12.4% 16 10.2%
Foot 3 5.0% 7 7.2% 10 6.4%
Trunk 2 3.3% 3 3.1% 5 3.2%
Hand/wrist - 0.0% 3 3.1% 3 1.9%
Head/face - 0.0% 3 3.1% 3 1.9%
Shoulder 1 1.7% - 0.0% 1 0.6%
Arm/elbow - 0.0% 1 1.0% 1 0.6%
Neck 1 1.7% - 0.0% 1 0.6%
Other - 0.0% 1 1.0% 1 0.6%
Total 60 100% 97 100% 157 100%
†Totals and n’s are not always equal due to slight rounding or missing responses.
80%
2%
18%
Competition n=60
Strain/sprain
Contusion
Fracture
Concussion
Other
57%
2%3%
1%
37%
Practice n=97
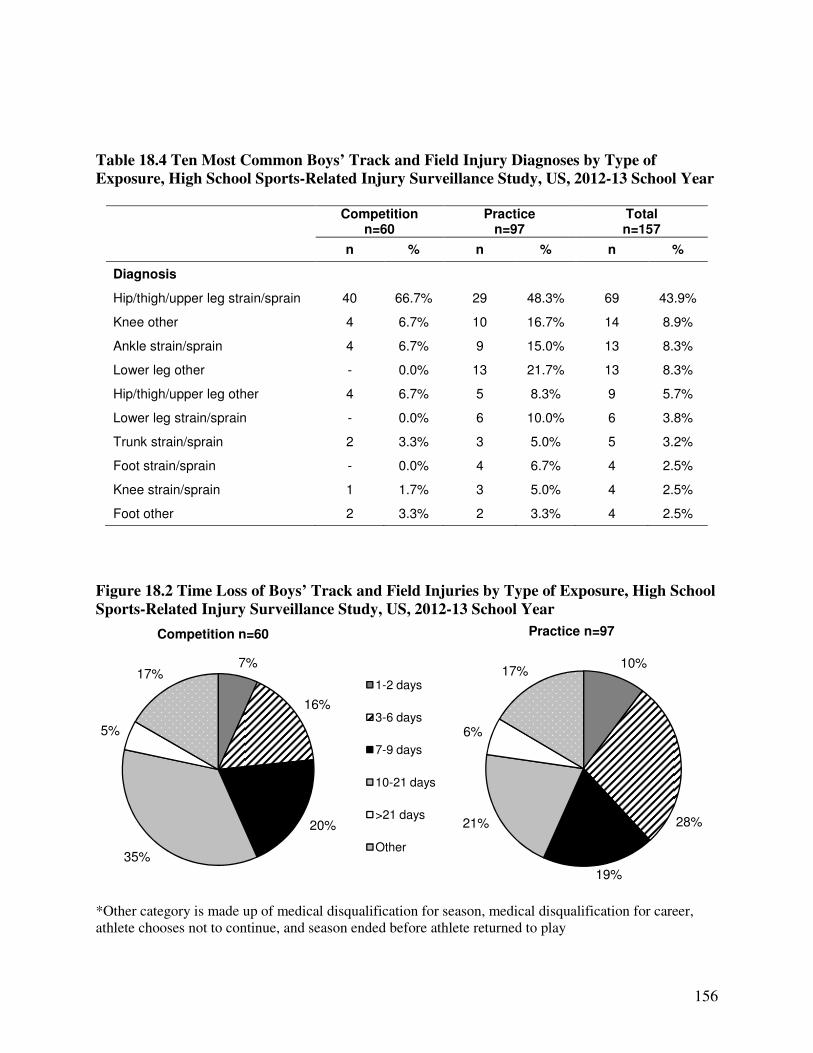
156
Table 18.4 Ten Most Common Boys’ Track and Field Injury Diagnoses by Type of
Exposure, High School Sports-Related Injury Surveillance Study, US, 2012-13 School Year
Competition
n=60 Practice
n=97 Total n=157
n % n % n %
Diagnosis
Hip/thigh/upper leg strain/sprain 40 66.7% 29 48.3% 69 43.9%
Knee other 4 6.7% 10 16.7% 14 8.9%
Ankle strain/sprain 4 6.7% 9 15.0% 13 8.3%
Lower leg other - 0.0% 13 21.7% 13 8.3%
Hip/thigh/upper leg other 4 6.7% 5 8.3% 9 5.7%
Lower leg strain/sprain - 0.0% 6 10.0% 6 3.8%
Trunk strain/sprain 2 3.3% 3 5.0% 5 3.2%
Foot strain/sprain - 0.0% 4 6.7% 4 2.5%
Knee strain/sprain 1 1.7% 3 5.0% 4 2.5%
Foot other 2 3.3% 2 3.3% 4 2.5%
Figure 18.2 Time Loss of Boys’ Track and Field Injuries by Type of Exposure, High School
Sports-Related Injury Surveillance Study, US, 2012-13 School Year
*Other category is made up of medical disqualification for season, medical disqualification for career, athlete chooses not to continue, and season ended before athlete returned to play
7%
16%
20%
35%
5%
17%
Competition n=60
1-2 days
3-6 days
7-9 days
10-21 days
>21 days
Other
10%
28%
19%
21%
6%
17%
Practice n=97
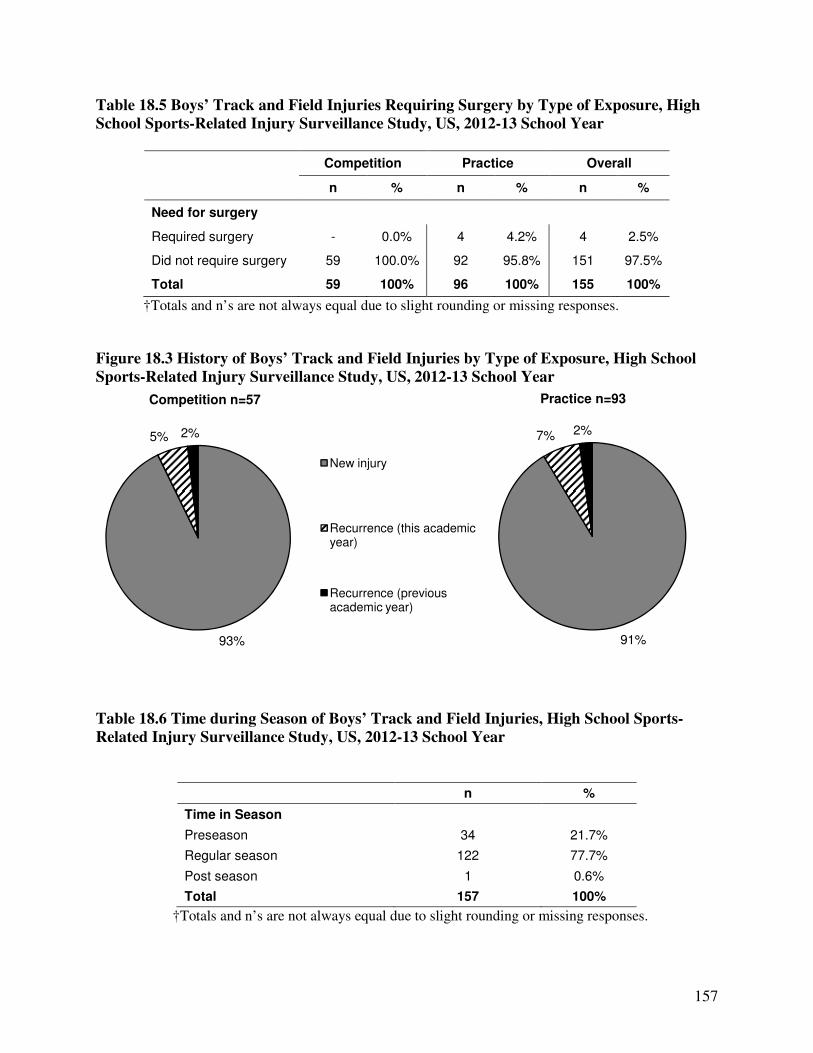
157
Table 18.5 Boys’ Track and Field Injuries Requiring Surgery by Type of Exposure, High
School Sports-Related Injury Surveillance Study, US, 2012-13 School Year
Competition Practice Overall
n % n % n %
Need for surgery
Required surgery - 0.0% 4 4.2% 4 2.5%
Did not require surgery 59 100.0% 92 95.8% 151 97.5%
Total 59 100% 96 100% 155 100%
†Totals and n’s are not always equal due to slight rounding or missing responses.
Figure 18.3 History of Boys’ Track and Field Injuries by Type of Exposure, High School
Sports-Related Injury Surveillance Study, US, 2012-13 School Year
Table 18.6 Time during Season of Boys’ Track and Field Injuries, High School Sports-
Related Injury Surveillance Study, US, 2012-13 School Year
n %
Time in Season
Preseason 34 21.7%
Regular season 122 77.7%
Post season 1 0.6%
Total 157 100%
†Totals and n’s are not always equal due to slight rounding or missing responses.
93%
5% 2%
Competition n=57
New injury
Recurrence (this academic year)
Recurrence (previous academic year)
91%
7% 2%
Practice n=93

158
Table 18.7 Practice-Related Variables for Boys’ Track and Field Injuries, High School
Sports-Related Injury Surveillance Study, US, 2012-13 School Year
n %
Time in Practice
First 1/2 hour 14 16.1%
Second 1/2 hour 28 32.2%
1-2 hours into practice 41 47.1%
>2 hours into practice 4 4.6%
Total 87 100%
†Totals and n’s are not always equal due to slight rounding or missing responses.
Table 18.8 Activities Leading to Boys’ Track and Field Injuries by Type of Exposure, High
School Sports-Related Injury Surveillance Study, US, 2012-13 School Year
Competition Practice Overall
n % n % n %
Activity
Running 42 73.7% 62 65.3% 104 68.4%
Jumping/landing 11 19.3% 14 14.7% 25 16.4%
Conditioning - 0.0% 6 6.3% 6 3.9%
Throwing - 0.0% 5 5.3% 5 3.3%
Running hurdles 3 5.3% 1 1.1% 4 2.6%
Warming up - 0.0% 2 2.1% 2 1.3%
Baton hand off - 0.0% 1 1.1% 1 0.7%
Other 1 1.8% 4 4.2% 5 3.3%
Total 57 100% 95 100% 152 100%
†Totals and n’s are not always equal due to slight rounding or missing responses.
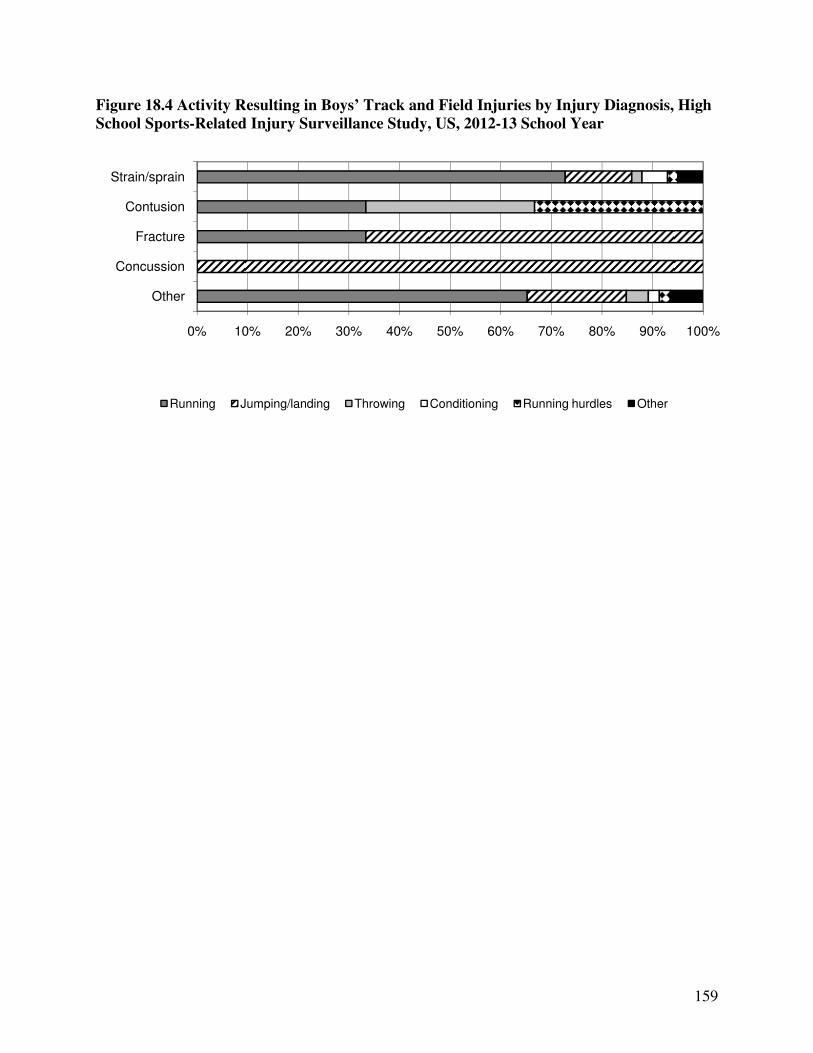
159
Figure 18.4 Activity Resulting in Boys’ Track and Field Injuries by Injury Diagnosis, High
School Sports-Related Injury Surveillance Study, US, 2012-13 School Year
0% 10% 20% 30% 40% 50% 60% 70% 80% 90% 100%
Other
Concussion
Fracture
Contusion
Strain/sprain
Running Jumping/landing Throwing Conditioning Running hurdles Other

160
XIX. Girls’ Track and Field Injury Epidemiology

161
Table 19.1 Girls’ Track and Field Injury Rates by Type of Exposure, High School Sports-
Related Injury Surveillance Study, US, 2012-13 School Year
# Injuries # Exposures Injury rate
(per 1,000 athlete-exposures)
Total 203 236,271 0.86
Competition 48 44,163 1.09
Practice 155 192,108 0.81
Table 19.2 Demographic Characteristics of Injured Girls’ Track and Field Athletes, High
School Sports-Related Injury Surveillance Study, US, 2012-13 School Year*
Year in School n=195
Freshman 26.7%
Sophomore 26.7%
Junior 27.7%
Senior 19.0%
Total† 100%
Age (years)
Minimum 13
Maximum 18
Mean (St. Dev.) 15.9 (1.2)
BMI
Minimum 15.6
Maximum 32.9
Mean (St. Dev.) 21.1 (3.5)
*All analyses in this chapter present un-weighted data. †Throughout this report, totals and n’s represent the total un-weighted number of injury reports containing a valid response for the particular question. Due to a low level of non-response, these totals are always similar but are not always equal to the total number of injuries.

162
6%
Figure 19.1 Diagnosis of Girls’ Track and Field Injuries by Type of Exposure, High School
Sports-Related Injury Surveillance Study, US, 2012-13 School Year
Table 19.3 Body Site of Girls’ Track and Field Injuries by Type of Exposure, High School
Sports-Related Injury Surveillance Study, US, 2012-13 School Year
Competition Practice Overall
n % n % n %
Body Site
Hip/thigh/upper leg 20 41.7% 52 33.5% 72 35.5%
Lower leg 7 14.6% 42 27.1% 49 24.1%
Knee 7 14.6% 18 11.6% 25 12.3%
Ankle 4 8.3% 13 8.4% 17 8.4%
Foot 3 6.3% 6 3.9% 9 4.4%
Trunk 2 4.2% 7 4.5% 9 4.4%
Head/face 3 6.3% 5 3.2% 8 3.9%
Shoulder - 0.0% 4 2.6% 4 2.0%
Hand/wrist - 0.0% 2 1.3% 2 1.0%
Arm/elbow 1 2.1% 1 0.6% 2 1.0%
Other 1 2.1% 5 3.2% 6 3.0%
Total 48 100% 155 100% 203 100%
†Totals and n’s are not always equal due to slight rounding or missing responses.
60%
4%
4%
26%
Competition n=47
Strain/sprain
Contusion
Fracture
Concussion
Other
53%
2%2%
1%
42%
Practice n=154

163
Table 19.4 Ten Most Common Girls’ Track and Field Injury Diagnoses by Type of
Exposure, High School Sports-Related Injury Surveillance Study, US, 2012-13 School Year
Competition
n=47 Practice n=154
Total n=201
n % n % n %
Diagnosis
Hip/thigh/upper leg strain/sprain 18 38.3% 46 29.9% 64 31.8%
Lower leg other 5 10.6% 29 18.8% 34 16.9%
Knee other 3 6.4% 14 9.1% 17 8.5%
Ankle strain/sprain 4 8.5% 9 5.8% 13 6.5%
Lower leg strain/sprain 1 2.1% 12 7.8% 13 6.5%
Knee strain/sprain 4 8.5% 4 2.6% 8 4.0%
Hip/thigh/upper leg other 1 2.1% 6 3.9% 7 3.5%
Head/face concussion 3 6.4% 2 1.3% 5 2.5%
Other other 1 2.1% 4 2.6% 5 2.5%
Trunk strain/sprain - 0.0% 4 2.6% 4 2.0%
Figure 19.2 Time Loss of Girls’ Track and Field Injuries by Type of Exposure, High School
Sports-Related Injury Surveillance Study, US, 2012-13 School Year
*Other category is made up of medical disqualification for season, medical disqualification for career, athlete chooses not to continue, and season ended before athlete returned to play
13%
21%
25%15%
19%
Competition n=48
1-2 days
3-6 days
7-9 days
10-21 days
>21 days
Other
12%
24%
15%25%
8%
16%
Practice n=155
8%
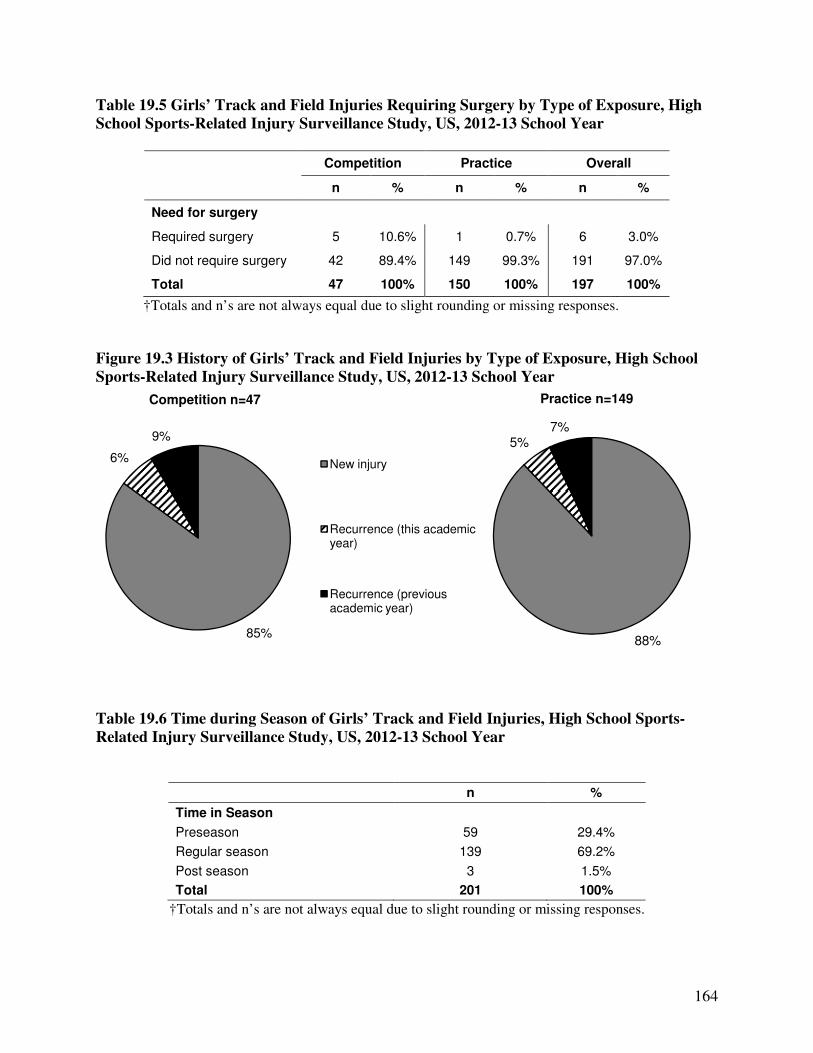
164
Table 19.5 Girls’ Track and Field Injuries Requiring Surgery by Type of Exposure, High
School Sports-Related Injury Surveillance Study, US, 2012-13 School Year
Competition Practice Overall
n % n % n %
Need for surgery
Required surgery 5 10.6% 1 0.7% 6 3.0%
Did not require surgery 42 89.4% 149 99.3% 191 97.0%
Total 47 100% 150 100% 197 100%
†Totals and n’s are not always equal due to slight rounding or missing responses.
Figure 19.3 History of Girls’ Track and Field Injuries by Type of Exposure, High School
Sports-Related Injury Surveillance Study, US, 2012-13 School Year
Table 19.6 Time during Season of Girls’ Track and Field Injuries, High School Sports-
Related Injury Surveillance Study, US, 2012-13 School Year
n %
Time in Season
Preseason 59 29.4%
Regular season 139 69.2%
Post season 3 1.5%
Total 201 100%
†Totals and n’s are not always equal due to slight rounding or missing responses.
85%
6%
9%
Competition n=47
New injury
Recurrence (this academic year)
Recurrence (previous academic year)
88%
5%7%
Practice n=149

165
Table 19.7 Practice-Related Variables for Girls’ Track and Field Injuries, High School
Sports-Related Injury Surveillance Study, US, 2012-13 School Year
n %
Time in Practice
First 1/2 hour 18 13.5%
Second 1/2 hour 43 32.3%
1-2 hours into practice 66 49.6%
>2 hours into practice 6 4.5%
Total 133 100%
†Totals and n’s are not always equal due to slight rounding or missing responses.
Table 19.8 Activities Leading to Girls’ Track and Field Injuries by Type of Exposure, High
School Sports-Related Injury Surveillance Study, US, 2012-13 School Year
Competition Practice Overall
n % n % n %
Activity
Running 28 58.3% 115 78.2% 143 73.3%
Jumping/landing 7 14.6% 11 7.5% 18 9.2%
Running hurdles 8 16.7% 6 4.1% 14 7.2%
Conditioning - 0.0% 5 3.4% 5 2.6%
Throwing 2 4.2% 5 3.4% 7 3.6%
Warming up - 0.0% 2 1.4% 2 1.0%
Leaving Block - 0.0% 1 0.7% 1 0.5%
Baton hand off 1 2.1% - 0.0% 1 0.5%
Hit by shotput/discus/javelin/hammer 1 2.1% - 0.0% 1 0.5%
Other 1 2.1% 2 1.4% 3 1.5%
Total 48 100% 147 100% 195 100%
†Totals and n’s are not always equal due to slight rounding or missing responses.

166
Figure 19.4 Activity Resulting in Girls’ Track and Field Injuries by Injury Diagnosis, High
School Sports-Related Injury Surveillance Study, US, 2012-13 School Year
0% 10% 20% 30% 40% 50% 60% 70% 80% 90% 100%
Other
Concussion
Fracture
Contusion
Strain/sprain
Running Jumping/landing Throwing Conditioning Running hurdles Other

167
XX. Boys’ Cross Country Injury Epidemiology

168
Table 20.1 Boys’ Cross Country Injury Rates by Type of Exposure, High School Sports-
Related Injury Surveillance Study, US, 2012-13 School Year
# Injuries # Exposures Injury rate
(per 1,000 athlete-exposures)
Total 84 129,244 0.65
Competition 17 21,845 0.78
Practice 67 107,399 0.62
Table 20.2 Demographic Characteristics of Injured Boys’ Cross Country Athletes, High
School Sports-Related Injury Surveillance Study, US, 2012-13 School Year*
Year in School n=84
Freshman 21.4%
Sophomore 28.6%
Junior 20.2%
Senior 29.8%
Total† 100%
Age (years)
Minimum 13
Maximum 18
Mean (St. Dev.) 15.6 (1.3)
BMI
Minimum 17.0
Maximum 25.8
Mean (St. Dev.) 21.4 (2.0)
*All analyses in this chapter present un-weighted data. †Throughout this report, totals and n’s represent the total un-weighted number of injury reports containing a valid response for the particular question. Due to a low level of non-response, these totals are always similar but are not always equal to the total number of injuries.

169
Figure 20.1 Diagnosis of Boys’ Cross Country Injuries by Type of Exposure, High School
Sports-Related Injury Surveillance Study, US, 2012-13 School Year
Table 20.3 Body Site of Boys’ Cross Country Injuries by Type of Exposure, High School
Sports-Related Injury Surveillance Study, US, 2012-13 School Year
Competition Practice Overall
n % n % n %
Body Site
Lower leg 3 17.6% 23 34.3% 26 31.0%
Hip/thigh/upper leg 4 23.5% 16 23.9% 20 23.8%
Knee 2 11.8% 14 20.9% 16 19.0%
Ankle 5 29.4% 6 9.0% 11 13.1%
Foot - 0.0% 3 4.5% 3 3.6%
Trunk - 0.0% 2 3.0% 2 2.4%
Head/face 1 5.9% - 0.0% 1 1.2%
Other 2 11.8% 3 4.5% 5 6.0%
Total 17 100% 67 100% 84 100%
†Totals and n’s are not always equal due to slight rounding or missing responses.
59%
6%
6%
29%
Competition n=17
Strain/sprain
Contusion
Fracture
Concussion
Other
34%
3%
63%
Practice n=67
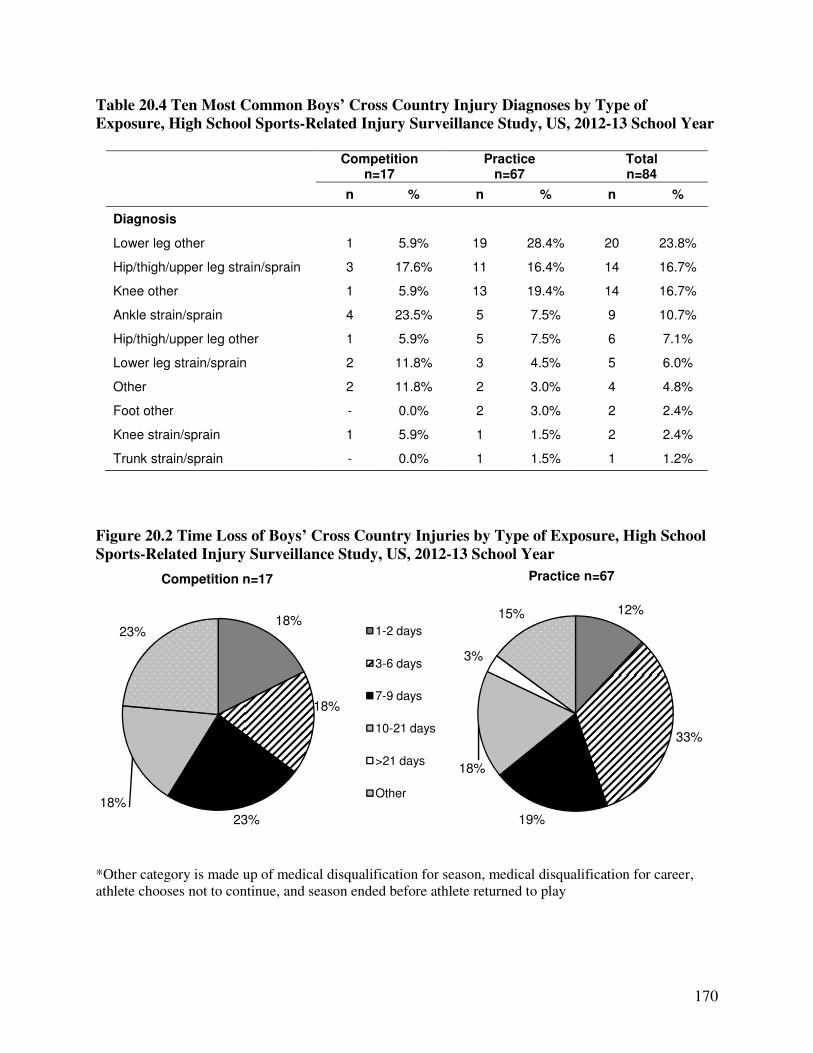
170
Table 20.4 Ten Most Common Boys’ Cross Country Injury Diagnoses by Type of
Exposure, High School Sports-Related Injury Surveillance Study, US, 2012-13 School Year
Competition
n=17 Practice
n=67 Total n=84
n % n % n %
Diagnosis
Lower leg other 1 5.9% 19 28.4% 20 23.8%
Hip/thigh/upper leg strain/sprain 3 17.6% 11 16.4% 14 16.7%
Knee other 1 5.9% 13 19.4% 14 16.7%
Ankle strain/sprain 4 23.5% 5 7.5% 9 10.7%
Hip/thigh/upper leg other 1 5.9% 5 7.5% 6 7.1%
Lower leg strain/sprain 2 11.8% 3 4.5% 5 6.0%
Other 2 11.8% 2 3.0% 4 4.8%
Foot other - 0.0% 2 3.0% 2 2.4%
Knee strain/sprain 1 5.9% 1 1.5% 2 2.4%
Trunk strain/sprain - 0.0% 1 1.5% 1 1.2%
Figure 20.2 Time Loss of Boys’ Cross Country Injuries by Type of Exposure, High School
Sports-Related Injury Surveillance Study, US, 2012-13 School Year
*Other category is made up of medical disqualification for season, medical disqualification for career, athlete chooses not to continue, and season ended before athlete returned to play
18%
18%
23%
18%
23%
Competition n=17
1-2 days
3-6 days
7-9 days
10-21 days
>21 days
Other
12%
33%
19%
18%
3%
15%
Practice n=67

171
Table 20.5 Boys’ Cross Country Injuries Requiring Surgery by Type of Exposure, High
School Sports-Related Injury Surveillance Study, US, 2012-13 School Year
Competition Practice Overall
n % n % n %
Need for surgery
Required surgery - 0.0% - 0.0% - 0.0%
Did not require surgery
17 100.0% 66 100.0% 83 100.0%
Total 17 100% 66 100% 83 100%
†Totals and n’s are not always equal due to slight rounding or missing responses.
Figure 20.3 History of Boys’ Cross Country Injuries by Type of Exposure, High School
Sports-Related Injury Surveillance Study, US, 2012-13 School Year
Table 20.6 Time during Season of Boys’ Cross Country Injuries, High School Sports-
Related Injury Surveillance Study, US, 2012-13 School Year
n %
Time in Season
Preseason 20 23.8%
Regular season 60 71.4%
Post season 4 4.8%
Total 84 100%
†Totals and n’s are not always equal due to slight rounding or missing responses.
94%
6%
Competition n=17
New injury
Recurrence (this academic year)
Recurrence (previous academic year)
82%
3%
15%
Practice n=66

172
Table 20.7 Practice-Related Variables for Boys’ Cross Country Injuries, High School
Sports-Related Injury Surveillance Study, US, 2012-13 School Year
n %
Time in Practice
First 1/2 hour 7 12.3%
Second 1/2 hour 20 35.1%
1-2 hours into practice 24 42.1%
>2 hours into practice 6 10.5%
Total 57 100%
†Totals and n’s are not always equal due to slight rounding or missing responses.
Table 20.8 Activities Leading to Boys’ Cross Country Injuries by Type of Exposure, High
School Sports-Related Injury Surveillance Study, US, 2012-13 School Year
Competition Practice Overall
n % n % n %
Activity
Running 17 100.0% 47 77.0% 64 82.1%
Conditioning - 0.0% 10 16.4% 10 12.8%
Warming up - 0.0% 2 3.3% 2 2.6%
Cooling down - 0.0% 1 1.6% 1 1.3%
Other - 0.0% 1 1.6% 1 1.3%
Total 17 100% 61 100% 78 100%
†Totals and n’s are not always equal due to slight rounding or missing responses.

173
Figure 20.4 Activity Resulting in Boys’ Cross Country Injuries by Injury Diagnosis, High
School Sports-Related Injury Surveillance Study, US, 2012-13 School Year
0% 10% 20% 30% 40% 50% 60% 70% 80% 90% 100%
Other
Concussion
Fracture
Contusion
Strain/sprain
Warming up Running Cooling down Conditioning Other

174
XXI. Girls’ Cross Country Injury Epidemiology

175
Table 21.1 Girls’ Cross Country Injury Rates by Type of Exposure, High School Sports-
Related Injury Surveillance Study, US, 2012-13 School Year
# Injuries # Exposures Injury rate
(per 1,000 athlete-exposures)
Total 124 113,000 1.10
Competition 22 19,519 1.13
Practice 102 93,481 1.09
Table 21.2 Demographic Characteristics of Injured Girls’ Cross Country Athletes, High
School Sports-Related Injury Surveillance Study, US, 2012-13 School Year*
Year in School n=124
Freshman 25.8%
Sophomore 41.1%
Junior 17.7%
Senior 15.3%
Total† 100%
Age (years)
Minimum 13
Maximum 18
Mean (St. Dev.) 15.4 (1.1)
BMI
Minimum 16.3
Maximum 30.3
Mean (St. Dev.) 20.5 (2.8)
*All analyses in this chapter present un-weighted data. †Throughout this report, totals and n’s represent the total un-weighted number of injury reports containing a valid response for the particular question. Due to a low level of non-response, these totals are always similar but are not always equal to the total number of injuries.

176
Figure 21.1 Diagnosis of Girls’ Cross Country Injuries by Type of Exposure, High School
Sports-Related Injury Surveillance Study, US, 2012-13 School Year
Table 21.3 Body Site of Girls’ Cross Country Injuries by Type of Exposure, High School
Sports-Related Injury Surveillance Study, US, 2012-13 School Year
Competition Practice Overall
n % n % n %
Body Site
Lower leg 4 18.2% 41 40.2% 45 36.3%
Hip/thigh/upper leg 8 36.4% 26 25.5% 34 27.4%
Ankle 6 27.3% 11 10.8% 17 13.7%
Knee 1 4.5% 11 10.8% 12 9.7%
Foot 3 13.6% 7 6.9% 10 8.1%
Trunk - 0.0% 3 2.9% 3 2.4%
Head/face - 0.0% 1 1.0% 1 0.8%
Shoulder - 0.0% 1 1.0% 1 0.8%
Other - 0.0% 1 1.0% 1 0.8%
Total 22 100% 102 100% 124 100%
†Totals and n’s are not always equal due to slight rounding or missing responses.
64%
36%
Competition n=22
Strain/sprain
Contusion
Fracture
Concussion
Other
39%
1%
58%
Practice n=102
2%
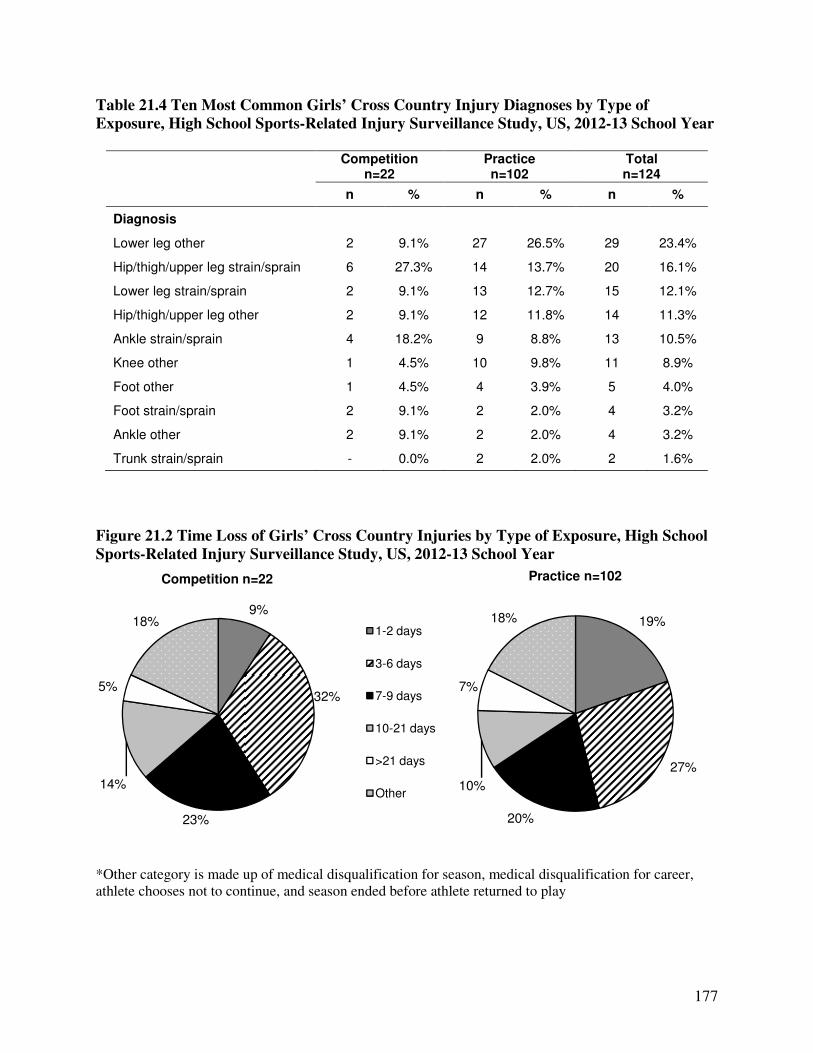
177
Table 21.4 Ten Most Common Girls’ Cross Country Injury Diagnoses by Type of
Exposure, High School Sports-Related Injury Surveillance Study, US, 2012-13 School Year
Competition
n=22 Practice n=102
Total n=124
n % n % n %
Diagnosis
Lower leg other 2 9.1% 27 26.5% 29 23.4%
Hip/thigh/upper leg strain/sprain 6 27.3% 14 13.7% 20 16.1%
Lower leg strain/sprain 2 9.1% 13 12.7% 15 12.1%
Hip/thigh/upper leg other 2 9.1% 12 11.8% 14 11.3%
Ankle strain/sprain 4 18.2% 9 8.8% 13 10.5%
Knee other 1 4.5% 10 9.8% 11 8.9%
Foot other 1 4.5% 4 3.9% 5 4.0%
Foot strain/sprain 2 9.1% 2 2.0% 4 3.2%
Ankle other 2 9.1% 2 2.0% 4 3.2%
Trunk strain/sprain - 0.0% 2 2.0% 2 1.6%
Figure 21.2 Time Loss of Girls’ Cross Country Injuries by Type of Exposure, High School
Sports-Related Injury Surveillance Study, US, 2012-13 School Year
*Other category is made up of medical disqualification for season, medical disqualification for career, athlete chooses not to continue, and season ended before athlete returned to play
9%
32%
23%
14%
18%
Competition n=22
1-2 days
3-6 days
7-9 days
10-21 days
>21 days
Other
19%
27%
20%
10%
7%
18%
Practice n=102
5%
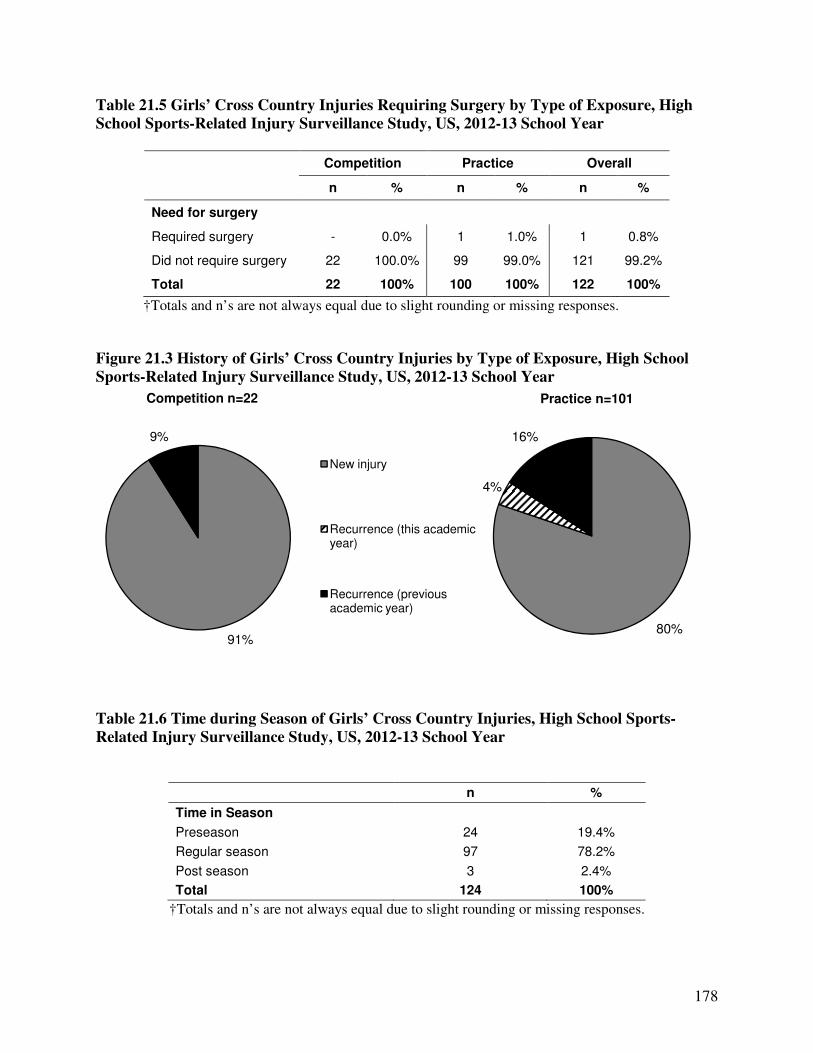
178
Table 21.5 Girls’ Cross Country Injuries Requiring Surgery by Type of Exposure, High
School Sports-Related Injury Surveillance Study, US, 2012-13 School Year
Competition Practice Overall
n % n % n %
Need for surgery
Required surgery - 0.0% 1 1.0% 1 0.8%
Did not require surgery 22 100.0% 99 99.0% 121 99.2%
Total 22 100% 100 100% 122 100%
†Totals and n’s are not always equal due to slight rounding or missing responses.
Figure 21.3 History of Girls’ Cross Country Injuries by Type of Exposure, High School
Sports-Related Injury Surveillance Study, US, 2012-13 School Year
Table 21.6 Time during Season of Girls’ Cross Country Injuries, High School Sports-
Related Injury Surveillance Study, US, 2012-13 School Year
n %
Time in Season
Preseason 24 19.4%
Regular season 97 78.2%
Post season 3 2.4%
Total 124 100%
†Totals and n’s are not always equal due to slight rounding or missing responses.
91%
9%
Competition n=22
New injury
Recurrence (this academic year)
Recurrence (previous academic year)
80%
4%
16%
Practice n=101
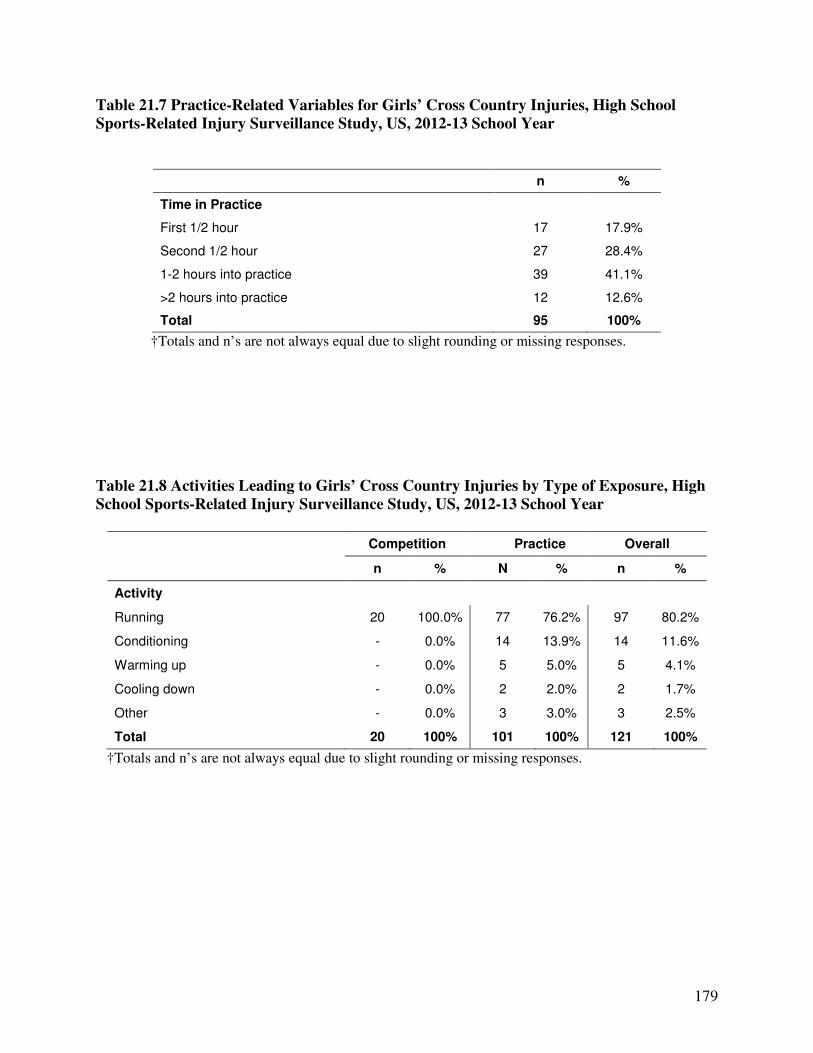
179
Table 21.7 Practice-Related Variables for Girls’ Cross Country Injuries, High School
Sports-Related Injury Surveillance Study, US, 2012-13 School Year
n %
Time in Practice
First 1/2 hour 17 17.9%
Second 1/2 hour 27 28.4%
1-2 hours into practice 39 41.1%
>2 hours into practice 12 12.6%
Total 95 100%
†Totals and n’s are not always equal due to slight rounding or missing responses.
Table 21.8 Activities Leading to Girls’ Cross Country Injuries by Type of Exposure, High
School Sports-Related Injury Surveillance Study, US, 2012-13 School Year
Competition Practice Overall
n % N % n %
Activity
Running 20 100.0% 77 76.2% 97 80.2%
Conditioning - 0.0% 14 13.9% 14 11.6%
Warming up - 0.0% 5 5.0% 5 4.1%
Cooling down - 0.0% 2 2.0% 2 1.7%
Other - 0.0% 3 3.0% 3 2.5%
Total 20 100% 101 100% 121 100%
†Totals and n’s are not always equal due to slight rounding or missing responses.

180
Figure 21.4 Activity Resulting in Girls’ Cross Country Injuries by Injury Diagnosis, High
School Sports-Related Injury Surveillance Study, US, 2012-13 School Year
0% 10% 20% 30% 40% 50% 60% 70% 80% 90% 100%
Other
Fracture
Contusion
Strain/sprain
Warming up Running Cooling down Conditioning Other

181
XXII. Cheerleading Injury Epidemiology

182
Table 22.1 Cheerleading Injury Rates by Type of Exposure, High School Sports-Related
Injury Surveillance Study, US, 2012-13 School Year
# Injuries # Exposures Injury rate
(per 1,000 athlete-exposures)
Total 192 262,581 0.73
Competition 19 16,855 1.13
Practice 150 194,698 0.77
Performance 23 51,028 0.45
Table 22.2 Demographic Characteristics of Injured Cheerleading Athletes, High School
Sports-Related Injury Surveillance Study, US, 2012-13 School Year*
Year in School n=190
Freshman 30.0%
Sophomore 26.8%
Junior 23.2%
Senior 20.0%
Total† 100%
Age (years)
Minimum 13
Maximum 18
Mean (St. Dev.) 15.5 (1.2)
BMI
Minimum 16.0
Maximum 33.7
Mean (St. Dev.) 21.8 (3.0)
*All analyses in this chapter present un-weighted data. †Throughout this report, totals and n’s represent the total un-weighted number of injury reports containing a valid response for the particular question. Due to a low level of non-response, these totals are always similar but are not always equal to the total number of injuries.

183
Figure 22.1 Diagnosis of Cheerleading Injuries by Type of Exposure, High School Sports-
Related Injury Surveillance Study, US, 2012-13 School Year
Table 22.3 Body Site of Cheerleading Injuries by Type of Exposure, High School Sports-
Related Injury Surveillance Study, US, 2012-13 School Year
Competition Practice Performance Overall
n % n % n % n %
Body Site
Head/face 6 31.6% 60 40.0% 4 17.4% 70 36.5%
Ankle 2 10.5% 20 13.3% 3 13.0% 25 13.0%
Knee 3 15.8% 10 6.7% 4 17.4% 17 8.9%
Neck 3 15.8% 14 9.3% - 0.0% 17 8.9%
Hand/wrist 2 10.5% 9 6.0% 2 8.7% 13 6.8%
Trunk - 0.0% 9 6.0% 2 8.7% 11 5.7%
Shoulder - 0.0% 8 5.3% 2 8.7% 10 5.2%
Foot 1 5.3% 6 4.0% 3 13.0% 10 5.2%
Arm/elbow - 0.0% 7 4.7% - 0.0% 7 3.6%
Hip/thigh/upper leg - 0.0% 3 2.0% 1 4.3% 4 2.1%
Lower leg 1 5.3% 1 0.7% 1 4.3% 3 1.6%
Other 1 5.3% 3 2.0% 1 4.3% 1 4.3%
Total 19 100% 150 100% 23 100% 192 100%
†Totals and n’s are not always equal due to slight rounding or missing responses.
45%
12%
15%
14%
14%
Competition/Performance n=42
Strain/sprain
Contusion
Fracture
Concussion
Other
34%
5%
11%
32%
18%
Practice n=150
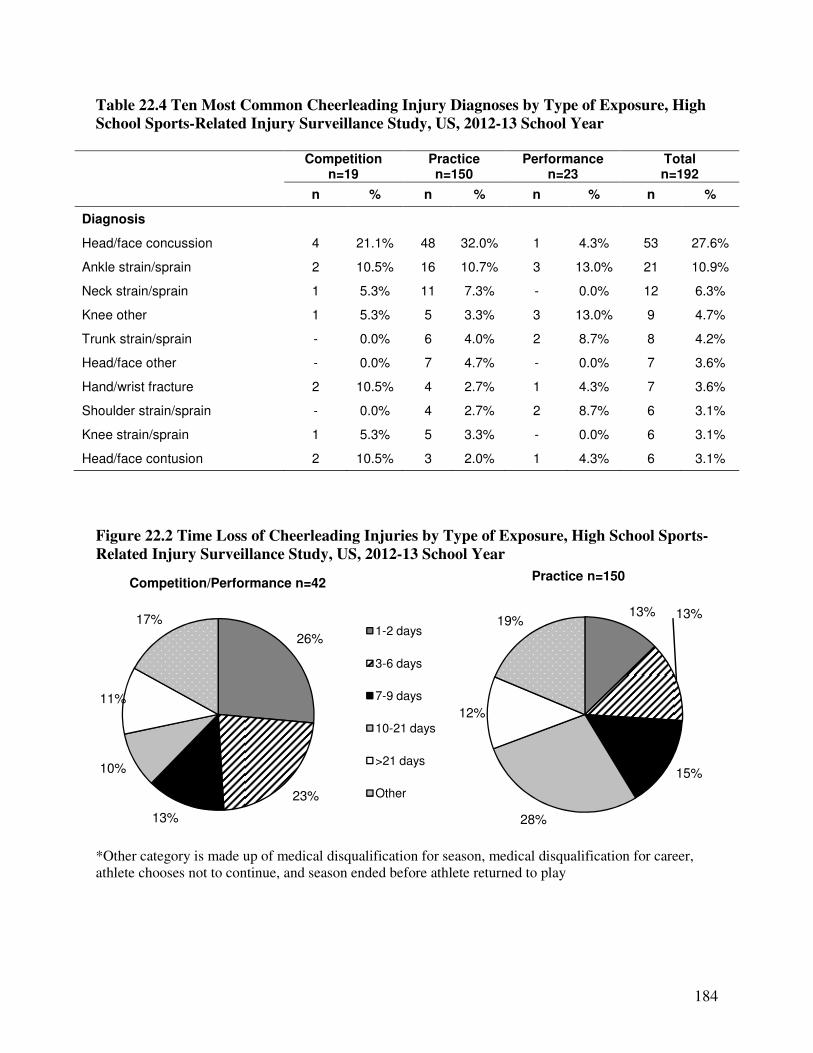
184
Table 22.4 Ten Most Common Cheerleading Injury Diagnoses by Type of Exposure, High
School Sports-Related Injury Surveillance Study, US, 2012-13 School Year
Competition
n=19 Practice n=150
Performance n=23
Total n=192
n % n % n % n %
Diagnosis
Head/face concussion 4 21.1% 48 32.0% 1 4.3% 53 27.6%
Ankle strain/sprain 2 10.5% 16 10.7% 3 13.0% 21 10.9%
Neck strain/sprain 1 5.3% 11 7.3% - 0.0% 12 6.3%
Knee other 1 5.3% 5 3.3% 3 13.0% 9 4.7%
Trunk strain/sprain - 0.0% 6 4.0% 2 8.7% 8 4.2%
Head/face other - 0.0% 7 4.7% - 0.0% 7 3.6%
Hand/wrist fracture 2 10.5% 4 2.7% 1 4.3% 7 3.6%
Shoulder strain/sprain - 0.0% 4 2.7% 2 8.7% 6 3.1%
Knee strain/sprain 1 5.3% 5 3.3% - 0.0% 6 3.1%
Head/face contusion 2 10.5% 3 2.0% 1 4.3% 6 3.1%
Figure 22.2 Time Loss of Cheerleading Injuries by Type of Exposure, High School Sports-
Related Injury Surveillance Study, US, 2012-13 School Year
*Other category is made up of medical disqualification for season, medical disqualification for career, athlete chooses not to continue, and season ended before athlete returned to play
26%
23%
13%
10%
11%
17%
Competition/Performance n=42
1-2 days
3-6 days
7-9 days
10-21 days
>21 days
Other
13% 13%
15%
28%
12%
19%
Practice n=150

185
Table 22.5 Cheerleading Injuries Requiring Surgery by Type of Exposure, High School
Sports-Related Injury Surveillance Study, US, 2012-13 School Year
Competition Practice Performance Overall
n % n % n % n %
Need for surgery
Required surgery - 0.0% 6 4.0% 2 8.7% 8 4.2%
Did not require surgery 18 100.0% 143 96.0% 21 91.3% 182 95.8%
Total 18 100% 149 100% 23 100% 190 100%
†Totals and n’s are not always equal due to slight rounding or missing responses.
Figure 22.3 History of Cheerleading Injuries by Type of Exposure, High School Sports-
Related Injury Surveillance Study, US, 2012-13 School Year
Table 22.6 Time during Season of Cheerleading Injuries, High School Sports-Related
Injury Surveillance Study, US, 2012-13 School Year
n %
Time in Season
Preseason 15 7.8%
Regular season 175 91.1%
Post season 2 1.0%
Total 192 100%
†Totals and n’s are not always equal due to slight rounding or missing responses.
93%
7%
Competition/Performance n=41
New injury
Recurrence (this academic year)
Recurrence (previous academic year)
93%
6%
Practice n=150
1%

186
Table 22.7 Practice-Related Variables for Cheerleading Injuries, High School Sports-
Related Injury Surveillance Study, US, 2012-13 School Year
n %
Time in Practice
First 1/2 hour 12 8.5%
Second 1/2 hour 16 11.3%
1-2 hours into practice 102 71.8%
>2 hours into practice 12 8.5%
Total 142 100%
†Totals and n’s are not always equal due to slight rounding or missing responses.
Table 22.8 Activities Leading to Cheerleading Injuries by Type of Exposure, High School
Sports-Related Injury Surveillance Study, US, 2012-13 School Year
Competition Practice Performance Overall
n % N % n % n %
Activity
Stunt - 0.0% 40 27.2% 4 18.2% 44 23.5%
Toss 6 33.3% 34 23.1% 3 13.6% 43 23.0%
Tumbling 4 22.2% 29 19.7% 7 31.8% 40 21.4%
Pyramid 2 11.1% 27 18.4% - 0.0% 29 15.5%
Jump 4 22.2% 6 4.1% - 0.0% 10 5.3%
Warm-up - 0.0% 1 0.7% 3 13.6% 4 2.1%
Other 2 11.1% 10 6.8% 5 22.7% 17 9.1%
Total 18 100% 147 100% 22 100% 187 100%
†Totals and n’s are not always equal due to slight rounding or missing responses.
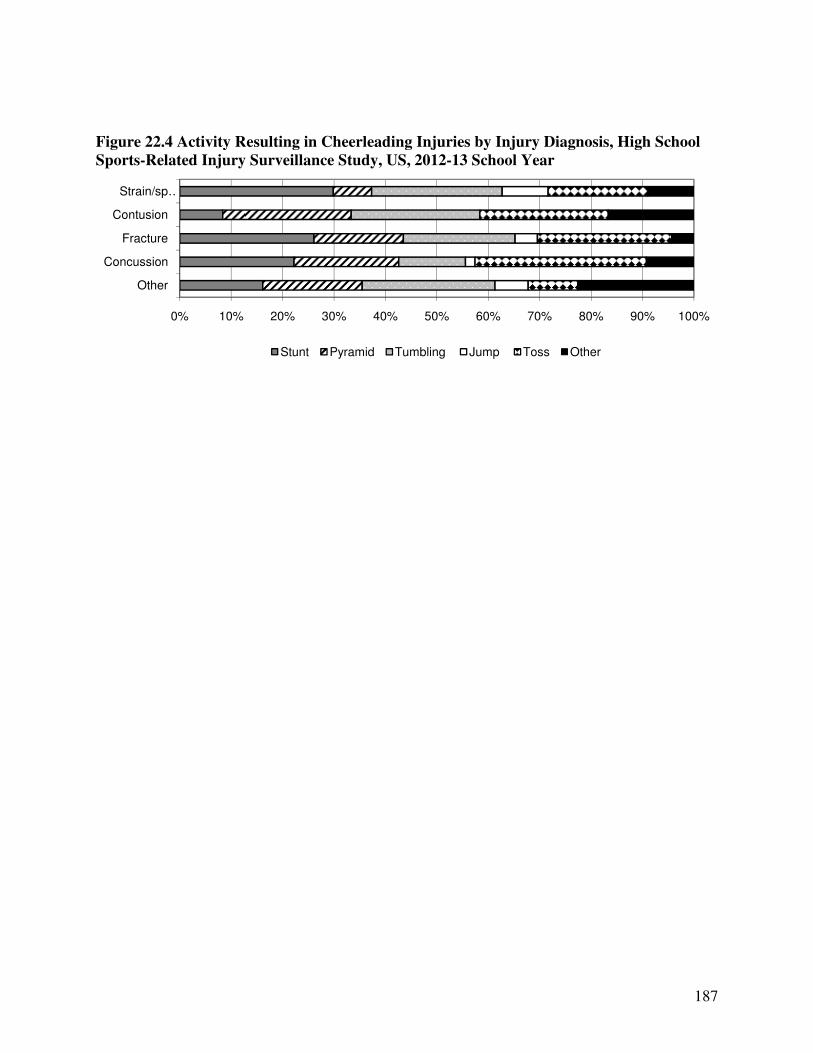
187
Figure 22.4 Activity Resulting in Cheerleading Injuries by Injury Diagnosis, High School
Sports-Related Injury Surveillance Study, US, 2012-13 School Year
0% 10% 20% 30% 40% 50% 60% 70% 80% 90% 100%
Other
Concussion
Fracture
Contusion
Strain/sp…
Stunt Pyramid Tumbling Jump Toss Other

188
XXIII. Gender Differences within Sports

189
23.1 Boys’ and Girls’ Soccer
Table 23.1 Comparison of Boys’ and Girls’ Soccer Injury Rates, High School Sports-
Related Injury Surveillance Study, US, 2012-13 School Year
*Throughout this chapter, rate ratios (RR) and injury proportion ratios (IPR) compare the gender with a higher injury rate/proportion (bolded) to the gender with a lower injury rate/proportion. †Throughout this chapter, statistically significant RR and IPR are bolded.
Table 23.10 Comparison of Body Sites of Boys’ and Girls’ Soccer Injuries, High School
Sports-Related Injury Surveillance Study, US, 2012-13 School Year
Boys’ soccer Girls’ soccer IPR (95% CI)
Body Site
Head/face 23.6% 30.0% 1.28 (1.03, 1.58)
Hip/thigh/upper leg 14.4% 14.2% 1.02 (0.71, 1.46)
Ankle 17.5% 17.8% 1.02 (0.77, 1.34)
Knee 14.7% 17.4% 1.19 (0.89, 1.60)
Foot 7.7% 5.0% 1.53 (0.94, 2.50)
Lower leg 8.2% 5.2% 1.57 (0.97, 2.53)
Hand/wrist 3.8% 1.8% 2.14 (0.98, 4.66)
Trunk 3.4% 3.4% 1.02 (0.52, 2.00)
Shoulder 1.9% 1.6% 1.19 (0.46, 3.05)
Arm/elbow 1.7% 2.0% 1.18 (0.46, 3.01)
Neck 0.7% 0.5% 1.34 (0.27, 6.59)
Other 2.4% 0.9% 2.67 (0.92, 7.76)
Total 100% 100% -
†Totals do not always equal 100% due to slight rounding.
Boys’ soccer Girls’ soccer* RR (95% CI)†
Total 1.43 2.33 1.63 (1.44, 1.85)
Competition 3.07 5.71 1.86 (1.60, 2.17)
Practice 0.72 0.86 1.21 (0.96, 1.52)

190
Table 23.11 Comparison of Diagnoses of Boys’ and Girls’ Soccer Injuries, High School
Sports-Related Injury Surveillance Study, US, 2012-13 School Year
Boys’ soccer Girls’ soccer IPR (95% CI)
Diagnosis
Strain/sprain 42.8% 46.2% 1.08 (0.94, 1.25)
Concussion 19.0% 28.4% 1.50 (1.18, 1.90)
Contusion 12.5% 9.9% 1.26 (0.88, 1.81)
Fracture 10.1% 4.1% 2.44 (1.49, 3.99)
Other 15.6% 11.3% 1.38 (1.00, 1.90)
Total 100% 100% -
†Totals do not always equal 100% due to slight rounding.
Table 23.12 Most Common Boys’ and Girls’ Soccer Injury Diagnoses*, High School
Sports-Related Injury Surveillance Study, US, 2012-13 School Year
Boys’ soccer Girls’ soccer IPR (95% CI)
Diagnosis
Head/face concussion 19.0% 28.4% 1.50 (1.18, 1.90)
Hip/thigh/upper leg strain/sprain 11.1% 12.2% 1.11 (0.78, 1.57)
Ankle strain/sprain 16.1% 17.1% 1.06 (0.80, 1.41)
Knee strain/sprain 6.7% 10.6% 1.58 (1.02, 2.43)
Knee other 4.8% 4.1% 1.16 (0.65, 2.09)
*Only includes diagnoses accounting for >5% of boys’ or girls’ soccer injuries.
Table 23.13 Comparison of Time Loss of Boys’ and Girls’ Soccer Injuries, High School
Sports-Related Injury Surveillance Study, US, 2012-13 School Year
Boys’ soccer Girls’ soccer IPR (95% CI)
Time Loss
1-2 days 12.5% 11.7% 1.07 (0.76, 1.51)
3-6 days 20.0% 16.5% 1.21 (0.92, 1.58)
7-9 days 21.6% 18.5% 1.17 (0.91, 1.50)
10-21 days 19.2% 22.3% 1.16 (0.90, 1.49)
22 days or more 7.0% 5.6% 1.25 (0.77, 2.04)
Other 19.7% 25.4% 1.29 (1.01, 1.64)
Total 100% 100% -
†Totals do not always equal 100% due to slight rounding.
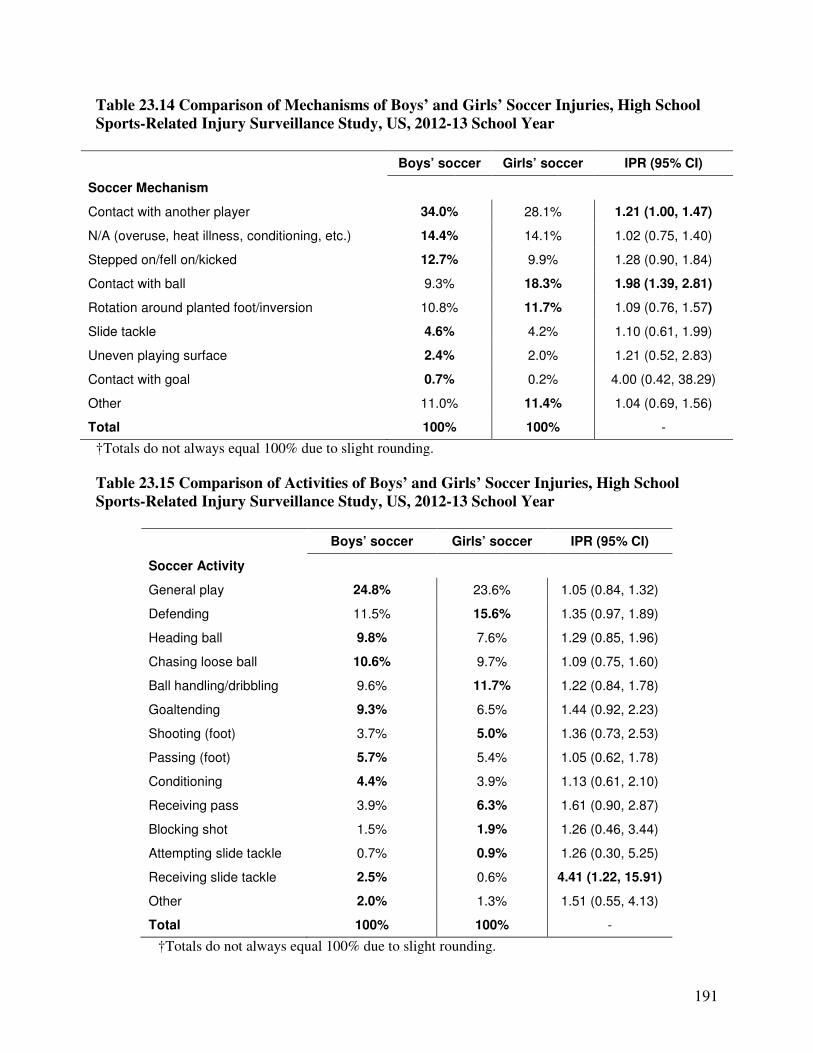
191
Table 23.14 Comparison of Mechanisms of Boys’ and Girls’ Soccer Injuries, High School
Sports-Related Injury Surveillance Study, US, 2012-13 School Year
Boys’ soccer Girls’ soccer IPR (95% CI)
Soccer Mechanism
Contact with another player 34.0% 28.1% 1.21 (1.00, 1.47)
N/A (overuse, heat illness, conditioning, etc.) 14.4% 14.1% 1.02 (0.75, 1.40)
Stepped on/fell on/kicked 12.7% 9.9% 1.28 (0.90, 1.84)
Contact with ball 9.3% 18.3% 1.98 (1.39, 2.81)
Rotation around planted foot/inversion 10.8% 11.7% 1.09 (0.76, 1.57)
Slide tackle 4.6% 4.2% 1.10 (0.61, 1.99)
Uneven playing surface 2.4% 2.0% 1.21 (0.52, 2.83)
Contact with goal 0.7% 0.2% 4.00 (0.42, 38.29)
Other 11.0% 11.4% 1.04 (0.69, 1.56)
Total 100% 100% -
†Totals do not always equal 100% due to slight rounding.
Table 23.15 Comparison of Activities of Boys’ and Girls’ Soccer Injuries, High School
Sports-Related Injury Surveillance Study, US, 2012-13 School Year
Boys’ soccer Girls’ soccer IPR (95% CI)
Soccer Activity
General play 24.8% 23.6% 1.05 (0.84, 1.32)
Defending 11.5% 15.6% 1.35 (0.97, 1.89)
Heading ball 9.8% 7.6% 1.29 (0.85, 1.96)
Chasing loose ball 10.6% 9.7% 1.09 (0.75, 1.60)
Ball handling/dribbling 9.6% 11.7% 1.22 (0.84, 1.78)
Goaltending 9.3% 6.5% 1.44 (0.92, 2.23)
Shooting (foot) 3.7% 5.0% 1.36 (0.73, 2.53)
Passing (foot) 5.7% 5.4% 1.05 (0.62, 1.78)
Conditioning 4.4% 3.9% 1.13 (0.61, 2.10)
Receiving pass 3.9% 6.3% 1.61 (0.90, 2.87)
Blocking shot 1.5% 1.9% 1.26 (0.46, 3.44)
Attempting slide tackle 0.7% 0.9% 1.26 (0.30, 5.25)
Receiving slide tackle 2.5% 0.6% 4.41 (1.22, 15.91)
Other 2.0% 1.3% 1.51 (0.55, 4.13)
Total 100% 100% -
†Totals do not always equal 100% due to slight rounding.
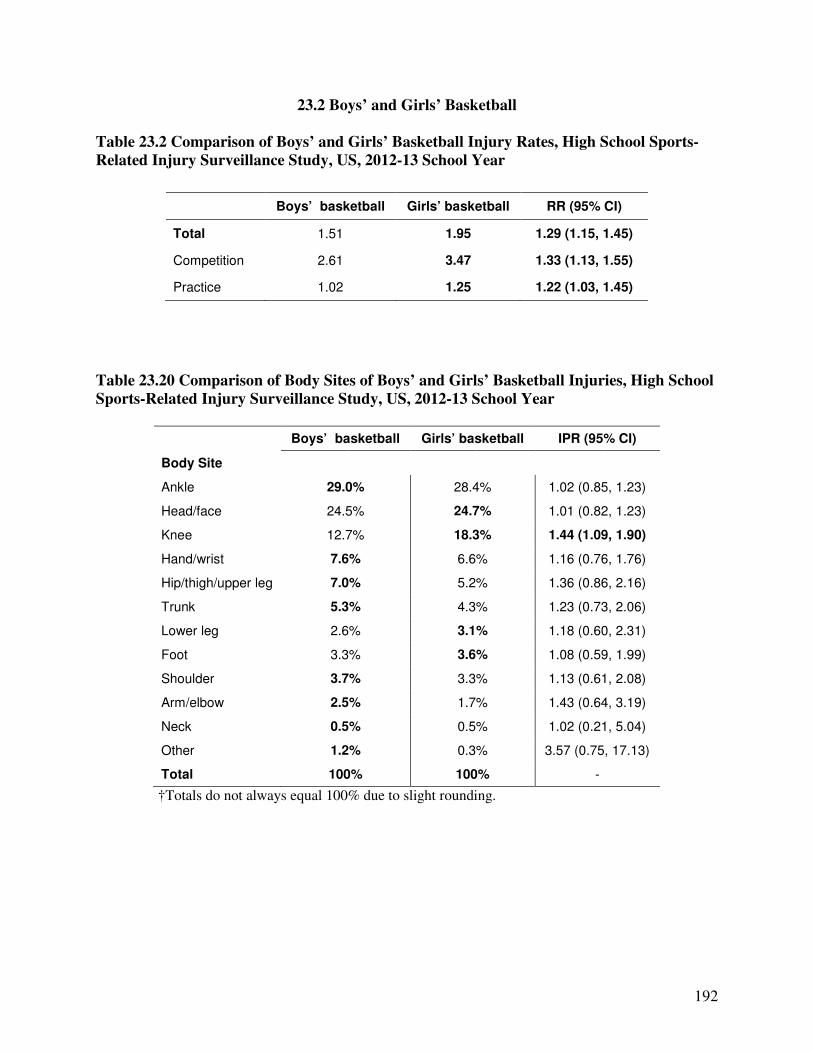
192
23.2 Boys’ and Girls’ Basketball
Table 23.2 Comparison of Boys’ and Girls’ Basketball Injury Rates, High School Sports-
Related Injury Surveillance Study, US, 2012-13 School Year
Table 23.20 Comparison of Body Sites of Boys’ and Girls’ Basketball Injuries, High School
Sports-Related Injury Surveillance Study, US, 2012-13 School Year
Boys’ basketball Girls’ basketball IPR (95% CI)
Body Site
Ankle 29.0% 28.4% 1.02 (0.85, 1.23)
Head/face 24.5% 24.7% 1.01 (0.82, 1.23)
Knee 12.7% 18.3% 1.44 (1.09, 1.90)
Hand/wrist 7.6% 6.6% 1.16 (0.76, 1.76)
Hip/thigh/upper leg 7.0% 5.2% 1.36 (0.86, 2.16)
Trunk 5.3% 4.3% 1.23 (0.73, 2.06)
Lower leg 2.6% 3.1% 1.18 (0.60, 2.31)
Foot 3.3% 3.6% 1.08 (0.59, 1.99)
Shoulder 3.7% 3.3% 1.13 (0.61, 2.08)
Arm/elbow 2.5% 1.7% 1.43 (0.64, 3.19)
Neck 0.5% 0.5% 1.02 (0.21, 5.04)
Other 1.2% 0.3% 3.57 (0.75, 17.13)
Total 100% 100% -
†Totals do not always equal 100% due to slight rounding.
Boys’ basketball Girls’ basketball RR (95% CI)
Total 1.51 1.95 1.29 (1.15, 1.45)
Competition 2.61 3.47 1.33 (1.13, 1.55)
Practice 1.02 1.25 1.22 (1.03, 1.45)

193
Table 23.21 Comparison of Diagnoses of Boys’ and Girls’ Basketball Injuries, High School
Sports-Related Injury Surveillance Study, US, 2012-13 School Year
Boys’ basketball Girls’ basketball IPR (95% CI)
Diagnosis
Strain/sprain 47.9% 49.5% 1.03 (0.92, 1.16)
Concussion 15.7% 20.9% 1.34 (1.04, 1.71)
Fracture 9.5% 6.9% 1.37 (0.93, 2.03)
Contusion 8.6% 6.2% 1.39 (0.92, 2.10)
Other 18.3% 16.4% 1.11 (0.87, 1.44)
Total 100% 100% -
†Totals do not always equal 100% due to slight rounding.
Table 23.22 Most Common Boys’ and Girls’ Basketball Injury Diagnoses*, High School
Sports-Related Injury Surveillance Study, US, 2012-13 School Year
Boys’ basketball Girls’ basketball IPR (95% CI)
Diagnosis
Ankle strain/sprain 27.8% 27.2% 1.02 (0.85, 1.23)
Head/face concussion 15.7% 20.8% 1.33 (1.04, 1.70)
Knee strain/sprain 6.7% 9.1% 1.36 (0.91, 2.04)
Knee other 4.2% 5.7% 1.37 (0.80, 2.34)
*Only includes diagnoses accounting for >5% of boys’ or girls’ basketball injuries.
Table 23.23 Comparison of Time Loss of Boys’ and Girls’ Basketball Injuries, High School
Sports-Related Injury Surveillance Study, US, 2012-13 School Year
Boys’ basketball Girls’ basketball IPR (95% CI)
Time Loss
1-2 days 18.5% 16.2% 1.14 (0.89, 1.47)
3-6 days 23.1% 19.3% 1.20 (0.96, 1.50)
7-9 days 16.2% 15.8% 1.02 (0.79, 1.33)
10-21 days 18.3% 22.2% 1.21 (0.96, 1.53)
22 days or more 8.3% 6.7% 1.23 (0.82, 1.86)
Other 15.7% 19.8% 1.26 (0.98, 1.62)
Total 100% 100% -
†Totals do not always equal 100% due to slight rounding.
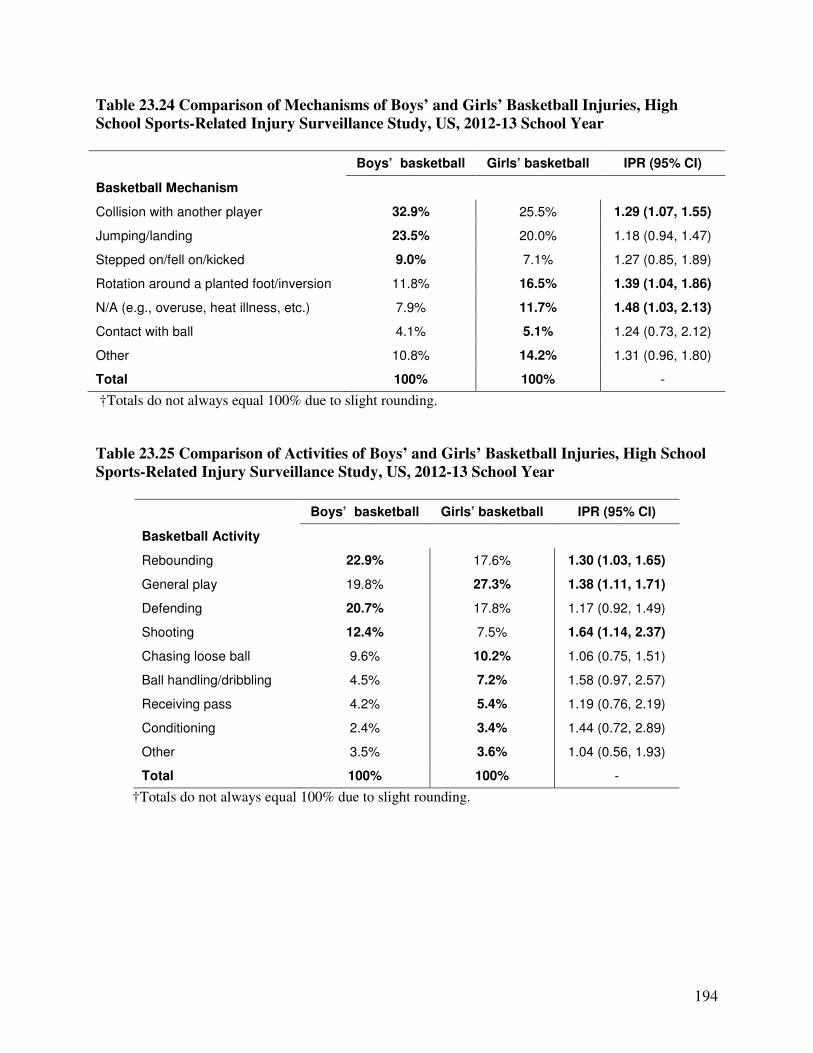
194
Table 23.24 Comparison of Mechanisms of Boys’ and Girls’ Basketball Injuries, High
School Sports-Related Injury Surveillance Study, US, 2012-13 School Year
Boys’ basketball Girls’ basketball IPR (95% CI)
Basketball Mechanism
Collision with another player 32.9% 25.5% 1.29 (1.07, 1.55)
Jumping/landing 23.5% 20.0% 1.18 (0.94, 1.47)
Stepped on/fell on/kicked 9.0% 7.1% 1.27 (0.85, 1.89)
Rotation around a planted foot/inversion 11.8% 16.5% 1.39 (1.04, 1.86)
N/A (e.g., overuse, heat illness, etc.) 7.9% 11.7% 1.48 (1.03, 2.13)
Contact with ball 4.1% 5.1% 1.24 (0.73, 2.12)
Other 10.8% 14.2% 1.31 (0.96, 1.80)
Total 100% 100% -
†Totals do not always equal 100% due to slight rounding.
Table 23.25 Comparison of Activities of Boys’ and Girls’ Basketball Injuries, High School
Sports-Related Injury Surveillance Study, US, 2012-13 School Year
Boys’ basketball Girls’ basketball IPR (95% CI)
Basketball Activity
Rebounding 22.9% 17.6% 1.30 (1.03, 1.65)
General play 19.8% 27.3% 1.38 (1.11, 1.71)
Defending 20.7% 17.8% 1.17 (0.92, 1.49)
Shooting 12.4% 7.5% 1.64 (1.14, 2.37)
Chasing loose ball 9.6% 10.2% 1.06 (0.75, 1.51)
Ball handling/dribbling 4.5% 7.2% 1.58 (0.97, 2.57)
Receiving pass 4.2% 5.4% 1.19 (0.76, 2.19)
Conditioning 2.4% 3.4% 1.44 (0.72, 2.89)
Other 3.5% 3.6% 1.04 (0.56, 1.93)
Total 100% 100% -
†Totals do not always equal 100% due to slight rounding.

195
23.3 Boys’ Baseball and Girls’ Softball
Table 23.3 Comparison of Baseball and Softball Injury Rates, High School Sports-Related
Injury Surveillance Study, US, 2012-13 School Year
Table 23.30 Comparison of Body Sites of Baseball and Softball Injuries, High School
Sports-Related Injury Surveillance Study, US, 2012-13 School Year
Baseball Softball IPR (95% CI)
Body Site
Head/face 17.1% 23.3% 1.37 (0.96, 1.96)
Arm/elbow 10.6% 6.3% 1.69 (0.92, 3.11)
Hand/wrist 9.8% 10.4% 1.07 (0.63, 1.82)
Shoulder 15.9% 11.7% 1.36 (0.87, 2.14)
Hip/thigh/upper leg 12.2% 7.5% 1.63 (0.93, 2.84)
Ankle 11.8% 15.4% 1.31 (0.83, 2.06)
Trunk 4.9% 3.8% 1.30 (0.56, 3.03)
Knee 8.1% 13.8% 1.69 (1.00, 2.86)
Lower leg 4.1% 3.8% 1.08 (0.45, 2.62)
Foot 1.6% 2.1% 1.28 (0.35, 4.71)
Neck 2.4% 0.8% 2.93 (0.60, 14.36)
Other 1.6% 1.3% 1.30 (0.29, 5.75)
Total 100% 100% -
†Totals do not always equal 100% due to slight rounding.
Baseball Softball RR (95% CI)
Total 0.85 1.17 1.37 (1.15, 1.64)
Competition 1.32 1.87 1.42 (1.11, 1.81)
Practice 0.61 0.81 1.33 (1.02, 1.73)
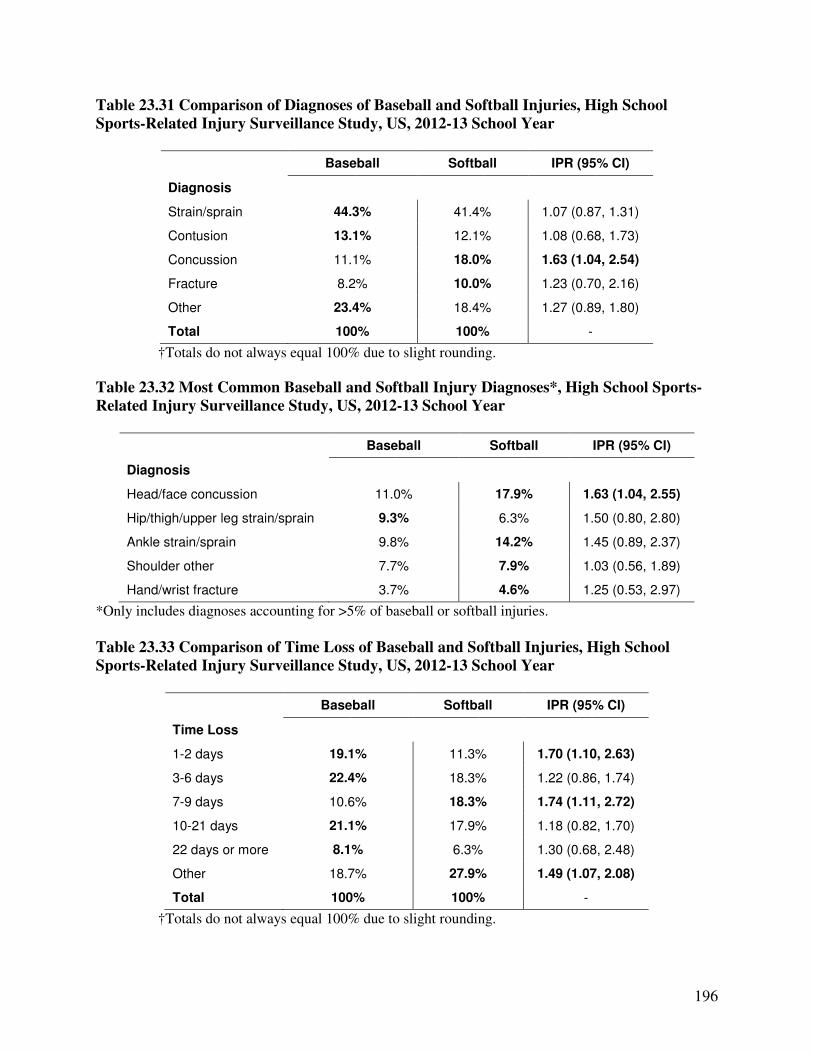
196
Table 23.31 Comparison of Diagnoses of Baseball and Softball Injuries, High School
Sports-Related Injury Surveillance Study, US, 2012-13 School Year
Baseball Softball IPR (95% CI)
Diagnosis
Strain/sprain 44.3% 41.4% 1.07 (0.87, 1.31)
Contusion 13.1% 12.1% 1.08 (0.68, 1.73)
Concussion 11.1% 18.0% 1.63 (1.04, 2.54)
Fracture 8.2% 10.0% 1.23 (0.70, 2.16)
Other 23.4% 18.4% 1.27 (0.89, 1.80)
Total 100% 100% -
†Totals do not always equal 100% due to slight rounding.
Table 23.32 Most Common Baseball and Softball Injury Diagnoses*, High School Sports-
Related Injury Surveillance Study, US, 2012-13 School Year
Baseball Softball IPR (95% CI)
Diagnosis
Head/face concussion 11.0% 17.9% 1.63 (1.04, 2.55)
Hip/thigh/upper leg strain/sprain 9.3% 6.3% 1.50 (0.80, 2.80)
Ankle strain/sprain 9.8% 14.2% 1.45 (0.89, 2.37)
Shoulder other 7.7% 7.9% 1.03 (0.56, 1.89)
Hand/wrist fracture 3.7% 4.6% 1.25 (0.53, 2.97)
*Only includes diagnoses accounting for >5% of baseball or softball injuries.
Table 23.33 Comparison of Time Loss of Baseball and Softball Injuries, High School
Sports-Related Injury Surveillance Study, US, 2012-13 School Year
Baseball Softball IPR (95% CI)
Time Loss
1-2 days 19.1% 11.3% 1.70 (1.10, 2.63)
3-6 days 22.4% 18.3% 1.22 (0.86, 1.74)
7-9 days 10.6% 18.3% 1.74 (1.11, 2.72)
10-21 days 21.1% 17.9% 1.18 (0.82, 1.70)
22 days or more 8.1% 6.3% 1.30 (0.68, 2.48)
Other 18.7% 27.9% 1.49 (1.07, 2.08)
Total 100% 100% -
†Totals do not always equal 100% due to slight rounding.
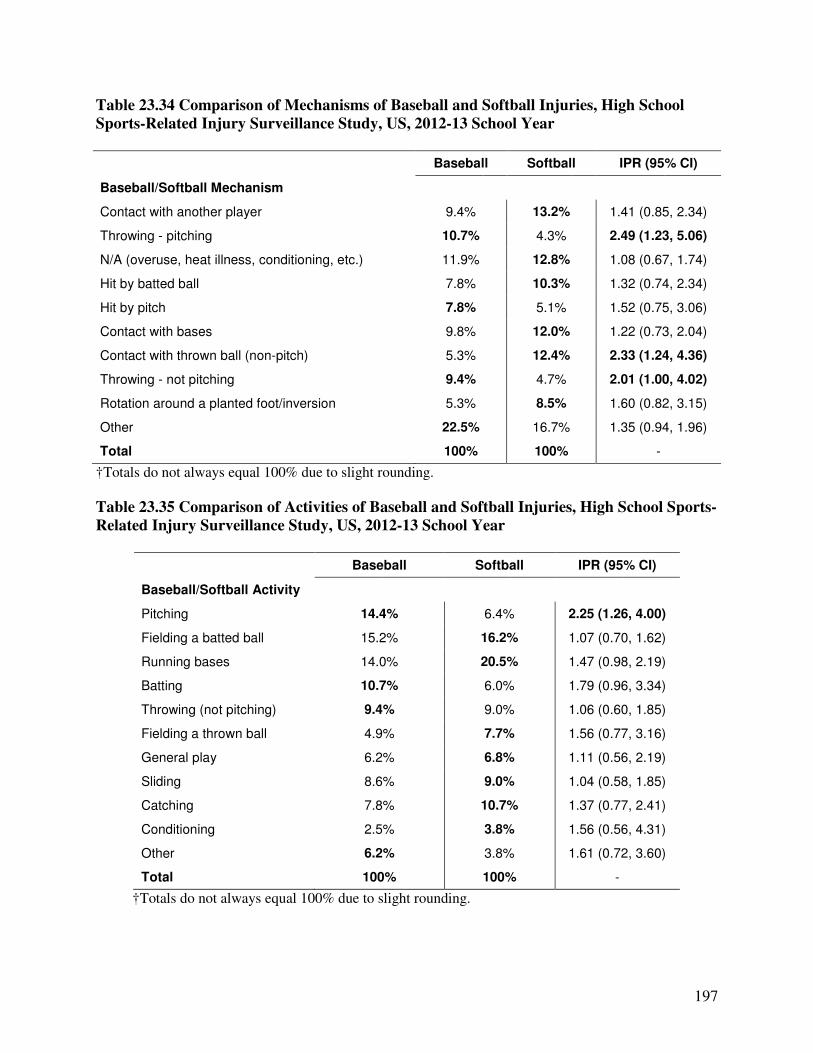
197
Table 23.34 Comparison of Mechanisms of Baseball and Softball Injuries, High School
Sports-Related Injury Surveillance Study, US, 2012-13 School Year
Baseball Softball IPR (95% CI)
Baseball/Softball Mechanism
Contact with another player 9.4% 13.2% 1.41 (0.85, 2.34)
Throwing - pitching 10.7% 4.3% 2.49 (1.23, 5.06)
N/A (overuse, heat illness, conditioning, etc.) 11.9% 12.8% 1.08 (0.67, 1.74)
Hit by batted ball 7.8% 10.3% 1.32 (0.74, 2.34)
Hit by pitch 7.8% 5.1% 1.52 (0.75, 3.06)
Contact with bases 9.8% 12.0% 1.22 (0.73, 2.04)
Contact with thrown ball (non-pitch) 5.3% 12.4% 2.33 (1.24, 4.36)
Throwing - not pitching 9.4% 4.7% 2.01 (1.00, 4.02)
Rotation around a planted foot/inversion 5.3% 8.5% 1.60 (0.82, 3.15)
Other 22.5% 16.7% 1.35 (0.94, 1.96)
Total 100% 100% -
†Totals do not always equal 100% due to slight rounding.
Table 23.35 Comparison of Activities of Baseball and Softball Injuries, High School Sports-
Related Injury Surveillance Study, US, 2012-13 School Year
Baseball Softball IPR (95% CI)
Baseball/Softball Activity
Pitching 14.4% 6.4% 2.25 (1.26, 4.00)
Fielding a batted ball 15.2% 16.2% 1.07 (0.70, 1.62)
Running bases 14.0% 20.5% 1.47 (0.98, 2.19)
Batting 10.7% 6.0% 1.79 (0.96, 3.34)
Throwing (not pitching) 9.4% 9.0% 1.06 (0.60, 1.85)
Fielding a thrown ball 4.9% 7.7% 1.56 (0.77, 3.16)
General play 6.2% 6.8% 1.11 (0.56, 2.19)
Sliding 8.6% 9.0% 1.04 (0.58, 1.85)
Catching 7.8% 10.7% 1.37 (0.77, 2.41)
Conditioning 2.5% 3.8% 1.56 (0.56, 4.31)
Other 6.2% 3.8% 1.61 (0.72, 3.60)
Total 100% 100% -
†Totals do not always equal 100% due to slight rounding.

198
23.4 Boys’ and Girls’ Swimming
Table 23.4 Comparison of Boys’ and Girls’ Swimming Injury Rates, High School Sports-
Related Injury Surveillance Study, US, 2012-13 School Year
Table 23.40 Comparison of Body Sites of Boys’ and Girls’ Swimming and Diving Injuries,
High School Sports-Related Injury Surveillance Study, US, 2012-13 School Year
Boys’ swimming Girls’ swimming IPR (95% CI)
Body Site
Shoulder 50.0% 36.7% 1.36 (0.65, 2.85)
Head/face 16.7% 13.3% 1.25 (0.26, 5.95)
Knee 16.7% 10.0% 1.67 (0.32, 8.76)
Thigh/upper leg 8.3% 3.3% 2.50 (0.17, 36.82)
Trunk 0.0% 13.3% -
Lower leg 8.3% 0.0% -
Foot 0.0% 6.7% -
Ankle 0.0% 3.3% -
Arm/elbow 0.0% 3.3% -
Hand/wrist 0.0% 3.3% -
Other 0.0% 6.7% -
Total 100% 100% -
†Totals do not always equal 100% due to slight rounding.
Boys’ swimming Girls’ swimming RR (95% CI)
Total 0.11 0.26 2.29 (1.19, 4.65)
Competition 0.05 0.48 8.93 (1.50, 195.40)
Practice 0.13 0.21 1.68 (0.81, 3.63)

199
Table 23.41 Comparison of Diagnoses of Boys’ and Girls’ Swimming Injuries, High School
Sports-Related Injury Surveillance Study, US, 2012-13 School Year
Boys’ swimming Girls’ swimming IPR (95% CI)
Diagnosis
Strain/sprain 33.3% 46.7% 1.40 (0.58, 3.40)
Concussion 16.7% 13.3% 1.25 (0.26, 5.95)
Fracture 0.0% 3.3% -
Other 50.0% 36.7% 1.36 (0.65, 2.85)
Total 100% 100% -
†Totals do not always equal 100% due to slight rounding.
Table 23.42 Most Common Boys’ and Girls’ Swimming Injury Diagnoses, High School
Sports-Related Injury Surveillance Study, US, 2012-13 School Year
Boys’ swimming Girls’ swimming IPR (95% CI)
Diagnosis
Shoulder other 41.7% 20.0% 2.08 (0.78, 5.55)
Head/face concussion 16.7% 13.3% 1.25 (0.26, 5.95)
Lower leg other 8.3% 0.0% -
Shoulder strain/sprain 8.3% 16.7% 2.00 (0.26, 15.38)
*Only includes diagnoses accounting for >5% of baseball or softball injuries.
Table 23.43 Comparison of Time Loss of Boys’ and Girls’ Swimming Injuries, High School
Sports-Related Injury Surveillance Study, US, 2012-13 School Year
Boys’ swimming Girls’ swimming IPR (95% CI)
Time Loss
1-2 days 16.7% 13.3% 1.25 (0.26, 5.95)
3-6 days 41.7% 33.3% 1.25 (0.54, 2.89)
7-9 days 16.7% 13.3% 1.25 (0.26, 5.95)
10-21 days 16.7% 30.0% 1.80 (0.45, 7.14)
22 days or more 0.0 3.3% -
Other 8.3% 6.7% 1.25 (0.13, 12.53)
Total 100% 100% -
†Totals do not always equal 100% due to slight rounding.

200
Table 23.44 Comparison of Mechanisms of Boys’ and Girls’ Swimming and Diving
Injuries, High School Sports-Related Injury Surveillance Study, US, 2012-13 School Year
Boys’ swimming Girls’ swimming IPR (95% CI)
Swimming Mechanism
N/A (overuse, heat illness, conditioning, etc.) 75.0% 70.0% 1.07 (0.72, 1.60)
Contact with wall 8.3% 3.3% 2.50 (0.17, 36.82)
Contact with another person 8.3% 10.0% 1.20 (0.14, 10.43)
Other 8.3% 16.7% 2.00 (0.26, 15.38)
Total 100% 100% -
†Totals do not always equal 100% due to slight rounding.
Table 23.45 Comparison of Activities of Boys’ and Girls’ Swimming and Diving Injuries,
High School Sports-Related Injury Surveillance Study, US, 2012-13 School Year
Boys’ swimming Girls’ swimming IPR (95% CI)
Swimming Activity
Swimming 90.9% 60.7% 1.50 (1.05, 2.13)
Flip turn off wall 0.0% 3.6% -
Diving off board/platform/starting platform 0.0% 17.9% -
Other 9.1% 17.9% 1.96 (0.26, 14.97)
Total 100% 100% -
†Totals do not always equal 100% due to slight rounding.

201
23.5 Boys’ and Girls’ Track and Field
Table 23.5 Comparison of Boys’ and Girls’ Track and Field Injury Rates, High School
Sports-Related Injury Surveillance Study, US, 2012-13 School Year
Table 23.50 Comparison of Body Sites of Boys’ and Girls’ Track and Field Injuries, High
School Sports-Related Injury Surveillance Study, US, 2012-13 School Year
Boys’ track Girls’ track IPR (95% CI)
Body Site
Hip/thigh/upper leg 49.7% 35.5% 1.40 (1.10, 1.79)
Lower leg 12.7% 24.1% 1.90 (1.18, 3.05)
Ankle 10.2% 8.4% 1.22 (0.64, 2.33)
Knee 12.3% 11.5% 1.07 (0.61, 1.90)
Trunk 3.2% 4.4% 1.39 (0.48, 4.07)
Foot 6.4% 4.4% 1.44 (0.60, 3.45)
Shoulder 0.6% 2.0% 3.09 (0.35, 27.41)
Head/face 1.9% 3.9% 2.06 (0.56, 7.65)
Arm/elbow 0.6% 1.0% 1.55 (0.14, 16.91)
Hand/wrist 1.9% 1.0% 1.94 (0.33, 11.47)
Neck 0.6% 0.0% -
Other 0.6% 3.0% 4.64 (0.56, 38.15)
Total 100% 100% -
†Totals do not always equal 100% due to slight rounding.
Boys’ track Girls’ track RR (95% CI)
Total 0.55 0.86 1.57 (1.28, 1.94)
Competition 1.08 1.09 1.00 (0.68, 1.47)
Practice 0.42 0.81 1.93 (1.50, 2.50)
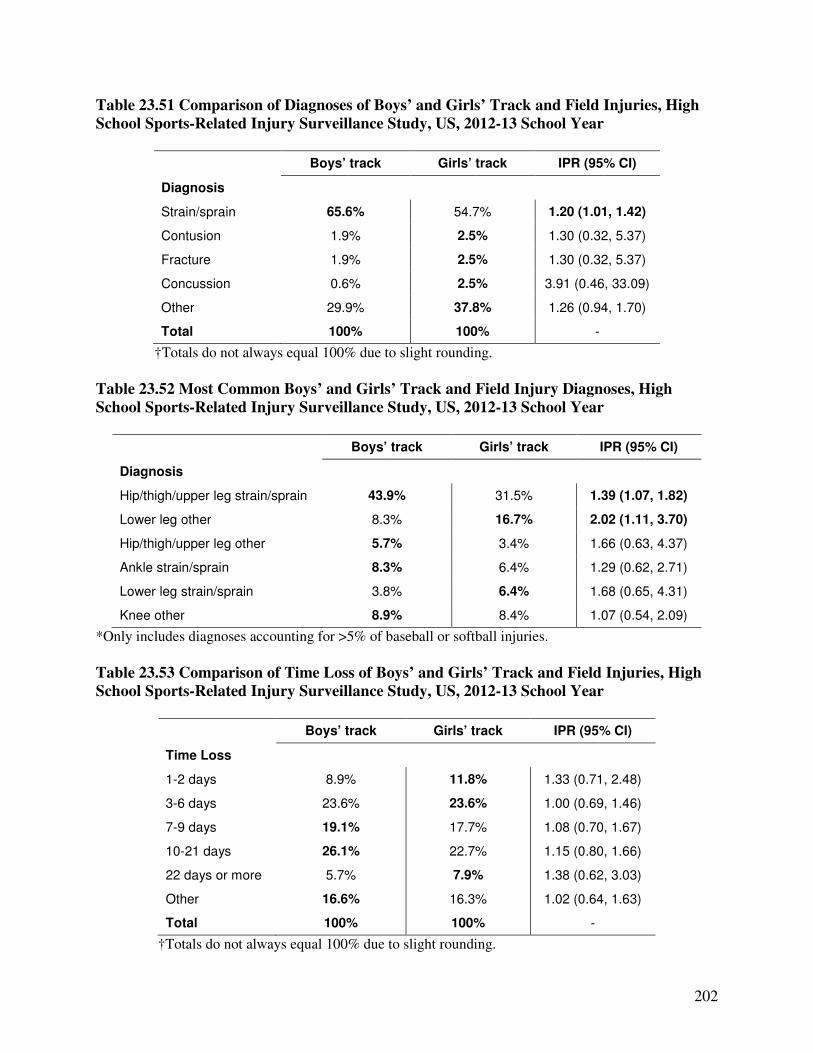
202
Table 23.51 Comparison of Diagnoses of Boys’ and Girls’ Track and Field Injuries, High
School Sports-Related Injury Surveillance Study, US, 2012-13 School Year
Boys’ track Girls’ track IPR (95% CI)
Diagnosis
Strain/sprain 65.6% 54.7% 1.20 (1.01, 1.42)
Contusion 1.9% 2.5% 1.30 (0.32, 5.37)
Fracture 1.9% 2.5% 1.30 (0.32, 5.37)
Concussion 0.6% 2.5% 3.91 (0.46, 33.09)
Other 29.9% 37.8% 1.26 (0.94, 1.70)
Total 100% 100% -
†Totals do not always equal 100% due to slight rounding.
Table 23.52 Most Common Boys’ and Girls’ Track and Field Injury Diagnoses, High
School Sports-Related Injury Surveillance Study, US, 2012-13 School Year
Boys’ track Girls’ track IPR (95% CI)
Diagnosis
Hip/thigh/upper leg strain/sprain 43.9% 31.5% 1.39 (1.07, 1.82)
Lower leg other 8.3% 16.7% 2.02 (1.11, 3.70)
Hip/thigh/upper leg other 5.7% 3.4% 1.66 (0.63, 4.37)
Ankle strain/sprain 8.3% 6.4% 1.29 (0.62, 2.71)
Lower leg strain/sprain 3.8% 6.4% 1.68 (0.65, 4.31)
Knee other 8.9% 8.4% 1.07 (0.54, 2.09)
*Only includes diagnoses accounting for >5% of baseball or softball injuries.
Table 23.53 Comparison of Time Loss of Boys’ and Girls’ Track and Field Injuries, High
School Sports-Related Injury Surveillance Study, US, 2012-13 School Year
Boys’ track Girls’ track IPR (95% CI)
Time Loss
1-2 days 8.9% 11.8% 1.33 (0.71, 2.48)
3-6 days 23.6% 23.6% 1.00 (0.69, 1.46)
7-9 days 19.1% 17.7% 1.08 (0.70, 1.67)
10-21 days 26.1% 22.7% 1.15 (0.80, 1.66)
22 days or more 5.7% 7.9% 1.38 (0.62, 3.03)
Other 16.6% 16.3% 1.02 (0.64, 1.63)
Total 100% 100% -
†Totals do not always equal 100% due to slight rounding.

203
Table 23.54 Comparison of Mechanisms of Boys’ and Girls’ Track and Field Injuries, High
School Sports-Related Injury Surveillance Study, US, 2012-13 School Year
Boys’ track Girls’ track IPR (95% CI)
Track Mechanism
N/A (e.g., overuse, heat illness, conditioning, etc.) 66.0% 70.2% 1.06 (0.92, 1.23)
Contact with ground/track/surface 8.0% 8.9% 1.11 (0.55, 2.26)
Fall/trip 4.7% 2.6% 1.78 (0.58, 5.51)
Rotation around planted foot/inversion 4.0% 5.2% 1.31 (0.49, 3.52)
Contact with field equipment 4.7% 5.2% 1.12 (0.44, 2.88)
Uneven playing surface 0.7% 2.6% 3.93 (0.46, 33.25)
Stepped on/kicked 0.7% 0.0% -
Contact with another person 2.7% 0.0% -
Other 8.7% 5.2% 1.66 (0.75, 3.67)
Total 100% 100% -
†Totals do not always equal 100% due to slight rounding.
Table 23.55 Comparison of Activities of Boys’ and Girls’ Track and Field Injuries, High
School Sports-Related Injury Surveillance Study, US, 2012-13 School Year
Boys’ track Girls’ track IPR (95% CI)
Track Activity
Running 68.4% 73.3% 1.07 (0.93, 1.23)
Jumping/landing 16.4% 9.2% 1.78 (1.01, 3.14)
Conditioning 3.9% 2.6% 1.54 (0.48, 4.95)
Throwing 3.3% 3.6% 1.09 (0.35, 3.37)
Running hurdles 2.6% 7.2% 2.73 (0.92, 8.12)
Warming up 1.3% 1.0% 1.28 (0.18, 9.00)
Leaving block 0.0% 0.5% -
Hit by shot put/discus/javelin/hammer 0.0% 0.5% -
Other 3.9% 2.1% 1.92 (0.55, 6.70)
Total 100% 100% -
†Totals do not always equal 100% due to slight rounding.

204
23.6 Boys’ and Girls’ Cross Country
Table 23.6 Comparison of Boys’ and Girls’ Cross Country Injury Rates, High School
Sports-Related Injury Surveillance Study, US, 2012-13 School Year
Table 23.60 Comparison of Body Sites of Boys’ and Girls’ Cross Country Injuries, High
School Sports-Related Injury Surveillance Study, US, 2012-13 School Year
Boys’ cross country Girls’ cross country IPR (95% CI)
Body Site
Lower leg 31.0% 36.3% 1.17 (0.79, 1.74)
Hip/thigh/upper leg 23.8% 27.4% 1.15 (0.71, 1.86)
Knee 19.0% 9.7% 1.97 (0.98, 3.95)
Ankle 13.1% 13.7% 1.05 (0.52, 2.12)
Foot 3.6% 8.1% 2.26 (0.64, 7.96)
Trunk 2.4% 2.4% 1.02 (0.17, 5.95)
Head/face 1.2% 0.8% 1.48 (0.09, 23.28)
Shoulder 0.0% 0.8% -
Other 6.0% 0.8% 7.38 (0.88, 62.05)
Total 100% 100% -
†Totals do not always equal 100% due to slight rounding.
Boys’ cross country Girls’ cross country RR (95% CI)
Total 0.65 1.10 1.69 (1.28, 2.23)
Competition 0.78 1.13 1.45 (0.77, 2.77)
Practice 0.62 1.09 1.75 (1.29, 2.39)
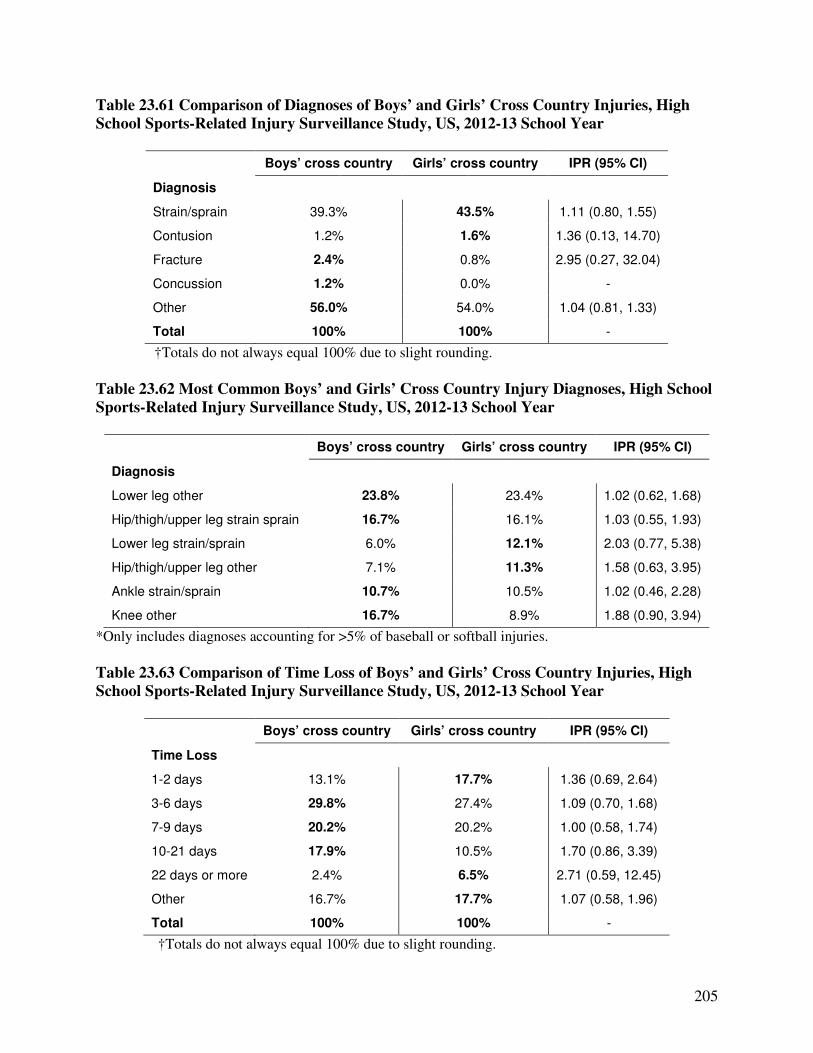
205
Table 23.61 Comparison of Diagnoses of Boys’ and Girls’ Cross Country Injuries, High
School Sports-Related Injury Surveillance Study, US, 2012-13 School Year
Boys’ cross country Girls’ cross country IPR (95% CI)
Diagnosis
Strain/sprain 39.3% 43.5% 1.11 (0.80, 1.55)
Contusion 1.2% 1.6% 1.36 (0.13, 14.70)
Fracture 2.4% 0.8% 2.95 (0.27, 32.04)
Concussion 1.2% 0.0% -
Other 56.0% 54.0% 1.04 (0.81, 1.33)
Total 100% 100% -
†Totals do not always equal 100% due to slight rounding.
Table 23.62 Most Common Boys’ and Girls’ Cross Country Injury Diagnoses, High School
Sports-Related Injury Surveillance Study, US, 2012-13 School Year
Boys’ cross country Girls’ cross country IPR (95% CI)
Diagnosis
Lower leg other 23.8% 23.4% 1.02 (0.62, 1.68)
Hip/thigh/upper leg strain sprain 16.7% 16.1% 1.03 (0.55, 1.93)
Lower leg strain/sprain 6.0% 12.1% 2.03 (0.77, 5.38)
Hip/thigh/upper leg other 7.1% 11.3% 1.58 (0.63, 3.95)
Ankle strain/sprain 10.7% 10.5% 1.02 (0.46, 2.28)
Knee other 16.7% 8.9% 1.88 (0.90, 3.94)
*Only includes diagnoses accounting for >5% of baseball or softball injuries.
Table 23.63 Comparison of Time Loss of Boys’ and Girls’ Cross Country Injuries, High
School Sports-Related Injury Surveillance Study, US, 2012-13 School Year
Boys’ cross country Girls’ cross country IPR (95% CI)
Time Loss
1-2 days 13.1% 17.7% 1.36 (0.69, 2.64)
3-6 days 29.8% 27.4% 1.09 (0.70, 1.68)
7-9 days 20.2% 20.2% 1.00 (0.58, 1.74)
10-21 days 17.9% 10.5% 1.70 (0.86, 3.39)
22 days or more 2.4% 6.5% 2.71 (0.59, 12.45)
Other 16.7% 17.7% 1.07 (0.58, 1.96)
Total 100% 100% -
†Totals do not always equal 100% due to slight rounding.
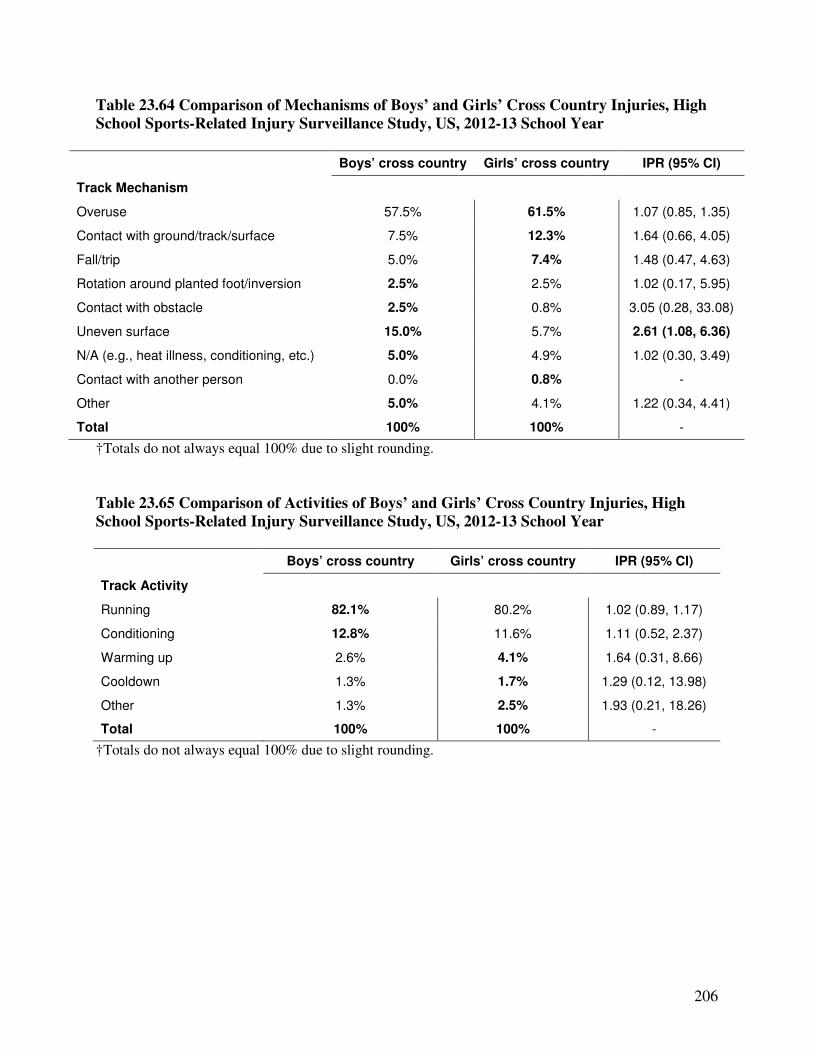
206
Table 23.64 Comparison of Mechanisms of Boys’ and Girls’ Cross Country Injuries, High
School Sports-Related Injury Surveillance Study, US, 2012-13 School Year
Boys’ cross country Girls’ cross country IPR (95% CI)
Track Mechanism
Overuse 57.5% 61.5% 1.07 (0.85, 1.35)
Contact with ground/track/surface 7.5% 12.3% 1.64 (0.66, 4.05)
Fall/trip 5.0% 7.4% 1.48 (0.47, 4.63)
Rotation around planted foot/inversion 2.5% 2.5% 1.02 (0.17, 5.95)
Contact with obstacle 2.5% 0.8% 3.05 (0.28, 33.08)
Uneven surface 15.0% 5.7% 2.61 (1.08, 6.36)
N/A (e.g., heat illness, conditioning, etc.) 5.0% 4.9% 1.02 (0.30, 3.49)
Contact with another person 0.0% 0.8% -
Other 5.0% 4.1% 1.22 (0.34, 4.41)
Total 100% 100% -
†Totals do not always equal 100% due to slight rounding.
Table 23.65 Comparison of Activities of Boys’ and Girls’ Cross Country Injuries, High
School Sports-Related Injury Surveillance Study, US, 2012-13 School Year
Boys’ cross country Girls’ cross country IPR (95% CI)
Track Activity
Running 82.1% 80.2% 1.02 (0.89, 1.17)
Conditioning 12.8% 11.6% 1.11 (0.52, 2.37)
Warming up 2.6% 4.1% 1.64 (0.31, 8.66)
Cooldown 1.3% 1.7% 1.29 (0.12, 13.98)
Other 1.3% 2.5% 1.93 (0.21, 18.26)
Total 100% 100% -
†Totals do not always equal 100% due to slight rounding.

207
XXIV. Reporter Demographics & Compliance
208
During the 2012-13 school year, 246 ATs were invited to participate in the study at the
beginning of the school year. ATs were expected to report for every week in which they were
enrolled. For example, an AT who joined the study as a replacement school in week 10 was not
expected to report for weeks 1-9. Overall, 208 enrolled ATs reported an average of 40 study
weeks. The majority of ATs (86.1%) reported all the weeks during which they were enrolled,
with only 12.5% of ATs missing over 10 weeks. Internal validity checks during the 2012-13
academic year yielded 95.8% sensitivity, 100.0% specificity, a positive predictive value of
100.0%, and a negative predictive value of 98.2%.
Prior to the start of the 2012-13 High School RIOTM study, participating ATs were asked
to complete a short demographics survey. Three-quarters (81.0%) of participating high schools
were public schools, with the remainder being private. All ATs except one provided services to
athletes of their high school on 5 or more days each week. Over 80% (84.0%) of ATs
participating during the 2012-13 study year had previously participated in the High School
RIO™ study.
An online “End of Season” survey gave all participating ATs (both in the original study
as well as in the expanded study (n=216 including those ATs who did not report any data)) the
opportunity to provide feedback on their experiences with High School RIOTM. This survey was
completed by 138 ATs (63.9%). Average reporting time burdens were 17 minutes for the
weekly exposure report and 9 minutes for the injury report form. Using a 5 point Likert scale,
RIOTM was overwhelmingly reported to be either very easy (56.5%) or somewhat easy (37.0%)
to use (5 and 4 on the Likert scale, respectively), with ATs being either very satisfied (70.0%) or
somewhat satisfied (24.6%) with the study (5 and 4 on the Likert scale, respectively).
Suggestions provided by ATs, such as the addition or clarification of questions or answer

209
choices, will be used to improve the National High School Sports-Related Injury Surveillance
Study for the 2013-14 school year.

210
XXV. Summary

211
High school sports play an important role in the adoption and maintenance of a physically
active lifestyle among millions of US adolescents. Too often injury prevention in this population
is overlooked as sports-related injuries are thought to be unavoidable. In reality, sports-related
injuries are largely preventable through the application of evidence-based preventive
interventions. Such preventive interventions can include educational campaigns, introduction of
new/improved protective equipment, rule changes, other policy changes, etc. The morbidity,
mortality, and disability caused by high school sports-related injuries can be reduced through the
development and implementation of improved injury diagnosis and treatment modalities as well
as through effective prevention strategies. However, surveillance of exposure based injury rates
in a large nationally disperse sample of high school athletes and subsequent epidemiologic
analysis of patterns of injury are needed to drive evidence-based prevention practices.
Prior to the implementation of the High School Sports-Related Injury Surveillance Study
by Dr. Comstock, the study of high school sports-related injuries had largely been limited by an
inability to calculate injury rates due to a lack of exposure data (i.e., frequency of participation in
athletic activities including training, practice, and competition), an inability to compare findings
across groups (i.e., sports/activities, genders, schools, and levels of competition), or an inability
to generalize findings from small non-representative samples. The value of national injury
surveillance studies that collect injury, exposure, and risk factor data from representative samples
has been well demonstrated by the National Collegiate Athletic Association’s Injury Surveillance
System (NCAA ISS). Data collected by the NCAA ISS since 1982 has been used to develop
preventive interventions including changes in coaching habits, increased use of protective
equipment, and rule changes which have had proven success in reducing injuries among
collegiate athletes. For example, NCAA ISS data has been used to develop several interventions
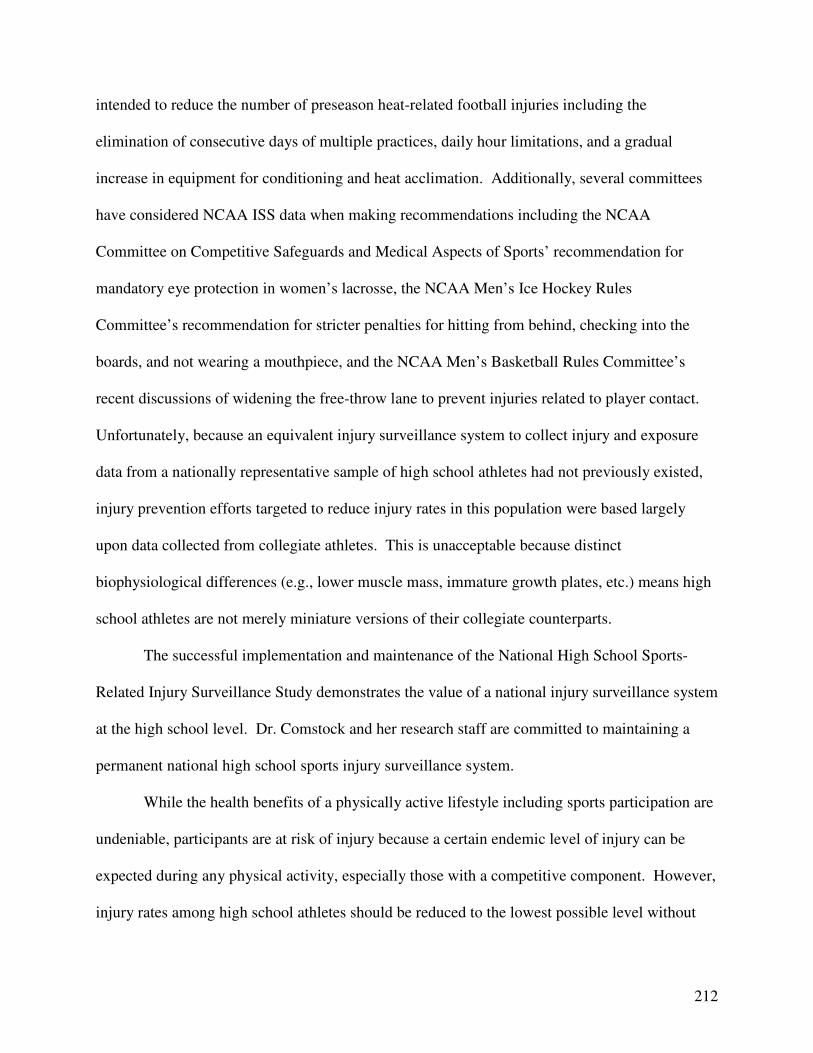
212
intended to reduce the number of preseason heat-related football injuries including the
elimination of consecutive days of multiple practices, daily hour limitations, and a gradual
increase in equipment for conditioning and heat acclimation. Additionally, several committees
have considered NCAA ISS data when making recommendations including the NCAA
Committee on Competitive Safeguards and Medical Aspects of Sports’ recommendation for
mandatory eye protection in women’s lacrosse, the NCAA Men’s Ice Hockey Rules
Committee’s recommendation for stricter penalties for hitting from behind, checking into the
boards, and not wearing a mouthpiece, and the NCAA Men’s Basketball Rules Committee’s
recent discussions of widening the free-throw lane to prevent injuries related to player contact.
Unfortunately, because an equivalent injury surveillance system to collect injury and exposure
data from a nationally representative sample of high school athletes had not previously existed,
injury prevention efforts targeted to reduce injury rates in this population were based largely
upon data collected from collegiate athletes. This is unacceptable because distinct
biophysiological differences (e.g., lower muscle mass, immature growth plates, etc.) means high
school athletes are not merely miniature versions of their collegiate counterparts.
The successful implementation and maintenance of the National High School Sports-
Related Injury Surveillance Study demonstrates the value of a national injury surveillance system
at the high school level. Dr. Comstock and her research staff are committed to maintaining a
permanent national high school sports injury surveillance system.
While the health benefits of a physically active lifestyle including sports participation are
undeniable, participants are at risk of injury because a certain endemic level of injury can be
expected during any physical activity, especially those with a competitive component. However,
injury rates among high school athletes should be reduced to the lowest possible level without

213
discouraging adolescents from engaging in this important form of physical activity. This goal
can best be accomplished by monitoring injury rates and patterns of injury among high school
athletes over time; investigating the etiology of preventable injuries; and developing,
implementing, and evaluating evidence-based preventive interventions. Surveillance systems
such as the model used for this study are critical in achieving these goals.