control systems laboratory manual hardware and software ...whoy/manual.pdf · control systems...
TRANSCRIPT

Control Systems Laboratory Manual
Hardware and Software Overview
1 Introduction
The undergraduate Control Systems Lab is located in ETLC E5-006. In the lab, there are 15 PCsequipped with data acquisition systems running under the Windows 2000 environment. The hard-ware equipment and some software tools, e.g., WinCon 3.2, are manufactured by Quanser Consulting(www.quanser.com), a Canadian company developing real-time control systems for education and re-search.
This document introduces some of the hardware equipment and software tools to be used in theControl Systems Lab. Familiarity with this document is assumed in the labs. Briefly, this document isorganized as follows:
Section 2 describes the hardware equipment;
Section 3 describes the software tools;
Section 4 provides an example of using the hardware and software;
Section 5 lists the issues related to safety and caution
2 Hardware Equipment
The hardware devices to be introduced are analog plant simulators, data acquisition systems, powermodules, and servo-motors.
2.1 Analog Plant Simulator (EE357 Only)
An analog plant simulator (APS) is shown in Figure 1, which consists of a set of 11 independentelectronic circuits (building blocks) that can be interconnected to study the behavior of dynamicalsystems. A series of potentiometers allow you to adjust the parameters of each block within a certainrange. RCA jacks are used throughout so you can easily connect the output of one block to the inputof another. A DC power unit for the APS is converts AC (from a wall power outlet) to DC for theAPS.
The 11 building blocks on the APS are listed below:
Qty Label I/O Relation or TF Parameter Range
1 Sum y = u1 + u2
2 Diff y = u1 − u2
2 Gain y = K · u K: 0-10.
3 Lag (1st-order) H1(s) =As+A
A: 0-10.
2 Lag (2nd-order) H2(s) =D0
s2+D1s+D0
D0: 0-104; D1: 0-2000.
1 PID (with switchset to 1)
Y =(Kp +
Ki
s
)(U−Ud)+KdsUd Kp: 0-10; Kd: 0-2; Ki: 0-10.
1 PID (with switchset to 2)
Y =(Kp +Kds+
Ki
s
)(U −Ud) Kp: 0-10; Kd: 0-2; Ki: 0-10.
Refer to the following data sheet for more information on the Analog Plant Simulator:http://www.ee.ualberta.ca/∼pdenboef/data sheets/Analog Plant Simulator.pdf
1

Figure 1: The analog plant simulator (APS)
2.2 Data Acquisition System
For computer implemented controllers, analog-to-digital (A/D) and digital-to-analog (D/A) conversionsare necessary. These are done using the data acquisition and control board (DACB), which inputs themeasured signal(s) to the computer and outputs control action to the actuator in the control loop. TheDACB in this lab consists of two parts: the MultiQ-PCI data acquisition card and terminal board,which are both made by Quanser Consulting.
Figure 2 shows a photo of the MultiQ-PCI data acquisition card, which has 8 analog inputs, 8analog outputs (only 4 available with our terminal board), 16 bits of digital inputs and outputs, 3programmable timers, and up to 6 encoder inputs decoded in quadrature. These data acquisition cardsare installed in PCI slots inside the computers.
Figure 2: The MultiQ-PCI data acquisition card (inside the PC)
The MultiQ-PCI terminal board, shown in Figure 3, is a bench-top board for interfacing the MultiQ-PCI data acquisition card with other analog equipment such as the APS, servo-motor, and powermodule. Five grey ribbon cables are used for connection — see Figure 3. Further details on properconnections will be discussed in the individual lab handouts.
Refer to the following data sheets for more information on the data acquisition system:
2

Analog Outputs(to UPM)
Analog Inputs(from Plant)
Encoder Inputs(from Plant)
To MultiQ PCI DataAcquisition Card
Digital I/OPorts
0
1
2
3
0
1
2
3
4
5
6
7
0
1
2
3
4
5
Figure 3: The MultiQ-PCI terminal board
http://www.ee.ualberta.ca/∼pdenboef/data sheets/MultiQ PCI Reference Manual.pdf
http://www.ee.ualberta.ca/∼pdenboef/data sheets/MultiQ PCI Terminal Board Manual.pdf
2.3 Universal Power Module
The universal power module (UPM-2405), part of which is shown in Figure 4, is a linear power opera-tional amplifier. The MultiQ-PCI data acquisition card cannot deliver enough power to the actuatorsused in this lab; therefore, a signal buffer is needed. The UPM-2405 is used as our signal buffer sinceit can deliver up to 5A to an actuator in a non-inverting, unity-gain configuration.
Figure 4: Top front view of the universal power module
The following connections can be made to/from the UPM (see also Figure 4):
• From analog sensors: There are four (S1-S4) inputs which can be connected from analog sensors
3

(and then subsequently to the computer); the cable used is a “6-pin mini-din/6-pin mini-din”cable (light tan color), which is now referred to as the analog sensor cable .
• To A/D: The four analog sensor signals (S1-S4) can then be connected to the MultiQ-PCI termi-nal board for A/D conversion into the computer; the cable used is a ”5-pin din-stereo/4×RCA”cable (black color), which is now refereed to as the A/D cables.
• From D/A: This is where you input the D/A signal from the MultiQ-PCI terminal board tothe UPM; the cable used is a ”5-pin din-mono/RCA” cable (black color), which is now refereedto as theD/A cable.
• To load: Here you connect the amplified D/A signal to an actuator (e.g. servo-motor); Thecable used is a ”6-pin din/4-pin din” cable (black color), which is now refereed to as the loadcable.
• Others: A few other connections are possible for convenience: e.g., the power supply on the topleft is for ±12 volts; the signals from analog sensors S1-S4 can be easily monitored by connectingto a scope.
2.4 Servo-motor
The Quanser DC servo-motor (SRV02) is shown in Figure 5. A 3W motor is mounted in a solidaluminum frame and drives a built-in Swiss-made 14.1 : 1 gearbox whose output drives an externalgear, which is attached to an independent output shaft that rotates in an aluminum ball-bearing block.The output shaft is equipped with an encoder. The external gear on the output shaft drives an anti-backlash gear connected to a precision potentiometer for measuring the output angle. The externalgear ratio can be changed from 1 : 1 to 5 : 1 using different gears. Two inertial loads are suppliedwith the system in order to examine the effect of changing inertia on motor performance. The motoris configured using the armature control scheme.
Several connections are available for the servo-motor as seen in Figure 5. The input voltage connectsto the UPM using the load cable. The potentiometer and tachometer ports connect to the UPM-2405 using sensor cables and are used to measure angular position and angular velocity, respectively.Additionally, the shaft encoder port connects to the terminal board using an encoder cable and is usedto measure angular position.
The following calibration factors are needed in order to use the sensors in units of degrees or radians:
Connection Conversion (Rad) Conversion (Deg)
Encoder −
2π
4096rad −
360
4096deg
Tachometer 1radsec
180
π
rad
sec
Potentiometer 1
4096rad 180
4096πrad
Two external gear ratios are available for the servo-motor: the low gear ratio (Figure 6) and thehigh gear ratio (Figure 7). Normally, the first one is used in motor position control experiments, andthe second is used when the motor acts as an actuator to drive other plants such as the ball and beam,or the inverted pendulum.
Different amounts of inertia can be bolted to middle gear of the servomotor. This achieves a different
plant for each servomotors.
Refer to the following data sheets for more information on the Servo-motor:
http://www.ee.ualberta.ca/∼pdenboef/data sheets/SRV03.pdf
http://www.ee.ualberta.ca/∼pdenboef/data sheets/micromo2338.pdf
4

Figure 5: rear view of the servo-motor
Figure 6: Servo-motor: low gear ratio
Figure 7: Servo-motor: high gear ratio
5

3 Software Tools
The software tools used in the lab are:
• MATLAB/Simulink with its Control Systems Toolbox
• WinCon
• RTX Runtime
• Visual C++
WinCon is developed by Quanser Consulting to interface MATLAB/Simulink with hardware equip-ment, e.g., the MultiQ-PCI data acquisition system. WinCon uses a Simulink model to generate,compile using Visual C++, and run the program to control the MultiQ-PCI data acquisition system.Venturcom produces the RTX Runtime application, which gives a real time running environment forthe MultiQ-PCI control programs despite using Windows, a non real time OS. In this section, we willfocus on Simulink and WinCon.
3.1 Simulink
Simulink allows a MATLAB user to simulate complex control systems through block diagram connec-tions. In this section, we briefly introduce the steps to use Simulink.
• Starting: Typing in Simulink in the MATLAB command window will open the Simulink window,see Figure 8. By selecting New from the File menu, you get a new system window, which youuse to build a Simulink model. This model can be saved as a mdl-file for further editing andsimulation.
Figure 8: Initial Simulink Window
• Creating blocks: Simulink has a standard block library shown in Figure 8 under the sub-groupSimulink; additionally, there are extended block libraries such as Communication Blockset,
6

Control System Toolbox, and so on. To create a Simulink model, drag and drop the requiredblocks into the system window, as shown in Figure 9 (left side).
• Connecting inputs and outputs: To connect the output of block A to the input of block B, leftclick the output port of block A, drag it to the input port of block B, and release the mousebutton. To connect a point in a data line with an input or output port, press and hold the Ctrlkey, and then click on the point in the line and drag it over to the port. When the ports areconnected, the angle brackets disappear and directed lines indicate information flow as shown infigure 9 (right side).
Figure 9: Placing and connecting blocks in Simulink
• Simulation parameters: View and edit the simulation parameters by selecting Parameters fromthe Simulation menu as shown in figure 10. The parameters worth noting are:
(a) Solver method: fixed-step is the default. You should change this to variable step usingODE5 when you are using blocks from the “continuous” toolbox.
(b) Start and stop time: 0 and 10 seconds is the default
(c) Step size: 0.001 seconds is the default; this parameter should be increased (e.g. 0.01 seconds)for longer simulations.
After setting the simulation parameters as required, close the dialog box by clicking OK.
• Simulating: To start the simulation, select Start from the Simulation menu. The simulationbegins and the scope stores the output time response; double click on the scope to see the plot.
• Plotting: The best way to capture the generated data is to use the To File block under theSimulink sub-group. This block will save the data in a *.mat file. The data in the *.mat file canbe loaded into the MATLAB workspace using the load command. The data can subsequentlybe viewed, analyzed and plotted.
3.2 WinCon
WinCon, a software package from Quanser Consulting, is a real-time application that runs Simulinkgenerated code using RTX Runtime on a PC under running Windows. WinCon allows controllersconstructed in Simulink diagrams to be implemented in real time via the computer. For such a typicalapplication, you need to start a WinCon Server and a WinCon Client. (One WinCon Server cancommunicate with several WinCon Clients, and visa versa.) In the simple case, one PC and nonetwork, the configuration and required software tools are illustrated in Figure 11.
7

Figure 10: Simulink simulation parameters
Win2K MATLAB/SIMULINK VC++
WinCon
Server
WinCon
Client
MultiQ3-PCI
Local User Plant to be
Controlled
Same PC
RTX
Figure 11: Stand-alone PC configuration
8

WinCon Server:
The WinCon Server performs the following tasks:
• Converts a Simulink diagram into a WinCon controller library wcl-file using the MATLAB Real-Time Workshop;
• Compile and link the code using Visual C++;
• Download the WinCon controller library file to run on the WinCon Client;
• Start and stop the WinCon Client;
• Maintain TCP/IP communications with the WinCon Client;
• Maintain communications with Simulink for updating real-time changes in the controller param-eters;
• Make changes to WinCon Client parameters using Control Panels;
• Plot the data streamed from a desired WinCon Client in real time;
• Save data to disk;
• Offer an External Interface Window to allow outside applications to receive streamed data froma WinCon Client and to perform real-time changes to the WinCon Client parameters.
WinCon Client:
The WinCon Client is a real-time application that runs the code generated from the Simulink diagramat the sampling rate specified; its functions are summarized below:
• Receive the controller code from the WinCon Server as a WinCon controller library wcl-file;
• Run the controller code in real time;
• Maintain communications with the WinCon Server;
• Stream real-time data to any WinCon Server(s) requesting it.
MultiQ-PCI Terminal Board and WinCon in Simulink:
WinCon is fully compatible with the MultiQ-PCI terminal board. Open the Simulink Library Browserand find the library of board drivers — see Figure 12. The blocks can be placed in a system window.Double clicking on the block opens the block properties dialog.
• Analog input: The analog input dialog allows you to specify the channel number (i.e. the analoginput port used on the terminal board). The board number and sample time should be kept totheir respective defaults as shown in figure 13. The input voltage has a resolution of 12 bits andhas a programmable voltage range of up to ±10 volts.
• Analog output: The analog output dialog allows you to specify the channel number. (i.e. theanalog output port used on the terminal board). The board number, initial value, final value,and sample time should be kept to their respective defaults as shown in figure 14. The outputvoltage, with a set range of ±10 volts, has a resolution of 13 bits.
9

Figure 12: Viewing the library of board drivers in Simulink
Figure 13: Dialog for the MultiQ-PCI analog input block
10

Figure 14: Dialog for the MultiQ-PCI analog output block
Figure 15: Dialog for the MultiQ-PCI encoder input block
11

• Encoder input: The encoder input dialog allows you to specify the channel number (i.e. theencoder input port used on the terminal board). The board number and initial value should bekept to their respective defaults as shown in figure 15. The encoder gives a positive integer countwith resolution dependant on the type of encoders selected; the encoder counter has 24 bits.
• Digital input and output: The MultiQ series also have 8-bit digital input and output capability.There are currently no plans to employ these I/O ports.
Generating Controller Codes for Simulink Diagrams:
If WinCon is installed properly, a WinConmenu item appears in the Simulink Window, which allows youto generate and run the real-time code seamlessly. Simply construct/load the controller diagram youwant to run in real time; and then in the WinCon menu select Build. This will initiates the process ofgenerating the real-time code. When the process is done, a message appears in the MATLAB windowindicating that a wcl-file has been successfully created. A pop-up window will appear automaticallyfor executing the controller— see Figure 16
Figure 16: Pop-up window for executing controllers
Running Controllers:
You can start and stop the controller on the WinCon Client to which the WinCon Server is connectedusing one of the following two ways:
1. Use the Start/Stop button on the Wincon pop-up window to manually start and stop thesimulation.
2. Use the MATLAB commands wc start and wc stop to start and stop the simulation, respectively.These commands are particularly useful for automating multiple trial operation.
Displaying and Saving Data:
Signals can be displayed from both Simulink by selecting the WinCon→Plot Open menu and the Win-Con Server using the Plot→Openmenu. You can then choose to display a desired variable as a real-timeplot (e.g., x(t) vs. t), a digital meter form (like a digital volt-meter), or an x-y plot (y vs. x).
To save data from a Wincon Server plot, simply click on File→Save The data can be saved in oneof three ways:
• m-file: This creates a .m file. Typing the name of the file in the MATLAB command windowbrings up the MATLAB plot saved; the vector plotted are loaded into the MATLAB workspace.
• mat-file: (Recommended) This creates a .mat file. Use the command load to load the data intothe MATLAB workspace. The time vector is named plot time while the data vector has a nameX Y where X is the Simulink model name and Y is the Simulink scope name, which is “Scope”by default. Use MATLAB command whos to check the name of the variables from the storeddata arrays. Use the commands plot and (optionally) subplot to plot the data.
12

• To workspace: This is equivalent to saving to a .mat file and then loading it into the MATLABworkspace— except that you do not have the data saved in a file.
Alternatively, You can use MATLAB script wc saveplot(’plot title’, ’filename.mat’) tosave your data to a mat-file. The plot title is the name appear at the top of the visual scope.
Refer to the following data sheet for more information on Wincon:http://www.ee.ualberta.ca/∼pdenboef/data sheets/WinCon 3.2 Manual.pdf
http://www.ee.ualberta.ca/∼pdenboef/data sheets/MultiQ PCI Programming Guide for WinCon.pdf
4 An Illustrative Example
This section illustrates how to use Simulink and Wincon in order to perform basic a I/O task withthe DC servo-motor. Follow the outlined procedure below to familiarize yourself with the hardwareand software.
• Build a Simulink model as shown in Figure 17. The model applies a constant voltage to theservo-motor. The encoder is employed to acquire the angular position over time.
Scope
Quanser ConsultingMultiQ-PCI ENC
Encoder Input
Display1
0
Display1
Constant
-K-
Calibration
Quanser ConsultingMultiQ-PCI DAC
Analog Output
Figure 17: Final Simulink diagram for the open-loop servomotor system
• The input and output channel numbers should match the channels used on the terminal board.Refer to figure 3 for terminal board channel location.
• The calibration factors need to be set so that the servo-motor angular position and velocity isacquired in appropriate units. Refer to subsectionr̃efServo-motor for calibration details of theservo-motor.
• Click on Simulation → Simulation Parameters from your Simulink screen. In our examplewe are not using blocks from the continuous library. Therefore, the solver options do not need tobe changed.
• Click on Wincom→ Build from Simulink menu. This generate real-time C code for the diagram.Wait until the compilation process is completed. The MATLAB window displays the progressof the code generation task and when it is completed the message appears:
Successful completion of RTW build procedure for model: xxxxx
Following the code generation, WinCom Server and WinCon Client are automatically started.The generated code is then automatically downloaded to the client and the system is ready torun.
• Click on the Plot button in WinCom Server and select Plot → New → Scope. The names of allblocks in the diagram appear in a Multi Select Variable Tree. You can select the variables whichyou want to display.
13
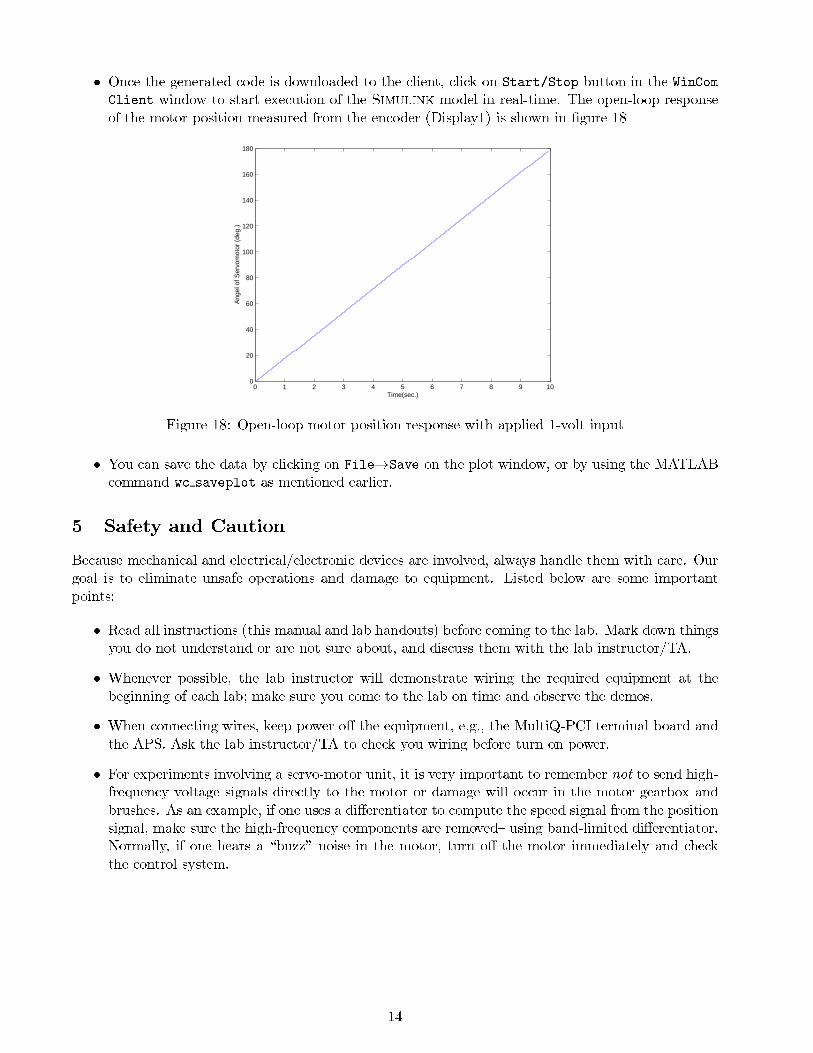
• Once the generated code is downloaded to the client, click on Start/Stop button in the WinComClient window to start execution of the Simulink model in real-time. The open-loop responseof the motor position measured from the encoder (Display1) is shown in figure 18
0 1 2 3 4 5 6 7 8 9 100
20
40
60
80
100
120
140
160
180
Time(sec.)
Ang
el o
f Ser
vom
otor
(de
g.)
Figure 18: Open-loop motor position response with applied 1-volt input
• You can save the data by clicking on File→Save on the plot window, or by using the MATLABcommand wc saveplot as mentioned earlier.
5 Safety and Caution
Because mechanical and electrical/electronic devices are involved, always handle them with care. Ourgoal is to eliminate unsafe operations and damage to equipment. Listed below are some importantpoints:
• Read all instructions (this manual and lab handouts) before coming to the lab. Mark down thingsyou do not understand or are not sure about, and discuss them with the lab instructor/TA.
• Whenever possible, the lab instructor will demonstrate wiring the required equipment at thebeginning of each lab; make sure you come to the lab on time and observe the demos.
• When connecting wires, keep power off the equipment, e.g., the MultiQ-PCI terminal board andthe APS. Ask the lab instructor/TA to check you wiring before turn on power.
• For experiments involving a servo-motor unit, it is very important to remember not to send high-frequency voltage signals directly to the motor or damage will occur in the motor gearbox andbrushes. As an example, if one uses a differentiator to compute the speed signal from the positionsignal, make sure the high-frequency components are removed— using band-limited differentiator.Normally, if one hears a “buzz” noise in the motor, turn off the motor immediately and checkthe control system.
14