control system design for a continuous passive motion machine undergraduate
TRANSCRIPT

CONTROL SYSTEM DESIGN FOR A
CONTINUOUS PASSIVE MOTION MACHINE
Undergraduate Honors Thesis
Presented in partial fulfillment of the requirements
for Graduation with Distinction in the Department of
Mechanical Engineering at the Ohio State University
Submitted by:
Erin M. Parsons
Advisor: Robert A. Siston, Ph. D.
May 2010

ii
Abstract
The knee is a complex joint that is essential for walking, running, kneeling, and climbing
stairs. Injuries and trauma to the knee joint commonly require surgical treatment followed by
post-operative physical therapy rehabilitation. Successful physical therapy treatment plans
involve repetitive flexion and extension of the knee immediately following surgery. A
continuous passive motion machine is commercially available to generate cyclic passive flexion
and extension of the patient’s leg. Continuous passive motion has been shown to reduce joint
stiffness, swelling, and restore the normal range of motion in the knee post-operatively.
However, the number of cycles, the maximum and minimum angles of flexion, and the speed of
the device are input parameters that currently have no standard setting. Defining a standard
physical therapy treatment methodology that specifies the settings of the continuous passive
motion device could decrease the overall treatment time and may improve the patient’s outcome.
Biomechanical evaluation of a knee during continuous passive motion can help to define
standard settings for the input parameters. A testing device similar to a commercially available
continuous passive motion machine can provide researchers with the means to measure the
effects of the input settings. The testing device must have user-friendly operation with input
parameters for the angular flexion velocity and flexion angle of the knee. The purpose of this
project is to develop closed-loop control for the testing device through a graphical user interface
control of the device. The software, mechanical hardware, and electrical hardware operate the
device based on the user input parameters. The testing device will be used for future work in the
Neuromuscular Biomechanics Laboratory to study the biomechanical properties of the knee
undergoing continuous passive motion.

iii
Acknowledgements
Several people have helped me with this project. The other members of the
Neuromuscular Biomechanics Lab have been extremely supportive. They have offered me
words of encouragement and helped guide me through this experience.
Joe West was extremely helpful with all of my questions regarding electronic equipment.
He was very patient with me and took time to teach me the circuit diagrams for my sensors. I
would also like to say thank you for allowing me to borrow your power source and voltmeter on
several occasions.
Neil Gardner and the workers at the machine shop were extremely helpful. Thank you
very much for teaching me how to use the equipment and for giving me advice on the
mechanical design of the potentiometer mount.
All of the technical support and National Instruments was extremely helpful in providing
me with the information I needed to operate my equipment. I would also like to thank the sales
representatives at National Instruments for allowing me quick access to the appropriate software
and working with me to solve software activation problems.
My advisor, Rob Siston, has been guiding me through my undergraduate degree for the
past three years. He introduced me to the field of biomechanics and inspired me to pursue a
doctorate degree. He has unyielding confidence in my capabilities while always demanding
more of me. I want to thank you for challenging me.

iv
Table of Contents Abstract ........................................................................................................................................... ii Acknowledgements ........................................................................................................................ iii Table of Contents ........................................................................................................................... iv List of Figures ................................................................................................................................. v List of Tables ................................................................................................................................. vi Chapter 1: Introduction .................................................................................................................. 1
1.1 Background ........................................................................................................................... 2 1.2 Project Motivation ................................................................................................................. 5 1.3 Previous Research ................................................................................................................. 6 1.4 Scope of Project .................................................................................................................... 7
Chapter 2: Hardware ...................................................................................................................... 7 2.1 Overview of Device .............................................................................................................. 7 2.2 Motion Controller and Driver ............................................................................................... 9 2.3 Servo Motor......................................................................................................................... 10 2.4 Quadrature Encoder............................................................................................................. 15 2.5 Rotary Potentiometer........................................................................................................... 16 2.6 Limit Switches..................................................................................................................... 18
Chapter 3: Software ..................................................................................................................... 20 3.1 Measurement & Automation ............................................................................................... 20 3.2 Motion Assistant ................................................................................................................. 21 3.3 Lab View ............................................................................................................................. 24
Chapter 4: Control Theory ............................................................................................................ 26 4.1 Actuator Subsystem............................................................................................................. 27
4.1.1 Auto-tune configuration .............................................................................................. 28 4.1.2 Manual configuration ................................................................................................... 30
4.2 Potentiometer Feedback ...................................................................................................... 33 Chapter 5: Conclusion................................................................................................................... 41
5.1 Contributions ....................................................................................................................... 41 5.2 Additional Applications ...................................................................................................... 42 5.3 Future Work ........................................................................................................................ 43 5.4 Summary ............................................................................................................................. 43
Appendix A ................................................................................................................................... 45 Appendix B ................................................................................................................................... 46 References ..................................................................................................................................... 48

v
List of Figures Figure 1: The knee joint .................................................................................................................. 1 Figure 2: Knee motion that can cause an ACL tear ........................................................................ 2 Figure 3: X-Ray of total knee arthroplasty ..................................................................................... 3 Figure 4: Commercial CPM ............................................................................................................ 4 Figure 5: Previously constructed mechanical hardware ................................................................. 8 Figure 6: Back panel connectors for power driver .......................................................................... 9 Figure 7: Motor torque-speed curve ............................................................................................. 11 Figure 8: Coupler for motor to linear slider shaft attachment ...................................................... 12 Figure 9: Flexible coupler ............................................................................................................. 13 Figure 10: Final coupler assembly ................................................................................................ 13 Figure 11: Motor mount ................................................................................................................ 14 Figure 12: Motor mount with coupler assembly ........................................................................... 14 Figure 13: Encoder wiring diagram .............................................................................................. 15 Figure 14: Potentiometer wiring diagram ..................................................................................... 16 Figure 15: Potentiometer mount ................................................................................................... 17 Figure 16: Limit switch wiring ..................................................................................................... 18 Figure 17: Final wired assembly ................................................................................................... 19 Figure 19: Absolute position trajectory for knee flexion .............................................................. 23 Figure 20: Absolute position trajectory for knee extension .......................................................... 23 Figure 21: Motor velocity for knee flexion speeds ....................................................................... 24 Figure 22: Software flow diagram ................................................................................................ 26 Figure 23: Closed-loop control block diagram ............................................................................. 27 Figure 24: Feedback error for loading condition #2 ..................................................................... 31 Figure 25: Feedback error for loading condition #3 ..................................................................... 32 Figure 26: Filtered potentiometer feedback (not attached to CPM) ............................................. 34 Figure 27: Unfiltered potentiometer feedback mounted to CPM ................................................. 35 Figure 28: Potentiometer feedback for knee flexion angle ........................................................... 36 Figure 29: Potentiometer feedback error for single move with filter ........................................... 37 Figure 30: Potentiometer feedback for a static trial 1 kHz ........................................................... 38 Figure 31: Potentiometer error for static trial at 1 kHz with Inverse Chebyshev filter ................ 38 Figure 32: Potentiometer feedback for static trial at 10 Hz. ......................................................... 40 Figure 33: Potentiometer error for static trial at 10 Hz with Inverse Chebyshev filter ................ 40

vi
List of Tables Table 1: Panel connections for power driver .................................................................................. 9 Table 2: Required motor specifications ........................................................................................ 10 Table 3: Supplier motor specifications ......................................................................................... 11 Table 4: Actuator PID control parameters from auto-tune ........................................................... 29 Table 5: Manual PID configuration .............................................................................................. 33

1
Chapter 1: Introduction
The knee is a complex joint that connects between the femur and the tibia (i.e., the thigh
and the shin) and primarily serves as the joint that allows leg flexion and extension. The
knee joint is crucial to many daily activities, such as walking, running, stair climbing, and
kneeling. The four ligaments and the shape of the condyles guide the motion of the knee that
is generated by the surrounding muscles and tendons (Figure 1). Unfortunately, the knee is
prone to injuries from trauma and disease which may require surgical treatment.
Figure 1: The knee joint
www.drericchan.wordpress.com

2
Figure 2: Knee motion that can cause an ACL tear
www.youcanbenefit.com
1.1 Background
Injuries to the ligaments in the knee can cause pain and change the motion within the
joint. An estimated 200,000 individuals tear the anterior cruciate ligament (ACL) annually
(Souryal, 2009). Athletes commonly tear the ACL when the tibia translates anterior to the
femur in combination with an internal tibial rotation (Figure 2). The ACL can be repaired by
reconstructive surgery however; physical therapy and rehabilitation can last for up to six
months post-operatively (Carlo, 1997). Physical therapy is necessary to reduce joint stiffness
and swelling in order to restore the normal range of motion of the knee.
Articular cartilage lesions can also be a result of athletic injury or trauma. Cartilage
primarily serves as a mechanism for load distribution between the tibia and femur. The
treatment options for cartilage lesions, such as Microfracture surgery or Autologous
Chondrocyte Implantation (ACI), vary depending on the size of the defect (Lewis, 2006).
Surgical treatments for articular cartilage repair require physical therapy for up to three
months post-operatively (Newman, 1998). Physical therapy has been shown to restore the
mechanical properties of the treated cartilage area and reduce joint stiffness (Salter, 1980).

3
Figure 3: X-Ray of total knee arthroplasty
www.medicaltourismco.com
Osteoarthritis is a disease that causes degeneration and the eventual break down of
articular cartilage. Most commonly found in elderly individuals, osteoarthritis causes severe
joint pain and swelling (Buckwalter, 1998). Replacing the native knee with a prosthetic in
Total Knee Arthroplasty (TKA) surgery can restore joint function and relieve joint pain
(Figure 3). In order to completely restore the joint function and range of motion, rigorous
physical therapy and rehabilitation is required immediately following surgery (Worland,
1998).
ACL reconstruction, articular cartilage repair, and total knee replacement have similar
post-operative physical therapy treatment requirements. The purpose of post-operative
physical therapy is to reduce joint stiffness and restore the normal range of motion in the
knee (O’Driscoll, 2000). Successful rehabilitation treatment plans involve repetitive,
continuous passive motion of the knee. Repetitive passive motion in the knee joint has been
shown to reduce stiffness in reconstructed ligaments and help rebuild the muscles around the
knee after surgery (O’Driscoll, 2000).

4
Passive motion is movement generated by an outside source and does not require the
activation of muscles. Repetitive passive motion for rehabilitation can be done be either a
physical therapist or a continuous passive motion (CPM) machine (Figure 4). Physical
therapists commonly prescribe patients to use a CPM machine at home for the weeks
following surgery (Worland, 1998).
The CPM machine flexes and extends the patient’s knee for a specified time, range,
and velocity. Physical therapists instruct patients to adjust the range and the velocity of the
CPM to values that do not cause pain. Efficient rehabilitation requires that the patient adjusts
the input parameters on a daily basis based on pain tolerance (‘Driscoll, 2000). However,
these variables currently have no standard for the CPM machine treatment. Therefore, there
is a need to determine an effective physical therapy treatment methodology using a CPM
machine.
Figure 4: Commercial CPM www.costalortho.com
5
1.2 Project Motivation
A CPM machine treatment methodology can standardize the machine parameters to
ensure an effective and efficient post-operative physical therapy. A physical therapy
treatment methodology can have several dependent factors. The type of surgery, severity of
the injury, and activity level can affect the duration of the post-operative physical therapy.
The patient characteristics (e.g. gender, size, and weight) can also be contributing factors in
determining the range of motion or velocity of CPM. The duration of the treatment, the
range of motion, and the knee flexion velocity are the parameters that can change in order to
optimize the physical therapy treatment.
The biomechanics of the knee during passive motion must be observed in order to
determine a relationship between the user input parameters to the CPM machine, the
dependent factors, and the effectiveness of post-operative physical therapy. The
biomechanical properties of the knee include stresses within the ligaments, the translation
and rotation of the tibia, or the stresses between the condyles.
Evaluating the biomechanics of the knee during CPM with quantitative variables can
help define the effectiveness of physical therapy. For example, the contact pressure and
stress distribution between the femur and the tibia is an important parameter for evaluating
prosthetic alignment or cartilage graft conformity (Insall, 2010; Lewis, 2006). Directly
measuring the contact stress during CPM can provide insight for determining the duration,
the range, and the velocity of CPM required for post-operative knee surgery patients.
Measuring the biomechanics of the knee during CPM can help define the input parameters to
the CPM machine for post-operative physical therapy.

6
1.3 Previous Research
The biomechanical properties of the knee have been observed in several studies under
various loading conditions. The ligament strains and the contact pressures are two
parameters commonly measured. These variables can suggest causes for injury, treatment
options, and physical therapy effectiveness.
The strain in the ACL is an important parameter for ACL reconstruction patients or
for athletes who are prone to knee injury. Studies have observed the ACL strain for various
angles of knee flexion during active motion (Beynnon, 1995). Another study showed the
strain in the ACL during static squatting is similar during active knee flexion or extension
(Beynnon, 1997).
The contact pressure between the femur and the tibia can indicate the severity of an
articular cartilage injury. One study has shown that the medial condyles have higher contact
pressures than the lateral side under static, vertical compression (Brockmeier, 2008).
Another study has observed the biomechanical properties of various types of cartilage graft
tissues under static, compressive loading (Guilak, 2001).
The success of TKR is dependent on the type of prosthetic and the alignment in-vivo
(Insall, 2010; Moreland, 1998). The range of motion and the restoration of normal joint
function have been evaluated for several types of prostheses (Insall, 2010). The performance
of the prosthetic was determined by the allowable range of motion and the restoration of
normal function post-operatively. Observing the function of the prostheses during passive
motion can provide insight into why some models perform better than others.
The biomechanical properties of the knee have been used to evaluate injury, surgical
treatment options, and physical therapy treatment options. The ability to measure knee
biomechanics during CPM can provide further insight into these areas of research.

7
1.4 Scope of Project
My project is the continuation of a former undergraduate research project by Julie
Thompson. Julie previously constructed a device designed to use for passive motion cadaver
testing. The device is currently operating with open-loop control via a constant power
supply. The device must have user-friendly operation with inputs for the number of cycles,
the range of knee flexion, and the knee flexion velocity. The purpose of this project was to
set up a user friendly graphical user interface to operate a custom CPM machine that can be
used to study passive motion knee kinematics on cadaver specimens.
The CPM device can be used in future research projects to develop a physical therapy
treatment methodology for various types of surgery. This device can be used to observe the
biomechanics of the knee during passive motion and provide insight to the CPM machine
parameters during physical therapy treatment.
Chapter 2: Hardware
A majority of the construction for the structure of the CPM device was previously
completed. In addition to the mechanical structure of the device, I acquired the electrical
components, designed the attachments, and constructed the mounting components. The
electrical hardware on the custom CPM device includes an actuator, a shaft encoder, a rotary
potentiometer, and two push button switches.
2.1 Overview of Device
The previously machined components of the device provide the structural support for
the femur and the tibia (Figure 5). The CPM device has two 4-bar linkages similar to that of
the commercially available devices (Thompson, 2008). A linear slider driven by a servo

8
motor controls the motion of the slider-rocker linkage. The motion of the double-rocker
linkage controls the angle of knee flexion. The relationship between the angle of knee
flexion, the angular velocity of knee rotation, the slider position, and the slider velocity were
previously derived from kinematic vector loop equations. The device is capable of 120
degrees of rotation at angular velocities from 30 to 750 degrees per minute.
The device is made almost entirely of 6061-T6 aluminum. The linear slider came
equipped with a 24V servo motor. The device has open-loop control with a constant power
supply. The output current of the power supply can adjust the speed of the device. In order
to change rotational direction of the linear slider (i.e., flexion/extension), the direction of
current can be reversed by switching the leads on the power supply. The goal of my project
is to develop closed-loop control of the custom built CPM device and provide user-friendly
operation through a graphical user interface.
Figure 5: Previously constructed mechanical hardware (Thompson, 2008)

9
2.2 Motion Controller and Driver
The motion controller and the servo driver were allocated for this project prior to my
involvement. The servo power motor drive contains the electrical attachments for the servo
motor and the feedback devices. The servo power motor drive is an MID-7654. The
Peripheral Component Interconnect (PCI) controller translates the electrical signals from the
feedback devices to the readable binary code for the computer. The motion controller for the
custom CPM device is a National Instruments PCI-7340. The PCI connects the motor drive
to the computer.
The back panel connectors on the motor power driver have the connections for the
servo motor leads, the potentiometer input, the encoder input, and the switches (Figure 6).
The attachment locations for the electrical components are provided in Table 1.
Table 1: Panel connections for power driver
Device Connection Description PCI Card 1 Controller Potentiometer 2 Analog Input Encoder 8 Axis 1 encoder input Limit Switch 12 Axis 1 limits Servo motor 16 Axis 1 servo output
Figure 6: Back panel connectors for power driver

10
The motor power driver is capable of providing up to a maximum of 10 Amperes for
the servo motor drive. However, the continuous current limit is 5 Amperes, which applies to
any actuation longer than 2.7 seconds. Since the device requires continuous actuation for
several cycles, I decided to select a motor based on the 5 Ampere current limit.
The PCI controller connects the motor power driver to the computer. The PCI
controller is capable of controlling four axes simultaneously with a dual-processor however,
for the purposes of this device, only one axis of motion is necessary. I connected both the
servo motor and the encoder to Axis 1.
2.3 Servo Motor
The linear slider is driven by a servo motor. In order to obtain the maximum desired
knee flexion velocity of 750 degrees per minute, the servo motor must be capable of the
parameters summarized in Table 2. The motor parameters were determined theoretically for
a maximum specimen weight of 36.225 pounds.
The linear slider from Aneheim Automation came equipped with a DC brush motor
that is capable of producing the required torque. However, the motor is not equipped with a
shaft encoder. The power driver and the PCI controller require a quadrature encoder to
measure the motor shaft rotation. The cost of buying a quadrature encoder and mounting it
to the motor is similar to purchasing a new motor with a quadrature encoder previously
installed. Therefore, I decided to purchase a DC servo motor from Pittman Express that has a
built-in quadrature encoder.
Table 2: Required motor specifications (Thompson, 2008)
Parameter Symbol Value Units Max. motor speed n 953.15 rpm Max. motor torque T 23.344 oz-in Max. motor power P 16.45 Watts

11
Table 3: Supplier motor specifications
Parameter Symbol Units Old Motor New Motor No-load speed SNL Rpm 1,050 4,230 Continuous Torque TC oz-in 8.33 10 Peak Torque TPK oz-in 55.1 63 Torque Constant KT oz-in/A - 3.72 Back-EMF Constant KE V/krpm - 2.75 Encoder Resolution RENC CPR - 500
The motor selected for the custom CPM device has a built-in quadrature encoder with
the specifications listed in Table 3. The continuous operation of the motor is 3,559 rpm and
3.1 Amperes (Figure 7). The motor does not exceed the power drive supply of 5 Amperes
for continuous operation.
Figure 7: Motor torque-speed curve

12
I designed and built a coupler that joins the shaft of the motor and the shaft of the
linear slider (Figure 8). I built the coupler from half inch diameter stainless steel stock. I
used set screws to fix the rotation of the motor shaft to the shaft on the linear slider.
The through holes in the coupler for the two shafts were misaligned, which caused
jerky motion on the slider and excessive vibrations in the motor. I decided to shorten the
length of the coupler because any misalignment propagates to the motor shaft; a longer
coupler magnifies the effects of error in alignment. I rebuilt the coupler; shortening the
overall length from 1.41 inches to 0.89 inches. The second coupler did not completely
eliminate the jerky motion for the motor driving the slider. I was unable to rigidly attach the
motor due to the vibrations of the motor casing.
Figure 8: Coupler for motor to linear slider shaft attachment

13
Figure 9: Flexible coupler
After rebuilding the coupler the second time, I decided to investigate flexible
couplers. A flexible coupler can reduce the effects of misalignment error by allowing for
offset shafts. I acquired a ¼ inch to ¼ inch diameter flexible coupler from the electronics
lab. I assembled the flexible coupler in series with the 0.89 inch steel coupler (Figure 10).
The steel coupler is necessary to adapt the 0.21 inch slider shaft diameter to the 0.25 inch
flexible coupler.
Figure 10: Final coupler assembly

14
Figure 11: Motor mount
The final coupler assembly with the flexible shaft reduced the error in shaft
alignment, allowing me to rigidly attach the motor to the CPM device. I manufactured the
motor mount out of the remaining supply of 6061-T6 Aluminum (Figure 11). I attached the
motor to the mount with two #6-32 ANSI size machine screws and the mount to the
underlying particle board with two wood screws. Soft foam sits underneath the motor to
dampen the vibrations during drive and support the motor casing.
Figure 12: Motor mount with coupler assembly

15
2.4 Quadrature Encoder
The quadrature shaft encoder on the servo motor measures the change in shaft
rotations. I connected the encoder directly to the Axis 1 feedback input on the power driver
(Figure 13). Quadrature encoders use two digital signals to recognize the direction of
rotation, unlike optical encoders.
The encoder has 2000 counts per revolution of the motor, with a sampling frequency
of 100 kHz and an accuracy of 1 count. The conversion between the encoder counts, c, to
revolutions, n, is as follows:
I calculated the linear slider velocity, V, from the lead of the worm gear, l, as follows:
The relationship between the number of encoder counts and the linear slider velocity
determines the software configuration settings discussed in Chapter 3.
Figure 13: Encoder wiring diagram

16
2.5 Rotary Potentiometer
The change in knee flexion angle is one of the input parameters for the device. The
user-friendly operation of the device must have an accurate output for the current knee
flexion angle while the device is in operation. I investigated various types of rotational
sensors to measure the current flexion angle. Rotary potentiometers are commonly used in
robotics to measure change in angle at a revolute joint (Craig, 2005). Rotary potentiometers
have a variable resistance based on the shaft angle; therefore, the analog feedback is
proportional to the shaft angle.
I purchased two 6637 multi-turn precision potentiometers from Bourns. I connected
the potentiometer to the analog input channel on the power driver (Figure 14). The
manufacturer specification allows 3° accuracy with a range of 340° of rotation, which does
satisfy the desired maximum angle rotation of 120°.
Figure 14: Potentiometer wiring diagram

17
The potentiometer measures the angle between the femoral and the tibial linkages on
the CPM device because the change in angle of the two linkages is the change in knee flexion
angle. I designed and built the assembly for the potentiometer mount from the remaining
supply of 6061-T6 Aluminum (Figure 15). The U-shaped mount fixes the rotation of the
base of the potentiometer to the femoral linkage. The coupler replaces the original pin
holding the joint together, while fixing the rotation of the shaft of the potentiometer to the
tibial linkage. The set screw fixes the potentiometer shaft to rotate with the coupler and the
coupler rotates with the tibial linkage via the coupler attachment piece. The machine screws
secure the coupler attachment and the mount to the original linkages. I ground the edges of
the femoral and tibial linkages in order to mount the assembly and still allow the full 120
degrees of rotation without interference.
Figure 15: Potentiometer mount

18
The potentiometer on the CPM device is located approximately 2 feet away from the
power driver connection. The ribbon cable connecting the potentiometer to the power driver
is 3 feet long. In order to consolidate the electrical hardware, I ran the ribbon cable through
the femoral linkage on the device.
2.6 Limit Switches
The maximum extension of the device (i.e., 0° knee flexion) has a slider position of
35 inches from the telescoping joint. Driving the motor beyond the maximum extension
limit can cause stress on the device and an excessive load on the motor. Similarly, driving
the motor past maximum flexion will force the slider to bump into the slider panel and cause
an excessive load on the motor.
Limit switches are commonly used in linear slider designs as hard stop indicators that
will shut off the motor when pressed (Craig, 2005). I purchased two 8631 push button
micro-switches from C&K Components. I wired the switches to the Axis 1 limit switch
terminal on the power driver (Figure 16). The push button switches have digital feedback of
0 for not pressed, and 1 for pressed.
Figure 16: Limit switch wiring

19
The forward limit switch indicates a slider position 35 inches from the telescoping
joint, or the maximum knee extension angle. The reverse limit switch indicates a slider
position 11 inches from the telescoping joint, or the maximum knee flexion angle. The
configuration for the limit switches is discussed in Chapter 3.
The limit switches need to be mounted to the device at the maximum and minimum
slider positions. These positions have been experimentally evaluated to be 35 and 11 inches
from the telescoping joint (Thompson, 2008). The final wired custom CPM machine
includes the potentiometer and the actuator (Figure 17).
Figure 17: Final wired assembly

20
Chapter 3: Software
I created the software for the custom CPM device from National Instruments
programs, as required by the PCI-7340 motion controller. The three motion control
programs used for the custom CPM device are: Measurement & Automation, Motion
Assistant, and Lab View.
3.1 Measurement & Automation
The servo motor and the quadrature encoder subsystem are controlled through
Measurement & Automation. The purpose of Measurement & Automation is to initialize the
motion controller and control the servo motor based on the feedback from the encoder. As
previously mentioned, the PCI controller is capable of four axis motion. The CPM device is
controlled through Axis 1 only. I disabled the remaining three axes through Measurement &
Automation.
The configuration for Axis 1 is a custom servo drive with encoder feedback. I
disabled all digital input and output ports for Axis 1. I enabled the analog input ports
because I connected the potentiometer to analog input 1. The control loop parameter settings
for PID control of the motor are discussed in Chapter 4.
The encoder settings tab has the following settings: 2000 counts per revolution; 100
kHz filter frequency; and all states are active high. The specification of the encoder indicates
that there are 500 counts per 90° of rotation, hence 2000 counts per complete revolution. The
index reference criteria count the beginning of a cycle when channel A and channel B are
both “off’. A clockwise rotation of the motor generates knee extension (i.e., pushes the slider
away from the motor). I configured the encoder index reference in Measurement &
Automation so that the clockwise rotation of the motor is “forward”.

21
The limit switch settings for the slider are also configured through Measurement &
Automation. I enabled the forward and reverse limit switches as active low polarity,
meaning that a digital value of zero is not pressed. I also configured the motor to drive at
20% of the user specified velocity as the slider approaches one of the limit switches.
3.2 Motion Assistant
Motion Assistant controls the acceleration, deceleration, and velocity of the motor
based on the user’s desired motor position and the configuration settings in Measurement &
Automation. More specifically, Motion Assistant controls the power actuation of the servo
motor based on feedback from the encoder. Straight line moves apply a constant velocity to
the motor for a specified time. For the purposes of the CPM device, I primarily use contour,
moves because the velocity of the slider must be adjusted during the move to maintain a
constant knee flexion velocity (Thompson, 2008). A contour move can adjust the velocity of
the motor or follow a position trajectory during a single move from imported Microsoft Excel
spreadsheet data.
Prior to applying a contour move, I used a reference move to find the forward and
reverse limit switches. I reset the encoder counts to zero after finding the reference limits.
This is a necessary operation because the absolute position of the slider can be reset in
Motion Assistant and the contour moves can use the calculated encoder positions for a full
cycle of flexion or a full cycle of extension.
The two types of contour moves are the position move and the position-velocity-time
(PVT) move. The position contour move accepts a desired position trajectory and follows
the trajectory for one constant motor velocity. For the CPM device, maintaining a constant
knee flexion velocity requires motor velocity adjustments throughout the move. Therefore, I

22
decided to use the PVT move which specifies a position and a velocity trajectory for one
single move.
Motion Assistant reads the PVT inputs from the Excel Spreadsheet as relative
encoder counts. The relationship between knee angle and the position of the linear slider
have been experimentally determined in 15° increments between 0° and 120° of knee flexion
(Thompson, 2008). I used the linear slider position data to determine the number of encoder
counts between each 15° increment. The forward direction of the motor (i.e., clockwise)
extends the knee. I used 120° of flexion, when the slider was at the reverse limit switch, as
the initial reference position for leg extension (Figure 18). Alternatively, knee flexion begins
with 0° of flexion, or when the slider is at the forward limit switch. A negative change in
encoder counts generates flexion (Figure 19).
The position control trajectory accepts relative encoder count data. I calculated the
position trajectory data as the change in absolute encoder position. For example, extending
the slider from 100° to 40° of flexion is calculated as the change in encoder counts as
follows:
Knee flexion from 40° to 100° is calculated as:

23
Figure 18: Absolute position trajectory for knee flexion
Figure 19: Absolute position trajectory for knee extension
24
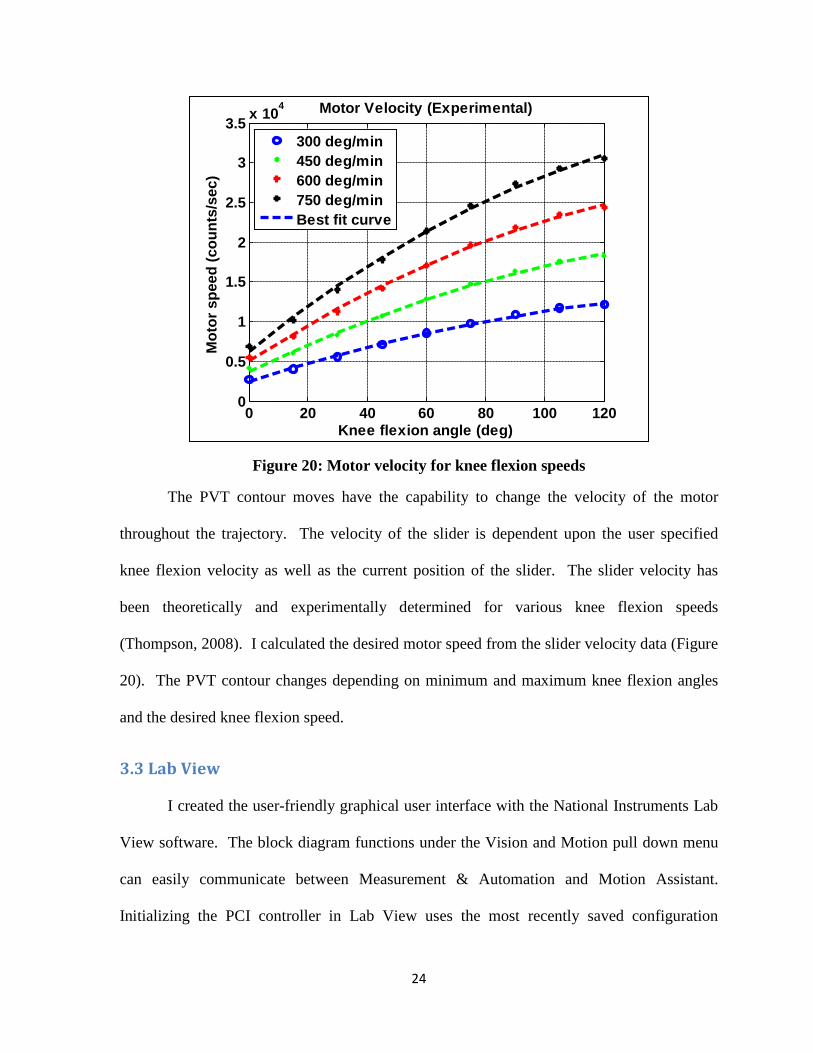
Figure 20: Motor velocity for knee flexion speeds
The PVT contour moves have the capability to change the velocity of the motor
throughout the trajectory. The velocity of the slider is dependent upon the user specified
knee flexion velocity as well as the current position of the slider. The slider velocity has
been theoretically and experimentally determined for various knee flexion speeds
(Thompson, 2008). I calculated the desired motor speed from the slider velocity data (Figure
20). The PVT contour changes depending on minimum and maximum knee flexion angles
and the desired knee flexion speed.
3.3 Lab View
I created the user-friendly graphical user interface with the National Instruments Lab
View software. The block diagram functions under the Vision and Motion pull down menu
can easily communicate between Measurement & Automation and Motion Assistant.
Initializing the PCI controller in Lab View uses the most recently saved configuration
0 20 40 60 80 100 1200
0.5
1
1.5
2
2.5
3
3.5 x 10⁴
Knee flexion angle (deg)
Mot
or s
peed
(cou
nts/
sec)
Motor Velocity (Experimental)
300 deg/min450 deg/min600 deg/min750 deg/minBest fit curve
25
parameter settings in Measurement & Automation. The move settings from Motion Assistant
can be exported to Lab View code directly. I configured the position, velocity, and
acceleration data through Motion Assistant for various PVT contour moves and exported the
information to a Lab View block diagram.
The user inputs for the CPM device include the knee flexion velocity, the maximum
and minimum angles of rotation, and the number of cycles. I made the user inputs numerical
entry. The knee flexion velocity input accepts values between 30° and 750° per minute. The
minimum angle of rotation is 0° of knee flexion, or when the device is fully extended. The
maximum angle of rotation is 120° of knee flexion. The user input for the number of cycles
must be a positive value, where one cycle is one complete range of flexion or one complete
range of extension. Therefore, if the user specifies two cycles, the device will drive
extension and then flexion back to the original starting position.
The Read ADC block function returns the value of the analog or digital ports. Prior
to using the Read ADC, the program enables all analog ports. The analog input from the
potentiometer (Analog Input 1) is channel 81. The PCI controller acquires the analog value
in real-time at 16.7 MHz but, Lab View has a data acquisition limit of 1 kHz. I used the filter
signal blocks to implement a software filter for the analog potentiometer signal. The filter
configurations are discussed in Chapter 4. The analog value for the potentiometer is acquired
through Lab View only; Measurement & Automation and Motion Assistant cannot read the
potentiometer value.

26
Figure 21: Software flow diagram
The user-interface communicates between the National Instruments software during
the program execution (Figure 21). Consequently, the device set-up is limited to computers
with all three programs installed. The operating computer must also have a motion controller
input channel for the PCI card.
Chapter 4: Control Theory
The closed-loop control of the device has two feedback loops. The feedback devices
are the encoder and the potentiometer. The encoder and the motor are a subsystem for the
actuation of the device. The potentiometer and the Lab View software control the
mechanical motion based on the user inputs (Figure 22).

27
Figure 22: Closed-loop control block diagram
4.1 Actuator Subsystem
The servo motor and the encoder feedback are a closed-loop subsystem.
Measurement & Automation has configuration settings for proportional integral derivative
(PID) control of the actuator subsystem. PID control is necessary to reduce to rise time, the
steady state error, and the oscillations at steady state. The three parameters in PID control
are the proportional gain, the derivative gain, and the integral gain. These three PID
parameters use the error between the user’s desired position and the encoder actual position
to adjust the motor speed and reduce the error. The velocity feedback gain reduces the error
between the user desired velocity and the motor velocity as read by the encoder. The
velocity feedback gain is necessary to reduce fluctuations in the motor speed.

28
The load on the motor changes the affects of the control loop constants (Nise, 2008).
I tested five separate conditions for PID parameter configuration:
1. No load or tactile load
2. Slider load alone
3. Slider load with a hanging mass
4. Device load in extension
5. Device load in flexion
The tactile loading condition (#1) is a variable load by touching the motor shaft
(unattached to the slider) and changing the torque load on the motor to maintain stability.
The slider load alone condition (#2) refers to the slider without the device attached and no
manual interference. The slider with a variable mass (1 kg, 1.5 kg, 2 kg) hanging over the
edge of the table (#3) does not have the device attached and no manual interference. The
device loads in extension (#4) and flexion (#5) change depending on the current slider
position (Thompson, 2008). Also, the load for flexion is higher than the load for extension
due to the weight of the device itself. The load on the motor is typically lowest for condition
one and highest for condition five. These five conditions will be referred to throughout this
chapter.
4.1.1 Auto-tune configuration
I used the auto-tune function in Measurement & Automation to set up PID control for
the actuator under the various loading conditions. The auto-tune function in Measurement &
Automation applies a desired position step input of 100 encoder counts (i.e., 0.05
revolutions) and determines the PID parameters based on the motor step response data.

29
Measurement & Automation calculates the controller parameters based on the step response.
The values from the auto-tune configuration are shown in Table 4.
I tested the actuator PID control using a desired relative slider position of 1 inch,
forward and backward, with a constant slider velocity of 0.04 inches per second under each
of the five loading conditions. The PID control for the motor subsystem did not effectively
reduce the following error during a move constraint in Motion Assistant because the software
achieved the following error limit (32,767 counts) in less than 5 seconds under each
condition. Motion Assistant forces the motor off and terminates the move after reaching the
following error limit.
One of the disadvantages of the auto-tune configuration is the constant velocity
feedback gain. The auto-tune function applies to position only; therefore, the velocity
feedback gain is unnecessary.
The auto-tune function configures the maximum software value (19,725) for the
integral gain in an attempt to reduce the stead state error. The high integral gain value causes
instability in the actuator system, causing the control loop feedback error to approach
infinity.
Table 4: Actuator PID control parameters from auto-tune
Control Parameter Condition
1 2 3 4 5 Proportional Gain Kp 3,571 4,121 3,913 1,828 1,915
Derivative Gain Kd 211 213 210 241 213
Integral Gain Ki 19,725 19,725 19,725 19,725 19,725
Velocity Feedback Kv 0 0 0 0 0

30
4.1.2 Manual configuration I decided to configure the control parameters manually instead of using the auto-tune
function provided in Measurement & Automation. The stability of the actuator subsystem is
dependent on the values of the three PID parameters (Nise, 2008). Estimates for the
proportional gain and the velocity feedback gain are determined from the resonating
frequency of the system, ωres (Craig, 2005):
where k is the stiffness and I is the rotational inertia of the system. The proportional gain is
approximated as:
and the velocity feedback gain:
I used these equations as relationships for each of the loading conditions, rather than
calculating the theoretical values. The theoretical calculations for the resonating frequency
are dependent upon the stiffness and the inertia of the system; which includes the motor, the
motor shaft, the worm gear, the slider, and the weight on the slider.
The stiffness of the system is roughly constant for the five loading conditions because
it is dependent on material properties and motor specifications. However, the rotational
inertia of the system increases with increased load on the motor. The inertia and the
resonating frequency are inversely proportional. Increased load on the system increases the
inertia. These relationships indicate that the proportional and velocity feedback gains should
decrease with higher loads.

31
I manually configured the PID parameters by applying a desired absolute position and
velocity in Measurement & Automation using the interactive window. I used the following
error between the desired position and the actual position of the encoder to adjust the control
settings. For example, a feedback error approaching infinity indicates an unstable system
(Figure 23). Oscillations in the feedback error indicate that the system is controlling the
position and it is not unstable.
Figure 23: Feedback error for loading condition #2

32
I decreased the applied velocity in the interactive window from 500 counts per second
to 100 counts per second, or 0.01 inches per second on the slider. The system stabilized with
a smaller input velocity for all five conditions (Figure 24). The maximum speed of the
device (750° per minute) requires a motor velocity of approximately 30,000 counts per
second.
If the system becomes unstable during a move, I can manually turn the motor shaft to
return the system to stability (Figure 24). The spike in feedback error decreases as I turn the
motor shaft. Once the feedback error is reduced to zero, the system stabilizes and begins to
control independently.
Figure 24: Feedback error for loading condition #3

33
Table 5: Manual PID configuration
Control Parameter Condition 1 2 3 4 5
Proportional Gain Kp 814 833 800 475 475 Derivative Gain Kd 4,477 4,477 4,400 4,400 4,400 Integral Gain Ki 8,605 8,657 8,670 8,415 8,415 Velocity Feedback Kv 2,907 1,047 1,000 1,000 1,000
I configured the PID settings for the five loading conditions based on the time until
the system became instable. I experimentally determined the settings listed in Table 5 by
trial and error. The proportional gain and velocity feedback parameters decrease with
increased loading, as suggested by the equations previously mentioned. These settings do
not achieve system stability except for condition #1 (no load). Each of the loading conditions
reaches instability after approximately 1 to 2 seconds of actuation. I can stabilize the system
by manual interference after the system becomes instable. Adjusting the PID parameters to
stabilize the system is an important step for device usability. The device is not usable if
manual interference is required after one second of operation. The actuator subsystem must
accurately control the desired user input in order to determine the control loop settings for the
potentiometer feedback loop.
4.2 Potentiometer Feedback
The analog feedback from the potentiometer is proportional to the change in angle
between the femoral linkage and the tibial linkage. For simplicity, I approximated the
change in angle between the linkages is the same as the change in knee flexion or extension.
Lab View receives the analog signal directly and then the data is exported to a text file. I
used MATLAB to analyze the raw signals acquired during testing. In order to configure the
gain between the angle and the voltage feedback, I first collected raw analog feedback data
before mounting the potentiometer to the device (Figure 25).

34
Figure 25: Filtered potentiometer feedback (not attached to CPM)
I plotted the raw analog feedback data for approximately 270° of rotation in Lab
View. The noise in the feedback signal is either due to hardware noise (e.g., from
mechanical vibrations, the ribbon cable, the power driver) or the software. I decided to apply
a software filter in Lab View to decrease the oscillations in the signal (Figure 27).
The frequency of the noise oscillations in the unfiltered data is approximately 100 Hz.
I applied a low-pass filter with a cutoff frequency of 10 Hz. The low-pass filter dampens any
oscillations faster than 10 Hz, subsequently reducing the noise at 100 Hz. I observed the
various types of low-pass filters available in Lab View by plotting the filtered signal for each
option: Bessel, Butterworth, Chebyshev, Inverse Chebyshev, and Elliptic (Figure 25). The
Inverse Chebyshev option has very little noise compared to the other four filter options.

35
I decided to test the filter with the potentiometer mounted to the device. I tested the
device with a constant power source from 120° to 90° of flexion. I fit a linear gain to the
data using the formula:
The unfiltered potentiometer feedback showed noise oscillations when mounted to the
device (Figure 26). I applied the Inverse Chebyshev low-pass filter in the Lab View software
to reduce the potentiometer feedback noise, similar to when the potentiometer was not
mounted on the device.
Figure 26: Unfiltered potentiometer feedback mounted to CPM

36
Figure 27: Potentiometer feedback for knee flexion angle
The Inverse Chebyshev filter with a 10 Hz. cutoff frequency effectively reduced the
noise oscillations in the signal when the potentiometer was mounted to the device (Figure
27). I tested the accuracy of the potentiometer feedback signal by measuring the actual angle
of the device with a goniometer. I taped the goniometer to the revolute joint at the
potentiometer and observed the knee flexion angle in real time as the device was operating at
750° per minute. The error for knee extension from 120° to 90° fluctuated between 2°
(Figure 28). I observed similar results for knee flexion and extension between 120° and 0° of
knee flexion. The error in potentiometer feedback for continuous operation of the device
achieves the desired accuracy of 3° when applying a linear gain for voltage to knee flexion
angle conversion.

37
Figure 28: Potentiometer feedback error for single move with filter
I linearly fitted the potentiometer gain for continuous operation of the device and
determined the knee flexion angle. However, stopping the device during a move causes the
potentiometer feedback error to increase because the fit is no longer linear. I moved the
CPM in 15° increments at a constant knee extension velocity of 750° per minute. I stopped
for 4 to 6 seconds at each angle increment. The linear fit from 120° of knee flexion to 0° of
knee flexion does not apply to the intermediate values of potentiometer feedback (Figure 29).
The error between the actual position and the potentiometer data ranges between 15°.
Furthermore, the Inverse Chebyshev filter causes the steady state values to blend with
the intermediate moves. The unfiltered data has clear segments of steady state potentiometer
feedback, but the filter decreases the error by blending the entire signal (Figure 29).
38
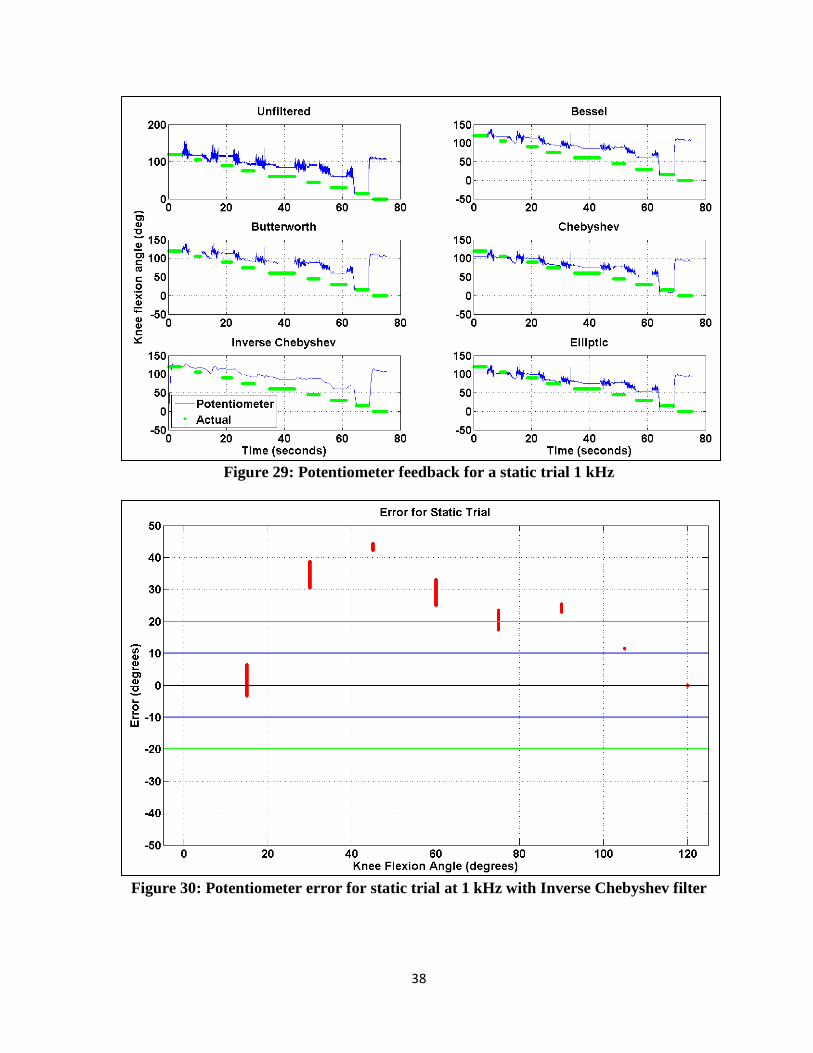
Figure 29: Potentiometer feedback for a static trial 1 kHz
Figure 30: Potentiometer error for static trial at 1 kHz with Inverse Chebyshev filter

39
The Inverse Chebyshev filter effectively reduced the noise in the static trial, but the
steady state values for each 15° increment have an error of 40° (Figure 30) with one
exception. The potentiometer feedback value at 0° of flexion had an error of approximately
100°. The software filter may be a cause of the increased steady state error. In order to
eliminate the filters and reduce the noise in the raw signal, I decided to investigate the effects
of the sampling frequency.
The sample frequency of the analog signal can reduce noise and effectively act as a
filter (Nise, 2008). The default sampling frequency in Lab View is 1 kHz. The maximum
velocity of the device is 750° per minute, or 12.5° per second. The resolution of the
potentiometer, as indicated by the manufacturer, is 3°. Therefore, the minimum required
sampling frequency is 2 Hz (12.5° / 6°). I decreased the sampling rate by waiting for 0.1
seconds between each analog read; so, the effective sampling frequency, fs, is 10 Hz. I also
decreased the cutoff frequency for each filter to 0.49 Hz. I had to reduce the cutoff
frequency because the cutoff must be less than half of the sampling frequency to prevent
aliasing.
I tested the decreased sampling frequency with a trial of extension, with a constant
power source, from 120° to 90° in increments of 15° (Figure 31). The noise oscillations in
the feedback signal are apparent during the moves to each 15° increment. However, the
steady state value has an error of 30° (Figure 32). Furthermore, the steady state
potentiometer feedback at 0° of flexion did not spike as in the 1 kHz. trial.
40
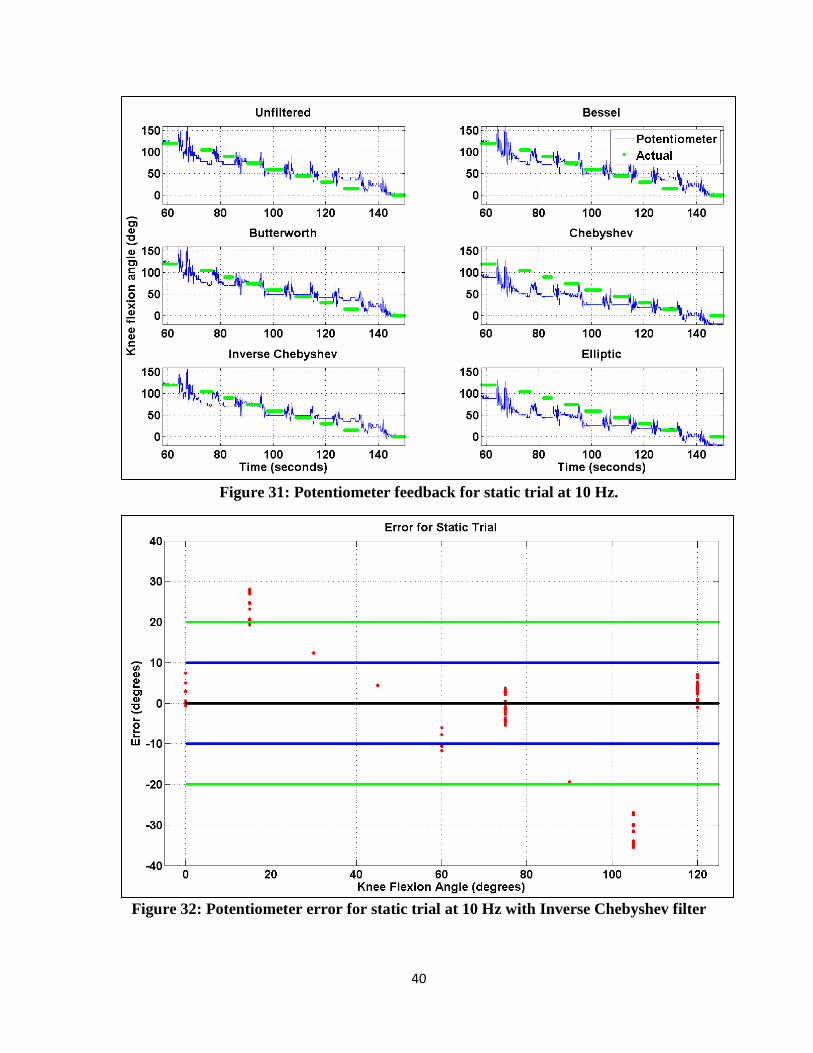
Figure 31: Potentiometer feedback for static trial at 10 Hz.
Figure 32: Potentiometer error for static trial at 10 Hz with Inverse Chebyshev filter
41
The decreased sampling frequency of 10 Hz showed better results than the 1 kHz trial
for steady state error. However, neither trial meets the desired 3° accuracy of the system.
The continuous motion of the potentiometer can be fitted with a linear gain for an accuracy
of 2°. For the purposes of the custom CPM machine, the accuracy of the knee flexion
angle is important for the continuous motion of the machine to close the control loop.
Chapter 5: Conclusion
The purpose of this project was to set up a user friendly graphical user interface to
operate a custom CPM machine that can be used to study passive motion knee kinematics on
cadaver specimens.
5.1 Contributions
Continuous passive motion is a common rehabilitation therapy for post-operative
knee surgery patients (O’Driscoll, 2000; Carlo, 1997). However, the speed, duration,
maximum flexion angle, and maximum extension angle have no standard settings for
physical therapy methodology. Adjusting these input parameters to maximize the benefits of
the post-operative rehabilitation treatment may reduce the overall treatment time and
improve post-operative outcome. The experimental testing CPM machine will allow further
research of passive motion in the knee.
The custom CPM device has the same user specified input parameters as the
commercial CPM devices: speed, duration, and maximum/minimum flexion angles.
Determining the biomechanics of the knee undergoing passive motion for various input
settings may give insight into the effects of changing the device settings for a physical
therapy treatment program. Relating the biomechanical properties of the knee to the current

42
device settings may help physical therapists and patients develop a standard physical therapy
treatment methodology. Additionally, the testing device exceeds the 300 degree per minute
speed limitation of the current commercial CPM machines. The testing device can give
researches the opportunity to observe the biomechanical properties of a knee undergoing 750
degrees per minute of passive flexion or extension. Consequently, researches may be able to
determine if a faster range of motion will reduce the treatment time or improve the range of
motion post-operatively.
5.2 Additional Applications
The study or observation of the biomechanical properties of a knee undergoing
passive motion can be beneficial for several surgical procedures in addition to post-operative
applications. For example, the testing device will be used in the Neuromuscular
Biomechanics Lab by other fellow researchers to investigate the effects of varying prosthetic
component alignment intra-operatively. The effects of misaligning a tibial, femoral, and
patellar prosthetic in the knee may increase contact stresses or ligament strains. Also, we can
observe passive motion for various types of prosthetics and study the effects on the
biomechanical properties in the knee.
The motion of the tibia relative to the femur has been shown to correlate with the
knee flexion angle during passive motion (Wilson, 2000). Through use of this device, we
can simulate passive motion in cadaver specimens and investigate stresses in the ligaments or
contact stresses between the condyles. The stress distributions and magnitudes may be
coupled to flexion angle, similarly to the tibial motion path. This device will allow for an
investigation of the effects of flexion angle during passive motion on the biomechanical
properties in the knee.

43
5.3 Future Work
Completion of the motion controller is required to accomplish user-friendly operation
of the device. Controlling the motor from the encoder feedback with the device load is
necessary to begin programming motion control in Lab View. Also, reduction of the noise
within the potentiometer feedback may guarantee more accurate device positioning. Once
the electrical and mechanical hardware functions properly, the graphical user interface can
operate the device based on user input parameters for speed, duration, and
maximum/minimum angles of rotation. The experimental test setup will lead to future
studies in our lab on the biomechanical properties of the knee during passive motion for
clinical applications both post-operatively and intra-operatively.
In addition to a study of the passive motion effects on the knee, this project may lead
to future studies involving active motion. Passive motion in the knee does not require muscle
activation. We contract our hamstrings to flex our knee. Similarly, we contract our
quadriceps to extend our knee. The contraction of the muscles may increase the contact
stresses within the knee or change the motion of the tibia relative to the femur. Simulation of
muscle contraction during knee flexion and extension by pulling on the tendons may give
further insight into the biomechanical properties of a knee undergoing active motion. The
study of a knee undergoing active motion is important in determining biomechanical
properties during everyday activities such as walking, running, or stair climbing.
5.4 Summary
The closed-loop control of the custom CPM device required additional mechanical
and electrical hardware, as well as additional software applications. Acquiring the
appropriate materials is an important step towards completing user-friendly operation of the

44
device. I performed initial investigations into the electrical control of the device through
signal analysis on various PID control parameter settings on the actuator. I acquired a
feedback signal for the potentiometer and calculated an electrical gain to relate the feedback
to the knee flexion angle. The custom CPM device will provide our lab with the capabilities
to test passive motion in the knee at velocities higher than current existing devices. The
experimental test setup will motivate further research studies that may improve the surgical
techniques for TKA, reduce the treatment time for physical therapy, or improve the outcome
of rehabilitation programs for post-operative knee surgery patients.

45
Appendix A
Relative encoder count data for position following:
Flexion Angle (degrees)
Slider Position (inches)
Relative Slider Position (inches)
Motor revolutions
Encoder Counts
0 29.531 0.961 4.81 2403 15 28.57 1.359 6.80 3398 30 27.211 1.783 8.92 4458 45 25.428 2.192 10.96 5480 60 23.236 2.567 12.84 6418 75 20.669 2.889 14.45 7223 90 17.78 3.143 15.72 7858
105 14.637 3.308 16.54 8270 120 11.329 0.000 0.00 0
Purchases
Description Supplier Quantity Cost (each) Date
Motion Assistant Software National Instruments
1 $237.25 12/9/09
6637 Bourns Rotary Potentiometer
Newark 2 $41.44 1/6/10
14201S001 Motor with Encoder Automation Express 1 $247.11 3/29/10 8631ZQD2 Pushbutton Switch C&K Components 4 $5.73 5/14/10

46
Appendix B
% Import data from .txt file [y1]=load('goniometer/unfiltered.txt'); [y2]=load('goniometer/bessel.txt'); [y3]=load('goniometer/butterworth.txt'); [y4]=load('goniometer/cheby.txt'); [y5]=load('goniometer/invCheby.txt'); [y6]=load('goniometer/elliptic.txt'); %Time (seconds) fs=1000; %sampling frequency, Hz. t=1:length(y1); t=t/fs; %Voltage and time for each 15 degree increment (trial specific) y120=39; t120=[3.426 4.318]; y105=38; t105=[9.212 11.2]; y90=37; t90=[18.51 22.02]; y75=31; t75=[25.55 29.69]; y60=29; t60=[34.7 43.52]; y45=31; t45=[48.07 51.96]; y30=22; t30=[56.26 61.38]; y15=9; t15=[64.8 68.9]; y0=35; t0=[70.6 75.27]; %Fit to flexion angle with linear gain (degrees/volt) k=(120-15)/(y120-y15); %Fit raw data to degrees of flexion y1=(y1(:,3)-y15)*k+15; y2=(y2(:,3)-y15)*k+15; y3=(y3(:,3)-y15)*k+15; y4=(y4(:,3)-y15)*k+15; y5=(y5(:,3)-y15)*k+15; y6=(y6(:,3)-y15)*k+15; %Plot data for each filter type %------Unfiltered subplot(3,2,1), plot(t,y1),hold on plotActual(), axis([58 150 -20 160]) grid on, title('Unfiltered') %------Bessel subplot(3,2,2),plot(t,y2),hold on plotActual(), axis([58 150 -20 160]) grid on, title('Bessel') legend('Potentiometer','Actual','Location','NorthEast') %------Butterworth subplot(3,2,3),plot(t,y3),hold on plotActual(), axis([58 150 -20 160]) grid on, title('Butterworth'), ylabel('Knee flexion angle (deg)') %------Chebyshev subplot(3,2,4),plot(t,y4),hold on plotActual(), axis([58 150 -20 160]) grid on, title('Chebyshev')

47
%------Inverse Chebyshev subplot(3,2,5),plot(t,y5),hold on plotActual(), axis([58 150 -20 160]) grid on, title('Inverse Chebyshev'), xlabel('Time (seconds)') %------Elliptic subplot(3,2,6),plot(t,y6),hold on plotActual(), axis([58 150 -20 160]) grid on, title('Elliptic'), xlabel('Time (seconds)') %Plot error for inverse chebyshev filter data figure; plot(120,y5(t120(1)*fs:t120(2)*fs)-120,... '.r','MarkerSize',15); hold on plot(105,y5(t105(1)*fs:t105(2)*fs)-105,... '.r','MarkerSize',15); plot(90,y5(t90(1)*fs:t90(2)*fs)-90,... '.r','MarkerSize',15); plot(75,y5(t75(1)*fs:t75(2)*fs)-75,... '.r','MarkerSize',15); plot(60,y5(t60(1)*fs:t60(2)*fs)-60,... '.r','MarkerSize',15); plot(45,y5(t45(1)*fs:t45(2)*fs)-45,... '.r','MarkerSize',15); plot(30,y5(t30(1)*fs:t30(2)*fs)-30,... '.r','MarkerSize',15); plot(15,y5(t15(1)*fs:t15(2)*fs)-15,... '.r','MarkerSize',15); plot(0,y5(t0(1)*fs:t0(2)*fs)-0,... '.r','MarkerSize',15); axis([-5 125 -50 50]), grid on, hold on plot([-5 125],[10 10],'b','LineWidth',2) plot([-5 125],[-10 -10],'b','LineWidth',2) plot([-5 125],[20 20],'g','LineWidth',2) plot([-5 125],[-20 -20],'g','LineWidth',2) plot([-5 125],[0 0],'k','LineWidth',2) title('Error for Static Trial') ylabel('Error (degrees)'), xlabel('Knee Flexion Angle (degrees)')

48
References Souryal, T., Adams, K., “Anterior Cruciate Ligament Injury”. eMedicine from WebMD. Carlo, D. Sell, K.E. “The effects of the number and frequency of physical therapy treatments
on selected outcomes of treatment in patients with anterior cruciate ligament reconstruction”. Journal of Orthopedic & Sports Physical Therapy. (December 1997)
Lewis, P.B., McCarty, L.P., Kang, R.W., Cole, B.J. “Basic Science and Treatment Options
for Articular Cartilage Injuries.” Journal of Orthopedic & Sports Physical Therapy. (October 2006)
Newman, A.P. “Articular Cartilage Repair”. The American Journal of Sports Medicine. 6 (2),
309-324. (1998) Salter, R.B., Simmonds, D.F., Malcolm, B.W., Rumble, E.J., MachMichael, D., Clements,
N.D. “The biological effect of continuous passive motion on the healing of full thickness defects in articular cartilage. An experimental investigation in the rabbit”. Journal of Bone and Joint Surgery. 62 (8): 1232-1251 (1980)
Buckwalter, J.A. Mankin, H.J. “Articular cartilage: degeneration and osteoarthritis, repair,
regeneration, and transplantation”. American Academy of Orthopedic Surgeons. (1998)
Worland, R.L., Arredondo, J. “Home continuous passive motion machine versus professional
physical therapy following total knee replacement”. The Journal of Arthroplasty. 13 (7) 784-787. (October 1998)
O’Driscoll, S.W., Giori, N.J., 2000. “Continuous passive motion (CPM): Theory and
principles of clinical application.” Journal of Rehabilitation Research and Development. 37 (2), 179-188.
Beynnon, B.D., Fleming, B.C., Johnson, R.J., Nichols, C.E., Renstrom, P.A. “Anterior
cruciate ligament strain behavior during rehabilitation exercises in vivo”. American Journal of Sports Medicine. 23 (1): 24-34 (February 1995)
Beynnon, B.D., Johnson, R.J., Fleming, B.C., Stankewish, C.J., Renstrom, P.A., Nichols,
C.E., “The Strain Behavior of the Anterior Cruciate Ligament During Squatting and Active Flexion-Extension”. American Journal of Sports Medicine. 27 (6): 823-829 (December 1997)
Brockmeier, P.M. “Effects of Articular Cartilage Defect Size and Shape on Subchondral
Bone Contact: Imlications for Surgical Cartilage Restoration”. (May 2008)

49
Guilak, F., Butler, D.L., Goldstein, S.A. “Functional Tissue Engineering: The Role of Biomechanics in Articular Cartilage Repair”. Clincal Orthopedics. 391: 295-305 (October 2001)
Insall, J.N., Ranawat, C.S., Aglietti, P., Shine, J. “A comparison of four models of total knee
replacement prostheses”. Journal of Bone and Joint Surgery. 58:754-765 (March 2010)
Moreland, J.R. “Mechanisms of failure in total knee arthroplasty”. Clinical Orthopedics.
226:49 (1998) Thompson, Julie. “Design, Construction, and Validation of a Cadaver Knee Motion Testing
Device”. (May 2008) Widuchowski, W., Widuchowski, J., Trzaska, T. “Articular cartilage defects: Study of 25,124
knee arthroscopies.” The Knee. 14 (3), 177-182 (June 2007) Collins, J.A. (2003) Mechanical Design of Machine Elements and Machines. John Wiley &
Sons. Nise, N.S. (2008) Control Systems Engineering, Fifth Edition. John Wiley & Sons. Craig, J.J. (2005) Introduction to Robotics: Mechanics and Control, Third Edition. Pearson
Education, Inc.
Wilson, D.R., Feikes, J.D., Zavatsky, A.B., O’Connor, J.J. “The components of passive knee movement are coupled to flexion angle”. Journal of Biomechanics. 33: 465-473. (2000)
Palmer, S.H., Cross, M.J. “Total Knee Arthroplasty”. eMedicine from WebMD. (April 2009)