control strategies for reactive batch distillation - ntnu · control strategies for reactive batch...
TRANSCRIPT
Control strategies for reactive batch distillation
Eva Swensen and Sigurd Skogestad”
Department of Chemical Engineering, University of Trondheim- NTH, N- 7034 Trondheim, Norway
A batch reactor may be combined directly with a distillation column by distilling off the light component product in order to increase the reactor temperature or to improve the product yield of an equilibrium reaction. The same amount of the light product should be removed as the amount being formed by the reaction at any time. A linearized model has been developed which describes the process behaviour satisfactorily for control analysis purposes. The controllability of a combined batch reactor/batch distilla- tion column is found to depend strongly on the operating conditions and on the time during the run. In general, controlling only the reactor temperature (one-point bottom control) is difficult since the set-point has to be specified below a maximum value in order to avoid break-through of an intermediate component in the distillate. This maximum value may be difficult to know a priori. For the example considered in this study, control of both reactor temperature and distillate composition (two-point control) is also found to be difficult due to large interactions in the column. As with one-point bottom control, the reactor temperature has to be specified below a maximum value. However, energy can be saved since the heat duty can be decreased with time. Controlling the temperature on a tray in the column (one-point column control) is found to give good performance for the given process with no loss of reactant and a high reactor temperature, although no direct control of the reactor temperature is obtained.
Keywords: reactive batch distillation; dynamic behaviour; controllability
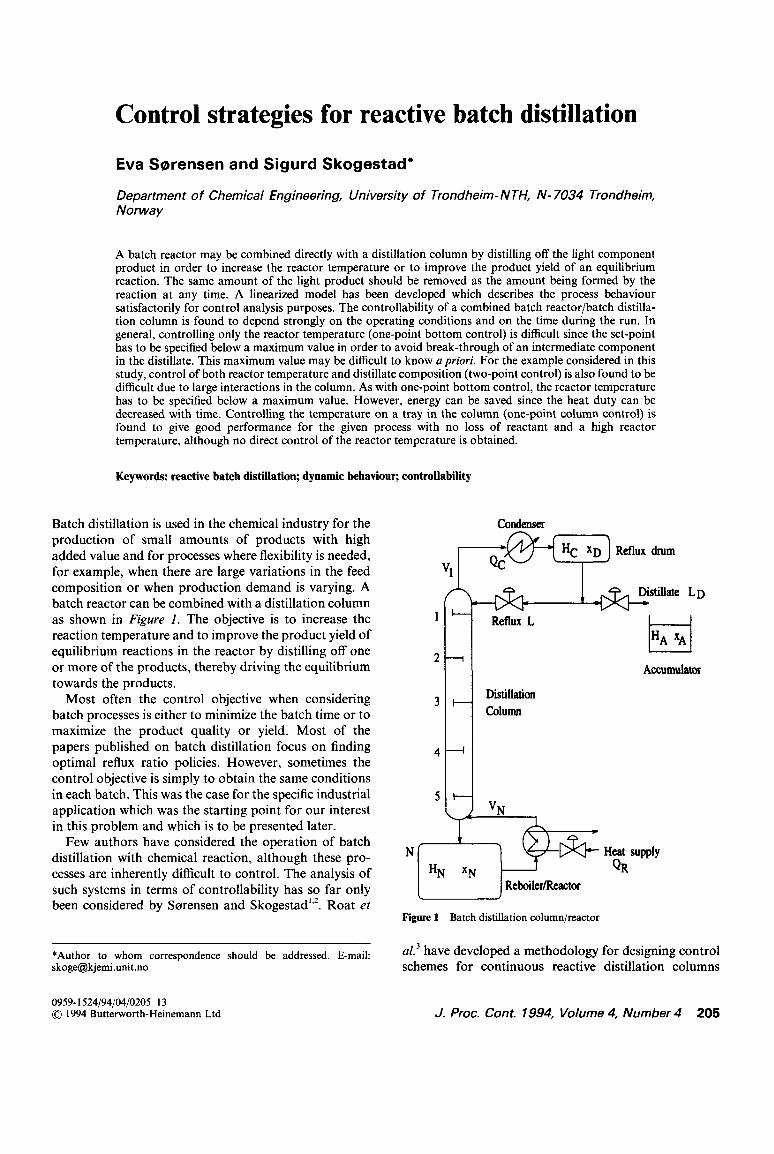
Batch distillation is used in the chemical industry for the production of small amounts of products with high added value and for processes where flexibility is needed, for example, when there are large variations in the feed composition or when production demand is varying. A batch reactor can be combined with a distillation column as shown in Figure 1. The objective is to increase the reaction temperature and to improve the product yield of equilibrium reactions in the reactor by distilling off one or more of the products, thereby driving the equilibrium towards the products.
Condenser
21 Accumulator
Most often the control objective when considering batch processes is either to minimize the batch time or to maximize the product quality or yield. Most of the papers published on batch distillation focus on finding optimal reflux ratio policies. However, sometimes the control objective is simply to obtain the same conditions in each batch. This was the case for the specific industrial application which was the starting point for our interest in this problem and which is to be presented later.
3
I
Distillation COlUlNl
Few authors have considered the operation of batch distillation with chemical reaction, although these pro- cesses are inherently difficult to control. The analysis of such systems in terms of controllability has so far only been considered by Sarrensen and Skogestad”‘. Roat el
N Heat QR
WPlY
Figure 1 Batch distillation column/reactor
*Author to whom correspondence should be addressed. E-mail: al3 have developed a methodology for designing control [email protected] schemes for continuous reactive distillation columns
0959- 1524/94/04/0205-13 0 1994 Butterworth-Heinemann Ltd J. Proc. Cont. 1994, Volume 4, Number 4 205

Control strategies for reactive batch distillation: E. Swensen and S. Skogestad
based on interaction measures together with rigorous dynamic simulation. However, no details about their model were given,
Modelling and simulation of reactive batch distillation have been investigated by Cuille and Reklaitis4, Reuter et ~1.~ and Albet et aL6. Cuille and Reklaitis4 developed a model and solution strategies for the simulation of a staged batch distillation column with chemical reaction in the liquid phase. Reuter et al.’ incorporated the simu- lation of a PI-controller in their model of a batch column with reaction only in the reboiler. The controller was used to control the top tray temperature using the distil- late flow as manipulated variable. They stated that their model could be used for the investigation of control structure with the aid of relative gain array (RGA) analy- sis but no details were given. Albet et aZ.6 presented a method for the development of operational policies based on simulation strategies for multicomponent batch distillation applied to reactive and non-reactive systems,
Egly et u/.‘~~ considered optimization and operation of a batch distillation column accompanied by a chemical reaction in the reboiler. Egly et ~1.’ presented a method for the optimization of batch distillation based upon models which included the non-ideal behaviour of multi- component mixtures and the kinetics of chemical reac- tions. The column operation was optimized by using the reflux ratio as a control variable. Feeding one of the reactants during the reaction was also considered. In a later paper’, they also considered control of the column based upon temperature measurements from different parts of the column. The optimal reflux ratio policy was achieved by adjusting the distillate flow using a non- linear control system. However, no details were given about either the column/reactor or the control system.
The purpose of this paper is to give an understanding of the dynamic behaviour of reactive batch distillation and to show how this process differs from batch distilla- tion without reaction. Also we investigate the possible difficulties in controlling a reactive batch distillation pro- cess and give some alternative control strategies based on an industrial example.
First, an industrial process, consisting of a batch reactor with a rectifying column on top, is presented. In this process the reaction is limited to the reactor/reboiler. Based on a staged equilibrium model of this process, we present special features of reactive batch distillation. We show how a linearized model of the process can be used to describe the behaviour in different operating points, and based on this linear model we present a simple con- trollability analysis based on step responses. Several control strategies are presented. We consider two-point control, where both the top and the bottom part are controlled, as well as one-point control, when only one part of the column/reactor is controlled. An RGA analy- sis is used for the investigation of control structures in two-point control.
Process example
In this study we have developed a dynamic model for a
combined batch reactor/batch distillation process con- sisting of a total mass balance, the mass balances for each component, the energy balance, linear tray hydraulics and Raoult’s law for the vapour-liquid equili- brium. A staged equilibrium model is used for the distil- lation column and the condenser holdup is assumed to be perfectly controlled. The dynamic model is given in the Appendix. It was solved and linearized using the pro- gram SPEEDUP.
The basis for the study is an industrial equilibrium esterification reaction of the type:
where R, is a dibasic aromatic acid (therephthalic acid with T, = 767°C) Rz and R, are glycols (1,2-propanediol with T,, = 188°C and 1,6-hexanediol with T, = 243°C) P is the solid polymer product (here given as the monomer block) and W is the side-product (water with T,, = 1OO“C). The overall reaction rate is described by the following rate equation:
rN = %, = hc+, + CR,) - kv (1)
where
ki = k,,iexp(- z(k - $)) (2)
The activation energy for the reverse reaction is the same as for the forward reaction, i.e. E, = E2. The frequency factor for the reverse reaction k,,* is one fourth that of the forward reaction ko,, . However, the reverse reaction is usually negligible as the concentration of W in the reac- tor cw will in most cases be very small (typically about 0.005 kmol me3 compared to about 4.7 kmol me3 for R,) since the water is constantly removed by distillation. The reverse reaction will only have some influence at the very end when most of the reactants have been used up and also CR,, cR, and CR, are small. A summary of the process data is given in Table 1. The physical properties data for
Table 1 Process data for simulation
Column
Reaction Activation energies
Frequency factors
Reference temperature for k,
Pressure in column/ reactor
Maximum heat input,
QKma, Hydraulic time
constant, r Condenser holdup, Hc Initial holdup on the
trays, Hp . Initial feed
Reboiler + five trays + total condenser + accumulator 1.0 R, + 0.7 RZ + 0.3 R, + P(s) + 2.0 W E, = ES = 18 kcal/mol = 7.5 x 100 kJ kmol-1 k,, = 0.06 rn’ h-l and koz = 0.015 m6 kmol-1 h-1 To = 500.0 K
1 atm
0.85x 10” kJ h-’ = 236.1 kW
0.0018 h =6.5 s
1.7 kmol 0.1 kmol
R,: 10.40 kmol (acid) R2: 7.28 kmol (alcohol) R,: 3.12 kmol (alcohol) P: 0.00 kmol (ester) W: 2.20 kmol (water)
206 J. Proc. Cont. 1994, Volume 4, Number 4

Control strategies for reactive batch distillation: E. Sorensen and S. Skogestad
Figure 2 Temperature profile with existing control strategy (one-point top control) without disturbances
the components (c,“p, hk, h,” and pi) were taken from Daubert and Danner’.
In the industrial unit the amount of reactant RZ in the feed was 20% higher than necessary to yield complete conversion of the reaction. This was done to account for the possible loss of the reactant in the distillate with the existing operating procedure. In this study no excess of Rz was used.
This process has been studied earlier’.‘.“. Compared to the process model used previously’.2, in this study the number of stages in the column is reduced from six to five and the excess of Rz is no longer included. Further- more the model is extended to include energy balances and a temperature- and concentration-dependent reac- tion rate (see Appendix). The optimization and on-line operation of the process using one-point column control were studied elsewhere”.
The existing operating procedure was to use one-point top control; the temperature at the top of the column T,
was kept constant at about 103°C using the reflux flow as manipulated variable. Simulations with the dynamic model in the Appendix gives a distillate composition of 0.004 (about 2 wt%) of the reactant Rz and thereby a loss of this component (about 1% in total). Due to distur- bances such as varying pressure, this loss was often higher in practice. The vapour flow was maximized by using maximum constant heating of the reactor QR,maa and the condenser level was controlled by the distillate flow LD.
The simulated temperature profile with this control stra- tegy for the ideal case with no disturbances is given in Figure 2. The reactor temperature TN is almost constant at the beginning but increases slightly as the reaction pro- ceeded. There is a sharp increase in temperature at the end of the reaction when the light reactant R, is almost used up. The conditions on trays 4 and 5 are practically equal because the column has more stages than are needed for the desired separation. The conversion at the end point of 10.5 h is only 0.957 due to the loss of RI.
With the existing control scheme there is no direct control of the reactor temperature TN and, more sever- ely, there is a varying loss of the reactant R,. This leads to a varying quality of the product P(s) between batches.
For this equilibrium reaction, combining the reactor with the distillation column has two effects:
0
0
Increase the reactor temperature by removing the light component W. This will also increase the rate constants and thereby the reaction rate. Drive the equilibrium reaction towards the products by removing the side-product W.
For this example, the rate of the reverse reaction is in most cases very low due to the low concentration of W in the reactor and the main effect will therefore be the increase in reactor temperature.
In operating the process one of the main objectives is to keep the reactor temperature as high as possible in order to reduce the reaction time. One way of achieving this is to run the process under pressure, but this was not possible for the industrial process studied in this exam- ple. However, the reactor temperature must not exceed 240°C since this might lead to decomposition of the polymer product P.
Understanding reactive batch distillation
The conventional operating policies for normal batch distillation columns are:
l constant distillate composition xn (or temperature
T,), l constant reflux ratio R,
l time varying reflux ratio R(t).
The constant distillate composition procedure is nor- mally implemented using feedback control with either reflux flow or distillate flow as manipulated variable. The reflux ratio procedures are open loop, that is, predefined values are used without feedback from the process.
As long as the set-point for the controlled variable xn or the manipulated variable R is high enough compared to the heat input QR the separation in the column will be satisfactory. Overspecifying the set-point, e.g. setting the reflux ratio to a higher value than necessary, will only result in a slightly longer batch time but the products being distilled will be purer than specified.
In the case of reactive batch distillation, where a reac- tion is taking place either only in the reboiler/reactor or in the whole column, some of the components will be removed and some will be formed in addition to what is removed or fed as part of the separation. The obvious question is then: can the same operating policies be used as for normal batch distillation? The answer is ‘yes’ for the constant distillate composition policy, but ‘no’ for the open-loop reflux policies, and in this section we will explain why.
Constant reflux policy
The temperature profile for the reactor when the process is operated according to the constant reflux ratio pro- cedure with R = 0.92 is given in Figure 3. Simulations with and without disturbances are given. The distur- bance is assumed to be in the reboiler heat duty QR ( f 18%). The temperature profile for the case with dis- turbances (solid line) deviates significantly from the ideal one without disturbances (dotted line). It should be noted that the loss of reactant R2 is only 3.7 x lo-’ and 9.1 x 10m5 kmol for the undisturbed and disturbed case respectively. However, the reboiler temperature deviates
J. Proc. Cont. 1994, Volume 4, Number 4 207
Control strategies for reactive batch distillation: E. Swensen and S. Skogestad
Figure 3 Top, disturbances in heat input; bottom, reactor tempera- ture profile with constant reflux ratio R = 0.92 with (-) and without ( ( 1 disturbance in heat input
~~~1 0 5 10 15
Time. Ihrl
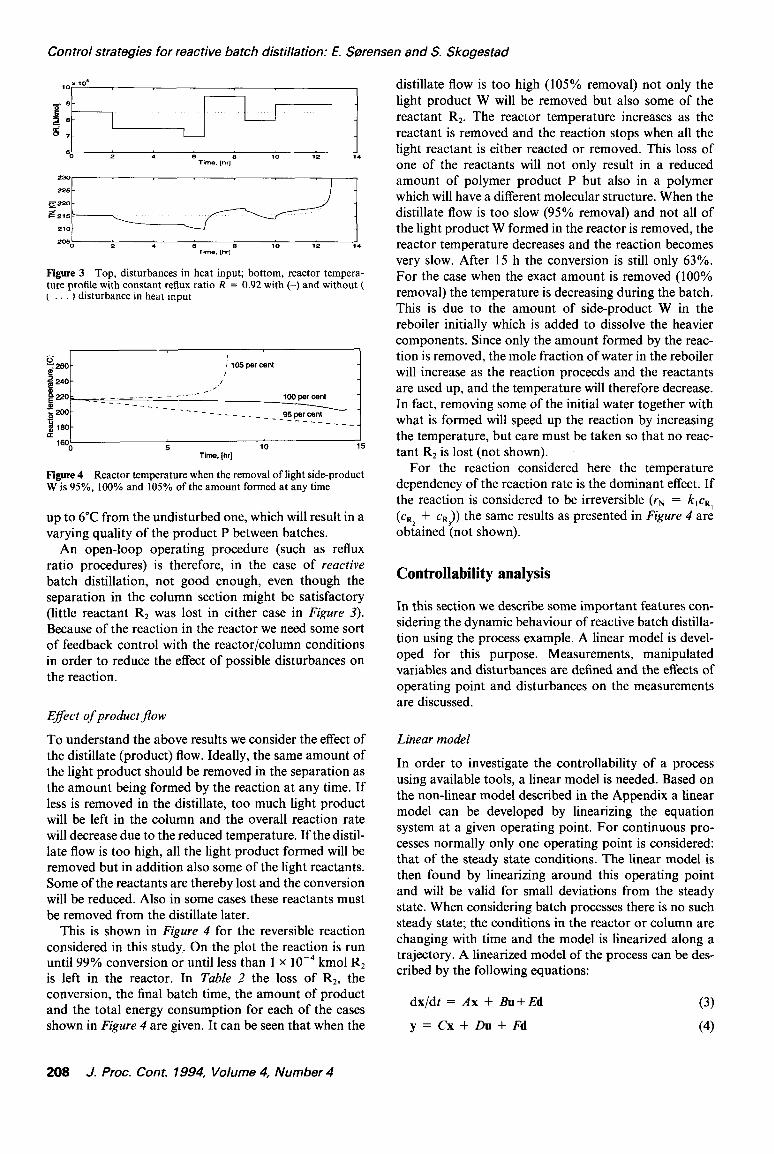
Figure 4 Reactor temperature when the removal of light side-product W is 95%, 100% and 105% of the amount formed at any time
up to 6°C from the undisturbed one, which will result in a varying quality of the product P between batches.
An open-loop operating procedure (such as reflux ratio procedures) is therefore, in the case of reactive batch distillation, not good enough, even though the separation in the column section might be satisfactory (little reactant R2 was lost in either case in Figure 3). Because of the reaction in the reactor we need some sort of feedback control with the reactor/column conditions in order to reduce the effect of possible disturbances on the reaction.
E#ect of productjow
To understand the above results we consider the effect of the distillate (product) flow. Ideally, the same amount of the light product should be removed in the separation as the amount being formed by the reaction at any time. If less is removed in the distillate, too much light product will be left in the column and the overall reaction rate will decrease due to the reduced temperature. If the distil- late flow is too high, all the light product formed will be removed but in addition also some of the light reactants. Some of the reactants are thereby lost and the conversion will be reduced. Also in some cases these reactants must be removed from the distillate later.
This is shown in Figure 4 for the reversible reaction considered in this study. On the plot the reaction is run until 99% conversion or until less than 1 x 10m4 kmol R2 is left in the reactor. In Table 2 the loss of R2, the conversion, the final batch time, the amount of product and the total energy consumption for each of the cases shown in Figure 4 are given. It can be seen that when the
distillate flow is too high (105% removal) not only the light product W will be removed but also some of the reactant RZ. The reactor temperature increases as the reactant is removed and the reaction stops when all the light reactant is either reacted or removed. This loss of one of the reactants will not only result in a reduced amount of polymer product P but also in a polymer which will have a different molecular structure. When the distillate flow is too slow (95% removal) and not all of the light product W formed in the reactor is removed, the reactor temperature decreases and the reaction becomes very slow. After 15 h the conversion is still only 63%. For the case when the exact amount is removed (100% removal) the temperature is decreasing during the batch. This is due to the amount of side-product W in the reboiler initially which is added to dissolve the heavier components. Since only the amount formed by the reac- tion is removed, the mole fraction of water in the reboiler will increase as the reaction proceeds and the reactants are used up, and the temperature will therefore decrease. In fact, removing some of the initial water together with what is formed will speed up the reaction by increasing the temperature, but care must be taken so that no reac- tant R, is lost (not shown).
For the reaction considered here the temperature dependency of the reaction rate is the dominant effect. If the reaction is considered to be irreversible (rN = klcR, (cR, + cR,)) the same results as presented in Figure 4 are obtained (not shown).
Controllability analysis
In this section we describe some important features con- sidering the dynamic behaviour of reactive batch distilla- tion using the process example. A linear model is devel- oped for this purpose. Measurements, manipulated variables and disturbances are defined and the effects of operating point and disturbances on the measurements are discussed.
Linear model
In order to investigate the controllability of a process using available tools, a linear model is needed. Based on the non-linear model described in the Appendix a linear model can be developed by linearizing the equation system at a given operating point. For continuous pro- cesses normally only one operating point is considered: that of the steady state conditions. The linear model is then found by linearizing around this operating point and will be valid for small deviations from the steady state. When considering batch processes there is no such steady state; the conditions in the reactor or column are changing with time and the model is linearized along a trajectory. A linearized model of the process can be des- cribed by the following equations:
dxldt = Ax + Bu+ Ed (3)
y = Cx + DU + Fd (4)
208 J. Proc. Cont. 1994, Volume 4, Number 4

Control strategies for reactive batch distillation: E. Swensen and S. Skogestad
Table 2 Results for different product flows
Removal as % of formation
Loss of reactant R2 (kmol)
Conversion of R,
Final batch time (h)
Product P, kmol (monomer block)
Energy consumption (kJ)
105.00 1.091 0.764 8.157 7.946 6.9 x lo6 100.00 2.2 x 10-S 0.990 14.303 10.296 12.2 x 10⁶ 95.00 3.8 x 10-e 0.990 328.041 10.296 278.8 x 10⁶
where
x=
Y’
u=
d=
Laplace transformation yields:
Y(S) = GM@) + GM(s) (5)
All variables represent deviations from the ‘natural drift’ along the trajectory with the flows and disturbances constant. It is the deviation from the natural drift which is important for control since this is the only thing the control system can affect. However, since this is a batch process which is never at a steady-state, the way we have reached the linearization point is also of importance since this will affect the states in the model (even when at a given time the values of the disturbances and outputs are identical). In this section we have used the trajectories given by 100% removal as presented earlier.
In defining the linear model we have assumed that the temperature in the reboiler TN can be measured in addi- tion to the amount of reactant R, in the distillate flow xn,2. These are the two variables we are mostly interested in controlling. In addition we also assume that the tem- perature in the condenser and on all the trays can be measured. The manipulated variables are the distillate flow LD, the reflux flow L and in some cases the heat input to the reboiler QR. If the heat input is assumed to be set as it will be when one-point control is used (nor- mally at its maximum value to reduce the batch time) it will be a possible disturbance. Other main disturbances are the pressure in the reactor and the reaction para- meters (stoichiometric coefficient, activation energy and frequency factors).
In Figure 5 the linear and non-linear model are com- pared for a 10% step in reflux flow L at t =6 h. It can be seen from the figure that the linear model describes the responses well up until z 0.1 h or 6 min. The linear model can therefore be used for control analysis purposes since in that case only the initial responses are of interest.
E#ect of operating point
In the previous section it was shown how the system changes with different product flows. It is obvious that the conditions in the column/reactor change when the
,i;
-4’ 1 0 0.05 0.1 0.15 0.2 0.25 0.3 0.35 0.4 0.45 0.5
Time, [hr]
I 0.15 0.2 0.35 0.3 0.35 0.4 0.45 0.5
Time, [hr]
Figure 5 10% step in reflux flow L: effect on distillate composition ~n,~ and reactor temperature TN for linear and non-linear model (at t= 6 h with 100% removal of W)
I 0.15 0.2 0.25 0.3 0.35 0.4 0.45 0.5
Time, [hr]
1.~~~
0 0.05 0.1 0.15 0.2 0.25 0.3 0.35 0.4 0.45 0.5 Time. [hrl
Figure 6 5% step in reflux flow L for linear model: effect on distillate composition and reactor temperature for different operating points
operating parameters, such as product flow, change. However, the conditions also change during the run.
In Figure 6 linear responses for a step in reflux for the case with 100% removal are given at different operating points for the distillate composition and the reboiler temperature (t = 0.5,2,4,6,8, 10, 12 and 14 h). It can be seen that the effect on temperature increases with time and especially towards the end of the batch. The res- ponses in distillate composition vary considerably, with the largest response at the beginning of the batch. How- ever, the responses are similar but differ in magnitude if plotted on log-scale (not shown). The difference in res- ponses is due to the. changing conditions in the column/ reactor with a light/heavy front in the column section which is lowered with time, thus giving the reduced res- ponses in distillate composition and the increased res- ponses in reactor temperature.
J. Proc. Cont. 1994, Volume 4, Number 4 209
Control strategies for reactive batch distillation: E. Swensen and S. Skogestad
may3 Tw4
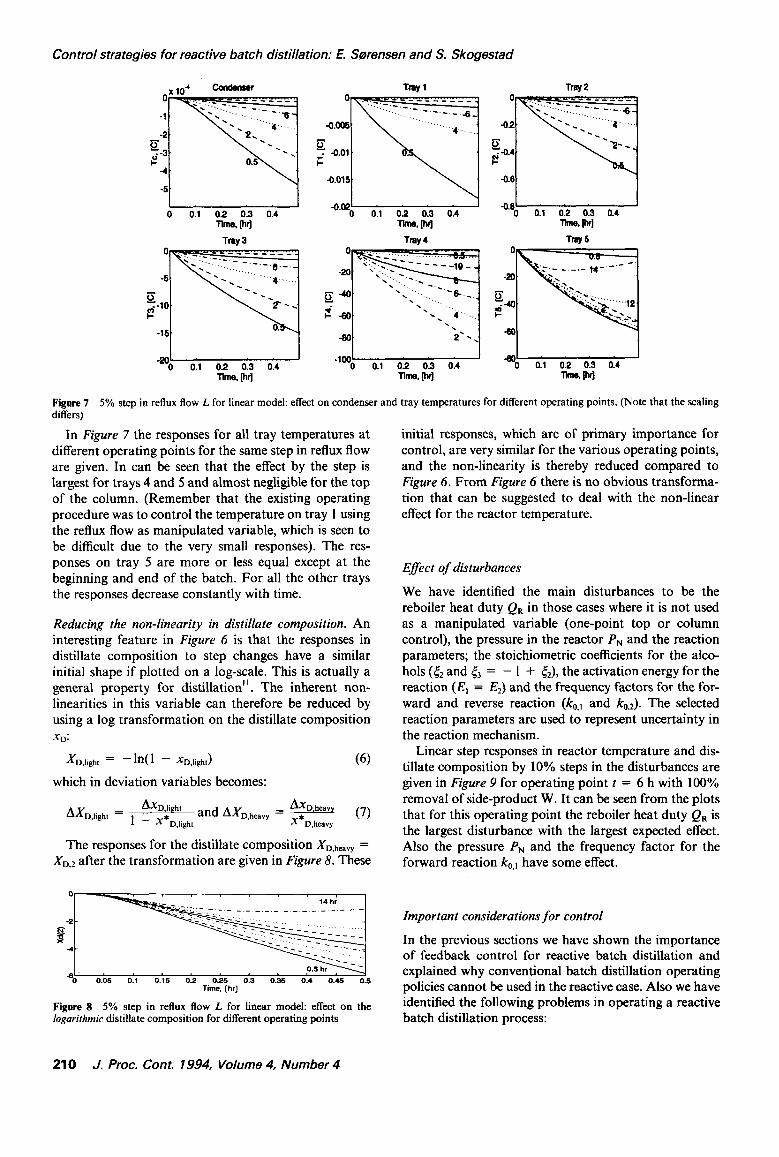
Figure 7 5% step in reflux flow L for linear model: effect on condenser and tray temperatures for different operating points. (Note that the scaling differs)
In Figure 7 the responses for all tray temperatures at different operating points for the same step in reflux flow are given. In can be seen that the effect by the step is largest for trays 4 and 5 and almost negligible for the top of the column. (Remember that the existing operating procedure was to control the temperature on tray 1 using the reflux flow as manipulated variable, which is seen to be difficult due to the very small responses). The res- ponses on tray 5 are more or less equal except at the beginning and end of the batch. For all the other trays the responses decrease constantly with time.
Reducing the non-linearity in distillate composition. An interesting feature in Figure 6 is that the responses in distillate composition to step changes have a similar initial shape if plotted on a log-scale. This is actually a general property for distillation”. The inherent non- linearities in this variable can therefore be reduced by using a log transformation on the distillate composition X&
XD,light = -Ml - XDJight)
which in deviation variables becomes:
(6)
The responses for the distillate composition XD,havy = X,.2 after the transformation are given in Figure 8. These
~~~
0 0.03 0.1 0.15 0.2 0.25 0.3 0.35 0.4 0.45 Time. [hr]
0.5
Figure 8 5% step in reflux flow L for linear model: effect on the logarithmic distillate composition for different operating points
initial responses, which are of primary importance for control, are very similar for the various operating points, and the non-linearity is thereby reduced compared to Figure 6. From Figure 6 there is no obvious transforma- tion that can be suggested to deal with the non-linear effect for the reactor temperature.
Effect of disturbances
We have identified the main disturbances to be the reboiler heat duty QR in those cases where it is not used as a manipulated variable (one-point top or column control), the pressure in the reactor PN and the reaction parameters; the stoichiometric coefficients for the alco- hols (& and & = - 1 + &), the activation energy for the reaction (E, = Ez) and the frequency factors for the for- ward and reverse reaction (k,,, and k,,*). The selected reaction parameters are used to represent uncertainty in the reaction mechanism.
Linear step responses in reactor temperature and dis- tillate composition by 10% steps in the disturbances are given in Figure 9 for operating point t = 6 h with 100% removal of side-product W. It can be seen from the plots that for this operating point the reboiler heat duty QR is the largest disturbance with the largest expected effect. Also the pressure P,., and the frequency factor for the forward reaction k,,, have some effect.
Important considerations for control
In the previous sections we have shown the importance of feedback control for reactive batch distillation and explained why conventional batch distillation operating policies cannot be used in the reactive case. Also we have identified the following problems in operating a reactive batch distillation process:
210 J. Proc. Cont. 1994, Volume 4, Number 4

Control strategies for reactive batch distillation: E. Sorensen and S. Skogestad
x10* B- 25
.
7- .*’ *-
,* 20- .’
c- *- _
(i- **
,’ *-
.’ **
,’ c*
.5- ** .’
15- .*
.’ **
4- .’ ‘t-m I’
B 5 ,’
T1 ,’ -IlO- ,-‘63
3- .’ _ E .’
<’ ,’
8’ .’
2- #’ s- .’
I’ _ .’ PN
I
,- .’
.’ ,’
**’
E,_._.___.___.___.-._._ ._._.-.-. -.-. El
;c=-=_z_7;z= =~_-~=:~.z
O~~._~-~.~~~~~-~___._.__._._~~~~_.~.~_.~.~~.~~
_- o-- m1
P?l. Ml
-, * -5 0 0.05 0.1 0.15 0.2 0.22 0.3 03 0.4 0.45 0.5 0 0.05 0.1 0.m 0.2 0.s 0.2 03 0.4 0.42 0.5
Tm% N J-mm (krl
Figure 9 Effect on distillate composition and reactor temperature by 10% steps in disturbances (t= 6 h with 100% removal)
Table 3 Control parameters used in the simulations
Bottom control K, = 3.0 and r, = 0.1 h Two-point control K, = -2.15 and 5, = 0.1 h
K, = -0.12 and r, = 0.1 h Column control Kp = 0.25 and r, = 0.1 h
l The same amount of side-product being formed should be removed at any time.
l The system’s response to changes varies with time as the conditions in the column/reactor change.
l The trays in the column have different and varying sensitivity to changes.
l The responses are generally non-linear.
These factors must be taken into account when deciding the control strategy.
Control strategies
The varying loss of reactant R2 in the distillate and the lack of direct control of the reactor temperature were the major problems with the existing operating practice using one-point top control. In the control part of this study the following alternative control strategies are con- sidered:
l one-point bottom control (controlling the reactor temperature directly),
l two-point control (controlling both the distillate composition and the reactor temperature),
l one-point column control (controlling the tempera- ture on a tray in the column).
The control parameters for the PI-controllers used in the simulations are given in Table 3. All controllers were tuned such that the closed-loop gain (using the linearized model at t =6 h with 100% removal) was one at fre- quency 60 rad h-l, giving a response time of 1 min. However, for two-point control the X,,* - L loop had to be detuned to a response time of 3 min to reduce the interactions in the column. Note that the transformed variable X,,* was used instead of x~,~ for two-point control.
One-point bottom control
The objective with one-point bottom control is to keep the reactor temperature constant at the highest possible temperature as this will maximize the rate of reaction for a temperature dependent reaction. The reflux flow L is used as manipulated variable and the heat input to the reactor is kept at its maximum value (QR = Qff,max = 0.85 x lo6 kJ kmol-‘. Consider the following procedures:
I F;’ = 210°C IT G’ = 215°C III 7$ = 220°C
The temperature profiles for each procedure are given in Figure IO. In Table 4 the loss of R2, the conversion, the final batch time, the amount of product and the total energy consumption for each of the cases shown in Figure 10 are given.
For operating procedures I and II the conditions are more or less constant with time, whereas procedure III
10 12 14 (0
Fim 10 One-point bottom control. Temperature profiles for differ- ent operating procedures
J. Proc. Cont. 1994, Volume 4, Number 4 211

Control strategies for reactive batch distillation: E. Sorensen and S. Skogestad
Table 4 Results for one-point bottom control with different set points for the reactor temperatures
Operating Set-point reactor procedure temperature (“C)
I 210.0 II 215.0 III 220.0
Loss of reactant R, (kmol)
4.3 x IO-6 3.0 x 10-s
0.749
Conversion of R,
0.990 0.990 0.897
Final batch time (h)
15.351 12.768 10.313
Product P (kmol) (monomer block)
10.296 10.296 9.329
Energy consumption (kJ)
13.048 x 10⁶ 10.853 x 10⁶ 8.766 x 10⁶
has a changing temperature profile with large variations at the beginning of the run but more or less stabilizing midway through. For operating procedure I the front between light and heavy component is low in the column, more light component than necessary is held back and the reaction rate decreases. For operating procedure II the front between light and heavy component is higher in the column and the reaction rate is therefore increased. For operating procedure III the set-point for the reactor temperature is too high and there is a loss of reactant R2 during the first couple of hours of the run. This is the same effect as described earlier; if the reactor tempera- ture is too low and too little side product is removed the reaction becomes slow and the conversion decreases, whereas if it is too high and too much is removed the conversion is reduced due to the loss of reactant.
There is in other words a maximum set-point for the reactor temperature in order to maximize the reaction rate but at the same time avoid loss of the reactant Rz. This maximum value will depend on the relative amounts of the reactants in the feed, on the reaction mechanism and on the disturbances in the system. This is illustrated in Figure 11, which shows how the mole fraction of R, in the distillate xD,* changes when the set-point for the tem- perature controller in the reactor is increased from G’ = 216.K to G’ = 217.o”C. An increase of 0S”C causes the mole fraction of reactant Rz to increase by a factor of 25. However, the loss of reactant is only tem- porary and X,,* is reduced to an acceptable level after about 1 h. The breakthrough is caused by the fact that when the specified temperature is above a certain maxi- mum value where most of the light component W is removed, a further increase is only possible by removing the light reactant Rz. If the set-point temperature is speci- fied below the maximum value, in this case ~216.O”C, good control of the system (TN x TN,set and xDZ < 1 X lo-‘) is achieved. The system can, however, become unstable at the end of the batch depending on the choice of control parameters in the PI controller.
Another alternative for raising the reaction tempera- ture, and thereby the reaction rate for a temperature dependent reaction, is to let the set-point follow a given
’ Tnsek217.0 C
s B
I,_\ ’
C 0 y rlL24 $5 0 0.5 1 1.5 2 2.5 3 3.5 4 4.5 5
Time. [hr]
Figure 11 One-point bottom control. Heavy component Rz in distil- late at different 7’;’ for the first 5 h of the batch
trajectory, e.g. a linear increase with time. Again, the maximum reactor temperature to avoid breakthrough will limit the possible increase, and breakthrough is inevitable if it is specified too high (not shown).
Two-point control
By using two-point control it may be possible to control both the top and the bottom part of the distillation column by implementing two single control loops in the system. In this way energy consumption can be reduced since it will no longer be necessary to keep the reboiler heat duty at its maximum value. In the case of the esteri- fication process, it is desirable to control not only the reactor temperature TN but also the composition of the distillate xD,Z, i.e. the loss of reactant RZ.
Two different control configurations are considered for the batch column:
LV-conjiguration Controlling the condenser level HC using the distillate flow LD leaving the reflux flow L and the reboiler heat duty QR to control the distillate compo- sition XD and the reactor temperature TN:
Hc-LD
DV-configuration Controlling the condenser level Hc using the reflux flow L leaving the distillate flow LD and the reboiler heat duty QR to control the distillate compo- sition XD and the reactor temperature TN:
HC c* L
XD,Z,TN * LD,&
Note that in both cases the logarithmic distillate compo- sition xD,* is used.
Analysis of two-point model. Open-loop step responses for both configurations are given in Figures 22 and 13. (The term ‘open-loop’ should here be put in quotes because we are not talking about an uncontrolled col- umn, but assume that the condenser level is perfectly controlled (HC ~1 LD or HC c, L) and we consider the effect of the remaining independent variables on the dis- tillate composition and reactor temperature.) From Figure 12 it can be seen that for the LV-configuration the responses to the chosen steps in L and QR are similar but opposite in direction. For the DV-configuration the res- ponses by a step in LD are similar to the step in L for the LV-configuration but in the opposite direction. How-
212 J. Proc. Cont. 1994, Volume 4, Number 4

Control strategies for reactive batch distillation: E. Slbrensen and S. Skogestad
Figure 12 Linear open-loop step (t = 6 h for 100% removal of W)
0.05 slep in OR
4
8’
i-1 -4
/ SO 0.1 0.2 0.3 0.4
Time. [hrl
0.05 step I” OR
10
Es
i .: El -10
a0 0.1 0.2 0.3 0.4 Time. Frl
responses for LV-configuration
0.05 stap I” QR
1
E 0.5
i .,.I -1
/ -1 .50 0.1 0.2 0.3 0.4
Time. [hrl
Figure 13 Linear open-loop step responses for DV-configuration (t = 6 h for 100% removal of W). Note that the y-axis scaling is 100 and 10 times smaller for changes in Qa compared to the LV-configu- ration
ever, the responses to a step in QR are very small and also there is an inverse response in Xi,*. This is a general property for distillation’2.
In a distillation column there are large interactions between the top and the bottom part of the column; a change in the conditions in one end will lead to a change in the other end as well. Because of these interactions a distillation column can be difficult or almost impossible to control. The interactions in a system can be analysed by various tools’3 including the RGA, or relative gain array. Systems with no interactions will have a RGA value of 1. The larger the deviation from 1, the larger the interaction and the more difficult the process is to control. Pairing control loops on steady-state RGA values less than 0 should be avoided.
The magnitude of the 1,l -element of the RGA for both the LV- and DV-configuration is given as a function of frequency in Figure 14. From the figure it can be seen that for the LV-configuration the RGA is very high at low frequencies (when the system is approaching a steady state). This shows that the interaction reduces the effect of the control input (L, QR) and makes control more difficult. RGA for DV is generally lower at all frequen-
Figure 14 RGA for LV- and DV-configuration for linear model (t=6 h for 100% removal of W)
ties. This difference between the configurations is the same as one would observe in a continuous distillation column.
However, the control characteristics from the RGA- plot for the LV-configuration are not quite as bad as it may seem. For control the steady-state values are gener- ally of little interest (particularly in a batch process since the process will never reach such a state), and the region of interest is around the system’s closed-loop bandwidth (response to changes), which is in the frequency range around 60 rad h-’ (response time about 1 min). We note that the RGA is closer to 1 here and that the difference between the two configurations is much smaller.
From the high-frequency RGA, which is close to 1, we find that for decentralized control, the loop pairing should always be to use the reboiler heat duty to control the reactor temperature and either the reflux flow or the distillate flow to control the distillate composition or the loss of reactant R2. This is in agreement with physical intuition.
TN * QR x D,2 - L,LD
Hc +-+ LD, L
Non-linear simulation of two-point model. Closed-loop simulations confirm that two-point control may be used if fast feedback control is possible. However, as in the case for one-point bottom control, we still have the problem of specifying a reasonable set-point for the bot- tom temperature to avoid breakthrough of reactant R2 in the distillate. An example of two-point control of the process using the LV-configuration is given in Figure 15 and Table 5 with the following set-points for the con- trollers: zt = 215°C and xu.2 = 2.5 X 10m6. (Note that we control the transformed distillate composition xn,2 instead of xn,Z in order to reduce the non-linearity in the model.) It can be seen that only a minor breakthrough of reactant occurs during the run. Both the distillate com- position $2 and the reactor temperature TN are kept approximately at their set-points through most of the batch but deviate towards the end. It should be noted how the heat duty decreases with time, which shows that energy can be saved using two-point control (compare with procedure II in Table 4 when QR is fixed at 0.85 x lo6 kJ kmol-‘).
J. Proc. Cont. 1994, Volume 4, Number 4 213

Control strategies for reactive batch distillation: E. Sorensen and S. Skogestad
Figure 15 Two-point control. Reactor temperature @,), distillate composition &), heat input (u,) and reflux flow (~3 for LV-configuration with set- points E = 215°C and xD,* = 2.5 x 10m6
Table 5 Results for two-point control
Set point reactor Set point temperature (‘C) distillate
composition
Loss of reactant Conversion R2 (kmol) ofR,
Final batch time (h)
Product P (kmol) (monomer block)
Energy consumption (kJ)
215.0 2.5 x 10⁻⁶ 4.9 x 10-S 0.990 12.788 10.296 9.037 x 10⁶
To achieve tight control of both ends of the column at the same time is difficult not only due to the interactions in the column (RGA = 5 at frequency 60 rad h-l). Another problem is that the set points for the two loops cannot be specified independently. If the reactor temper- ature is specified too high, the control system will not be able to maintain the specified purity in the top and will become unstable (not shown). This is due to constraints in QR,max. ‘Decoupling’ the column sections by introduc- ing more trays in the column will reduce the interaction problem.
One-point column control
With the existing operating practice the temperature at the top of the column was controlled. The set-point was 103°C which gave a composition of 0.4% of reactant R2 in the distillate. By lowering the set-point to e.g. lOO.l”C the distillate would be purer, but the column would become very sensitive to measurement noise, and this system would not work in practice.
One alternative is to measure the composition xD and use this for feedback as in two-point control in the pre- vious section. However, implementing an analyser (or possibly an estimator based on the temperature profile) is costly and often unreliable. A simpler alternative is to place the temperature measurement further down in the column since this measurement will be less sensitive to noise. In this investigation the temperature on tray 5, the tray above the reactor, is chosen as the new measurement to be used instead of the one on the top tray. This is because the effect of changes in the manipulated variable L is large and most consistent here (see Figure 7).
The reboiler heat duty is kept fixed at its maximum value (QR,max = 0.85 x lo6 kJ h-l). With this control configuration (TS t* L) there is no direct control of the
214 J. Proc. Cont. 1994, Volume 4, Number 4
0 2 4 6 8 10 12 14 Time. [hr]
Figure 16 One-point column control. Temperature profile with rp = 170°C
reactor temperature. However, with an appropriate choice of set-point TT’ loss of reactant R2 can easily be avoided and one of the main causes of the operability problems is thereby eliminated.
The temperature profile for one-point column control with set-point F’ = 170°C is shown in Figure 16 and the loss of reactant RI, the conversion, the final batch time, the amount of product and the total energy consumption are given in Table 6.
The conditions are ‘stable’ (i.e. no breakthrough of reactant R2) throughout the batch. The reactor tempera- ture increases towards the end but reaches the maximum reactor temperature before complete conversion. This can be avoided by adding a small excess of reactant R2 initially to account for the fact that some.of this reactant will be located on the trays in the column and will there- fore not be accessible for the reaction. Note that this control procedure with QR fixed at its maximum will yield the highest possible reactor temperature. This may be important in some cases when the reaction is slow.
Comparison of control strategies
In this section three alternative control strategies have been presented:

Control strategies for reactive batch distillation: E. Sorensen and S. Skogestad
Table 6 Results for one-point column control
Set point- temperature (“C)
Loss of reactant R2 (kmol)
Conversion ofR,
Final batch time (h)
Product P (kmol) (monomer block)
Energy consumption (kJ)
170.0 3.6 x 10-S 0.978 12.222 10.171 10.389 x 10⁶
4 x16
:ih 0 2 4 6 10 12 14
#-+J-- -0 6 10
Tm.N
Figure 17 One-point bottom control with disturbances in Qa. Reactor temperature, distillate composition, heat input and reflux flow with set-point Tff’ = 2 15°C. (Dotted line: set-point)
iii_:1 161 to’
I I
I OO
I 2 4 6 10 12 14
Figure 18 Two-point control with disturbances in QR. Reactor temperature, distillate composition, heat input and reflux flow with set-points rr = 2 15°C and xn.* = 2.5 x lo-‘. (Dotted lines: set-points)
l one-point bottom control (controlling the reactor temperature directly),
l two-point control (controlling both the distillate composition and the reactor temperature),
l one-point column control (controlling the tempera- ture on a tray in the column).
It was found that with the one-point bottom strategy good control of the reactor temperature was achieved if the set-point temperature was specified below a maxi- mum value. This is illustrated in Figure 27 for the case with disturbances in reboiler heat duty. The disturbances are the same as in Figure 3. The maximum reactor tem- perature is, however, difficult to estimate a priori and in practice the set-point must be specified low enough to ensure an acceptable performance. This will of course result in a slower reaction and a longer batch time.
Energy will be saved compared with one-point control as the heat duty can be reduced. Two-point control of the process including the disturbances in reboiler heat duty is given in Figure 18. Also in this case good control is achieved but both the reactor temperature and the distil- late composition deviate from their set-points towards the end of the batch due to the interactions between the control loops.
The existing operating practice, controlling the tem- perature at the top of the column, is poor, sensitive to noise and leads to a varying loss of reactant R2 and thereby varying product quality. The measuring point should therefore be moved from the top tray and further down in the column. The proposed new strategy of one- point column control, where the temperature on tray 5 is controlled, has several advantages:
Two-point control allows both the reactor tempera- l no loss of reactant R2 (compared to controlling the ture and the distillate composition to be controlled. top temperature),
J. Proc. Cont. 1994, Volume 4, Number 4 215

Control strategies for reactive batch distillation: E. Swensen and S. Skogestad
Figure 19 One-point column control with disturbances in Q,. Reactor temperature, distillate composition, heat input and reflux flow (u,) with set- point T;’ = 170°C. (Dotted line: undisturbed case) -
l need not worry about maximum attainable reactor temperature (compared to controlling the reactor temperature directly by one-point bottom control),
l no interactions with other control loops (compared to two point control).
The temperature profile for one-point column control with disturbances in the system is given in Figure 19. It can be seen that also with this control strategy the devi- ations in the reactor temperature are small compared with the open-loop strategy in Figure 3. The deviations are, however, larger than for one-point bottom or two- point control, but if the reactor temperature can be allowed to deviate about f 0.5”C then one-point column control is the simplest and most efficient control strategy.
Conclusions
In this paper a combined batch reactor/distillation pro- cess has been presented. The need for feedback control for reactive batch distillation has been discussed and it has been shown that the same amount of light product formed should be removed in the separation as the amount being formed by the reaction at any time.
A linearized model has been found to describe the process behaviour satisfactorily for central analysis purposes. The effect of operating point and of distur- bances has been discussed based on the linearized model. It has been found that the system’s response to changes varies with time as the conditions in the column/reactor change. Also the responses are generally non-linear.
Different control strategies have been presented. The one-point column control strategy is simple and was found to give good control of the process also in the presence of disturbances.
References
1 Sorensen, E. and Skogestad, S. AIChE 1991 Annual Meeting, Los Angeles, paper 140e, 1991
2 Sorensen, E. and Skogestad, S. presented at NATO Advanced Study Institute, Batch Processing Systems Engineering, Antalya, Ttirkey, May-June 1992
216 J. Proc. Cont. 1994, Volume 4, Number 4
Roat, S.D., Downs, J.J., Vogel, E.F. and Doss, J.E. Presented at CPC’3 (1986) Cuille, P.E. and Reklaitis, G.V. Comp. Chem. Eng. 1986, 10(4), 389 Reuter, E., Wozny, G. and Jeromin, L. Proc. CHEMDATA’II, Gothenburg, 1988,322 Albet, J., Le Lann, J.M., Joulia, X. and Koehret, B. Proc. COPE’91, Barcelona, Spain, 1991, 75 Egly, H., Ruby, V. and Seid, B. Comp. Chem. Eng. 1979,3, 169 Egly, H., Ruby, V. and Seid, B. Ger. Chem. Eng. 1983,4, 220 Daubert, T.E. and Danner, R.P. ‘Data Compilation Tables of Properties of Pure Compounds’ Design Institute for Physical Property Data, AIChE, Hemishere Publishing, 1985 Sorensen Leversund, E., Macchietto, S., Stuart, G. and Skogestad, S. Comp. Chem. Eng. 1994, 18 Suppl., S391 (supplement from ESCAPE’3, Graz, July 1993) Skogestad, S. and Morari, M. Ind. Eng. Chem. Rex 1988, 27(10), 1848 Skogestad, S. IFAC symposium DYCORD’92, Maryland, 1992 Wolff, E.A., Skogestad, S., Hovd, M. and Mathisen, K.W. pre- sented at the IFAC Workshop on Interactions Between Process Design and Control, Imperia1 College, London, September 68, 1992
Nomenclature
A B C
i d
E E F
G(s) G(S)
hL, ‘T HA
H, HO
H:, HC
ko,
&
L
L, LO
Ld N
nc p, Fy
$:
system matrix system matrix system matrix concentration of component i in reactor (kmol mm’) system matrix disturbance vector activity coefficient for reaction i (kJ mol-‘) system matrix system matrix transfer function transfer function for disturbances liquid enthalpy (kJ kmol-‘) vapour enthalpy (kJ kmol-‘) liquid holdup in the accumulator (kmol) liquid holdup on the trays (kmol) initial liquid holdup on the trays (kmol (= 0.1 kmol)) liquid holdup in the reactor (kmol) liquid holdup in the condenser (kmol) frequency factor for reaction i controller gain reflux flow (kmol h ‘) internal liquid flow (kmol h-‘) initial liquid flow (kmol h ’ (= 15 kmol h ‘)) distillate flow (kmol h-‘) number of theoretical stages number of components pressure (atm) vapour pressure (atm) condenser heat duty (kJ h-‘) reboiler heat duty (kJ h-‘)

Control strategies for reactive batch distillation: E. Swensen and S. Skogestad
reaction rate (kmol h-‘) ideal aas constant C=8.314 kJ kmol-’ Km’) internal reflux ratio time (h) final batch time (h) temperature (K) control vector vapour flow (kmol h-‘) state vector mole fraction of component i in liquid from tray j mole fraction of component i in distillate mole fraction of component i in vapour from trayj measurement vector
Greek ler ters
relative volatility deviation from operating point hydraulic time constant (h-l) integral time for controller (h) stoichiometric coefficient liquid density of component i (kmol mm’)
Subscripts and superscripts
i component number i tray number set set point * nominal value
Appendix. Dynamic model of reactive batch distillation column
The equations used in this study describing the dynamic behaviour of the combined batch reactor/batch distilla- tion column consist of the total mass balance, the mass balance for each component, the energy balance, tray hydraulics and phase equilibrium and are valid under the following assumptions:
Al A staged model is used for the distillation col- umn.
A2 Perfect mixing and equilibrium between vapour and liquid on all stages is assumed.
A3 The vapour phase holdup is negligible compared to the liquid phase holdup.
A4 The stage pressures and the plate efficiencies are constant.
A5 Changes in liquid enthalpies are neglected (dhL/ dtz0). This yields an algebraic energy balance.
A6 Linear tray hydraulics is considered. A7 Total condensation with no subcooling in the
condenser is assumed. A8 The chemical reaction is limited to the reactor. A9 Raoult’s law for the vapour-liquid equilibrium
holds. A10 The condenser holdup is assumed to be perfectly
controlled. All Immediate heat input is assumed.
Belowj denotes the stage number and i the component number. The following differential and algebraic equa- tions result.
reboiler, i= 1, n,, j= h?
dH,ldt = LN_1 - VN + k &ryq i=l
(8)
d(HNxd/dt = LN- 1x1~ ~,i - VNY, + 5rr,v
0 = LN-I(hh_l - h:) - VN(h; - hf+) + QR
r N = r,v(ci, TN)
(9)
(10)
(11)
(12)
column tray, i = 1, n,, j = 1, N - 1:
dH,ldt = 4-1 + 4+1 - Lj - 6 (13)
d(HjxjJ/dt = Lj-IXj- I,i + y+lYj+ l,i - LjXji - TYji
0 = L,_,(hi_, - hk) + y+,(hivi - hjL) -
condenser, i = 1, n,:
o=v,-L-LD
Hc. d(x,Jldt = Vly,,i - LxD,i - -&xLI,~
0 = V,h: - Lh4: - L& - Qc
L= R.V,
accumulator, i = 1, n,:
dH,ldt = L,,
d(HAXAi)/dt = LDxDi
linearized tray hydraulics, j = 1, N - 1:
L,=p+4-q t
equilibrium, i = 1, n,, j = 1, N:
yii = kjixji
restriction, i = 1, n,, j = 1, N:
$,Yji = l
physical properties, i = 1, n,, j = 1, N:
k,, = ‘;;‘(7;) JI P
hi” = h;(x,, 7J
h; = h,v(yji, lJ
pi = P,(T)
(14)
Vi(h; - hk)
(15)
(16)
(17)
(18)
(19)
(20)
(21)
(22)
(23)
(24)
(25)
(26)
(27)
(28)
The solid polymer product forms a separate phase and is therefore not included in the model. The initial con- ditions are total reflux and no reaction. Note that the reflux ratio is given as the internal reflux ratio L/VI since this is better solved numerically (between 0 and 1 instead of 0 and co).
J. Proc. Cont. 1994, Volume 4, Number 4 217