control of light -matter coupling in silicon photonic...
TRANSCRIPT

Control of lightControl of light--matter coupling matter coupling
in silicon photonic crystal nanocavitiesin silicon photonic crystal nanocavities
M. Galli, S.L. Portalupi, M. Belotti, L.C. Andreani
Department of Physics “Alessandro Volta,”
University of Pavia, Italy
L. O’Faolain (W. Whelan-Curtin), T.F. Krauss
School of Physics and Astronomy,
University of St. Andrews, United Kingdom
Work sponsored by: Fondazione CARIPLO, MIUR FIRB, EU FP6 ePIXnet

OUTLINE
1. Introduction to PhC slab nanocavities
2. Resonant light scattering and Fano lineshapes
3. Geometry optimization and effects of disorder
4. Conclusions
“Resonant light scattering in Silicon photonic crystal cavities”
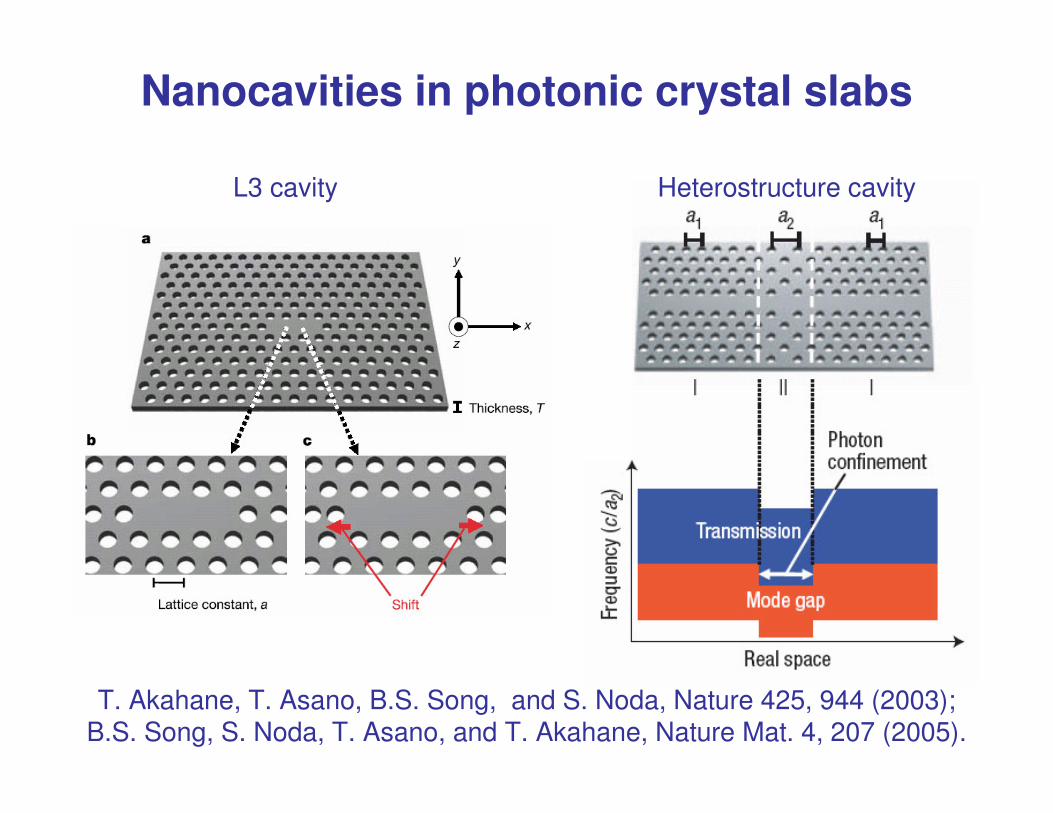
Nanocavities in photonic crystal slabs
L3 cavity Heterostructure cavity
T. Akahane, T. Asano, B.S. Song, and S. Noda, Nature 425, 944 (2003); B.S. Song, S. Noda, T. Asano, and T. Akahane, Nature Mat. 4, 207 (2005).

Photonic crystal slab nanocavities: strong light-matter interaction, QED effects
Purcell effect:
Chang et al., PRL 96, 117401 (2006)
Strong-coupling regime:
Hennessy et al., Nature 445, 896 (2007)

T. Akahane, T. Asano, B.S. Song, and S. Noda, Nature 425, 944 (2003)
Measurement of Q-factor:waveguide coupling (channel-drop filter)
• Needs coupling waveguide• Loading effect has to be taken into account
probe
emissiontransmission

Measurement of Q-factor: fiber (evanescent) coupling
• Needs accurate control of probe distance• Loading effect has to be taken into account
K. Srinivasan, P. Barkley, M. Borselli, O. Painter, Phys. Rev. B 70, 081306R (2004)
1. Introduction to PhC slab nanocavities
2. Resonant light scattering and Fano lineshapes
3. Geometry optimization and effects of disorder
4. Conclusions
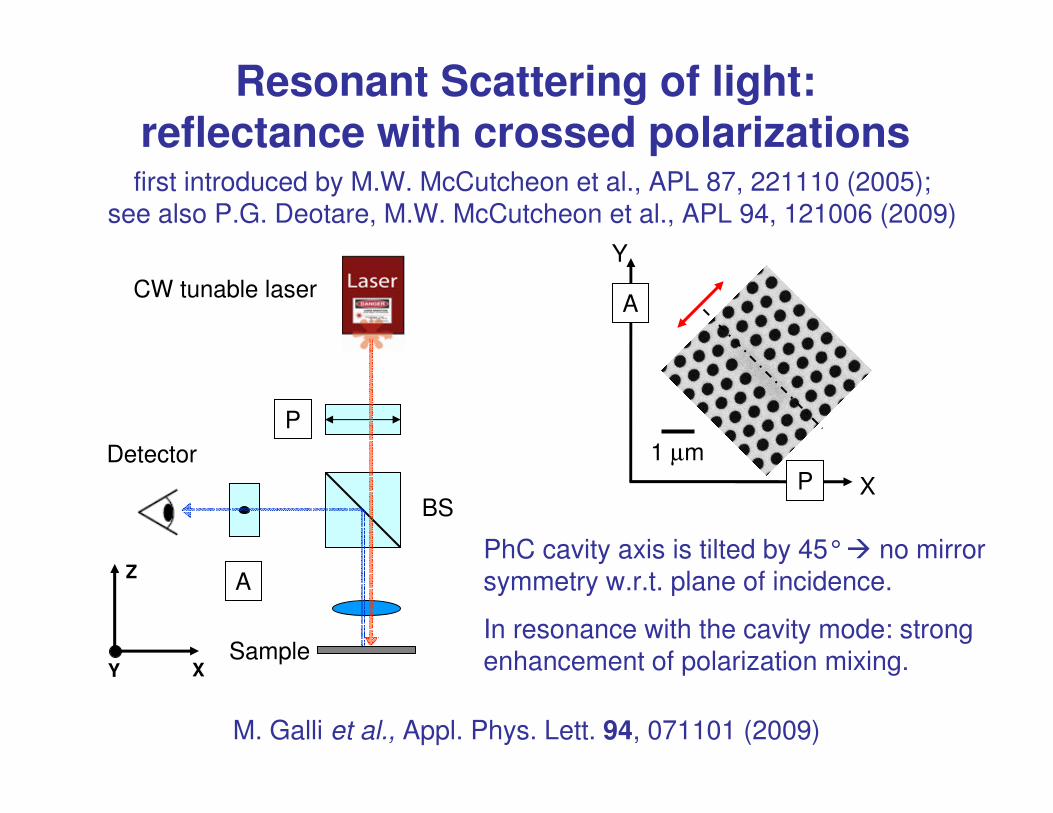
M. Galli et al., Appl. Phys. Lett. 94, 071101 (2009)
CW tunable laser
Detector
BS
SampleX
Z
Y
P
A
P
A
X
Y
1 µm
Resonant Scattering of light: reflectance with crossed polarizations first introduced by M.W. McCutcheon et al., APL 87, 221110 (2005);
see also P.G. Deotare, M.W. McCutcheon et al., APL 94, 121006 (2009)
PhC cavity axis is tilted by 45°� no mirror symmetry w.r.t. plane of incidence.
In resonance with the cavity mode: strong enhancement of polarization mixing.

Sample and resonant scattering spectra
1526.1 1526.2 1526.3 1526.4
2
4
6
8
10
12
14 Expt.
Sca
tte
red
In
ten
sity (
a.u
.)
Wavelength (nm)1.5 µm
Asymmetric lineshape (even below background level) � evidence for Fano interference effect
L3 cavity on Si membrane with d=220 nm, a = 420 nm, r/a = 0.3

Fano resonances in photonic crystals slabs: scattering by quasi-guided modes
0.6 0.7 0.8 0.9 1.0 1.10.0
0.2
0.4
0.6
0.8
1.0
Experiment
Fano best-fit
Reflecta
nce
Energy (eV)
Theoretical description: S. Fan, J.D. Joannopolulos, PRB 65, 235112 (2002);
A.R. Cowan, JOSA A 18, 1160 (2001); …
Experiment: V. Pacradouni et al., Opt. Quantum Electron. 34, 161 (2002);
M.Galli et al., IEEE J. Sel. Areas Commun. 23, 1402 (2005); …

The Fano interference effect
Interference between a discrete and a continuum scattering channel � asymmetric lineshape, depending on coupling parameter u
U. Fano, Phys. Rev. 124, 1866 (1961)
In the case of L3 PhC cavities:
Scattering by 2D photonic crystal � continuum of extended states
Scattering by cavity mode �discrete, localized state
( )( )
( )( )20
20
00/21
/2)(
Γ−+
Γ−++=
ωω
ωωω
uFAF u=resonant / non-resonant

( )( )
( )( )20
20
00/21
/2)(
Γ−+
Γ−++=
ωω
ωωω
uFAF
u = resonant / nonresonant
• |u| » 1 → weakly asymmetric • |u| ~ 1 → strongly asymmetric• |u| = 0 → reversed Lorentzian
Possible Fit with parameters |u| < 1 and F < 0 or |u| > 1 and F > 0
Fit with Fano lineshape
1540 1550 15600.0
0.2
0.4
0.6
0.8
1.0
1.2
u = 3
u = 1
u = 0
Sig
nal (a
.u.)
Wavelength (a.u.)
1526.1 1526.2 1526.3 1526.4
0.2
0.4
0.6
0.8
1.0
1.2
1.4 Exp.
Fano fit
Scattere
d Inte
nsity (
a.u
.)
Wavelength (nm)
d1=2 µm
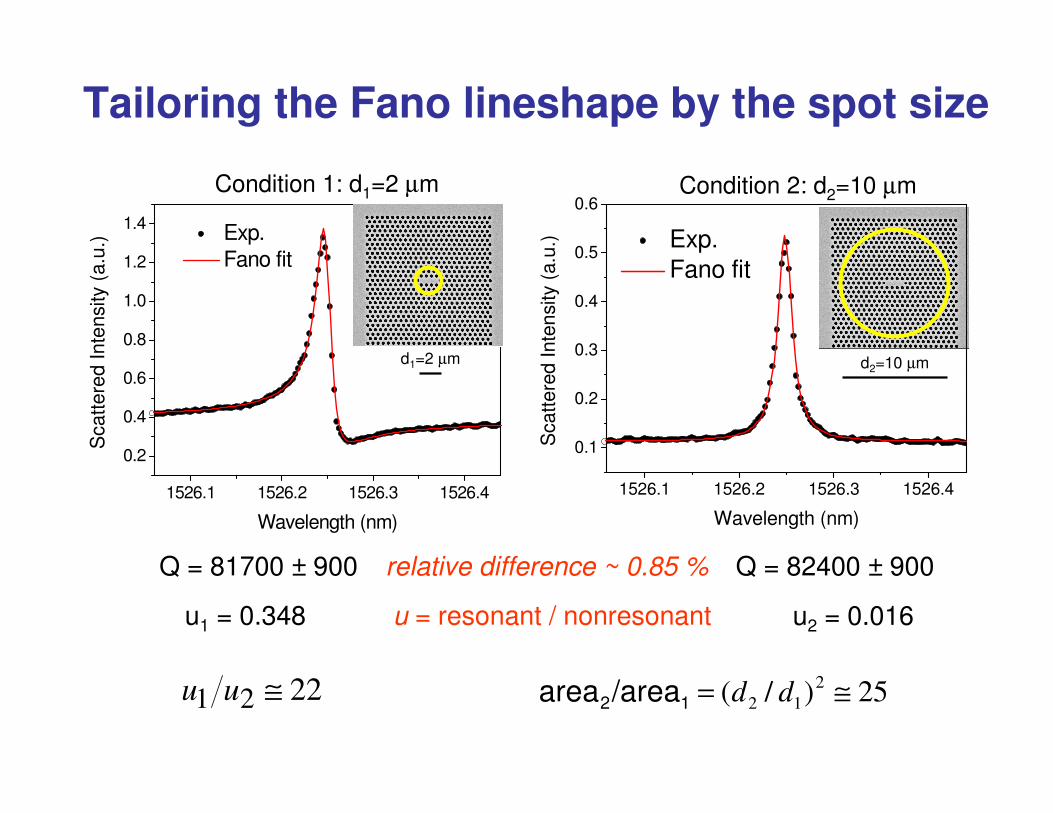
Tailoring the Fano lineshape by the spot size
Condition 1: d1=2 µm
d2=10 µm
1526.1 1526.2 1526.3 1526.4
0.1
0.2
0.3
0.4
0.5
0.6
Exp.
Fano fit
Scatt
ere
d I
nte
nsity (
a.u
.)
Wavelength (nm)
Q = 81700 ± 900 Q = 82400 ± 900
25)/( 2
12 ≅= dd12/areaarea2221 ≅uu
u = resonant / nonresonantu1 = 0.348 u2 = 0.016
relative difference ~ 0.85 %
Condition 2: d2=10 µm
1. Introduction to PhC slab nanocavities
2. Resonant light scattering and Fano lineshapes
3. Geometry optimization and effects of disorder
4. Conclusions
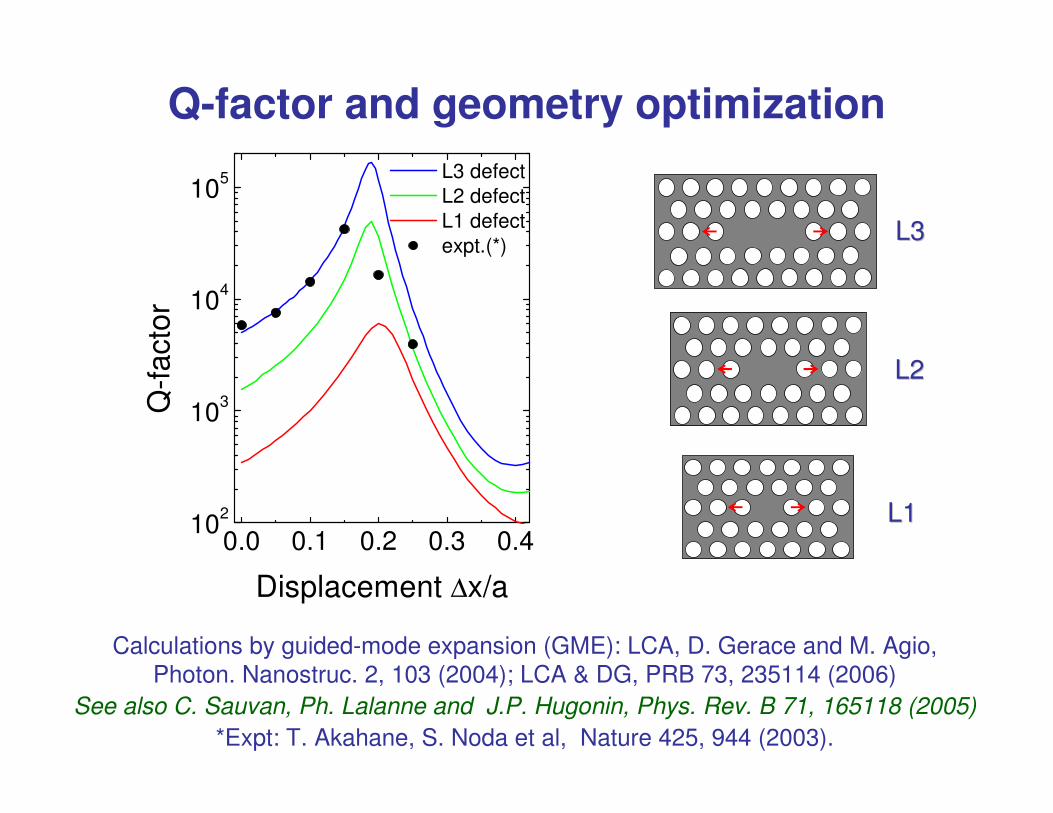
Q-factor and geometry optimization
L3L3
L2L2
L1L1
Calculations by guided-mode expansion (GME): LCA, D. Gerace and M. Agio,
Photon. Nanostruc. 2, 103 (2004); LCA & DG, PRB 73, 235114 (2006)
See also C. Sauvan, Ph. Lalanne and J.P. Hugonin, Phys. Rev. B 71, 165118 (2005)
*Expt: T. Akahane, S. Noda et al, Nature 425, 944 (2003).
0.0 0.1 0.2 0.3 0.410
2
103
104
105
L3 defect
L2 defect
L1 defect
expt.(*)
Q-f
acto
r
Displacement ∆x/a

A model of disorder: size variations
Random distribution of hole radii within a large supercell:
Dielectric perturbation couples guided modes to leaky PhC slab modes � out of plane losses can be calculated by electromagnetic perturbation theory
−−=
2
2
2
)(exp)(
σ
rrrP
)()()( dis rrr εεε −=∆
σ≡ r.m.s. deviation of radius
losses of linear (W1) waveguides Q-factors of nanocavities

Effect of size disorder on L3-cavity Q-factors
0.0 0.1 0.210
3
104
105
0.0 0.1 0.2 0.310
3
104
105
σ/a=0.020σ/a=0.015
σ/a=0.010
σ/a=0
σ/a=0.005
Shrinkage ∆r/a
σ/a=0.020σ/a=0.015
σ/a=0.010
σ/a=0
σ/a=0.005
Q-f
acto
r
Displacement ∆x/a
D. Gerace and L.C. Andreani, Photon. Nanostruc. 3, 120 (2005)

Experimental results on optimized L3 cavities
0.12 0.14 0.16 0.18 0.20 0.2220
40
60
80
100120140160
Theory (no disorder)
Experiment
Q f
acto
r (x
10
3)
∆x/a
a = 420 nm; r/a = 0.3; ∆r/r = – 0.06;
∆x/a = 0.14 to 0.20
Local geometry optimization
-100 -50 0 50 100
0
1
2
3
4
5
6
7
Experiment
Fano fit
Inte
nsity (
a.u
.)
Wavelength detuning (pm)
Maximum Q = 110 x 103
∆x/a = 0.19
M. Galli et al., Appl. Phys. Lett. 94, 071101 (2009)

Disorder parameter σ = r.m.s. deviation of holes radii
2
intrinsicexp
11
+=
aA
σ
Theoretical value: A = 0.62
0.14 0.16 0.18 0.200.7
0.8
0.9
1.0
1.1
((1
/Qe
xp-1
/Q0 )/A
)1/2
a (
nm
)
∆x/a
115 120 125 130 1350
50
100
150
200
250
300
350
400
Fre
qu
ency
Radius (nm)
σSEM=0.9 nmHoles radius distribution by SEM image
Experimental determination of disorder parameter
mean value: σRS=0.89 nm
20
40
60
80
100
120
140160
Theory (no disorder)
ExperimentQ fa
cto
r (x
103
)

80 100 120 140 1600
10
20
30
40
50
60
Holes radius (nm)
100 120 140 1600
20
40
60
80
100
Holes radius (nm)
Nominal σ = 0 nm
SEM σ = 0.91 nm
Nominal σ = 5 nm
SEM σ = 5.41 nm
Nominal σ = 10 nm
SEM σ = 10.65 nm
Effects of intentional disorder
100 120 1400
50
100
150
200
250
300
350
400
450
500
Fre
que
ncy
Holes radius (nm)

1523.8
1524.0
1524.2
1524.4
1.0
1.5
2.0
2.5
3.0
3.5
1518.4
1518.6
1518.8
1509.6
1509.8
1510.0
1510.2
RS
Sig
na
l (a
.u.)
Wavelength (nm)
∆λ = 22.5 pm
Q=67700
0 nm disorder 5 nm disorder
Wavelength (nm)
∆λ = 61.4 pm
Q=24760
9 nm disorder
Wavelength (nm)
∆λ=109.5 pm
Q=13852
a=420 nm, r/a=0.3, hole shift ∆x/a=0.16, hole shrink ∆r/r= - 0.06
Reduction of Q-factor

Quality factors Q decreases rapidly as a function of disorder parameter σ. Trends for cavities with different nearby holes shift ∆x/a are reproduced.
Dependence of Q-factor on disorder parameterQ
fa
cto
r (x
10
3)
0 2 4 6 8 100
20
40
60
80
100
120
0 2 4 6 8 100
20
40
60
80
100
120
Disorder parameter σ (nm)
∆x/a 0.14
0.16
0.17
0.18
0.19
0.2
expt.
Disorder parameter σ (nm)
∆x/a 0.14
0.16
0.17
0.18
0.19
0.2
theory
d=220 nm, a=420 nm, r/a=0.3, hole shrink ∆r/a=−0.06Theoretical calculation is non-perturbative (large σ)
1518.8 1519.0 1519.2
0.001
0.002
0.003
0.004
0.005
0.006
45 degrees
Sig
nal (a
.u.)
Wavelength (nm)
1518.8 1519.0 1519.2
0.001
0.002
0.003
0.004
0.005
0.006 90 degrees
Sig
nal (a
.u.)
Wavelength (nm)
1518.8 1519.0 1519.2
0.001
0.002
0.003
0.004
0.005
0.006
0 degrees
Sig
nal (a
.u.)
Wavelength (nm)
An
aly
ze
r
Polarizer X
Y
An
aly
ze
r
Polarizer X
Y
An
aly
ze
r Polarizer X
Y
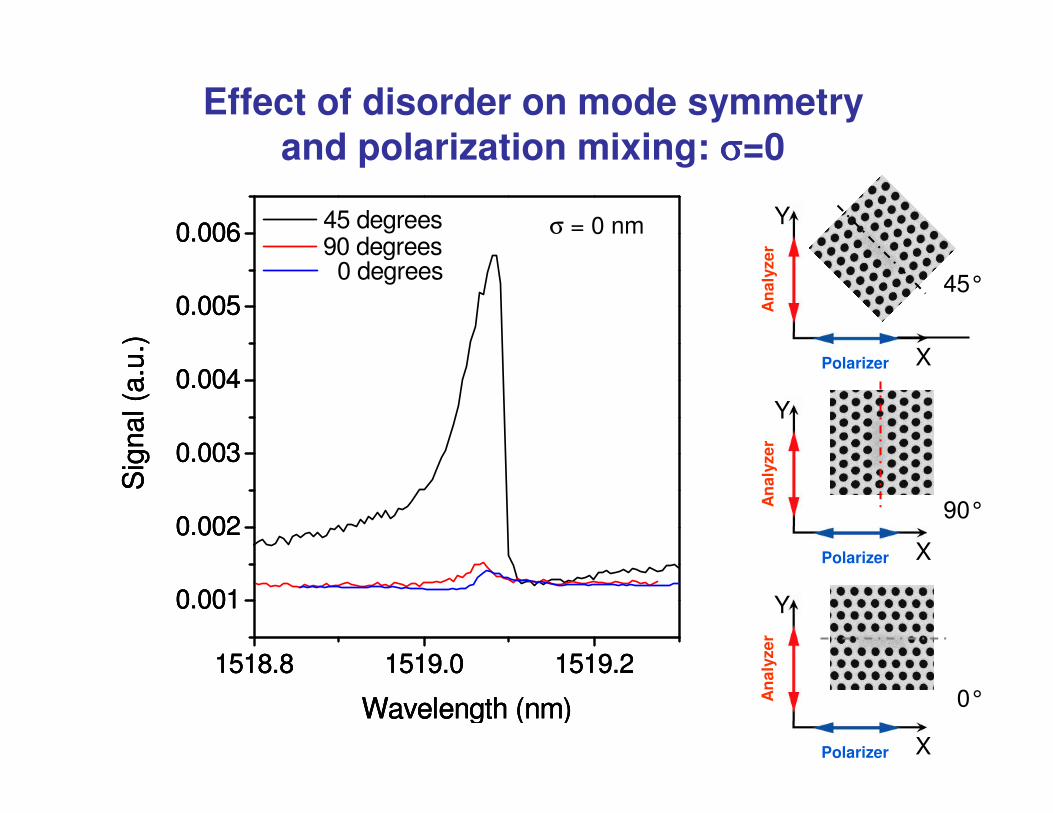
Effect of disorder on mode symmetry
and polarization mixing: σσσσ=0
45°
90°
0°
σ = 0 nm

An
aly
ze
r
Polarizer X
Y
An
aly
ze
r
Polarizer X
Y
An
aly
ze
r Polarizer X
Y
1519.8 1520.0 1520.2 1520.4 1520.6
0.000
0.002
0.004
0.006
0.008
0.010
0.012
0.014
0.016
0.018
45 degrees
90 degrees
0 degrees
Sig
nal (a
.u.)
Wavelength (nm)
45°
90°
0°
σ = 4 nm
Effect of disorder on mode symmetry
and polarization mixing: σσσσ=4 nm

An
aly
ze
r
Polarizer X
Y
An
aly
ze
r
Polarizer X
Y
An
aly
ze
r Polarizer X
Y
1515.2 1515.4 1515.6
0.0005
0.0010
0.0015
0.0020
0.0025
0.0030
0.0035 45 degrees
90 degrees
0 degrees
Sig
na
l (a
.u.)
Wavelength (nm)
45°
90°
0°
σ = 6 nm
Effect of disorder on mode symmetry
and polarization mixing: σσσσ=6 nm
An
aly
ze
r
Polarizer X
Y
An
aly
ze
r
Polarizer X
Y
An
aly
ze
r Polarizer X
Y
1510.8 1511.2 1511.6 1512.0
0.000
0.005
0.010
0.015
0.020
0.025
0.030
45 degrees
90 degrees
0 degrees
Sig
nal (a
.u.)
Wavelength (nm)
45°
90°
0°
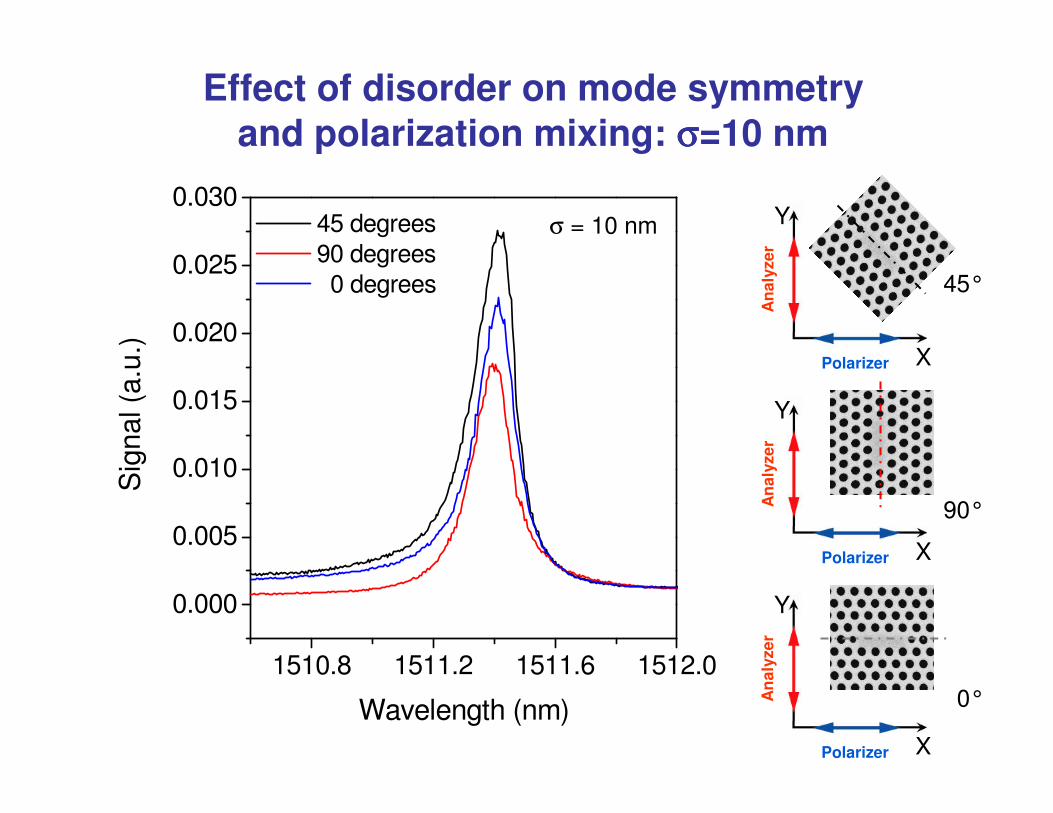
σ = 10 nm
Effect of disorder on mode symmetry
and polarization mixing: σσσσ=10 nm
CONCLUSIONS
• Resonant Scattering of light with crossed polarizations yields an accurate and loadless measurement of Q-factors in PhC
nanocavities.
• Resonant scattering spectra display Fano-type lineshapes
that can be tailored by changing the excitation spot size (but
fitted Q is unchanged).
• Behaviour of Q-factor as a function of local geometry
optimization as well as of intentional disorder is well reproduced
by theory.
• Resonant scattering has both an intrinsic origin (when the
plane of incidence is not a mirror plane of the cavity: 45°) and a
disorder-induced origin (when the plane of incidence is a mirror plane of the cavity: 0°or 90°).