control of flow separation from the deflected flap of a
TRANSCRIPT

Control of Flow Separation from the
Deflected Flap of a High-Lift Airfoil using
Multiple Dielectric Barrier Discharge
(DBD) Plasma Actuators
A THESIS
Present in Partial Fulfillment of the Requirements for
Graduation with Distinction in the Department of
Mechanical Engineering at The Ohio State University
By
Kristine L. McElligott
*********
The Ohio State University
May 2010

i
ABSTRACT
In current wing design, multiple flaps are incorporated into the trailing edge to allow mixing of
high and low pressure sides to reduce flow separation. These flaps reduce the efficiency by
adding weight and complexity to the aircraft. A single hinged flap would reduce these
inefficiencies but is more susceptible to flow separation. Active flow control is a means by
which the fluid flow over a body is deliberately altered and can be altered such that it becomes
less likely to separate from the object. By energizing the flow, the degree of separation of the
flow can be controlled, and this inherently controls lift. Dielectric barrier discharge (DBD)
plasma actuators are a form of active flow control. These actuators are created by
asymmetrically aligning two electrodes and adding a dielectric layer between the electrodes.
When the electrodes are electrically connected, ionized air (plasma) travels from the exposed
electrode towards the covered electrode. Collisions occur between the plasma and neutral air
over the body, and momentum is transferred to the neutral air, effectively energizing it. The
purpose of this study is to examine the lift enhancement and flow control authority that multiple
DBD plasma actuators have on a high-lift airfoil when compared to the flow exhibited by non-
controlled and single DBD plasma actuator controlled cases. Electrodes were mounted onto a
simplified NASA Energy Efficient Transport airfoil near the flap. The airfoil was tested in a
closed, recirculating wind tunnel operating at a Reynolds number of 240,000, 20° flap deflection
angle and 0° degree angle of incidence. The actuators were independently powered in order to
determine the most effective input parameters. Using multiple actuators operated in-phase has
increased the lift and has delayed flow separation on the trailing edge flap when compared to
baseline and single actuation cases.

ii
ACKNOWLEDGMENTS
I would first like to acknowledge Prof. Mo Samimy for allotting me the opportunity to conduct
undergraduate research. In addition to his constant support and guidance, he always welcomed
my inquiries regarding details pertaining to my research. I owe a debt of gratitude to Jesse Little
for his supervision and mentorship throughout my research process. I would like to thank
Professor Gregory for his participation on my review committee and Professor Guezennec for his
advice in an effort to prepare me for my oral defense of my thesis. Last, but certainly not least, I
would also like to thank the other graduate and undergraduate students at the Gas Dynamics and
Turbulence Laboratory for their support.

iii
TABLE OF CONTENTS
ABSTRACT ....................................................................................................................................................... i
ACKNOWLEDGMENTS ................................................................................................................................... ii
List of Figures ............................................................................................................................................... iv
List of Tables ................................................................................................................................................ iv
List of Equations ........................................................................................................................................... iv
Nomenclature ............................................................................................................................................... v
CHAPTER 1: Introduction .............................................................................................................................. 1
CHAPTER 2: Background ............................................................................................................................... 3
CHAPTER 3: Experimental Facility and Methodology ................................................................................. 10
3.1 Experimental Facility and Set‐up ...................................................................................................... 10
3.2 Data Instrumentation and Acquisition .............................................................................................. 13
3.3 Experimental Procedure ................................................................................................................... 18
CHAPTER 4: Results and Discussion ............................................................................................................ 24
4.1 Pressure Experiments ....................................................................................................................... 24
4.2 PIV Experiment .................................................................................................................................. 35
CHAPTER 5: Conclusions and Future Work ................................................................................................. 43
REFERENCES ................................................................................................................................................ 45

iv
List of Figures Figure 1. Simple Actuator ............................................................................................................................. 4
Figure 2. Modulation Types (Little 2010) .................................................................................................... 6
Figure 3. Average velocity in quiescent conditions (Little 2010) ................................................................. 8
Figure 4. Airfoil in Test Section ................................................................................................................. 11
Figure 5. Location of Static Pressure Taps ................................................................................................. 13
Figure 6. User Interface for Electrical Controls .......................................................................................... 14
Figure 7. Power Generation with Phase Difference .................................................................................... 15
Figure 8. Multiple Actuator Configuration ................................................................................................. 16
Figure 9. Actuators Mounted on Airfoil ..................................................................................................... 17
Figure 10. Cp Curve for Configuration #1 .................................................................................................. 24
Figure 11. Configuration #1 Phase Delay Test ........................................................................................... 26
Figure 12. Configuration #2 Phase Delay Test ........................................................................................... 26
Figure 13. Configuration #3 Phase Delay Test ........................................................................................... 27
Figure 14. Configuration #1 Frequency Sweep Test .................................................................................. 32
Figure 15. Configuration #2 Frequency Sweep Test .................................................................................. 32
Figure 16. Configuration #3 Frequency Sweep Test .................................................................................. 33
Figure 17. Configuration #2 Steady/Unsteady Actuation ........................................................................... 34
Figure 18. Configuration #3 Steady/Unsteady Actuation ........................................................................... 34
Figure 19. Cp Curve with Reported CL........................................................................................................ 36
Figure 20. Time-Averaged Vorticity .......................................................................................................... 37
Figure 21. Phase-Average Vorticity ............................................................................................................ 39
Figure 22. Wake Profile .............................................................................................................................. 41
Figure 23. Wake Profile of In-Phase and A2 Only cases ............................................................................ 42
List of Tables Table 1. Actuator Locations for Tested Configurations .............................................................................. 21
Table 2. Configuration Experiment Results ................................................................................................ 35
List of Equations (1) Cp………………………………………………………………...…………………………………….24 (2) CL…………………………………………………………………...………………………………….25 (3) Uncertainty…………………………………………………………………………………………….27 (4) Velocity of Wave………………………………………………………………………………………30 (5) Number of Wavelengths……………………………………………………………………………….30

v
Nomenclature BL = baseline c = airfoil model chord CL = lift coefficient Cp = pressure coefficient d = distance between actuators F+ = reduced frequency (xspfM/U∞) fM = modulation frequency N = wavelength ratio p = static pressure p∞ = freestream static pressure q∞ = freestream dynamic pressure <U> = average streamwise velocity U∞ = freestream velocity xsp = length of separated region x/c = normalized streamwise coordinate y/c = normalized vertical coordinate λ = wavelength of perturbation Ω* = normalized spanwise vorticity (Ωzc/ U∞) Ωz = spanwise component of vorticity AC = alternating current AFC = active flow control BM = burst mode DBD = dielectric barrier discharge DC = direct current dc = duty cycle LE = leading edge PIV = particle image velocimetry TE = trailing edge

1
CHAPTER 1: Introduction
In order for an aircraft to take-off, it must have sufficient speed (controlled by thrust force from the
engines) and lift (controlled by pressure forces on the body and wings of the aircraft). Maximum speed
before take-off is restricted by the length of the runway and engine capabilities. With relatively short
runways at some airports and on aircraft carriers, it has become necessary to more fully examine the
science behind lift and possible augmentation.
Lift generated by the wings for a given speed of the aircraft is dependent upon the shape and
projected area of the wing. In current wing designs in mid-size and large commercial and military
aircraft, the wings have multiple flaps that effectively change the wing shape and increase the projected
area during landing and take-off, where lift must be carefully monitored and controlled. The wing
changes such that flaps extend from the trailing edge of the wing and deflect downward. This extension
and deflection on the trailing edge of the wing creates a profile that appears to be almost a continuous
curve. This curve appears continuous because it is comprised of multiple sets of flaps that are controlled
by mechanisms in the main body of the wing. However, there are small gaps between the various flaps
which allow high pressure air from the lower side of the wing to mix with lower pressure air on the upper
side. This mixing energizes the flow on the upper side of the wing and is critical in the performance
because it prevents the flow separation over the flaps.
These multi-element wing designs increase the weight of the wing and therefore reduce the
overall efficiency of the wing. It has been suggested that replacing the multi-element flap with a single-
hinged flap will reduce the complexity while increasing the efficiency of the wing. However, severe flow
separation is imminent due to the lack of momentum transfer from the high pressure side to the low
pressure side. Active Flow Control (AFC) is a subject which has been utilized for providing the
necessary mass, momentum and/or energy to prevent flow separation. The success of AFC in any flow

2
system is dependent on suitable actuation systems. One such device is the dielectric barrier discharge
(DBD) plasma actuator. The remainder of this work is dedicated to understanding the mechanisms
behind DBD plasma actuators and how effective they are when used in preventing flow separation along a
test airfoil, and more specifically, the impact of using multiple actuators for flow control.
Flow separation over airfoils can significantly reduce the lift, increase drag and create vortices,
which introduce instability and possibly danger to the flight control of the aircraft. In a worst case
scenario, flow separation can cause unrecoverable stall, which is characterized by a complete loss of lift
often accompanied by total aircraft failure. The flaps operated by mechanical systems previously
described are successful for increasing lift without a significant flow separation penalty. However, the
extension and retraction of the flaps during takeoff and landing are accomplished by motors and linkage
systems within the main wing. These mechanisms add significant weight and mechanical complexity to
the wing thereby reducing fuel efficiency. The replacement of a multi-flap wing system with a single flap
using active flow control to avoid or at least to minimize flow separation offers many advantages and has
motivated significant work (Kiedaisch, Nagib et al. 2006; Melton, Schaeffler et al. 2007; Mabe, Calkins et
al. 2009).
Research on airfoils that replace multiple flaps with one hinged flap is currently being conducted
at The Gas Dynamics and Turbulence Laboratory (GDTL) located at The Ohio State University Airport
(Little et al. 2008 and 2009). The hinged single flap reduces the complexity of the wing, but increases the
chance for flow separation on the flap at large flap defection angles since it does not permit mixing
between the upper and lower sides. To eliminate, or at least reduce the size and effects of flow
separation, the air flowing over the wing near the surface must be energized so that it may negotiate the
effects of viscosity and an adverse pressure gradient encountered along the flap. This energy transfer is
accomplished by dielectric barrier discharge (DBD) plasma actuators. The following document provides
a detailed explanation of theories and testing facilities used to conduct experiments on a simplified airfoil
in an attempt to increase control authority.

3
CHAPTER 2: Background
Flow separation control is a form of AFC and is the means of creating tailored perturbations in
air flow over a body in attempts to deliberately change the flow structures and tendencies. AFC
is incorporated into an area of study that is focused on replacing multi-element wings of aircraft
(commercial, military, etc.) with a more simple design such as reducing trailing edge elements to
a singular flap. In traditional wings, the slats between the elements allow for mixing of air of the
high pressure side and the low pressure side. This mixing transports energy to the low pressure
side and inhibits flow separation. With a single hinge, mixing is eliminated, and the flow along
the top of the wing is unable to negotiate the adverse pressure difference along the flap, and flow
separation occurs. Flow separation can lead to increased drag, reduction of lift and early on-set
of stall. Active control of flow separation has shown the capability to increase lift and reduce
drag (Greenblatt and Wygnanski 2000). Actuators, an important component of AFC, have been
incorporated into airfoils and have been shown to prevent flow separation downstream of the
actuator, which can also increase circulation. An increase in circulation decreases the pressure
on the upper surface and ultimately leads to an increase in lift (Cerchie, Halfron et al. 2006).
The interest in Dielectric Barrier Discharge (DBD) Actuators has grown in the past
decade, but the exploration in AFC by means of ionized air has been investigated as early as the
1990s (Corke, Post et al. 2007). Plasma actuators specifically are attractive because they have
stationary parts, are easily installed and are lightweight relative to the mass of the airfoil (Mabe,
Calkins et al. 2009). DBD plasma actuators are constructed by asymmetrically aligning two
electrodes; the electrodes are separated by an insulating dielectric layer, see Figure 1. An
electric field is created when an AC voltage is applied to the electrodes (Corke, Post et al. 2007).
Plasma traditionally has been defined as a region of a gas discharge in which the number of

4
electrons is equal to that of the number of ions. The definition has since evolved to mean a
system of particles that exhibit behavior of coulomb interactions (Corke, Post et al. 2007).
Plasma is only created when the electric field exceeds a specific threshold; however, the strength
of electric field to maintain plasma is less than that which is required to create the plasma. The
strength required for creation of plasma is less for AC than DC-discharges (Corke, Post et al.
2007). The movement of charged species in the plasma transfers momentum to neutral air
particles through collisions. The properties of the boundary layer of the airflow are modified
when kinetic energy injects momentum to the inside of the boundary layer (Forte, Jolibois et al.
2006). Increased momentum decreases the likelihood of flow separation.
Figure 1. Simple Actuator
Plasma is produced from the exposed electrode and is drawn towards the covered
electrode with declining luminosity. The discharge induces airflow of several meters/second
towards the covered electrode. The maximum velocity is reached near the end of the plasma
formation and is very close to the surface (a few mm) (Forte, Jolibois et al. 2006). The effects of
the discharge mimic that of tangential wall jets (Corke, Post et al. 2007). Besides having an
impact on the tangential velocity, the actuators draw air from above the actuator creating a zone
of suction (Forte, Jolibois et al. 2006). Plasma is not created uniformly through the AC cycle.
The rise of the AC wave produces the most plasma (Corke, Post et al. 2007). The negative half
of the waveform dominates the momentum transfer and generates more horizontal velocity

5
(Forte, Jolibois et al. 2006). The momentum that the actuators impart on the airflow is low thus
limiting its uses in high-speed airflow applications (Mabe, Calkins et al. 2009).
Single DBD actuators, when incorporated on airfoils, have shown to increase stall angle,
reduce drag and reduce flow separation at low Reynolds numbers (Corke, Post et al. 2007). With
these preliminary findings, it’s important to understand how geometry and electrical parameters
influence the effect of DBD actuators have on airflow over an airfoil.
Geometry is another important factor in the performance of DBD plasma actuators. The
maximum velocity of the plasma has a parabolic relationship relative to the gap length between
the asymmetrically aligned electrodes. Actuators oriented asymmetrically produce a higher
velocity than when actuators are symmetrically oriented (Forte, Jolibois et al. 2006). A gap
length of 0 mm between the downstream edge of the exposed electrode and the upstream edge of
covered electrode encourages unity plasma. The electric field between the two electrodes is
strongest when the dielectric layer is thinnest, but a thin dielectric layer is more susceptible to
damage due to excessive heat (Forte, Jolibois et al. 2006). This damage greatly reduces the
mechanical efficiency. Additionally, a thin dielectric layer is more susceptible to failure due to
increased likelihood of arching between the electrodes and metallic components on the airfoil.
The velocity of the plasma and the extent to which the plasma covers the covered
electrode varies proportionally with the applied voltage (Forte, Jolibois et al. 2006; Corke, Post
et al. 2007). Despite the additional plasma, the power requirement and safety concerns greatly
increase with increasing voltage. Since the required power to create plasma is lower for AC, the
frequency of waveform and how the waveform is modulated contribute to the effectiveness of

6
the actuator. Plasma is created when actuators are operated between 1-10 kHz (Forte, Jolibois et
al. 2006; Corke, Post et al. 2007; Mabe, Calkins et al. 2009).
Modulating the carrier frequency has shown to have positive effects on flow control.
Modulation is the means of altering a carrier wave to transmit data. In amplitude modulation
(AM), the high frequency carrier wave is modulated using a sine wave whose frequency is the
modulated frequency, see Figure 2a. Modulation can be used with a variable duty cycle, referred
to as burst modulation (BM). Operating with a duty cycle permits more control over power
consumption and activity of the actuator (Little 2010). The duty cycle shown in Figure 2b is
50%. Unsteady actuation like this has proven to be more effective in preventing flow separation
using various actuation techniques (Seifert, Darabi et al. 1996). Low frequency amplitude
modulation has shown to delay stall and increase the lift coefficient, CL,max, at low trailing edge
(TE) flap deflections (Melton, Yao et al. 2004).
Figure 2. Modulation Types (Little 2010)
The modulation frequency is reported as the Reduced Frequency, a dimensionless
parameter. It is defined as

7
where is the separated length, is the modulated frequency and is the freestream
velocity. Pulsing at F+ near unity has shown to increase lift augmentation (Seifert, Darabi et al.
1996; Mabe, Calkins et al. 2007).
A single DBD plasma actuator at the TE has been previously explored for the airfoil used
in this experiment. Determining the most effective location for the actuator was an iterative
process, but began with placing the actuator near the flap hinge. Separation can be triggered by a
sudden shape change, such as a deflected flap, and actuators have proven to be most effective
when placed slightly upstream of the point where separation occurs (Huang, Corke et al. 2006).
The optimal location was determined by examination of largest suction peaks and upstream
effects, both of which are indication of trailing edge flow control (Cerchie, Halfron et al. 2006;
Kiedaisch, Nagib et al. 2006; Melton, Yao et al. 2006). The most effective location for a single
DBD actuator was determined to be at x/c = 0.775 measured from the downstream edge of the
exposed electrode (Little, Nishihara et al. 2008). DBD actuators that were incorporated in this
study are identical to those used in this experiment. They have been shown to produce airflow of
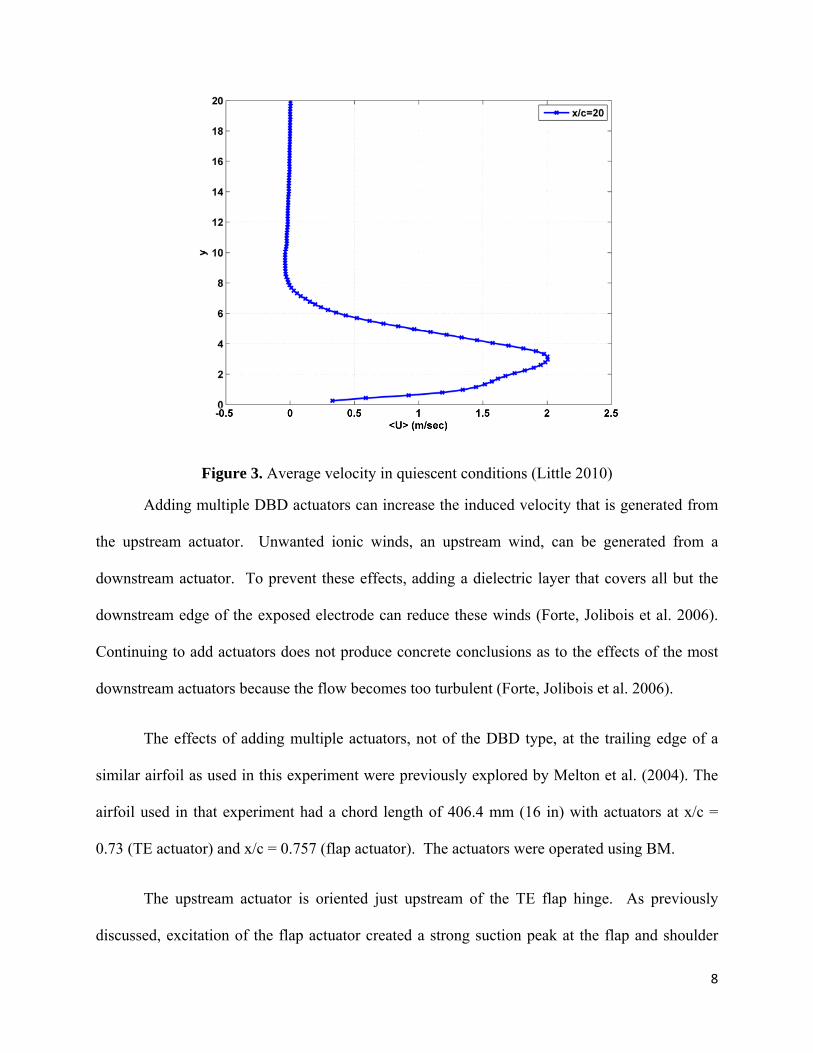
2 m/s when operated in BM in quiescent conditions, see Figure 3 (Little 2010).
8
Figure 3. Average velocity in quiescent conditions (Little 2010)
Adding multiple DBD actuators can increase the induced velocity that is generated from
the upstream actuator. Unwanted ionic winds, an upstream wind, can be generated from a
downstream actuator. To prevent these effects, adding a dielectric layer that covers all but the
downstream edge of the exposed electrode can reduce these winds (Forte, Jolibois et al. 2006).
Continuing to add actuators does not produce concrete conclusions as to the effects of the most
downstream actuators because the flow becomes too turbulent (Forte, Jolibois et al. 2006).
The effects of adding multiple actuators, not of the DBD type, at the trailing edge of a
similar airfoil as used in this experiment were previously explored by Melton et al. (2004). The
airfoil used in that experiment had a chord length of 406.4 mm (16 in) with actuators at x/c =
0.73 (TE actuator) and x/c = 0.757 (flap actuator). The actuators were operated using BM.
The upstream actuator is oriented just upstream of the TE flap hinge. As previously
discussed, excitation of the flap actuator created a strong suction peak at the flap and shoulder

9
and created an area of more positive pressure downstream of the slot. An increase in lift and
delay in flow separation were a result of these effects. The maximum lift improvements for
actuation occurred when the TE flap was deflected 20-25° (Melton, Yao et al. 2004). The flap
actuator was shown to have more effect on the airflow than the TE actuator when actuators were
operated independently. When the actuators were operated in conjunction with each other the
phase delay of modulation frequency of the actuators in BM were tested. Melton determined that
actuators were most effective in increasing lift and delaying separation when the phase delay was
within 30° relative to in-phase, and lift and flow separation control was weakest when actuators
were operated out-of-phase (Melton, Yao et al. 2004).

10
CHAPTER 3: Experimental Facility and Methodology
3.1 Experimental Facility and Set-up
Experiments were conducted in a Göttingen-type, closed, recirculating wind tunnel. The tunnel
is operated by an axial fan powered by a 200 hp AC induction Motor. The wind tunnel is
capable of reaching speeds from 3 to 90 m/s (7 to 200 mph) in the test section. This study only
requires speeds near 15 m/s (34 mph).
The tunnel is equipped with an optically accessible 61 x 61 x 122 cm3 (2 x 2 x 4 ft3) test
section. The walls of the test section are 2.54 cm (1 in) thick and are made of super abrasion
resistant acrylic. Each side wall has a 30.5 cm (12 in) diameter port. The ports are located 30.5
cm (12in) from the test section floor and 61 cm (24 in) downstream of the test section entrance.
The purpose of the ports is to hold the airfoil in place during testing and align the model at
various angles of attack, Figure 4.

11
Figure 4. Airfoil in Test Section
The contraction into the test section is a 6.25:1 ratio, while the downstream diffuser
expands at an overall angle of 6°. This configuration allows for continuously variable velocities
in the aforementioned range. A hexagonal cell aluminum honeycomb is located upstream of the
test section in order to condition the flow. High porosity stainless steel screens are mounted
downstream of the test section to act as a safety catch. Since the tunnel is a closed circuit, high
efficiency turning cascades made of galvanized steel are installed in each of the four tunnel
elbows. This configuration within the tunnel reduces freestream turbulence levels to the order of
0.25% with +/-1% variation in the freestream velocity when measurements are taken 6 inches
from the test section inlet.

12
In order to maintain a stable thermal environment in the test section, the tunnel is
equipped with an aluminum fin/copper, double row heat exchanger utilizing water as the cooling
medium. The temperature is maintained with a set point controller and an electronic modulating
valve. As a result, the tunnel freestream operating temperature is maintained to be +/-1°C of the
ambient temperature when sufficient source of cooling water is supplied (maximum of .0032
m3/s [50 gpm]).
The airfoil selected for the series of experiments is a simplified high-lift version of the
NASA Energy Efficient Transport (EET) airfoil (Melton, Yao et al. 2004). It is simplified in that
it only has a simple trailing edge flap whereas the full model is equipped with a segmented
leading edge slat and trailing edge flap. The chord length, c, is 25.4 cm (10 in) and the model
spans the entire test section length of 61 cm (24 in). The trailing edge, simple flap is capable of
deflections of 0 to 60°; the flap length is 25% of the chord length. Instrumentation in the airfoil
includes 45 staggered static pressure taps near the center line and 15 static pressure taps at ¼ and
¾ the span of the airfoil. Location of the static pressure taps in the profile view can be found in
Figure 5.

13
Figure 5. Location of Static Pressure Taps
3.2 Data Instrumentation and Acquisition
Actuators are independently powered in order to determine the most beneficial input parameters.
The input signal is generated and controlled by a dSpace DSP 1103 board. The user interface
permits control of the electrical potential gain, the duty cycle, carrier frequency, modulation
frequency and a phase delay for one of the actuator’s control frame. Additionally, a
compensated phase shift is added to ensure that while the signals have a modulated phase shift,
the peaks and troughs of their carrier signals coincide. This is a critical component since if one
actuator is at a high potential and the second is at a low potential, sparking will occur between

14
the two actuators because electrical energy travels from the high potential to lowest potential. In
previous experiments, this sparking has lead to damage of the actuators, airfoil and
instrumentation. A snapshot of the user interface can be found in Figure 6. An example of the
power generation can be found in Figure 7. Notice the delay in modulation signal but the peaks
and troughs for the carrier signals are in-phase.
Figure 6. User Interface for Electrical Controls

15
Figure 7. Power Generation with Phase Difference
Power is supplied by two identical Powertron Model 1500S AC power supplies, and each
is equipped with a step-up high voltage transformer. The transformer is necessary in order to
increase the voltage to an amplitude that is required in order to generate plasma on the actuators.
The voltage generated by the power supply was monitored by high voltage probes, and the
signals were reviewed during the experiments on a LeCroy Waverunner 6050A oscilloscope.
Voltage loss in the lead wires from the power supply to the actuators are disregarded for data
analysis.
Actuators are mounted onto the airfoil by placing the covered ground electrodes directly
onto the surface. The exposed high voltage electrodes are insulated from the grounds by three
layers of heat resistant Kapton tape. The exposed electrodes are placed on top of the tape such
that it is upstream of the ground electrode with no gap between the downstream edge of the
exposed electrode and the upstream edge of the covered electrode. A cross-sectional profile is

16
provided in Figure 8. The exposed electrodes measure 6.35 mm (0.25 in) wide and 0.09 mm
(0.0035 in) thick, and the covered electrodes measure 12.7 mm (0.5 in) wide and 0.09 mm
(0.0035 in) thick. The width of the exposed high voltage electrode is secondary in importance to
the width of the covered ground electrode (Forte, Jolibois et al. 2006). Three layers of Kapton
tape are used measuring 50.8 mm (2 in) wide with a total thickness of 0.27 mm (0.011 in). The
width is large relative to the widths of the two types of electrodes because the Kapton tape serves
as a common barrier for both electrode sets. This configuration is chosen due to the close
proximity of the set of actuators and the electrical communication that might result if the
electrodes are not sufficiently protected. Additionally, it removes surface discontinuities
between the actuators. A second single layer of 12.7 mm (0.5 in) wide and 0.09 mm (0.0035 in)
thick Kapton tape is used to insulate all but the trailing edge of the downstream exposed
electrode. This is added in order to minimize parasitic ionization and cross talk between the two
devices which can reduce the effectiveness of the devices (Forte, Jolibois et al. 2006; Do, Kim et
al. 2008). Figure 9 is an image of the actuators mounted onto the airfoil.
Figure 8. Multiple Actuator Configuration

17
Figure 9. Actuators Mounted on Airfoil
Static taps are incorporated into the model to collect pressure readings (Cp) around the
airfoil. The pressure readings give an indication of lift and location of flow separation. Three
Scanivalve digital sensor arrays (DSA-3217) are used to collect data from the 45 static pressure
tap locations at a sampling rate of 10 Hz. Data from the sensors is viewed during the experiment
using LabView software. The data is monitored to characterize the stability of the flow and give
a preliminary estimate of the CL.
The flow field is examined using a two-component particle image velocimetry (PIV)
system with DaVis 7.2 software. PIV requires a light source, seeding particles and a camera to
track particle movement. The light source is a dual-head Spectra Physics PIV-400 Nd:Yag laser.
The laser is reflected by mirrors from its source to a location over the test section, it is then

18
manipulated by a set of spherical and cylindrical lenses to form a thin laser sheet which lies in a
plane parallel to the flow near the model centerline. The laser pulse has a width of 9ns, which
freezes the flow in time so that an image can be taken. The short pulse length is required in
order to prevent streaking (Dabiri 2009). The pulse length is sufficient for supersonic flows, but
the flow used for this experiment is safely in the subsonic flow region (Ganapathisubramani,
Clemens et al. 2006). A 6-jet atomizer introduces olive oil seed particles upstream of the test
section. The atomizer reduces a liquid into a spray of particles with diameters of approximately
1 μm. The camera chosen to collect the images is a LaVision 14 bit 2048 by 2048 pixel Imager
Pro-X CCD camera with a Nikon zoom lens. An additional Vivitar 2x teleconvertor is used to
increase spatial resolution. Ideally, the camera is oriented perpendicular to the light source
(Dabiri 2009), but the wall plugs and electric leads create optical obstructions. The camera is
oriented downstream at an angle of approximately 13° relative to the perpendicular datum. The
time separation between two laser pulses for correlating particle movement is 45 μs for the
camera setup and flow conditions surveyed. Adaptive window, multi-pass processing with final
window size of 32x32 pixels is used to correlate the two image frames using 50% overlap. A
correction algorithm is applied for the non-orthogonal camera angle, and post processing
removes spurious vectors that fall outside of an unrealistic velocity range and applies a
smoothing filter to the calculated velocity field. All data that is below the airfoil is eliminated
from post-processing since the laser sheet cannot penetrate the airfoil. This also decreases
processing time.
3.3 Experimental Procedure

19
The experiments on the airfoil were tested at a Reynolds number of 240,000 ± 1,000. The
dimensionless Reynolds number represents various aspects of the fluid flow and environment
such as the temperature in the test section, tunnel speed, atmospheric pressure, chord length,
dynamic viscosity and gas constant of the working fluid. The Reynolds number of 240,000 is for
a tunnel speed of approximately 15 m/s (34 mph). This is a relatively low speed for the
capabilities of the wind tunnel and the pressure sensors. The static pressure sensors and flow in
the wind tunnel require 10-20 minutes to reach thermal steady-state so that reliable experiments
can be conducted. The angle of incidence, the angle at which the flow encounters the leading
edge of the airfoil, is set to be 0°. The trailing edge flap is deflected to 20°. A flap deflection of
30° would have inherently produced more lift, but because of the increase in adverse pressure
gradient, it would have been more difficult to control separation. The initial purpose of this
study was to first determine if multiple actuators were able to re-attach the flow to some degree
before examining the limitations of multiple actuators.
Based on previous studies conducted on this airfoil, both sets of actuators were powered
with a carrier frequency of 2000 Hz and a modulated frequency of 120 Hz (Little, Nishihara et
al. 2008; Little, Nishihara et al. 2009). The modulating frequency coincides with the natural
frequency of vortex shedding from the flap in these conditions (F+= 0.5), which has previously
been most successful for lift enhancement (Little, Nishihara et al. 2008; Little, Nishihara et al.
2009). The voltage applied is 18 kV peak to peak. In previous experiments involving this
airfoil and a single actuator, the actuator was powered with 20 kV peak to peak (Little, Nishihara
et al. 2008; Little, Nishihara et al. 2009), but due to the close proximity of the actuators, the
voltage was decreased for safety. Unsteady actuation has proven to be more effective in
preventing flow separation for various actuators and flow systems (Seifert, Darabi et al. 1996).

20
The carrier signal is modulated with a duty cycle of 50% based on previous work (Little,
Nishihara et al. 2008; Little, Nishihara et al. 2009).
Control authority is most effective for a single actuator located at x/c=0.775, where x is
measured relative to the downstream edge of the exposed electrode (Little, Nishihara et al.
2008). The actuator location is defined in this manner because this is the location of maximum
body force production by the plasma (Enloe, McLaughlin et al. 2004). The location of x/c=0.775
is henceforth referenced as optimal location. Based on this knowledge, the multiple actuators
were adjusted relative to this parameter. The term ‘A1’ refers to the upstream actuator and ‘A2’
refers to the downstream actuator. In the first configuration tested, A1 is placed at the optimal
location and A2 at x/c= 0.875. This configuration is selected because it is hypothesized that
placing an actuator downstream of the optimal location will continue to re-attach the flow if the
separation point is delayed by A1. This allows for a nominal space size of 6.35 mm (0.25 in)
between the downstream edge of the covered upstream actuator and the upstream edge of the
exposed downstream actuator. Having the actuators closer together will affect control authority,
but it comes at a greater risk of electrical communication between the actuators and ultimate
failure of the device. The second configuration tested was one in which the optimal location is
between the two actuators. A1 is located at x/c=0.725 and A2 is located at x/c=0.825. This
configuration is chosen because it was unclear if the location of A2 in the previous configuration
is too far downstream to re-attach a highly separated flow. The final configuration tested is one
in which A1 is located upstream of the optimal location at x/c=0.675 while A2 is located at the
optimal location. It is hypothesized that locating a second actuator upstream of the optimal
location could ‘pre-condition’ the flow over the airfoil and the actuator at the optimal location
will have a greater success of re-attaching the flow if correct phase matching can be obtained.

21
The configurations are summarized in Table 1; actuators located at the optimal location have
been marked for emphasis. In all configurations, the device covers some pressure taps in the
vicinity of the flap. These taps must be removed from analysis because creating holes in the
actuators in order for pressure readings to be taken would render the actuator inept.
Table 1. Actuator Locations for Tested Configurations
The first set of experiments was run in order to determine which configuration produced
the most lift. An increase in lift is an indication of an increase in control authority. Data
collected by the static pressure taps are integrated to determine the lift. Tests are run in the same
sequence. The first step is to ensure that each actuator is operating properly individually and
concurrently. Proper operation is characterized by production of plasma and no discharge or
sparking between the separated actuators. The second step is to take a baseline case to
characterize the lift of the airfoil at the given operating conditions. Additionally, A1 and A2 are
operated independently to define lift due to each actuator.
The first test is a Phase Delay Sweep Test. The modulation phase delay between the
actuators is varied between 0° and 360° in increments of 30°. Due to unsteadiness that may arise
during the experiments due to the covered pressure taps and experiments being conducted days
apart, baseline cases are taken between each increment. As a result, the change in lift coefficient,
ΔCL, is reported, not the overall lift, CL. After the phase delay of 180° test is conducted, the
A1 Location
x/c
A2 Location
x/c
Configuration #1 0.775 0.875Configuration #2 0.725 0.825Configuration #3 0.675 0.775
22
actuators are operated independently in an effort to characterize the stability of the actuators over
time. This test is also conducted after the phase delay of 360° test. The purpose of the phase
delay test is not only to determine the optimal delay between the signals, but also to find if there
is a delay that is detrimental to lift when compared to a single actuator at the optimal location
and even the non-controlled case.
The second test is a Frequency Sweep test. The modulated frequency of the actuator not
at the optimal location is altered from 30 Hz to 360 Hz in increments of 30 Hz. Only the actuator
not located at the optimal location is altered since the best operating conditions are already
known at x/c=0.775 (Little, Nishihara et al. 2008; Little, Nishihara et al. 2009). For the second
configuration, the modulated frequency of A2 is altered because if A1 is capable of maintaining
an attached flow up to A2, the separation length changes for the configuration and the optimum
modulating frequency may change for A2. A baseline is taken between each increment in the
same fashion as the first test. The device is operated with the carrier and modulated signals in-
phase in BM.
The third and final test conducted to determine the most effective configuration is a Duty
Cycle Test. Three cases are run in addition to the baseline: A1 steady and A2 at 50% dc, A1 at
50% dc and A2 steady, and both actuators at steady operation. Both are operated with a carrier
frequency of 2000 Hz and modulated at 120Hz. Steady operation is defined as a Duty Cycle
equal to 100%. For a single actuator, 50% dc proved to be the most effective (Little, Nishihara
et al. 2008; Little, Nishihara et al. 2009), but since the flow structures will have changed due to a
second actuator, perhaps a steady operation will prove to be more effective.

23
The second set of experiments is a PIV test using the most effective configurations as
determined by the first set of experiments. PIV experiments are limited due to time constraints
and size of data files associated with the tests. PIV test runs incorporate the parameters that
produced the maximum lift from the phase delay test, incorporating the parameters that produced
the minimum lift from the phase delay test, operating A1 only, operating A2 only and a baseline.
Data includes time-averaged and phase-averaged sets. The time-averaged data can indicate how
well the flow is attaching in an average sense while the phase-average data can give a temporal
sense of vortex shedding.

24
CHAPTER 4: Results and Discussion
4.1 Pressure Experiments
The first test conducted is the Phase Delay Sweep Test for the three configurations selected.
Based on the pressure readings taken during the test, the pressure coefficients, Cp, and then the
lift coefficient, CL, are calculated. The pressure distribution of the in-phase (0° phase shift) for
Configuration #1 is presented in Figure 10 along with the baseline (BL) pressure distribution for
the particular test.
Figure 10. Cp Curve for Configuration #1
The pressure coefficient is a dimensionless parameter, see Equation 1, and it is a ratio of
the local static pressure on the airfoil relative to the freestream dynamic pressure.
(1)

25
where is the local pressure, is the freestream static pressure, and is the freestream
dynamic pressure. The ordinate of the plot is reversed to match the orientation of the airfoil. A
negative Cp indicates suction and most commonly effects the upper-side (suction side) of the
airfoil, and a positive Cp indicates pressure and most commonly effects the underside (pressure
side) of the airfoil. The abscissa of the plot has been non-dimensionalized with reference to the
chord length, c. The lift coefficient is calculated by integrating the difference of the pressure
coefficient of the pressure side and the suction side of the cord length, see Equation 2.
(2)
The trapezoidal method is used for numerical integration. By examining the Cp curve of the
airfoil in Figure 10, there is an indication of lift enhancement because the In-Phase data
encompasses a larger area. This upstream effect is due to increased circulation due to actuation
on the flap (Cerchie, Halfron et al. 2006). The ΔCL values of Configurations #1-3 of the Phase-
Delay Sweep Test are presented in Figures 11-13. In the following figures, the lift enhancement
due to device actuation is labeled as ‘Data’. Lift enhancement due to activation of A1 and A2
only is also presented. The effectiveness of each actuator is recorded at the beginning of the test
(subscript i) and the end of the test (subscript f). For Configuration #3, the plot shows the cases
where the actuators were also tested midway through the test, just after the 180° phase shift
(subscript m). This test was conducted on Configurations #1 and #2, but data revealed the same
trend; data is not presented in order to simplify plots.

26
Figure 11. Configuration #1 Phase Delay Test
Figure 12. Configuration #2 Phase Delay Test

27
Figure 13. Configuration #3 Phase Delay Test
Based on the calculated values of CL and the standard deviation based on forty samples
taken, the uncertainty/repeatability error associated with the lift coefficient for these experiments
is ± 0.002. The uncertainty is calculated using Equation 3 below.
(3)
where is the confidence interval at 95%, is the sample mean, is the standard
deviation for an experimental test quantity, and is the number of samples. There is an
additional, and potentially more relevant, error band associated with the lack of data due to the
coverage of pressure taps between x/c = 0.60 and x/c = 0.825. As a result, the lift that is
calculated is likely to be an underestimation of the actual lift because when flow is reattached, a
local suction peak occurs at the point of reattachment (Melton, Yao et al. 2004). A suction peak

28
correlates to a more negative Cp value at the location of attachment, and based on the calculation
of lift (Equation 2), a higher CL would result.
The results of the Configuration #1 Phase-Delay Sweep test greatly differ from those of
Configurations #2 and #3, see Figures 11-13. There is very little variation in lift enhancement in
relation to phase delay changes. Examining the independent actuator effects, A1 produces lift
enhancement on the same order as when both devices are activated; A2 does not produce lift
enhancement. Based on these results, it is postulated that A1 does not move the separation point
far enough downstream for A2 to further re-attach the flow. Lift enhancement is a result of A1
only.
In Figure 13, there is a clear bell curve shape to the data. The actuators have more lift
enhancement when they are in-phase at 0° and 360° than at other delays. The in-phase tests at 0°
and 360° were approximately 60 minutes apart, and the actuator control authority appears to
degrade of this timeframe. This is most obvious when comparing the 0° and 360° cases which
should provide identical results. It can also be seen by examining the singular actuator
performance at various portions of the run. The reduction in actuator effectiveness over time has
not been studied in detail, but it is expected based on literature (Greenblatt, Goksel et al. 2008).
Most importantly, this plot shows that combined actuators in-phase produce slightly greater lift
than any single actuator can produce. Actuators operating out-of-phase (roughly between 120°-
270°) have detrimental effects on lift when compared to the A2 only operating condition.
The results of Configuration #2 yield similar results to that of Configuration #3 yet with
slightly less control authority, see Figure 12. The bell curve re-enforces the result that the device
is more effective when operated in-phase, and when it is operated out-of-phase, it can be

29
detrimental to lift. This configuration is more detrimental to lift when out-of-phase as the device
is less effective than when each actuator is operated independently. Despite the similar results to
Configuration #3, this configuration produces less overall lift enhancement. The maximum lift
change from baseline is 0.08 while it is 0.12 for Configuration #3.
As introduced in Chapter 3, this airfoil is a simplified high-lift version of that used by
Melton et al. in NASA experiments (2004). The purpose of these experiments was to also
examine flow separation by means of AFC, but piezoelectric actuators in mechanical slots were
utilized as the means of actuation. The mechanisms on how the flow is influenced by
piezoelectric differ from those of the DBD actuator. Melton examined the effect that a phase
delay between the two actuators would have when actuators are located near the hinge of the
trailing edge flap. Parameters of Melton’s work are similar to those of this experiment: low
frequency excitation modulation, Re=240,000, and a flap deflection of 20°. However, the airfoil
of Melton’s experiment had a chord length of 406.4 mm (16 in), and the actuators, while near the
trailing edge hinge, were located at x/c = 0.73 and x/c = 0.757. The airfoil used by Melton et al.
is also equipped with a leading edge droop (2004) and results were published at 6° and 12° angle
of attack. Despite the different methods, the results of Melton’s experiments show similar trends
as the results for the phase delay tests conducted in this experiment. Melton found the actuators
were slightly more effective when operated near in-phase (within 30° of in-phase) (2004). The
effect of the actuators in enhancing lift disintegrated as the angle of attack increased from 6° to
12°. This is attributed to that as the angle of attack increases, the flow separation occurs further
upstream and the actuators lose their effect on delaying flow separation over the flap.
Due to a physical separation of the actuators, some finite period of time exists for the
perturbation wave that is created by A1 to reach A2. Using the superposition principle, if the

30
perturbation wave created by A2 is created in-phase with that of the perturbation created by A1,
the effect of the flow disruption would increase. Based on the results of Figure 13 in conjunction
with the work of Melton, the phase-delay is near zero, but a resolution of 30˚ may be too large to
identify this optimal phase delay. Similarly, the most detrimental phase delay to lift is not likely
to be exactly 180˚, but very near it.
The optimal phase difference for Melton’s study is estimated using F+, the modulation
frequency, the physical separation of the actuators and the convective velocity. By definition,
the velocity of the waveform generated by the actuator is equal to the product of the frequency
and the wavelength, see Equation 4. The convective velocity in the shear layer is estimated at
60% of the freestream, and the frequency of the perturbation is the modulating frequency. The
resulting value of lambda (x/c = 0.3) compares favorably with PIV data. The wavelength of the
perturbation is then compared to the physical separation of the actuators, see Equation 5. This is
then correlated to a phase separation. In the case of Melton, it is found to be ~30°.
(4)
(5)
where is the convective velocity, is the low frequency modulation and is the
wavelength of the perturbation; is the physical separation between the actuators, is the
proportional constant of the wavelengths. Applying this theory to the data collected in this
experiment leads to an optimal phase delay of ~120°. This is clearly not in agreement with the
collected data. This leads to examining how the variables are defined, in particular the
separation between actuators. In the case of Melton work, the actuators are physical and distinct

31
slots and are the source perturbations. With plasma actuators, the exact location of perturbations
is not as clear being as the plasma extends over the ground electrode (Forte, Jolibois et al. 2006).
Additionally, the angle at which the perturbation is introduced to the flow will have some effect.
In Melton et al., the slots have a fixed orientation relative to the surface of the airfoil (2004), and
this likely has an effect on how the perturbation wave is introduced to the shear layer and how it
propagates and interacts with the downstream actuator. Additionally, the effect of the carrier
frequency was not emphasized in calculating the optimum phase delay.
The results of the second test, the modulated frequency sweep for Configurations #1-3,
are presented in Figures 14-16. The results of Configuration #1 (A2 modulated), Figure 14,
show little change in lift enhancement across all modulated frequencies further indicating that
A2 does not have an effect on flow control. Despite A1 being upstream from the optimal
location, Configuration #3, Figure 16, produced the most lift enhancement at the same modulated
frequency of 120 Hz. There are small local peaks at 240Hz and 360 Hz, both of which are
harmonics of 120 Hz. As with the Phase Delay Sweep Test, the results of Configuration #2 for
the Frequency Sweep Test reveal a similar trend to that of Configuration #3, see Figure 15.
There is a clear peak at a modulated frequency of 120 Hz, but the harmonics are less distinct.
The overall lift generated is less than Configuration #3, which is in agreement from the Phase
Delay Sweep Test.

32
Figure 14. Configuration #1 Frequency Sweep Test
Figure 15. Configuration #2 Frequency Sweep Test

33
Figure 16. Configuration #3 Frequency Sweep Test
The third and final test conducted is one in which the steady actuation (i.e. no
modulation) was examined. Based on previous work, an actuator located at x/c= 0.775 was able
to slightly delay flow separation when operated with unsteady actuation (Little, Nishihara et al.
2008; Little, Nishihara et al. 2009). The purpose of this test is to examine the hypothesis that if
the actuator at the non-optimal location can partially delay separation, then the effects of
delaying the flow separation can be further enhanced by the actuator located at/near the optimal
location. The lift results are presented in Figures 17 and 18 for the various cases, and a reference
of the maximum lift produced in the Phase Delay Sweep Test with the device at a dc of 50% and
0° phase shift is included. This test was not performed on Configuration #1 due to device
failure, and it was deemed unnecessary to re-conduct the tests based on results from the Phase
Delay Sweep and Frequency Sweep Test. In Configurations #2 and #3, the actuator located at
the optimal location produced more lift when operated in unsteady conditions. Despite the

34
location of the actuators, lift is enhanced most when both actuators are operated in an unsteady
fashion.
Figure 17. Configuration #2 Steady/Unsteady Actuation
Figure 18. Configuration #3 Steady/Unsteady Actuation

35
Based on the results of the first experiment, which examined the parameters of phase
delay between actuators, modulation frequency and steadiness of actuation, the most effective
device configuration can be determined. One of the actuators should be located at the optimal
location (x/c = 0.775) based on a greater lift enhancement produced by Configuration #3 (A2
located at x/c = 0.775) relative to Configuration #2 (actuators straddled the flap). The other
actuator should be located upstream based on the lack of effectiveness of the second actuator in
Configuration #1 (x/c = 0.875) when compared to Configuration #3 (x/c = 0.675). The results
are summarized in Table 2; the optimal configuration is highlighted for emphasis.
Table 2. Configuration Experiment Results
4.2 PIV Experiment
A PIV experiment was conducted on Configuration #3 in order to characterize the flow velocity
and flow structure in a time-averaged and phased-averaged sense for the following cases: In-
Phase operation, Out-of-Phase operation, A2 only, A1 only and BL. The carrier frequency of
2000 Hz was modulated at 120 Hz with unsteady actuation (dc of 50%). Since the experiment
took place in a small time frame (within 3 hours), the overall lift, CL, is reported, not ΔCL as was
reported in the pressure tests. The pressure coefficients, Cp, and the lift coefficient, CL, are
presented in Figure 19. Trends remain the same as the pressure tests further confirming that in-
Actuator 1 Location
x/c
Actuator 2 Location
x/c
Phase
Delay
Modulated
FrequencyDuty Cycle
Maximum Lift
Enhancement
(ΔCL)
Configuration #1 0.775 0.875 180° 120 Hz N/A 0.1125
Configuration #2 0.725 0.825 0° 120 Hz 50% 0.0794
Configuration #3 0.675 0.775 0° 120 Hz 50% 0.1200

36
phase operation has more lift enhancement than out-of-phase and A2 has more affect on lift than
A1.
Figure 19. Cp Curve with Reported CL
Time-averaged data allows for the overall trends of the flow to become apparent and
should correlate with the measurements of Figure 19. The phase-averaged data is synced to
collect data at four phases over the modulation cycle. The phases are synced with A2 except in
the A1 Only case. The phases are synced with A2 because this actuator is located at the
optimum location. When examining the time-averaged data, the vorticity figures give an insight
as to where the flow is separating on the flap and how the flow turns over the shoulder. The
results are presented for the cases in Figure 20.

37
Figure 20. Time-Averaged Vorticity
Comparing the four controlled cases to the BL case, there are some clear conclusions.
A1 Only, 20d, case delays flow separation the least as the shear layer is not brought back
towards the flap as much as in the other cases. The Out-of-Phase, 20b, case does not exhibit the
38
degree of reattachment that can be found in the In-Phase, 20a, and A2 Only, 20c, cases. The In-
Phase and A2 Only cases move the point of flow separation further down the flap relative to the
BL. Beyond this, it is difficult to distinguish the differences between the two cases.
The shear layer development over the flap for these tests is similar to those as reported by
Melton et al. (2004). Melton showed that the in-phase and downstream actuator only produced a
vorticity with very similar shapes. The shear layer is pulled closer to the flap than in the
baseline, the upstream actuator only, and the out-of-phase cases. It is unclear as to if the flow
separation point moved further downstream with actuation for the cases tested by Melton (2004).
As the shear layers between the In-Phase and A2 cases are difficult to differentiate, the
phase-averaged flow structures for 90° and 270° are presented in Figure 21. Additionally, the
Out-of-Phase case, the least effective control, is presented.

39
Figure 21. Phase-Average Vorticity
Comparing the In-Phase (most effective), 21a, and Out-of-Phase (least effective), 21b,
the shedding structure at 90° exhibits a stronger rotation and is released further down the flap.
Examining the 270° phase, the vorticity of the In-Phase, 21a, case better follows the curve of the
40
flap and the vortex that is shed from the pressure side is of a greater magnitude, smaller in size,
and is drawn closer to the flap.
Upon examination of the phase-averaged vorticity of the In-Phase, 21a, and A2 Only,
21c, cases, there is no substantial difference in flow structure formation between the two cases.
However, based on Figure 19, there is an influence from A1 that differentiates the flow in the
two cases because the In-Phase produced more lift than the A2 which can be seen at the leading
edge. If we refer to flow around airfoils with a blunt trailing edge, very slight turning of the flow
generates an increase in circulation that has an effect all the way up to the LE even in the
absence of separation (Cerchie, Halfron et al. 2006). Based on a higher peak in LE in Cp curve
in Figure 19, there is greater circulation in In-Phase case when compared to A2 Only, so the flow
follows the flap curvature slightly more for the In-Phase case.
Another means of comparison is to examine the wake profile downstream of the end of
the flap. After examining profiles at distinct x/c locations, x/c=1.1 was the closest location to the
flap that shows differentiation between the vorticity of In-Phase and A2 Only. The wake profile
for all cases is shown in Figure 22, and a closer examination of the In-Phase and A2 Only cases
is show in Figure 23. The absolute value of the vorticity is reported. Recall that shedding
vorticity from the suction side is negative and shedding vorticity from the underside of the flap is
positive.

41
Figure 22. Wake Profile
The wake profile downstream of the flap magnifies the affect that the actuators have on
the flow. In all cases, the magnitude of the shedding vorticity has decreased up to 50% that of
BL. Additionally, the flow structures are pulled closer to the flap indicated by the decreasing
separation of peaks relative to y/c.

42
Figure 23. Wake Profile of In-Phase and A2 Only cases
A closer examination of the In-Phase and A2 Only cases show that the flow structures are
pulled closer to the flap to approximately the same degree. The vortex shedding from the
underside of the flap in the In-Phase has a smaller magnitude than that of the A2 Only.

43
CHAPTER 5: Conclusions and Future Work
Dielectric Barrier Discharge plasma actuators have been used to actively control flow over high-
lift airfoils and have been shown to increase control authority by augmenting lift and delaying
separation of flow over the shoulder of a simple deflected flap. This study was an exploration in
the effectiveness of multiple DBD plasma actuators on a simplified NASA EET high-lift airfoil
when operated at Re=240,000, 20° flap deflection and 0° angle of attack. Previous work of Little
has shown that a single actuator at x/c=0.775 is capable of slightly delaying flow separation
(2010).
The location of the actuators has an effect on the degree of lift enhancement and flow
control. It was found that the most effective configuration incorporated an actuator at the
optimal location as determined by Little (2008) with a second actuator located upstream at
x/c=0.675. The actuators were operated with unsteady actuation (BM), which reduces power
requirements and resulted in higher lift than steady actuation. Experimental results suggest that
the actuators be operated in-phase with each other, but theoretically, there should be some phase
delay due to physical separation. When the device was operated in-phase, the flow still
separated on the flap, but the shear layer was pulled closer to the flap when compared to a
baseline case (uncontrolled). The wake of the in-phase multiple actuator is very similar to that of
just a single actuator located at x/c=0.775, but there is a larger suction peak at the leading edge
for the in-phase actuation. This suction peak is a result of increased circulation around the airfoil
and more flow turning over the flap shoulder which indicates an increase in control authority.
Based on this result, minimal effects at the trailing edge can have a larger effect on the lift of the
airfoil due to increased circulation.

44
Experiments were limited due to the size, strength and instrumentation of the airfoil. A
larger airfoil would be advantageous to better understanding the effects of separation distance
has on actuators. A larger airfoil would scale down the required separation distance between
actuators relative to the chord length of the airfoil. A more robust airfoil would permit higher
speed tests that better simulate lift-off conditions. The current airfoil incorporates static pressure
taps for measurements, but taps located between x/c=0.6 and x/c=0.825 were covered by the
actuators. As a result, the lift reported is an underestimation because actuation increases the
attachment of the flow and increases suction peaks along the trailing edge flap (Melton, Yao et
al. 2004). The use of hot-film sensors would allow for detection of flow separation in this area,
and they would not disrupt plasma generation (Poggie, Tilmann et al. 2010). The actuators could
be optimized such that the electrodes and dielectric layer are more capable of operating under a
higher voltage input (Thomas, Corke et al. 2009).

45
REFERENCES Cerchie, D., E. Halfron, et al. (2006). Some Circulation and Separation Control Experiments. Applications of Circulation Control Technology. R. Joslin and G. Jones. Reston, VA, AIAA Inc. 214: 113‐165. Corke, T., M. Post, et al. (2007). "SDBD plasma enhanced aerodynamics: concepts, optimization and applications." Progress in Aerospace Sciences 43(8): 193‐217. Dabiri, D. (2009). "Digital Particle Image Thermometry/Velocimetry: A Review." Experiments in Fluids 46(2): 191‐241. Do, H., W. Kim, et al. (2008). "Cross‐talk in multiple dielectric barrier discharge actuators." Applied Physics Letters 92(7): 071504‐071504‐071503. Enloe, C. L., T. E. McLaughlin, et al. (2004). "Mechanisms and Responses of a Single Dielectric Barrier Plasma Actuator: Geometric Effects." AIAA Journal 42(3): 595‐604. Forte, M., J. Jolibois, et al. (2006). "Optimization of a Dielectric Barrier Discharge Actuator by Stationary and Non‐stationary Measurements of the Induced Flow Velocity ‐ Application to." 3rd AIAA Flow Control 2006‐2863: 10. Ganapathisubramani, B., N. T. Clemens, et al. (2006). "Large‐Scale Motions in a Supersonic Turbulent Boundary Layer." Journal of Fluid Mechanics 556: 271‐282. Greenblatt, D., B. Goksel, et al. (2008). "Dielectric Barrier Discharge Flow Control at Very Low Flight Reynolds Numbers." AIAA Journal 46(6): 1528‐1541. Greenblatt, D. and I. J. Wygnanski (2000). "The control of flow separation by periodic excitation." Progress in Aerospace Sciences 36(7): 487‐545. Huang, J., T. C. Corke, et al. (2006). "Unsteady Plasma Actuators for Separation Control of Low‐Pressure Turbine Blades." AIAA Journal 44(7): 1477‐1487. Kiedaisch, J., H. Nagib, et al. (2006). Active Flow Control Applied to High‐Lift Airfoils Utilizing Simple Flaps. AIAA 3rd Flow Control Conference. AIAA Paper. Little, J. (2010). "High‐Lift Airfoil Separation Control with Dielectric Barrier Discharge Plasma Actuators Dissertation." Little, J., M. Nishihara, et al. (2008). Separation Control from the Flap of a High‐Lift Airfoil using DBD Plasma Actuation. AIAA 4th Flow Control Conference. AIAA Paper: 19. Little, J., M. Nishihara, et al. (2009). Separation Control from the Flap of a High‐Lift Airfoil using DBD Plasma Actuators. AIAA 47th Aerospace Sciences Meeting. AIAA Paper: 17. Mabe, J., F. Calkins, et al. (2009). "Single Dielectric Barrier Discharge Plasma Actuators for Improved Airfoi Performance." Journal of Aircraft 46(3): 847‐855.

46
Mabe, J. H., F. T. Calkins, et al. (2007). "On the Use of Single Dielectric Barrier Discharge Plasma Actuators for Improving the Performance of Airfoils." 37th AIAA 2007‐3972: 17. Melton, L. P., N. W. Schaeffler, et al. (2007). "High‐Lift System for a Supercritical Airfoil: Simplified by Active Flow Control." 45th AIAA 2007‐707: 20. Melton, L. P., C.‐S. Yao, et al. (2006). "Active Control of Separation from the Flap of a Supercritical Airfoil." AIAA Journal 44(1): 34‐41. Melton, L. P., C. S. Yao, et al. (2004). "Application of Excitation from Multiple Locations on a Simplified High‐Lift System." AIAA 2004‐2324: 14. Poggie, J., C. Tilmann, et al. (2010). Closed‐Loop Stall Control on a Morphing Airfoil Using Hot‐Film Sensors and DBD Actuators. AIAA 48th Aerospace Sciences Meeting. AIAA Paper: 1‐19. Seifert, A., A. Darabi, et al. (1996). "Delay of Airfoil Stall by Periodic Excitation." Journal of Aircraft 33(4): 691‐698. Thomas, F., T. Corke, et al. (2009). "Optimization of Dielectric Barrier Discharge Plasma Actuators for Active Aerodynamic Flow Control." AIAA Journal 47(9): 2169‐2178.