control number 09-0311 - us department of energy 2. aerial photographic map of the cnta site..... 3...
TRANSCRIPT

DOE-LM/1612 Task Order LM00-502
Control Number 09-0311 December 19, 2008 U. S. Department of Energy Office of Legacy Management ATTN: Mark Kautsky Site Manager 2597 B ¾ Road Grand Junction, CO 81503 SUBJECT: Contract No. DE-AM01-07LM00060, S. M. Stoller Seismic Survey Report for Central Nevada Test Area, Subsurface, Correction Action Unit 443, Revision 1 REFERENCE: LM-502-07-613-101, Central Nevada Test Area, Nevada Dear Mr. Kautsky: This letter report summarizes the results of a seismic survey performed by Boise State University (BSU) at the Central Nevada Test Area (CNTA), Nevada. BSU performed the seismic survey in two phases: an initial feasibility test and a final seismic reflection survey. The seismic data were acquired to support scheduled drilling activities associated with subsurface Corrective Action Unit (CAU) 443 at CNTA. The U.S. Department of Energy (DOE) Office of Legacy Management (LM) funded the investigation. A copy of the BSU seismic survey report is provided as Attachment I. A copy of the Nevada Division of Environmental Protection (NDEP) comments dated July 21, 2008 and DOE-LM responses to comments are provided as Attachment II. Background and Objective The corrective action strategy associated with subsurface CAU 443 has recently been revised and is documented in the Addendum to the Corrective Action Decision Document/Corrective Action Plan (CADD/CAP) dated January 2008. The new strategy includes enhancement of the monitoring network and a new proof-of-concept monitoring period seeking to validate the compliance boundary at CNTA. To enhance the monitoring of the alluvial aquifer, two new alluvial wells will be installed at CNTA (CADD/CAP addendum 2008). The alluvium is not currently monitored except for head levels in the upper piezometers of wells MV-1, MV-2, MV-3 (Figure 1). Head levels at these locations (two piezometers and a well at each) indicate that the most likely potential transport direction from the cavity is down, toward densely welded tuff units below the detonation zone. The current network is designed to monitor this potential transport pathway. However, given the processes of prompt injection and convective mixing in the nuclear chimney, migration into the alluvial aquifer cannot be ruled out. Alluvial wells are

Mark Kautsky Control Number 09-0311 Page 2
typically more productive than those in the deeper volcanic section, making the alluvial aquifer the most likely source for future groundwater development and therefore the most likely access path to potential receptors. The interpreted horizontal flow direction in the alluvium is generally from the northwest to the southeast, following the slope of the topography from Hot Creek Range to Moores Station Wash in Hot Creek Valley. The new wells are being positioned to not only monitor the potential southeastward migration of contaminants from the site in the alluvium, but to also determine if the graben faults act as barriers or conduits for groundwater flow. The wells (designed as dual completions) are being positioned with respect to the southeast-bounding graben fault (northwest-dipping) to allow a piezometer to be placed in the shallow, saturated section of the alluvium (downthrown block) and a well to be placed in lower alluvium (upthrown block). The following section provides a brief summary of the results. Data Acquisition and Results An initial feasibility test was conducted in May 2007 to determine the suitability of obtaining seismic reflection data at CNTA. A more comprehensive seismic reflection survey was designed using parameters obtained from the feasibility test and was conducted in October 2007. The purpose of the seismic reflection survey was to image the subsurface orientation of the graben faults and better position the new wells and accompanying piezometers. The 7.8 mile (12.5-km) survey consists of five vibroseis seismic profiles. The lines pass near six deep wells with geophysical and lithologic logs that tie the seismic and well data. The results were better than expected, in that a strong set of reflectors are able to image the water table. The water table reflector (and the horizontal flow component in the shallow alluvium) generally slopes to the southeast as expected. Additionally, the water table reflector is offset upwards of 40 m by faults, both those associated with the surface expression of the drop-down graben block and others not previously recognized that do not reach the surface. This indicates that the faults apparently act as barriers to groundwater flow even in the unconsolidated alluvial deposits. The location of the faults on the seismic lines below the water table is subject to interpretation and only slightly improves the location of the well/piezometer pairs with respect to the fault. However, the precise location of the wells is not as critical because the influence of the faults on groundwater flow is apparent with the seismic data. Conclusion and Recommendations The seismic survey was successful in imaging the water table and underlying structures at the site. The configuration of the water table reflector confirms the general southeast horizontal flow direction in the alluvial aquifer. Offsets in the water table reflector, both at known faults that reach the surface and at subsurface faults not previously recognized, indicate that both extension and blast-related faults are barriers to lateral groundwater flow. The results from this study have been used to optimally locate two new wells designed to monitor head levels and possible contaminant migration in the alluvial aquifer at CTNA. Refer to Figure 1 for the planned locations of the alluvial wells.

This page intentionally left blank

Figure 1. CNTA Site Map

This page intentionally left blank
Attachment I
Boise State University Seismic Survey Report

This page intentionally left blank
Attachment I
Vibroseis Seismic Reflection Imaging at the Central Nevada
Test Area
Report Prepared for S.M. Stoller Corp. Contact: Rex Hodges
2597 B ¾ Rd Grand Junction, CO 81503
(970) 248-6714
Lee M. Liberty
Center for Geophysical Investigation of the Shallow Subsurface (CGISS) Department of Geosciences
Boise State University Boise, Idaho 83725-1536
Technical Report BSU CGISS 08-02 Boise State University Department ID# 693G106235
U.S. Department of Energy Office of Legacy Management Contract No. DE-AM01-07LM00060
01 March 2008

This page intentionally left blank
i
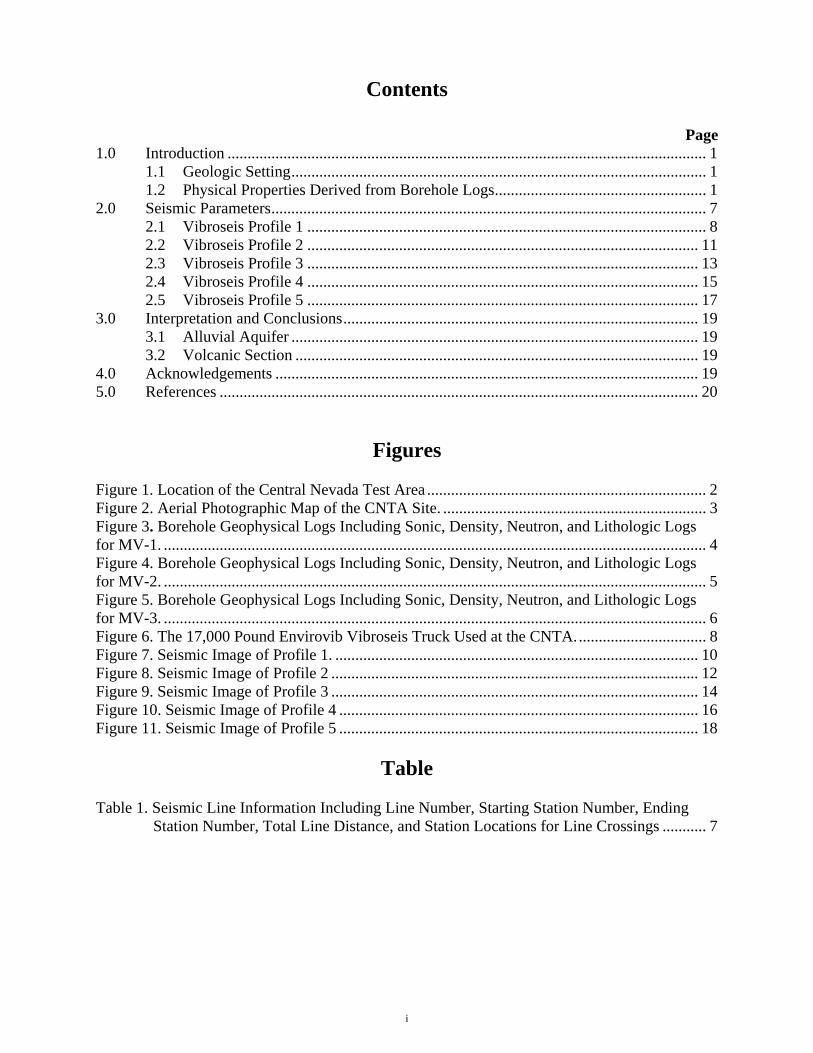
Contents
Page 1.0 Introduction ........................................................................................................................ 1
1.1 Geologic Setting........................................................................................................ 1 1.2 Physical Properties Derived from Borehole Logs..................................................... 1
2.0 Seismic Parameters............................................................................................................. 7 2.1 Vibroseis Profile 1 .................................................................................................... 8 2.2 Vibroseis Profile 2 .................................................................................................. 11 2.3 Vibroseis Profile 3 .................................................................................................. 13 2.4 Vibroseis Profile 4 .................................................................................................. 15 2.5 Vibroseis Profile 5 .................................................................................................. 17
3.0 Interpretation and Conclusions......................................................................................... 19 3.1 Alluvial Aquifer ...................................................................................................... 19 3.2 Volcanic Section ..................................................................................................... 19
4.0 Acknowledgements .......................................................................................................... 19 5.0 References ........................................................................................................................ 20
Figures Figure 1. Location of the Central Nevada Test Area ...................................................................... 2 Figure 2. Aerial Photographic Map of the CNTA Site. .................................................................. 3 Figure 3. Borehole Geophysical Logs Including Sonic, Density, Neutron, and Lithologic Logs for MV-1. ........................................................................................................................................ 4 Figure 4. Borehole Geophysical Logs Including Sonic, Density, Neutron, and Lithologic Logs for MV-2. ........................................................................................................................................ 5 Figure 5. Borehole Geophysical Logs Including Sonic, Density, Neutron, and Lithologic Logs for MV-3. ........................................................................................................................................ 6 Figure 6. The 17,000 Pound Envirovib Vibroseis Truck Used at the CNTA................................. 8 Figure 7. Seismic Image of Profile 1. ........................................................................................... 10 Figure 8. Seismic Image of Profile 2 ............................................................................................ 12 Figure 9. Seismic Image of Profile 3 ............................................................................................ 14 Figure 10. Seismic Image of Profile 4 .......................................................................................... 16 Figure 11. Seismic Image of Profile 5 .......................................................................................... 18
Table Table 1. Seismic Line Information Including Line Number, Starting Station Number, Ending
Station Number, Total Line Distance, and Station Locations for Line Crossings ........... 7

ii
This page intentionally left blank

1
1.0 Introduction
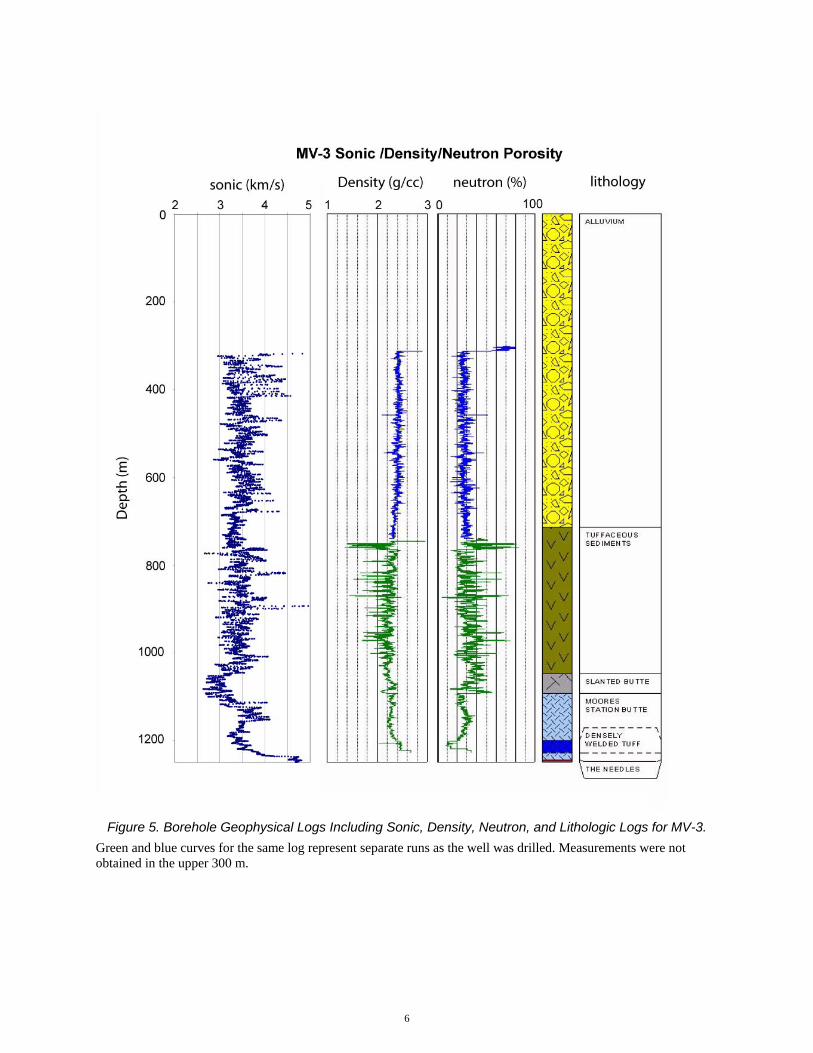
This report presents the results of vibroseis seismic reflection imaging conducted at the Central Nevada Test Area (CNTA) in Hot Creek Valley, central Nevada. The fieldwork was conducted in October 2007. The purpose of the study was to optimize the locations of two proposed monitoring wells that will be used to monitor groundwater elevations and potential migration of radionuclides in the alluvial aquifer. In 1968 the U.S. Atomic Energy Commission, now the U.S. Department of Energy, detonated a 200 to 1,000 kiloton nuclear device at a depth of 3,200 feet (ft) (975 meters [m]) below land surface (elevation of 2,900 ft (825 m) above mean sea level) in the CNTA. A roughly 0.75 square mile (2 square kilometer [km]) normal fault-bounded graben formed at the surface as a result of the event (McKeown and Dickey 1969; U.S. Department of Energy 1998). Much of the displacement was along existing faults, many with Holocene displacement (McKeown and Dickey 1969). 1.1 Geologic Setting The CNTA is located in the 125-mile (200-km)-long Hot Creek Valley, part of the Basin and Range physiographic province of central Nevada (Figure 1). Mountain ranges adjacent to the CNTA contain large volumes of extension-related Tertiary volcanic rocks overlying Paleozoic marine strata (Ekren et al. 1973). The actively extending valleys (approximately 3 millimeters per year) contain basins filled with large volumes of alluvial and fluvial deposits shed from the adjacent ranges (Thatcher et al. 1999). The fault-bounded basins surrounding Hot Creek Valley contain range-derived sediments more than 1 km in thickness overlying 10 mega-annum (Ma) and older volcanic rocks (Ekren et al. 1973; Liberty et al. 1994; U.S. Department of Energy 1998). 1.2 Physical Properties Derived from Borehole Logs Logs from a series of pre- and post-blast boreholes describe both the lithologic and geophysical properties to depths that exceed 3,280 ft (1 km) at the CNTA (Figure 2). These logs show water table depths that range from 256 to 751 ft (78 to 229 m) below land surface and unconsolidated alluvium to depths greater than 2,625 ft (800 m). Sonic logs obtained from the monitoring/validation (MV) wells installed in 2005 show seismic velocities of approximately 2,500 meters per second (m/s) at water table depths, increasing at approximately 1.5 (m/s)/m to more than 3,200 m/s at the depth of volcanic tuffs (Figures 3, 4, and 5). Density measurements at equivalent depths range from 2.2 to 2.4 grams per cubic centimeter, which is consistent with semiconsolidated, coarse-grained deposits. The velocity and density increases likely result from compaction of alluvial-fan-derived sediments. Below the alluvium, tuffaceous sediments appear to depths greater than 0.75 mile (1.2 km) below land surface. Small changes in physical properties measured in boreholes suggest that the boundary between alluvial fan deposits (mostly derived from tuffs of the Hot Creek Range) and the tuffaceous sediments is gradational and subject to interpretation. Underlying the tuffaceous sediments are semiwelded and welded tuffs that are mostly 30 Ma and older. Again, geophysical log measurements suggest strong similarities between the tuffaceous sediments and welded tuffs, but the thin-bedded welded tuffs show a sharp increase in seismic velocity, density, and resistivity. Volcanic rocks extend more than 1.2 miles (2 km) below land surface and below Hot Creek Valley (Ekren et al. 1973).

2
Figure 1. Location of the Central Nevada Test Area
A southeast-directed regional groundwater flow direction is derived from regional surface and borehole measurements (from Prudic et al. 1995). Inset map shows site location in central Nevada.

Figure 2. Aerial Photographic Map of the CNTA Site. Seismic profile lines are shown as orange lines, and scarps are shown as black lines. Green circles represent seismic profile positions that cross the scarps. Larger red dots show tie locations of crossing lines or line ends, small red dots are at 100 shot point intervals. Local topography and surface water flow is to the east-southeast, and surface water flow is to the south down the axis of Hot Creek Valley.
3

4
Figure 3. Borehole Geophysical Logs Including Sonic, Density, Neutron, and Lithologic Logs for MV-1.
Note the general increase in P-wave velocity and density with depth within the alluvium due to compaction. Also note the sharp increase in physical properties where densely welded tuffs are identified. Red, green, and blue curves for the same log represent separate runs as the well was drilled.

5
Figure 4. Borehole Geophysical Logs Including Sonic, Density, Neutron, and Lithologic Logs for MV-2. Red, green, and blue curves for the same log represent separate runs as the well was drilled.
6
Figure 5. Borehole Geophysical Logs Including Sonic, Density, Neutron, and Lithologic Logs for MV-3.
Green and blue curves for the same log represent separate runs as the well was drilled. Measurements were not obtained in the upper 300 m.

7
2.0 Seismic Parameters
Seismic reflection data were obtained at CNTA using a 17,000 pound IVI Minivib vibroseis truck (Figure 6). The data were acquired with a 16.4-ft (5-m) source and receiver spacing along existing roads within the CNTA (Figure 2). Profile details are summarized in Table 1, where position values represent the distance (in 5 m station increments) from the profile start. Uncorrelated, off-end, 20 to 160 hertz (Hz) sweeps were recorded for 10 seconds with a 120 channel Geometrics RX seismograph. The strata in the upper 0.62 mile (1 km) were imaged using 10 Hz geophones at offsets up to 1,969 ft (600 m). Most geophones were placed along the south and west road shoulders, and the vibroseis source positions were located on the roads approximately 8.2 ft (2.5 m) from each geophone. Shot positions were located between geophone locations.
Table 1. Seismic Line Information Including Line Number, Starting Station Number, Ending Station Number, Total Line Distance, and Station Locations for Line Crossings
Line No.
Start Station
End Station
Distance (km) Line 1 Line 2 Line 3 Line 4 Line 5
Line 1 1001 1552 2.75 – 1455/2434 1292/3306 1247/4426 – Line 2 2001 2531 2.65 1455/2434 – 2171/3171 2248/4468 2306/5055 Line 3 3171 3530 1.8 1292/3306 2171/3171 – 3252/4456 3275/5001 Line 4 4001 4840 4.20 1247/4426 2248/4468 3252/4456 – – Line 5 5001 5224 1.12 – 2306/5055 3275/5001 – – Total – – 12.5 – – – – –
The steps for processing the data included vibroseis correlation, velocity analysis, band pass filters, mutes, static corrections, and post-stack migration (e.g., Yilmaz 1987). The seismic wavefield from the origin to travel times less than the air wave direct arrival (<330 m/s) were removed because of the strong ground roll and air wave energy that overwhelmed the seismic reflection energy. Because of the high velocity of the reflections below the water table, this data mute significantly improved the quality of the stacked sections (Figures 7 through 11). Each profile was migrated using a post-stack Kirchoff time migration that places the reflectors from their imaging points to the proper spatial and temporal positions. Seismic sections were converted to depth using average velocity values obtained from refracted head wave, stacking velocity values, and borehole geophysical logs obtained from the MV wells (Figures 3, 4, and 5). Internal seismic velocities above the water table (~upper 328 ft [100 m]) range from 500 to 800 m/s, which is consistent with unsaturated, coarse-grained alluvial sediments. Seismic velocities increase from ~2,500 m/s immediately below the water table to >3,500 m/s at depths approaching 1 km (Figures 3, 4, and 5). It is important to recognize that vibroseis acquisition produces a zero-phase wavelet, implying that reflecting boundaries often appear not as a single reflector, but as a set of peaks and troughs centered about the peak central arrival. The surface and water table elevations, surface scarp locations, (projected) wells, and crossing profile locations are shown in Figures 7 through 11. Below the elevation profiles, unmigrated travel time and migrated, depth-converted and interpreted seismic sections for the seismic profiles are shown. The sections are all corrected to a 6,234 ft (1,900 m) datum to tie each profile and nearby well log information.
8
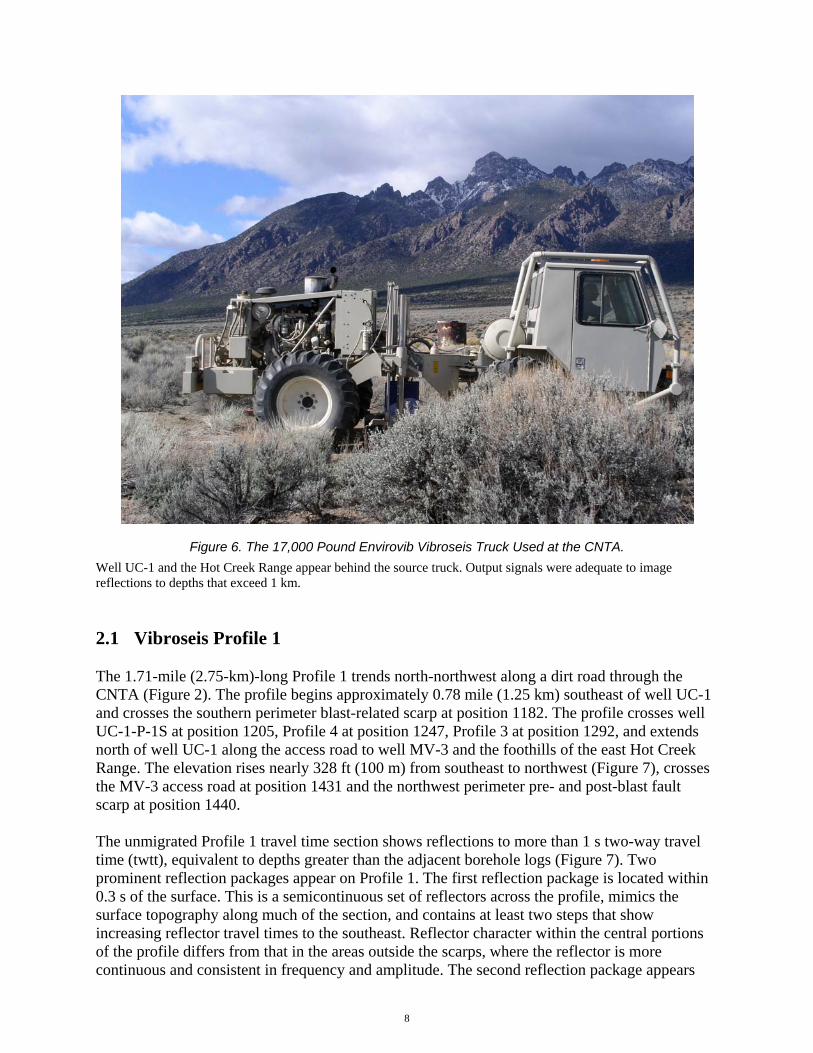
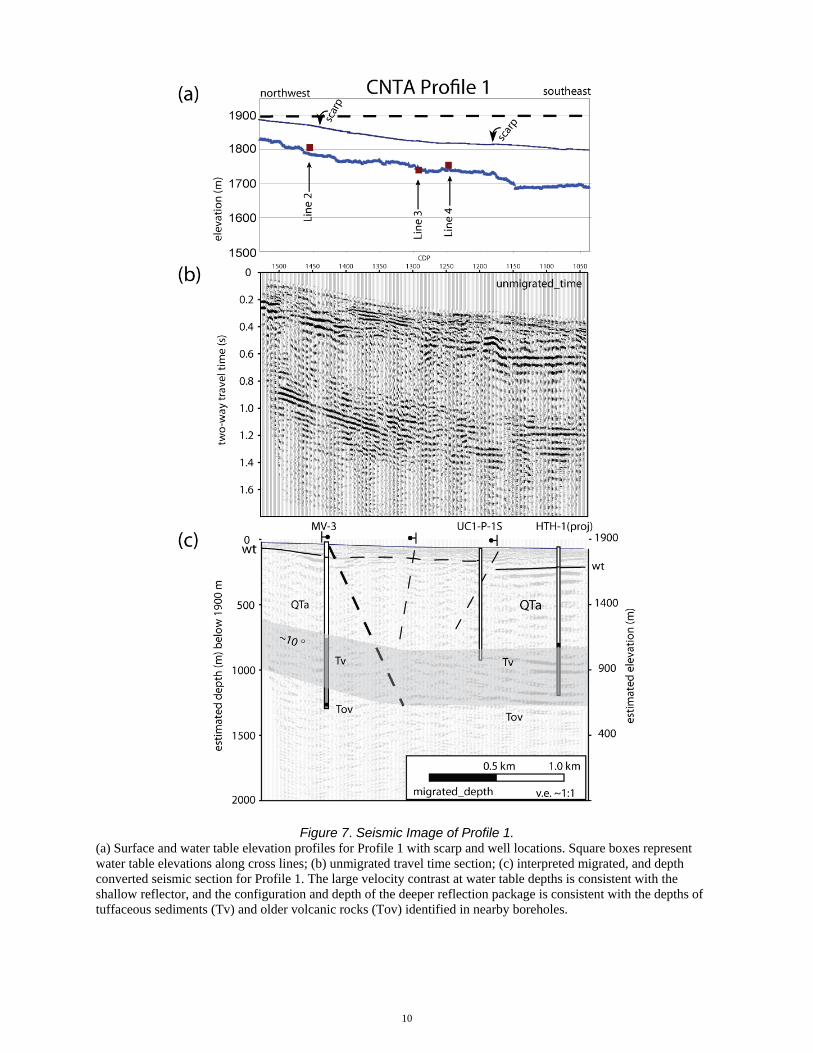
Figure 6. The 17,000 Pound Envirovib Vibroseis Truck Used at the CNTA. Well UC-1 and the Hot Creek Range appear behind the source truck. Output signals were adequate to image reflections to depths that exceed 1 km. 2.1 Vibroseis Profile 1 The 1.71-mile (2.75-km)-long Profile 1 trends north-northwest along a dirt road through the CNTA (Figure 2). The profile begins approximately 0.78 mile (1.25 km) southeast of well UC-1 and crosses the southern perimeter blast-related scarp at position 1182. The profile crosses well UC-1-P-1S at position 1205, Profile 4 at position 1247, Profile 3 at position 1292, and extends north of well UC-1 along the access road to well MV-3 and the foothills of the east Hot Creek Range. The elevation rises nearly 328 ft (100 m) from southeast to northwest (Figure 7), crosses the MV-3 access road at position 1431 and the northwest perimeter pre- and post-blast fault scarp at position 1440. The unmigrated Profile 1 travel time section shows reflections to more than 1 s two-way travel time (twtt), equivalent to depths greater than the adjacent borehole logs (Figure 7). Two prominent reflection packages appear on Profile 1. The first reflection package is located within 0.3 s of the surface. This is a semicontinuous set of reflectors across the profile, mimics the surface topography along much of the section, and contains at least two steps that show increasing reflector travel times to the southeast. Reflector character within the central portions of the profile differs from that in the areas outside the scarps, where the reflector is more continuous and consistent in frequency and amplitude. The second reflection package appears
9
between 0.8 and 1.4 s twtt, dips to the southeast along the northwest portions of the profile, and is nearly flat-lying along the southeastern half of the profile. The semicontinuous reflector that mimics surface topography on Profile 1 is consistent in velocity, depth, and character to the water table (Figure 7). The seismic velocity contrast from 500 to 800 m/s to more than 2,500 m/s suggests that more than one-half the p-wave seismic energy is reflected back toward the surface at this boundary, and the strength of the reflector is consistent with this velocity contrast. The water table reflector is flat-lying along the southeast portion of the profile and dips moderately to the southeast along the bulk of the profile. The change in reflection character in the central portions of the profile is consistent with an area within the blast zone that may offset layers within the alluvium and influence local groundwater elevations. The largest steps in the water table reflector appear near the blast-related scarps. This suggests that the faults are probably barriers to lateral fluid flow. The deeper reflection package likely represents the transition from alluvium to tuffaceous sediments and from tuffaceous sediments to welded tuffs that are interpreted in CNTA well logs (Figure 7). The uppermost reflector associated with the higher-amplitude continuous reflectors crosses the (projected) MV-3 well at an estimated depth of 2,297 ft (700 m) with (apparent) dips to the southeast of approximately 10 degrees. Within the MV-3 well log, the base of the alluvium is interpreted at a depth of 2,297 ft (700 m), consistent with the change in reflection character. Reflectors along the southeast half of the profile are essentially flat-lying. Along the southeast portions of the profile, projected well HTH-1 shows welded tuffs at a depth of 2,398 ft (731 m), consistent with a high-amplitude reflector.
10
Figure 7. Seismic Image of Profile 1. (a) Surface and water table elevation profiles for Profile 1 with scarp and well locations. Square boxes represent water table elevations along cross lines; (b) unmigrated travel time section; (c) interpreted migrated, and depth converted seismic section for Profile 1. The large velocity contrast at water table depths is consistent with the shallow reflector, and the configuration and depth of the deeper reflection package is consistent with the depths of tuffaceous sediments (Tv) and older volcanic rocks (Tov) identified in nearby boreholes.
11
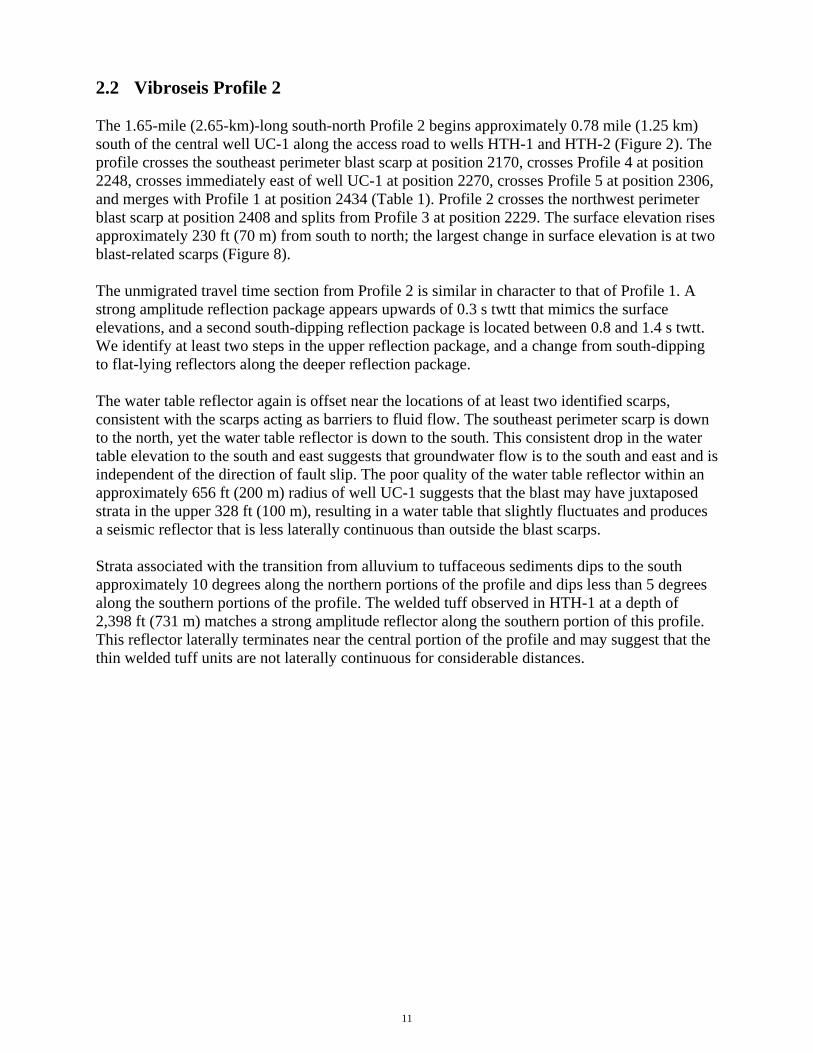
2.2 Vibroseis Profile 2 The 1.65-mile (2.65-km)-long south-north Profile 2 begins approximately 0.78 mile (1.25 km) south of the central well UC-1 along the access road to wells HTH-1 and HTH-2 (Figure 2). The profile crosses the southeast perimeter blast scarp at position 2170, crosses Profile 4 at position 2248, crosses immediately east of well UC-1 at position 2270, crosses Profile 5 at position 2306, and merges with Profile 1 at position 2434 (Table 1). Profile 2 crosses the northwest perimeter blast scarp at position 2408 and splits from Profile 3 at position 2229. The surface elevation rises approximately 230 ft (70 m) from south to north; the largest change in surface elevation is at two blast-related scarps (Figure 8). The unmigrated travel time section from Profile 2 is similar in character to that of Profile 1. A strong amplitude reflection package appears upwards of 0.3 s twtt that mimics the surface elevations, and a second south-dipping reflection package is located between 0.8 and 1.4 s twtt. We identify at least two steps in the upper reflection package, and a change from south-dipping to flat-lying reflectors along the deeper reflection package. The water table reflector again is offset near the locations of at least two identified scarps, consistent with the scarps acting as barriers to fluid flow. The southeast perimeter scarp is down to the north, yet the water table reflector is down to the south. This consistent drop in the water table elevation to the south and east suggests that groundwater flow is to the south and east and is independent of the direction of fault slip. The poor quality of the water table reflector within an approximately 656 ft (200 m) radius of well UC-1 suggests that the blast may have juxtaposed strata in the upper 328 ft (100 m), resulting in a water table that slightly fluctuates and produces a seismic reflector that is less laterally continuous than outside the blast scarps. Strata associated with the transition from alluvium to tuffaceous sediments dips to the south approximately 10 degrees along the northern portions of the profile and dips less than 5 degrees along the southern portions of the profile. The welded tuff observed in HTH-1 at a depth of 2,398 ft (731 m) matches a strong amplitude reflector along the southern portion of this profile. This reflector laterally terminates near the central portion of the profile and may suggest that the thin welded tuff units are not laterally continuous for considerable distances.
12
Figure 8. Seismic Image of Profile 2 (a) Surface and water table elevation profiles for Profile 2, and scarp and well locations. Square boxes represent water table elevations along cross lines; (b) unmigrated travel time section; (c) interpreted migrated and depth-converted seismic section. Seismic reflection Profile 2 shows a reflection from the water table and from Tv and Tov units. Strong amplitude reflectors that match the depth of welded tuffs appear to laterally terminate, suggesting that these units do not extend for large distances. QTa = Quaternary and Tertiary alluvium; Tv = Tertiary tuffaceous sediments; Tov = Tertiary older volcanic rocks.

13
2.3 Vibroseis Profile 3 The 1.12-mile (1.8-km)-long south-north Profile 3 splits from Profile 2 at position 3229 southeast of well UC-1 (Figure 2). The profile continues from Profile 2 along the access road to MV-1 approximately 328 ft (100 m) east of well UC-1, extends past the start of Profile 5 at position 3275, and crosses Profile 1 at position 3306. Profile 3 continues past well MV-1 at position 3450 and extends northeast an additional 1,312 ft (400 m). The surface elevation change is approximately 66 ft (20 m) from south to north (Figure 9). Figure 9 shows the seismic image of Profile 3 and the southern extension of Profile 2 that extends past the southeast perimeter scarp and well HTH-1. As with Profiles 1 and 2, the most prominent reflectors appear between 0.2 and 0.3 s twtt and below 0.8 s. Both shallow and deep reflections dip to the south; the shallow reflection package is offset at two locations and also shows a change in reflection character near the center of the profile. Reflections near water table depths are again offset at the locations of at least two surface scarps, and down to the south (Figure 9). Reflections from the central portions of the profile are less coherent, consistent with strata within a few hundred meters of the blast radius being juxtaposed from the blast. Reflections that appear at depths greater than 0.5 mile (0.8 km) suggest that tuffaceous sediments strata dip approximately 10 degrees to the south along the northern portions of the profile and dip approximately 5 degrees to the south along the southern portions of the profile. The change in reflection dip appears in the central well area between Profiles 1 and 4 (Figure 2).

14
Figure 9. Seismic Image of Profile 3 (a) Surface and water table elevation profiles for Profile 3, and scarp and well locations. Square boxes represent water table elevations along cross lines; (b) unmigrated travel time section; (c) interpreted migrated, and depth-converted seismic section. Seismic Profile 3 shows a strong reflection from the water table and from Tv and Tov stratigraphy. Dips on volcanic strata are to the south ~5 degrees. QTa = Quaternary and Tertiary alluvium; Tv = Tertiary tuffaceous sediments; Tov = Tertiary older volcanic rocks.

15
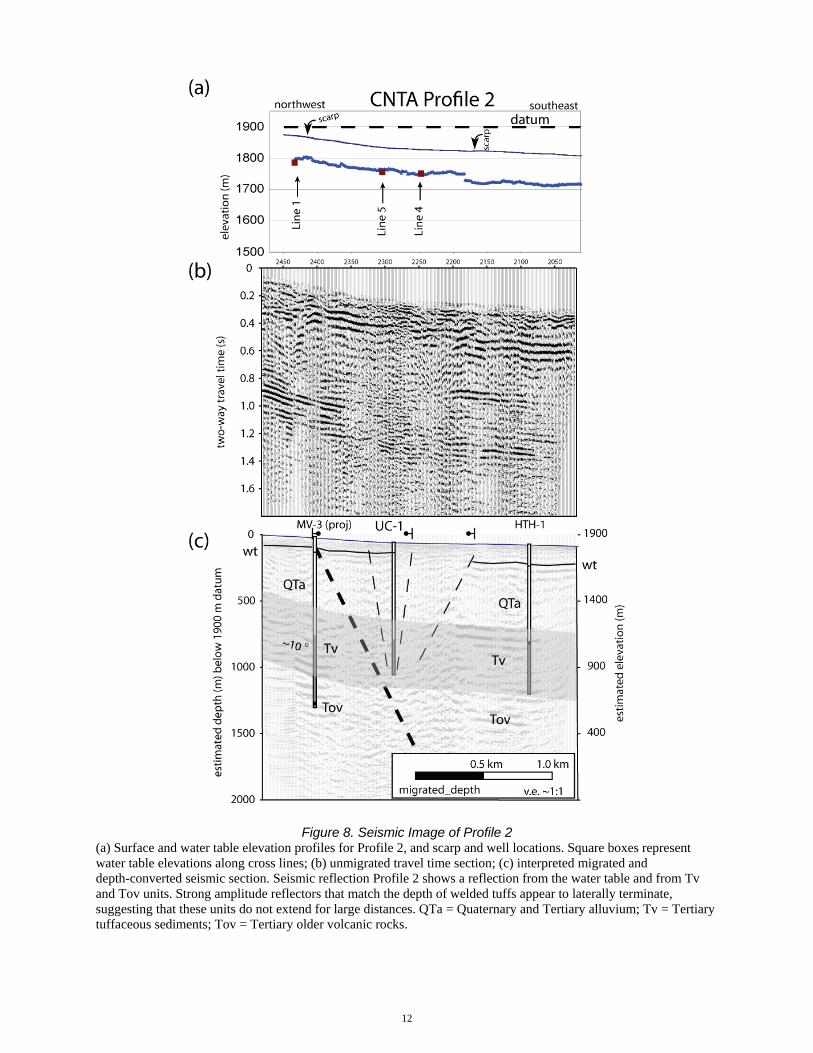
2.4 Vibroseis Profile 4 The 2.6-mile (4.2-km)-long east-west Profile 4 extends from the axial valley road (immediately west of the Moores Station Wash) along the main CNTA access road (Figure 2). Profile 4 is the longest of the five profiles and is oriented parallel to local surface water flow and normal to the basin-bounding faults of the Hot Creek Valley. The profile continues to the west approximately 164 ft (50 m) south of UC-1 to a jeep trail beyond the exclusion area near exposures of tuffaceous sediments (Ekren et al. 1973). Profile 4 crosses Profile 1 at position 4426, crosses Profile 3 at position 4456, and crosses Profile 2 at position 4468. Profile 4 crosses the southeast perimeter scarp at positions 4358 and the southward extension of the northwest perimeter scarp at position 4680. The elevation rises nearly 656 ft (200 m) from the topographic lowest portion of the valley to approximately 0.62 mile (1 km) east of Tertiary rock exposures (Figure 10; Ekren et al. 1973). Both shallow and deeper reflections are imaged on this profile; a consistent dip to the east is evident on the shallow reflector, and dips toward the center of the profile are shown by the deeper reflection package (Figure 10). The shallow reflector is again associated with the water table, based on seismic amplitude and estimated depth from refraction and borehole geophysical measurements. Water table elevations are plotted below the surface elevation and show an increase in depth to the water table from west to east. Large water table reflector offsets are noted from at least two locations with other minor steps in water elevations. These offsets appear near identified scarps, again consistent with faults acting as barriers to ground water flow. Again, the reflection quality diminishes within 656 ft (200 m) of the central well area, consistent with the presence of a rubble zone near the blast that influences head measurements. Reflections from below the water table likely represent a gradation from alluvial fan deposits to tuffaceous sediments. Below the tuffaceous sediments, many strong-amplitude reflections are likely associated with older welded and semiwelded tuffs. The zone of tuffaceous sediments is upwards of 984 ft (300 m) thick and is consistent with lithologic descriptions for CNTA boreholes. The eastern portion of Profile 4 shows an approximately 10 degree dip to the west, and the deeper reflections along the western portion of the profile show an approximate 15 degree dip to the east. A wedge of lower-amplitude reflections appearing at shallower dips within the central zone may represent younger tuff strata that filled the extending basin after older strata were offset by basin extension. The pre-blast fault scarp is located near position 4670 on Profile 4. Projecting the scarp location to the change in dip on tuffaceous and older volcanic strata suggests a 65 degree dip on the observed basin-bounding fault.
16
Figure 10. Seismic Image of Profile 4 (a) Surface and water table elevation profiles for Profile 4, and scarp and well locations. Square boxes represent water table elevations along cross lines; (b) unmigrated travel time section; (c) interpreted migrated, and depth-converted seismic section. Seismic reflection Profile 4 shows a strong reflection from the water table and from Tertiary volcanic rocks. The thin dashed lines represent blast-related faulting, while the bold dashed line represents a pre-blast fault that ties the surface scarp to the change in Tv dip. QTa = Quaternary and Tertiary alluvium; Tv = Tertiary tuffaceous sediments; Tov = Tertiary older volcanic rocks.

17
2.5 Vibroseis Profile 5 The 0.68-mile (1.1-km)-long east-west Profile 5 begins approximately 656 ft (200 m) northeast of well UC-1 and is the shortest of the 5 profiles (Figure 2). The profile continues northwest along the gravel road and terminates at a blast-related scarp at position 5144. Geophones were planted above the scarp, but we could not mobilize the vibroseis truck upslope of the fault scarp because of the poor quality of the road and the more than 6.6 ft (2 m) vertical relief at the scarp. The surface elevation increases to the west and rises approximately 230 ft (70 m) (Figure 11). The water table reflection from 0.2 to 0.3 s twtt on Profile 5 undulates but shallows to the east and may be laterally discontinuous near position 5120 (Figure 11). This position is approximately 246 ft (75 m) east of the prominent fault scarp (5144) and, if related to the fault acting as a barrier to fluid flow, would suggest a 55 degree dip on the fault at depths shallower than 328 ft (100 m), similar to the dip angle measured on Profile 4 (Figure 10). Deeper reflectors mostly dip to the east along the western portion of the profile and are relatively flat-lying near the eastern portions of the profile, again consistent with the profile crossing a major pre-blast fault.

18
Figure 11. Seismic Image of Profile 5 (a) Surface and water table elevation profiles for Profile 5, and scarp and well locations. Square boxes represent water table elevations along cross lines; (b) unmigrated travel time section; (c) interpreted migrated and depth-converted seismic section. Seismic reflection section Profile 5 shows a strong reflection from the water table and from estimated depths between 1.5 and 2.5 km that may represent bedrock stratigraphy. QTa = Quaternary and Tertiary alluvium; Tv = Tertiary tuffaceous sediments.

19
3.0 Interpretation and Conclusions
3.1 Alluvial Aquifer Direct head wave arrivals range from 500 to 800 m/s, which are consistent with unsaturated, coarse-grained sediments in the upper few hundred meters below land surface. Sonic logs from monitoring wells suggest that p-wave velocities below the water table exceed 2,500 m/s (Figures 3, 4, and 5). A strong-amplitude reflector that appears at travel times within 0.3 s of the surface datum on all seismic sections is consistent in depth and character with the large velocity contrast expected at the water table. This water table reflector is semicontinuous across each seismic profile and offset at a number of locations (Figures 9–11), including mapped scarps, suggesting that faults associated with the scarps are barriers to fluid flow. Scarp heights of generally less than a few meters do not directly correlate to the associated water table offsets of more than 32.8 ft (10 m) (from 32.8 ft [10 m] to 131 ft [40 m] along Profile 4), suggesting that even faults with minor amounts of vertical slip may strongly influence fluid flow. Groundwater flow is likely reduced across and/or redirected around these faults. The likely cause of the reduced flow across the faults is the added fine-grained materials that result from the faulting process and decrease the permeability of the fault zone, typical in unconsolidated sediment environments (e.g., Sigda et al. 1999; Rawling et al. 2001; Sims et al. 2005). Water table offsets do not necessarily match the surface expression of the scarps, as seen across the southeast perimeter fault on Profiles 2, 3, and 4. There, the fault scarp is down to the northwest, yet the water table deepens to the southeast. Within the blast zone, the water table reflector is discontinuous and difficult to track. The character of the water table reflector within an approximately 656 ft (200 m) radius of well UC-1 is consistent with a region of fractured alluvial fan and volcaniclastic sediments and a water table that mimics this deformation. 3.2 Volcanic Section Reflectors below the alluvium are believed to be associated with densely welded tuffs. The dip direction of the welded tuff may be inferred from the seismic data; however, the seismic data do not provide information on groundwater flow directions within the welded tuff section.
4.0 Acknowledgements
Field assistance was provided by Boise State University graduate students Kristin Pape, Troy Brosten, and Vijay Gottumukkula and John and Elizabeth Healey from the Desert Research Institute (DRI). Land access was granted by the Bureau of Land Management. Funding was provided by S.M. Stoller Corp. under the direction of Rex Hodges and the U.S. Department of Energy Office of Legacy Management contract number DE-AM01-07LM00060. Boise State University Dept ID No.: 693G106235, Project ID No.: 6FT81XXXX0028.

20
5.0 References
Ekren, E. B., E. N. Hinrichs, W. D. Quinliven, and D. L. Hoover, 1973. Geologic map of the
Moores Station Quadrangle, Nye County: U.S. Geological Survey Miscellaneous Investigation Series Map I-756, scale 1:48,000.
Liberty, L. M., P. L. Heller, and S. B. Smithson, 1994. “Seismic reflection evidence for two-phase development of Tertiary basins from east-central Nevada,” Geological Society of America Bulletin, 106: 1621–1633.
McKeown, F. A., and D. D. Dickey, 1969. “Fault Displacements and Motion Related to Nuclear Explosions,” Bulletin of the Seismological Society of America, 59 (6): 2253–2269.
Pohll, G., K. Pohlmann, J. Daniels, A. Hassan, and J. Chapman, 2003. “Contaminant Boundary at the Faultless Underground Nuclear Test,” Publication No. 45196, prepared for the U.S. Department of Energy Nevada Site Office.
Pohlmann, K., A. Hassan, and J. Chapman, 2000. “Description of Hydrogeologic Heterogeneity and Evaluation of Radionuclide Transport at an Underground Nuclear Test,” Journal of Contaminant Hydrology, 44: 353–386.
Prudic, D. E., J. R. Harrill, T. J. Burbey, 1995. Conceptual Evaluation of Regional Ground-Water Flow in the Carbonate Rock Province of the Great Basin, Nevada, Utah, and Adjacent States, U.S. Geological Survey Professional Paper 1409-D, 93–170.
Rawling, G. C., L. B. Goodwin, and J. L. Wilson, 2001. “Internal Architecture, Permeability Structure, and Hydrologic Significance of Contrasting Fault-Zone Types,” Geology, 29: 43–46.
Sigda, J. M., L. B. Goodwin, P. S. Mozley, and J. L. Wilson, 1999. “Permeability Alteration in Small-Displacement Faults in Poorly Lithified Sediments: Rio Grande Rift, Central New Mexico,” in Faults and Subsurface Fluid Flow in the Shallow Crust, Haneberg, W.C., et al., eds, American Geophysical Union Monograph 113, pp. 51–68.
Sims, D. W., A. P. Morris, D. A. Ferrill, and R. Sorkhabi, 2005. “Extensional Fault System Evolution and Reservoir Connectivity,” in Faults, Fluid Flow, and Petroleum Traps, R. Sorkhabi, and Y. Tsuji, eds, American Association of Petroleum Geologists Memoir 85, American Association of Petroleum Geologists, Tulsa, Oklahoma, pp. 79–93.
Thatcher, W., G. R. Foulger, B. R. Julian, J. Svarc, E. Quilty, and G. W., Bawden, 1999. “Present-Day Deformation Across the Basin and Range Province, Western United States, Science, 283: 1714–1718.
U.S. Department of Energy, 1998. Corrective Action Investigation Plan for the Central Nevada Test Area Subsurface Sites (Corrective Action Unit no. 443).
U.S. Department of Energy, 2005. Central Nevada Test Area Environmental Management End State Vision, DOE/NV 954.
Yilmaz, O., 1987. “Seismic data processing,” Society of Exploration Geophysicists, Tulsa, Oklahoma, 526 pp.

Attachment II
NDEP Comments and DOE-LM Responses to Comments

This page intentionally left blank


Placeholder for DOE Support Letter

This page intentionally left blank