contributions of role-playing games: advantages of
TRANSCRIPT

University of Arkansas, Fayetteville University of Arkansas, Fayetteville
ScholarWorks@UARK ScholarWorks@UARK
Theses and Dissertations
12-2019
Contributions of Role-Playing Games: Advantages of Contributions of Role-Playing Games: Advantages of
Incorporating Social Media in Disaster Response Incorporating Social Media in Disaster Response
Erin Mullin University of Arkansas, Fayetteville
Follow this and additional works at: https://scholarworks.uark.edu/etd
Part of the Communication Technology and New Media Commons, Industrial Engineering Commons,
Industrial Technology Commons, Social Media Commons, and the Transportation Commons
Citation Citation Mullin, E. (2019). Contributions of Role-Playing Games: Advantages of Incorporating Social Media in Disaster Response. Theses and Dissertations Retrieved from https://scholarworks.uark.edu/etd/3551
This Thesis is brought to you for free and open access by ScholarWorks@UARK. It has been accepted for inclusion in Theses and Dissertations by an authorized administrator of ScholarWorks@UARK. For more information, please contact [email protected].

Contributions of Role-Playing Games: Advantages of Incorporating Social Media in Disaster Response
A thesis submitted in partial fulfillment of the requirements for the degree of
Master of Science in Industrial Engineering
by
Erin Mullin Mount Holyoke College
Bachelor of Arts in Mathematics, 2017
December 2019 University of Arkansas
This thesis is approved for recommendation to the Graduate Council. ___________________________________ Ashlea Bennett Milburn, Ph.D. Thesis Chair ___________________________________ ___________________________________ Ed Pohl, Ph.D. Kim LaScola Needy, Ph.D. Committee Member Committee Member

Abstract
After a disaster, emergency managers need to know who needs help, what type of help they need,
and how soon they need it. Traditionally, they have relied on 911 calls and ground assessments to
collect this information. Because the needs of a population are not able to be identified in a timely
manner by ground assessments and because individuals are often unable to get through to 911,
many civilians in distress turn to social media outlets as a last-ditch effort to obtain the services
they need. Due to the uncertainty concerning the accuracy of social media posts, responding to
disaster related information sourced from social media is considered a liability by emergency
managers. Historically, the academic literature has not focused on obtaining an in depth
understanding of the post-disaster decision environment. As a result of this gap in the literature,
academics have been unable to provide viable routing solutions for incorporating social media data
in disaster response operations, emergency managers have refrained from using this data, and
civilian’s last-ditch efforts have been left unserved by officials. This research presents 2
spreadsheet-based role-playing games to combat these problems: Logistics to the Rescue and
Dispatch to the Rescue. In both games, players assume the role of an emergency dispatcher,
assigning locations to routes. Logistics to the Rescue is geared towards K-12 students and provides
a platform to familiarize them with emergency response logistics. Dispatch to the Rescue is geared
towards emergency management personnel and aims to communicate the benefits of incorporating
social media data in disaster response while concurrently eliciting expert knowledge regarding the
post-disaster decision environment. Individually, Logistics to the Rescue promotes students to
pursue careers in STEM by providing a distinct narrative portraying engineering as creative and
cooperative rather than technical and a-social, and Dispatch to the Rescue provides invaluable
insights into the underpinnings of the environment emergency personnel work within after major

disasters. Both games serve as pedagogical tools for simulating post-disaster environments
showcasing how engineering can be used to save more lives in a disaster response while
reinforcing the benefits of incorporating social media in disaster response.

Table of Contents 1. Introduction ........................................................................................................................... 1
2. Literature Review ................................................................................................................... 4 2.1 Disaster Routing .............................................................................................................. 4
2.2 Disaster Routing Under Uncertainty: Future Needs ..................................................... 6 2.3 Disaster Routing Under Uncertainty: Demand Accuracy ............................................ 7
2.4 K-12 Education: Logistics to the Rescue ........................................................................ 9 2.5 Eliciting Expert Knowledge: Dispatch to the Rescue ................................................... 10
3. Methodology ......................................................................................................................... 14 3.1 Orienteering Problem ................................................................................................... 14
3.2 Logistics to the Rescue .................................................................................................. 15 3.3 Dispatch to the Rescue .................................................................................................. 16
4. Case Study ............................................................................................................................ 18 4.1 Logistics to the Rescue .................................................................................................. 18
4.2 Developing Benchmark Instances: Dispatch to the Rescue ......................................... 19 4.2.1 Academic Instance .................................................................................................... 20 4.2.2 Stylized Scenarios .................................................................................................... 21
5. Results .................................................................................................................................. 22
5.1 K-12 Survey Results: Logistics to the Rescue ............................................................... 22 5.2 K-12 Routing Results: Logistics to the Rescue ............................................................. 24
5.3 Emergency Management Survey Results: Dispatch to the Rescue .............................. 26 5.4 Emergency Management Routing Results: Dispatch to the Rescue ............................ 30
6. Conclusion ........................................................................................................................... 35 7. Bibliography ......................................................................................................................... 38
8. Appendix .............................................................................................................................. 41

1
1. Introduction
On October 29th of 2012, when Hurricane Sandy made landfall on the New Jersey coast, the US
not only experienced one of the costliest natural disasters to date but it also experienced the first
mass occurrence of civilian reliance on social media as a form of crisis communication (Council,
2012). Between October 27th and November 1st of 2012, Twitter recorded over 20 million tweets
related to Sandy and on the day of its landfall FEMA’s official Facebook page received an
estimated 300,000 views (Cohen, 2013). Since then, many examples of civilians utilizing social
media platforms to exchange real-time information in times of crisis have been recorded and
various methods outlining how to harness this data have been documented. In 2014 digital
volunteers at Micromappers harnessed information posted to social media platforms to compile a
real-time map displaying areas heavily impacted by Typhoon Haiyan and their associated rescue
requests (Mackenzie, 2013). In 2015 Google harnessed information posted to social media
platforms, after the earthquakes in Nepal, to reunite families and inform loved ones of their safety
through their website, Google Person Finder (Baker, 2016). In 2017 grassroots organizations were
able to provide relief to over 14,600 victims of Hurricane Harvey by harnessing information posted
to social media and compiling an interactive map consisting of pending/fulfilled rescue requests
while concurrently mobilizing civilians with the necessary equipment to conduct these rescues
(MacMillan, 2017) (Sullivan & Holley, 2017).
Traditionally, official response agencies have relied on ground assessments, that often take
days to conduct, to collect vital information about civilian safety during disasters (James, 2016).
The aforementioned civilian response efforts provide various examples of how official response
agencies could harness social media data to more speedily cultivate this vital information.
However, the emergency response community has been reluctant to incorporate social methods in

2
their data collection efforts due to the negatively perceived credibility of the data retrieved from
social platforms (Su et al., 2013). In 2012, NEMA surveyed a group of emergency response agency
personnel and questioned them on their propensity to consider incorporating social media data in
their disaster response operations. The survey reported that over 75% of respondents would not
consider social media data unless they could be corroborated by a trusted source, a process which
could take days to conduct (Su et al., 2013). In a disaster response, the rapid administration of
supplies to affected areas significantly reduces human suffering and loss of life (International
Federation of Red Cross and Red Crescent Societies, 2000). It is well known that the logistics of
a disaster response operation critically influence its effectiveness and efficiency (Van
Wassenhove, 2006). Consequently, it is critical to ascertain the advantages and disadvantages of
employing social media data in response operations as the information concerning rescue requests
significantly affects the delivery of relief to affected populations.
In the past, various studies, discussed in greater detail below, have evaluated the positive
and negative consequences of integrating social media in disaster response for a variety of decision
approaches (Kirac, Milburn, & Wardell, 2013) (Kirac & Milburn, 2015) (Milburn & Mullin, 2018).
Due to lack of information, these analyses have focused on a narrow set of decision approaches
founded on the academic ideologies of what an ideal disaster routing methodology should be rather
than the emergency management principles that dictate what a realistic disaster routing
methodology can be. In this paper, two games are presented with the objective of bridging the
aforementioned information gap. Logistics to the Rescue aims to promote interest in the use of
social media for disaster response in future generations by appealing to K-12 girls while Dispatch
to the Rescue aims to both encourage the current emergency management community to use social

3
media for disaster response and to elicit their expert knowledge on what constraints dictate how
decisions are made in their community.
Logistics to the Rescue considers a single vehicle disaster response route planning problem.
The game is targeted toward K-12 girls and consists of two rounds. The first-round mimics a 3-
stage route planning process. Each stage corresponds to the revelation of new data; in stage 1 the
students are present with only 911 calls, in stage 2 they are additionally presented with unverified
social media posts, and in stage 3 the accuracy of the social media posts is revealed. In each
subsequent step a subset of the route created in the previous step is captured. This gently introduces
students to the permanence related to their routing decisions. The second-round mimics an online
route planning environment where data evolves over time and where each decision made is locked
in, no longer allowing for any route flexibility and exposing the harsh nature of disaster response.
Dispatch to the Rescue also considers a single vehicle disaster response route planning
problem. This game consists of one round, with three steps, and is targeted toward members of the
emergency management community. All three steps of the game mimic an online route planning
problem and utilize data derived from a case study tailor-made to incorporate both 911 calls and
social media posts. The first step of Dispatch to the Rescue covertly reveals unlabeled 911 calls to
players. The second and third step reveal both 911 calls and social media posts but only the third
step discloses their labels. Although all three steps are centered around the same routing problem
and case study, the progressive disclosure of data in each step elicits distinct outcomes. Thus, each
step has the potential to represent a distinctive routing strategy.
Section 2 provides a review of the related literature. Section 3 presents a detail overview
of the design process. In Section 4, the instance development for both games is discussed. Sections
5 and 6 summarize the work and present the final conjectures.

4
2. Literature Review
In this section we review relevant routing literature and examine how the routing problems built-
into the games relate to the existing literature on disaster relief routing. Additionally, we discuss
the academic evidence substantiating the intentional decisions we made when designing Logistics
to the Rescue to appeal to young female audiences as well as the intentional decisions made when
designing Dispatch to the Rescue to elicit expert knowledge in the field of emergency response.
2.1 Disaster Routing
Previous publications have explored topics relating to the dispatch of emergency vehicles in
disaster response. For example, Hsueh et al., (2008), Mguis et al., (2012), Wex et al., (2014),
Kirac et al., (2013), Kirac and Milburn, (2015), and Mullin and Milburn, (2018), among others,
allocate the position of demand locations on the schedules/routes of emergency vehicles by
minimizing the total tour cost. Mguis et al., (2012) assesses the implementation of a dynamic
vehicle routing problem with time windows when routing the transport of civilians, troops, freight,
food, fuel, and prescription drugs in a post disaster operation. Wex et al., (2014) evaluates the
performance of a parallel-machine scheduling problem for allocating rescue units. Kirac et al.,
(2013) analyzes how two decision approaches compare for a variety of disaster routing objectives
and extends this work in Kirac and Milburn (2015) to compare the same approaches in a multi-
objective disaster routing problem. Similar decision approaches are considered by Mullin and
Milburn, (2018), whose work analyzes how various data properties and their implementations can
maximize lives saved when employing a capacitated vehicle routing problem to plan and dispatch
rescue teams. In each of the aforementioned papers, all demand must be served.
While there is ample literature related to the optimization of disaster routing, few works
consider models whose objectives allow for unsatisfied demand to remain at the response stage.
5
Qin et al., (2017) notes that in the first 72 hours of a response, resources are constrained and
consequently applies an emergency vehicle routing problem with insufficient supplies to route
emergency vehicles. The objective is to minimize the total expected cost, and although each
demand point is required to be visited by a vehicle, the total demand units at each point are not
required to be satisfied at the end of the response stage. Subsequently, the shortage of a unit of
supply at a demand point is penalized providing the model with incentive to serve as much demand
as possible but allowing some demand to go unsatisfied. Najafi et al., (2014) proposes a mixed
integer, multi-objective, multi-commodity, multi-modal model to dispatch and route vehicles in
response to an earthquake. The model’s objectives are hierarchical, primarily minimizing the
number of unserved people and secondarily minimizing unsatisfied need. The number of unserved
people and needs are penalized not only by their absolute amount but also by their associated
severity as their weighted sums, by severity, are respectively added to objective functions 1 and 2.
Kirac and Milburn, (2018) proposes the use of the team orienteering problem (TOP) to solve a
mobile delivery problem in a disaster response environment. By definition the TOP maximizes
lives saved, thus it does not require a penalty to account for unserved demand.
The goal of the games presented in this paper is to mimic the role of a dispatcher, working
within the first 72 hours of a large-scale disaster response operation. A dispatcher’s job is to relay
uncertain information and organize the appointment of people/vehicles in emergency services. Due
to its simplicity, this paper’s formulation of this problem most closely resembles that presented by
Kirac and Milburn, (2018), as players are asked to solve variants of the Orienteering Problem (OP),
a special case of the TOP. For more information concerning the OP we direct readers to
Tsiligirides, (1984) and Golden et al., (1987).

6
2.2 Disaster Routing Under Uncertainty: Future Needs
As previously mentioned, there are few works which allow for unsatisfied demand to
remain at the end of a given time horizon, however, there are even fewer works who consider the
uncertainty of data in a disaster response. Intuitively, the future needs of a disaster-stricken
population are not known with certainty at the time of planning a disaster response. Most
publications regarding disaster routing assume that all data are available in the planning stages of
a disaster response (Najafi, Eshghi, & Sander, 2014). Two strategies have predominantly been
used to model uncertainty in regard to future needs in disaster environments. Academics such as
Najafi et al., (2014), Özdamar et al., (2004), Hsueh et al., (2008), and Mullin and Milburn, (2018)
follow a dynamic planning strategy where data evolves over the response period and plans can be
changed accordingly. Others such as Qin et al., (2017) and Shen and Dessouky, (2009) utilize a
dynamic planning strategy where data evolves over the response period and a stochastic strategy
where uncertain data is used to plan a response.
The games were developed to bridge an information gap between the academics modeling
optimized rescue routes, the practitioners executing rescues, and the civilians being rescued. In
disaster routing, the scheduling of demand within supply routes can drastically change depending
on the objective of the model (Luis, Dolinskaya, & Smilowitz, 2012). This implies that any
misinterpretation of the game, on the players behalf, will lead to insignificant results. Thus, given
that stochastic modeling is considered to be an advanced topic in engineering and that the target
audiences are comprised of emergency personnel and K-12 girls, both games consider variations
of the dynamic programming strategy. Specifically, Logistics to the Rescue, considers a 3-step
dynamic planning strategy where the player is allowed to re-route only after 2 specified time
intervals. Additional demand information is only revealed at these specified times. In Dispatch to

7
the Rescue, an online dynamic planning strategy is considered where the player is allowed to re-
route only after they have arrived at a previously scheduled stop, at each stop new points may or
may not be revealed.
2.3 Disaster Routing Under Uncertainty: Demand Accuracy
Less intuitive than the uncertainty of future demand, the accuracy of demand information is also
unknown during the planning stage of a disaster response (Shen Z. & Dessouky, 2009). Despite
having chosen to consider only 911 data, which they deem as high-quality data, the disaster
response community continues to operate in conditions of extreme uncertainty (Tapia & Moore,
2014). A survey conducted by CNA and NEMA in 2012 found that more than 75% of the
emergency management agencies surveyed stated that they would not consider social media data
when creating disaster response plans unless the data could be verified by a credible source (Su,
Wardell, & Thorkildsen, 2013). Interviews conducted with representatives from large international
disaster response organizations by Tapia and Moore, (2014) corroborated these findings. In these
interview summaries many subjects “stated that the veracity, accuracy, and legitimacy of data were
the most important factors in data used in organizational decision-making” and the academics
concluded that the subjects held “unreasonable standards for [social media] data, beyond the
standards for the same data arising from more traditional sources [911]”. Interestingly enough,
these interviews also revealed that, in regard to 911 data, most subjects regretted that superior data
was unavailable, accepted that this was the nature of their work, and understood that despite the
shortcomings of the data, hundreds of lives had been saved.
From the aforementioned interviews, it is clear that despite being widely regarded as
incomplete, 911 data is thought of with high esteem when compared to social media data. This can
be explained by examining data that is recognized as being of high-quality. Data are defined as

8
being of high-quality if their features are considered suitable for employment in a given field
(Juran, 1988). Unofficial policies within the emergency management (EM) community dictate that
only 911 demands are considered fit for consideration by response agencies, consequently boosting
the perception of 911 data’s quality, especially when compared to social media.
These unofficial policies have historically led academics to largely overlook the intrinsic
uncertainty of data accuracy, as a whole, in disaster response. However, the concurrent rise of
social media and billion-dollar disasters within the last decade has paved the way for a resurgence
of academic interest in the uncertainty of data and its accuracy in high-risk decision environments.
Kirac et al., (2013), Kirac and Milburn, (2015, 2018), Houston et al., (2015), and Mullin and
Milburn, (2018) model disaster response problems under uncertainty and analyze the implications
of incorporating uncertain social media data in disaster response. Athanasia and Stavros, (2015),
Plotnick and Hiltz, (2016), and Tapia and Moore, (2014) examine and summarize the current and
future roles of social media in disaster response by reviewing relevant literature and conducting
expansive studies as well as interviews. All of the above-mentioned academics have indicated that
social media has a lot of potential to become a useful tool in disaster response and that while the
uncertain nature of this data does pose significant challenges, that the development of generalized
models to quantify the improvements accomplished by incorporating this data might facilitate a
shift in the perception of social media’s role in disaster response. Moreover, the papers allude to
the notion that the critical shift in EM agencies’ perspectives is not likely to come from justifying
that the qualities of social media data are comparable to those of 911 data. Instead, they propose
that academics aid EM agencies in redefining their data performance metrics to measure
helpfulness rather than accuracy.

9
The primary objective of both Logistics to the Rescue and Dispatch to the Rescue is to help
expose the EM community as well as K-12 girls to the potential advantages of incorporating social
data in disaster response. More specifically, both games are intended to reveal that disaster routes
which consider both 911 and social data perform at least as good as, if not better than, disaster
routes which only consider 911 data, even when accounting for highly inaccurate social media
data. To accomplish this objective, experimental design choices were derived from Kirac et al.,
(2013), Kirac and Milburn (2015, 2018) and Mullin and Milburn, (2018) and integrated into a user-
friendly format which could be easily distributed and accessible to EM personnel as well as K-12
girls. At the finally of both games, the routes created, by players, in each step are measured in
terms of total lives saved and compared to one another. In Logistics to the Rescue, the routes are
compared using a benchmark from a case study, with only 1 instance, where approximately 45%
of the nodes revealed to the players are social media posts, and of those 60% are accurate. In
Dispatch to the Rescue, the routes are compared using a case study, comprised of 22 instances. In
each scenario approximately 30% of the nodes revealed to the players are social media posts. A
total of 6 values denoting the proportion of social media posts considered accurate are used, 0%,
20%, 40%, 60%, 80%, and 100%. Each of these percentages, with the exception of 0% and 100%,
has 5 replicates, each randomly distributing the accurate social media nodes within the pre-defined
set social media nodes. The performance of the routes created in each step of this game are then
compared for each instance in this case study, providing the player with a reliable portrait of how
integrating social data in disaster can improve rescue outcomes in a variety of lifelike scenarios.
2.4 K-12 Education: Logistics to the Rescue
The design choices implemented throughout the development of Logistics to the Rescue focused
on encouraging young women to pursue careers in STEM. This focus was driven by the disparate

10
percentage of bachelor’s degrees awarded to women compared to the percentage of engineering
specific bachelor’s degrees awarded to women. The National Science Foundation (NSF) has stated
that in 2014 57% of bachelor degree recipients were women, while only 20% of engineering
specific bachelor degrees were awarded to women (National Center for Science and Engineering
Statistics, 2017). It has been shown that different engineering fields value different principles,
which, consequently, affects the participation of women (Godfrey, 2007). Studies by the National
Academy of Engineering have also shown that the use of empathetic and philanthropic language
in job descriptions is effective in attracting more girls to engineering (National Academy of
Engineering, 2008). Brawner et al. (2012) even documented that fields like industrial engineering
allow women to “combine the prestigious social credentials of being an engineer with practices
they value, without losing their sense of self”. Consequently, we claim that Logistics to the Rescue
can help bridge the aforementioned gender gap by emphasizing how industrial engineering can be
utilized to aid disaster victims in times of crisis.
2.5 Eliciting Expert Knowledge: Dispatch to the Rescue
Dispatch to the Rescue’s, contributions are twofold. Not only does the game stimulate interest in
the incorporation of social media data within the EM community, as discussed in previous sections,
but it also serves as a tool to elicit expert knowledge. The knowledge captured by Dispatch to the
Rescue is beneficial for both the EM community itself and the academics studying it. To the EM
community, it provides an assessment of the strategies employed by experienced emergency
response personnel and a breakdown of how they utilize their skills and knowledge to manage time
sensitive information in un-predictable environments. To academics, it provides a documentation
of the expert knowledge employed by the emergency response personnel who operate as decision-
makers in complex disaster scenarios.
11
There is extensive literature on eliciting expert knowledge. Schiuma et al., (2012) provides
a thorough review of various knowledge elicitation methods and classifies them into one of three
categories, analyst-leading, expert-leading, or expert-analyst collaborating. The analyst-leading
and expert-leading methods require the active position to be held by analyst and experts,
respectively. More specifically, methods such as interviews and questionnaires are classified as
analyst-leading methods while round table discussions, brainstorming sessions, observational
studies, and lectures are classified as expert-leading methods. Although experts and analysts
assume active positions in both role-playing games and verbal reports, these methods are not
classified as either analyst-leading or expert-leading. These methods require both analyst and
experts to concurrently assume active positions and are classified as expert-analyst collaborating
methods as defined in Schiuma et al., (2012).
Specialized techniques are used a priori, in analyst-leading methods, to craft questions
intended to elicit expert knowledge (Schiuma, Gavrilova, & Andreeva, 2012). Therefore, it can be
deduced that a thorough understanding of the decision process in question is a perquisite to
applying these methodologies, an ideology supported by Schiuma et al., (2012) . In regard to
dispatchers, the decision process they employ in post-disaster rescue operations varies not only by
state but by county and even by dispatch center. In light of this, the application of an analyst-
leading method to elicit expert knowledge in this field is implausible.
The role of an analyst is very limited in expert-leading methods. In fact, analyst
engagement in these methods is typically restricted to communicating the topic and objectives of
the activity and is sometimes extended to allow for questions regarding clarification on any
statements or behaviors recorded by the analyst (Schiuma, Gavrilova, & Andreeva, 2012). In our
experience, expert-leading methods can be very time consuming. Minimizing the time spent

12
eliciting the expert knowledge of EM personnel such as dispatchers is of utmost importance as EM
personnel operate in high-stakes environments where every second matters, making their time very
costly (Moore & Miles, 1991). Consequently, precluding the use of expert-leading methods for
eliciting expert knowledge within the EM community.
In the past, expert-analyst collaborating methods have been applied by academics to elicit
expert knowledge within the EM community (Klein, Calderwood, & Macgregor, 1989)
(Okechukwu Okoli, Weller, & Watt, 2014). Both Klein et al., (1989) and Okechukwu Okoli et al.,
(2014) employ a type of verbal report methodology, termed the critical decision method (CDM).
The paper published by Klein et al., (1989) introduces the CDM method and provides an example
of its application by employing it to investigate the decision differences between expert and novice
firefighters. Okechukwu Okoli et al., (2014) expands this case study by utilizing the CDM to
identify the training needs in the firefighting community. This paper pinpoints the tacit knowledge
and skills used by expert firefighters and explores the implications of transferring this knowledge
to novice firefighters. These publications validate the employment of expert-analyst collaborating
methods to elicit expert knowledge within the EM community.
Although, the case study performed by Klein et al., (1989), validates the use expert-analyst
collaborating methods in the form of verbal reports, i.e. the CDM, for eliciting expert knowledge
in the field of EM and although his findings are corroborated by Okechukwu Okoli et al., (2014),
the application of a more advanced expert-analyst collaborating method, a role-playing game, may
be more appropriate in this domain. As previously mentioned, minimizing the time spent eliciting
expert knowledge is of utmost importance in this domain. However, Klein et al., (1989) and
Okechukwu Okoli et al., (2014) both reported that their interviews were roughly 2 hours long.
Additionally, it has been reported that individuals are not consistently able to verbalize their

13
decision process and that even when they are their explanation is only weakly correlated with their
tacit knowledge (Schiuma, Gavrilova, & Andreeva, 2012). These findings not only indicate major
temporal drawbacks to the use of verbal reports, i.e. the CDM, for eliciting expert knowledge in
the field of EM but furthermore substantiate that the method itself may not be appropriate as its
underpinnings may be perceived as very challenging and difficult by the experts in question.
In contrast to verbal reporting methods, role-playing methods engage experts and reveal
their tacit and implicit decision-making processes (Schiuma, Gavrilova, & Andreeva, 2012).
Instead of relying on the complex verbalization of an expert’s decision process, games allow
experts to be immersed in a simplified metaphor of reality. This facet of role-playing games allows
for the direct expression of various decisions in what appears to the expert as a simplified yet
legitimate environment (Barreteau, Page, & Perez., 2007). Moreover, Barreteau et al., (2007)
states that games offer a new dimension of knowledge elicitation through the “observation of body
language, attitudes, and direct actions during the game”. In Barreteau et al., (2007) gaming sessions
are categorized as either continuous or deterministic in terms of player freedoms. In games
expressing continuous player freedom, experts create their own rules at given stages of the game
and in those expressing deterministic player freedom, experts must follow the scenarios
implemented by analysts. Deterministic player freedom allows analysts to elicit specified
behaviors while continuous player freedom allows analyst to validate hypothesis about expert
behaviors. Combined with the drawbacks of verbal reporting methods and the advantages
presented by gaming methods Dispatch to the Rescue employs a role-playing game method
incorporating both deterministic and continuous player freedoms.

14
3. Methodology
Ultimately, the goal of this research is two-fold, to understand the decision processes employed in
post-disaster situations and to promote the use of social media data in such environments. Two
games are presented to achieve this goal, Logistics to the Rescue and Dispatch the Rescue. While
the incentives influencing the design of Logistics to the Rescue and Dispatch the Rescue differ,
they both employ a variation of the orienteering problem (OP).
3.1 Orienteering Problem
The OP is an NP hard single-vehicle routing problem that deals with the selection of nodes to visit
and the sequence of those visits. The problem itself aims to maximize the total profit collected
from the selected nodes within a pre-determined time limit. In the OP, it may not be possible to
visit all nodes within the time limit, simulating the realities of a disaster response operation where
demand outweighs supply.
The fundamental OP variant utilized in this paper can be defined as follows. Consider a set
of demand locations, 𝑁 = {1,… , |𝑁|}, where each demand location 𝑖 ∈ 𝑁 is associated with a non-
negative integer valued number of lives, 𝑆,. At the time of planning,𝑡 = 0, 𝑁 can be partitioned
into two subsets: verified demand locations,𝑁0, whose rescue requests were sourced using
traditional methods, and unverified demand locations,𝑁1, whose rescue requests were sourced
through social media platforms. At 𝑡 = 0, it is known that for each 𝑛03 ∈ 𝑁0, its’ associated
number of lives is equal to exactly one, 𝑆, = 1, and that for each 𝑛13 ∈ 𝑁1, its’ associated number
of lives is equal to at most one, 𝑆, ∈ {0,1}. The vehicle’s route is assumed to begin and end at the
station. The goal of this formulation is to determine a route, constrained by a time limit,𝑇𝑚𝑎𝑥,
that visits a subset of 𝑁 and maximizes the total lives saved.

15
3.2 Logistics to the Rescue
As previously mentioned, Logistics to the Rescue is intended to promote K-12 interest in the use
of social media for disaster response. The game simulates a post-disaster environment where
players assume the role of an emergency dispatcher, dynamically assigning demand locations to
rescue routes. To mimic this decision environment, Logistics to the Rescue employs two dynamic
variants of the OP described above, one in each of its rounds.
The game’s first round mimics a 3-stage OP where 𝑇𝑚𝑎𝑥8 = 74. In this round, players are
interrupted twice and introduced to previously unknown information at times 𝐼 = {20, 50}.
Throughout each stage of this round, players are able to experiment with their route plans prior to
finalizing their decisions. In stage 1, only verified demand locations, 𝑁0, are considered and
players define a route, 𝑅8, between time 0 ≤ 𝑡 ≤ 𝑇𝑚𝑎𝑥8 such that 𝑅8 ⊂ 𝑁0. Each 𝑟,8 ∈ 𝑅8 is
associated with a non-negative, arrival time 𝑎,8. In stage 2, the route created in stage 1 is interrupted
at time 𝐼8 = 20, and unverified demand locations, 𝑁1, are revealed. In this stage, players define a
route, 𝑅B, between time 𝐼8 < 𝑡 ≤ 𝑇𝑚𝑎𝑥8. The demand locations visited between time 0 ≤ 𝑡 ≤ 𝐼8
in 𝑅B are identical to those defined in this time period by 𝑅8. Mathematically, this implies that
∀𝑟,B ∈ 𝑅B whose 𝑎,B ≤ 𝐼8, 𝑟,B = 𝑟,8 ∈ 𝑅8. Furthermore, ∀𝑟,B ∈ 𝑅B whose 𝑎,B > 𝐼8, 𝑟,B ∈ {𝑁1 ∪ 𝑁0}.
In stage 3, the route created in stage 2 is interrupted at time 𝐼B = 50, and the accuracy of each of
the previously disclosed unverified demand locations are revealed. By revealing the accuracy of
these demand locations, 𝑁1 can be partitioned into two subsets, accurate unverified demand
locations, 𝑁G1, and inaccurate unverified demand locations, 𝑁H1. In this stage, players define a
route, 𝑅I, between time 𝐼B < 𝑡 ≤ 𝑇𝑚𝑎𝑥8. The demand locations visited between time 0 ≤ 𝑡 ≤ 𝐼B
in 𝑅I are identical to those defined in this time period by 𝑅B. Thus, ∀𝑟,I ∈ 𝑅I whose 𝑎,I ≤ 𝐼B, 𝑟,I =
𝑟,B ∈ 𝑅B and ∀𝑟,I ∈ 𝑅I whose 𝑎,I > 𝐼B, 𝑟,I ∈ {𝑁G1 ∪ 𝑁0}.

16
The second round of Logistics to the Rescue mimics a 3-stage OP with real time execution.
The OP formulation in this round is very similar to the formulation utilized in round 1, with a
couple of key exceptions. In round 2, only one route is created, 𝑅. Once a demand location has
been added to the route it is made permanent, eliminating the planning aspect allowed in round 1.
In this round, previously unknown information is also revealed at times 𝐼 = {20, 50}. Between
times 0 ≤ 𝑡 ≤ 𝐼8, players are only presented with verified demand locations, between 𝐼8 < 𝑡 ≤ 𝐼B
unverified demand locations are revealed, and between 𝐼B < 𝑡 ≤ 𝑇𝑚𝑎𝑥8 the accuracy of the
unverified demand locations is disclosed. Consequently, it can be observed that ∀𝑟, ∈ 𝑅 whose
𝑎, ≤ 𝐼8, 𝑟, ∈ 𝑁0, and that ∀𝑟, ∈ 𝑅 whose 𝐼8 < 𝑎, ≤ 𝐼B, 𝑟, ∈ {𝑁0 ∪ 𝑁1}, and lastly that ∀𝑟, ∈ 𝑅
whose 𝐼B < 𝑎, ≤ 𝑇𝑚𝑎𝑥8, 𝑟, ∈ {𝑁0 ∪ 𝑁G1}.
When creating routes in Logistics to the Rescue, by and large players define how demand
locations are assigned. The assignment strategies employed in this game can be categorized as
either TRAD strategies, those who only consider 911 calls, or PLAY strategies, those who consider
some form of both 911 calls and social media posts. In Logistics to the Rescue only stage 1 of
round 1 enforces a specific strategy, TRAD, by revealing verified demand locations and
withholding unverified demand locations. Stages 2 and 3 of round 1, as well as round 2, allow
players the flexibility to either employ a TRAD or PLAY strategy.
3.3 Dispatch to the Rescue
Dispatch to the Rescue is intended to encourage the emergency management community to use
social media for disaster response and to elicit their expert knowledge on what constraints dictate
how decisions are made in post-disaster environments. In parallel to Logistics to the Rescue,
Dispatch to the Rescue simulates a post-disaster environment where players assume the role of an
emergency dispatcher, dynamically assigning demand locations to rescue routes. To mimic this

17
decision environment, Dispatch to the Rescue employs an online variant of the OP described in
Section 3.1. In addition to the sets and parameters defined for the aforementioned OP variant, each
demand location 𝑖 ∈ 𝑁, in Dispatch to the Rescue, is associated with a non-negative opening time
𝑂,. In each of its’ 3 steps, a route,𝑅, constrained by 𝑇𝑚𝑎𝑥B = 99, is defined. Each 𝑟, ∈ 𝑅 is
associated with a non-negative, arrival time 𝑎,. In Dispatch to the Rescue verified and unverified
demand locations, 𝑁0 and 𝑁1, are uniformly revealed in a dynamic fashion between time 0 ≤ 𝑡 ≤
𝑇𝑚𝑎𝑥B.Unlike in Logistics to the Rescue, the accuracy of unverified demand locations is not
disclosed to players at any point in time. Subsequently, the route created in each step must satisfy
the following: ∀𝑟, ∈ 𝑅, 𝑂, ≤ 𝑎, ≤ 𝑇𝑚𝑎𝑥B and 𝑟, ∈ {𝑁0 ∪ 𝑁1}. In steps 1 and 2 of Dispatch to the
Rescue demand locations revealed to players are not labeled as either verified or unverified, instead
all demand locations are labeled as “missions”. In step 3, revealed demand locations are labeled
as either “social media posts” or “911 calls”, allowing players to distinguish verified demand
locations from unverified demand locations. Unbeknownst to them, players are presented with
both verified and unverified demand locations in step 2 while in step 1 they are only presented
with verified demand locations. Consequently, the route created in step 1 further satisfies: ∀𝑟, ∈
𝑅, 𝑂, ≤ 𝑎, ≤ 𝑇𝑚𝑎𝑥B and 𝑟, ∈ {𝑁0}.
Unlike Logistics to the Rescue, Dispatch to the Rescue offers players little flexibility in
defining how demand locations are assigned based on their verified status. While players have the
ability to dictate the assignment of a demand location based on its proximity and opening time in
steps 1, 2, and 3 of the game, they can only weigh the cost of assigning an unverified demand
location as opposed to a verified demand location in step 3. The assignment strategies employed
in Dispatch to the Rescue can be categorized as either TRAD, PLAY, or ALL strategies. Strategies
categorized as TRAD or PLAY remain as previously defined in Section 3.2 and strategies
18
categorized as ALL are those who unbiasedly consider 911 calls and social media posts. By only
revealing verified demand locations, step 1 enforces the TRAD strategy and, by not labeling
demand locations as either verified or unverified, step 2 enforces the ALL strategy. In step 3 players
are given the freedom to employ either a TRAD, PLAY, or ALL strategy.
4. Case Study
Two classes of information are available when solving the dynamic orienteering problem utilized
in Logistics to the Rescue and Dispatch to the Rescue: (i) unverified demand locations whose
requests were sourced from social media platforms and (ii) verified demand locations whose
requests were sourced from traditional sources, such as 911. As previously mentioned, the
accuracy of the requests made at unverified demand locations cannot be determined with full
certainty until they can be corroborated by a trusted source. The development of the case studies
used in Logistics to the Rescue and Dispatch to the Rescue are, respectively, discussed in sections
4.1 and 4.2.
4.1 Logistics to the Rescue
The case study utilized in Logistics to the Rescue is modified from an instance used in a previous
version of the game. It is comprised of 23 nodes, representing 22 demand locations, 𝑁M =
{1,2, … ,22} and a depot, 𝑁N = {0}. All nodes are imposed on a 20 X 20 grid with integer-valued
coordinates. The depot is placed at (10,10), a centralized location. It is assumed that all nodes have
a service time, 𝑆𝑇, equal to 0.
A parameter 𝜌 = 0.45 denotes the proportion PQPR and a parameter 𝜆 = 0.6 denotes the
proportion PUQPQ. 𝑁0 is defined as 𝑁0 = 𝑁M ∩ 𝑁1 and 𝑁H1 is defined as 𝑁H1 = 𝑁1 ∩ 𝑁G1. Each 𝑖 ∈
𝑁M represents a rescue request and is associated with an 𝑆, and an opening time, 0 ≤ 𝑂, ≤ 𝐼8.
Moreover, each 𝑖 ∈ 𝑁1 is associated with an integer-valued accuracy reveal time, 𝐴, = 𝐼B, at which

19
the accuracy of the requests made by unverified demand locations is revealed to players. The
planning horizon of the case study spans from 𝑡 = 0 to 𝑡 = 𝑇𝑚𝑎𝑥8. For every 𝑖 ∈ 𝑁0, 𝑆, = 1 and
𝑂, = 0, for every 𝑖 ∈ 𝑁G1, 𝑆, = 1 and 𝑂, = 𝐼8, and for every 𝑖 ∈ 𝑁H1, 𝑆, = 0 and 𝑂, = 𝐼8.
Table 1 provides a detailed overview of the case study data utilized in Logistics to the
Rescue. The row associated with the depot, 𝑁𝑢𝑚 = 0, is highlighted in yellow to distinguish it
from demand locations. Furthermore, the parameter 𝑆, can be calculated from the listed data as
𝑆, = 𝑁0 + 𝑁G1, where 𝑁0 and 𝑁G1 are equal to the column vector under their respective labels.
Table 1: Logistics to the Rescue Case Study Data
4.2 Developing Benchmark Instances: Dispatch to the Rescue
The case study presented is comprised of 22 stylized scenarios modified from an academic instance
we developed. Section 4.2.1 provides an overview of the methods used to generate the underlying
Num X Y O ST A NV NAu
0 10 10 0 0 - - -1 4 19 0 0 0 1 02 15 15 0 0 0 1 04 10 2 0 0 0 1 06 9 19 0 0 0 1 07 8 9 0 0 0 1 09 19 5 0 0 0 1 010 18 9 0 0 0 1 012 20 18 0 0 0 1 013 19 16 0 0 0 1 018 7 20 0 0 0 1 020 5 13 0 0 0 1 021 2 2 0 0 0 1 019 2 9 20 0 50 0 13 17 17 20 0 50 0 111 1 10 20 0 50 0 114 8 3 20 0 50 0 116 17 3 20 0 50 0 117 14 2 20 0 50 0 15 7 6 20 0 50 0 08 11 7 20 0 50 0 015 8 12 20 0 50 0 022 2 12 20 0 50 0 0
Logistics to the Rescue Case Study Data

20
academic instance and Section 4.2.2 discusses the stylized modifications applied to the academic
instance.
4.2.1 Academic Instance
The academic instance considers a set of 26 nodes, 𝑁M = {1,2, … ,25} and 𝑁N = {0}. Each 𝑖 ∈ 𝑁M
is associated with an 𝑆, = 1, an 𝑆𝑇, = 0, and an 0 ≤ 𝑂, < 𝑇𝑚𝑎𝑥B. The planning horizon of the
case study spans from 𝑡 = 0 to 𝑡 = 𝑇𝑚𝑎𝑥B and is partitioned into five time intervals, 𝑇8 =
{𝑡 ∈ ℤ|𝑡 = 0}, 𝑇B = {𝑡 ∈ ℤ|0 < 𝑡 ≤ 25}, 𝑇I = {𝑡 ∈ ℤ|25 < 𝑡 ≤ 50}, 𝑇[ = {𝑡 ∈ ℤ|50 < 𝑡 ≤
75} and 𝑇\ = {𝑡 ∈ ℤ|75 < 𝑡 ≤ 𝑇𝑚𝑎𝑥B}. An ordered set 𝑂𝐷 = {0.2, 0.3, 0.4, 0.1, 0} denotes the
percent of demand locations whose opening time falls, respectively, within time intervals
𝑇8, 𝑇B, 𝑇I, 𝑇[,and 𝑇\.
All nodes are imposed on a 16 X 16 grid. The depot is placed at (8,8), a centralized location.
Demand locations are placed by generating a random set of 25 integer coordinates, within the 16
X 16 grid, iteratively until there are no duplicates. For the academic instance, parameter is defined
𝜌 = 0.32. The set of demand locations and their coordinates is partitioned by defining 𝑁1 as a
random sample of 𝑁Msuch that |𝑁1| = ⌈|𝑁M|(𝜌)⌉, and by defining 𝑁0 = 𝑁M ∪ 𝑁1. To ensure that
all verified and unverified demand locations are distributed fairly across both time and space, 𝑁1
and 𝑁0 are first partitioned into 5 subsets as shown in equations (1)-(6). The size of the random
samples calculated in equations (1)-(6) is rounded to the nearest even number to ensure that the
sum of all their magnitudes equals the total number of nodes. Once 𝑁1 has been partitioned, for
𝑚 = {1, 2, 3, 4, 5}, it can be seen that ∀𝑖 ∈ 𝑁1cd, 𝑂, ∈ 𝑇d. The same is true for 𝑁0 and its subsets.
𝑁ec8 = 𝑅𝑎𝑛𝑑𝑜𝑚𝑆𝑎𝑚𝑝𝑙𝑒 k𝑁e, 𝑠𝑖𝑧𝑒 = n𝑁en ∗ 𝑂𝐷(1)p (1)
𝑁ecB = 𝑅𝑎𝑛𝑑𝑜𝑚𝑆𝑎𝑚𝑝𝑙𝑒 k𝑁e\𝑁ec8, 𝑠𝑖𝑧𝑒 = n𝑁en ∗ 𝑂𝐷(2)p (2)

21
𝑁ecI = 𝑅𝑎𝑛𝑑𝑜𝑚𝑆𝑎𝑚𝑝𝑙𝑒 k𝑁e\(𝑁ec8 ∪ 𝑁ecB), 𝑠𝑖𝑧𝑒 = n𝑁en ∗ 𝑂𝐷(3)p (3)
𝑁ec[ = 𝑅𝑎𝑛𝑑𝑜𝑚𝑆𝑎𝑚𝑝𝑙𝑒 k𝑁e\(𝑁ec8 ∪ 𝑁ecB ∪ 𝑁ecI), 𝑠𝑖𝑧𝑒 = n𝑁en ∗ 𝑂𝐷(4)p (4)
𝑁ec\ = 𝑅𝑎𝑛𝑑𝑜𝑚𝑆𝑎𝑚𝑝𝑙𝑒 k𝑁e\(𝑁ec8 ∪ 𝑁ecB ∪ 𝑁ecI ∪ 𝑁ec[), 𝑠𝑖𝑧𝑒 = n𝑁en ∗ 𝑂𝐷(5)p (5)
∀𝐽 ∈ {𝑢, 𝑣} (6)
4.2.2 Stylized Scenarios
In order to assess the performance of the TRAD, PLAY, and ALL strategies, various scenarios are
adapted from the academic instance described above. Scenarios are generated by assigning various
proportions of accuracy to the unverified demand locations in the academic instance. More
specifically, in the stylized scenarios 𝜆 is assigned a value from the following range,
{0, 0.2, 0.4, 0.6, 0.8, 1}. The set 𝑁1 is partitioned by defining 𝑁G1 as a random sample of 𝑁1such
that |𝑁G1| = ⌈|𝑁1|(𝜆)⌉, and by defining 𝑁H1 = 𝑁1 ∪ 𝑁G1. Because the requests associated with the
locations in 𝑁H1 are inaccurate, ∀𝑖 ∈ 𝑁H1, 𝑆, = 0. Following the same logic, because the requests
associated with the locations in 𝑁G1 and 𝑁0 are accurate, ∀𝑖 ∈ (𝑁G1 ∪ 𝑁0), 𝑆, = 1. To vary the
location distribution of 𝑁H1 and 𝑁G1 within 𝑁1this procedure is repeated 5 times for each 𝜆 ∈
{0.2, 0.4, 0.6, 0.8} value, producing a total of 22 stylized scenarios which are split into 6 𝜆-defined
categories.
The academic instance and its 22 stylized scenarios are depicted in Table 2. The row
associated with the depot, 𝑁𝑢𝑚 = 0, is highlighted in yellow to distinguish it from demand
locations. Furthermore, the parameter 𝑆,, can be calculated from the listed data as follows. For any
given scenario 𝑆, = 𝑁0 + 𝑁G1, where 𝑁0 and 𝑁G1 are equal the column vector under their
respective labels.

22
Table 2: Dispatch to the Rescue Case Study Data
5. Results
5.1 K-12 Survey Results: Logistics to the Rescue
Logistics to the Rescue has been administered to two groups of 6th and 7th grade female engineering
summer camp students, once in 2018 and again in 2019. Cumulatively, a total of 35 campers, aged
between 11 and 12 years, have played Logistics to the Rescue and responded to the survey
λ=0 λ=10 8 8 0 0 - - - - - - - - - - - - - - - - - - - - - - -1 7 15 30 0 1 0 0 0 0 0 0 0 0 0 0 0 0 0 0 0 0 0 0 0 0 0 02 12 1 24 0 0 0 0 1 0 0 0 1 1 0 0 1 1 1 0 0 1 1 1 0 0 1 13 0 0 68 0 1 0 0 0 0 0 0 0 0 0 0 0 0 0 0 0 0 0 0 0 0 0 04 5 2 0 0 1 0 0 0 0 0 0 0 0 0 0 0 0 0 0 0 0 0 0 0 0 0 05 2 14 20 0 1 0 0 0 0 0 0 0 0 0 0 0 0 0 0 0 0 0 0 0 0 0 06 1 1 25 0 1 0 0 0 0 0 0 0 0 0 0 0 0 0 0 0 0 0 0 0 0 0 07 3 7 29 0 1 0 0 0 0 0 0 0 0 0 0 0 0 0 0 0 0 0 0 0 0 0 08 5 16 0 0 1 0 0 0 0 0 0 0 0 0 0 0 0 0 0 0 0 0 0 0 0 0 09 6 9 0 0 0 0 1 0 0 0 0 1 0 0 1 0 1 1 0 1 1 1 1 0 1 1 110 9 11 0 0 0 0 1 0 0 1 1 0 0 1 0 1 1 0 1 1 1 1 0 1 1 1 111 7 5 39 0 1 0 0 0 0 0 0 0 0 0 0 0 0 0 0 0 0 0 0 0 0 0 012 11 11 7 0 1 0 0 0 0 0 0 0 0 0 0 0 0 0 0 0 0 0 0 0 0 0 013 3 14 21 0 0 0 0 1 1 0 0 0 0 0 0 0 0 0 1 0 0 1 0 1 0 1 114 14 0 64 0 1 0 0 0 0 0 0 0 0 0 0 0 0 0 0 0 0 0 0 0 0 0 015 0 12 14 0 1 0 0 0 0 0 0 0 0 0 0 0 0 0 0 0 0 0 0 0 0 0 016 11 16 28 0 1 0 0 0 0 0 0 0 0 0 0 0 0 0 0 0 0 0 0 0 0 0 017 7 12 44 0 0 0 0 0 0 0 0 0 1 1 0 0 0 1 1 0 0 0 1 1 1 0 118 9 4 0 0 1 0 0 0 0 0 0 0 0 0 0 0 0 0 0 0 0 0 0 0 0 0 019 2 13 35 0 0 0 0 0 1 0 1 0 1 1 0 0 1 1 1 1 0 1 1 1 1 0 120 3 1 27 0 1 0 0 0 0 0 0 0 0 0 0 0 0 0 0 0 0 0 0 0 0 0 021 13 7 3 0 0 0 0 0 0 1 0 0 0 0 1 0 0 0 1 1 1 0 1 1 1 1 122 16 15 26 0 1 0 0 0 0 0 0 0 0 0 0 0 0 0 0 0 0 0 0 0 0 0 023 5 4 0 0 1 0 0 0 0 0 0 0 0 0 0 0 0 0 0 0 0 0 0 0 0 0 024 11 4 47 0 0 0 0 0 0 0 0 1 0 0 1 1 1 1 0 1 1 1 1 1 1 1 125 14 2 15 0 1 0 0 0 0 0 0 0 0 0 0 0 0 0 0 0 0 0 0 0 0 0 0
NV
Academic Instance Stylized Scenarios
λ=0.2 λ=0.4 λ=0.6 λ=0.8NAuNum X Y O ST

23
questions shown in Table 3. The survey results show that 100.00% of the campers were in
agreement that both their understanding of disaster response as well as their understanding of how
social data can be used to support disaster response had improved as a result of the activity.
Additionally, 96.30% of campers were in agreement that their interest in disaster response
improved as a result of the activity and 96.00% were in agreement that their interest in the use of
social data to support disaster response improved as a result of the activity.
Table 3: Logistics to the Rescue Survey Questions
The survey responses suggest that the game provided an appropriate level of difficulty for
the 35 campers who partook in the activity. When asked to rate their agreement on whether the
challenge presented by the activity was appropriate for their skill level, on a scale from strongly
disagree to strongly agree, 96.43% of campers reported that they strongly agreed or agreed while
the remaining 3.57% of campers reported a neutral stance. In fact, for both Q5 and Q6 on the
survey, the median level of agreement is 4, indicating that the campers agree with the statements.
Q7In order to effectively administer relief, emergency response agencies should monitor social
media throughout the course of a disaster.
Q3My understanding of how social data can be used to support disaster response improved as a
result of this activity.
Q8 Social media is an effective way to communicate with officials when 911 is unreachable.
Q4My interest in the use of social data to support disaster response improved as a result of this
activity.
Q5 The challenge presented by this activity was appropriate for my skill level.
Q6The challenge presented by this activity was appropriate for the skill level of other students
in my grade.
On a scale from strongly disagree - strongly agree (1-5), rate your agreement with the following.
Q1 My understanding of disaster response improved as a result of this activity.
Q2 My interest in disaster response improved as a result of this activity.
Survey Questions

24
Our testing demographics are not exhaustive; however, the results collected suggest that Logistics
to the Rescue is well-suited for 6th to 7th graders between the ages of 11-12 years-old.
5.2 K-12 Routing Results: Logistics to the Rescue
Logistics to the Rescue is comprised of 4 steps. Verified, unresolved unverified, and resolved
unverified demand locations are successively revealed to players in steps 1-3, respectively. Step 4
dynamically reveals all the information from steps 1-3. This includes revealing verified and
unverified demand locations as well as revealing the resolutions to the unverified demand
locations. The terms unresolved and resolved are used to, respectively, describe the set of
unverified demand locations before and after they have been partitioned into accurate and
inaccurate unverified locations. In the following, we report performance metrics, such as lives
saved and distance traveled per accurate visit, for steps 1, 2, 3, and 4 of Logistics to the Rescue.
By measuring average distance per accurate visit rather than average distance per visit, we are able
to quantify the cost of visiting inaccurate demand locations within the route.
As previously mentioned, in step 1 the only routing strategy that players are able to employ
is the TRAD strategy. A total of 68.57% of campers were able to save the maximum number of
lives saved by participants, 12. Of the campers who were able to achieve the maximum number of
lives saved, the minimum average distance traveled per accurate visit was 4.14 units. The
participants averaged 11.14 lives saved and 6.41 average distance units per accurate visit. 68.57%
surpassed the average lives saved and 71.43% of students surpassed the performance of the average
distance units per accurate visit.
In step 2 players are able chose to employ either the TRAD or PLAY strategy. In this step,
the maximum number of lives saved by participants was 17. By effectively employing the PLAY
strategy only one camper was able to save 17 lives while traveling an average of 4.34 units of

25
distance per accurate visit. Campers averaged 12.43 lives saved and 5.93 average distance units
per accurate visit. There were no campers, who chose to employ the TRAD strategy, that were able
to surpass these averages. Of the campers employing the PLAY strategy, 52.94% were able to
surpass the average number of lives saved and 58.82% were able to surpass the average distance
traveled per accurate visit.
The set of unverified demand locations is partitioned into accurate and inaccurate
unverified demand locations in step 3, allowing players to employ either the TRAD or PLAY
strategy. In this step, 8.57% of campers achieved the maximum number of lives saved, 16. Of the
campers who were able to achieve the maximum number of lives saved, the minimum average
distance traveled per accurate visit was 4.56 units. Participants averaged 12.97 lives saved and
5.67 average distance units per accurate visit. 61.76% of campers employing the PLAY strategy
were able to surpass both of these averages. Only one camper chose to employ the TRAD strategy
and, consequently, was not able to surpass either average.
By dynamically revealing verified and unverified demand locations as well as resolutions
to the unverified demand locations, step 4 allows participants to employ either the TRAD or the
PLAY strategy. 37.14% of campers were able to achieve the maximum number of lives saved, 15.
Of these campers the minimum average distance traveled per accurate visit was 4.32 units.
Campers averaged 12.40 lives saved and 5.93 distance units per accurate visit. No campers who
chose to employ the TRAD strategy were able to surpass these averages. 56.25% of campers
employing the PLAY strategy were able to surpass the average number of lives saved and 59.38%
were able to surpass the performance of the average distance units per accurate visit.

26
5.3 Emergency Management Survey Results: Dispatch to the Rescue
In 2019 Dispatch to the Rescue was administered to various emergency response personnel. The
activity ranged in duration between 20 to 60 minutes with an approximate average duration of 35
minutes. Nineteen individuals responded to the survey shown in Table 4. The survey was presented
to participants in two sections. One section, distributed prior to the activity, was termed the pre-
survey and the other section, distributed after the activity, was termed the post-survey. The pre-
survey delivered questions 1-7 and the post survey delivered questions 1-9. Pre- and post-survey
questions 1-7 were intentionally overlapped in order to detect any game-related variation in
responses.
Table 4: Dispatch to the Rescue Survey Questions
Questions 1 through 5 of the survey are hierarchical survey questions intended to provide
insight into how emergency response personnel prioritize 911 calls in a major disaster response
operation. In both the pre- and post-survey, more than half of respondents reported that the severity
of a victim’s condition, Q5, was the most influential characteristic and that the position on the 911
call backlog, Q1, was the least influential characteristic when determining a calls placement on the
Q1Q2Q3Q4Q5
Rank the following from most - least (1-5) influential when ordering calls on the dispatch queue.Survey Questions
On a scale from strongly disagree - strongly agree (1-5), rate your agreement with the following.
Position on the 911 Call BacklogNumber of VictimsAge of VictimsLocation's Proximity to OfficersSeverity of Victim's Condition
Emergency response agencies cannot effectively administer relief in response to a major disaster without monitoring needs posted to social media. Social media is an effective way for impacted individuals to communicate their needs with officials when 911 is unreachable.My understanding of how social data can be used to support disaster response improved as a result of this activity. My interest in the use of social data to support disaster response improved as a result of this activity.
Q6
Q7
Q8
Q9

27
dispatch queue. These results are reflected in Figure 1, where the weighted average of Q1 exceeds
all others and the weighted average of Q5 is surpassed by all others. Additionally, Figure 1
provides rudimentary evidence that there is little change in the responses reported by participants
for each characteristic in the pre- and post-survey.
Figure 1: Pre- and post-survey weighted average response for questions 1-5. Weighted averages are proportional to influence.
A Friedman test was carried out to compare the influence ranking of the 5 call
characteristics. There was found to be a significant difference between the characteristics,
𝜒B(4) = 81.66, 𝑝 < 0.001. Post hoc analysis with the Pratt-Wilcoxon signed-rank tests was
conducted to further investigate the difference in influence for each characteristic from the pre-
survey to the post-survey. For each question, 1-5, the results indicate that there is not enough
evidence contained in this sample of data to reject the null hypothesis that the median difference
is zero at a 0.05 level of significance. The p-values for each of these tests are shown in Table 5.
Intuitively, the results make sense. Only 2 call characteristics on the list are considered by Dispatch
to the Rescue, position on the 911 call backlog and locations proximity to officers. The objective
of the game, to save maximal lives within a specified timeframe, favors prioritizing a location’s
proximity to officers over its position on the 911 call backlog and the pre-survey results show that
0 1 2 3 4 5
Q5
Q4
Q3
Q2
Q1
Weighted Influence
Weighted Average Response for Survey Questions 1-5
Pre-Survey Post Survey

28
even before playing Dispatch to the Rescue, participants ranked proximity over call order. These
observations justify the test results.
Table 5: Signed rank test results for survey questions 1-5, where * is significant at 0.05 and ** at 0.10.
Questions 6-9 of the survey are Likert scale survey questions intended to collect
information regarding particular statements of interest for this research. Figure 2 shows the
agreement ratings for each of these questions. As reflected in Figure 2, responses for Q8 and Q9,
were only collected in the post-survey. These responses show that 0% of respondents disagree with
either Q8 or Q9 and that, respectively, 68.42% and 42.11% of respondents agree with Q8 and Q9.
The median response for these questions is 4, signifying that the responses center around the
“agree” category. Agreement ratings for Q6 and Q7 are collected twice, once in the pre-survey and
again in the post-survey. In the pre-survey, 42.11% of respondents disagreed with Q6 while only
15.79% of respondents agreed. Furthermore, 21.05% of respondents disagreed with Q7 while
31.58% of respondents agreed. In the post-survey, agreement with Q6 and Q7, respectively, rose
to 36.84% and 42.11% while disagreement, respectively, fell to 26.32% and 5.26%.
Two-Sided Directional�
Q1 53 32 0.56 0.281Q2 33 66 0.688 0.344Q3 51 48 1 0.5Q4 91 71 1 0.5Q5 31 68 0.46 0.203
�Direction of the one sided test is determined by the sign of the largest W value, highlighted in blue.
P-Values
W-W+Question
Pratt-Wilcoxon Signed Rank Test: Pre vs Post Survey Call Characteristic Influence

29
Figure 2: Pre- and post-survey agreement ratings. Percentages are rounded to the nearest whole number.
These results indicate that there is some change in the agreement reported by participants
for these statements. The Pratt-Wilcoxon signed-rank test was performed on questions 6-7 to
examine the difference in agreement from the pre-survey to the post-survey, the p-values are
reported in Table 6. For Q6, at a 0.05 level of significance and with a sample of 19 pairs of
differences, we reject H0 in favor of the alternative which states the difference in agreement
between the pre-survey and the post survey is negative and that overall agreement with the
statement increased. Similarly, for Q7, at a 0.10 level of significance and with a sample of 19 pairs
of differences, we reject H0 in favor of the alternative which states the difference in agreement
between the pre-survey and the post survey is negative and that overall agreement with the
statement increased.
Table 6: Signed rank test results for survey questions 6-7, where * is significant at 0.05 and ** at 0.10.
5%
16%
5%
26%
32%
21%
32%
21%
42%
68%
42%
37%
26%
11%
16%
0 5 10 15
Q9
Q8
Q7
Q6
Agreement Rating Post-Survey Summary
Strongly Disagree Disagree Neutral Agree Strongly Agree
5%
16%
21%
42%
26%
26%
32%
16%
16%
0 5 10 15
Q9
Q8
Q7
Q6
Agreement Rating Pre-Survey Summary
Strongly Disagree Disagree Neutral Agree Strongly Agree
Two-Sided Directional�
Q6 14.5 109.5 0.055** 0.027*Q7 16 83 0.188 0.094**
�Direction of the one sided test is determined by the sign of the largest W value, highlighted in blue.
W+ W-
P-Values
Question
Pratt-Wilcoxon Signed Rank Test: Pre vs Post Survey Likert Agreement Rating

30
5.4 Emergency Management Routing Results: Dispatch to the Rescue
Dispatch to the Rescue is comprised of 3 steps. As previously mentioned, in step 1 only unlabeled
verified data is revealed, in step 2 unlabeled verified and unverified data is revealed, and in step 3
labeled verified and unverified data is revealed. This enforces that in step 1 players employ the
TRAD strategy, that in step 2 they employ the ALL strategy, and that in step 3 they employ their
choice of either the TRAD, PLAY, or ALL strategy.
Routing results were collected from a total of 20 emergency response personnel. For each
of these individuals, the routes they created in steps 1-3 were evaluated across six unique 𝜆 values
for lives saved, distance traveled per accurate visit, and unverified points visited. Out of the 20
individuals, only 2 had routes whose averages across all six 𝜆 values saved more lives and traveled
less distance units per accurate visit when employing the TRAD strategy, in step 1, instead of the
ALL strategy, in step 2. Only 1 individual had routes whose averages saved more lives and traveled
less distance units per accurate visit in step 1 than in step 3. Furthermore, only 1 individual had
routes who on average included more unverified points in step 3 than in step 2.
Table 7 shows the average lives saved, average distance traveled per accurate visit, and average
unverified visits in steps 1, 2, and 3 for each 𝜆 value. The final row of Table 7 reports the summary
results over all participants and 𝜆 values.
Table 7: Routing averages for each λ. The final row, in blue, shows the averages of each individuals average across all λ’s.
Step 1 Step 2 Step 3 Step 1 Step 2 Step 3 Step 1 Step 2 Step 30 14.85 13.60 14.25 6.48 7.19 6.84
0.2 14.85 15.42 15.80 6.48 6.33 6.160.4 14.85 16.14 16.25 6.48 6.05 6.000.6 14.85 17.92 17.75 6.48 5.44 5.500.8 14.85 18.75 18.47 6.48 5.20 5.291 14.85 20.50 19.90 6.48 4.76 4.92
Avg λ 14.85 17.06 17.07 6.48 5.72 5.71
λAverage Distance per Accurate Visit
Routing Result AveragesAverage Lives Saved Average Unverified Visited
5.706.950.00

31
From the summary row of Table 7 it can be observed that step 2, on average, saves more
lives and travels less distance per accurate visit than step 1. Because step 2 enforces the application
of the ALL strategy and step 1 enforces the application of the TRAD strategy, the results for these
steps were used to conduct paired-samples t-tests. The first set of t-tests compared the lives saved
in step 1 and step 2 and the second compared the average distance traveled per accurate visit in
step 1 and step 2. The p-values for the first set of tests, shown in Table 8, indicate that for 𝜆 =
{0.4, 0.6, 0.8, 1}, at a 0.05 level of significance and with a sample of 20 pairs of differences, we
reject H0 in favor of the alternative which states the difference in lives saved between step 1 and
step 2 is negative. This suggests that for 𝜆 = {0.4, 0.6, 0.8, 1} the overall number of lives saved
increased when employing the ALL strategy. For 𝜆 = 0, at a 0.05 level of significance and with a
sample of 20 pairs of differences, we reject H0 in favor of the alternative which states the
difference in lives saved between step 1 and step 2 is positive, suggesting that the overall number
of lives saved decreased when employing the ALL strategy. Additionally, the p-values for the
second set of tests, shown in Table 8, indicate that for 𝜆 = {0.4, 0.6, 0.8, 1}, at a 0.05 level of
significance and with a sample of 20 pairs of differences, we reject H0 in favor of the alternative
which states the difference in average distance traveled per accurate visit between step 1 and step
2 is positive. These results suggest that for 𝜆 = {0.4, 0.6, 0.8, 1} the average distance traveled per
accurate visit decreased when employing the ALL strategy. For 𝜆 = 0, at a 0.05 level of
significance and with a sample of 20 pairs of differences, we reject H0 in favor of the alternative
which states the difference in average distance traveled per accurate visit between step 1 and step
2 is negative, suggesting that the average distance traveled per accurate visit increased when
employing the ALL strategy. The results from the first and second set of tests reveal that, for 𝜆 =

32
{0.4, 0.6, 0.8, 1}, employing the ALL strategy instead of the TRAD strategy allows players to more
effectively utilize resources and save more lives.
Table 8: Paired t-test for lives saved & distance traveled per accurate visit by the TRAD & ALL strategy, * is significant at 0.05.
Similarly, it can also be observed from the summary row in Table 7 that step 3, on average,
saves more lives and travels less distance per accurate visit than step 1. However, because step 3
allows players to choose whether to employ the ALL, TRAD, or PLAY strategy, results from step 3
cannot be used to compare a specific strategy against the TRAD strategy documented by step 1.
Instead of utilizing the results from steps 1 and 3 to compare specific strategies, the results were
used to run two sets of t-tests to, respectively, compare the impact that revealing unverified demand
locations/social media posts had on lives saved and distance traveled per accurate visit. The p-
values for the first set of tests, shown in Table 9, indicate that for all 𝜆 = {0.2, 0.4, 0.6, 0.8, 1}, at
a 0.05 level of significance and with a sample of 20 pairs of differences, we reject H0 in favor of
D=L1-L2
Two-Sided Directional�
λ=0 1.250 1.743 0.390 3.206 19 0.005* 0.002*λ=0.2 -0.570 1.820 0.407 -1.401 19 0.177 0.089**λ=0.4 -1.290 1.759 0.393 -3.281 19 0.004* 0.002*λ=0.6 -3.070 1.823 0.408 -7.531 19 4.06E-07* 2.03E-08*λ=0.8 -3.900 1.902 0.425 -9.168 19 2.09E-08* 1.05E-08*λ=1 -5.650 2.059 0.460 -12.272 19 1.77E-10* 8.87E-11*
Avg λ -2.205 1.818 0.407 -5.424 19 3.11E-05* 1.56E-05*
D=d1-d2
λ=0 -0.703 1.052 0.235 -2.989 19 0.008* 0.004*λ=0.2 0.158 0.911 0.204 0.775 19 0.448 0.224
λ=0.4 0.436 0.835 0.187 2.338 19 0.030* 0.015*λ=0.6 1.046 0.747 0.167 6.262 19 5.17E-06* 2.58E-06*λ=0.8 1.285 0.728 0.163 7.898 19 2.03E-07* 1.01E-07*λ=1 1.728 0.681 0.152 11.353 19 6.57E-10* 3.28E-10*
Avg λ 0.767 0.794 0.178 4.315 19 3.73E-04* 1.87E-04*�
Direction of the one sided test is determined by the sign of the mean of the paired differences, μD.
Paired T-Test: Lives Saved in Step 1 (L1) vs Step 2 (L2) by λ
Paired T-Test: Distance per Accurate Visit in Step 1 (d1) vs Step 2 (d2) by λ
Pairs
(D)
Paired Differences
t df
P-ValuesMean
(μD)
Std.
Deviation
Std.
Error

33
the alternative which states the difference in lives saved between step 1 and step 3 is negative. This
suggests that for 𝜆 = {0.2, 0.4, 0.6, 0.8, 1} the overall number of lives saved increased when
unverified demand locations/social media posts were revealed. For 𝜆 = 0, at a 0.05 level of
significance and with a sample of 20 pairs of differences, we reject H0 in favor of the alternative
which states the difference in lives saved between step 1 and step 3 is positive and that the overall
number of lives saved decreased when unverified demand locations/social media posts were
revealed. The p-values for the second set of tests, show that for all 𝜆 = {0.2, 0.4, 0.6, 0.8, 1}, at a
0.05 level of significance and with a sample of 20 pairs of differences, we reject H0 in favor of the
alternative which states the difference in average distance traveled per accurate visit between step
1 and step 3 is positive, suggesting that for 𝜆 = {0.2, 0.4, 0.6, 0.8, 1} the average distance traveled
per accurate visit decreased when unverified demand locations/social media posts were revealed.
For 𝜆 = 0, at a 0.05 level of significance and with a sample of 20 pairs of differences, we reject
H0 in favor of the alternative which states the difference in average distance traveled per accurate
visit between step 1 and step 3 is positive and that the average distance traveled per accurate visit
increased when unverified demand locations/social media posts were revealed. The
aforementioned results reveal that, for 𝜆 = {0.2, 0.4, 0.6, 0.8, 1}, choosing to reveal rather than
conceal unverified demand locations/ social media posts allows players to more effectively utilize
resources and save more lives.
34
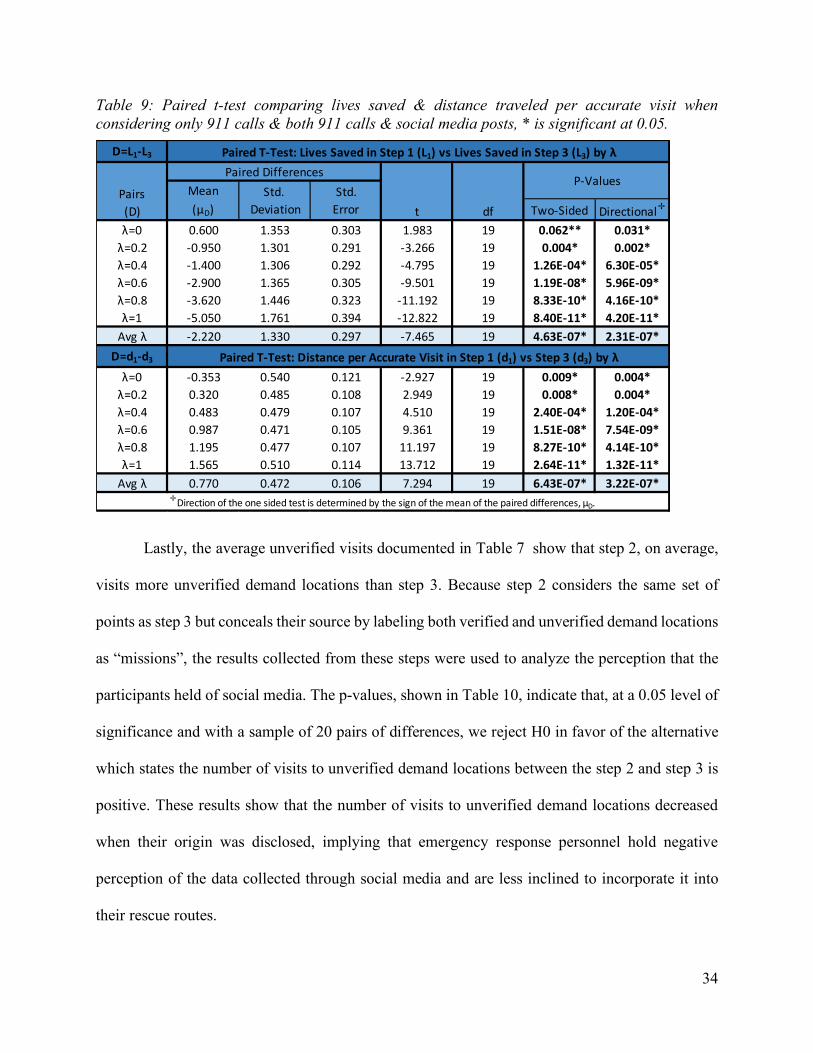
Table 9: Paired t-test comparing lives saved & distance traveled per accurate visit when considering only 911 calls & both 911 calls & social media posts, * is significant at 0.05.
Lastly, the average unverified visits documented in Table 7 show that step 2, on average,
visits more unverified demand locations than step 3. Because step 2 considers the same set of
points as step 3 but conceals their source by labeling both verified and unverified demand locations
as “missions”, the results collected from these steps were used to analyze the perception that the
participants held of social media. The p-values, shown in Table 10, indicate that, at a 0.05 level of
significance and with a sample of 20 pairs of differences, we reject H0 in favor of the alternative
which states the number of visits to unverified demand locations between the step 2 and step 3 is
positive. These results show that the number of visits to unverified demand locations decreased
when their origin was disclosed, implying that emergency response personnel hold negative
perception of the data collected through social media and are less inclined to incorporate it into
their rescue routes.
D=L1-L3
Two-Sided Directional�
λ=0 0.600 1.353 0.303 1.983 19 0.062** 0.031*λ=0.2 -0.950 1.301 0.291 -3.266 19 0.004* 0.002*λ=0.4 -1.400 1.306 0.292 -4.795 19 1.26E-04* 6.30E-05*λ=0.6 -2.900 1.365 0.305 -9.501 19 1.19E-08* 5.96E-09*λ=0.8 -3.620 1.446 0.323 -11.192 19 8.33E-10* 4.16E-10*λ=1 -5.050 1.761 0.394 -12.822 19 8.40E-11* 4.20E-11*
Avg λ -2.220 1.330 0.297 -7.465 19 4.63E-07* 2.31E-07*
D=d1-d3
λ=0 -0.353 0.540 0.121 -2.927 19 0.009* 0.004*λ=0.2 0.320 0.485 0.108 2.949 19 0.008* 0.004*λ=0.4 0.483 0.479 0.107 4.510 19 2.40E-04* 1.20E-04*λ=0.6 0.987 0.471 0.105 9.361 19 1.51E-08* 7.54E-09*λ=0.8 1.195 0.477 0.107 11.197 19 8.27E-10* 4.14E-10*λ=1 1.565 0.510 0.114 13.712 19 2.64E-11* 1.32E-11*
Avg λ 0.770 0.472 0.106 7.294 19 6.43E-07* 3.22E-07*
Pairs(D)
Paired Differences
t df
P-ValuesMean
(μD)Std.
DeviationStd.
Error
Paired T-Test: Lives Saved in Step 1 (L1) vs Lives Saved in Step 3 (L3) by λ
Paired T-Test: Distance per Accurate Visit in Step 1 (d1) vs Step 3 (d3) by λ
�Direction of the one sided test is determined by the sign of the mean of the paired differences, μD.

35
Table 10: Paired t-test comparing number of unverified/social media demand locations visited when demand location source was unknown and when it was known, * is significant at 0.05.
6. Conclusion
Surveys distributed to the general public by The American Red Cross reveal that 80% of
respondents expect emergency managers to monitor social sites, 20% of respondents would turn
to an online channel if unable to reach 911, and over 30% expect responders to arrive within 60
minutes of posting a rescue request to a social media platform (The American Red Cross, 2011).
In contrast, a survey distributed to emergency personnel by NEMA revealed that over 75% of
respondents would not consider unverified social media data unless it could be corroborated by a
trusted source (Su et al., 2013). The results documented by these surveys suggest that the general
public’s perception of current emergency procedures and the actual emergency procedures
followed by emergency personnel do not align. As previously mentioned, current verification
methods can take days to conduct, thus, any miscommunication concerning disaster procedures
between the public and officials can have life threatening implications. The vital discrepancy
between civilian expectation and official procedure motivated us to educate the public in regard to
standard S.A.R procedures and to, within the emergency response community, promote the
exploration of avenues in which standard S.A.R procedures may be improved upon. Logistics to
the Rescue allows its students to contend with the trade-offs between incorporating
unverified/social media demand locations, saving the maximal number of lives, and effectively
utilizing limited resources. Dispatch to the Rescue provides emergency response personnel a
Two-Sided Directional�
Pair 1 1.25 1.293 0.289 4.324 19 3.65E-04* 1.83E-04*t df
P-ValuesMean
(μD)
Std. Deviation
Std. Error
Pairs:
D=S2-S3
Paired Differences
Paired T-Test: Social Media Posts Visited in Step 2 (S2) vs Social Media Posts Visited in Step 3 (S3)
�Direction of the one sided test is determined by the sign of the mean of the paired differences, μD.

36
liability free way of comparing the outcome of routes created with and without unverified/social
media demand locations.
The contributions of the games presented in this thesis are three-fold. As shown in Figure
3, Logistics to the Rescue contributes to the K-12 literature by utilizing specialized tactics, such as
highlighting the intersection of the social sciences and STEM as well as showcasing how
engineering can help save more lives in a disaster, to encourage girls to pursue careers in STEM
fields. Moreover, Dispatch to the Rescue contributes to the expert knowledge elicitation literature
by expanding the repertoire of expert-analyst collaborating methods applied within the domain of
disaster response by extending the application of role-playing games to the field. Lastly, both
games contribute to the disaster routing literature by introducing models which more realistically
simulate the actual decision environment experienced by emergency managers in post-disaster
situation.
Figure 3: Contributions to the literature.
It is our opinion that Dispatch to the Rescue and Logistics to the Rescue can, respectively,
encourage emergency response personnel to consider the exploration of alternative routing
K-12
Edu
catio
n Logistics to the Rescue highlights the intersection of STEM and social science, providing students with an example of how engineers can work towards practices they value. Specifically, showcasing how engineering can be used to save lives in disasters.
By utilizing specialized tactics to engage and attract girls, Logistics to the Rescue has the potential to bridge the gap in the disproportionate percentage of bachelor’s degrees awarded to women vs the percentage of engineering specific bachelor’s degrees awarded to women.
Expe
rt K
now
ledg
e El
icita
tion Dispatch to the Rescue expands the repertoire of expert-analyst collaborating methods which
have been applied in the domain of disaster response.
Dispatch to the Rescue extends the application of role playing games for use in the domain of disaster response.
Disa
ster
Rou
ting
Logistics to the Rescue introduced a more accurate simulation of how decisions and information evolve over time in a post-disaster response by employing an online dynamic planning strategy, in step 4,where players were only allowed to schedule 1 stop at a time and each stop was permanent. New demand points were only revealed at 2 specified time intervals.
Dispatch to the Rescue increased the accuracy of the simulation by employing a similar strategy where new demand points were revealed and players were allowed to re-route only after they had arrived at a previously scheduled stop, which was permanent.

37
methods to improve disaster response operations and educate the next generation on the elementary
concepts of S.A.R.

38
7. Bibliography
Özdamar, L., Ekinci, E., & Küçükyazici, B. (2004). Emergency Logistics Planning in Natural Disasters. Annals of Operations Research, 217-245.
Athanasia, N., & Stavros, P. T. (2015). Twitter as an Instrument for Crisis Response: The Typhoon Haiyan Case. Proceedings of the ISCRAM 2015 Conference.
Baker, J. (2016, January 24). 2016 Nepal earthquake: People turn to social media for help updates . Retrieved January 2018, from Straits Times: http://www.straitstimes.com/asia/south-asia/nepal-earthquake-people-turn-to-social-media-for-help-updates
Barreteau, O., Page, C. L., & Perez., P. (2007). Contribution of simulation and gaming to natural resource management issues: An introduction. Simulation & Gaming, 185-194.
Brawner, C. E., Camacho, M. M., Lord, S. M., Long, R. A., & Ohland, M. W. (2012). Women in industrial engineering: Stereotypes, persistence, and perspectives. Journal of Engineering Education, 101(2), 288-318.
Cohen, S. (2013, March 7). Sandy Marked a Shift for Social Media Use in Disasters. Retrieved from Govtech: https://www.govtech.com/em/disaster/Sandy-Social-Media-Use-in-Disasters.html
Council, Y. (2012, November 8). In the Eye of The Storm, Entrepreneurs Band Together. Retrieved January 2018, from Forbes: http://www.forbes.com/sites/theyec/2012/11/08/in-the-eye-of-the-storm-entrepreneurs-band-together/
Godfrey, E. (2007). Cultures within cultures: Welcoming or unwelcoming for women? ASEE Annual Conference. Honolulu.
Golden, B., Levy, L., & Vohra, R. (1987). The orienteering problem. Naval Research Logistics (NRL), 307-318.
Houston, J., Hawthorne, J., Perreault, M., Park, E., Goldstein Hode, M., Halliwell, M., . . . Griffith, S. (2015). Social media and disasters: a functional framework for social media use in disaster planning, response, and research. Disasters, 1-22.
Hsueh, C.-F., Huey-Kuo, C., & Huey-Wen, C. (2008). Dynamic vehicle routing for relief logistics in natural disasters. In The Vehice Routing Problem. InTechOpen.
International Federation of Red Cross and Red Crescent Societies. (2000, June). Introduction to Disaster Preparedness. Retrieved from IFRC: https://www.ifrc.org/Global/Publications/disasters/all.pdf
James, T. (2016, September 11). Disaster Assessment – As Easy As 1-2-3. Retrieved January 2018, from The Red Cross: http://www.redcross.org/news/article/local/louisiana/programs/Disaster-Assessment-As-Easy-As-1-2-3

39
Juran, J. M. (1988). Juran on Planning for Quality. Collier Macmillan.
Kirac, E., & & Milburn, A. B. (2018). A general framework for assessing the value of social data for disaster response logistics planning. European Journal of Operational Research, 486-500.
Kirac, E., & Milburn, A. (2015). Uncertain Social Media Information with Application in Multi-Objective Disaster Relief Tour Planning. IIE Annual Conference Proc. Institute of Industrial and Systems Engineers (IISE).
Kirac, E., Milburn, A., & Wardell, C. (2013). How social media can aid disaster relief routing plans. Proc. of the International Institute of Industrial Engineers Conference.
Klein, G. A., Calderwood, R., & Macgregor, D. (1989). Critical decision method for eliciting knowledge. IEEE Transactions on systems, man, and cybernetics, 462-472.
Luis, E., Dolinskaya, I. S., & Smilowitz, K. R. (2012). Disaster relief routing: Integrating research and practice. Socio-economic planning sciences, 88-97.
Mackenzie, D. (2013, November 12). Social media helps aid efforts after typhoon Haiyan. Retrieved January 2018, from New Scientist: https://www.newscientist.com/article/dn24565-social-media-helps-aid-efforts-after-typhoon-haiyan/
MacMillan, D. (2017, September 11). In Irma Emergency Responders' New Tools: Twitter and Facebook. Retrieved January 2018, from The Wall Street Journal: https://www.wsj.com/articles/for-hurricane-irma-information-officials-post-on-social-media-1505149661
Mguis, F., Zidi, K., Ghedira, K., & Borne, P. (2012). Distributed approach for vehicle routing problem in disaster case. IFAC Proceedings Volumes, 353-359.
Milburn, A., & Mullin, E. (2018). Disaster Response Routing with Social Data in Stylized Demand Scenarios. IIE Annual Conference Proc. Institute of Industrial and Systems Engineers.
Moore, C. J., & Miles, J. C. (1991). Knowledge elicitation using more than one expert to cover the same domain. Artificial Intelligence Review, 255-271.
Najafi, M., Eshghi, K., & Sander, D. L. (2014). A dynamic dispatching and routing model to plan/re-plan logistics activities in response to an earthquake. OR Spectrum, 323-356.
National Academy of Engineering. (2008). Changing the conversation: Messages for improving public understanding of engineering. . Washington: National Academies Press.
National Center for Science and Engineering Statistics. (2017). Women, Minorities, and Persons with Disabilities in Science and Engineering . Arlington: National Science Foundation.

40
Okechukwu Okoli, J., Weller, G., & Watt, J. (2014). Eliciting experts’ knowledge in emergency response organizations. International Journal of Emergency Services, 118-130.
Plotnick, L., & Hiltz, S. R. (2016). Barriers to use of social media by emergency managers. Journal of Homeland Security and Emergency Management, 247-277.
Qin, J., Ye, Y., Cheng, B., Zhao, X., & Ni, L. (2017). The emergency vehicle routing problem with uncertain demand under sustainability environments. Sustainability.
Schiuma, G., Gavrilova, T., & Andreeva, T. (2012). Knowledge elicitation techniques in a knowledge management context. Journal of Knowledge Management.
Shen Z., O. F., & Dessouky, M. (2009). The Stochastic Vehicle Routing Problem for Minimum Unmet Demand. In Optimization and logistics challenges in the enterprise (pp. 349-371). Boston, MA: Springer.
Su, Y., Wardell, C., & Thorkildsen, Z. (2013). Social media in the emergency management field: 2012 survey results. CNA Analysis and Solutions.
Sullivan, K., & Holley, P. (2017, September 2). Texans' do-it-ourselves rescue effort defines Hurricane Harvey. Retrieved January 2018, from The Washington Post: https://www.washingtonpost.com/national/texans-do-it-ourselves-rescue-effort-defines-hurricane-harvey/2017/09/02/f41bb8ee-8f2f-11e7-8df5-c2e5cf46c1e2_story.html?utm_term=.27584c16644e
Tapia, A. H., & Moore, K. (2014). Good enough is good enough: Overcoming disaster response organizations’ slow social media data adoption. Computer supported cooperative work (CSCW), 483-512.
The American Red Cross. (2011). Disaster Services Program Review. Retrieved from Red Cross: https://www.redcross.org/content/dam/redcross/atg/PDF_s/Publications/Annual_Reports/Disaster-Relief-Program-Review-2011.pdf
Tsiligirides, T. (1984). Heuristic methods applied to orienteering. Journal of the Operational Research Society, 797-809.
Van Wassenhove, L. (2006). Humanitarian aid logistics: supply chain management in high gear. Journal of the Operational Research Society, 57(5), 475-489.
Wex, F., Schryen, G., Feuerriegel, S., & Neumann, D. (2014). Emergency response in natural disaster management: Allocation and scheduling of rescue units. European Journal of Operational Research, 697-708.

41
8. Appendix