contribution of ntpc to uttar pradesh n.k.srivasatava gm-r&m/es ntpc-noida...
TRANSCRIPT

Contribution of NTPC to
Uttar Pradesh
N.K.SrivasatavaGM-R&M/ESNTPC-Noida
1986-871986-87
1991-921991-92
1996-971996-97
2001-022001-02
19935 MW19935 MW
2006-072006-07 2032
2032
128000 MW128000 MW27404 MW
27404 MW
16795 MW16795 MW
3100 MW3100 MW
11333 MW11333 MW 33194 MW
33194 MW
TodayToday
1

2
NTPC has evolved as a leading integrated power player
1975197519821982
1990199019971997
20022002
20042004
20052005
20072007
20092009
Set up with 100% ownership by GOI
Initiated strategic diversification by
foraying into Equipment
manufacturing
First 200 MW unit at Singrauli commissioned
GOI conferred status of
“Navratna”
NTPC’s installed capacity exceeds 20,000 MW
Rechristened as “NTPC Limited” in line with diversifications
NTPC installed capacity crosses
30,000 MW mark
Listed on Indian stock exchanges
GoI disinvests another 5% stake
Coal Mining Block allocated
20032003
Commenced construction of first
hydro-electric power project
NTPC builds up a total installed capacity of 10,000 MW
20102010
Growth of NTPCGrowth of NTPC First CPSE to be granted ‘Maharatna’ status

• Current Operating Capacity–35,354 MW (Including JV of 3,864 MW)
• 20 Coal Based and 8 Gas Based operating Power stations
• 15,740 MW Under Construction (includes hydro) in 15 projects
• More than 30,000 MW under various stages of development (under
bidding / FR finalized).
• Largest generator in India with a share of 28.6%.
• One of the largest Indian companies with market cap of over Rs.
160,000 Crores
• Net worth of over Rs. 62,000 Crore (FY-10)
• Total Assets of over Rs. 112,000 Crore (FY-10)
3
NTPC TodayNTPC Today
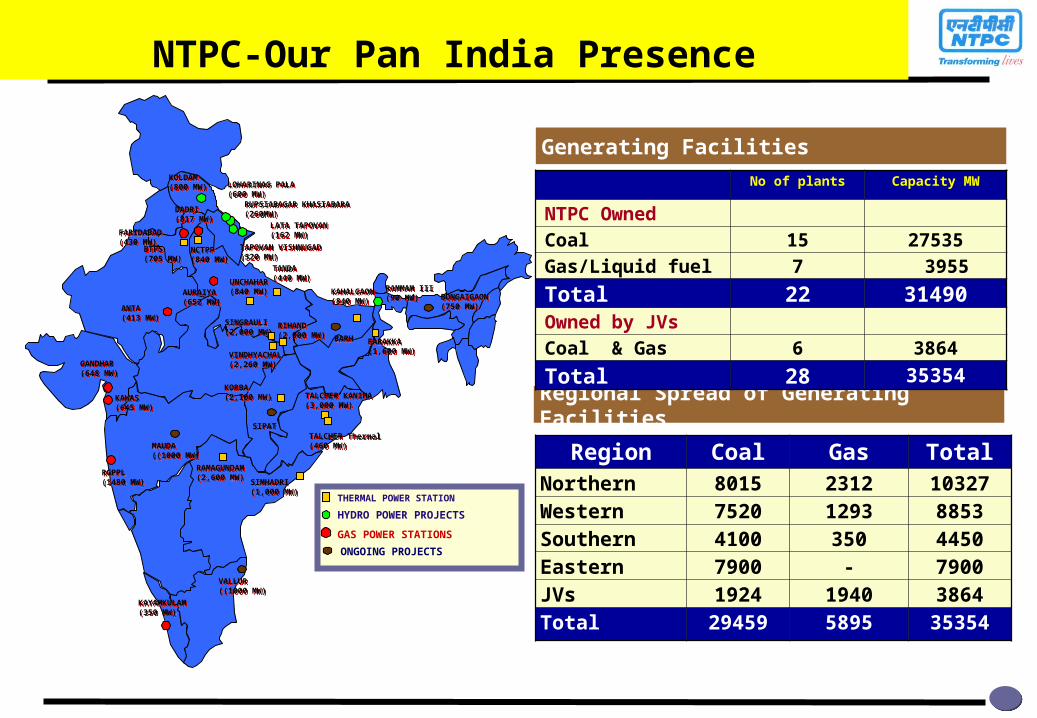
Region Coal Gas TotalNorthern 8015 2312 10327
Western 7520 1293 8853
Southern 4100 350 4450
Eastern 7900 - 7900
JVs 1924 1940 3864
Total 29459 5895 35354
RIHAND(2,000 MW)RIHAND(2,000 MW)
SINGRAULI(2,000 MW)SINGRAULI(2,000 MW)
FARIDABAD(430 MW)FARIDABAD(430 MW)
DADRI(817 MW)DADRI(817 MW)
NCTPP(840 MW)NCTPP(840 MW)
ANTA(413 MW)ANTA(413 MW)
AURAIYA(652 MW)AURAIYA(652 MW)
UNCHAHAR(840 MW)UNCHAHAR(840 MW)
TANDA(440 MW)TANDA(440 MW)
KAHALGAON(840 MW)KAHALGAON(840 MW)
FARAKKA(1,600 MW)FARAKKA(1,600 MW)
KORBA(2,100 MW)KORBA(2,100 MW)
VINDHYACHAL(2,260 MW)VINDHYACHAL(2,260 MW)GANDHAR
(648 MW)GANDHAR(648 MW)
KAWAS(645 MW)KAWAS(645 MW)
TALCHER KANIHA(3,000 MW)TALCHER KANIHA(3,000 MW)
RAMAGUNDAM(2,600 MW)RAMAGUNDAM(2,600 MW)
SIMHADRI(1,000 MW)SIMHADRI(1,000 MW)
KAYAMKULAM(350 MW)KAYAMKULAM(350 MW)
TALCHER Thermal(460 MW)TALCHER Thermal(460 MW)
KOLDAM(800 MW)KOLDAM(800 MW)
GAS POWER STATIONS
THERMAL POWER STATION
HYDRO POWER PROJECTS
TAPOVAN VISHNUGAD(520 MW)TAPOVAN VISHNUGAD(520 MW)
RAMMAM III(90 MW)RAMMAM III(90 MW)
LOHARINAG PALA(600 MW)LOHARINAG PALA(600 MW)
LATA TAPOVAN(162 MW)LATA TAPOVAN(162 MW)
RUPSIABAGAR KHASIABARA(260MW)RUPSIABAGAR KHASIABARA(260MW)
ONGOING PROJECTS
SIPATSIPAT
BARHBARH
BTPS(705 MW)BTPS(705 MW)
Regional Spread of Generating Facilities
No of plants Capacity MW
NTPC Owned
Coal 15 27535
Gas/Liquid fuel 7 3955
Total 22 31490Owned by JVs
Coal & Gas 6 3864
Total 28 35354
BONGAIGAON(750 MW)BONGAIGAON(750 MW)
VALLUR((1000 MW)VALLUR((1000 MW)
MAUDA((1000 MW)MAUDA((1000 MW)
RGPPL(1480 MW)RGPPL(1480 MW)
NTPC-Our Pan India Presence
Generating Facilities
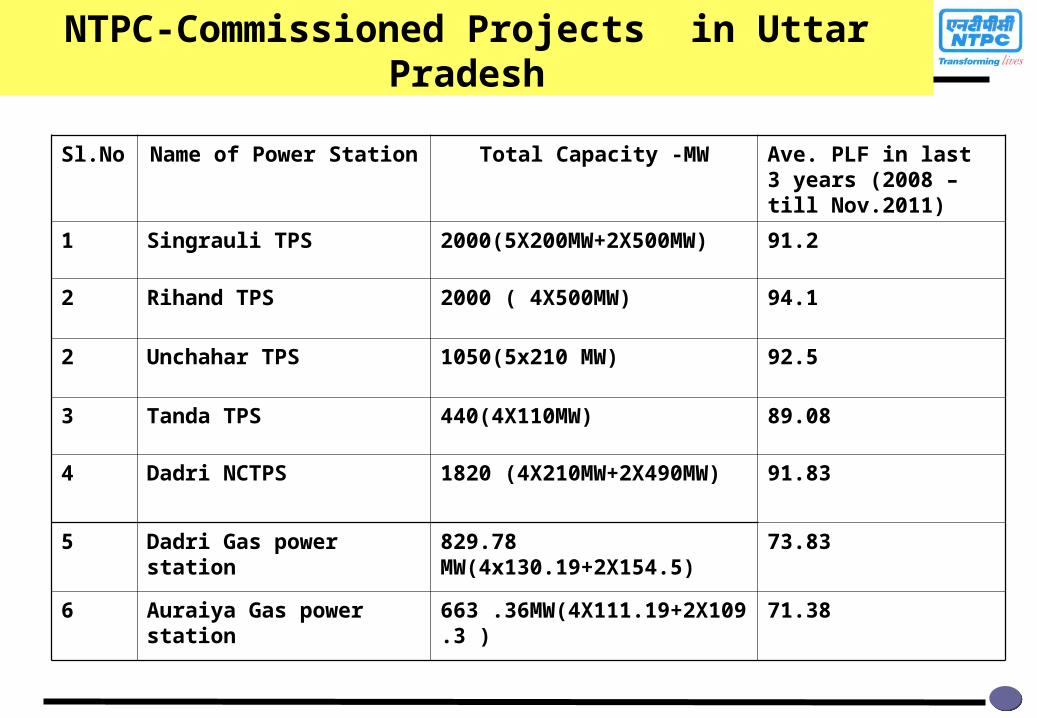
NTPC-Commissioned Projects in Uttar Pradesh
Sl.No Name of Power Station Total Capacity -MW Ave. PLF in last 3 years (2008 –till Nov.2011)
1 Singrauli TPS 2000(5X200MW+2X500MW) 91.2
2 Rihand TPS 2000 ( 4X500MW) 94.1
2 Unchahar TPS 1050(5x210 MW) 92.5
3 Tanda TPS 440(4X110MW) 89.08
4 Dadri NCTPS 1820 (4X210MW+2X490MW) 91.83
5 Dadri Gas power station 829.78 MW(4x130.19+2X154.5) 73.83
6 Auraiya Gas power station 663 .36MW(4X111.19+2X109.3 ) 71.38

NTPC-Upcoming Projects in Uttar Pradesh
Sl.No Name of Power Station Total Capacity -MW
1 Tanda Stage-II TPS 1320(2X660MW)
2 Bilhaur TPS 1320(2x660 MW)
3 Unchahar Stage-V TPS 500 (1X500MW)
4 Rihand TPS 1000( 2X500MW)
5 MEJA ( JV) 1320(2X660MW)

INTRODUCTION OF TANDA TPS Tanda Thermal Power Station (4 X 110 MW) was
commissioned in the years 1988-90 by UPSEB. The Plant was taken over by NTPC in Jan 2000 These units were supplied by BHEL The operating history of the unit is as below
Unit No Date of Commissioning
Date of Commercial operation
Running Hours up to12 / 99
No. of Tripping
No. of Tripping/ 1000 Hrs
1 21/03/88 01/01/90 37269 1957 52.51
2 11/03/89 01/04/91 38678 1670 43.18
3 28/03/90 01/10/93 30238 1359 44.95
4 20/02/98 01/07/98 9281 426 45.90

PRE-R&M PERFORMANCE OF TANDA TPS
Year PLF (%) Availability (%) Partial Loading
94-95 26.72 42.34 36.88
95-96 35.36 51.43 31.25
96-97 37.19 57.83 35.52
97-98 31.21 48.25 35.32
98-99 33.49 51.38 34.71
99-00 21.59 37.89 43.16

PRE-R&M CONDITION/PROBLEMS
Need for R&Mo As seen above, the number of tripping of the units was abnormally high,
which resulted in deterioration in the condition of the turbine & generator. The PLF of the station never crossed 38% and the specific oil consumption was very high.
o Besides, there were a number of major problems in the units which are listed below:
Problem in Boiler areao Extensive corrosion inside boiler tubes in all units due to poor water
chemistry resulting in frequent tube leakages. o E & F coal mills in all units were not available. Other mills were in very bad
condition. Units required continuous oil support.o Secondary air damper control (SADC) & burner tilt were inoperative.o Most of the control valves were passing.

R&M OF TANDA THERMAL POWER PLANT
o Bottom ash handling system totally inoperativeo All wall de-slaggers and air pre-heater soot blowers were
out of service.o APH baskets were heavily choked, ID fan impellers were
eroded.o Only 3 to 5 fields were available in each ESP.
Turbine Areao Heavy scaling and leakages in the condenser of unit 1, 2 &
4. Poor condenser Vacuum (-0.58 to -0.6 Kg/cm2) causing low load operation.
o Only 5 out of 28 CT fans were available.o HP heaters were not available in all four units .

R&M OF TANDA THERMAL POWER PLANT
Electrical Systems:• Obsolete switchgear.• Unreliable line protection and inaccurate energy
meters• Design deficiency in Generator rotors • Failures in insulating cylinders below the retaining
rings in Unit#2 & 3.
Control & Instrumentation:• Obsolete & Unreliable C&I system.• UPS not provided in unit # 1, 2 & 3.
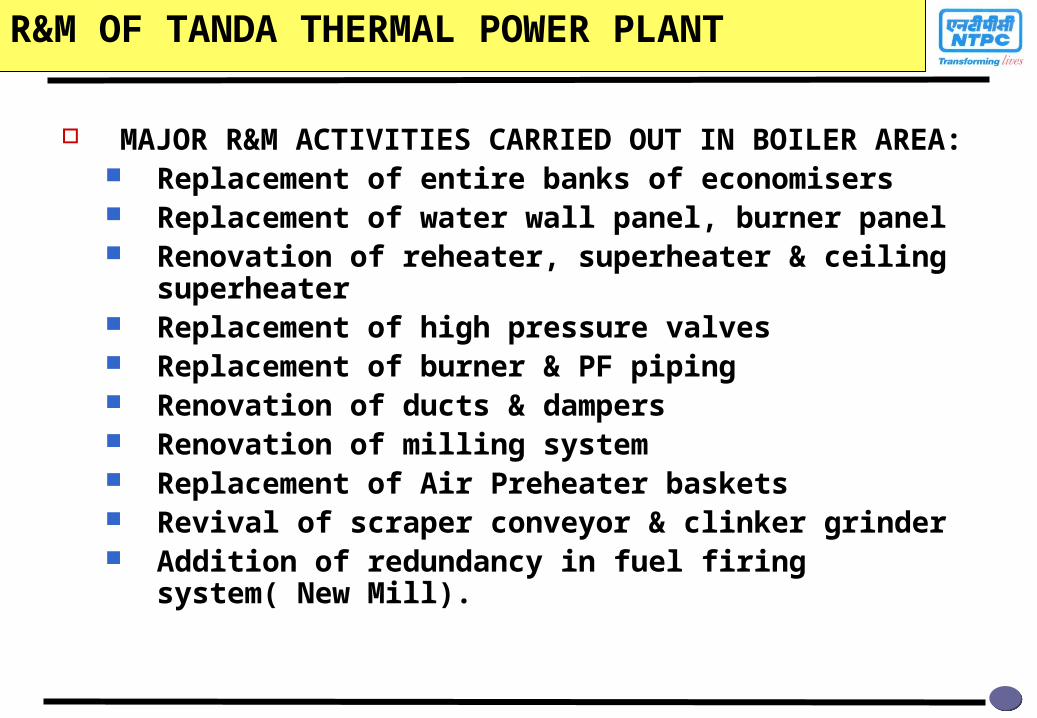
R&M OF TANDA THERMAL POWER PLANT
MAJOR R&M ACTIVITIES CARRIED OUT IN BOILER AREA:
Replacement of entire banks of economisers Replacement of water wall panel, burner panel Renovation of reheater, superheater & ceiling superheater Replacement of high pressure valves Replacement of burner & PF piping Renovation of ducts & dampers Renovation of milling system Replacement of Air Preheater baskets Revival of scraper conveyor & clinker grinder Addition of redundancy in fuel firing system( New Mill).

R&M OF TANDA THERMAL POWER PLANT
Turbine & auxiliaries: Complete replacement of condenser tubes Renovation / restoration of HP/LP bypass system Renovation of BFP & condensate booster pump Renovation of 11 & 6 ata Auxiliary Steam Headers Commissioning of CT fans
Electrical and C&I: Installation of Digital Voltage Regulator Replacement of 220 V battery bank Restoration of protection system of 6.6 KV system Renovation of HT/LT switchgear Revival of Unit-3 C&I system including new DDC controls Re-commissioning of auto loops Replacement of turbo-supervisory instruments

R&M OF TANDA THERMAL POWER PLANT
Technology Improvement To improve performance and operational flexibility, technology up-gradation
is necessary for a number of systems. The following activities are being carried out under this head:
Introduction of DDCIMS & DAS Modernisation of Turbine Governing system. Introduction of PLC Based Control System in CHP Event Logger & GPS for EHV Equipments Disturbance Recorder for Outgoing Lines
Environment & Statutory Requirement To meet the environmental standards the following activities have been
undertaken: Retrofitting of ESP. Raising of Ash Pond Installation of CO, Sox & Nox Analyzers Installation of Autoclave for Hospital Waste Revamping of Sewerage System Installation of Effluent treatment plant.

IMPROVEMENT IN PERFORMANCEYEAR Generation
(MU)PLF (%)
Avaiability (%)
APC (%)
Sp. Oil(ml/Kwh)
Heat Rate(Kcal/Kwh)
2000-01 1190 30.87 52.12 21.33 38.87 3762
2001-02 2101 54.52 73.92 16.1 11.08 3364
2002-03 2219 57.6 67.01 13.84 2.12 3135
2003-04 2911 75.32 83.57 12.81 0.92 2845
2004-05 3318 86.07 90.87 12.00 0.74 2758
2005-06 3330 86.39 87.42 11.88 0.62 2753
2006-07 3512 91.14 90.21 11.34 0.4 2750
Cumulative R&M Expenditure is only 0.69 Cr./MW
Cumulative R&M Expenditure is only 0.69 Cr./MW

Turn Around of NTPC taken over stations Through R&M Interventions

17
POWERING MILLION SMILES