contribution of different components of innate and
TRANSCRIPT

Contribution of different components of innate and
adaptive immunity to severity of flavivirus-induced
encephalitis in susceptible and resistant hosts
RAFIDAH HANIM SHOMIAD SHUEB (B.SC.)
This thesis is presented for the degree of Doctor of Philosophy
April 2008
Discipline of Microbiology, School of Biomedical, Biomolecular and Chemical
Sciences
The University of Western Australia
Perth, Western Australia

STATEMENT
I declare that the work presented in this thesis was conducted by me,
except for intracerebral inoculation which was performed by Dr.
Nadia Urosevic, and the analysis of pathological changes of infected
mouse brains which was done by Prof. Papadimitriou.
………………………………….
Rafidah Hanim Shomiad Shueb

iii
ACKNOWLEDGMENTS
There are people whom I would like to express my deepest gratitude because
without them, this thesis could not be materialised. I will only list their
names here because their immense contribution and assistant is basically
beyond description:
Malaysian Department of Public Services
University of Science Malaysia
Dr. Nadia Urosevic
Dr. Cheryl Johansen
Prof. Geoff Shellam
Prof. John Papadimitriou
Simone Ross
Helen Moulder
Haran, Chris and Lily
Veronica, Giles and Kevin
Juliana and Tobias
Shueb Kaimi (my father) and Zaibah Salim (my mother)
My seven siblings –Anum, Amal, Iqbal, Faiz, Bob, Ali and Ayie
Lazim and my two beautiful kids, Danial and Diyanah.

iv
SUMMARY
Flaviviruses are small, positive-stranded RNA viruses belonging to the family
Flaviviridae. Flavivirus infection in humans could cause diseases ranging from febrile
illnesses to fatal encephalitis. Mice provide a useful small animal model to study
flavivirus-induced encephalitis in humans since mice also develop encephalitis during
flavivirus infection. Some strains of mice have been shown to be resistant to flavivirus
challenge and this resistance is conferred by a single autosomal dominant gene,
designated as Flvr. Recently, OAS1b gene has been identified to be a gene candidate for
Flvr. Several congenic resistant mouse strains have been developed by introducing
resistance genes from outbred or wild mice onto the genetic background of susceptible
C3H mice. These new resistant strains that carry different allelic variants at the Flv
locus include C3H/PRI-Flvr (RV), C3H.MOLD-Flv
mr (MOLD) and C3H.M.domesticus-
Flvr-like (DUB), the latter two being developed in the same laboratory in which the
work described in this thesis was accomplished.
Preliminary studies in this laboratory found that flavivirus resistant mice are vulnerable
to certain flavivirus infections, particularly when challenged by intracerebral (i.c.) route.
Intracerebral (i.c.) challenge with flaviviruses such as West Nile virus (WNV) Sarafend
strain and Kunjin virus (KUNV) MRM16 strain were found to induce high mortality in
flavivirus resistant mice while infection with Murray Valley encephalitis virus (MVEV)
OR2 strain did not cause any apparent disease in the same mice. Based on these
previous findings, this study was designed to further investigate the abrogation of
resistance phenotype expressed in flavivirus resistant DUB mice following infection
with KUNV and to compare a course of infection in resistant versus susceptible mice
with the same virus. Thus, the general aim of this study was to further characterise the
responses of resistant and susceptible mice to KUNV MRM16, to compare these
responses with responses to MVEV OR2 and WNV Sarafend infection and to identify
factors that are associated with a disease development in susceptible and resistant hosts.
Genetic background of the mice and route of virus infection influence the outcome of
infection and because of these, KUNV, MVEV and WNV have different virulence
properties in susceptible and resistant mice. KUNV exhibited low neuroinvasiveness in
adult susceptible and resistant mice but was highly neurovirulent in both strains of mice.
MVEV and WNV were highly neuroinvasive and neurovirulent in susceptible mice.

v
However, only WNV was neurovirulent in resistant mice, while MVEV did not cause
any morbidity to resistant mice at any dose or route of inoculation. Alterations of the
host BBB or depletion of immune cells using different reagents were used in this study
resulting in some changes in the outcome of infection.
To examine the pathogenesis of i.c. infection of KUNV and MVEV, the analysis of
brain histopathology and inflammatory cell infiltrates were performed in both
susceptible HeJ and resistant DUB mice. It was shown in this study that pathogenesis of
KUNV and MVEV was a complex process and the mechanisms involved in susceptible
and resistant mice were different. Several factors including high titres and CD4+ T cells
in the brain contributed to the severe encephalitis observed in KUNV and MVEV-
infected susceptible mice. In contrast, CD8+ T cells had a protective effect in
susceptible HeJ mice MVEV i.c. challenge.
One of the most important findings in this study was that the host immune response
particularly CD8+ T cells and inflammatory mediator, IFNγ, have a strong immuno-
pathological role during lethal i.c. flavivirus infection in the model of flavivirus resistant
mice. This was first time that the immunopathogenic role of T cells in flavivirus
resistant mice was described. The finding is very important as it may provide answer on
the phenomenon seen in the last 50 years regarding the incomplete protection conferred
by the flavivirus resistance gene during certain flavivirus infection in resistant mice.
CD8+ T cells were shown to be the cause of death in resistant DUB mice during i.c.
infection with KUNV as demonstrated by the reduced mortality in mice following T
cells depletion. In contrast, during a non-fatal MVEV infection, T cells were
neuroprotective since the absence of both subsets of T cells, CD4+ and CD8+ T cells,
caused morbidity and mortality in resistant DUB mice infected with MVEV.
Interestingly, T cells were also involved in virus clearance following i.c. infection with
both KUNV and MVEV.
Strong Th1 immune response was induced after KUNV and MVEV i.c. infection in
both susceptible and resistant mice. However, excessive brain IFNγ production at the
time when resistant DUB mice started to exhibit signs of sickness implicated this
cytokine in the development of severe infection of these mice. Using intracellular
labelling of IFNγ, CD8+ T cells were found to be the major producer of this cytokine in
resistant DUB mice. Thus, it can be concluded that CD8+ T cells exerted harmful effect

vi
to resistant DUB mice during KUNV i.c. infection by producing excessive IFNγ that
could be toxic, causing functional loss of the CNS cells.
It was shown from in vitro studies that WNV had the highest tropism for macrophages
and dendritic cells, followed by KUNV. MVEV however did not replicate well in these
cells. This combined with the data from the in vivo studies indicates that macrophages
might be involved in the pathogenesis of intraperitoneal (i.p.) infection of WNV but not
KUNV and MVEV. The reason for this could be that the production of KUNV in
macrophages may not be high enough to induce viraemia and subsequent fatal
encephalitis in mice. In contrast, MVEV appears to use different mechanism or cells for
virus dissemination. Although macrophages may not be involved in KUNV
pathogenesis after i.p. infection, the fact that macrophages support KUNV replication in
vitro may indicate the possibility that blood-borne macrophages were recruited to the
brain where they can get infected with KUNV during i.c. infection and therefore could
participate in KUNV pathogenesis in DUB mice.
This study provides evidence for the first time on the detrimental effect of host antiviral
immunity and inflammatory mediators during flavivirus i.c. infection in resistant mice.
However, it also launches a new question on the selective cell tropism of KUNV versus
MVEV responsible for inducing different pattern of immune responses and
consequently leading to different outcomes of infection in resistant mice.

vii
LIST OF ABBREVIATIONS
ADCC Antibody-dependent cell mediated cytotoxicity
ADE Antibody-dependent enhancement
BAN Banzi virus
BBB Blood brain barrier
BFS Phosphate buffered formalin saline
BRVR Bacteria-resistant-virus-resistant
BRVS Bacteria-resistant-virus-susceptible
C Capsid
oC Degrees Celcius
CaCl2 Calcium chloride
Clodronate Dichloromethylene-biphosphonate
CMI Cell-mediated immunity
cM Centimorgan
CNS Central nervous system
CO2 Carbon dioxide
Con A Concanavalin A
CPE Cytopathic effect
CTL Cytolytic T cells
17D YFV 17D vaccine strain of Yellow fever virus
DAB Diamino methyl benzidine
ddw double distilled water
DEN Dengue
DENV Dengue virus
DHF Dengue haemorrhagic fever
DI Defective interfering
DMSO Dimethyl sulphoxide
DNA Deoxyribonucleic acid
dsRNA double-stranded ribonucleic acid
DTH Delayed-type hypersensitivity
DTT Dithiothreitol
DUB C3H.M.domesticus-Flvr-like
E Envelope

viii
EDTA Ethylenediamine tetra-acetic acid
EMCV Encephalomyocarditis virus
ER Endoplasmic reticulum
FCS Fetal calf serum
g Gram
GAG Glycosaminoglycans
H2O2 Hydrogen peroxide
HA Haemaglutination
HCl Hydrochloric acid
HE Haematoxylin and eosin
He C3H/HeJARC
HeJ C3H/HeJ
HI Haemaglutination inhibition
hr(s) Hour(s)
i.c. intracerebral(ly)
IFN Interferon
IL Interleukin
i.n. intranasal
iNOS inducible nitric oxide synthase
i.p. Intraperitoneal(ly)
I.U. International unit(s)
i.u. infectious unit(s)
i.v. intravenous
JE Japanese encephalitis
JEV Japanese encephalitis virus
kb Kilobases
KCl Potassium chloride
KH2PO4 Potassium dihydrogen orthophosphate
KUN Kunjin
KUNV Kunjin virus
L litre
L929 L929 mouse fibroblast cell line
LPS Lipopolysaccharide
M Molar
MEF Mouse embryo fibroblast

ix
MHC Major histocompatibility class
mg Milligram
mL Millilitre
min Minute(s)
mM Millimolar
MgCl2 Magnesium chloride
MOI Multiplicity of infection
MOLD C3H.MOLD-Flvmr
MRM Mitchell River Mission
mRNA messenger ribonucleic acid
MVE Murray Valley encephalitis
MVEV Murray Valley encephalitis virus
N Neutralising
NaCl Sodium chloride
NaHCO3 Sodium hydrogen carbonate
NaOH Sodium hydroxide
NCR Noncoding region(s)
NCS New born calf serum
NED N-1-napthyethylene diamine dihydrochloride
NGS Normal goat serum
NHS Normal horse serum
NK Natural killer
NO Nitric oxide
NOS Nitric oxide synthase
OAS 2’-5’ oligoadenylate synthetase
OD Optical density
OR Ord River
ORF Open reading frame
PBS Phosphate buffered saline
p.i. Post infection
PRI Princeton-Rockefeller Institute
prM pre-membrane
RER Rough endoplasmic reticulum
RNAse ribonuclease
RF Replicative form

x
RI Replicative intermediate
RNA Ribonucleic acid
rpm rotations per minute
RR Ross river
RSSE Russian spring-summer encephalitis
RT room temperature
RV C3H/PRI-Flvr
rRNA ribosomal ribonucleic acid
s.c. subcutaneous
SDS Sodium dodecyl sulphate
SLEV St. Louis encephalitis virus
ss Single stranded
TBEV Tick-borne encephalitis virus
Tc
Cytotoxic T cells
TCID50 50% tissue culture infectivity dose
TdT Terminal deoxyribonucleotidyl transferase
TMB Tetramethylbenzidine
TNFα Tumor necrosis factor alpha
TUNEL Terminal deoxyribonucleotidyl transferase dUTP nick end
labeling
µg Microgram
µL Microlitre
US United States
UTR Untranslated region
UWA University of Western Australia
Vero African Green Monkey kidney
WN West Nile
WNV West Nile virus
YF Yellow Fever
YFV Yellow fever virus

xi
TABLE OF CONTENTS
1.0 CHAPTER 1: LITERATURE REVIEW ------------------------------ 1
1.1 FLAVIVIRUS IN GENERAL --------------------------------------------------------- 1
1.1.1 HISTORY AND CLASSIFICATION ------------------------------------------ 1
1.1.2 ECOLOGY AND EPIDEMIOLOGY------------------------------------------- 2
1.1.3 MORPHOLOGY ------------------------------------------------------------------- 4
1.1.5 VIRAL PROTEINS --------------------------------------------------------------- 5
1.1.5.1 Structural proteins ----------------------------------------------------------- 6
1.1.5.2 Non-structural proteins ----------------------------------------------------- 7
1.1.6 VIRUS ENTRY AND TRANSLATION --------------------------------------- 8
1.1.7 REPLICATION -------------------------------------------------------------------- 9
1.1.8 VIRUS ASSEMBLY AND RELEASE ---------------------------------------- 10
1.2 PATHOGENESIS OF FLAVIVIRUSES ------------------------------------------ 11
1.2.1 INFECTION IN VERTEBRATE HOSTS ------------------------------------ 12
1.2.2 UP-REGULATION OF HOST CELL SURFACE MOLECULES
UPON FLAVIVIRUS INFECTION ------------------------------------------- 13
1.2.3.1 Nature and properties of the central nervous system ------------------ 14
1.2.3.2 Flavivirus infections in central nervous system------------------------ 17
1.2.4 NEUROINVASIVENESS AND NEUROVIRULENCE ------------------- 18
1.3 IMMUNE RESPONSE AND IMMUNOPATHOLOGY ---------------------- 20
1.3.1 INNATE IMMUNE SYSTEM -------------------------------------------------- 21
1.3.1.1 Macrophages ---------------------------------------------------------------- 21
1.3.1.2 Nitric oxide ------------------------------------------------------------------ 22
1.3.1.3 Natural killer cells ---------------------------------------------------------- 23

xii
1.3.1.4 Neutrophils ------------------------------------------------------------------ 23
1.3.2 ADAPTIVE IMMUNITY ------------------------------------------------------- 24
1.3.2.1 Humoral mediated immunity --------------------------------------------- 25
1.3.2.2 Cell-mediated immunity -------------------------------------------------- 27
1.3.3 SOLUBLE MEDIATORS ------------------------------------------------------- 30
1.4.3.1 Cytokines -------------------------------------------------------------------- 30
1.3.3.1.1 IFN type I ------------------------------------------------------------- 31
1.3.3.1.2 IFNγ ------------------------------------------------------------------- 33
1.3.3.1.3 TNF ------------------------------------------------------------------ 34
1.3.3.2 Chemokines ----------------------------------------------------------------- 35
1.4 GENETIC RESISTANCE TO FLAVIVIRUSES ------------------------------- 36
1.4.1 FLAVIVIRUS RESISTANCE IN HUMANS -------------------------------- 37
1.4.2 FLAVIVIRUS RESISTANCE IN MURINE MODELS -------------------- 37
1.4.2.1 History and development ------------------------------------------------- 37
1.4.2.2 Flavivirus resistance in wild mice --------------------------------------- 38
1.4.2.3 Development of congenic flavivirus mouse resistant strains -------- 39
1.4.2.4 Resistance expression in mice -------------------------------------------- 40
1.4.2.5 Resistance expression in cell culture ------------------------------------ 40
1.4.3 THE MECHANISM OF FLAVIVIRUS RESISTANCE ------------------- 41
1.4.4 ANALYSIS OF GENE CANDIDATE FOR FLAVIVIRUS
RESISTANCE GENE ------------------------------------------------------------ 43
1.4.5 FACTORS INFLUENCING THE HOST INNATE RESISTANCE TO
FLAVIVIRUSES ----------------------------------------------------------------- 44
1.5 AIMS -------------------------------------------------------------------------------------- 46

xiii
2.0 CHAPTER 2: MATERIALS -------------------------------------------- 49
2.1. REAGENTS ---------------------------------------------------------------------------- 49
2.2 CELL CULTURE MATERIALS --------------------------------------------------- 52
2.3 BUFFERS, SOLUTIONS AND MEDIA ------------------------------------------- 53
2.3.1 CELL STUDIES ------------------------------------------------------------------ 53
2.3.1.1 Growth media --------------------------------------------------------------- 53
2.3.1.2 Cell culture solutions ------------------------------------------------------ 54
2.3.2 IMMUNOHISTOCHEMISTRY ------------------------------------------------ 55
2.3.3 FLOW CYTOMETRY ----------------------------------------------------------- 57
2.3.4 CELL ISOLATION -------------------------------------------------------------- 57
2.3.5 ELISA REAGENTS -------------------------------------------------------------- 58
3.0 CHAPTER 3: METHODS ----------------------------------------------- 59
3.1 VIRUSES --------------------------------------------------------------------------------- 59
3.1.1 VIRUS STRAINS ---------------------------------------------------------------- 59
3.1.2 PROPAGATION OF VIRUS STOCKS --------------------------------------- 59
3.2 ANIMAL STUDIES -------------------------------------------------------------------- 60
3.2.1 MOUSE STRAINS --------------------------------------------------------------- 60
3.2.2 VIRUS INOCULATION OF MICE ------------------------------------------- 60
3.2.2.1 Intracerebral inoculation -------------------------------------------------- 60
3.2.2.2 Intraperitoneal inoculation ------------------------------------------------ 61
3.2.2.3 Intranasal inoculation ------------------------------------------------------ 61

xiv
3.3 INOCULATION OF REAGENTS/CELLS INTO MICE ---------------------- 61
3.3.1 THIOGLYCOLLATE ------------------------------------------------------------ 61
3.3.2 LIPOPOLYSACCHARIDE (LPS) --------------------------------------------- 62
3.3.3 SODIUM DODECYL SULPHATE (SDS) ---------------------------------- 62
3.3.4 CD4+ AND CD8 T+ CELLS DEPLETION ---------------------------------- 62
3.4.5 CLODRONATE ------------------------------------------------------------------ 63
3.4 ORGAN EXTRACTION -------------------------------------------------------------- 63
3.4.1 BRAINS ---------------------------------------------------------------------------- 64
3.4.2 PERIPHERAL ORGANS ------------------------------------------------------- 64
3.5 CELL ISOLATION -------------------------------------------------------------------- 65
3.5.1 BRAIN MONONUCLEAR CELLS ------------------------------------------- 65
3.5.2 SPLENOCYTES ------------------------------------------------------------------ 65
3.5.3 PERITONEAL MACROPHAGES --------------------------------------------- 66
3.5.3.1 In vitro experiments -------------------------------------------------------- 66
3.5.3.2 In vivo experiments -------------------------------------------------------- 67
3.6 HISTOLOGICAL PREPARATION AND
IMMUNOHISTOCHEMISTRY OF ORGANS --------------------------------- 68
3.6.1 BRAIN ------------------------------------------------------------------------------ 68
3.6.1.1 Paraffin embedding of the brain ----------------------------------------- 68
3.6.1.2 Hematoxylin and eosin (HE) staining ----------------------------------- 68
3.6.1.3 Activated brain microglia/macrophages labeling ---------------------- 69
3.6.1.4 Detection of macrophages in spleens ------------------------------------ 69
3.6.1.4.1 Cryosectioning of spleen ------------------------------------------- 69
3.6.1.4.2 Detection of macrophages ------------------------------------------ 70

xv
3.6.1.5 Apoptosis Detection ------------------------------------------------------- 70
3.7 CELL STUDIES ------------------------------------------------------------------------ 71
3.7.1 AFRICAN GREEN MONKEY KIDNEY CELLS (VERO CELLS)
AND L292 MOUSE FIBROBLASTS ----------------------------------------- 71
3.7.2 HYBRIDOMA YTS 191 AND 169 CELL LINES -------------------------- 71
3.7.2.1 Cell culture ------------------------------------------------------------------ 71
3.7.2.2 Production of anti CD4+ and anti CD8+ antibodies ------------------ 72
3.7.2.3 Ammonium sulfate precipitation ----------------------------------------- 72
3.7. 3 MOUSE PRIMARY CELL CULTURES ------------------------------------ 73
3.7.4 VIRUS INFECTION OF CELLS ---------------------------------------------- 73
3.7.6 VIRUS TITRATION ------------------------------------------------------------- 74
3.7.6.1 Preparation of 10% brain homogenates --------------------------------- 74
3.7.6.2 Tissue culture infectivity dose 50% (TCID50) ------------------------- 74
3.8 CYTOKINE STUDIES ---------------------------------------------------------------- 75
3.8.1 IFN TYPE I BIOASSAY -------------------------------------------------------- 75
3.8.1.1 Preparation of L929 monolayers ----------------------------------------- 75
3.8.1.2 Acid treatment of samples ------------------------------------------------ 76
3.8.1.3 IFN type I bioassay -------------------------------------------------------- 76
3.9 FLOW CYTOMETRY ---------------------------------------------------------------- 77
4.0 CHAPTER 4: STUDY ON KUNV, MVEV AND WNV
VIRULENCE IN SUSCEPTIBLE AND CONGENIC
RESISTANT MICE ------------------------------------------------------- 80
4.1 INTRODUCTION ---------------------------------------------------------------------- 80

xvi
4.2 RESULTS -------------------------------------------------------------------------------- 81
4.2.1 VIRUS NEUROVURULENCE STUDIES ----------------------------------- 81
4.2.1.1 Analysis of neurovirulence of WNV, KUNV and MVEV in
susceptible mice ------------------------------------------------------------ 81
4.2.1.2 Analysis of neurovirulence of WNV, KUNV and MVEV in
resistant mice --------------------------------------------------------------- 85
4.2.1.3 Analysis of different degrees of neurovirulence of WNV,
KUNV and MVEV --------------------------------------------------------- 85
4.2.1.3 Mouse mortality and average time to death using a 100 LD50
virus dose -------------------------------------------------------------------- 87
4.2.2 INTRANASAL INFECTION IN SUSCEPTIBLE MICE ------------------ 88
4.2.3 VIRUS NEUROINVASIVENESS STUDIES -------------------------------- 91
4.2.3.1 Intraperitoneal challenge in adult and young mice -------------------- 91
4.2.3.2 Effect of blood brain barrier modulation on virus
neuroinvasiveness ---------------------------------------------------------- 94
4.2.3.2.1 Effect of SDS on KUNV and MVEV neuroinvasiveness in
HeJ mice -------------------------------------------------------------- 94
4.2.3.2.2 Effect of blood brain barrier modulation on WNV
neuroinvasiveness in mice ----------------------------------------- 96
4.2.3.3.1 Mouse survival following thioglycollate treatment ------------ 99
4.2.3.3.2 Mouse survival following transient macrophage depletion - 102
4.2.3.4 Effect of T cells depletion on survival of DUB mice following
WNV i.p. infection ------------------------------------------------------- 106
4.3 DISCUSSION ------------------------------------------------------------------------- 109

xvii
5.0 CHAPTER 5: CHARACTERISATION OF KUNV, MVEV
AND WNV INFECTIONS IN CELL CULTURE ----------------- 118
5.1 INTRODUCTION -------------------------------------------------------------------- 118
5.2 RESULTS ------------------------------------------------------------------------------ 119
5.2.1 VIRUS REPLICATION IN CELL CULTURE ---------------------------- 119
5.2.1.1 Determination of dose of infection ------------------------------------ 119
5.2.1.2 Virus replication in Vero cells ----------------------------------------- 119
5.2.1.3 Virus repl
ication in thioglycollate-elicited macrophages -------------------------------- 120
5.2.1.4 Virus replication in primary mouse dendritic cells ------------------ 122
5.2.2 CYTOKINE PRODUCTION IN PRIMARY MOUSE
MACROPHAGES -------------------------------------------------------------- 129
5.2.3 ADOPTIVE TRANSFER OF VIRUS-INFECTED MACROPHAGES
IN MICE ------------------------------------------------------------------------- 133
5.3 DISCUSSION ------------------------------------------------------------------------- 137
6.0 CHAPTER 6: ROLE OF VIRAL REPLICATION AND
IMMUNOPATHOLOGY IN DISEASE DEVELOPMENT
FOLLOWING KUNV AND MVEV INTRACEREBRAL
INFECTION --------------------------------------------------------------- 142
6.1 INTRODUCTION -------------------------------------------------------------------- 142
6.2 RESULTS ------------------------------------------------------------------------------ 144

xviii
6.2.1 BRAIN VIRUS TITRES FOLLOWING INTRACEREBRAL
INFECTION --------------------------------------------------------------------- 144
6.2.1.2 Analysis of viral titres in mouse brain following KUNV and
MVEV infection ---------------------------------------------------------- 144
6.2.1.2 Analysis of viral titres in peripheral organs following KUNV
and MVEV infection ----------------------------------------------------- 147
6.2.2 BRAIN HISTOPATHOLOGICAL AND INFLAMMATION
ANALYSIS ---------------------------------------------------------------------- 149
6.2.2.1 Brain architecture and inflammation in KUNV and MVEV
infection ------------------------------------------------------------------- 149
6.2.2.2 Brain tissue architecture and leucocytic infiltration in the brains
of infected mice ---------------------------------------------------------- 149
6.2.2.3 Analysis of accumulation and activation of
microglia/macrophages in the brains of virus-infected mice ------ 157
6.2.2.4 Contribution of apoptosis to fatal outcome of infection ------------ 158
6.3 DISCUSSION ------------------------------------------------------------------------- 165
7.0 CHAPTER 7: ROLE OF CELL MEDIATED IMMUNITY IN
IMMUNOPATHOLOGY OR RECOVERY FOLLOWING
INTRACEREBRAL KUNV AND MVEV INFECTION IN
MICE ----------------------------------------------------------------------- 172
7.1 INTRODUCTION -------------------------------------------------------------------- 172
7.2 RESULTS ------------------------------------------------------------------------------ 174
7.2.1 FLOW CYTOMETRIC ANALYSIS OF BRAIN MONONUCLEAR
CELLS FOLLOWING KUNV AND MVEV INFECTION -------------- 174

xix
7.2.1.1 Analysis of cells infiltrating the brains of susceptible HeJ mice
upon infection with MVEV and KUNV ------------------------------ 174
7.2.1.3 Analysis of MHC cell surface up-regulation on brain CD11b+
cells following flavivirus infection. ----------------------------------- 186
7.2.2 T CELL DEPLETION STUDIES -------------------------------------------- 188
7.2.2.1 Pilot study to determine the optimum antibody depletion time --- 190
7.2.2.2 Effect of CD4+ or CD8+ T cells depletion on mortality
following flavivirus infection in susceptible mice ------------------ 192
7.2.2.3 Effect of CD4+ or CD8+ T cells depletion on mortality
following flavivirus infection in resistant DUB mice --------------- 193
7.2.2.4 Effect of total T cells (CD4+ and CD8+) depletion on mortality
following KUNV and MVEV infection in resistant DUB mice --- 197
7.2.3 ANALYSIS OF CYTOKINE PRODUCTIONS --------------------------- 202
7.2.3.1 Cytokine productions in susceptible HeJ mice----------------------- 203
7.2.3.2 Cytokine productions in resistant DUB mice ------------------------ 205
7.2.3.3 Analysis of major IFNγ producing cells in resistant DUB mice -- 208
7.3 DISCUSSION ------------------------------------------------------------------------- 213
8.0 CHAPTER 8: GENERAL DISCUSSION --------------------------- 223
9.0 REFERENCES ----------------------------------------------------------- 236

xx
TABLE OF FIGURES
Figure 4.1. Analysis of survival in mice following infection with 100
LD50 (in susceptible mice) of KUNV and MVEV.
8
Figure 4.2. Depletion of splenic macrophages by clodronate treatment. 105
Figure 5.1. Replication of WNV, KUNV and MVEV in Vero cells. 123
Figure 5.2. Replication of WNV, KUNV and MVEV in A)
thioglycollate-elicited macrophages from flavivirus
susceptible HeJ mice and B) resistant DUB mice.
124
Figure 5.3. Replication of WNV, KUNV and MVEV in C57/BL6 mouse
bone marrow derived dendritic cells.
126
Figure 5.4. Cytopathic effect of virus replication in Vero cells. 127
Figure 5.5. Cytopathic effect of virus replication in macrophage cell
cultures.
128
Figure 5.6. In vitro cytokine productions by HeJ isolated macrophages
following infection with WNV, KUNV and MVEV.
131
Figure 6.1. Kinetics of viral replication in mouse brains infected with
KUNV and MVEV.
148
Figure 6.2. Brain tissue section from uninfected mouse. 153
Figure 6.3. Brain tissue inflammation in susceptible HeJ mice infected
with KUNV (A and B) or MVEV (C and D) at the time of
death.
154
Figure 6.4. Brain tissue inflammation on day 5 p.i. in DUB mice
infected with KUNV (A and B) or MVEV (C and D).
155
Figure 6.5. Brain tissue inflammation on day 9 p.i. following i.c. KUNV
(A and B) and MVEV (C and D) infection in DUB mice.
156
Figure 6.6. Detection of activated microglia/macrophages in the brains
of susceptible mice following i.c. KUNV and MVEV
infection.
160
Figure 6.7. Analysis of apoptosis in brains of susceptible and resistant
mice following i.c. KUNV and MVEV infection.
163
Figure 7.1. Total number of cells isolated from (A) spleens and (B)
brains of resistant mice challenged i.c. either with KUNV or
178

xxi
MVEV.
Figure 7.2. Flow cytometric analysis of splenocytes in DUB mice
following i.c. KUNV and MVEV infection.
180
Figure 7.3. Analysis of brain infiltrating leucocytes in DUB mice
following KUNV and MVEV infection.
183
Figure 7.4. Up-regulation of MHC class I and II molecules in CD11b+
cells following KUNV and MVEV infection.
189
Figure 7.5. Analysis of T cells depletion in DUB mice by flow
cytometry after treatment with cytotoxic anti-CD4 and anti-
CD8 antibodies.
191
Figure 7.6. Effect of CD4 or CD8 cells depletion on mortality following
KUNV and MVEV infection in flavivirus susceptible HeJ
mice.
194
Figure 7.7. Effect of CD4+ or CD8+ T cells depletion on mortality of
resistant DUB mice following challenge with KUNV and
MVEV.
198
Figure 7.8. Effect of CD4+ or CD8+ T cells depletion on viral titres
following MVEV infection in resistant DUB mice.
198
Figure 7.9. Effect of T cells (CD4+ and CD8+) depletion on mortality of
KUNV and MVEV-infected resistant DUB mice.
199
Figure 7.10. Brain IFNαβ (A) and TNF (B) levels in resistant DUB mice
following infection with KUNV and MVEV.
207
Figure 7.11. Analysis of IFN producing cells in resistant DUB mouse
brains 7 days after infection with KUNV or MVEV.
212

xxii
TABLE OF TABLES
Table 1.1. Recent classification of the Flavivirus genus 3
Table 4.1.A. Mortality and LD50 studies following intracerebral infection
with serially diluted viruses in flavivirus susceptible HeJ
mice.
83
Table 4.1.B. Mortality in different susceptible mouse strains following
intracerebral infection with KUNV.
84
Table 4.1.C. Mortality and LD50 studies following intracerebral infection
with serially diluted viruses in flavivirus resistant DUB mice.
86
Table 4.2. Mortality studies following intranasal infection of KUNV
and MVEV in HeJ mice.
90
Table 4.3 Intraperitoneal infection of KUNV, MVEV and WNV in
flavivirus susceptible HeJ and resistant DUB mice.
93
Table 4.4. The effect of SDS on mortality of HeJ mice following i.p.
KUNV and MVEV infection.
98
Table 4.5. The effect of SDS on mortality of mice following i.p. WNV
infection in mice.
101
Table 4.6. The effect of thioglycollate on mortality of HeJ and DUB
mice following i.p. virus infection.
103
Table 4.7. The effect of macrophage and blood brain barrier modulation
on WNV and KUNV infections in young DUB mice.
104
Table 4.8. The effect of T cells depletion on mortality of DUB mice
following i.p. WNV infection
108
Table 5.1. Mortality studies following i.p. infection of mice with HeJ
peritoneal macrophages infected in vitro with WNV.
134
Table 5.2. Mortality studies following i.p. infection of mice with DUB
peritoneal macrophages infected in vitro with WNV.
135
Table 6.1. The KUNV and MVEV doses used for intracerebral
infection in mice
145
Table 6.2. Analysis of viral titres in peripheral organs of KUNV or
MVEV-infected HeJ mice at the time of death.
150
Table 6.3. Summary of viral titres, histopathology and microglia 162

xxiii
analysis in susceptible and resistant mice following i.c.
infection with KUNV and MVEV.
Table 7.1. Number of brain infiltrating leucocytes isolated from HeJ
mice that succumbed to KUNV and MVEV infection.
177
Table 7.2. Effect of CD4+ and CD8+ T cells depletion on mortality of
HeJ mice following i.c. challenge with KUNV or MVEV.
194
Table 7.3. Summary on the effect of T cells depletion in DUB mice
challenged with KUNV or MVEV.
200
Table 7.4. Cytokine levels in brains of susceptible HeJ mice at the time
of death following infection with KUNV or MVEV.
204
Table 7.5. Th1-Th2 cytokines in DUB mouse sera following infection
with KUNV and MVEV.
210
Table 7.6. Th1-Th2 cytokines in DUB mouse brains following infection
with KUNV and MVEV.
211

CHAPTER 1
LITERATURE REVIEW
1
1.0 CHAPTER 1: LITERATURE REVIEW
1.1 FLAVIVIRUS IN GENERAL
1.1.1 HISTORY AND CLASSIFICATION
Yellow fever virus (YFV) was the first mosquito-transmitted virus known to cause
diseases in humans. It was also the first arbovirus to be isolated (1927) and cultivated
(1932) (reviewed in Burke and Monath, 2001). When a number of other arboviruses
were also discovered, the Togaviridae family was established to group these viruses
together. Two groups of viruses were classified within this family, known as Group A
and Group B, which shared similarity in modes of transmission, viral genome
organisation and morphology but were serologically distinct. However, further studies
revealed that there were significant differences between these two groups of viruses in
terms of viral replication, genome structure and gene order. Thus, Group A was later
reclassified as Alphavirus genus in the family Togaviridae whereas group B was known
as Flavivirus genus (from Latin word Flavus which means yellow, for yellow fever) and
incorporated into a new virus family known as Flaviviridae (Westaway et al, 1985;
Westaway, 1987).
At present, in addition to the genus Flavivirus, the family Flaviviridae also includes
another 2 genera; Pestivirus (from the Latin word pestis which means plague) and
Hepacivirus (from Greek word hepatos which means liver). These 3 groups of viruses
have similar morphology, genome structures and replication strategies (Heinz et al,
2000). However, Pestivirus and Hepacivirus are not arthropod-borne and they do not
share any antigenic resemblance with Flavivirus (Tsai, 2000). The Flavivirus genus
consists of approximately 70 members, which are further classified into 10 subgroups or
complexes (Table 1.1) (ICTVdB management, 2006), based upon cross-neutralisation in
plaque reduction neutralisation test and vector species involved in transmission
(reviewed in Calisher and Gould, 2003). Classifying the viruses according to their
vectors nevertheless is not always appropriate as some mosquito-borne flaviviruses have
also been isolated from ticks and vice versa. Hence, advanced computer programs and
molecular biological techniques provides excellent tools for extensive nucleotide

CHAPTER 1
LITERATURE REVIEW
2
sequence comparisons, which subsequently make it possible to draw a more accurate
genetic relationship and taxonomy of flaviviruses (Calisher and Gould, 2003).
Most flaviviruses are arboviruses; they are either transmitted by ticks or mosquitoes.
Currently there are 31 mosquitoes-borne Flavivirus species, 12 tick-borne species and
14 species with no known vector (ICTVdB management, 2006).
1.1.2 ECOLOGY AND EPIDEMIOLOGY
Arboviruses including flaviviruses are globally distributed. Among the 10 subgroups of
flaviviruses, Japanese encephalitis (JE) serocomplex contains the most medically
important viruses that are found in all continents except in the Antartic (Mackenzie et
al, 2002a). Natural transmission cycles of these viruses are primarily maintained
between arthropod vectors and susceptible vertebrate hosts like birds (Mackenzie et al,
2002a). Horse and human infections with flaviviruses are considered incidental except
in the case of dengue (DEN) and yellow fever (YF) infections where humans may also
be involved in virus transmission (Vasconcelos et al, 2001; Ligon, 2005).
WNV is the most widely distributed member of the JE complex and can be found in
Africa, the Middle East, Europe, Asia, North America and Australia (Mackenzie et al,
2004). Currently, West Nile virus is divided into lineage I and II. The Lineage I includes
viruses isolated from Africa, Europe, Asia, North America and Australia and commonly
associated with human diseases (Lanciotti et al, 1999; Mackenzie et al, 2004). Lineage
II consists solely of viruses isolated from southern Africa and Madagascar (Lanciotti et
al, 1999). Previously, human infection with WNV resulted mostly in fever-arthralgia-
rash syndrome but recent WNV outbreaks in Europe and The United States involving
large numbers of encephalitic cases has sparked serious concerns about the re-
emergence of WNV with high virulence (Solomon and Vaughn, 2002). In 2002, a large
outbreak of WNV occurred in North America with more that 4000 people were infected
and 250 fatalities were recorded (Lanciotti et al, 2002).

CHAPTER 1
LITERATURE REVIEW
3
Table 1.1 Recent classification of the Flavivirus genus (ICTVbB management,
2006)
Group Vector Viruses
Mammalian tick-
borne
encephalitis
Tick
Gadgets Gully, Kyasanur Forest disease,
Langat, Louping ill, Omsk hemorrhagic
fever, Powassan, Royal Farm, Tick-borne
encephalitis
Seabird tick-
borne
encephalitis
Tick Kadam, Meaban, Saumarez Reef, Tyuleniy
Aroa Virus Mosquito Aroa
Yellow Fever Mosquito
Banzi, Bouboui, Edge Hill, Jugra, Saboya,
Sepik, Uganda S, Wesselsbron, Yellow
fever
Japanese
encephalitis Mosquito
Japanese encephalitis, St. Louis
encephalitis, Murray Valley encephalitis,
West Nile, Kunjin, Kokobera, Usuta,
Stratford, Alfuy, Koutango
Dengue Mosquito Dengue-1, Dengue-2, Dengue-3, Dengue-4
Kokobera Mosquito Kokobera
Ntaya Mosquito
Bagaza, Ilheus, Israel turkey
meningoencephalomyelitis, Ntaya,
Tembusu
Spondweni Mosquito Zika
Entebbe bat
No known
arthropod
vector
Entebbe bat, Yokose, Apoi, Cowbone
Ridge, Jutiapa, Modoc, Sal Vieja virus, San
Perlita, Bukalasa bat, Carey Island, Dakar
bat, Montana myotis leukoencephalitis,
Phnom Penh bat, Rio Bravo

CHAPTER 1
LITERATURE REVIEW
4
Later, sequence analysis indicated that the WNV strain responsible for the North
America outbreak was closely related to a WNV strain that was isolated from Israel
during 1998-2000 outbreaks (Lanciotti et al, 2002).
In Australia, KUNV, an Australian variant of WNV, can be found. This virus has a
similar distribution to the major Australian encephalitogenic flavivirus, MVEV, and
both are endemic in several areas including the northern part of Western Australia,
Northern Territory and northern Queensland (Hall et al, 2002). These two viruses share
similar ecologies, as they have the same vector and vertebrate hosts (reviewed in
Mackenzie et al, 2002b). Although KUNV isolates from Australia belong to the lineage
I of WNV, they are only associated with mild febrile illness in humans (Mackenzie et
al, 2004; Hall et al, 2002). In addition to Australia, KUNV also can be found in Papua
New Guinea, Irian Jaya, Indonesian archipelago as well as some parts of Southeast Asia
(reviewed in Hall et al, 2002). However, genetic analysis indicates that KUNV isolates
from Southeast Asia may have evolved separately from a common ancestor and thus are
a separate lineage of WNV (Scherret et al, 2001).
MVEV is the major encephalitogenic flavivirus in Australia that was first isolated from
humans in 1951 during a major outbreak in south-eastern Australia. MVEV was also
isolated from Culex annulirostris mosquitoes in 1959 at Kowanyama, Cape York,
northern Queensland (reviewed in Mackenzie et al, 2002a).
1.1.3 MORPHOLOGY
Virions of flaviviruses are spherical, approximately 40-60 nm in diameter. They have an
icosahedral core 30-35 nm in diameter, which contains a nucleocapsid protein
complexed with RNA (Duane and Roehrig, 2000). The nucleocapsid core is surrounded
by a lipid bilayer envelope, which is densely covered with surface projections,
consisting of membrane (M) and envelope (E) proteins (Duane and Roehrig, 2000).
Both M and E proteins are anchored to the envelope by hydrophobic bonds (Burke and
Monath, 2001).

CHAPTER 1
LITERATURE REVIEW
5
1.1.4 GENOME STRUCTURE
The genome of flaviviruses consists of a linear positive single stranded RNA of about
10.4 to 11kb in length (Brinton, 1986). The molecular weight is estimated to be about
4 x 10³ kDA (Westaway et al, 1985). The 5’ end has a type 1 cap followed by the
conserved dinucleotide sequence AG while the 3’ end has no polyA tail (Duane and
Roehrig, 2000; Chambers et al, 1990a).
There is only a single open reading frame (ORF) of more than 10,000 bases which is
flanked by 5’ (95 to 132 bases) and 3’ short un-translated regions (UTR) (114 to 624
bases) that contain conserved RNA elements (Rice, 1996). The 5’ non-translated region
is believed to carry stable secondary structure involved in recognition and binding of
viral and host replication and packaging factors (Lindenbach and Rice, 2001). Most
flaviviruses also carry a 3’ terminal stem-loop structure at the 3’ non-coding region
which may function as a promoter to initiate negative strand RNA synthesis. The 3’
stem-loop structure has been shown to bind to viral helicase NS3 and NS5 in vitro
(reviewed in Lindenbach and Rice, 2003). Upstream of the 3’ stem loop structure is
another RNA element known as cyclisation sequence (CS) which is complementary to a
sequence present at the 5’ end of the genome and is necessary for replication
(Khromykh et al, 2001; Alvarez et al, 2005). The ORF encodes and directs synthesis of
a single polyprotein that serves as a precursor to a number of viral proteins. The
ORF is arranged as follows: C-prM-NS1-NS2A-NS2B-NS3-NS4A-NS4B-NS5 (Rice
et al., 1985). Complete genome sequences are already known for several flaviviruses
including YFV (Rice et al, 1985), WNV (Castle et al, 1985), Japanese encephalitis virus
(JEV) (Sumiyoshi et al, 1987), MVEV (Dalgarno et al, 1986) and KUNV (Coia et al,
1988).
1.1.5 VIRAL PROTEINS
Translation results in the synthesis of a single polyprotein, which eventually cleaved by
host and viral proteases into 10 proteins (Chambers et al, 1990a). Of this, 3 are
structural; capsid (C), pre-membrane (prM) and envelope (E) and 7 are non-structural
proteins; NS1, NS2A, NS2B, NS3, NS4A, NS4B and NS5.
CHAPTER 1
LITERATURE REVIEW
6
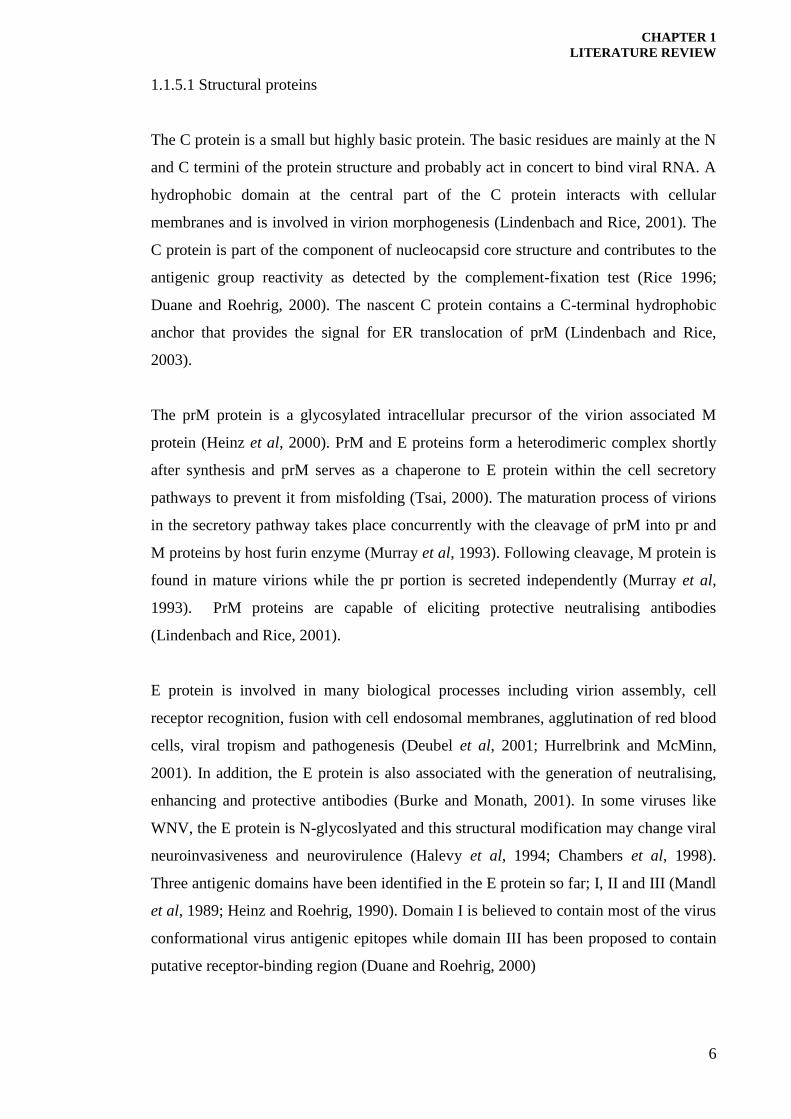
1.1.5.1 Structural proteins
The C protein is a small but highly basic protein. The basic residues are mainly at the N
and C termini of the protein structure and probably act in concert to bind viral RNA. A
hydrophobic domain at the central part of the C protein interacts with cellular
membranes and is involved in virion morphogenesis (Lindenbach and Rice, 2001). The
C protein is part of the component of nucleocapsid core structure and contributes to the
antigenic group reactivity as detected by the complement-fixation test (Rice 1996;
Duane and Roehrig, 2000). The nascent C protein contains a C-terminal hydrophobic
anchor that provides the signal for ER translocation of prM (Lindenbach and Rice,
2003).
The prM protein is a glycosylated intracellular precursor of the virion associated M
protein (Heinz et al, 2000). PrM and E proteins form a heterodimeric complex shortly
after synthesis and prM serves as a chaperone to E protein within the cell secretory
pathways to prevent it from misfolding (Tsai, 2000). The maturation process of virions
in the secretory pathway takes place concurrently with the cleavage of prM into pr and
M proteins by host furin enzyme (Murray et al, 1993). Following cleavage, M protein is
found in mature virions while the pr portion is secreted independently (Murray et al,
1993). PrM proteins are capable of eliciting protective neutralising antibodies
(Lindenbach and Rice, 2001).
E protein is involved in many biological processes including virion assembly, cell
receptor recognition, fusion with cell endosomal membranes, agglutination of red blood
cells, viral tropism and pathogenesis (Deubel et al, 2001; Hurrelbrink and McMinn,
2001). In addition, the E protein is also associated with the generation of neutralising,
enhancing and protective antibodies (Burke and Monath, 2001). In some viruses like
WNV, the E protein is N-glycoslyated and this structural modification may change viral
neuroinvasiveness and neurovirulence (Halevy et al, 1994; Chambers et al, 1998).
Three antigenic domains have been identified in the E protein so far; I, II and III (Mandl
et al, 1989; Heinz and Roehrig, 1990). Domain I is believed to contain most of the virus
conformational virus antigenic epitopes while domain III has been proposed to contain
putative receptor-binding region (Duane and Roehrig, 2000)

CHAPTER 1
LITERATURE REVIEW
7
1.1.5.2 Non-structural proteins
Unlike the structural proteins, functions of non-structural proteins are not fully
understood. NS1, NS3 and NS5 are large and highly conserved proteins while the rest
are small hydrophobic and poorly conserved non-structural proteins (Chambers et al,
1990a).
NS1 is a membrane-bound glycoprotein but it can also be secreted from virus infected-
cells. This protein is likely to be involved in virion morphogenesis as well as viral RNA
synthesis (Duane and Roehrig, 2000; Mackenzie et al, 1996). Mutations at the N-linked
glycosylation sites of this protein affect RNA and virus production (Muylaert et al,
1996). A strong humoral immune response has also been documented against the
secreted form of NS1 while the membrane-bound form of this protein can induce
antibodies that direct the complement-mediated lysis of virus-infected cells (reviewed in
Lindenbach and Rice, 2003). On the contrary, recently, a possible role of NS1 in
attenuating complement activation during certain flavivirus infections has been
suggested. Chung and co-workers (2006) demonstrated that WNV NS1 binds to and
recruits factor H (fH), which is a key regulatory molecule of complement activation.
This activity results in the inhibition of complement-mediated immunity of infected
hosts (Chung et al, 2006)
NS3 is a multifunctional protein and serves as a viral helicase during viral RNA
replication while NS2B-NS3 complex functions as a viral protease associated with
cleavage of viral polyprotein (Yamshchikov and Compans, 1993; Chambers et al,
1990b, Wu et al, 2005). NS4A and NS4B have molecular weights of 16 and 27 kDa,
respectively. Their function is not clear but it is possible that these proteins have a role
in RNA replication (Lindenbach and Rice, 1999). NS5 has a molecular weight of 103 kb
and thus is the largest and the most conserved flavivirus protein (Lindenbach and Rice,
2001). Given the high level of sequence homology to RNA-dependent RNA
polymerases (RdRps) of other positive strand RNA viruses, NS5 may serve as a viral
polymerase (Lindenbach and Rice, 2001; Chambers et al, 1990a). In addition, the NS5
protein might also function as a methyltransferase enzyme, engaging in the methylation
of the 5’ RNA cap structure (Lindenbach and Rice, 2001). NS5 has also been shown to
form a complex with NS3 resulting in NS3 NTPase activity (Lindenbach and Rice,
2001).

CHAPTER 1
LITERATURE REVIEW
8
1.1.6 VIRUS ENTRY AND TRANSLATION
Flaviviruses are capable of infecting a wide range of invertebrate and vertebrate hosts,
as well as mammalian, avian and arthropod cell lines. Initial attachment of the virion is
mediated by the E protein, which binds to the host cell surface receptor. At present, this
cell surface receptor has not been fully identified and characterised either in the
periphery or central nervous system (CNS) but the availability of these receptors
determines tissue and cell tropism as well as the host range of the virus. Recently,
CD209 or DC-SIGN (dendritic cell-specific intercellular adhesion molecule 3-grabbing
nonintegrin) has been suggested as a cell surface receptor for dengue virus (DENV)
(reviewed in Chambers and Diamond, 2003). However, the significance of this receptor
in vivo is unknown and further study is required to determine whether other flaviviruses
utilise the same ligand for attachment or entry (Chambers and Diamond, 2003). Highly
sulfated glycosaminoglycans were shown to promote the binding of E protein and
heparin sulfate expression on the host cell surface was required for efficient infection
with laboratory-passaged DENV and MVEV strains (Chen et al, 1997; Lee and Lobigs,
2002). However the role of heparin as an important cell surface receptor to mediate
virus entry remains uncertain as serial laboratory passages of JEV and MVEV showed
increased binding for this receptor in vitro but at the same time the viruses had low
virulence in vivo (Lee and Lobigs, 2002). In vitro analysis of WNV Sarafend strain
infection revealed that the host αVβ3 intergrin served as a functional receptor that
interacted with domain III of the envelope protein to mediate virus binding (Lee et al,
2006). In addition, binding may also occur through antibody-dependent enhancement
(ADE) as has been shown in DENV infection. In this instance, virus particles are
opsonised with subneutralising concentrations of antibodies and bound to cells
expressing immunoglobulin FcγI and FcγII receptors (Lindenbach and Rice, 2001). An
alternative ADE mechanism that requires complement has also been described (Cardosa
et al, 1983; 1986).
The most common route of entry of flaviviruses into the cell is thought to be via
receptor-mediated endocytosis following studies with WNV, YFV, and KUNV in cell
cultures (Gollins and Poterfield 1985; Ishak et al, 1988; Ng and Lau, 1988). In this
process, following attachment of the virion on the host cell surface, invagination of the
cell membrane occurs which results in formation of coated vesicles that internalise the
virion and transport it to the cell cytoplasm (Gollins and Porterfield, 1985). Acid

CHAPTER 1
LITERATURE REVIEW
9
catalysed membrane fusion then takes place when E protein is exposed to the local mild
acidic conditions in the endosomes. This results in permanent structural changes of this
protein (reviewed in Heinz, 2003), causing uncoating of the membrane, release of the
nucleocapsid to the cytoplasm and eventually leading to the translation of the viral
genome. Alternatively, entry of flaviviruses by direct fusion at the plasma membrane
has also been observed following infection with JEV and DENV-2 in mosquito cells
and human monocytes (reviewed in Chambers et al, 1990a).
Translation occurs in association with the membrane of rough endoplasmic reticulum
(Lindenbach and Rice, 2001). Translation initiation is cap-dependent, starts at the 5’ end
of the viral genome and concludes at the stop codon located near the 3’ end to produce a
single polyprotein (Calisher and Gould, 2003; Alvarez et al, 2005). The polyprotein is
cleaved into 10 viral proteins. Host signal peptidase is associated with cleaving the
capsid-premembrane (C-preM), premembrane-envelope (prM-E), envelope-NS1 (E-
NS1) and near the C terminus of NS4A proteins. In contrast, the viral serine protease is
responsible for cleaving the NS2A/NS2B, NS2B/NS3, NS3/NS4A, NS4A/NS4B and
NS4B/NS5 (Lindenbach and Rice, 2003). Some of these proteins translocate to the
lumen of endoplasmic reticulum while the others remain localised on the cytoplasmic
site, depending on their roles in virus life cycle.
1.1.7 REPLICATION
Viral RNA replication occurs in the perinuclear region of the cells following translation
of viral RNA polymerase (Westaway et al, 1997). Although vesicle packets are the most
likely sites of viral replication, these structures are only observed late in infection and
thus it is still unclear where the initial RNA replication takes place (Lindenbach and
Rice, 2003). Replication starts with the production of negative strands, which serve as
templates for synthesising new genomes, positive strand RNA (Westaway et al, 1985).
Replication of flaviviruses has been shown to employ a semiconservative mechanism
with three major types of RNA detected. These include RNase sensitive 40-44S single
stranded virion RNA (vRNA), RNase resistant 20S double-stranded replicative form
(dsRF), and RNase partially sensitive 20-28S replicative intermediate form (RI)
(Lindenbach and Rice, 2001). All 3 species of viral RNA have been detected both in
flavivirus infected cells and mouse brains (Chu and Westaway, 1985; Urosevic et al,
1997a). DsRF serves as the template for viral RNA synthesis, in which the newly

CHAPTER 1
LITERATURE REVIEW
10
synthesised RNA strand replaces the existing positive strand RNA in the dsRF (Chu and
Westaway, 1985). The cycle period taken for a nascent RNA to displace the pre-existing
RNA in the RI is about 15 minutes (Westaway et al, 2002). The synthesis of viral RNA
is also shown to be asymmetric in vivo, with the production ratio of positive strand
RNA to the negative complementary strand is 10:1 to 100:1 (Brinton, 2001).
At present, regulation of RNA synthesis and the components of flavivirus replication
complexes have not been fully characterised (Lindenbach and Rice, 2001). However,
the involvement of both 3’ and 5’ UTR in the flavivirus genome replication has been
previously documented (Khromykh et al, 2001; Lo et al, 2003; Alvarez et al, 2005).
Deletion of RNA elements in the 3’ UTR has been shown to affect synthesis of DENV
RNA (Alvarez et al, 2005). The interaction of certain cellular proteins as well as viral
proteins such as NS3 and NS5 with the 3’terminal structures may be important in the
regulation of transcription (Brinton, 2001). A host cellular factor identified as
translation elongation factor-1 has been shown to interact with the 3’ stem loop
structure of the viral RNA during WNV infection (Blackwell and Brinton, 1997). In
vitro studies have also shown that interaction between cyclisation sequences (CS)
present in 3’ UTR and 5’ region of the ORF is required for RNA replication (You et al.,
2001).
1.1.8 VIRUS ASSEMBLY AND RELEASE
Upon completion of viral replication, virion morphogenesis takes place in association
with intracellular membranes. In flavivirus-infected cells, two modes of maturation have
been demonstrated; the trans-mode and the cis-mode (Hase et al, 1987). Maturation of
most flaviviruses is via the trans-mode and occurs in the lumen of ER (reviewed in
Lindenbach and Rice, 2001). In the cytoplasm, nucleocapsids or viral cores are formed
when the C protein interacts with genomic RNA. These structures then become
enveloped following budding process into the ER lumen (Lorenz et al, 2003; Lorenz
et al, 2002; Lobigs and Lee, 2004). Intracellular immature virions, which contain
heterodimers of E and prM proteins then accumulate within the membrane-bound
vesicles and are transported through the host secretory pathway (Mackenzie and
Westaway, 2001). Prior to release of mature virions, the glycans on E and prM are
altered followed by cleavage of prM in the trans-Golgi network by furin enzyme.
Virions are then transported to the cell surface membrane by secretory vesicles, where

CHAPTER 1
LITERATURE REVIEW
11
fusion occurs resulting in the release of progeny virions by exocytosis (reviewed in
Brinton, 2002; Lindenbach and Rice, 2001).
During cis-mode maturation, structural proteins are transported to the plasma membrane
for insertion at the budding site (Ng et al, 2001; Chu and Ng, 2002). Maturation occurs
at the plasma membrane and virions egress by budding rather than by exocytosis
process (Ng et al, 1994; reviewed in Ng and Chu, 2002). However, this mechanism has
been reported only in specific virus-host cell combinations including infection of
DENV-2 strain PR-159 in C6/36 cells (Hase et al, 1987) and WNV strain Sarafend in
Vero and C6/36 cells (Sreenivasan et al, 1993; Ng et al, 1994). Host microtubules and
actin filaments as well as the 5’ end of the viral genome have been shown to have a
critical role in the maturation and release of WNV Sarafend by this process (Ng et al,
2001; Chu et al, 2003; Li et al, 2005).
1.2 PATHOGENESIS OF FLAVIVIRUSES
Infection with flaviviruses in humans induces diseases ranging from non-specific febrile
illnesses (fever, headache, myalgia and malaise) to severe diseases such as encephalitis
and dengue hemorrhagic fever (DHF) (Tsai 2000; Mackenzie et al, 2002a). In Asia,
30,000 to 50,000 of JE cases with 10,000 deaths are reported annually (Burke and
Monath, 2001; Solomon et al, 2000). With WNV infection, diseases are mostly
asymptomatic with about 20-30% infected individuals suffering from symptomatic
diseases characterised by fever, headache, back pain and other minor symptoms.
(Mackenzie et al, 2004). KUNV-induced diseases however are rather mild and are
rarely associated with encephalitis (Hall et al, 2002). On the contrary, it has been
reported that during MVE infection, about 20% of clinical cases are fatal and 40% of
survivors suffer from permanent neurological sequelae (Mackenzie et al, 2002b).
In patients suffering from encephalitis, movement disorders such as tremor, and
Parkinsonian syndrome including rigidity and postural instability are commonly
observed. Some patients that survived flavivirus infections have been shown to suffer
from long-term cognitive and neurologic impairments (Mackenzie et al, 2004).

CHAPTER 1
LITERATURE REVIEW
12
Pathogenesis of flaviviruses in humans has not been fully characterised. At present,
vaccine or effective treatment is limited, thus further understanding of flavivirus-
induced illness is important to help design better therapy to treat the diseases. Infection
of flavivirus in rodents induces encephalitis; therefore this animal provides an excellent
model to study development of flavivirus-induced-encephalitis in humans. However,
certain diseases like DHF that is also inflicted on human do not cause similar disease in
mice; thus DHF phenomenon cannot be studied in these animals.
1.2.1 INFECTION IN VERTEBRATE HOSTS
During natural infection, flaviviruses are introduced into their vertebrate hosts by
mosquito or tick bites. The virus is then believed to replicate although not extensively in
the skin and infects Langerhan’s dendritic cells (reviewed in Chambers and Diamond,
2003). Infected dendritic cells then transport and spread the virus to the local lymph
nodes (Wu et al, 2000). The virus exits the lymph nodes via the efferent lymphatics and
later spreads to other organs such as liver, heart and kidney via the blood, establishing
systemic infection (Solomon and Vaughn, 2002). Following development of a sufficient
level of viraemia, virus can enter the brain via several routes. In weanling mice, the
olfactory mucosa has been shown to be the route for virus spread to the brain (Solomon
and Vaughn, 2002). WNV however was shown to spread to the central nervous system
(CNS) via the haematogenous route following footpad infection in mice (Diamond et al,
2003). Studies on the JEV and WNV-induced encephalitis in humans suggested that
hematogenous rather than olfactory route was a more probable way for the virus to get
disseminated to the brain (Desai et al, 1995; Shieh et al, 2000).
Means on how the virus crosses the blood brain barrier has also been studied. This
process could either occur through passive transport across the endothelium, replication
of virus in the endothelial cells or via infected inflammatory cells that act like ‘Trojan
Horses’ and carry the virus to the brain parenchyma (reviewed in Solomon and Vaughn,
2002). The virus species, vertebrate host and route of virus infection may influence
pathogenesis and virus spread to the brain, and this eventually will determine the
development or severity of encephalitis in infected host. During WNV infection, virus
replication in endothelial cells seems to be important while in contrast, JEV seems to
undergo endocytosis and transportation across endothelial cells and pericytes without
replicating in these cells, as observed in the brains of suckling mice (Liou and Hsu,

CHAPTER 1
LITERATURE REVIEW
13
1998). Axonal transport of flaviviruses to the olfactory lobe in the brain has been
suggested as an additional alternative pathway of flavivirus entry into the CNS. This
route is believed to be an important route of virus transport during i.n. infection of
WNV (reviewed in Chambers and Diamond, 2003). Peripheral inoculation of SLEV and
MVEV strains also result in the virus spread from the olfactory bulb, in a roastal to
caudal direction (reviewed in King et al, 2007).
In the CNS, neurons are the primary sites of viral replication (Hase et al, 1987; Silvia,
2004). In vitro infection and antigen production in astrocytes and oligodendrocytes has
been demonstrated but there is very little evidence that these glial cells are permissive to
virus infection in vivo (Jordan et al, 2000; Chen et al, 2000; Chambers and Diamond,
2003).
1.2.2 UP-REGULATION OF HOST CELL SURFACE MOLECULES UPON
FLAVIVIRUS INFECTION
Major histocompatibility complex (MHC) class I and class II molecules have important
involvement in shaping the adaptive immune response as they engage in antigen
presentation to the T cells. MHC class I and II molecules interact with and cause
activation of cytolytic T lymphocytes (mainly CD8+ T cells) and CD4+ helper T cells,
respectively (Abraham and Manjunath, 2006). Mouse MHC class I has a classical
region known as class Ia (H-2b, H-2K and H-2L) and a non-classical region identified
as class Ib (Shawar et al, 1994). Meanwhile, mouse MHC class II region consists of two
loci, I-A and I-E. In order to escape surveillance from CTL, some viruses induce down-
regulation of MHC I and II cell surface molecules (Diamond, 2003). However, reduced
expression of MHC I may result in infected cells being recognised and eventually killed
by natural killer (NK) cells. In contrast, infection by flaviviruses causes increased
expression of MHC I molecules on infected cells, as shown in various primary cells
types isolated from rats, mice, and humans upon infection with WNV, MVEV, JEV and
DENV (reviewed in King et al, 2003; Abraham and Manjunath, 2006). Up-regulation of
MHC I molecules by WNV was demonstrated to be due to an increase in MHC gene
transcription as well as an increase in peptide import into the lumen of the ER (Cheng et
al, 2004; Kesson et al, 2002; Mullbacher and Lobigs 1995; Momburg et al, 2001). Up-
regulation of MHC I and II expression is functional, causing infected cells to be more
susceptible to flavivirus-specific CTL and MHC I specific CTL (Kesson and King,

CHAPTER 1
LITERATURE REVIEW
14
2001) and triggering cytokine productions from MHC II- specific effector T cells (Liu
et al, 1989b). However, expression of MHC I is dependent on the cell cycle as well as
adhesion status, with cells infected at G0 phase showing higher up-regulation of these
cell surface molecules than cells infected in other phases of the cell cycle (Shen et al,
1995a; 1995b). In addition to MHC molecules expression, adhesion molecules
including ICAM-1, VCAM-1 and E-selectin were also shown to be increased following
flavivirus infections (King et al, 2003).
It has been suggested that induced up-regulation of MHC I molecules on infected cells
is a mechanism used by flavivirus to evade NK cells surveillance early in infection. This
perhaps would give adequate time for the virus to replicate at high titres and induce
prolonged viraemia and subsequently would allow invasion of the CNS (Momburg et al,
2001; Diamond et al, 2003a). Additionally, greater expression of MHC I also increases
the avidity of interaction between infected cells and virus-specific T cells (Kesson et al,
2003). Given that cells in G0 phase have higher induction of MHC I, these cells appear
to be more susceptible to killing by low affinity T cells. This in turn, will allow infected
cells in other phase cycle to escape T cells detection and maintain a low immunological
profile but still manage to spread the infection (Kesson et al, 2002; King et al, 2003).
However, it is also possible that the flavivirus-induced MHC I expression is a by-
product of virus replication and not a strategy to evade the immune system (Lobigs,
2003b).
1.2.3 CENTRAL NERVOUS SYSTEM DISEASES
1.2.3.1 Nature and properties of the central nervous system
Until recently, the brain was thought to be an immune privileged organ and that there is
no communication between the brain and the immune system except during infection or
injury. This assumption is due to several observations: the presence of a tight layer of
endothelial cells known as blood brain barrier (BBB) in the brain which prevents free
movement of cells and proteins from the periphery into the brain; the lack of antigen
presenting cells (APC) and expression of MHC cell surface molecules in the CNS; the
lack of a classical lymphatic drainage system; prolonged survival of tissue grafts within
the CNS; and the presence of neurons that are post-mitotic and non renewable cells
(Bradl and Frugel, 2002; Reiss et al, 2002). However, now it has become evident that

CHAPTER 1
LITERATURE REVIEW
15
the CNS is in fact under constant immune surveillance both during healthy and infection
stages and thus can react accordingly upon any insults or injury. Activated T cells can
enter the CNS but are not retained in the absence of antigen; they either leave the CNS
or die in situ (Binder and Griffin, 2003).
The CNS consists of neurons and glial cells including microglia/macrophages,
astrocytes and oligodendrocytes. The neurons’ basic function is to receive and transmit
electrochemical signals via synaptic connections (Redwine and Evans, 2002). They are
long-lived, terminally differentiated and non-replaceable cells (Griffin, 2003). Microglia
are macrophage-like cells that comprise up to 20% of total glial cells (Gehrmann, 1996).
Immune surveillance is one of the primary functions of microglia and thus they are the
first cell type to respond to CNS injuries or insults (Gehrmann, 1996; Redwine and
Evans, 2002). Invading pathogens are rapidly recognised by microglia, which in turn
produce pro-inflammatory cytokines (such as IL-1, TNFα and IL-6) and eventually
initiate an inflammatory cascade (Haschish, 2002). Unlike other resident brain cells,
microglia are derived from the bone marrow precursors, which invade the CNS at an
early stage of embryonic development to give rise to brain macrophage-like cells
(Becher et al, 2000). Oligodendrocytes form and maintain the myelin that surrounds the
axons of neurons and infection of these cells usually leads to demyelinating diseases.
Astrocytes are the supporting cells for neurons that secrete neuroprotective factors and
neurotransmitters, and are responsible for removing toxic materials (Griffin, 2003). All
brain resident cells are capable of producing cytokines and chemokines (Redwine and
Evans, 2002).
It is still not clear which cells take up the role of the APCs in the brain parenchyma.
Among cells considered to be possible APCs are microglia/macrophages, astrocytes and
oligodendrocytes. However, to act as an APC, particular cells must be able to express
MHC II cells surface molecules, integrins, CD40, co-stimulatory molecules B7 and
cytokines such as IL-12 (Reiss et al, 2002). The strongest data indicated that microglia
possess these characteristics, thus suggesting the predominant role of these cells as APC
in the CNS (Reiss et al, 2002). Expression level of B7 and B7-2 has been shown to be
significantly higher in activated microglia than in astrocytes (Satoh et al, 1995; Soos et
al, 1999).

CHAPTER 1
LITERATURE REVIEW
16
In normal, uninfected brains, there is a lack of immunological activity. Microglia and
other cells are usually kept in a quiescent state through production of neurotrophins and
anti-inflammatory TGFβ (Griffin, 2003). Expression of MHC molecules is also either
minimal or absent and confined to only dendritic cells and macrophages at the
meninges, choroid plexus and perivascular spaces (Binder and Griffin, 2003; Schneider-
Schaulies et al, 2000). MHC II is expressed minimally in microglia and possibly
astrocytes (although this is less evident) but can be up-regulated upon infection as well
as by the trafficking of activated T cells through the CNS. Generally, neurons are
thought not to express MHC I cell surface molecules as these cells are non-replaceable
and thus, lysis of neurons by cytolytic T cells will lead to detrimental and fatal
outcomes of disease (Binder and Griffin, 2003).
When infectious agents reach the CNS, disease only develops if a sufficient number of
cells is infected, resulting in brain dysfunction. CNS tissue is unique in that it has a high
metabolic rate and a low regenerative capacity. Some viruses specifically target neurons
as their site of replication. However, not all types of neurons are equally susceptible as
this depends on factors such as tissue tropism, route of virus entry as well as virus
virulence (Griffin, 2003). Neuronal tissue can be damaged or completely destroyed by
intracellular replication of viruses. Poliovirus, a positive single stranded RNA virus that
causes acute infection, replicates in the anterior and posterior horn cells of the spinal
cord resulting in flaccid paralysis. In contrast, Rabies virus causes non-lytic infection of
the neurons but disease develops because the virus interferes with neuronal cell
functions in vital centres that regulate sleep, body temperature and respiration
(Schneider-Schaulies et al, 2000). The glial cells; oligodendrocytes, astrocytes and
microglia can also be infected, depending on the type of infecting viruses.
In general, clearance of virus from the brain depends on the type of cells being infected
in the brain as well as the type of infecting virus. Viral elimination from infected
neurons usually involves a non-cytolytic mechanism as neurons are non-renewable
cells, resistant to apoptosis and do not express MHC I molecules. In contrast, efficient
clearance of virus from glial cells may involve NK or T cell-mediated cytolytic
mechanisms (Binder and Griffin, 2003).

CHAPTER 1
LITERATURE REVIEW
17
1.2.3.2 Flavivirus infections in central nervous system
In the brain, neurons are the principal target for flavivirus infection as has been
documented in vivo with several flavivirus infections in mice (Hase et al, 1990;
Andrews et al, 1999; Silvia et al, 2004). Localisation of viral antigen is also evident
around neurons but not in other CNS resident cells during fatal human cases of JEV
infection (Johnson et al, 1985). Infection with JEV and MVEV in mice caused
cytoplasmic rarefaction in the neurons (Hase et al, 1990b; Silvia 1999). The cytoplasm
appeared to be round and empty with a nucleus in the centre. By electron microscopy,
virus was shown to be replicating in the cell secretory pathway including RER and
Golgi apparatus of the neurons, eventually causing cytoplasmic organelle damage and
rarefaction as seen by light microscopy (Hase et al, 1990a). Infection of other cell types
in the brain is less clear. Recently, human primary cell cultures of neurons, astrocytes
and microglia were infected with WNV and virus growth was observed only in neurons
and astrocytes. Microglia however failed to support WNV replication although these
cells did produce cytokines upon infection (Cheeran et al, 2005). No infiltrating
leucocytes, endothelium or perivascular cells were shown to be infected during JEV or
MVEV infection (Hase et al, 1990b; Andrews et al, 1999).
Neuronal infection by viruses typically induces host inflammatory responses. Typical
inflammatory responses seen following flavivirus infection in the CNS include
perivascular cuffing and cellular infiltrates accumulation at the meninges and brain
parenchyma as well as microglia nodules formation associated with neuronophagia
(King et al, 2003; Chambers and Diamond, 2003). Among the leucocytes that present
in the brain are neutrophils, macrophages and lymphocytes although the composition,
type and importance of these infiltrating cells depend on the experimental models used
(Andrews et al, 1999; Silvia et al, 2004). Migration and infiltration of perivascular
leucocytes is the result of production of IFN type I from infected neurons, which then
signals microglia and astrocytes to produce secondary cytokines and chemokines to
attract these inflammatory cells to the brain (Gouwy et al, 2005).
Apoptosis is an active process of cell death that has an important role in development,
morphogenesis, tissue remodelling and immune regulation. This process also has been
associated with the pathogenesis of many diseases (Hay and Kannoroukis, 2002). Cells
undergoing apoptosis have distinct morphological features including cytoplasm

CHAPTER 1
LITERATURE REVIEW
18
condensation, fragmentation of the cell nucleus and chromatin condensation, and
membrane blebbing (Courageot et al, 2003). The biochemical hallmarks of apoptosis
include activation of endonucleases, DNA degradation into oligonucleosomal fragments
and activation of caspases (Courageot et al, 2003). In vivo and in vitro studies have
demonstrated that certain flaviviruses are capable of inducing apoptosis. The molecular
mechanism for the occurrence of apoptosis is not fully defined but it has been suggested
that some flavivirus proteins such as the capsid and NS3 may be directly involved in
inducing neuronal cell death (Chamber and Diamond, 2003; Prikhod’ko et al, 2002).
St. Louis encephalitis virus (SLEV) infection in human mononuclear cells, K562 and
mouse neuroblastoma cell line, Neuro2a resulted in up-regulation of pro-apoptotic bax
gene leading to apoptosis (Parquet et al, 2002). In addition, apoptosis also has been
reported during in vitro infection by Langat virus, JEV, WNV and DENV (Prikhod’ko
et al, 2002; Liao et al, 1997; Chu and Ng, 2002; Despres et al, 1996). In newborn mice,
DENV was used to study induction of apoptosis. Infected mouse brain tissue was
assayed for both viral antigens and apoptosis, and neurons were shown to be both
positive for DENV infection as well as apoptosis (Despres et al, 1998). In contrast,
infection with viruses such as JEV and MVEV in rodents did not cause any apoptosis
Hase et al, 1990; Silvia 1999; Andrews et al, 1999, and a fatal outcome of infection was
attributed possibly to neuronal dysfunction (Hase et al, 1990).
1.2.4 NEUROINVASIVENESS AND NEUROVIRULENCE
Infection of flaviviruses in different individuals may result in different disease
outcomes. This is because the severity of the diseases induced by these viruses relies on
many underlying factors and one of them is the type of infecting virus. While some
flaviviruses can induce fatal encephalitis, others only cause asymptomatic infections in
the same host, an outcome that is influenced by the neuroinvasiveness and
neurovirulence properties of the viruses.
Neuroinvasiveness is the ability of the virus to enter and infect cells or tissue in the CNS
upon peripheral inoculation. Neurovirulence on the other hand is the capacity of the
virus to infect and replicate in the CNS (Schneider-Schaulies et al, 2000). Early studies
on molecular determinants of virulence in flaviviruses were done by comparing the
genomic sequences of high and low virulence strains of YFV, JEV, DENV and tick
borne encephalitis virus (TBEV) (reviewed in Hurrelbrink and McMinn, 2003).

CHAPTER 1
LITERATURE REVIEW
19
However, more specific information on neuroinvasiveness and neurovirulence of
flaviviruses has been obtained from studies using various approaches such as single
plaque purification of uncloned viruses, selection of neutralisation escape variants,
limited passage of the virus in cell culture or mice and site-directed mutagenesis of viral
infectious clones (reviewed in Hurrelbrink and McMinn, 2003). In animal studies,
neuroinvasiveness is tested by inoculating the virus via the peripheral route while
neurovirulence is examined by inoculating the virus directly into the brain. Some
flaviviruses are both neuroinvasive and neurovirulent while others may be neurovirulent
but not neuroinvasive.
Studies with viruses such as MVEV, TBEV and JEV using variants selected either from
neutralisation-escape mutants or by serial passage in cell cultures have demonstrated
that the E protein plays an important role in the neuroinvasiveness of flaviviruses
(reviewed in McMinn, 1997; Lobigs et al, 1990). Alteration of amino acid residues in E
protein may not only change the receptor binding but may also result in reduced virus
uptake into the cells following initial attachment and change in pH-depended fusion
activity, all of which may cause the loss of neuroinvasiveness of certain viruses
(McMinn, 1997). McMinn and co-workers (1996) have shown that MVEV variants with
low neuroinvasiveness have an altered amino acid at residue 227 in E glycoprotein.
An in vivo study with the New York strain of WNV revealed the association of
glycosylation of E protein with neuroinvasiveness of the virus. Upon subcutaneous (s.c.)
infection with glycosylated and non-glycosylated variants of WNV, the former variant
caused higher mortality in mice although mortality following i.c. infection did not differ
between these two variants (Shirato et al, 2004a). On the contrary, WN25 and WN25A,
that were isolated from Israel, had glycosylated E proteins but were not neuroinvasive
when inoculated intraperitoneally (i.p.) into mice (Halevy et al, 1994). Thus, although
evidence from both in vitro and in vivo studies implicated the role of E protein in
neuroinvasiveness of the same virus strains, this notion cannot be generalised for all
flaviviruses. Studies with birds revealed that neuroinvasive viruses such as WNV strain
NY99 were capable of eliciting high levels of viraemia and eventually death of the
infected host. This is in contrast to infection with KUNV, which is non-neuroinvasive
and induces low viraemia levels and minimal morbidity in infected birds (Brault et al,
2004).

CHAPTER 1
LITERATURE REVIEW
20
In addition to the E proteins, the loss or reduced neuroinvasiveness of flaviviruses has
also been associated with the NS1 protein mutations. An amino acid mutation, from
proline to leucine at residue 250 in the NS1 of MVEV and KUNV was demonstrated to
cause attenuation of these viruses in weanling mice during i.p. challenge (Clark et al,
2007; Hall et al, 1999).
The blood brain barrier (BBB) is a tight barrier formed by endothelial cells and acts as a
physical barrier that restricts movement of large molecules (Abbott et al, 2006). The
breakdown of the BBB however can facilitate the entry of non-neuroinvasive virus to
the brain. The permeability of this barrier can be altered by cytokines such as IL-1, IL-8,
TNF and IFN as well as cytolytic T cells (Charturvedi et al, 1991; Mathur et al, 1992;
Licon Luna et al, 2002). In addition, physical stress and the use of chemicals such as
dimethyl sulphoxide (DMSO), sodium dodecylsulphate (SDS), lipopolysaccharides
(LPS) and polyinosinic:polycytidylic (pIc) can also contribute to the breakdown of BBB
(Kobiler et al, 1989; Abbott et al, 2006; Haahr, 1971).
Neurovirulence of flaviviruses is probably determined by structural proteins such as E
protein, as well as non-structural proteins. In DENV-4, neurovirulence determinants are
located in the prM/E gene region (Pletnev et al, 1992). Other studies have shown that
NS1 mutation led to reduced virus replication and loss of neurovirulence of DENV and
YFV (reviewed in McMinn, 1997). In MVEV variants selected by serial passage in
Vero cells, loss of virulence was due to mutation in the non structural region and/or
3’ UTR (McMinn et al, 1995).
1.3 IMMUNE RESPONSE AND IMMUNOPATHOLOGY
Invasion of pathogens will provoke the immune system as part of the host defence
mechanism. There are two parts of the immune system that are induced and may
interact with each other during infection. These are innate and adaptive immunity.
Innate immunity, which has limited capacity to distinguish different pathogens, mounts
a rapid non-specific antimicrobial response within hours of infection (Nash and
Usherwood, 2000). In some cases, the action of innate immunity alone may be adequate
to abolish an infection. However, if this early host defence in preventing infection is
unsuccessful, it can still slow down the spread of infection before another branch of the

CHAPTER 1
LITERATURE REVIEW
21
immune system, the adaptive immunity becomes active. The adaptive immune response
is a much slower response but with high specificity for the microbes (Nash and
Usherwood, 2000). The high specificity for different infectious agents allows this
branch of the immune system to use several discrete mechanisms to combat different
types of infections (Nash and Usherwood, 2000).
A vigorous immune system however may act as a double-edged sword to the host. In
order to provide protection from the harmful effect of infectious agents, it may at the
same time induce collateral damage to host cells as well (Lucas et al, 2006). Hence, an
infected host may not die directly from virus infection, but from immunopathological
diseases caused by one or several components of the immune system (Santana and
Rosenstein, 2003).
Many studies have been undertaken to look at the role of both the innate immune
system and adaptive immunity in protection as well as in pathogenesis of flavivirus
infection.
1.3.1 INNATE IMMUNE SYSTEM
1.3.1.1 Macrophages
Macrophages are mononuclear phagocytes derived from blood monocytes and are
involved in non-specific host defence. Blood monocytes migrate to various tissues and
organs and differentiate to macrophages in response to specific stimuli (Beutler, 2004).
Macrophages can also act as APCs and capable of producing cytokines such as IFN
and TNF, which can contribute to the immunoprotection of the infected host. Another
protective and antiviral effect provided by macrophages is the induction of nitric oxide
synthase-2 (NOS-2) following IFN activation which results in the production of NO
and other reactive oxygen intermediates (Saxena et al, 2000). Macrophages can also
clear virus using several mechanisms including phagocytosis or by opsonisation of
virus-antibody complexes via the Fc receptor.
Selective depletion of macrophages with silica was shown to increase the susceptibility
of mice to YFV-induced diseases (Zisman et al, 1971). Silica impairs liver macrophages
function thus resulting in slower viral clearance and prolonged viraemia. Virus can then

CHAPTER 1
LITERATURE REVIEW
22
enter the brain earlier and undergo rapid replication before an antibody response is
developed. The important role of macrophages in host defence has also been
demonstrated following challenge of a non-neuroinvasive variant of WNV in mice
(WN-25) (Ben-Nathan et al, 1996). This attenuated WNV did not cause any mortality in
control mice. However, following depletion of macrophages using the drug
dichloromethylene diphosphonate (clodronate) in the mice, 70-75% mortality was
observed when mice were challenged with WN-25 (Ben-Nathan et al, 1996).
Although macrophages are an important host innate immunity agent, they can also have
immunopathological role during flavivirus infections. In vivo and in vitro studies have
shown that macrophages can be infected and can contribute to virus pathogenesis by
antibody dependent enhancement (ADE) (Cardosa et al, 1986; Pantelic, 2005;
Anderson, 2003). In vitro macrophage infection has been shown to depend upon
several factors including mouse strain, type of infecting virus and different macrophage
populations (Cardosa et al, 1986; Kreil et al, 1997). Thioglycollate is a rich nutrient
medium that has been used widely to induce sterile peritoneal inflammation in order to
elicit macrophages. Intraperitoneal injection of thioglycollate increases peritoneal yield
10-fold with 80% of total cell population consisting of macrophages (Silvia et al, 2001).
Thiogycollate-elicited-macrophage cultures have been used in this and other laboratory
as an in vitro model of infection to study flavivirus pathogenesis.
1.3.1.2 Nitric oxide
Nitric oxide is a free radical gas, which has antimicrobial activity, and is derived as a
by-product during the conversion of L-arginine to L-citrulline by the NO synthase
enzyme (Bogdan, 2001; Licinio et al, 1999). There are three forms of this gene: NOS-1
is expressed in the neurons, NOS-2 is found in macrophages and NOS-3 is expressed in
endothelial cells (Nathan, 1992). NOS-1 and NOS-3 were mapped to distal and
proximal regions of murine chromosome 5, respectively (Gregg et al, 1995; Lee et al,
1995). The NOS-1 and NOS-3 are constitutively expressed while NOS-2 is inducible
(Reiss and Komatsu, 1998). IFN has been shown to be a potent inducer of NOS-2. In
many virus infections such as Sindbis virus and Herpes Simplex virus type I, NO has an
important role in inhibiting viral replication, promoting viral clearance and eventually
host recovery (Reiss and Komatsu, 1998). In flavivirus infection, NO activity
contributes both to recovery and immunopathology, depending on the type of infecting

CHAPTER 1
LITERATURE REVIEW
23
virus. During in vitro infection with JEV, NO caused inhibition of viral RNA, viral
protein accumulation and virus release from infected cells. In mice infected with the
same virus, inhibition of NO resulted in increased mortality, demonstrating the antiviral
role played by NO in JEV infection (Lin et al, 1997). The pathogenesis of TBEV in
contrast was shown to be partially mediated by NO. Blocking of its production by
administration of a competitive inhibitor of NOS-2 increased the mean survival time of
infected mice although they eventually succumbed to the infection (Kreil and Eibl,
1996). It was suggested that NO production increased cerebral blood flow and
peripheral inflammatory cell recruitment, which eventually led to the BBB breakdown.
1.3.1.3 Natural killer cells
Natural killer (NK) cells have the ability to kill infected cells by releasing granzymes
and perforin or by binding to the death receptors on the cell surface. A decrease in MHC
class I expression on target cells prompts NK cell activation by attenuating the
inhibitory signals. NK cell dependent lysis and antibody dependent mediated
cytotoxicity against DENV-infected cells has been observed (Kurane et al, 1984).
However, the bulk of evidence suggests that flaviviruses evade the NK surveillance by
up-regulating the expression of MHC class I molecules as well as adhesion molecules
(King and Kesson, 1988). Consistent with this, splenocytes from WNV-immunised
mice had poor NK cell lytic activity (Momburg et al, 2001) and mice that were
genetically deficient in NK cells did not exhibit increased morbidity or mortality rate
compared to wild type control mice during flavivirus (Chambers and Diamond, 2003).
1.3.1.4 Neutrophils
Neutrophils are also known as polymorphonuclear cells and respond rapidly to
chemotactic stimuli and are activated by cytokines (Nash and Usherwood, 2000).
Mortality following peripheral infection of MVEV strain BH3479 in weanling Swiss
mice is associated with development of encephalitis and inflammatory responses, which
is predominated by the presence of neutrophils (Andrews et al, 1999). The infiltration of
neutrophils was preceded by an increased mRNA expression of TNFα and the
neutrophil-attracting chemokines N51/KC which is a murine homolog to human IL-8.
The mRNA expression of inducible NOS (iNOS) coincided with the presence of
neutrophils in the brain and onset of encephalitis. Depletion of neutrophils with

CHAPTER 1
LITERATURE REVIEW
24
monoclonal antibodies resulted in higher survival although similar viral titres in the
brains were detected as in the brains of control mice. Neutrophils possibly induce their
deleterious effect in the CNS by producing NO and other inflammatory mediators,
which may disturb CNS homeostasis and neuronal functions (Andrews et al, 1999).
1.3.2 ADAPTIVE IMMUNITY
There are two branches of adaptive immunity based upon the major components that
mediate the response; humoral and cell mediated immunity. Humoral immunity mainly
involves antibodies (produced by B cells) which recognise as well as eliminate antigen
while cell mediated immunity involves T lymphocytes (Becher et al, 2000). In an
infected host, the bias to mount either one of these types of specific immune response is
dependent on CD4+ helper T cells. In order for CD4+ cells to mediate the effect, they
must recognise the antigenic peptide/MHC II complexes and co-stimulatory molecules
present on the cell surface of APCs (reviewed in Mullbacher et al, 2003). Following
this, CD4+ helper T cells then become activated and differentiate into two major
subpopulations that differ in the cytokine profiles that they secrete (Becher et al, 2000).
T helper 1 (Th1) cells secrete IL-2, IFNγ and TNFβ and thus mediate a cellular immune
response through activation of macrophages and cytotoxic T cells. Th2 cells on the
other hand secrete IL-4, IL-5, IL-6, IL-10 and IL-13, leading to the maturation of B
cells and degranulation of mastocytes, therefore inducing the humoral immune response
(Santana and Rosenstein, 2003).
The role of both humoral and cell mediated immune responses in either protection or
immunopathology of flavivirus infections have been investigated mostly using murine
model utilising different viruses and routes of inoculation. B and T cells have been
shown to have different roles during disease development in different experimental
models.

CHAPTER 1
LITERATURE REVIEW
25
1.3.2.1 Humoral mediated immunity
Many studies have been undertaken to study the role of humoral immune response in
protecting infected host from fatal flavivirus infection. Antibody mediates its effect via
virus neutralisation, which inhibits virus attachment, prevents release of cell-bound
virus or blocks the fusion step associated with un-coating of virus particles (Hooper
et al, 2002). All of these steps result in protecting cells from being infected. However, if
virus has already entered the cells, antibody can clear the virus through complement-
mediated cell lysis or antibody-dependent cytotoxicity that results in cell lysis (Hooper
et al, 2002). Antibody may also utilise a non-lysis mechanism to rid the virus from cells
such as by inhibiting viral RNA transcription and restoring antiviral function of IFN in
infected cells (Dietzschold et al, 1992).
Following flavivirus infection, neutralising antibodies (NA) are mostly induced by the
E protein that has antibody eliciting epitopes widely distributed over its surface (Heinz,
1986; Roehrig et al, 1989). Non-neutralising yet protective antibodies on the other hand
have been reported to recognise the NS1 proteins. Immunisation with recombinant or
purified NS1 has been shown to be protective against flavivirus challenge (Calvert et al,
2006; Hall et al, 1996). Following in vitro and in vivo studies, protection by anti-NS1
antibodies has been previously reported to operate via the Fc receptor dependent
mechanism (reviewed in Brinton et al, 1998). However, Chung and co-workers (2006)
have recently demonstrated that distinct regions of NS1 could also elicit humoral
immunity through an Fc receptor independent mechanism. Other viral proteins that are
also immunogenic for humoral mediated immunity are C, prM, NS3, NS4B and NS5
(Brinton, 1998). Induction of both neutralising antibodies and non-neutralising
antibodies have been reported following infection with several flaviviruses including
JEV, MVEV, DENV, and YFV (Kurane, 2002; Konishi et al, 1995; Chambers and
Diamond, 2003).
Antibodies usually can be detected 4-6 days following peripheral infection and usually
associated with the termination of viraemia and the presence of virus in the brain (Bhatt
and Jacoby, 1976; Diamond et al, 2003b). During JEV infection, hemagglutination
inhibition (HI) antibody and NA were first detected in 1 week and persisted up to
5 weeks (Mathur et al, 1983). IgM antibodies usually predominate early in infection
while IgG antibodies appear later (Monath and Borden, 1971). IgM and IgG antibodies

CHAPTER 1
LITERATURE REVIEW
26
are important in controlling flavivirus infection, with the former antibodies involved in
preventing viral dissemination early in infection and in induction of IgG antibodies
production. IgG antibodies are then involved in shaping up the adaptive immune
response (Diamond et al, 2003b; Engle and Diamond, 2003).
The important role of humoral immunity in flavivirus infection became evident when
mice were treated with cyclophosphomide; a chemical that suppresses B cells and to a
lesser extent T cells prior to virus infection. The immunosuppressed mice did not
develop detectable anti flavivirus antibodies and this resulted in extended viraemia,
higher CNS viral burden and increased mortality (Bhatt and Jacoby, 1976; Camenga
et al, 1974; Cole and Nathanson, 1968). Diamond and co-workers (2003b) have further
defined the importance and specific role of antibody using wild type and genetically
deficient mice. Upon infection of low passage WNV via the footpad, wild type mice
developed viraemia on day 2 p.i. but the virus became undetectable on day 6 p.i. In
contrast, B cell deficient (µMT) mice had prolonged viraemia that lasted up to day 8 p.i.
In addition, viral titres in peripheral organs and the CNS were also much higher in µMT
mice and all died from WNV-induced encephalitis. When these mice were given heat-
inactivated serum from infected and immune wild type mice, they were protected from
the disease although the protection was not long lasting. Protection was shown to
depend on the initial amount of the immune serum given but eventually all mice
succumbed to viral infection when the antibody level had waned, with some mortality
observed as late as 60 days after infection (Engle and Diamond, 2003). This was in
contrast to wild type animal in which passive administration of immune serum
completely protected them from flavivirus infection and no mortality was observed even
after several months. In µMT mice, virus probably still replicated at low level and
persisted following administration of immune serum. When antibody titres eventually
declined, virus could replicate at higher levels again and subsequently induce fatal
encephalitis in the animal (Engle and Diamond, 2003). This study demonstrated that
antibodies are important in preventing virus dissemination and viraemia but they are not
sufficient to completely clear the virus.
Following brain infection with other viruses, antibodies have been shown to be pivotal
in clearing Rabies virus, mouse hepatitis virus (MHV), Theiler’s murine
encephalomyelitis virus (TMEV) and Sindbis virus from neurons in the CNS, while
CD8+ T cells only played an auxiliary role in some of these virus infections (Binder and

CHAPTER 1
LITERATURE REVIEW
27
Griffin, 2003; Kimura and Griffin, 2000). In neuronal infection with Sindbis virus,
inhibition of viral replication occurs when antibodies bind to the viral glycoproteins on
the cell surface membrane (Nash and Usherwood, 2000). In some studies, IFN type I
has been reported to act synergistically with antibodies to inhibit viral replication
(Griffin, 2003).
Although humoral immunity has a protective role in many virus infections, it can also
have a detrimental effect and contribute to the pathogenesis in some virus-induced
diseases. DHF is a classical example of an immunopathological disease, which is
humoral immunity-mediated. There are four DENV serotypes and individuals who have
had a previous infection with one DENV serotype have a higher risk of developing DHF
following secondary infection with a different DENV serotype than individuals without
prior infection (reviewed in Mackenzie et al, 2004). This disease may be caused by
ADE, when subneutralising antibodies from one serotype of DENV enhance the
infectivity of another DENV serotype for macrophages and monocytes by facilitating
the uptake of virus-antibody complexes via the Fc receptor (Burke and Monath, 2001).
This may increase the number of infected cells and eventually increase the production
of virus. Broom and co-workers reported a similar ADE phenomenon in mice infected
with MVEV (2000). When 3 weeks old mice received immune sera from mice
previously infected with sublethal dose of MVEV and JEV prior to MVEV challenge,
these mice were protected from fatal outcomes. However, when similar experiments
were performed using immune sera obtained upon sublethal challenge with KUNV or
passively immunised with JEV vaccine, mice succumbed to MVE infection. In fact,
mice passively immunised with JEV vaccine died more rapidly than the control group,
which received non-immune serum. This suggests that ADE may be involved in
accelerating disease development, as it is known that immunisation with live virus
induces higher levels of antibody than inactivated vaccine (Broom et al, 2000).
1.3.2.2 Cell-mediated immunity
Cell-mediated immunity (CMI) is mediated by T lymphocytes, CD4+ and CD8+ T
cells. T lymphocytes are initially naive cells and they require priming for the induction
of their effector functions (Santana and Rosenstein, 2003). APCs process antigenic
peptides for presentation by MHC II molecules, which are then recognised by CD4+ T
cells. In contrast, CD8+ T cells recognise MHC I/peptide complexes that are presented

CHAPTER 1
LITERATURE REVIEW
28
on infected cells. Activation of T cells consequently results in induction of effector
activity of T cells; which involves cytolysis of infected cells and/or control of infection
via cytokine production (Mullbacher et al, 2003).
The CMI has been suggested to have a more important role than humoral immune
response in recovery from flavivirus infection (Bhatt and Jacoby, 1976). T cells induced
following flavivirus infection or immunization usually have broad cross-reactivity,
although this also depends on the genetic background (MHC haplotypes) of the
experimental animals used (Hill et al, 1992; Kulkarni et al, 1992; Kurane, 2002;
Chambers and Diamond, 2003). The differences in MHC haplotyes also influence the
multiple epitopes recognised by T cells. For example, the CTL from BALB (H-2d) mice
recognise E protein while C57BL/6 mice (H-2b) and C3H mice (H-2k) mainly
recognise the NS1 protein during JE infection (Takada et al, 2000). In addition to
genetic background of the mice, virus strain could also affect the antigenic peptide
recognised by T cells. During MVEV infection, NS3 protein was the dominant source
of antigenic peptide for cytotoxic T cell recognition (Lobigs et al, 1994)
Previous studies using mice with suppressed T cells functions clearly showed the
importance of CMI in clearing flavivirus and to some extent preventing mortality in
infected hosts (Camenga et al, 1974; Nathanson and Cole, 1974). Adoptive transfer of
immune spleen cells conferred protection to mice against flavivirus infections
(Camenga et al, 1974; Mathur et al, 1983; Murali-Krishna et al, 1996; Desai et al,
1997). In JEV infection, when mice were given immune spleen cells lacking either T or
B cells prior to intracerebral virus challenge. Protection from encephalitis was abrogated
by depletion of T cells but not B cells (Mathur et al, 1983).
Many recent studies were undertaken to define the role of individual cells of the CMI
especially CD8+ T cells in immunopathology or protection following flavivirus
infection. However the role of these cells is very much influenced by factors such as the
strain of mice, type of infecting virus as well as the route of virus inoculation. In mice
that were previously immunised and then challenged i.c. with neuroadapted YF strain
17D, B cell, CD4+ and CD8+ deficient mice had 0%, 6.6% and 85% survival rates
respectively, despite the higher levels of CD8+ T cells detected in the brains of wild
type mice relative to CD4+ T cells (Liu and Chambers, 2001). This indicated that
although CD8+ T cells are functional during YFV clearance, they are not critical for

CHAPTER 1
LITERATURE REVIEW
29
survival of these mice and that antibody response driven by CD4+ is probably the
mechanism involved in conferring protection from the fatal outcome (Liu and
Chambers, 2001). Studies with other viruses such as the JHM strain of neurotrophic
mouse hepatitis virus also revealed the importance of CD4+ T cells in virus clearance
(Stohlman et al, 1998). During i.c. infection of this virus, there were more CD8+ T cells
infiltrating the brain in comparison to CD4+ T cells. However, the expression of CD8+
CTL effector function in the brain parenchyma is CD4+ dependent, and the absence of
CD4+ T cells in the CNS resulted in rapid apoptosis of CTL cells. Murali-Krisha and
co-workers (1996) have demonstrated that both CD4+ and CD8+ T cells are required
for protection against JEV infection in mice. In contrast, studies with WNV isolated in
New York indicated that CD8+ T cells have a more important role in animal recovery
(Diamond et al, 2003a; Shrestha and Diamond, 2004). Mice that lack CD8+ T cells
were more prone to the disease and had increased mortality following subcutaneous
WNV challenge. In these mice, although brain viral production is much higher than
wild type mice, absence of CD8+ T cells did not have any effect on antibody response
as well as the kinetics or magnitude of viraemia. In some CD8+ T cell deficient mice
that survived the infection, infectious virus could be recovered from the brain several
weeks later, indicating the pivotal role played by this subset of T cells in clearing the
virus and preventing persistent infection (Shrestha and Diamond, 2004). During
infection with viruses other than flaviviruses, impaired CD8+ T cell response has been
reported to affect clearance of Lymphocytic choriomeningitis virus (LCMV) but not
Influenza, Sendai or Vaccinia viruses (Mangada et al, 2002).
Intravenous (i.v.) infection of WNV Sarafend in mice showed the dual role of CD8+ T
cells; in recovery and immunopathology during virus infection (Wang et al, 2003b).
When mice were infected with either low or high doses of virus, cellular infiltrates
detected were predominantly CD8+ T cells and not CD4+ T cells. While CD8+ T cells
contributed to the recovery in mice infected with the low WNV dose, this cell type
caused immunopathology in mice challenged with the high WNV dose. At high dosage,
i.v. infection resulted in 100% mortality of infected mice. In contrast, virus challenge in
CD8+ T cell deficient mice increased mean survival time and reduced mortality,
indicating that CD8+ T cells contributed to the pathogenesis of WNV. In addition,
several other studies have shown that cross-reactive T cells could lead to DHF by
causing tissue damage and production of cytokines that aggravate vascular leakage
(Loke et al, 2001). It has been suggested that following secondary DENV infection, the

CHAPTER 1
LITERATURE REVIEW
30
pre-existing low avidity memory T cell population expands at a higher rate than the
naive high avidity T cell population resulting in deregulation of immunological
response to DENV infection (Navarro-Sanchez et al, 2005). Children suffering from
DHF were found to have elevated levels of soluble CD8+ T cells in the serum in
comparison to children suffering from dengue fever (DF) only (Kurane et al, 1991).
Upon recognition with MHC I proteins complexed with short viral peptide, T cells
become activated and mediate their effect through two independent effector functions;
production of IFNγ or cytolytic activity (Regner et al, 2001). Cytolysis could occur
through the release of granules, perforin and granzymes from CTL towards target cells,
or via ligation of Fas receptor on target cells with Fas ligand on CTL. Both mechanisms
however have the same consequence; target cells will undergo apoptosis (Wang et al,
2004b). In vitro, CTL activity has been observed in mice infected with WNV and JEV
(Kesson et al, 1987; 1988; Murali-Krishna et al, 1994). In mice i.v. infected with low
dose of MVEV and WNV, although CD8+ T cells were induced in both infections
(Wang et al, 2003b; Licon Luna et al, 2002), further analysis showed that this subset of
T cells function differently even in a closely related flavivirus infections. The cytolytic
mechanism of T cells is involved in neuropathology of MVEV but in contrast; it
contributed to neuroprotection during WNV infection (Wang et al, 2004b; Licon Luna
et al, 2002). Mice deficient in either the granule exocytosis- or Fas-mediated pathways
of cytotoxicity or both were less susceptible to peripheral low dose MVEV infection,
demonstrating the immunopathological role played by CTL during virus infection.
Mullbacher and co-workers (2003) proposed that in wild type mice, CTL killed infected
endothelial cells lining the brain capillaries, causing a breakdown of the BBB and
allowing virus to enter the brain. However, in mice deficient in cytotoxicity pathways,
endothelial cells remained intact and did not undergo cytolysis and therefore BBB
breakdown and viral invasion of the CNS did not occur or was delayed.
1.3.3 SOLUBLE MEDIATORS
1.4.3.1 Cytokines
Cytokines are soluble proteins that have an important and key role in the induction and
maintenance of inflammation, the immune response and embryonal development (Kunzi
and Pitha, 2000). As potent inflammatory molecules, they have been implicated in many

CHAPTER 1
LITERATURE REVIEW
31
immune-mediated diseases (Lucey et al, 1996). The cytokine expression profile is
regulated by 2 different T-helper (Th) cell subsets (Kunzi and Pitha, 2000). It can either
be Th1 which is associated with production of IFNγ, IL-2, IL-12 and predominantly
leads to CMI; or Th2 which usually involves expression of IL-4, IL-5, IL-6 and IL-10
and associated with humoral mediated immunity and suppression of CMI (Lucey et al,
1996; Gouwy et al, 2005). The Th1 cells secrete factors that inhibit development of
cytokines from Th2 cells and vice versa.
The production of a particular subset of cytokines is dependent on many factors such
type of virus, route of inoculation, type of cells being infected as well as the genetic
background of the host. Infection of RNA viruses such as LCMV in rodent CNS
generated strong Th1 response with production of TNFα, IL-1, IL-6 and IFNγ observed
in the brain. In contrast, Sindbis virus that infects neurons and causes acute
encephalomyelitis was shown to elicit Th2 responses (reviewed in Kunzi and Pitha,
2000). However, in other virus-induced diseases, cytokine production cannot be
associated with particular Th cell subsets. In patients suffering from DHF during a 1996
DENV epidemic in India, severity of disease correlated with high levels mRNA and
serum IL-8 (Raghupathy et al., 1998). However, sera from Cuban patients suffering
from DF or DHF were shown to contain high levels of IL-10 compared to the
uninfected control group (Perez et al, 2004). Studies with JEV infection in humans
revealed that elevated levels of proinflammatory cytokines and chemokines are
associated with a poor prognosis (Winter et al, 2004). IFN, IL-6, IL-8 levels were high
in the cerebrospinal fluid (CSF) of JEV infected patients, which succumbed to disease
whereas RANTES/CCL5 chemokine was elevated in the plasma of the same patients.
However, whether the production of these soluble mediators contributes to the
pathogenesis of virus infection or simply as a result of viral burden is not known.
1.3.3.1.1 IFN type I
IFN type I consists of IFNα and IFNβ, and they are secreted by most cells in response to
infection or other stimuli. Murine IFN is encoded by a family of 11 genetically
closely related intronless genes while IFN is encoded by a single gene (Higashi et al,
1983; Shaw et al, 1983). The initial response occurs when virus enters the cell, and then
produces viral components including dsRNA. Presence of dsRNA activates

CHAPTER 1
LITERATURE REVIEW
32
transcription factor IRF-3, IRF-7, NF-kB and activating transcription factor (ATF2)/c-
Jun and subsequently inducing IFN production (Munoz-Jordan et al, 2003).
Once secreted, these cytokines act in both autocrine and paracrine manner by binding to
a cell surface receptor both on infected cells and neighbouring cells, activating the Janus
kinase (JAK), signal transducer and activator of transcription (STAT) and inducing
transcription of hundreds of IFN-inducible genes (Smith et al, 2005; Munoz-Jordan et
al, 2003; Haller et al, 2006). This cytokine acts within hours of infection and has 3
major roles in the cells: antiviral, antiproliferative and immunomodulatory (Nash and
Usherwood, 2000). Both in vitro and in vivo studies have shown the importance of this
cytokine in protecting infected cells or host from a fatal outcome during flavivirus
infections. Treatment of cell cultures with IFN type I prior to WNV and DENV virus
infection protects cells from death (Samuel and Diamond, 2005; Diamond et al, 2000).
During natural infection of flaviviruses, dendritic cells may be the first cell types to
produce IFN type I and initiate a cascade of antiviral reactions (reviewed in Navarro-
Sanchez et al, 2005; Chambers and Diamond, 2003). IFN may inhibit viral replication
by preventing translation and replication of infectious viral RNA via both RNase L and
Protein Kinase R dependent or independent mechanisms (Diamond and Harris 2001;
Diamond et al, 2000). Mice that are deficient in type I IFNs, or their receptor, show
increased susceptibility to flaviviruses (Lobigs et al, 2003a). In murine DENV-2
infection, IFNαβ has been demonstrated to be an important early immune mediator that
limits viral replication in extraneural tissues and subsequently reduces or prevents viral
spread to the CNS (Shrestha et al, 2004). Similar observations were also reported in
WNV infection (Samuel and Diamond, 2005). IFNαβ receptor deficient mice had 100%
mortality with a mean time to death of about 4 days post infection following
subcutaneous challenge of the virus. In contrast, wild type mice only had 62% mortality
and a longer mean time to death (Samuel and Diamond, 2005).
However, protection conferred by IFN type I apparently occurs only if cells or animals
are pretreated with the cytokine before infection. Treatments of IFN type I after
infection have very little or no effect on viral replication. WNV and DEN infections
have been demonstrated to inhibit the interferon signalling and its antiviral mechanism
(Guo et al, 2005; Munoz-Jordan et al, 2003). Treatment of cells or animals with IFNα
at 4 h after DENV or SLEV infection resulted in almost complete inability of IFNα to
induce antiviral activity (Diamond et al, 2000). Similarly, IFNα treatment of patients
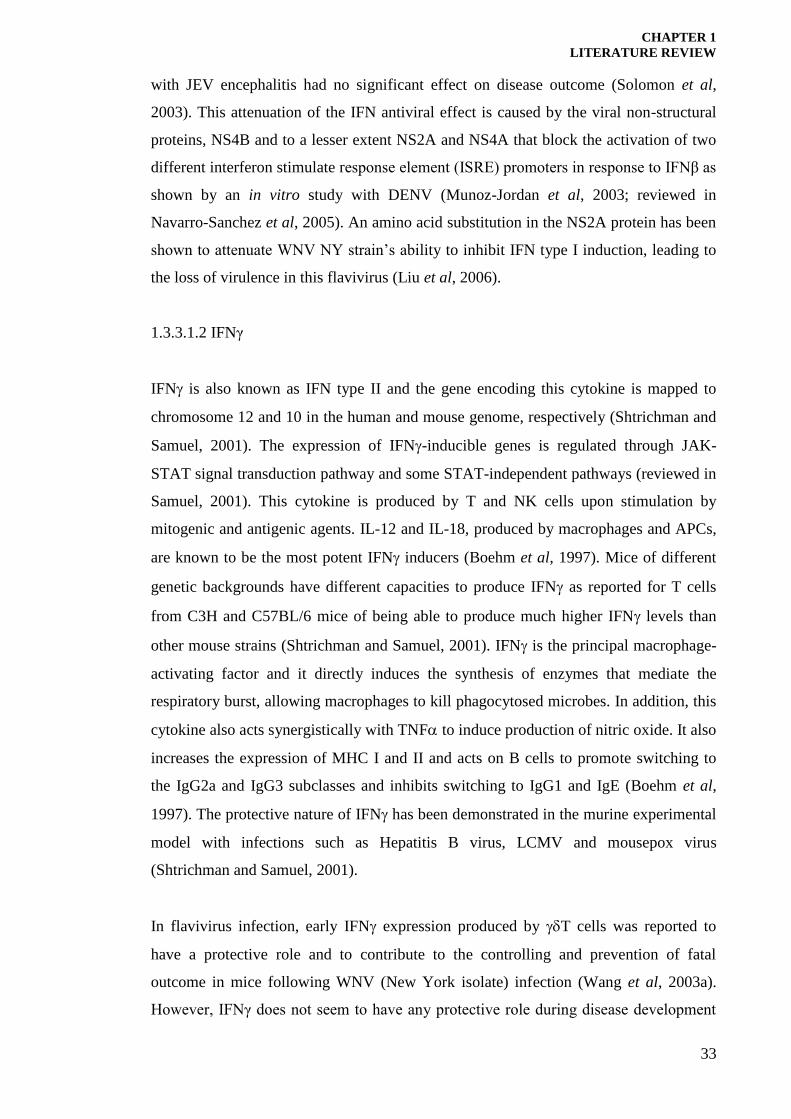
CHAPTER 1
LITERATURE REVIEW
33
with JEV encephalitis had no significant effect on disease outcome (Solomon et al,
2003). This attenuation of the IFN antiviral effect is caused by the viral non-structural
proteins, NS4B and to a lesser extent NS2A and NS4A that block the activation of two
different interferon stimulate response element (ISRE) promoters in response to IFNβ as
shown by an in vitro study with DENV (Munoz-Jordan et al, 2003; reviewed in
Navarro-Sanchez et al, 2005). An amino acid substitution in the NS2A protein has been
shown to attenuate WNV NY strain’s ability to inhibit IFN type I induction, leading to
the loss of virulence in this flavivirus (Liu et al, 2006).
1.3.3.1.2 IFNγ
IFN is also known as IFN type II and the gene encoding this cytokine is mapped to
chromosome 12 and 10 in the human and mouse genome, respectively (Shtrichman and
Samuel, 2001). The expression of IFN-inducible genes is regulated through JAK-
STAT signal transduction pathway and some STAT-independent pathways (reviewed in
Samuel, 2001). This cytokine is produced by T and NK cells upon stimulation by
mitogenic and antigenic agents. IL-12 and IL-18, produced by macrophages and APCs,
are known to be the most potent IFN inducers (Boehm et al, 1997). Mice of different
genetic backgrounds have different capacities to produce IFN as reported for T cells
from C3H and C57BL/6 mice of being able to produce much higher IFN levels than
other mouse strains (Shtrichman and Samuel, 2001). IFN is the principal macrophage-
activating factor and it directly induces the synthesis of enzymes that mediate the
respiratory burst, allowing macrophages to kill phagocytosed microbes. In addition, this
cytokine also acts synergistically with TNF to induce production of nitric oxide. It also
increases the expression of MHC I and II and acts on B cells to promote switching to
the IgG2a and IgG3 subclasses and inhibits switching to IgG1 and IgE (Boehm et al,
1997). The protective nature of IFN has been demonstrated in the murine experimental
model with infections such as Hepatitis B virus, LCMV and mousepox virus
(Shtrichman and Samuel, 2001).
In flavivirus infection, early IFN expression produced by T cells was reported to
have a protective role and to contribute to the controlling and prevention of fatal
outcome in mice following WNV (New York isolate) infection (Wang et al, 2003a).
However, IFNγ does not seem to have any protective role during disease development

CHAPTER 1
LITERATURE REVIEW
34
following MVEV and YFV infections in mice (Lobigs et al, 2003a; Liu and Chambers,
2001). During i.v. infection with small doses of MVEV, IFN was reportedly to have no
beneficial role as mice deficient in IFN had only marginally increased mortality
compared to wild type mice (Lobigs et al, 2003a). Similarly, infection of YFV in IFN
knockout mice also did not increase the mice susceptibility to virus-induced encephalitis
although brain virus titres were higher in these mice indicating the role of IFN in
clearing the virus (Liu and Chambers, 2001). Interestingly, IFNγ has been demonstrated
to have an immunopathological role following i.p. infection with WNV Sarafend strain
(King et al, 2003). In IFNγ knockout mice, mortality reduced after WNV infection,
although kinetics of virus replication were similar in both wild type and IFNγ deficient
mice. In contrast, during DENV infection, IFN had dual roles; it elicited antiviral
activity against this virus but was also shown to help enhance virus infection that
eventually resulted in DHF (Sittisombut et al, 1995; Kontny et al, 1998; Libraty et al,
2001).
1.3.3.1.3 TNF
TNF is a 17-kDa proinflammatory cytokine, which is produced mainly by monocytes
and macrophages in response to infectious stimuli (Ravi et al, 1997). It is also a
pleiotropic soluble mediator as most all cells express at least one or the two types of
TNF receptors (TNFR I and TNFR II) (Darnay and Agarwal, 1999). While TNF I
transduces both death and survival signals, TNFR II only transduces survival signals
(Mizuno et al, 2001). TNF has an important role in various processes ranging from
promoting viral replication and evasion of host defences to activation of the immune
system by modulating the production of an array of cytokines (Ravi et al, 1997). Thus,
this cytokine could influence the outcome of diseases, by either being involved in
protection or exaggeration of virus infections. One of TNF inducers is IFN and these
two cytokines have been demonstrated to act together to provide antiviral activity and
protection during infections such as vaccinia virus (Sambhi et al, 1991), adenovirus
(Elkon et al, 1997) and herpes simplex virus (Kodukula et al, 1999). However,
induction of TNF in the CNS may also cause immunopathology as it is involved in
demyelination process, has cytotoxic effects on the endothelium and induces necrosis in
oligodendrocytes (Ravi et al, 1997)
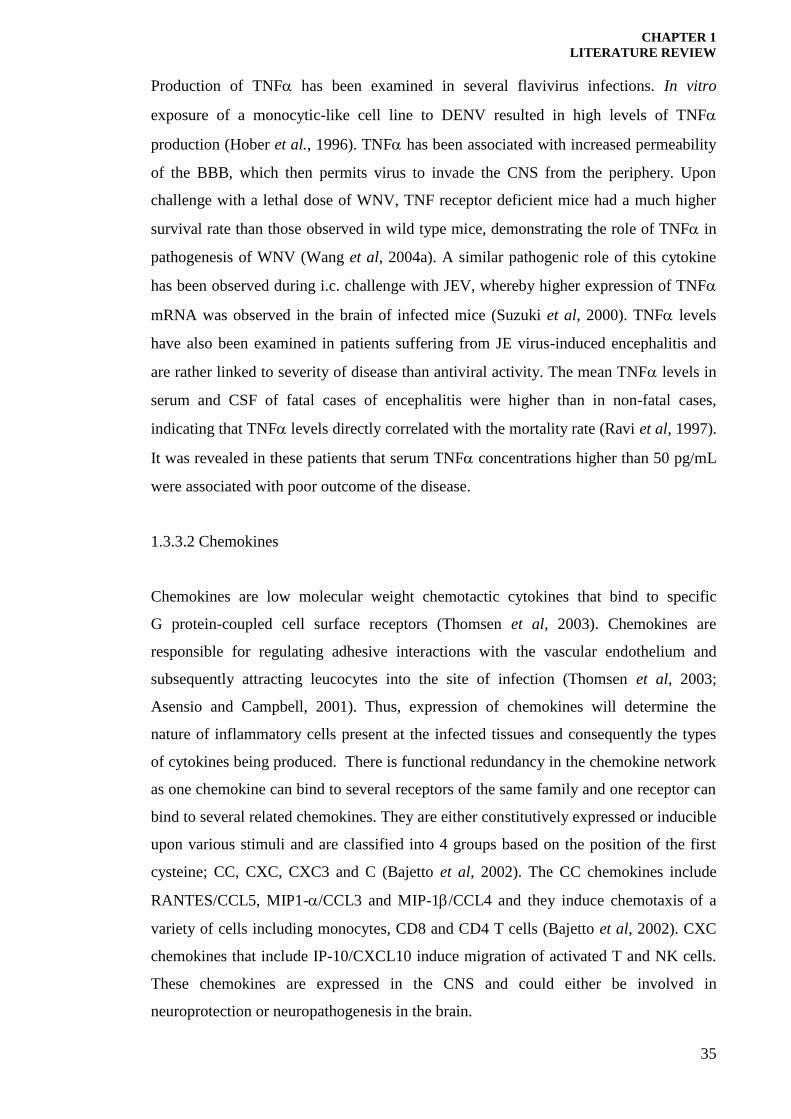
CHAPTER 1
LITERATURE REVIEW
35
Production of TNF has been examined in several flavivirus infections. In vitro
exposure of a monocytic-like cell line to DENV resulted in high levels of TNF
production (Hober et al., 1996). TNF has been associated with increased permeability
of the BBB, which then permits virus to invade the CNS from the periphery. Upon
challenge with a lethal dose of WNV, TNF receptor deficient mice had a much higher
survival rate than those observed in wild type mice, demonstrating the role of TNF in
pathogenesis of WNV (Wang et al, 2004a). A similar pathogenic role of this cytokine
has been observed during i.c. challenge with JEV, whereby higher expression of TNF
mRNA was observed in the brain of infected mice (Suzuki et al, 2000). TNF levels
have also been examined in patients suffering from JE virus-induced encephalitis and
are rather linked to severity of disease than antiviral activity. The mean TNF levels in
serum and CSF of fatal cases of encephalitis were higher than in non-fatal cases,
indicating that TNF levels directly correlated with the mortality rate (Ravi et al, 1997).
It was revealed in these patients that serum TNF concentrations higher than 50 pg/mL
were associated with poor outcome of the disease.
1.3.3.2 Chemokines
Chemokines are low molecular weight chemotactic cytokines that bind to specific
G protein-coupled cell surface receptors (Thomsen et al, 2003). Chemokines are
responsible for regulating adhesive interactions with the vascular endothelium and
subsequently attracting leucocytes into the site of infection (Thomsen et al, 2003;
Asensio and Campbell, 2001). Thus, expression of chemokines will determine the
nature of inflammatory cells present at the infected tissues and consequently the types
of cytokines being produced. There is functional redundancy in the chemokine network
as one chemokine can bind to several receptors of the same family and one receptor can
bind to several related chemokines. They are either constitutively expressed or inducible
upon various stimuli and are classified into 4 groups based on the position of the first
cysteine; CC, CXC, CXC3 and C (Bajetto et al, 2002). The CC chemokines include
RANTES/CCL5, MIP1-/CCL3 and MIP-1/CCL4 and they induce chemotaxis of a
variety of cells including monocytes, CD8 and CD4 T cells (Bajetto et al, 2002). CXC
chemokines that include IP-10/CXCL10 induce migration of activated T and NK cells.
These chemokines are expressed in the CNS and could either be involved in
neuroprotection or neuropathogenesis in the brain.

CHAPTER 1
LITERATURE REVIEW
36
Generally, there is a typical profile of chemokines induced following virus infection,
which include RANTES, MIP-1, MIP-1, IP-10 and MCP-1 (reviewed in Thomsen
et al, 2003). Shirato and co-workers (2004b) compared expression of chemokines in
lethal (NY99) versus non-lethal WNV (Eg101) subcutaneous infection mice. Among
the CC and CXC chemokines that were under study, RANTES, MIP1, MIP-1 and IP-
10 mRNA expression were highly up-regulated upon lethal WNV infection which
suggested that these soluble mediators may be directly involved in the pathogenesis of
the virus. In contrast, BMAC mRNA was highly up-regulated later during infection in
non-lethal Eg101 compared to the lethal NY99 WNV virus. BMAC, which is
chemotactic agent for B cells and monocytes, may contribute to the protective nature of
the immune system later in infection by inducing macrophages migration (Shirato et al,
2004b). RANTES/CCL5 chemokine has been demonstrated to have a more protective
than immunopathological role upon infection with WNV strain NY99. Infection of mice
deficient in the receptor for RANTES/CCL5 (CCR5) resulted in higher mortality
(100%) as well as increased viral burden and reduced leucocytic infiltration when
compared to the wild type mice (Glass et al, 2005).
1.4 GENETIC RESISTANCE TO FLAVIVIRUSES
Host genetic resistance to certain pathogens is a very important factor in determining
the severity of virus-induced diseases. The susceptibility or resistance to disease varies
between individuals upon exposure to viral pathogens and this trait can be passed on to
the next generation (Brinton, 2001). At present, there are already a number of genes
identified to confer resistance to viral-induced diseases in the infected host (Brinton,
1997). Some operate independently while others may be synergised with other
components of the immune system to mediate an effect (Urosevic et al, 2000). The most
important features of host natural resistance to viruses are: it usually acts early during
the course of infection, it lacks the unique specificity of the immune system and it
confers protection only against a specific group or family of viruses (Urosevic and
Shellam, 2002). Resistance to influenza virus in mice for example is attributed to the
Mx gene (Haller et al, 1979). This resistance gene is mapped to chromosome 16, is IFN-
inducible and reduces viral replication at the level of viral mRNA synthesis (Krug et al,
1985). Another example is the Cmv1 gene, which restricts murine cytomegalovirus

CHAPTER 1
LITERATURE REVIEW
37
infection in the spleen (Scalzo, 1990). This gene is mapped to murine chromosome 6
and contributes to host resistance through NK cells (Scalzo et al, 1995). However, the
most relevant for this study is the Flvr gene conferring resistance to Flavivirus infection
as will be described in the following sections.
1.4.1 FLAVIVIRUS RESISTANCE IN HUMANS
Evidence of innate resistance to flaviviruses in humans is indirect at present. In Africa,
where YF was highly endemic, there were groups of people who seemed to be resistant
to the virus and did not suffer from any clinical manifestation of the disease whereas
strangers coming to this area were highly susceptible (Sabin, 1954). The mechanism of
human resistance is unknown but it’s been suggested that thousands of years of
exposure to YFV has eliminated individuals carrying susceptibility genes, while those
having the resistance genes survived the infection, resulting in genetically determined
natural human resistance to YFV (Sabin, 1954). By contrast, the shorter period of
exposure in the South American Indians to the same virus resulted in the mixed
incidence of severe and mild YF among these people (Sabin, 1952b).
1.4.2 FLAVIVIRUS RESISTANCE IN MURINE MODELS
1.4.2.1 History and development
The phenomenon of host innate resistance to flaviviruses is well established in murine
models. In 1931, Sawyer and Lloyd reported a variation in survival seen in different
mouse strains following i.c. inoculation of YFV. Lynch and Hughes (1936) then
demonstrated a strain of mice from the Rockefeller Institute in New York (Det) were
also less susceptible to i.c. challenge to YFV infection. Following this, Webster
(Webster and Clow, 1936; Webster, 1937) created four mouse strains with different
susceptibility to Salmonella enteritidis and two flaviviruses, louping ill (LI) and St.
Louis encephalitis (SLE). These mouse strains were known as bacteria-susceptible-
virus-susceptible (BSVS), bacteria-resistant-virus-susceptible (BRVS), bacteria-
susceptible-virus-resistant (BSVR) and bacteria-resistant-virus-resistant (BRVR).
Studies using these mouse strains showed that resistance to bacteria and to virus are
inherited independently. The brain viral titres in virus-susceptible strains were found to
be higher than in virus-resistant strains (Webster and Clow, 1936; Webster, 1937).

CHAPTER 1
LITERATURE REVIEW
38
Sabin made a further discovery of murine flavivirus resistance in 1944 when he
demonstrated that an outbred strain of mice at the Princeton Rockefeller Institute,
known as PRI mice were 100% resistant to i.c. challenge of YFV. Brain viral titres in
PRI mice were found to be 10,000 to 100,000 fold less than those found in susceptible
Swiss mice (Sabin, 1952a). Studies with other viruses showed that this resistance is
flavivirus specific as PRI mice were also resistant to WNV, JEV, SLEV, DENV and
Russian Spring Summer encephalitis virus (Sabin, 1952a; 1952b; 1954). The flavivirus
resistant mice however are equally susceptible to other arboviruses including Sindbis
virus, Ross River virus and Chikungunya virus (Hanson et al, 1969; Shellam et al,
1998). Sabin’s studies also suggested that this flavivirus-resistance-gene is inherited as
an autosomal, dominant trait controlled by alleles of a single genetic locus, which is
later known as Flv (Sabin, 1952b, Green 1989).
1.4.2.2 Flavivirus resistance in wild mice
Genetically controlled flavivirus resistance is not a common feature in laboratory strains
and it has only been previously described in a few mouse strains such as in Det, BSVR,
BRVR and PRI mice. On the other hand, resistance was shown to be widespread and
abundant in wild mice (Brinton and Perelygin, 2003). M. m domesticus mice trapped in
Maryland, Virginia and California in America in the early 1970s showed resistance to
17D YFV challenge (reviewed in Brinton and Perelygin, 2003). Additionally, wild
M. m domesticus mice found in Australia were also resistant to i.c. infection with
MVEV (Sangster and Shellam, 1986). Resistance in these wild mice appeared to be
attributed to the Flv gene (Sangster et al, 1998).
In addition, inbred strains derived from wild mice within the Mus complex have also
been tested for their flavivirus resistance. CASA/Rk and CAST/Ei strains derived from
M. musculus castaneus revealed similar resistance to C3H/RV (RV) mice. In contrast,
MOLD/Rk strain derived from M. musculus molossinus has different a resistance
phenotype than RV mice. MOLD/Rk mice were shown to have only moderate or
intermediate resistance to flaviviruses (Sangster et al, 1993). These mice survived i.c.
infection with 17D YFV but not with MVEV. It has been suggested that the occurrence
of flavivirus resistance in wild mice is due to the selective pressure of the virus
infections (Brinton, 1981).

CHAPTER 1
LITERATURE REVIEW
39
1.4.2.3 Development of congenic flavivirus mouse resistant strains
In order to study the resistance conferred by Flv possible under controlled laboratory
conditions, a virus-resistant mouse strain congenic to inbred-virus susceptible mice was
developed (Groschel and Koprowski, 1965). The first congenic strain established was
C3H.RV (RV) (later known also as C3H/PRI-Flvr), created by 8 generations of
backcross breeding between PRI and C3H/He mice (Goodman and Koprowski, 1962a;
Groschel and Koproswski, 1965). For many years, this was the only flavivirus resistant
congenic strain available until new strains were developed in the 1990’s. C3H/MOLD-
Flvmr
(MOLD) was generated by introducing the genetic locus from MOLD/Rk strain
into the genetic background of C3H/HeJARC (HeJARC) mice; by backcross breeding
and further brother and sister matings (Urosevic et al, 1999). MOLD/Rk mice showed
different resistance phenotype than PRI mice, where the former mice were only resistant
to i.c. infection of YFV but not MVEV OR2 (minor resistance) (Sangster et al, 1993).
Thus, YFV virus was used to select the offspring from the backcross breeding carrying
the moderate resistance gene. By limited allelism analysis, the minor resistance
expressed in MOLD/Rk mice were shown to be an allelic variant at the Flv locus and
thus has been designated as Flvmr
(Sangster et al, 1993). Another resistant strain was
also created in the same laboratory using a similar approach, this time using resistant
wild Mus domesticus mice trapped in Dubbo, New South Wales as the source of
resistance gene. This new strain was called C3H.M.domesticus.Flvr-like (DUB) and was
created by 11 generations of backcrossing to HeJARC mice (Urosevic et al, 1999). In
vivo and in vitro studies showed that DUB mice demonstrated similar but slightly
stronger levels of resistance than RV mice (Silvia et al, 2001). The susceptible HeJARC
mice used to create this congenic mouse strain were shown to be a lipopolysaccharide-
responsive subline of C3H.HeJ (HeJ) mice (Silvia and Urosevic, 1999). Urosevic and
co-workers (1999) reported that these three congenic resistant mouse strains (RV,
MOLD and DUB) carry different segments of the chromosome 5, encompassing Flv
embedded within the same genetic background of flavivirus-susceptible C3H mice. The
sizes of donor-derived chromosomal regions flanking the selected resistance alleles are
estimated to be 9 and 11cM in DUB and MOLD mice, respectively (Urosevic et al,
1999).

CHAPTER 1
LITERATURE REVIEW
40
1.4.2.4 Resistance expression in mice
Flavivirus resistant mice are only resistant to diseases induced by flaviviruses but they
can still be infected by the viruses. Thus, virus can still grow in the cells or tissues of the
resistant animals although at a much lower titres than in susceptible mice. Webster and
Clow (1936) were the first to provide data on virus growth in susceptible HeJ and
resistant RV mice. They showed that during SLEV infection, viral load in the brain of
infected resistant mice remained lower than in susceptible mice. A similar growth
pattern was also observed during i.c. challenge with WNV in the same strain of mice
(Hanson et al, 1969). Viral titres rose rapidly in susceptible mice whereas the virus
growth was delayed in resistant mice with maximum titres at about 3 log lower than in
susceptible mice.
Viral replication in brains of other resistant mouse strains has been studied by Urosevic
and co-workers (1999). Intracerebral challenge of MVEV OR2 in HeJ mice resulted in
rapid virus growth and reached maximum on day 4 p.i. and mice died two days later. In
mild resistant MOLD mice, viral titres were significantly lower than in susceptible mice
although mice eventually succumbed to the infection. In resistant RV and DUB mice
however, virus replicated to a much lower level in comparison to susceptible and
moderately resistant mice. By day 10 p.i., no virus was detected and mice survived the
infection. YFV challenge was lethal for susceptible mice while all resistant mouse
strains were equally resistant to this virus (Urosevic et al, 1999).
1.4.2.5 Resistance expression in cell culture
Since the flavivirus resistance gene does not have any effect on viral entry or initial
viral replication, similar numbers of resistant and susceptible derived mouse embryo
fibroblasts (MEF) were shown to be infected with WNV by immunofluorescence
(Brinton-Darnell and Koprowski, 1974). Similar numbers of thioglycollate-elicited
macrophages from both resistant and susceptible mice were also found to be initially
infected with WNV (Silvia, 1999). However, virus replication is still lower in cells or
tissues derived from resistant mice in comparison to susceptible mice indicating that
innate resistance to flavivirus is expressed at the level of the individual cells. Ten to
hundred fold lower WNV titres were produced in MEF from resistant mice, compared
to MEFs from susceptible mice (Briton-Darnell and Koprowski, 1974). Nevertheless the

CHAPTER 1
LITERATURE REVIEW
41
maximum difference in viral titres between resistant and susceptible mice in vitro is not
as great as in vivo. For example, infection of resistant peritoneal macrophages with
MVEV OR2 resulted in only 10 times titres lower replication than in susceptible cell
cultures whereas the difference in maximum brain titres was more than 103.5
TCID50
units (Silvia et al, 2001). Expression of resistance has been found in primary brain cell
cultures, spleen cells, kidney cells, peritoneal macrophages and mouse-embryo
fibroblasts (Webster and Johnsen, 1941; Goodman and Koprowski, 1962a; Vainio
1963a; Vainio, 1963b; Hanson et al, 1969; Silvia et al, 2001; Pantelic et al, 2005).
However, primary cultures derived from astrocytes and skin fibroblasts do not
conclusively express flavivirus resistance in vitro (Silvia, 1999).
1.4.3 THE MECHANISM OF FLAVIVIRUS RESISTANCE
The action of the gene Flvr is virus specific; it only provides resistance to flavivirus
infections but not to other viruses (Sabin, 1952b; Shellam et al, 1988). Among the
flaviviruses that have been tested are WNV, KUNV, Alfuy virus, Kokobera virus,
SLEV, DENV, MVEV and Russian spring-summer encephalitis virus (reviewed in
Shellam et al, 1988). However the resistance conferred by the Flvr gene does not protect
the animal from non-flaviviruses such as arenaviruses, lymphocytic choriomeningitis,
picornavirus, poliovirus, Western equine encephalitis, Semliki Forest virus and others
(reviewed in Brinton and Perelygin, 2003). The major phenotypic features of the Flv
resistance are decreased production of infectious virus and limited spread to
surrounding cells (Urosevic and Shellam, 2002). From in vitro studies, it was shown
that the resistance conferred by Flvr gene acts intracellularly at the level of virus RNA
synthesis and assembly rather than at the level of virus entry (Brinton, 1983).
Defective interfering (DI) viruses were suggested to play a role in Flvr mediated
resistance. These DI particles usually contain deletions, often due to inversions or
rearrangement of the gene (reviewed by Urosevic and Shellam, 2002). Because
defective interfering (DI) particles do not produce replicase, they bind to the standard
virus replicase and as a consequence interfere with the infectious viral replication. DI
particles replicate to higher levels at high MOI when all infected cells contain infectious
viral genomes, resulting in reduced production of standard virus progeny (Dimmock and
Primrose, 1989; Dulbecco, 1990). However, evidence obtained so far suggested that
production of DI viruses is rather associated with persistently infected cell culture and is

CHAPTER 1
LITERATURE REVIEW
42
quite uncommon in animal studies. Persistently infected MEF derived from resistant
mice were shown to produce more DI and less infectious virus than cells from
susceptible mice upon WN infection (Brinton, 1983). Additionally, DI particles were
also observed during infection with Banzi, MVE and JE viruses (reviewed in Urosevic
and Shellam, 2002). Following challenge with Banzi virus, DI was only found in brains
of resistant mice but not in susceptible during i.p. infection but could not be
demonstrated from brains of both strains upon i.c. infection (Smith, 1981). When both
susceptible and resistant mice were infected i.c. with MVE, no accumulation of DI was
observed in resistant mice as well (Urosevic et al, 1997a). Thus, since the production of
DI particles was not always consistent with the resistance phenotype, DI viruses
possibly do not play a major role in Flvr mediated resistance but it may reflect the
characteristics of cell culture under study as well as the strain of virus used to infect the
mice.
The role of IFN type I in flavivirus resistance has not been found to be critical for its
expression (Vainio et al, 1961; Urosevic and Shellam, 2002). This is in contrast to the
Mx gene which confers resistance to influenza virus-induced diseases and it requires
induction of IFN for its induction (Haller et al, 1980). Resistance in RV mice was not
abrogated during i.c. 17D YFV infection when the antiviral effect of IFN was
neutralised by sheep anti-IFN αβ antibodies (Brinton et al, 1982). Brain viral titres
were slightly higher in IFN-depleted resistant mice but were still significantly lower
than in susceptible mice. Additionally, IFN type I production in brains of infected
susceptible mice was higher than in resistant mice following i.c. infection with KUN
and WNV (Shueb, 2002; Hanson et al, 1962). IFN production in these animals
correlated directly with viral titres and showed that Flv mediated resistance was indeed
IFN independent.
In contrast, RV derived MEFs and macrophages showed higher sensitivity to the
antiviral effect of IFN than HeJ derived MEFs (Hanson et al, 1969; Pantelic et al,
2005). Addition of exogenous IFN before WNV infection produced several times lower
viral titres in resistant than in susceptible cell cultures (Hanson et al, 1969; Pantelic et
al, 2005). Thus, although Flvr involvement in the reduction of viral replication is IFN
independent, it appears that IFN has the ability to potentiate this resistance effect. This
is possibly mediated by IFN-inducible factors encoded at loci closely linked to Flvr and
expressed only upon IFN stimulation (Urosevic and Shellam, 2002).

CHAPTER 1
LITERATURE REVIEW
43
NO is another antiviral molecule that has been implicated in many biological processes
including host defence against intracellular pathogens (Reiss and Komatsu, 1998;
Nathan, 1992). As NO was shown to contribute resistance to murine Hepatitis virus
(Pope et al, 1998) and since the Flv locus was mapped to the same region as NOS-1, a
possibility existed that the NOS-1 could be a potential candidate for the gene that
confers resistance to flaviviruses. However, Silvia and co-workers (2001) monitored the
level of brain NO production in susceptible HeJARC, RV and DUB mice upon i.c.
challenge with MVEV OR2 and found no difference in NO brain tissue levels before or
after the infection. Similar results were demonstrated when these 3 mouse strains were
infected i.c. with KUNV MRM 16 (Shueb, 2002). In vitro studies using mouse
macrophages infected with WN virus also showed similar levels of NO production in
these cells derived from either resistant or susceptible strains (Silvia et al, 2001). These
studies thus indicated that murine innate resistance to flavivirus conferred by Flvr is NO
independent.
1.4.4 ANALYSIS OF GENE CANDIDATE FOR FLAVIVIRUS RESISTANCE
GENE
Although the phenotypic expression of Flv has been well characterised in vivo and in
vitro, the search and validation for the possible gene candidate for Flv are still in
progress. Using a three-point backcross linkage analysis, Flv locus was initially mapped
to mouse chromosome 5, between the retinal degradation (rd) locus and the
glucoronidase structural gene (Gus-s) in the region encompassing 23cM of genetic
distance (Shellam et al, 1993; Urosevic et al, 1993; Sangster et al, 1994). However, by
employing a low-resolution genetic mapping, this region was narrowed to 1 cM
(Urosevic et al, 1995) and then further narrowed to 0.45cM using high-resolution
microsatellite analysis (Urosevic et al, 1997b).
However, using these genetic maps and a positional cloning approach, the Oas1b gene
has been recently identified as a possible Flv gene candidate (Perelygin et al, 2002;
Mashimo et al, 2002). The premature stop codon in the fourth exon of the Oas1b gene
present only in susceptible but not in resistant mice. This may result in the expression of
proteins that lack 30% of the C-terminal sequence compared to the proteins that are
expressed in resistance mice. This nonsense mutation results in a predicted truncated

CHAPTER 1
LITERATURE REVIEW
44
protein lacking a catalytic domain in susceptible hosts (Lucas et al., 2003). The intact
Oas1b protein is expressed in resistant mice including RV, BRVR, CASA/Rk and
CAST/Ei while similar predicted truncated Oas1b protein should be expressed in
susceptible BALB/c, HeJ, C57BL/6 and CBA/J, based on gene sequence analysis
(Brinton and Perelygin 2003; Mashimo et al, 2002). Oas1b expression in transfected
MEF has been shown to provide some protection against WNV infection (Perelygin et
al, 2002). Additionally, constitutive expression of Oas1b in stable mouse neuroblastoma
cells limited cell-to-cell spread of WNV (Lucas et al, 2001). Kajaste-Rudjitski and co-
workers (2006) showed that the Oas1b gene provides antiviral protection against WNV
by limiting the accumulation of positive-stranded viral RNA in infected cells. Urosevic
and co-workers (1997a) also reported similar observation. Viral dsRNA replicative form
was found to be at greater levels in brains of resistant mice upon i.c. challenge with
MVEV than in brains of susceptible mice (Urosevic et al, 1997a).
To date, the only well established biochemical function of Oas1b gene is the activation
of a ubiquitous 2-5A dependent, single strand specific, cytoplasmic endoribonuclease,
RNase L. (Zhou et al, 1993). However, recent study indicates that although RNase L
contributes to the cellular antiviral activity against flaviviruses, RNase L activation is
not part of Oas1b-mediated flavivirus resistance phenotype (Kajaste-Runitski, 2006).
Thus, although the flavivirus resistant gene has been identified, the mechanism by
which it regulates the levels of viral RNA in infected cells and confers protection
against fatal encephalitis remains to be elucidated. Further study is also required to
validate the Oas1b gene in innate immunity against other flaviviruses since most studies
involving this gene were conducted during infection with WNV only.
1.4.5 FACTORS INFLUENCING THE HOST INNATE RESISTANCE TO
FLAVIVIRUSES
Although Flvr gene confers resistance to flaviviruses in mice, protection in many
instances is not complete and infection of flaviviruses can lead to fatal outcomes. This
depends on several factors such as age of mice, immune status, virus strain and dose or
route of inoculation (Sabin, 1952a; Goodman and Koprowski, 1962; Hanson et al,
1969). Newborn RV mice (1-2 days old) succumbed to i.c. infection of YFV strain 17D
while suckling mice behaved like adult mice and survived the infection (Sabin 1952b).
In addition, upon flavivirus infection in 7-day-old suckling BRVR and BSVS mice,

CHAPTER 1
LITERATURE REVIEW
45
both mouse strains eventually died but resistant mice succumbed to the infection 2 days
later than susceptible mice (Goodman and Koprowski, 1962a). The levels of replicating
virus in these dying resistant mice however was lower than in susceptible mice,
indicating that the Flvr gene is expressed from a very early age to restrict virus growth.
Death observed in this group of mice may be associated with an immature immune and
central nervous systems (Urosevic, 2000). Sabin also demonstrated the effect of
different strains of flaviviruses on the survival of resistant mice. While RV adult mice
exhibited complete resistance to YFV of strain 17D, 24% of them died from French
neurotropic strain of YFV (Sabin, 1954). Large doses of virulent viruses were also
shown to produce high mortality in resistant mice, although the onset of disease
symptoms and time of death usually were still delayed in comparison to susceptible
mice (Goodman and Koprowski, 1962a; Jacoby and Bhatt, 1976).
Flv gene only reduces viral replication and eventually viral spread to other cells or
tissues during infections. However, complete clearance of virus is pivotal to prevent
death of the infected resistant host (Bhatt and Jacoby, 1976). Thus, the Flv gene works
concurrently with a competent immune system to confer protection against a fatal
disease outcome. Both humoral and cell-mediated immunity are vital for virus clearance
and protection against fatal flavivirus infection in flavivirus resistant mice. Indeed,
immunosuppression has been shown to reduce the host innate resistance to flaviviruses
(Goodman and Koprowski, 1962a).
Camenga and co-workers (1974) provided evidence for the importance of antibodies in
the recovery of flavivirus infection. Cyclophosphamide impairs the antibody response
and resistant animals treated with this drug became susceptible to sublethal infection of
WNV. The requirement for humoral immunity was also demonstrated during i.p. Banzi
infection in RV mice. RV mice are highly resistant to i.p. Banzi infection and
cyclophosphamide treatment rendered these mice susceptible to Banzi challenge (Bhatt
and Jacoby, 1976). The requirement for CMI was demonstrated when thymectomised
RV mice, which have an impaired T cell response but are still capable of producing
antibody, became susceptible to Banzi infection (Jacoby et al, 1980). However,
although these immunosuppressed resistant mice were susceptible to flavivirus
infection, they exhibited slower virus spread; lower virus titres as well as delayed time
to death compared to susceptible mice that received the same treatment. This result
indicated that although functional host immune system is required for the complete
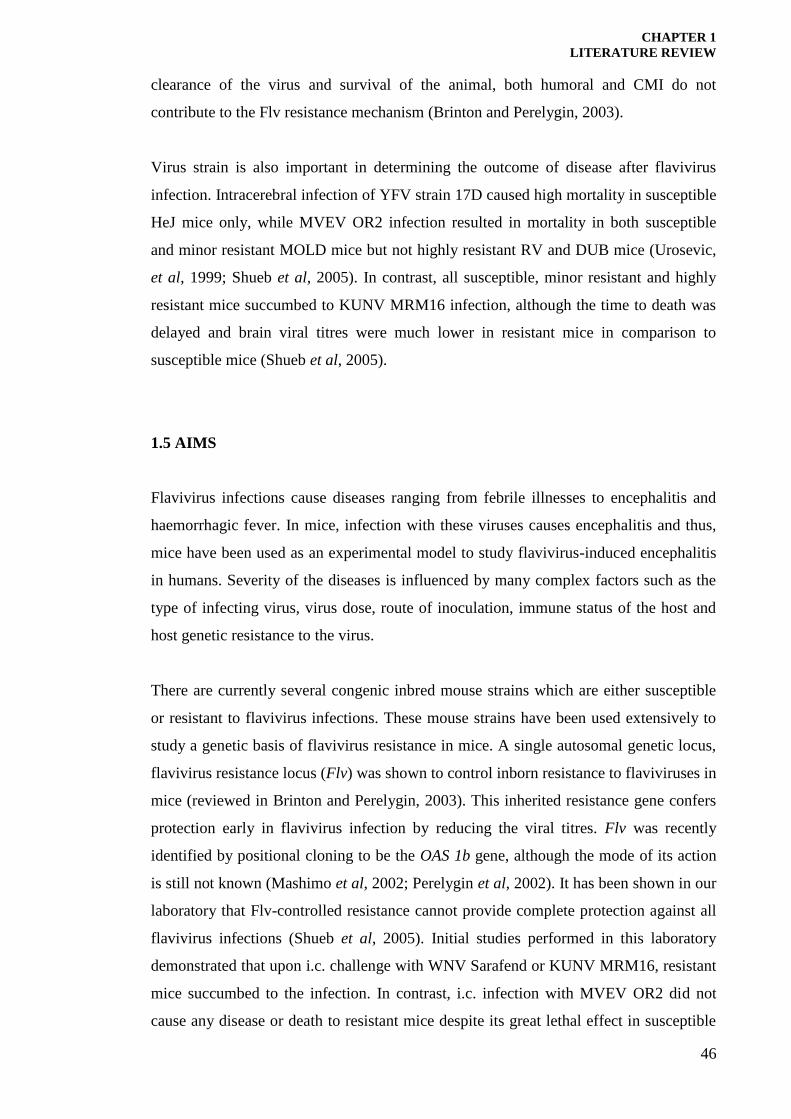
CHAPTER 1
LITERATURE REVIEW
46
clearance of the virus and survival of the animal, both humoral and CMI do not
contribute to the Flv resistance mechanism (Brinton and Perelygin, 2003).
Virus strain is also important in determining the outcome of disease after flavivirus
infection. Intracerebral infection of YFV strain 17D caused high mortality in susceptible
HeJ mice only, while MVEV OR2 infection resulted in mortality in both susceptible
and minor resistant MOLD mice but not highly resistant RV and DUB mice (Urosevic,
et al, 1999; Shueb et al, 2005). In contrast, all susceptible, minor resistant and highly
resistant mice succumbed to KUNV MRM16 infection, although the time to death was
delayed and brain viral titres were much lower in resistant mice in comparison to
susceptible mice (Shueb et al, 2005).
1.5 AIMS
Flavivirus infections cause diseases ranging from febrile illnesses to encephalitis and
haemorrhagic fever. In mice, infection with these viruses causes encephalitis and thus,
mice have been used as an experimental model to study flavivirus-induced encephalitis
in humans. Severity of the diseases is influenced by many complex factors such as the
type of infecting virus, virus dose, route of inoculation, immune status of the host and
host genetic resistance to the virus.
There are currently several congenic inbred mouse strains which are either susceptible
or resistant to flavivirus infections. These mouse strains have been used extensively to
study a genetic basis of flavivirus resistance in mice. A single autosomal genetic locus,
flavivirus resistance locus (Flv) was shown to control inborn resistance to flaviviruses in
mice (reviewed in Brinton and Perelygin, 2003). This inherited resistance gene confers
protection early in flavivirus infection by reducing the viral titres. Flv was recently
identified by positional cloning to be the OAS 1b gene, although the mode of its action
is still not known (Mashimo et al, 2002; Perelygin et al, 2002). It has been shown in our
laboratory that Flv-controlled resistance cannot provide complete protection against all
flavivirus infections (Shueb et al, 2005). Initial studies performed in this laboratory
demonstrated that upon i.c. challenge with WNV Sarafend or KUNV MRM16, resistant
mice succumbed to the infection. In contrast, i.c. infection with MVEV OR2 did not
cause any disease or death to resistant mice despite its great lethal effect in susceptible

CHAPTER 1
LITERATURE REVIEW
47
mice. On the basis of this finding, it was assumed that the virulence of flaviviruses in
resistant mice is different from their virulence in susceptible mice. In addition, previous
findings in this laboratory also suggested that development of fatal encephalitis in
resistant DUB mice during intracerebral infection with some flaviviruses did not
necessarily coincides with high levels of virus replication and that Flv-controlled
resistance, although operative, was not sufficient to protect flavivirus resistant mice
from developing lethal diseases. Thus, the general aim of this project was to further
characterise the response of resistant and susceptible host to infection with the same
viruses and to identify host factors that contribute to either the recovery or morbidity of
resistant mice following infection with different but closely related flaviviruses. We
hypothesise that additional virulence factors, other than virus ability to replicate at high
levels, may become important to resistant host in influencing the host immune response
and underlying pathogenesis of flavivirus infection.
The first aim of this study was to characterise the virulence of 3 different flaviviruses;
KUNV MRM16, MVEV OR2 and WNV Sarafend in susceptible and resistant mice,
and to determine the effect of alteration of host defence mechanisms on virus virulence
and outcome of infection. Intracerebral, intranasal (i.n) and i.p. challenges of the viruses
were performed to determine the neurovirulence and neuroinvasiveness of KUNV,
MVEV and WNV. Since mice maybe resistant to i.p. challenge, studies were
undertaken to examine the role of three host defence mechanisms; the blood brain
barrier, macrophages and T cells, in the outcome of virus infection following i.p.
challenge. BBB permeability was altered using SDS and LPS in mice during i.p.
infection of the viruses. BBB is responsible for restricting the influx of foreign
molecules into the brain and its breaching has been reported to increase mice
susceptibility to virus infection (reviewed in Chambers and Diamond, 2003).
Additionally, thioglycollate, clodronate and T cells depletion were used to study the
influence of macrophages and T cells in severity of flavivirus infection.
The second aim was to characterise in vitro infection of KUNV, MVEV and WNV. In
addition to standard laboratory cell lines such as Vero cells, primary cells including
thioglycollate-elicited macrophages isolated from susceptible HeJ and resistant DUB
mice as well as dendritic cells isolated from susceptible C57BL/6 mice were used in this
study. Extensive studies have been performed previously in this laboratory, which
demonstrated that macrophages could be infected with WNV in vitro. However, parallel

CHAPTER 1
LITERATURE REVIEW
48
and comparison analysis of different flavivirus infections in cell cultures have never
been performed before and therefore, in this study, the aim was to investigate variations
in viral titres, cytopathic effect (CPE) as well as in cytokine productions following
KUNV, MVEV and WNV infection. This would provide additional insight into the
virus characteristics that may assist in better understanding of their different virulence
observed in vivo.
The third aim of this project was to examine MVEV and KUNV pathogenesis in
susceptible and resistant mice during i.c. infection and to determine factors that could be
attributed to the different outcome of infection following these 2 flavivirus infections.
The pathogenesis of these flaviviruses was studied and compared by examining brain
viral titres and characterising the types of infiltrating leucocytes in the CNS. In addition,
cytokine production was examined to study the correlation between the induction of
certain cytokines, virus clearance and severity of disease. In order to investigate the role
of T cells in virus pathogenesis or host recovery, depletion of these cells was performed
in mice infected with KUNV or MVEV, and mortality was monitored.
Studies conducted by other investigators on pathogenesis of flaviviruses were mainly
performed in flavivirus susceptible animals and cells. However, there were a limited
number of similar studies undertaken in flavivirus resistant hosts. In this regard, this
project will shed further light on flavivirus infection in resistant hosts and cells and
provide insight into the pathogenic mechanisms involved in flavivirus susceptible and
resistant mice.

CHAPTER 2
MATERIALS
49
2.0 CHAPTER 2: MATERIALS
2.1. REAGENTS
Acetic acid, glacial May and Baker, Australia (M & B)
Actinomycin D Sigma-Aldrich, USA (Sigma)
Ammonium chloride (NH4Cl) BDH Laboratory Supplies, England
(BDH)
Benzyl penicillin Commonwealth Serum Laboratories,
Australia (CSL)
Calcium chloride (CaCl2) BDH
Crystal violet Sigma
DePeX BDH
3, 3’-Diaminobenzidine tetrahydrochloride
(DAB) with Metal enhancer tablet set Sigma
Dimethyl sulphoxide (DMSO) BDH
Disodium hydrogen orthophosphate
(Na2HPO4) BDH
DNase 1 Boehringer Manheimann, Germany
Ethanol Merck Pty Limited, Australia
(MERCK)
Ethylenediamine tetra-acetic acid (EDTA)
BDH
Foetal calf serum Commonwealth Serum Laboratories,
Australia (CSL)
Formaldehyde MERCK
Gentamycin Delta West Ltd, Australia
Goat anti-rat anti-CD4 PE conjugated Pharmingen
Goat anti-rat anti-CD8 PE conjugated Pharmingen

CHAPTER 2
MATERIALS
50
Goat anti-rat anti-CD11b PECy5 conjugated
Pharmingen
Goat anti-rat anti-CD19 PE conjugated Pharmingen
Heparin Sigma
HEPES Buffer Gibco, USA
Horse serum donor herd Gibco
Hydrochloric acid (HCl) BDH
Hydrogen peroxide (H2O2) BDH
Lipopolysaccharide E.coli serotype
0128:B12 Sigma
Lycopersicum esculentum (tomato lectin) Vector Laboratories Inc, USA
L-glutamine Sigma
Magnesium chloride (MgCl2) BDH
2β-Mercaptoethanol Sigma
Methanol BDH
Methylene blue BDH
Mouse anti-mouse H-2Kk monoclonal
antibodies (MHC I) FITC conjugated Pharmingen
Mouse anti-mouse I-Ek monoclonal
antibodies (MHC II) FITC conjugated Pharmingen
New born calf serum (NCS) CSL
Paraformaldehyde Prolabo, Paris
Percoll Amersham Biosciences, Sweeden
Phosphoric acid (H3PO4) BDH
Potassium bicarbonate BDH

CHAPTER 2
MATERIALS
51
Potassium cacodylate Promega
Potassium chloride (KCl) BDH
Potassium dihydrogen orthophosphate
(KH2PO4) BDH
Propidium iodide Pharmingen
Protease inhibitor tablet Roche
Proteinase K Sigma
READY-SET-GO! Mouse Th1/Th2 ELISA Ebiosciences
RPMI 1640 Gibco
Sodium chloride (NaCl) BDH
Sodium dodecyl sulphate (SDS) BDH
Sodium hydrogen carbonate (NaHCO3) BDH
Sodium hydroxide (NaOH) BDH
di-Sodium hydrogen orthophosphate
(Na2HPO4) BDH
Sodium pyruvate BDH
Streptavidin-horseradish peroxidase DAKO
Thioglycollate Difco Laboratories, USA (Difco)
Tissue-tek O.C.T. Compound Sakura Finetek, USA
READY-SET-GO TNF ELISA Ebiosciences
TRIS Gibco
TRIS-HCl Sigma
Trypan blue Difco

CHAPTER 2
MATERIALS
52
Trypsin Difco
Tween-20 BDH
Xylene MERCK
2.2 CELL CULTURE MATERIALS
6-well culture plates Falcon Becton Dickinson (Falcon)
24-well culture plates Falcon
96 well culture plates Falcon
15 mL polystyrene conical tube Falcon
50 mL polypropylene tubes Falcon
1.5 mL polypropylene tubes Sarsredt, Numbrecht, Germany
2 mL polypropylene tubes Nuclon, USA
1.8 mL cryotubes Nunclon,
225 cm2 cell culture flask Costar, Corning Incorporation, USA
75 cm2 cell culture flask
Nunclon
Teflon well inserts Savillex Corporation, St Paul, USA
26-G needle Becton and Dickinson

CHAPTER 2
MATERIALS
53
2.3 BUFFERS, SOLUTIONS AND MEDIA
2.3.1 CELL STUDIES
All reagents were made up in double distilled water (DDW) and stored at room
temperature (25oC), unless otherwise stated. Where necessary, the solutions were
adjusted to the required pH with concentrated HCl or concentrated NaOH.
2.3.1.1 Growth media
RPMI 1640 medium was used for cultivation of Vero cells, L929 cells, primary cultures
of mouse macrophages, primary splenocytes cultures, brain mononuclear cells and
hybridoma cell lines YTS 169 and YTS 191. Medium was warmed shortly before use
with FCS or NCS was added as required: 10% (v/v) for cell growth and 2% (v/v) for
virus growth. For cultivation of hyridoma cell lines, 2-mercaptoethanol and sodium
pyruvate were also added.
RPMI 1640 liquid
Supplied pre-made by Gibco BRL
*L-glutamine 0.29 g/L
Benzyl penicillin 100 mg/L
Gentamycin 10 g/L
* L-glutamine was added to the medium shortly before use. FCS was added as required
and the medium was stored at 4oC.
RPMI 1640 powder
RPMI pre-made powder 110 g
NaHCO3 20 g
Benzyl penicillin 100 mg/L
Gentamycin 10 g/L
*L-glutamine 0.29 g/L
pH of the medium was adjusted to 7.4, sterilised by pressure filtration and stored at 4oC.
* L-glutamine was added to the medium shortly before use. NCS was added as
required.
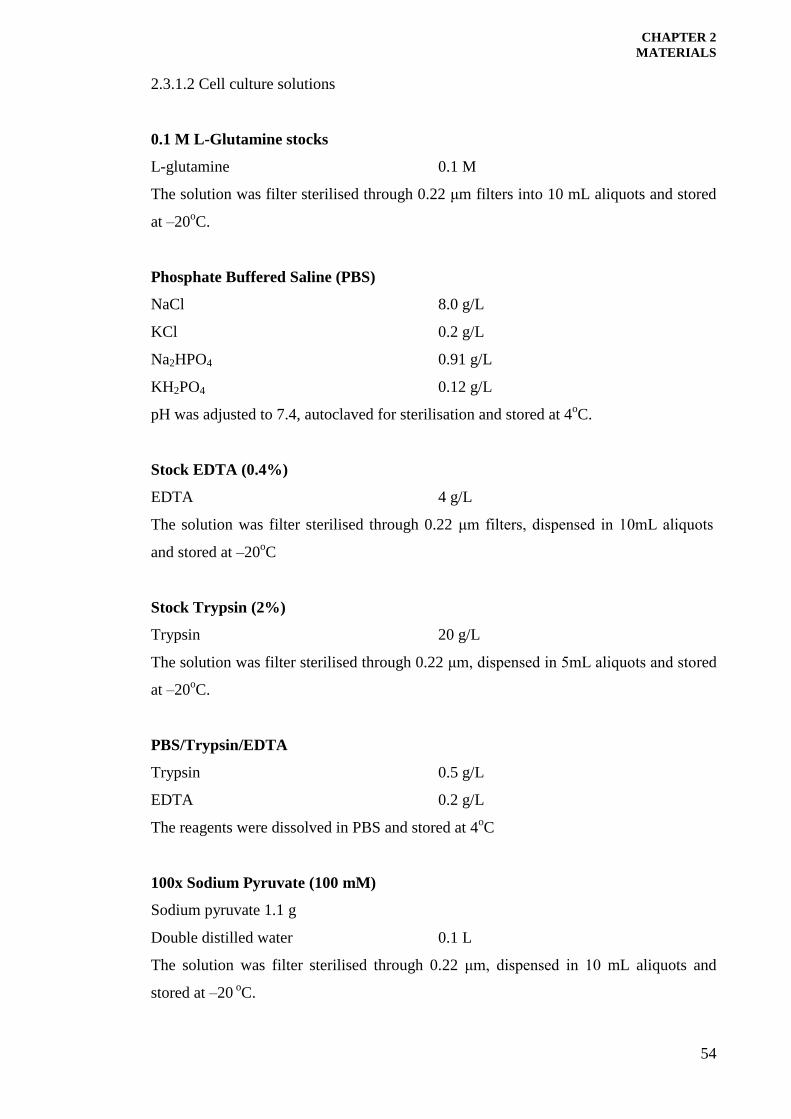
CHAPTER 2
MATERIALS
54
2.3.1.2 Cell culture solutions
0.1 M L-Glutamine stocks
L-glutamine 0.1 M
The solution was filter sterilised through 0.22 μm filters into 10 mL aliquots and stored
at –20oC.
Phosphate Buffered Saline (PBS)
NaCl 8.0 g/L
KCl 0.2 g/L
Na2HPO4 0.91 g/L
KH2PO4 0.12 g/L
pH was adjusted to 7.4, autoclaved for sterilisation and stored at 4oC.
Stock EDTA (0.4%)
EDTA 4 g/L
The solution was filter sterilised through 0.22 μm filters, dispensed in 10mL aliquots
and stored at –20oC
Stock Trypsin (2%)
Trypsin 20 g/L
The solution was filter sterilised through 0.22 μm, dispensed in 5mL aliquots and stored
at –20oC.
PBS/Trypsin/EDTA
Trypsin 0.5 g/L
EDTA 0.2 g/L
The reagents were dissolved in PBS and stored at 4oC
100x Sodium Pyruvate (100 mM)
Sodium pyruvate 1.1 g
Double distilled water 0.1 L
The solution was filter sterilised through 0.22 μm, dispensed in 10 mL aliquots and
stored at –20 oC.

CHAPTER 2
MATERIALS
55
1000x 2-Mercaptoethanol (50 mM)
2-Mercaptoethanol 50 mM
Solution was made in sterile distilled water and stored at 4oC.
Methylene Blue – Formaldehyde Stain
Methylene blue 10 g/L
Formaldehyde 0.1 L
Methylene blue was added into 900 mL distilled water and stirred overnight. The
solution was then filtered through Whatman number 1 film paper and added with
formaldehyde.
Saturated Ammonium Sulphate
Ammonium sulphate 761 g
Distilled water 1 L
Ammonium sulphate was added to distilled water and stirred slowly. The pH was
adjusted to 7.0 and the solution was autoclaved.
2.3.2 IMMUNOHISTOCHEMISTRY
10xTris Buffered Saline (TBS)
Tris (MW 121.1) 60.5 g
NaCl 85 g
Distilled water 1 L
pH of the solution was adjusted to 7.6 and stored at 4oC.
0.1M Citrate Buffer
Citric acid 2.1 g
Distilled water 1 L
pH of the solution was adjusted to 6.0 and stored at 4oC.
Scott’s Tap Water
NaHCO3 24 mM
MgSO4 83 mM

CHAPTER 2
MATERIALS
56
The solution was stored at 4oC.
Gills Haemotoxylin
Ethylene glycol 25% v/v
Haematoxylin 6 g/L
NaIO4 2.8 mM
Aluminium sulphate.16H2O 80 mM
The ingredients were mixed overnight after which 6% v/v acetic acid was added. The
solution was then filtered and stored in the dark.
10% Phosphate Buffered Formalin Solution
Formaldehyde 10% v/v
The solution was made in PBS.
4% Paraformaldehyde
PBS was warmed in a microwave. Paraformaldehyde was added then to the PBS and
mixed vigorously to dissolve the powder.
DNase 1 buffer
Tris-HCl pH 8.0 40 mM
NaCl 10 mM
MgCl2 6 mM
CaCl2 10 mM
The solution was stored at 4oC.
DNase 1 (1 unit/mL)
DNase stock (10 unit/mL) 1 uL
DNase buffer 10 mL
Proteinase K buffer
Tris-HCl pH 8.0 100 mM
EDTA 50 mM
The solution was stored at 4oC.

CHAPTER 2
MATERIALS
57
2.3.3 FLOW CYTOMETRY
PBS/5% FCS/0.03%NaN3 (WASH BUFFER)
Heat inactivated FCS* 5 ml
NaN3 0.03 g
PBS 95 ml
*FCS was heat inactivated by keeping it in a water bath at 56oC for 2 hours. The wash
buffer was stored at 4oC.
Blocking buffer (20% normal goat serum)
Normal goat serum 2 ml
PBS 8 ml
PBS 90 mL
The solution was stored at 4oC.
2.3.4 CELL ISOLATION
RPMI/HEPES
HEPES 25 mM
RPMI 500 ml
The medium was stored at 4oC.
Percoll stock
Percoll 90%
10xPBS 10%
The solution was stored at 4oC.
70% Percoll
Percoll stock 70 ml
RPMI/HEPES 30 ml
The solution was stored at 4oC.

CHAPTER 2
MATERIALS
58
Ammonium Lysis Buffer
NH4Cl 82.9 g
KHCO3 10 g
EDTA 0.37
Distilled water 1 L
pH was adjusted to 7.2 and the solution was stored at 4oC.
2.3.5 ELISA REAGENTS
PBS/protease inhibitor
Protease inhibitor tablet supplied by Roche 1 tablet
PBS 10 mL
The solution was stored at 4oC and used within 2 weeks.
ELISA Wash buffer
Tween-20 0.5 mL
PBS 1 L
Stop solution
18M H3PO4 0.56 mL
H20 10 mL

CHAPTER 3
MATHODS
59
3.0 CHAPTER 3: METHODS
3.1 VIRUSES
3.1.1 VIRUS STRAINS
Flaviviruses that were used for in vitro and in vivo studies in this project were Kunjin
virus strain MRM16 (KUNV) (Doherty et al, 1963), Murray Valley encephalitis virus
strain OR2 (MVEV) (Leihne et al, 1976) and West Nile virus strain Sarafend (WNV)
(Scherret et al, 2001). These viruses were obtained from the existing departmental
stocks. They were originally derived from suckling mouse brain stocks and then
propagated twice in Vero cells. Glycosylation of the E protein may influence virulence
of a virus. Previously, it was shown that while KUNV MRM16 is a non-glycosylated
virus, WNV carries a glycosylated E protein (Scherret et al, 2001). However,
glycosylation of the E protein is also affected by the number of laboratory passage.
Thus, the actual glycosylation status of the viruses used in this project cannot be
provided as it was not examined and may vary between different laboratories.
Encephalomyocarditis virus (EMCV) was used in IFN type I bioassay.
3.1.2 PROPAGATION OF VIRUS STOCKS
For virus propagation, firstly, Vero cells were grown in 225 cm2 flasks (Nunclon
TM) in
30 mL of growth medium until cells were confluent. The spent medium was then
removed and cells were washed once with PBS. After removal of PBS, virus was added
to the cells at a multiplicity of infection (MOI) of 1 together with 10 mL of RPMI/2%
NCS. After 1 hour incubation at 37oC with occasional rocking, the inoculum was
removed and washed with PBS to remove unabsorbed virus. The cell culture flask was
added with fresh 30mL growth media containing 2% FCS and then incubated at 37oC.
Cytopathic effect was observed and when evident, the culture medium was removed and
centrifuged in Beckman Centrifuge (Model J-6B rotor JS-4.2) at 3000 rpm for 15 min at
4oC. The supernatant was removed and stored at –70
oC in 400 μL aliquots. Fifty percent
tissue culture infectivity dose (TCID50) bioassay was used to titrate the virus stocks and
titres were determined to be 7.9 log10 TCID50 units/100uL, 7.4 log10 TCID50

CHAPTER 3
MATHODS
60
units/100uL and 9.3 log10 TCID50 units/100uL for KUNV, MVEV and WNV,
respectively.
Methods for propagation of EMCV were similar except that the virus was grown in
murine L929 fibroblasts cells.
3.2 ANIMAL STUDIES
3.2.1 MOUSE STRAINS
Specific-pathogen free flavivirus susceptible C3H/HeJ (HeJ) and flavivirus resistant
C3H.M.domesticus-Flvr-like (DUB) inbred mouse strains were obtained from the
Animal Resource Centre (ARC), Murdoch, Western Australia. The young mice used
were from 3 to 4 weeks old while the adult mice were from 8 to 12 weeks old and they
were housed at the animal house in the Discipline of Microbiology and Immunology
under specific barrier maintained conditions with minimum disease risk. The cages were
changed once per week and infected mice were checked twice daily. Both male and
female mice were used in this project. All experimental work on mice was performed
according to the rules and practices prescribed by the UWA Animal Experimentation
and Ethics Committee.
3.2.2 VIRUS INOCULATION OF MICE
Different routes of inoculation were used in this project to infect mice. After infection,
mice were monitored and checked daily for signs of disease. The signs include
hunching, ruffling, hind leg paralysis and lethargy. Sick mice were sacrificed by
cervical dislocation before they experienced severe signs of diseases and became
moribund. Thus, any mortality or morbidity recorded in this project indicated deaths
that occurred before the onset of a moribund state.
3.2.2.1 Intracerebral inoculation
Virus stocks were diluted in sterile PBS. Virus was then administered intracerebrally
(i.c.) in 5 µL into penthrane-anaesthetised mice using a Hamilton repeating syringe

CHAPTER 3
MATHODS
61
fitted with a 26-gauge needle. The mice were inoculated under the eye, at the right side
of the head. Control mice were inoculated in a similar method with 5 μL PBS. Unless
otherwise stated, mice were infected with 100 times 50% lethal dose (100 LD50). The
LD50 is the dose that was required to kill 50% of adult HeJ mice and this dose varied
between KUNV and MVEV. Mice infected with KUNV received 1.74 x 10⁵
infectious units (i.u.) while those infected with MVEV received 3.4 x 10³ i.u.
3.2.2.2 Intraperitoneal inoculation
Adult and young HeJ and DUB mice were infected intraperitoneally (i.p.) with KUNV,
MVEV or WNV. Intraperitoneal injections were made into the caudal right abdominal
quadrant. Mice were restrained by hand and held with the body and head tilted
downward. The virus was diluted in sterile PBS and then injected using a 26G needle.
Some mice received treatment with LPS, thioglycollate, anti CD4+/CD8+ depleting
antibodies or SDS prior to or after virus inoculation (Section 3.3).
3.2.2.3 Intranasal inoculation
Intranasal inoculation (i.n.) of mice was performed by administrating 4 times the dose
was used for i.c. inoculation. The virus suspension was administered into the left and
right nares of penthrane-anaesthetised mice. A total volume of 20 l of virus containing
4 x 10² LD50 was given to each mouse.
3.3 INOCULATION OF REAGENTS/CELLS INTO MICE
3.3.1 THIOGLYCOLLATE
Thioglycollate is a sterile inflammatory agent and i.p. administration in mice results in
accumulation of macrophages in the peritoneal cavity. Six percent thioglycollate broth
was prepared in double distilled water, aliquoted into 10 mL and autoclaved. The
chemical was stored in dark at room temperature for at least 3 months prior to use in
animals. Adult mice were i.p. inoculated with 1mL of thioglycollate while young mice

CHAPTER 3
MATHODS
62
were i.p. inoculated with 200 uL. For both in vivo and in vitro studies, mice were
administered with thioglycollate 3 days prior to virus infection or cell isolation.
3.3.2 LIPOPOLYSACCHARIDE (LPS)
Lipopolysaccharide (LPS) was derived from Escherichi coli (E.coli) bacteria serotypes
0128:B12 (Sigma). The LPS was diluted in PBS at a concentration of 500 mg/mL and
mice received 100 uL by the i.p. route.
3.3.3 SODIUM DODECYL SULPHATE (SDS)
SDS was prepared in sterile double distilled water at a concentration of 2.4 μg/mL.
Mice were i.p. injected with 240 ng of SDS. For experiments involving administration
of the virus in conjunction with SDS, virus dilution was prepared in SDS solution.
Infectivity of the virus preparation was not affected by the presence of dilute SDS as
determined using the TCID50 bioassay.
3.3.4 CD4+ AND CD8 T+ CELLS DEPLETION
Mice were depleted of CD4 or/and CD8 T cells by i.p. inoculation of 150 μL anti-CD4
or 100 μL CD8 cell culture supernatant (equivalent to > 900ng antibodies) or both.
Unless otherwise stated, the depletion commenced 2 days before virus infection, and
then on day 2 and 4 p.i. in susceptible HeJ mice or on day 0, 2, 6 and 8 days p.i. in
resistant DUB mice. The monoclonal antibodies are cytotoxic and thus, would bind to
and cause apoptosis to the target cells.
To monitor the efficiency of T cell depletion, mice were given either 150 µL anti-CD4
or 100 µL anti-CD8 monoclonal antibodies on day 1 and day 3. On the fourth day,
spleens were harvested and splenocytes were isolated and labelled with anti-CD4+
(RL174, kindly donated by Dr J. Allen) and CD8+ (3.11 M, kindly donated by Dr J.
Allen) monoclonal antibodies that recognise different epitopes on T cells compared to

CHAPTER 3
MATHODS
63
the antibodies that were used to deplete T cells in mice (Lathbury et al, 1996).
Following this, flow cytometry analysis of the splenocytes was performed. The
depletion efficiency was determined to be 96% and 95% for CD4+ and CD8+ T cells,
respectively.
3.4.5 CLODRONATE
Clodronate (liposome encapsulated dichloromethylene-biphosphonate) was kindly
donated by Dr. Nico van Rooijen, Free University, Amsterdam, Netherlands and was
used to selectively deplete macrophages. HeJ and DUB mice were injected i.p. with
100 μL clodronate liposomes or liposomes only (negative control) before being infected
i.p. with WNV 4 days later. Intraperitoneal inoculation of clodronate depletes
macrophages in the peritoneal cavity, spleen, parathymic lymph nodes and liver (van
Rooijen and Sanders, 1994; Biewenga et al, 1995; Ciavarra et al, 1997). Efficiency of
macrophage depletion was assessed as discussed in Section 3.6.1.4.
3.4.6 MACROPHAGE TRANSFER EXPERIMENT
For adoptive transfer experiment, peritoneal macrophages were cultured under non-
adherent conditions for 5 days and later infected with WNV at MOI 10 (see Section
3.5.2.2 for isolation and culturing procedures). Two days after infection, the cultures
were centrifuged and supernatant was removed and stored at –80oC. The supernatant
was used to test the level of virus replication in peritoneal macrophages. Peritoneal cells
were washed with PBS and centrifuged twice before resuspended in PBS at
approximately 1 x 10⁷ cells/100μL. Mice received 100uL of infected WNV and as
negative control, a separate group of mice were injected with uninfected macrophages.
3.4 ORGAN EXTRACTION
Mice were deeply anaesthetised by keeping them in an airtight jar filled with iso-
fluoropenthrane and they were sacrificed by cervical dislocation prior to organ
collection.

CHAPTER 3
MATHODS
64
3.4.1 BRAINS
Mice were sprayed with 70% alcohol and skin surrounding the head was removed. A
cut was made on top of the skull and then the skull was removed gently from the
cranium, ensuring that brain tissue was not damaged and all connecting muscle fibres
were removed. The brain was aseptically removed by sterile forceps into a collecting
tube. Brains were collected for viral titration, brain cell isolation, in situ cytokine
measurement or histology analysis. For virus titration, the collection tube contained
1mL cold RPMI medium with 2% NCS while for brain cells isolation, medium
comprised 1mL cold RPMI with 2% FCS and 25 mM HEPES. For cytokine
measurement and histology, collection tube was filled with 200 µL cold PBS/protease
inhibitor and 3 mL 10% buffered formalin saline, respectively. When brains were
extracted for cell isolation purposes, perfusion was performed prior to organ collection
to remove contaminating erythrocytes and non-brain infiltrating cells. In these instances,
the chest cavities of anaesthetised mice were opened. A butterfly clip 26G needle was
inserted into the lower left ventricle of the heart and mice were perfused with 10 to
20 mL of cold PBS. The brains were extracted and kept on ice until they were
homogenised. For histology analysis, brains were kept in 10% buffered formalin saline
at room temperature for 48 hour before being processed at the Department of Pathology,
UWA.
3.4.2 PERIPHERAL ORGANS
Mice were pinned to a corkboard with the ventral side facing up. Seventy percent
alcohol was sprayed on the body and skin was cut from the abdomen to the chest. The
skin was removed, exposing the peritoneal wall. A cut was then made with sterile
scissor to open the peritoneum. Organs including spleen, liver, kidney and pancreas
were removed gently and aseptically into small tubes containing cold RPMI with 2%
NCS or FCS. For virus titration, organs were homogenised into 10% extracts using
sterilised glass tissue grinders. For detection of macrophages in spleens, these organs
were embedded in tissue-tek and stored at –80 oC until ready for cryosectioning.

CHAPTER 3
MATHODS
65
3.5 CELL ISOLATION
3.5.1 BRAIN MONONUCLEAR CELLS
Brains were transferred from collection tubes to cold sterile glass tissue homogenisers.
1mL RPMI with 25 mM HEPES was added and brain tissue was ground to a smooth
consistency. The homogenate was then transferred into a pre-chilled 15 ml centrifuge
tube. Two brains were used for each 15 mL centrifuge tube. The volume in the
centrifuge tube was adjusted to 7 mL by adding extra medium. Then, 3 mL of stock
Percoll was added and the contents mixed by inversion. This resulted in a 30% Percoll
solution. One mL of 70% Percoll was added slowly to the bottom of the centrifuge tube,
using a sterile 1 mL glass pipette so that the 30% Percoll solution at the top of the tube
was not disturbed, resulting in a sharp interphase. The tube was centrifuged at 2000 g
for 20 min at 20oC without applying a brake (Beckman J6-MI centrifuge). Following
centrifugation, the top phase which contained myelin was removed using a 25 mL glass
pipette. Mononuclear cells were in the interphase and lay above the 70% Percoll. After
removing most of the top phase (30% Percoll solution), the interphase was transferred
gently to a fresh 15 mL tube without disturbing (if any) red blood cells that formed a
pellet at the bottom of the tube. Cells were washed in 10 to 12 mL of medium after
being transferred into a fresh tube and centrifuged again at 4oC for 12 min. Supernatant
was removed and cell pellet were resuspended in a final volume of 300 uL. When cells
were used for flow cytometry, they were resuspended in PBS containing 5% heat
inactivated FCS and 0.03% NaN3. For studies involving culturing the cells, RPMI with
10% or 5% FCS was used, respectively.
3.5.2 SPLENOCYTES
Spleens were cut into smaller pieces and transferred to a tissue sieve, which was kept on
top of a cold 50 mL centrifuge tube. Using 10 mL plunger, the spleens were gently
squashed to remove the splenocytes. Following this, RPMI/2% NCS was added to wash
the sieve. Cells were collected at the bottom of 50 mL centrifuge tube. The sieve was
washed 3 times with 2 mL medium. The tube was centrifuged at 3000 rpm at 4oC for
12 min. After centrifugation, supernatant was removed and cell pellet was resuspended

CHAPTER 3
MATHODS
66
in 2 mL lysis buffer. Lysis buffer was used to remove contaminating red blood cells.
The cells were incubated at room temperature for 2-3 min after which 10 mL medium
was added to stop the cell lysis. The cells were centrifuged twice. Cells were finally
resuspended in 1 mL wash buffer prior to flow cytometry analysis.
3.5.3 PERITONEAL MACROPHAGES
3.5.3.1 In vitro experiments
Three days after administrating 6% thioglycollate, mice were culled by cervical
dislocation and pinned to a corkboard. Skin was sprayed with 70% alcohol and a cut
was made at the abdomen to expose the peritoneal wall. 5 mL of cold sterile PBS was
carefully injected into the peritoneal cavity using a 26G needle. The peritoneal wall was
then massaged gently to help dislodge the peritoneal cells. The cells were later aspirated
using the same needle slowly and carefully, so that internal organs were not punctured
or damaged by the needle. The process was repeated and the peritoneal fluid was
transferred into cold 50 mL centrifuge tubes. Peritoneal cells were centrifuged
(Beckman J6-MI centrifuge) at 1500 rpm for 5 min at 4oC and cell pellet was
resuspended in cold PBS and centrifuged again. Cells were resuspended in 3 to 5 mL of
RPMI with 10% FCS. Trypan Blue exclusion dye was then used to determine cell
number and viability.
Peritoneal macrophages were usually pooled from several mice and cells were grown
either under adherent or non-adherent conditions. Adherent peritoneal cells were used to
study viral replication and MHC molecules up-regulation following KUNV, MVEV and
WNV infections. To prepare this, cells were seeded into 6 well culture tissue plates at a
density of 1 x 10⁶ cells/well. The peritoneal cells were incubated overnight in a total
volume of 3 mL medium/well at 37oC and in a 5% CO2 humidified atmosphere. The
next day, non-adherent cells were removed by washing the wells vigorously, twice with
PBS. Peritoneal macrophages adhered to the tissue culture flask and these cells were
further incubated in fresh 2 mL RPMI with 10% FCS and later used for various
analyses. For a non-adherent growth condition of peritoneal cells, they were grown in
teflon pots at 1 x 10⁶ cells/mL. Every two days in culture, cells and spent media were

CHAPTER 3
MATHODS
67
transferred into 50 mL centrifuge tubes and centrifuged for 5 min at 2000 rpm. Cells
were washed twice in 10 mL PBS and they were finally resuspended in fresh RPMI
containing 10% FCS and cultured in the teflon pots. Peritoneal cells grown in either
adherent or non-adherent conditions were cultured for a maximum period of 5 days after
isolation prior to virus infection. This allowed the removal of cytokines that may be
produced by macrophages during thioglycollate treatment or isolation which could
affect virus infection of the cells.
3.5.3.2 In vivo experiments
For cell transfer studies, peritoneal macrophages were isolated as mentioned above.
However, following collection of the cells, peritoneal macrophages were centrifuged
and washed twice with PBS. The cell numbers and viability were determined and the
peritoneal cells were resuspended in 10% RPMI at a density of 1 x 10⁶ cells per mL.
Five to six mL of cell suspensions were transferred to teflon pots to maintain the culture
in a non-adherent condition as described above. The media were regularly changed
every two days by centrifuging cells for 5 min at 2000 rpm and washing the cells twice
with PBS. Following this, fresh media was added to the cells. Peritoneal macrophages
were cultured for 5 days prior to virus infection.

CHAPTER 3
MATHODS
68
3.6 HISTOLOGICAL PREPARATION AND IMMUNOHISTOCHEMISTRY OF
ORGANS
3.6.1 BRAIN
3.6.1.1 Paraffin embedding of the brain
Brains were removed aseptically and kept in 10% buffered formalin saline, as
previously described (section 3.4.1) and left at room temperature for 48 hours before
they were taken to the Department of Pathology (UWA) for further processing into
paraffin blocks. Paraffin embedded brain tissue was cut in 10μm saggital and horizontal
orientations and placed onto 3-aminopropyltriethoxysilane pre-coated microscope slides
(silanated slides). The slides were kept at room temperature prior to staining.
3.6.1.2 Hematoxylin and eosin (HE) staining
Staining of brain tissue sections with HE was performed with assistance from staff in
the Department of Pathology. Briefly, the slides were deparaffinised by washing
consecutively in xylene, 100%, 95% and 70% ethanol, and water. Gill’s hematoxylin
was then added for 3 min after which the slides were washed sequentially in water,
Scott’s Tap water and ethanol. Eosin was added for 1 min and the slides were washed in
ethanol, ethanol: xylene and xylene. The slides were mounted onto permanent mounting
medium and covered with cover slips. Using these slides, the study of brain architecture
and inflammatory responses was undertaken under the guidance of Professor John
Papadimitriou at the Department of Pathology, UWA. Photographs were taken using a
light microscope with an attached digital camera (Leica Digital Camera and Viewer).

CHAPTER 3
MATHODS
69
3.6.1.3 Activated brain microglia/macrophages labeling
Labeling of activated microglial/macrophage cells in the brain was performed by
utilising tomato lectin (Lycopersicum Esculentum). Brain tissue sections placed on
silanated slides were consecutively washed with 100% xylene, 1:1 xylene and alcohol,
100% alcohol, 70% alcohol, 50% alcohol and water. The slides were then placed in
citrate buffer and heated in a microwave for 2 x 4 min to retrieve microglia antigen.
Following this, the brain sections were washed in TRIS Buffered Saline (TBS) and then
incubated in 0.3% hydrogen peroxidase for 30 min. Further treatment involved
incubating the brain sections with biotinylated tomato lectin for 2 hours. Upon washing
with TBS, streptavidin conjugated with hydrogen peroxidase was applied onto each
slide and incubated for 10 min. Following incubation, DAB solution was added to the
slides for 3 to 5 min before being washed with distilled water to stop the reaction. Slides
were counterstained with haematoxylin (kindly provided by staff at the Department of
Pathology, UWA) for 30 sec, washed in distilled water, and then in Scott’s tap water for
30 sec before being washed again in distilled water. Slides were later washed
sequentially for 3 min in 50% alcohol, 70% alcohol, 100% alcohol, ethanol:xylene and
100% xylene, and finally mounted using DEPEX mounting solution and left overnight
to dry.
3.6.1.4 Detection of macrophages in spleens
To confirm that clodronate treatment depletes macrophages in mice (Section 3.3.5),
mice were administered with 100 μL clodronate and two days later, spleens were
harvested from these mice and embedded in tissue-tek prior to storage at –80 oC.
3.6.1.4.1 Cryosectioning of spleen
Blocks of embedded tissues were placed in the cryostat (Leica CM 1900) at –20oC for
15 min to allow the samples to equilibrate to the temperature of the cryostat. Spleens
were placed on the chuck and mounted using tissue-tek. Ten μm sections were prepared
from these organs, placed onto silanated slides and kept at –20oC.

CHAPTER 3
MATHODS
70
3.6.1.4.2 Detection of macrophages
Detection of macrophages was performed using a rat raised monoclonal antibody
specific for F4/80 cell surface antigen which is expressed by macrophages (Austyn and
Gordon, 1981). The frozen tissue sections from control and macrophage-depleted mice
were air-dried prior to being fixed in cold methanol for 10 min. Following this, tissue
sections were washed 3 times for 2 min and then incubated in blocking solution for 30
min. Spleen tissue sections were then removed from the blocking solution and applied
with the primary antibodies, F4/80 (neat culture supernatant). Tissue sections from
clodronate-treated mice were not only used to assess the efficiency of macrophage
depletion, but were also employed as controls for background reaction of F4/80
antibodies. To ensure that secondary antibody bind specifically to the primary antibody,
a few tissue sections from control mice were applied with Tris saline buffer (TSB)
rather than F4/80 antibodies (negative controls). Following 2 hours incubation, all slides
were washed with TSB 5 times (5 min per wash) and then incubated with biotinylated
goat anti-rat IgG (1/200 dilution). After 45 min incubation, slides were washed and
streptavidin-horseradish-peroxidase was added to the slides for 10 min. Slides were
washed again and later incubated with DAB for 5 min. To stop the reaction, slides were
immersed in distilled water for 10 min. Hematoxylin was then used to counterstain the
tissue sections. Following this, the slides were washed for 3-5 min in 70%, 85%, and
100% ethanol, ethanol:xylene and lastly in 100% xylene. The slides were mounted
using DEPEX mounting solution and left overnight to dry.
3.6.1.5 Apoptosis Detection
Apoptotic cells were detected using the DeadEnd Colorimetric TUNEL System
(Promega). The brain tissue sections on pre-coated slides were first deparaffinised in
xylene for 5 min. The slides were washed through graded ethanol (100%, 95%, 85%,
70% and 50%), 0.85% NaCl and PBS for 5 min in each wash. To fix the tissue, the
tissue sections were incubated in 4% paraformaldehyde for 15 min and then washed
with PBS. Proteinase K was added for 10 min to permeabilise the tissues. Slides were
again washed in 4% paraformaldehyde before addition of 100 μL Equilibration buffer
(supplied). Both positive and negative controls were also included in this assay. Positive
control was prepared by treating brains tissue sections with DNase I to induce DNA
fragmentation after washing with the slides with paraformaldehyde. Brain tissue

CHAPTER 3
MATHODS
71
sections from uninfected mice were used as negative control. After 10 min incubation,
biotinylated nucleotide mix (supplied) was added and the slides were incubated at 37oC
for one hour. The reaction was stopped by immersing slides in 2 x SSC for 15 min and
subsequent washing in PBS. The slides were then added with hydrogen peroxide (0.3%)
to block the endogenous peroxidase. After that, 100 μL of streptavidin conjugated with
hydrogen peroxidase (HRP) was dispensed onto each slides and incubated for 30 min.
Following incubation, slides were washed with PBS and DAB components were added.
Dark brown colour developed in 13 min in tissues containing apoptotic cells. To
counterstain the slides, Gill’s Hematoxylin (kindly provided by staff at the Department
of Pathology) was used.
3.7 CELL STUDIES
All cell lines used in this research were obtained from departmental stocks.
3.7.1 AFRICAN GREEN MONKEY KIDNEY CELLS (VERO CELLS) AND L292
MOUSE FIBROBLASTS
Vero and L292 cells were grown in RPMI 1640 media containing 10% FCS in 225 cm2
tissue culture flasks (NunclonTM
) until confluent. To subculture the cells, the spent
medium was removed and cells were washed with 10 mL PBS. Following that, 10 mL
PBS/trypsin/EDTA was added, incubated for 1 minute and then removed, leaving 1 mL
in the flask. The flasks were incubated further for 4 min at 37oC. Ten mL medium was
added and the cells were resuspended gently to break up cell clumps. One mL of cell
suspension was used to seed the flask. Fresh growth media (30 mL) was added to the
flask and cells were incubated at 37oC.
3.7.2 HYBRIDOMA YTS 191 AND 169 CELL LINES
3.7.2.1 Cell culture
Hybridoma cells lines YTS 191 and YTS 169 (American Type Tissue culture (ATTC),
kindly provided by Dr. Anthony Scalzo, Lions Eyes Institute) (Lathbury et al, 1996;
Cobbold et al, 1984) were grown in RPMI 1640 containing 10% FCS/2mM

CHAPTER 3
MATHODS
72
glu/0.05mM 2ME/1mM sodium pyruvate. Cells were subcultured every 3 days. Since
these cells are semi adherent, to subculture, cells were dislodged from the flask by
washing the flask several times with the spent media. If washing alone could not
dislodge the cells, 3 mL PBS containing trypsin then were added and flask was
incubated for 1 to 2 min. Spent media containing cells were then transferred to 50 ml
centrifuge tubes and centrifuged at 2400 rpm for 5 min. The supernatant was removed,
cells were resuspended in 10 ml media and 1 ml was returned to the flask. An additional
35 ml of medium was added and cells were incubated at 37oC with 5% CO2.
3.7.2.2 Production of anti CD4+ and anti CD8+ antibodies
For production of anti CD4 and anti CD8 antibodies, YTS 191 (produces anti-CD4,
IgG2b) and YTS169 (produces anti-CD8, IgG2b) hybridoma cell lines were cultured
in 75 mL media for 4 days until confluent. On day 4, spent media were removed and
centrifuged in 50 ml centrifuge tube. Cells were resuspended in 50 ml
RPMI/glu/2ME/sodium pyruvate without FCS for the next 4 days. The absence of FCS
caused cells to eventually die, resulting in the secretion of antibodies into culture
supernatant. On day 4, when signs of cell deaths were apparent, spent media were
collected and stored at 4oC prior to further processing.
3.7.2.3 Ammonium sulfate precipitation
Ammonium sulfate precipitation was used to purify and concentrate the antibodies. In
solution, proteins form hydrogen bonds with water through their exposed polar and
ionic groups. When high concentrations of small, highly charged ions such as
ammonium or sulfate are added, these groups compete with the proteins for binding
with water. This removes water from the proteins, eventually resulting in precipitation.
Total volume of tissue culture supernatant (spent media containing antibodies) was
determined prior to centrifugation at 3000 g for 30 min. The supernatant was then
transferred to a 2 L beaker which was kept on a magnetic stirrer. While the antibody
solution was being stirred gently, saturated ammonium sulphate was added drop wise to
bring the final concentration of this solution to 50%. The solution then turned cloudy,
indicating that antibodies had precipitated. The beaker was then transferred to a cold
room (4oC) and kept overnight. The following day, the precipitate was centrifuged at

CHAPTER 3
MATHODS
73
3000 g for 30 min. The supernatant was discarded and the pellet was suspended with
PBS (0.1 x the starting culture supernatant volume). The antibody solution was then
transferred to sterile dialysis tubing measuring approximately 20 cm. The dialysis
tubing was kept in a beaker, containing 2L PBS and stirred overnight at 4oC. PBS was
changed 3 times in 2 days. The antibody solution was then removed from the tubing and
centrifuged. Finally the antibody was filter sterilised through a 0.22 μm syringe filter,
aliquoted into 1.5ml eppendorf tubes and kept at –20oC. Protein concentration was
determined using a UV spectrophotometer at 280 nm with the assumption that optical
density of 1.35 was equal to 1 mg/ml protein. The concentration was found to be
600 µg/ml and 926 µg/ml for anti CD4+ and anti CD8+ culture supernatant,
respectively.
3.7. 3 MOUSE PRIMARY CELL CULTURES
Primary mouse macrophages were cultured in growth medium (RPMI) containing 10%
FCS and 2 mM glutamine. For dendritic cells (DCs) (kindly provided by Ms Andrea
Kong), cells were grown in growth medium (DMEM) containing 10% GM-CSF
(Kindly provided by Ms Andrea Kong). Cells were either cultured in 6 well culture
plates (at 1x10⁶ cells/well) or in teflon pots (at 1x10
6 cells/mL).
3.7.4 VIRUS INFECTION OF CELLS
Primary cell lines were grown in growth media in 6 well culture tissue plates (adherent)
(1x10⁶ cells/well) or teflon pots (non-adherent) (1x10
6 cells/mL), depending on the
experiment. To infect cells with virus, cells were first washed with sterile PBS gently.
Cells were then infected with virus at MOI 10, diluted in mL RPMI with 2% FCS for 1
hour (1 x 10⁷ i.u./mL). This value (1 x 10
7 i.u./mL) is equivalent to 10
6.2/100μL TCID50
units. The plates or the pots were incubated at 37oC in 5% CO2 with occasional rocking
to facilitate virus binding to the cells. Following one hour incubation, medium
containing free unattached virus was removed and cells were washed with PBS twice.
Fresh 2mL medium with 2% FCS or NCS was then added into each well of the 6 well
plates. After a gentle rocking, 0.5mL to 1mL aliquots were immediately taken from the
wells and replaced with similar volume of fresh media. These samples were used to
measure virus titres at time 0. At various time points after infection, aliquots of

CHAPTER 3
MATHODS
74
supernatant from 6 well plates were removed, stored at –80oC and later used for virus
titration. For cells cultured in teflon pots, 1mL of new medium was added per 1 x 10⁶
cells. Virus titration was performed by TCID50 bioassay.
3.7.5 PREPARING CELL STOCKS
To prepare stocks of the cells used in this project, cells were grown in appropriate
growth medium until confluent. Cells were removed from the tissue culture flask and
centrifuged at 4oC at 2000 rpm for 15 mins. Following centrifugation, supernatant was
discarded and cells were suspended in 9 mL cold FCS. Nine mL of 10% dimethyl
sulphoxide (DMSO) in FCS was then added slowly to the cells, avoiding any bubbles.
Cells were aliquoted into 1.8 mL cryotubes and kept at –70oC overnight. The following
day, cryotubes were transferred into liquid nitrogen.
3.7.6 VIRUS TITRATION
3.7.6.1 Preparation of 10% brain homogenates
Brain was removed aseptically and kept in cold RPMI containing 2% NCS. The brain
was weighed and 10% brain homogenates were prepared aseptically using cold glass
homogenisers in fresh medium. The homogenates were then centrifuged at 3000 g, for
15 min at 4oC (Beckman Centrifuge, Model J-6B rotor JS-4.2). Supernatant containing
the virus was removed and stored in 500 μL aliquots at –70oC.
3.7.6.2 Tissue culture infectivity dose 50% (TCID50)
The titres of virus present in harvested organs or culture supernatant was determined by
TCID50 assay (where the TCID50 is the highest dilution of virus that causes cytopathic
effect in 50% of cell cultures). In this assay, Vero cells were used as indicator cell lines.
Wells of 96 well plates (MICROTESTTM
Tissue Culture) were seeded with 100 μL of
Vero cell suspension, containing approximately 2 x 10⁵ cells/mL and incubated at 37
oC
in 5% CO2 until 90% confluent (1-2 days). Virus samples from 10% homogenates or
culture supernatant were diluted from 10-1
to 10-9
in RPMI containing 2% NCS in a 25-

CHAPTER 3
MATHODS
75
well sterilin tray. The growth medium was removed from the 96-well plates and 100 μL
of each virus dilution was added to 10 wells using a multi-channel. Two wells were
included as cell control, into which only media was added. The cells were incubated at
37oC for 7 days and checked occasionally for CPE. On day 7, the presence of CPE was
determined using an inverted microscope and confirmed by adding 100 μL of methylene
blue into the wells. The plates were left overnight, and then washed and rinsed with tap
water. The number of wells that showed CPE was recorded and the TCID50 for each
sample was determined using an in-house computer programme.
The sensitivity of this assay in detecting accurate virus titres is at 2.0 log10 TCID50
units/100μL. This value corresponds to 0.7 x 10² i.u./100µL. As virus is also present
below 2.0 log10 TCID50 units, the amount of virus was expressed by 2 arbitrary values;
1.0 log10 TCID50 units for virus detected between 0.7 x 10² i.u./100µL and 0.35 x 10
2
i.u./100µL, and 0.5 log10 TCID50 for virus detected between 0.35 x 10² i.u./100µL and
0.1 x 10² i.u./100µL. This assay would not detect any infectious virus below 0.1 x 10
2
i.u./100µL.
3.8 CYTOKINE STUDIES
3.8.1 IFN TYPE I BIOASSAY
This assay tests for the presence of IFN type I in the samples by utilising the antiviral
properties of this cytokine following infection of indicator cell line L929 mouse
fibroblasts with EMCV.
3.8.1.1 Preparation of L929 monolayers
L929 cells were grown until confluent, trypsinised and resuspended in RPMI containing
10% NCS. One hundred μL of resuspended cells were seeded onto wells of 96-well
plates and incubated at 37oC until confluent (1-2 days).

CHAPTER 3
MATHODS
76
3.8.1.2 Acid treatment of samples
Since IFN assay is based on the biological (antiviral) property of IFN type I, acid
treatment was performed in order to destroy other constituents of the tissues that may
have antiviral properties or infectious virus that could infect and kill L929 cells and
eventually would lead to inaccurate results. Five hundred microlitres of samples were
acidified to pH 2 by adding 50-60 μL HCl (0.5M). At pH 2, most proteins are denatured
and precipitated while virus is inactivated. IFN type 1 however is not affected and
exerts its full biological activity when the pH is re-adjusted to 7. Thus, following one-
hour incubation, samples were neutralised to pH 7 by adding 40-50 μL NaOH (0.5 M)
and then centrifuged at 3500 g for 15 mins. Supernatants were collected and stored at
–70oC.
3.8.1.3 IFN type I bioassay
Brain homogenates and IFN standard were diluted 1:6 in RPMI containing 2% NCS,
and 250 μL of this dilution was transferred in duplicate to the first rows of the first
96-well plates (which did not contain any cells). One hundred and twenty five μL of
RPMI containing 2% NCS was dispensed to the rest of the wells and serial two-fold
dilutions were performed across the plates. The spent medium in the second 96-well
plates that contained confluent monolayer L929 cells (as prepared in 3.8.1.1) was
discarded and then plates were washed with sterile PBS. PBS was removed and 100 μL
of prepared diluted samples and standard IFN was transferred from the first 96-well
plates into the corresponding wells of plates containing L929 cells. Positive and
negative controls were also included in each plate at this stage. The positive controls
contained virus only, while negative control contained medium only (6 wells per
control). The plates were then incubated at 37oC in 5% CO2 for 20 hours.
Following incubation, the samples were discarded and the 96-well plates were washed
with sterile PBS. Stock EMCV was diluted to 10-6
in RPMI with no serum and 100 μL
was added to all wells excluding the negative control wells. Only RPMI was added into
these negative control wells. Plates were then incubated again until CPE could be
observed in positive control cells (> 20 hours). The plates were stained with methylene
blue-formaldehyde, left overnight, washed and wells with 50% CPE were determined.
The 50% CPE in the samples were determined by comparing test wells with the 50%

CHAPTER 3
MATHODS
77
CPE observed in IFN standard with known IFN type I concentrations and values were
expressed at international units/mL (I.U./mL). The sensitivity of this assay is
2.5 I.U./mL.
3.8.2 CYTOKINE ELISA
For detection of TNF, IFN, IL-2, IL-4 and IL-10, a commercial ELISA was used
(eBioscience). High protein binding capacity 96 well flat bottom plates (such as
Corning Costar 9018) were coated with 100 μL per well of capture antibody, which had
been diluted in coating buffer as recommended by the supplier. The plates were sealed
and kept overnight at 4C. The next day, the contents were removed and plates were
washed 3 times with 300 μL per well with wash buffer. Plates were then blotted on
absorbent paper to remove any residual buffer. Following this, plates were blocked with
100μL per well of assay diluent for one hour at room temperature. Plates were then
washed with wash buffer as before. 100 μL per well of standard was added to the
appropriate wells and 2-fold serial dilutions were performed to construct the standard
curve. 100 L of test samples were added to the wells and incubated at room
temperature for 2 hours. Plates were washed 5 times and 100 L detection antibody
(conjugated with biotin )was added to the wells and further incubated for 1 hour. Then,
plates were washed 5 times and Avidin-Horseradish peroxidase was added (100
L/well). The plates were left at room temperature for 30 min before being washed 7
times. During this step, wells were soaked with wash buffer for 1-2 min each wash. To
develop colour, 100 L substrate solution (tetramethylbenzidine, TMB) was distributed
into each well and left for 15 min. Fifty L stop solution (1M H3PO4) was added to stop
the reaction and absorbance was measured at 450 nm using Bio-Rad Model 3550
Microplate Reader. The amount of cytokines present in the samples was determined
using the standard curve.
3.9 FLOW CYTOMETRY
Following isolation of mononuclear cells and splenocytes, numbers of cells were
determined using trypan blue dye and the cells were resuspended at 1 x 10⁷ cells/mL in

CHAPTER 3
MATHODS
78
wash buffer. 100 μL was added to the wells of 96-well round bottom plate. Plates were
centrifuged at 200 g for 5 mins at 4C and the supernatant was removed. Cells were
washed twice and incubated for 30 min in blocking buffer (PBS/20% normal horse
serum) on ice. After washing the cells twice with wash buffer, 100 µL of rat anti CD4,
CD8, CD19, CD45, CD11b, CD11c, MHC class I or MHC class II antibodies that were
diluted 1/500 in wash buffer were added to the cells and incubated on ice in a dark for
60 min. These antibodies were directly conjugated with fluorescein dye (either PE or
FITC). Following this, cells were washed twice and then finally resuspended in 500 uL
wash buffer. Unstained cells were included as a negative control. Cells were kept on ice
in the dark until further analysis by flow cytometry.
For IFN intracellular staining, cells were incubated in RPMI/ 5%FCS/ 2mM glutamine/
2 μg per mL Brefeldin A for 4 hours prior to labelling the cells with monoclonal
antibodies. Brefeldin A interferes with protein transport from the endoplasmic reticulum
to the Golgi apparatus, leading to the accumulation of protein in the endoplasmic
reticulum. This allows detection of proteins of interest following intracellular staining.
After incubating cells with anti-CD4+, CD8+ or CD11b+ monoclonal antibodies for 30
min, cells were washed twice with wash buffer. Cells were then fixed in 4%
paraformaldehyde for 30 min on ice in the dark. Following this, cells were washed once
in wash buffer and 100 μL 0.1% saponin in PBS was added for 30 min to permeabilise
the cells. After two washes with PBS, cells were incubated with anti IFN antibody for
60 min. Cells labelled with isotype antibody were included as negative control.
For flow cytometry analysis, cells were analysed in the Biomedical Imaging and
Analysis Facility, UWA, using a Becton-Dickinson FACSCalibur. The cells were gated
as defined by forward and side scatter to ensure that 10,000 cells were being recorded,
and analysis was performed using the CELLQUEST program.

CHAPTER 3
MATHODS
79
3.10 STATISTICAL ANALYSIS
Student T-test was used in this project for statistical analysis of brain viral titres, ATD
and cytokine levels (Excel program). ANOVA was used when analysis involved more
than two groups. For analysis of mortality rate of mice, Kaplan Meier was employed
(SPSS program).

CHAPTER 4
NEUROVERULENCE AND NEUROINVASIVENESS
80
4.0 CHAPTER 4: STUDY ON KUNV, MVEV AND WNV
VIRULENCE IN SUSCEPTIBLE AND CONGENIC
RESISTANT MICE
4.1 INTRODUCTION
Numerous data have demonstrated that the outcome of infections is contributed by
many different host and virus factors (Brinton and Perelygin, 2003). Virulence of a
virus is the most prominent viral feature that in concert with a viral dose and route of
inoculation, could dictate the severity of disease. The virus virulence is characterised by
the ability of virus to invade the CNS (neuroinvasiveness), and by the ability of virus to
establish lethal infection in the brain (neurovirulence).
The neurovirulence of several flaviviruses belonging to the JE complex serogroup has
been studied earlier in this laboratory in flavivirus susceptible HeJ and congenic
resistant MOLD, RV and DUB mice. Resistant MOLD and DUB mice, developed in
this laboratory, carry novel resistance alleles Flvr-like and Flv
mr, respectively, which
confer different degrees of resistance against flaviviruses when compared to resistant
RV mice (Urosevic et al, 1999). Data from this and other laboratories indicated that the
same flavivirus may produce different neurovirulence patterns in susceptible and
resistant mice (Urosevic et al, 1999; Sabin, 1952a). For example, i.c. challenge of 17D
YFV resulted in 100% mortality in HeJ mice but did not affect the survival of resistant
mice (Urosevic et al, 1999; Sabin, 1952a). In contrast, i.c. challenge with MVEV strain
1/51 induced less than 50% death in both susceptible and resistant mice (Shueb et al,
2005).
The aim of the study described in this chapter was to extend our knowledge and to shed
further light onto the neurovirulence and neuroinvasive properties of three flaviviruses,
WNV (Sarafend), MVEV (OR2) and KUNV (MRM16) in two mouse strains expressing
different levels of susceptibility/resistance to flaviviruses; the flavivirus susceptible HeJ
and flavivirus resistant DUB mice. Although KUNV, MVEV and WNV have been
extensively used previously in this laboratory, their virulence in resistant and
susceptible mice has never been completely characterised. Thus, to assess their

CHAPTER 4
NEUROVERULENCE AND NEUROINVASIVENESS
81
neuroinvasiveness and neurovirulence, these three flaviviruses were delivered by the i.p.
and i.c. routes to susceptible HeJ and resistant DUB mice. Additionally, a small study
involving intranasal (i.n.) infection was also performed in parallel to examine virus
virulence in the absence of mechanical (needle) injury to the CNS.
In addition, the second aim of the study was to investigate the effect of breaching BBB
or alteration of function/population of host innate and adaptive immune cells on the
neuroinvasiveness of the three flaviviruses. To achieve this, two chemicals, SDS and
LPS, which are known to modulate the BBB were assessed for their effect on virus
neuroinvasiveness. Host early defence/inflammatory cells were also manipulated using
treatments with thioglycollate, clodronate and anti-T cells antibodies to examine
whether the absence/presence of certain cell types would facilitate flavivirus invasion to
the brain and subsequently induce a more severe disease in mice.
4.2 RESULTS
4.2.1 VIRUS NEUROVURULENCE STUDIES
This study was undertaken to compare the neurovirulence of WNV, KUNV and MVEV
in flavivirus HeJ susceptible and resistant DUB mice following i.c. challenge. This
work was aimed at determining whether a difference in the neurovirulence displayed by
these viruses in susceptible mice would also be displayed in flavivirus resistant DUB
mice. The viruses used in this study were propagated once in suckling mouse brain and
twice in Vero cells. TCID50 bioassay was performed to determine the titres of the virus
stocks. Initial stocks of WNV, KUNV and MVEV were determined to have titres of
109.2
/100 µL, 107.9
/100 µL and 107.4
/100 µL TCID50 units respectively.
4.2.1.1 Analysis of neurovirulence of WNV, KUNV and MVEV in susceptible mice
In this study, virus stocks were serially diluted in PBS from 10-1
and up to 10-6
.
Following this, 5 µL of each virus dilution were inoculated by the i.c. route to
susceptible HeJ and resistant DUB mice. Groups consisting of 8-20 mice of both sexes
aged between 12 to 15 weeks were used per each virus dilution, and the mice were
monitored for signs of disease for up to 30 days p.i. Signs of illness exhibited by sick

CHAPTER 4
NEUROVERULENCE AND NEUROINVASIVENESS
82
mice included ruffled fur, hunched back, body weight reduction and hind leg paralysis.
Sick animals were culled and deaths were recorded before they reached moribund stage,
in accordance with the rules and practices prescribed by the UWA Animal
Experimentation and Ethics Committee. As negative controls, two groups of 5-8 mice
were inoculated i.c. with either PBS or UV-treated viruses. These mice did not exhibit
any signs of disease when monitored for 30 days indicating that the injection alone or
dead virus could not trigger fatal encephalitis in mice.
As shown in Table 4.1.A, the outcome of infection, which is defined by the mortality
rates and average time to death (ATD) of infected animals, was affected by the dose and
type of infecting viruses. High doses of KUNV induced 100% mortality in HeJ mice, as
seen in animals i.c. infected with 3.0 x 10⁵ , 3.0 x 10
4 or 3.0 x 10
3 infectious units (i.u.)
of KUNV. In contrast, mice were not affected when infected with weaker doses; 3.0 x
102 i.u. of KUNV or lower (virus stock dilution 10
-3 and higher). Similarly, all HeJ mice
had fatal encephalitis following i.c. challenge with 8.0 x 10⁵ , 8.0 x 10
4 or 8.0 x 10
3 i.u.
of WNV (10-2
to 10-4
virus stock dilutions) while they displayed complete survival with
lower amounts of WNV (8.0 x 10² i.u. and 8.0 x 10 i.u. of WNV). Interestingly, lower
doses of MVEV compared with KUNV and WNV were required to cause similar 100%
lethal infection in susceptible HeJ mice (1.0 x 10³ i.u. and 1.0 x 10
2 i.u. of MVEV),
suggesting that these flaviviruses, although closely related, exhibit disparate
neurovirulence in susceptible HeJ mice.
To investigate whether different strains of susceptible mice would be uniformly
vulnerable to flavivirus infection, parallel i.c. infection was also carried in three
flavivirus susceptible mouse strains; HeJ, C57BL/6 and BALB/c mice. However, for
this study, only two dilutions of KUNV were used. As shown in Table 4.1.B, C57BL/6
mice displayed a slight resistance to i.c. KUNV challenge as suggested by the lowest
mortality recorded compared with the other mouse strains, HeJ and BALB/c that had
similarly high mortality rates. However, the difference in mortality rates and ATD
observed in these animals was not significant (Student t test, p > 0.05)
.

CHAPTER 4
NEUROVERULENCE AND NEUROINVASIVENESS
83
Table 4.1.A Mortality and LD50 studies following intracerebral infection with
serially diluted viruses in flavivirus susceptible HeJ mice.
Virus
Virus
stock
dilutions
Amount
(i.u.)a
Mortality/
tested ATD
b
LD50
(virus
dilutions)
LD50
(i.u.)
KUNV
10-1
3.0 x 10⁵ 20/20 5.0 ± 0
10-3.5
1.7 x 10³
10-2
3.0 x 10⁴
10/10
5.0 ± 0
10-3
3.0 x 10³ 10/10 5.0 ± 0
10-4
3.0 x 10² 0/10 -
10-5
3.0 x 101 0/10 -
MVEV
10-3
1.0 x 10³ 10/10 6.0 ± 0
10-4.62
3.4 x 101
10-4
1.0 x 10² 10/10
7.4 ±
1.4
10-5
1.0 x 101 2/10 8.0 ± 0
10-6
1.0 x 100 2/10 11.0 ± 0
WNV
10-2
8.0 x 10⁵ 8/8
5.3 ±
0.3
10-4.5
4.4 x 10³
10-3
8.0 x 10⁴ 8/8
5.3 ±
0.3
10-4
8.0 x 10³ 8/8
8.3 ±
2.0
10-5
8.0 x 10² 0/8 -
10-6
8.0 x 101 0/8 -
Mice were monitored for 30 days for signs of disease and those that were sick were
sacrificed before they reached moribund state and deaths were recorded. The fifty
percent lethality dose (LD50) values were calculated according to the methods by Reed
and Muench (1938).
aInfectious units
bAverage time to death (days) ± standard error

CHAPTER 4
NEUROVERULENCE AND NEUROINVASIVENESS
84
Table 4.1.B. Mortality in different susceptible mouse strains following
intracerebral infection with KUNV.
Virus
Virus
stock
dilutions
Amount
(i.u.)a
%Mortality
(No. of died/
Inoculated)
ATDb
HeJ
10-2
3.0 x 10⁴ 85
(6/7) 6.0 ± 1.6
10-3
3.0 x 10³
0
0/7 -
C57BL/6
10-2
3.0 x 10⁴ 64
(7/11) 5.8 ± 0.7
10-3
3.0 x 10³
30
(3/10) 7.0 ± 2.0
BALB/c
10-2
3.0 x 10⁴ 90
(9/10) 5.6 ± 1.0
10-3
3.0 x 10³
11
(1/9)
7.0 ± 0.0
aInfectious units
bAverage time to death (days) ± standard error
Differences in mortality between different mouse strains were not significant (p < 0.05)

CHAPTER 4
NEUROVERULENCE AND NEUROINVASIVENESS
85
4.2.1.2 Analysis of neurovirulence of WNV, KUNV and MVEV in resistant mice
Previous studies have indicated that the Flv gene does not confer full protection to
flavivirus resistant mice against all flavivirus infections (Sabin, 1954; Urosevic and
Shellam, 2002; reviewed in Brinton and Perelygin, 2004). Because of this, this study
was aimed at determining a difference in neurovirulence between three flaviviruses,
WNV, KUNV and MVEV in resistant DUB mice. As shown in Table 4.1.C,
intracerebral challenge of WNV and KUNV induced fatal encephalitis in a proportion of
resistant DUB mice. Parallel to infection in HeJ mice, KUNV induced a higher
death rate at a much lower dose than WNV. At 3.0 x 10⁵ i.u., all DUB mice
succumbed to KUNV infection while none of the mice were affected following
challenge with equal to or less than 3.0 x 10³ i.u. of KUNV. In contrast, WNV infection
at doses of 8.0 x 10⁴ i.u. and 8.0 x 10
5 i.u., resulted in only 75% deaths of DUB mice.
However, the ATD in resistant DUB mice receiving various doses of WNV and KUNV
were considerably greater than that observed in similarly infected susceptible HeJ mice
(Student t test, p < 0.001), most probably due to the presence of the resistance gene in
the former mice that delayed a development of disease. More importantly, it was
demonstrated here that MVEV, which showed greater neurovirulence to HeJ mice than
KUNV and WNV, did not induce a fatal disease in DUB mice when inoculated at a very
high dose. However, higher dilutions of MVEV stock containing lower viral doses were
not included in this study since numerous studies previously performed in this
laboratory using lower doses of MVEV did not show any mortality among resistant
DUB mice (pers. com. Dr. N. Urosevic).
4.2.1.3 Analysis of different degrees of neurovirulence of WNV, KUNV and MVEV
In order to assess the neurovirulence levels of these three viruses, the virus dose
required to kill 50% of infected mice (LD50) was calculated (Reed and Muench, 1938).
From Table 4.1.A, LD50 in susceptible mice were 4.4 x 10³ i.u., 1.7 x 10
3 i.u. and 3.4 x
101 i.u. for WNV, KUNV and MVEV respectively. From this result it can be concluded
that MVEV was the most neurovirulent virus in susceptible HeJ mice since fewer
infectious viral units were required to kill the same number of mice. The next most
neurovirulent virus was KUNV while WNV was the least neurovirulent virus in this
study (Table 4.1.A).

CHAPTER 4
NEUROVERULENCE AND NEUROINVASIVENESS
86
Table 4.1.C Mortality and LD50 studies following intracerebral infection with
serially diluted viruses in flavivirus resistant DUB mice.
Virus Virus stock
dilutions
Amount
(i.u.)a
Mortality/
tested ATD
b
LD50
(virus
dilutions)
LD50
(i.u.)
KUNV
10-1
3.0 x 10⁵ 10/10 8 ± 0
10-2.2
2.2 x
104
10-2
3.0 x 10⁴
6/9 9 ± 0
10-3
3.0 x 10³ 0/10 -
10-4
3.0 x 10² 0/10 -
10-5
3.0 x 101 0/10 -
MVEV* 10-1
1.0 x 10⁵ 0/10 - -
WNV
10-2
8.0 x 10⁵ 6/8 8 ± 0
10-3.5
6.2 x
104
10-3
8.0 x 10⁴ 6/8 9 ± 0
10-4
8.0 x 10³ 2/8 14 ± 0
10-5
8.0 x 10² 2/8 14 ± 0
Mice were monitored for 30 days for development of diseases and those that were sick
were sacrificed before they reached moribund state and deaths were recorded. The fifty
percent lethality dose (LD50) values were calculated according to the methods by Reed
and Muench (1938). *Only one dose of MVEV was used to infect DUB mice since
numerous studies using equal or lower doses have been performed in this laboratory by
other researchers with similar outcome of infection observed (Silvia, 1999; Pantelic,
2004).
aInfectious units
bAverage time to death (days) ± standard error

CHAPTER 4
NEUROVERULENCE AND NEUROINVASIVENESS
87
Neurovirulence of these three flaviviruses in resistant DUB mice however was
significantly different. As demonstrated in Table 4.1.C, KUNV was the most
neurovirulence (LD50 was 2.2 x 10⁴i.u.)
in resistant mice. WNV was slightly less
neurovirulent than KUNV since it had a higher LD50 value (LD50 6.2 x 10⁴i.u.).
4.2.1.3 Mouse mortality and average time to death using a 100 LD50 virus dose
In this study, neurovirulence of the same flaviviruses was studied using single virus
dose of 100 times LD50 as determined for susceptible mice. This dose was known to
induce 100% mortality in susceptible mice, but the death rate in resistant mice was
unknown. Since in the previous studies (Section 4.2.1.3), KUNV and MVEV were
determined to be the most neurovirulent in susceptible and resistant mice, respectively,
they were chosen for further analyses of mortality rate and ATD in mice. A dose of 100
LD50 for susceptible mice corresponded to 1.74 x 10⁵ i.u. of KUNV and 3.4 x 10
3 i.u. of
MVEV.
Two groups of HeJ mice and another two groups of DUB mice which consisted of 15
nine-week old animals per group were used for this experiment. One group of mice of
each mouse strain was challenged i.c. with KUNV while the other group with MVEV.
The mice were monitored for 30 days for the development of disease. Flavivirus
susceptible HeJ mice infected with KUNV started to show signs of sickness such as
slight fur ruffling and hunching four days after infection. The following day (day 5 p.i.),
all mice developed severe ruffling and hunching with some suffering from hind-leg
paralysis and they were immediately culled (Figure 4.1). In contrast, MVEV-infected
susceptible HeJ mice only started to exhibit signs of disease on day 5 p.i. and by day 6
p.i., all of them developed fatal encephalitis and were culled (100% mortality).
Similarly, KUNV infection in resistant DUB mice displayed a slower disease
progression compared with susceptible mice. Resistant DUB mice started to be slightly
ruffled and hunched on day 7 p.i. and subsequently all succumbed to the infection. Sixty
percent of DUB mice died on day 9 p.i. while the rest died the next day. In contrast,
resistant DUB mice challenged with MVEV did not develop any disease or death, as
shown previously in the laboratory (pers. com. Dr. N. Urosevic).
Therefore, using a dose of 100 LD50 for susceptible mice, earlier deaths were observed
in KUNV-infected susceptible HeJ mice (day 5 p.i.) than in those infected with MVEV

CHAPTER 4
NEUROVERULENCE AND NEUROINVASIVENESS
88
(day p.i.). In contrast, resistant DUB mice succumbed to KUNV infection 4-5 days later
(day 9 p.i.) while as expected, MVEV infection did not have any effect on resistant
mice.
4.2.2 INTRANASAL INFECTION IN SUSCEPTIBLE MICE
Intranasal infection (i.n.) of KUNV and MVEV was also performed in susceptible HeJ
mice to study mortality induced following an alternative route that delivers the virus
directly into the brain. This route avoids any needle injury to the brain that is observed
following i.c. inoculation. The injury caused to the brain following virus delivery during
i.c. infection may possibly contribute to the development of a more severe course of
infection. Thus, the mortality rate following i.n. challenge may be lower than that
observed after i.c. infection. In this study, four times the dose given for i.c. infection
was used for virus inoculation via i.n. route. A greater amount of virus was needed for
i.n. infection because it was known that a large percentage of the virus would be
distributed to the lungs, stomach or expelled from the nares of the animal (Silvia, 1999).
To study whether brain injury induced would exaggerate the course of infection, 5 µL
PBS was delivered i.c. into another group of mice a day after i.n. KUNV or MVEV
infection.
As shown in Table 4.2, mice that received i.c. inoculation of PBS only did not
succumbed to needle injury, suggesting that inflicted wound in the brain alone is not
sufficient to cause mortality in mice (Table 4.2). Only one of six susceptible HeJ mice
died from i.n. KUNV challenge while none of the 10 mice i.n. infected with MVEV
succumbed to the infection. Interestingly, the presence of brain wound increased
susceptibility of susceptible HeJ mice to i.n. KUNV and MVEV infection. Three out of
seven mice challenged with KUNV i.n. and had brain injury succumbed to the infection.
The difference however was not significant when compared to KUNV-infected mice
that did not receive PBS. In addition, the time to death and average brain viral burden
were similar to that observed in mice that received KUNV only. Following MVEV
challenge and brain injury, four out of ten mice showed serious signs of illness on day
10 p.i. and later died on day 11 or 12 p.i. (Student t test, p < 0.04 when compared with
infected with MVEV only).

CHAPTER 4
NEUROVERULENCE AND NEUROINVASIVENESS
89
0
20
40
60
80
100
1 3 5 7 9 11 13 15
Days post infection
Su
rviv
al
(%)
HeJ-KUNV HeJ-MVEV
DUB-KUNV DUB-MVEV
Figure 4.1 Analysis of survival in mice following infection with 100 LD50 (in
susceptible mice) of KUNV and MVEV.
The 100 LD50 dose of virus given to mice was equivalent to 1.74 x 10⁵ and 3.4 x 10
3i.u.
of KUNV and MVEV, respectively. Fifteen mice were used per group and animals were
monitored until 30 days p.i. for signs of diseases.

CHAPTER 4
NEUROVERULENCE AND NEUROINVASIVENESS
90
Table 4.2. Mortality studies following intranasal infection of KUNV and MVEV in
HeJ mice.
Virus
(i.n.)
Treatment
(i.c.)
Mortality (%)
(number of
death/total
number of mice)
ATDa
(days p.i.)
Viral titres
(log10 TCID50
/0.01g)
- PBS 0
(0/5) - -
KUNV
- 17
(1/6) 7.0 ± 0.0 7.4 ± 0.0
PBS 43
(3/7) 7.0 ± 0.0 7.7 ± 0.2
MVEV
- 0
(0/10) - -
PBS 40
(4/10) 11.8 ± 0.3 ND
The amount of virus given to the mice was 4 x 100 LD50. The values were equivalent to
6.9 x 10⁵ i.u. and 1.4 x 10
4 i.u. of KUNV and MVEV respectively. Five microlitres of
PBS was i.c. injected a day after virus infection.
aAverage time to death (days) ± standard error
ND = not done

CHAPTER 4
NEUROVERULENCE AND NEUROINVASIVENESS
91
4.2.3 VIRUS NEUROINVASIVENESS STUDIES
4.2.3.1 Intraperitoneal challenge in adult and young mice
Neuroinvasiveness is the ability of certain viruses to replicate in the periphery and
invade the central nervous system to establish a disease. This property usually can be
tested by inoculating the virus from the periphery. Viruses that could cause morbidity in
mice following i.p. route of infection are classified as neuroinvasive viruses. Since
KUNV, MVEV and WNV have different neurovirulence properties in susceptible and
resistant mice, these flaviviruses were expected to display varying patterns or levels of
neuroinvasiveness as well.
To study neuroinvasiveness of KUNV, MVEV and WNV, three groups of adult 8 to 10
weeks old susceptible HeJ mice were infected i.p. with 2 x 10⁷ i.u. of WNV, KUNV or
MVEV. This dose was chosen because it has been routinely used in the laboratory to
induce deaths in HeJ mice after i.p. challenge with WNV. As shown in Table 4.3,
infection with WNV resulted in 60% death of adult HeJ mice with ATD of about 9
days. The average brain titres in mice succumbing to WNV infection tested by TCID50
bioassay was 7.5 ± 0.5 log10 TCID50/0.01g brain tissue. Meanwhile, MVEV i.p.
challenge induced a slightly higher mortality rate (70%) in susceptible HeJ mice.
Furthermore, on average, susceptible HeJ mice succumbed to i.p. MVEV infection on
day 7.8 p.i., which was a day earlier than observed in WNV-infected mice (Student t
test, p > 0.05). Interestingly, brain viral titres of sick MVEV-infected HeJ mice were
more than 2 logs higher than in WNV-infected HeJ mice. In sharp contrast, KUNV
failed to induce fatal encephalitis in these mice. To further confirm that KUNV was
avirulent if inoculated by the peripheral route, animals were also challenged with higher
amounts of the virus. However i.p. challenge with 2 x 10⁸ i.u. and 1 x 10
9 i.u. of KUNV
also did not induce any manifestation of disease in susceptible HeJ mice (data not
shown). Thus, it can be concluded that within the dosage range used in this study, only
WNV and MVEV were neuroinvasive while KUNV was not neuroinvasive in adult
flavivirus susceptible HeJ mice.
Since KUNV was non neuroinvasive in adult HeJ mice, a study was then performed to
look at the course of infection with the same virus in young 3-week-old mice. Young
mice have immature immune systems and not fully developed BBB and many studies

CHAPTER 4
NEUROVERULENCE AND NEUROINVASIVENESS
92
have shown that they are more susceptible to virus infection than adult mice (Liebert,
2001). Five young susceptible HeJ mice were given 2 x 10⁷ i.u. of KUNV and
development of disease was monitored. Four animals started to develop ruffled fur and
hunched back 6 days after infection and by day 7 p.i., two of them exhibited hind-leg
paralysis and were sacrificed. Additionally, 2 mice succumbed to the virus infection on
day 9 p.i. Average brain virus titres from these dying mice were 5.84 ± 1.0 log10
TCID50/0.01g tissue (Table 4.3). This suggests that, in contrast to adult HeJ mice,
KUNV was highly neuroinvasive in young HeJ mice.
A similar neuroinvasiveness study was also undertaken in flavivirus resistant DUB
mice. However, in this part of the study, only WNV and KUNV were tested. MVEV
was excluded as it failed to induce any mortality in DUB mice even when virus was
directly inoculated into the brain (i.c. infection) (Section 4.2.1.2). It should be noted
here that the highest dose given to resistant DUB mice during i.c. challenge of MVEV
was 1 x 10⁵ i.u., which was more than 0.5 logs higher than the amount of infectious
WNV and KUNV required to cause 50% mortality of DUB mice. It is not known
whether resistant DUB mice would still survive if a much higher dose of MVEV (more
than 1 x 10⁵ i.u.) was used. However, it was impractical to infect resistant DUB mice
with more than 1 x 10⁵ i.u. of MVEV as this would lead to inoculating virus at a neat
concentration since MVEV stock had a low TCID50 units compared to the other two
viruses. Given that virus was propagated in Vero cells, concentrated virus may contain
unnecessary components of the cells that could cause false positive/negative results
following infection.
When adult DUB mice received 2 x 10⁷ i.u. of WNV or KUNV by the i.p. route (10
mice per virus), they did not show any signs of disease when monitored for 30 days
(Table 4.3). Similar infection in young 3 weeks old DUB mice (10 mice per virus)
produced comparable results (Table 4.3).
Since WNV was more neuroinvasive than KUNV in susceptible HeJ mice, higher
amounts of the former virus were also given to a group of young resistant DUB mice to
further verify that this virus was non neuroinvasive in resistant mice. Doses of 2 x 10⁸
and 2 x 10⁹ i.u. of WNV were given to 5 mice per group and this infection also failed to
induce lethal disease (data not shown). Thus, this study demonstrated that WNV and
KUNV were avirulent during i.p. challenge in both adult and young resistant DUB mice

CHAPTER 4
NEUROVERULENCE AND NEUROINVASIVENESS
93
Table 4.3. Intraperitoneal infection of KUNV, MVEV and WNV in flavivirus
susceptible HeJ and resistant DUB mice
Mouse
strain Virus
Mortality (%)
(number of
death/total
number of mice)
ATDa
(days p.i.)
Viral titres
(log10 TCID50
/0.01g)
HeJ
(adult)
WNV 60
(6/10) 9.0 ± 0.8 7.5 ± 0.5
KUNV 0
(0/15) - -
MVEV* 70
(7/10) 7.8 ± 0.5 10.0 ± 0.3
HeJ
(young) KUNV
80
(4/5) 8.0 ± 1.0 5.84 ± 1.0
DUB
(adult)
WNV 0
(0/10) - -
KUNV 0
(0/10) - -
DUB
(young)
WNV 0
(0/10) - -
KUNV 0
(0/10) - -
Adult mice used were aged between 8 to 12 weeks old while young mice were aged
between 3 to 4 weeks old, and they were infected i.p. with 2 x 10⁷ i.u. of virus.
*Since MVEV was not virulent to resistant mice following i.c. inoculation, it was
excluded from the neuroinvasiveness studies.
aAverage time to death (days) ± standard error

CHAPTER 4
NEUROVERULENCE AND NEUROINVASIVENESS
94
which most probably due to the flavivirus resistance gene that confers resistance to
peripheral tissues, consequently preventing virus replication and subsequent viral
invasion of the CNS.
4.2.3.2 Effect of blood brain barrier modulation on virus neuroinvasiveness
Following natural infection, flaviviruses are thought to spread, at least in part, via the
haematogenous route (Chambers and Diamond, 2003). For many encephalitis-inducing
viruses, the major obstacle is to pass the BBB, which forms a tight junction of the
endothelial cells in the brain and controls influx of molecules into the CNS. Studies
have shown that if the permeability of BBB is breached, non-neuroinvasive viruses may
also be able to reach the brain (Lustig et al, 1992; Kobiler et al, 1989; Ben-Nathan et al,
1996). Thus, it would be interesting to investigate whether increasing permeability of
the BBB would alter the outcome of infection during i.p. challenge of KUNV, MVEV
and WNV in susceptible and resistant mice.
4.2.3.2.1 Effect of SDS on KUNV and MVEV neuroinvasiveness in HeJ mice
The present study was designed to test whether SDS, which is known to modulate BBB
permeability (Saija et al, 1997), would increase susceptibility of HeJ mice to i.p. KUNV
and MVEV infections. Kobiler and co-workers (1989) showed that a variant of WNV-
25, that has lost neuroinvasiveness but not neurovirulence, could cause mortality in
mice when SDS (about 60 ng) was given together with the virus by the i.v. challenge.
Neuroinvasiveness of KUNV and MVEV were monitored in this study as these viruses
were shown to have very contrasting virulence traits in mice. While MVEV is highly
virulent in susceptible HeJ mice only, KUNV does not kill adult susceptible HeJ mice
by the i.p. route but it induces high morbidity in HeJ and DUB mice following i.c.
challenge.
To look at the ability of SDS to alter mortality in susceptible adult HeJ mice, a group of
15 mice were given SDS and KUNV at the same time (Table 4.4). Since several pilot
experiments performed by the i.v. route did not provide satisfactory results and due to a
limited number of animals available for optimising this experiment, the i.v. route of
inoculation was abandoned and the i.p. injection was chosen for SDS inoculation into
the mice. Two hundred microlitres of PBS that contained 240 ng SDS and 2 x 10⁷ i.u.

CHAPTER 4
NEUROVERULENCE AND NEUROINVASIVENESS
95
virus were given i.p. to a group of 10 to 15 adult HeJ mice and they were under
observation for 30 days. In addition, mice infected only with virus (control) were also
included. In KUNV-infected susceptible HeJ mice, concurrent administration of SDS
and virus did not have any effect on HeJ mice as all mice survived i.p. KUNV infection.
From the study above, SDS did not alter the survival rate of adult susceptible HeJ mice
when administered to the mice at the same time as the virus. It is possible that such an
outcome was due to a low efficiency of the i.p. challenge compared to the i.v.
inoculation, which used by Kobiler and co-workers (1989). Intravenous inoculation
transports virus directly into the bloodstream. In contrast, i.p. injection distributes virus
into the peritoneal cavity and possibly, only a small amount of virus could get into the
bloodstream, causing a delayed and low viraemia. Thus, the next set of experiments was
designed to treat mice with SDS several days after i.p. virus infection, allowing virus
replication and the induction of viraemia. Viremia was shown to occur up to day 3 p.i.
following i.p. infection with WNV in susceptible HeJ mice (Pantelic, 2004). However,
there was no prior knowledge on the levels and extent of viraemia during i.p. KUNV
and MVEV infection in this laboratory and thus it was decided that SDS would be given
3 days after KUNV or MVEV inoculation to adult HeJ mice. As illustrated in Table 4.4,
this treatment increased the susceptibility of adult HeJ mice to i.p. MVEV but not i.p.
KUNV challenge. During i.p. MVEV challenge in control mice, animals started to
exhibit typical signs of flavivirus-induced encephalitis including ruffled fur and
hunched posture on day 5 p.i. Deaths occurred between day 6 p.i. to day 9 p.i. and 70%
mortality was recorded (7 out 10 mice died). Average time to death of these mice was
7.8 days p.i. with average brain titres of 10.0 ± 0.3 log10 TCID50/0.01g tissue. In
contrast, SDS treatment 3 days after infection caused quicker and slightly higher rate of
lethal MVEV (80%, p > 0.05, Kaplan Meier test ) infection in susceptible HeJ mice.
The first death of MVEV-infected susceptible HeJ mice treated with SDS was recorded
on day 4 p.i., which was 2 days earlier than control mice (Table 4.4). On average, these
mice succumbed to fatal disease a day earlier than the control mice (6.8 days p.i.).
While brain viral burden was slightly lower than in non-SDS treated group, no
considerable difference was noted between these 2 groups of mice (Student t test, p >
0.05).
Since SDS treatment did not enhance susceptibility of adult HeJ mice to i.p. KUNV
challenge, a small scale study involving young HeJ mice was carried out. Five mice

CHAPTER 4
NEUROVERULENCE AND NEUROINVASIVENESS
96
were used per group and they either received virus only, virus and SDS concurrently or
virus and SDS 3 days p.i. As shown in Table 4.4, concurrent SDS and i.p. KUNV
inoculation did not increase vulnerability of young HeJ mice to KUNV infection
since similar rate of mortality (80%) and ATD ( 8-9 day p.i.) were recorded.
Meanwhile, SDS treatment 3 days after virus challenge exacerbated the course of i.p.
KUNV infection in young HeJ mice. Rate of fatal encephalitis increased from 80% to
100% although statistical analysis could not be performed due to the small number of
mice involved. The increased susceptibility to i.p. KUNV infection was further
evidenced by the rapid disease progression. Young HeJ mice started to develop disease
on day 4 p.i. and some deaths occurred on day 5 p.i., a day earlier than that observed in
mice not treated with SDS. On average, SDS-treated mice succumbed to the infection
on day 6 p.i while non-treated animals died on day 8 p.i. However, the average brain
viral titres in SDS-treated KUNV-infected mice were a log lower than observed in non-
SDS treated mice.
4.2.3.2.2 Effect of blood brain barrier modulation on WNV neuroinvasiveness in mice
It remained to be answered whether resistant DUB mice would exhibit similar increased
susceptibility to i.p. flavivirus infection following breaching of the BBB. However,
since KUNV is a non neuroinvasive virus in adult susceptible mice while MVEV is
avirulent in resistant mice, WNV was the best alternative virus for neuroinvasiveness
study in resistant DUB mice since this virus is highly virulent to HeJ and DUB mice.
The effect of SDS on the neuroinvasiveness of WNV was investigated in young and
adult resistant DUB mice. In this study, adult HeJ mice were also included as a control
and since contribution of SDS to the outcome of i.p. WNV infection in susceptible mice
was not known. Mice were either infected with virus only or virus and SDS on either
day 0 or 2 p.i. Day 2 p.i. was chosen in this particular because it was thought that if
DUB mice developed viremia following i.p. flavivirus infection, it would be a much
transient process than that observed in HeJ mice. Additionally, day 2 p.i. corresponded
to the peak of viremia following the i.p. challenge with WNV.
As expected, concurrent administration of SDS and virus did not modify the survival
rate of adult HeJ mice as 60% of mice died with comparable ATD and average brain
viral titres (Student t test, p > 0.05) when the virus was i.p. inoculated with or without

CHAPTER 4
NEUROVERULENCE AND NEUROINVASIVENESS
97
SDS (Table 4.5). Meanwhile, WNV-infected HeJ mice treated with SDS 2 days after
infection exhibited higher susceptibility to the virus. Mortality increased to 75%
following SDS treatment although this was not markedly different. SDS treatment
however did not alter the resistance of DUB mice to i.p. WNV challenge (Table 4.5).
In addition to SDS, resistant mice were also treated with LPS during or after i.p. WNV
infection. LPS is an outer component of the cell wall of some gram negative bacteria
and can cause an array of physiological changes including immuno-stimulatory and
antigenic responses, and is known to alter BBB permeability (Di Marzio et al, 1990).
Lustig and co-workers (1992) previously demonstrated that administration of LPS prior
to infection with a non-neuroinvasive variant of WNV caused some mortality in mice.
While the majority of mouse strains respond to LPS, some mouse strains including HeJ
mice do not (Silvia and Urosevic, 1999). Resistant DUB mice however, were shown by
Silvia and Urosevic (1999) to be an LPS-responsive mouse strain since LPS-responsive
C3H/HeJARC mice were used as inbred parents during production of congenic resistant
DUB mice. Due to the LPS unresponsiveness of the HeJ mice, the effect of LPS on
modulation of WNV neuroinvasiveness was only studied in resistant DUB mice (data
not shown). LPS can stimulate macrophages and B cells to produce cytokines including
IL-1, TNFα and IFNγ (Di Marzio et al, 1990; Cockfield et al, 1993; Lustig et al, 1992).
Thus, to further verify the response of DUB mice to LPS, the levels of sera TNFα were
measured using a commercial ELISA-based assay (eBioscience). Sera were collected
from 2 non-treated mice and 2 LPS-treated mice (1.5h after treatment at 50 μg/mouse).
While TNFα was below detection in non-treated mice, LPS-treated mice had average
sera levels of 14.25 ± 7.5 pg/mL TNFα (data not shown), further confirming the
responsiveness of DUB mice to LPS.

CHAPTER 4
NEUROVERULENCE AND NEUROINVASIVENESS
98
Table 4.4 The effect of SDS on mortality of HeJ mice following i.p. KUNV and
MVEV infection.
Virus Age of
mice Treatment
Mortality (%)
(number of
death/total
number of mice)
ATDa
(days p.i.)
Viral titres
(log10
TCID50
/0.01g)
- Adult SDS 0
(0/5) - -
KUNV Adult
- 0
(0/10) - -
SDS
(day 0 p.i.)
0
(0/15) - -
SDS
(day 3 p.i.)
0
(0/10) - -
KUNV Young
- 80
(4/5) 8.0 ± 1.0 5.8 ± 1.0
SDS
(day 0 p.i.)
0
(4/5) 9.0 ± 1.0 5.9 ± 1.0
SDS
(day 3 p.i.)
100
(5/5) 6.0 ± 1.0 4.9 ± 1.1
MVEV Adult
- 70
(7/10) 7.8 ± 0.5 10.0 ± 0.3
SDS
(day 3 p.i.)
80
(8/10) 6.8 ± 0.5 9.2 ± 0.7
Mice received 2 x 10⁷ i.u. of virus and 240 ng of SDS. The animals were monitored for
30 days for any signs of diseases.
aAverage time to death (days) ± standard error

CHAPTER 4
NEUROVERULENCE AND NEUROINVASIVENESS
99
However, when LPS was administered to young and adult resistant DUB mice at the
same dose as above (50 μg/mouse i.p.) immediately or 2 days after i.p. WNV infection,
no development of fatal encephalitis was observed in these mice (data not shown). The
lack of effect of LPS on WNV neuroinvasiveness is not clear since no study was
performed to monitor the breaching of the BBB following treatment with 50 μg LPS.
It is possible that the lack of severe WNV infection in LPS-treated mice was due to
inefficient LPS treatment on the BBB permeability or the lack of peripheral virus
replication which eventually did not allow viraemia and viral invasion of the CNS.
Collectively, data from this study suggest that increasing the BBB permeability 2 to 3
days after infection only enhanced susceptibility of HeJ mice but not DUB mice to i.p.
flavivirus challenge, evidenced by the shorter ATD and/or increased death rate in the
former mice, although this depends on the strains of infecting virus as well.
4.2.3.3 Effect of macrophage modulation on flavivirus infection
Macrophages have pivotal role in the host antiviral immunity. Macrophages can act as
APC and produce various cytokines that could contribute to the clearance of virus
infection (Beutler, 2004). However, the ability of monocytes and macrophages to
support flaviviruses has been reported and therefore they may be also involved in the
pathogenesis of some viruses including DENV (reviewed in Solomon and Mallewa,
2001). In this part of study, the role of macrophages in immunopathogenesis and host
defence during flavivirus infection in both susceptible and resistant mice was
investigated as well as whether the modulation of macrophages using selected
chemicals would affect mortality or survival of mice after flavivirus infection was
investigated.
4.2.3.3.1 Mouse survival following thioglycollate treatment
The objective of this study was to investigate whether manipulation of macrophages
using thioglycollate could modify the outcomes of WNV and KUN infections in
flavivirus susceptible and resistant mice. Thioglycollate is a sterile inflammatory agent
that has been used extensively in many laboratories to attract cells into the peritoneal
cavity. This treatment has been shown previously to cause up to 10-fold increase in the
number of peritoneal cell yields with macrophages comprising more than 80% of these

CHAPTER 4
NEUROVERULENCE AND NEUROINVASIVENESS
100
cells (Silvia et al, 2001). To investigate the effect of thioglycollate treatment on
flavivirus infection, 10 adult HeJ mice were infected i.p. with 2 x 10⁷ i.u. of WNV or
KUNV. In another two groups of mice (10 mice per group), 1mL of 6% thioglycollate
was given i.p. to mice 3 days prior to WNV or KUNV infections. As shown in Table
4.6, accumulation of macrophages in the peritoneal cavity increased susceptibility of
adult HeJ mice to i.p. challenge with WNV, indicated by the increased death rate from
60% to 100% (Kaplan Meier test, p < 0.03). This result was in agreement with the
previous findings in this laboratory (Silvia, 1999; Pantelic, 2004). These mice started to
become sick on day 6 p.i. and the disease progressed in the next few days.
Most of the deaths were recorded on day 8 p.i. In contrast, WNV-infected mice not
treated with thioglycollate did not succumb to fatal encephalitis until 9 days after
infection. This indicates that peritoneal macrophages may be involved in WNV
pathogenesis and consequently in a fatal disease outcome, possibly by increasing virus
dissemination. Surprisingly, thioglycollate did not affect the survival of KUNV-infected
HeJ mice. The resistance of WNV infected adult and young DUB mice was similarly
unaffected by this chemical (Table 4.6).
Another separate group of young and adult resistant DUB mice were treated with
thioglycollate 3 days prior to infection and later with SDS 2 days after i.p. WNV
infection. It is initially thought that these treatments would make DUB mice more
vulnerable as these chemicals not only elicited potential harbouring site in the peritoneal
cavity but at the same time may assist WNV to invade the brain by breaching the BBB.
However, as shown in Table 4.7, DUB mice did not show increased susceptibility to i.p.
WNV challenge following both thioglycollate and SDS treatments.

CHAPTER 4
NEUROVERULENCE AND NEUROINVASIVENESS
101
Table 4.5 The effect of SDS on mortality of mice following i.p. WNV infection in
mice.
Mice Treatment
Mortality (%)
(number of
death/total
number of mice)
ATDa
(days p.i.)
Viral titres
(log10
TCID50
/0.01g)
HeJ
(adult)
- 60
(6/10) 9.0 ± 1.0 7.5 ± 0.5
SDS
(day 0 p.i.)
60
(6/10) 10.0 ± 1.0 6.9 ± 0.3
SDS
(day 2 p.i.)
75
(6/8) 9.0 ± 0.5 ND
DUB
(adult)
- 0
(0/10) - -
SDS
(day 0 p.i.)
0
(0/13) - -
SDS
(day 2 p.i.)
0
(0/8) - -
DUB
(young)
- 0
(0/10) - -
SDS
(day 0 p.i.)
0
(0/10) - -
SDS
(day 2 p.i.)
0
(0/5) - -
Mice were infected with 2 x 10⁷ i.u. of virus and received either 240 ng of SDS or 50 μg
LPS. The animals were monitored for 30 days for any signs of disease. Administration
of only SDS in DUB mice did not result in development of disease.
aAverage time to death (days) ± standard error
ND = not done

CHAPTER 4
NEUROVERULENCE AND NEUROINVASIVENESS
102
4.2.3.3.2 Mouse survival following transient macrophage depletion
Another important role played by macrophages is to provide an early non-specific
defence against invading micro-organisms. Thus, to study the importance of
macrophages in the early protection against flavivirus infection in susceptible and
resistant mice, transient depletion of macrophages was performed prior to virus
infection. Selective depletion of macrophages can be achieved by local administration
of liposome encapsulated dichloromethylene bisphosphonate (clodronate).
Intraperitoneal inoculation of clodronate depletes macrophages in the peritoneal cavity,
spleen, parathymic lymph nodes and liver (van Rooijen and Sanders, 1994; Biewenga et
al, 1995; Ciavarra et al, 1997). Five adult mice of each HeJ and DUB strains were
treated i.p. with 100μL of clodronate liposomes. Another 10 HeJ mice were treated with
100μL of empty liposomes. Four days later, all of these mice were infected i.p. with
WNV at 2 x 10⁷ i.u./mouse and they were monitored for 30 days. Control mice infected
with WNV only were also included. The depleting effect of clodronate on tissue
macrophages was confirmed by taking spleens from control and clodronate-treated HeJ
mice (4 days after treatment) and staining macrophages for F4/80 cell surface antigen
on the frozen spleen sections (Figure 4.2). Clodronate administration was shown to
cause elimination of the marginal zone and the red pulp macrophages from spleens of
treated mice. However, it must be noted here that macrophage depletion by clodronate
is a transient process. Since clodronate was administered only once, the absence of
macrophages was certain only at the early stage of infection and not throughout the
course of infection.
As shown in Table 4.7, HeJ mice that received empty liposome had similar mortality
rate and ATD as the control WNV-infected mice. This shows that phagocytosis of
empty liposomes did not affect WNV pathogenesis. Interestingly, mortality increased
from 60% in the control group to 100% in the clodronate-treated group (Table 4.7).
However, the overall statistical significance could not be calculated due to the small
numbers of animal used. Disease progression was notably quicker in clodronate-treated
mice which became sick on day 4 pi and all died the following day (Student t test, p <
0.05). In contrast, control HeJ mice only started to succumb to i.p. WNV from day 8 p.i.
onwards. Clodronate-treated HeJ mice succumbing to the i.p. WNV challenge also
displayed about 2.5 log lower brain virus titres than control HeJ mice (Student t test, p <
0.05). Thus, the transient absence of macrophages had a significant effect on i.p. WNV

CHAPTER 4
NEUROVERULENCE AND NEUROINVASIVENESS
103
Table 4.6. The effect of thioglycollate on mortality of HeJ and DUB mice following
i.p. virus infection.
Mouse
strain Virus Treatment
Mortality (%)
(number of
death/total
number of mice)
ATDa
(days
p.i.)
Viral titres
(log10 TCID50
/0.01g)
HeJ
(adult)
WNV
- 60
(6/10)
10.0 ±
2.0 7.5 ± 0.5
Thioglycollate 100
(10/10) 8.0 ± 1.0 7.0 ± 1.0
KUNV
- 0
(0/10) - -
Thioglycollate 0
(0/10) - -
DUB
(adult) WNV
- 0
(0/5) - -
Thioglycollate 0
(0/5) - -
Thioglycollate
/SDS (day 2
p.i)
0
(0/9) - -
DUB
(young) WNV
Thioglycollate 0
(0/13) - -
Thioglycollate
/ SDS (day 2
p.i.)
0
(0/6) - -
Adult mice were given 1mL of 6% thioglycollate and 3 days later received 2 x 10⁷ i.u.
of virus. Two hundred microlitres of thioglycollate was administered to young DUB.
The animals were monitored for 30 days for any signs of disease.
aAverage time to death (days) ± standard error

CHAPTER 4
NEUROVERULENCE AND NEUROINVASIVENESS
104
Table 4.7. The effect of macrophage depletion on mortality of adult HeJ and DUB
mice following WNV infection
Mouse
strain Treatment
Mortality (%)
(number of
death/total
number of mice)
ATDa
(days p.i.)
Viral titres
(log10 TCID50
/0.01g)
HeJ
- 57
(4/7) 8.5 ± 1.1 6.8 ± 0.4
Empty
liposome
60
(6/10) 8.3 ± 1.0 7.0 ± 0.5
Clodronate 100
(5/5) 5.0 ± 0.0* 5.4 ± 1.6*
DUB Clodronate 0
(0/5) - -
Clodronate (100 μL) was given to the mice 4 days prior to WNV infection at
2 x 10⁷ i.u. The animals were monitored for 30 days for any signs of disease. Statistical
analysis was not performed due to the small numbers of mice involved in this study.
*The difference in the ATD and brain viral titres were statistically significant in
clodronate treated-HeJ versus control or liposome treated-HeJ mice (Student t test, p <
0.05)
aAverage time to death (days) ± standard error

CHAPTER 4
NEUROVERULENCE AND NEUROINVASIVENESS
105
A
B
Figure 4.2: Depletion of splenic macrophages by clodronate treatment.
Frozen spleen tissue sections taken from mice 4 days after receiving 100μL of
A) PBS B) Clodronate. Macrophages were stained with monoclonal antibody specific
for F4/80 cell surface antigen which is expressed in macrophages (brown colour). No
splenic macrophages could be detected in mice treated with clodronate.

CHAPTER 4
NEUROVERULENCE AND NEUROINVASIVENESS
106
infection in HeJ mice, suggesting that these cells may have important role in the early
host innate defence against WNV.
However, similar to earlier observations in BBB modulation studies, elimination of
macrophages early in the infection by clodronate did not promote development of fatal
disease in resistant DUB mice following i.p. WNV infection. These findings indicate
that the outcome of infection varies in different animal models and following different
treatments since virus pathogenesis is dependent on many host and viral factors.
4.2.3.4 Effect of T cells depletion on survival of DUB mice following WNV i.p.
infection
An intact host immune response is critical for prevention of fatal diseases following
invasion of pathogens (Chambers and Diamond, 2003; Diamond, 2003). In addition to
the host innate defence mechanisms/cells, the host adaptive immune response has been
shown to have a crucial role in the protection or pathogenesis of some flaviviruses,
depending on the infecting flaviviruses, route of inoculation as well as the genetic
background of the mice (reviewed in Chambers and Diamond, 2003; King et al, 2003;
Wang et al, 2003b). Thus, the following study was designed to examine the role of T
cells, which are part of the host adaptive immune cells, in resistant mice during i.p.
WNV challenge. The depletion effect of CD4+ T cells and/or CD8+ T cells was
achieved using anti-CD4+ T cells or CD8+ T cells monoclonal antibodies. This study
was performed in resistant DUB mice only due to limited amount of depleting
monoclonal antibodies available. To confirm that depletion of T cells was achieved, two
groups of mice were given either anti-CD4+ or anti-CD8+ T cell depleting antibodies
on day 1 and day 3. Spleens harvested from these mice on day 4 post depletion were
then analysed by flow cytometry. 96% and 95% depletion of CD4+ and CD8+ T cells
was achieved, respectively (please refer to Figure 6.5).
Young 3 week old DUB mice were depleted of CD4+ T cells (150 µL) while adult DUB
mice were depleted of both CD4+ (150 µL) and CD8+ T (100 µL) two days prior to i.p.
challenge with WNV. Since 2 x 10⁷ i.u. of WNV did not kill DUB mice by i.p.
challenge, a higher dose of 2 x 10⁸ i.u. was used in this study. It was thought that this
high viral dose would be sufficient to induce fatal encephalitis in resistant DUB mice
CHAPTER 4
NEUROVERULENCE AND NEUROINVASIVENESS
107
with a breached immune response. Following infection, animals received further T cell-
depleting antibodies on day 0, 2, 4 and 8 p.i.
However, as shown in Table 4.8, absence of CD4+ T cells in young 3 weeks old DUB
mice as well as the lack of both CD4+ and CD8+ T cells in adult DUB mice did not
render these animals susceptible to i.p. WNV infection when monitored for 30 days.
This suggests that the flavivirus resistant gene has a more dominant role in determining
the outcome of infection than other forms of host non-specific or specific immune
responses.

CHAPTER 4
NEUROVERULENCE AND NEUROINVASIVENESS
108
Table 4.8. The effect of T cells depletion on mortality of DUB mice following i.p.
WNV infection
Age of
mice
(weeks)
T cells
depletion
Mortality (%)
(number of
death/total
number of mice)
ATDa
(days p.i.)
Viral titres
(log10 TCID50
/0.01g)
3 - 0
(0/5) - -
3 CD4 0
(0/5) - -
7 CD4/CD8 0
(0/5) - -
Resistant mice were infected with 2 x 10⁸ i.u. of WNV and depletion was performed
on 2 days before infection, day 0, 2, 6, and 8 p.i. Mice were monitored for 30 days for
any signs of illness.
aAverage time to death (days) ± standard error

CHAPTER 4
NEUROVERULENCE AND NEUROINVASIVENESS
109
4.3 DISCUSSION
This study described the in vivo characterisation of three closely related flaviviruses,
KUNV, MVEV and WNV in flavivirus susceptible HeJ and resistant DUB mice. The
most important finding of this study was that different virulence traits of KUNV,
MVEV and WNV were observed in these two mouse strains differing in their resistance
to flaviviruses. These results are remarkable as they further support other previously
published reports on flavivirus pathogenesis which involves multifaceted processes and
in which the outcome of infection is virus type- and host-dependent. Even closely
related flaviviruses such as WNV and KUNV behave differently in the same mouse
strain. In susceptible HeJ mice, KUNV, MVEV and WNV were neurovirulent, although
different degrees of neurovirulence were exhibited by these three viruses. MVEV was
the most neurovirulent virus in these susceptible mice, followed by KUNV and WNV,
as demonstrated by the low amount of MVEV (LD50 was 3.4 x 10 i.u.) needed to kill
50% of susceptible mice, compared with LD50 of 1.7 x 10³ i.u. for KUNV and LD50 of
4.4 x 10³ i.u. for WNV (Table 4.1.A). Based on the LD50 in HeJ mice following i.c.
inoculation as shown above, KUNV appears to be significantly more virulent than
WNV (one log difference in the LD50). However, as it will be discussed later, WNV
was neuroinvasive in HeJ mice following i.p. inoculation while KUNV was not. These
interesting findings suggest that the virus virulence is a very complex property and it
depends on the route of virus inoculation and the genetic background of the host.
Until now, there was no evidence to suggest that there are different levels of
susceptibility to flaviviruses among laboratory mouse strains carrying Flvs gene
(Darnell et al, 1974; Sangster et al, 1993). Although Muira and colleagues (1988)
reported a variable susceptibility of C3H, C57BL/6 and BALB/c mice following i.p.
challenge with JEV, these differences were not observed when mice were infected with
JEV via the i.c. route. Accordingly, in this current study, HeJ, C57BL/6 and BALB/c
mice which have different genetic backgrounds were also shown to be equally
susceptible to i.c. KUNV challenge with comparable mortality rates and ATD observed
(Table 4.1.B). This is the first time that the i.c. infection with KUNV strain MRM16
was studied in parallel in mice of three different flavivirus susceptible mouse strains,
revealing a similar neurovirulence of KUNV in these mice.

CHAPTER 4
NEUROVERULENCE AND NEUROINVASIVENESS
110
Intracerebral infection of the same viruses in resistant DUB mice yielded very distinct
outcomes of infection compared to susceptible HeJ mice. Interestingly, KUNV was the
most neurovirulent virus in resistant DUB mice, followed closely by WNV.
Remarkably, MVEV, which was highly virulent in HeJ mice, was not neurovirulent in
resistant DUB mice (Table 4.1.C). The disparity in the neurovirulence of MVEV in
flavivirus susceptible and resistant mice indicates a dominant contribution of the host
resistance factor, Flvr-like, to the outcome of infection. Another related host resistance
factor, Flvr, was also shown in other studies to confer strong protection to resistant RV
mice against infection with a number of flaviviruses (Urosevic et al, 1999; Urosevic and
Shellam, 2002; reviewed in Brinton and Perelygin, 2003). The genes controlling these
host resistance factors were mapped to mouse chromosome 5 (Sangster et al, 1999;
Urosevic et al, 1997b). Recently, a gene candidate for Flvr was identified as an OAS1b
gene (Brinton and Perelygin, 2003). The mice carrying the Flvr and Flv
r-like genes were
shown to be fully resistant to MVEV OR2 strain (Shueb et al, 2005; Urosevic et al,
1999). However, these mice succumbed to infection with WNV and KUNV following
i.c. inoculation (Shueb et al, 2005) and these findings were in agreement results from
the present study.
One interesting observation was that although resistant DUB mice succumbed to i.c.
WNV and KUNV infection, the effect of the Flvr-like gene was also evident, as
indicated by the longer ATD (between 8 to 14 days) in infected DUB mice compared to
susceptible HeJ mice (about 5 days). Furthermore, the viral dose required to kill 50% of
resistant mice was 25 and 14 times greater than that required to kill similar proportion
of susceptible mice following i.c. infection with KUNV and WNV, respectively. The
vulnerability of flavivirus resistant DUB mice to certain i.c. flavivirus infections was
seen not only in this study. In fact, resistant mice have been reported to die from i.c.
infection with certain strains of WNV, JEV, SLEV and MVEV (Sabin, 1952a; Sabin,
1952b; Urosevic and Shellam, 2002; Brinton, 2001). However, the molecular or
cellular mechanisms responsible for this phenomenon have never been investigated
before.
A separate experiment was performed in this study examining the possibility that an
injury caused by a needle while performing i.c. delivery of a virus could exaggerate the
severity of the diseases. Hase and co-workers (1990b) have demonstrated that needle
injury increased mortality rate as well as decreased survival time in mice i.p. infected

CHAPTER 4
NEUROVERULENCE AND NEUROINVASIVENESS
111
with JEV. Accordingly, it was demonstrated in this study that HeJ mice exhibited
enhanced susceptibility to i.n. KUNV and MVEV when a wound was inflicted in the
brain following infection. This might suggest that the fatal encephalitis observed in
mice challenged i.c. can be influenced by the needle injury during administration of
virus.
Further work on in vivo characterisation of flaviviruses in this study demonstrated that
WNV and MVEV were neuroinvasive in susceptible HeJ mouse strain. This was
reflected by the ability of WNV and MVEV to induce 60% and 70% mortality,
respectively, in these mice. Interestingly, MVEV was slightly more neuroinvasive than
WNV since it induced earlier manifestation of fatal encephalitis in HeJ mice than WNV
(ATD of day 7.8 compared to ATD of day 9 during MVEV and WNV infection,
respectively). In contrast, KUNV was non neuroinvasive and it did not promote
morbidity in adult HeJ mice even when they were infected with much higher doses; up
to 109 i.u. of KUNV. KUNV was recently classified as the lineage I WNV and
therefore it is closely related to virulent WNV strains that are associated with fatal
human encephalitis in Europe, Russia, North America and the Middle East (Hall et al,
2002). At the proteome level, KUNV is more than 98% homologous in amino acid
sequence to WNV NY99 strain (Liu et al, 2003; Shi et al, 2002). However, to date,
KUNV is considered to be a flavivirus with minor medical implications as infections in
humans with KUNV are mild, with clinical symptoms including mild fever, headache,
rash and myalgia (Hall et al, 2002). This is in agreement with the findings in this study
which demonstrated that KUNV was non-neuroinvasive in adult HeJ mice. In fact,
fatalities in humans have not been recorded since the discovery of KUNV more than 40
years ago (Hall et al, 2002). Furthermore, data attained in the present study are in
accordance with results reported by several other investigators regarding the inability of
KUNV to kill mice during peripheral infection (Scherret et al, 2001; Beasley et al,
2002).
Intraperitoneal infection, unlike intracerebral infection, results in a broad dissemination
of the virus throughout the body with only a small proportion of it directly reaching the
brain. This is in contrast to the i.c. challenge, where most of the virus is delivered
directly to the CNS. Neuroinvasive viruses usually possess the ability to replicate to
high titres in the peripheral tissues/organs and to promote high levels of viraemia that
subsequently facilitates viral invasion of the brain (reviewed in Chambers and
CHAPTER 4
NEUROVERULENCE AND NEUROINVASIVENESS
112
Diamond, 2003). Although investigation into infection and viraemia in peripheral
organs were not conducted in the current study due to limited animals available, it could
be hypothesised here that the profound difference in neuroinvasiveness between
MVEV/WNV and KUNV in susceptible adult HeJ mice may be caused by the increased
infectivity and tropism towards extraneural tissues of MVEV/WNV, enabling them to
replicate and multiply at higher titres than KUNV. This would lead to sufficient levels
of viraemia to promote viral invasion of the brain. An association between different
tropism for extraneural tissues and the ability of viruses to generate viraemia has been
reported previously in high and low neuroinvasive flaviviruses (McMinn et al, 1996). In
this study, the highly neuroinvasive MVEV strain replicated in the lymph node and
induced early viraemia while the low neuroinvasive variant did not. Thus, the observed
lack of neuroinvasiveness of KUNV in susceptible HeJ mice may be explained by the
inefficient extraneural tissue replication of this virus.
Although KUNV is known to be non-neuroinvasive in adult susceptible mice (Scherret
et al, 2001, Beasley et al, 2002), it was the first time that KUNV was shown to be
extremely neuroinvasive in young HeJ mice, as evidenced by the high fatal encephalitis
rate in these mice (Table 4.3). Again, this finding highlights the complex host-viral
interaction and that different dominant factors govern the severity of disease in different
infection model. In young HeJ mice, the increased susceptibility to i.p. KUNV was due
to various host factors, particularly the age-related susceptibility. These include the less
developed adaptive immune response, poorly developed apoptotic regulator, IFN-
responsive genes and others that may allow a greater level of peripheral viral replication
and elevated viraemia (reviewed in Mullbacher et al, 2003; Labrada et al, 2002).
Additionally, young mice possess immature BBB which facilitates virus spread into the
brain. In humans, young children have also been reported to be more prone to develop
encephalitis with poor prognosis, as well as having a greater chance of suffering from
neurological sequelae after virus infection in comparison to older children and adults
(reviewed in Griffin, 1995).
In this study, it was reported for the first time that KUNV and WNV, although highly
neurovirulent to resistant DUB mice, are not neuroinvasive in these mice as shown by
their inability to induce fatal encephalitis following i.p. inoculation despite their
neurovirulence in the same resistant mouse strain during i.c. infection (Table 4.3). In
case of WNV, the lack of neuroinvasion in resistant DUB mice may have resulted from

CHAPTER 4
NEUROVERULENCE AND NEUROINVASIVENESS
113
the expression of Flv-resistance in peripheral tissues. Expression of resistance has been
shown in primary cultures prepared from lungs, kidneys, spleen, peritoneal
macrophages and embryo fibroblasts from resistant mice (reviewed in Brinton and
Perelygin, 2003). Although flavivirus resistant cells can be infected, virus usually
replicates at low titres (Urosevic and Shellam, 2002). As a consequence, peripheral
organs probably were infected at a very low level with WNV, leading to insufficient
viraemia. Since KUNV was non-neuroinvasive to susceptible HeJ mice, its inability to
infect resistant DUB mice when inoculated peripherally is not surprising and clearly, it
is not dependent on the expression of the Flv resistance gene. However, the Flv gene is
known to be expressed even in young resistant mice (Sabin, 1952). In this study, it was
demonstrated that 3 weeks old DUB mice were also not susceptible to i.p. challenge
with either KUNV or WNV. Furthermore, these mice survived i.p. WNV infection at a
high dose (2 x 10⁹ i.u.), suggesting that the effect of the Flv
r gene was dominant and
protective to young mice even in the absence of mature adaptive immunity.
The second aim of this study was to investigate the effect of modulation of the host
innate defence and adaptive immunity on flavivirus neuroinvasiveness in susceptible
HeJ and resistant DUB mice. The ability of flaviviruses to induce mortality in mice
following i.p. challenge depends on many host and viral factors including virus tropism
for peripheral tissues and its ability to cross the brain, as discussed previously. Some
physical alterations of the host such as breaching the BBB and immunosuppression
have been shown to result in the increased vulnerability of the host to viral challenge as
virus may have easier access to establish fatal infection (reviewed in Chambers and
Diamond, 2003; Kobiler et al, 1989; Lustig et al 1992; Saija et al, 1997). Thus, in this
part of the study, the correlation between increased BBB permeability by SDS and LPS,
absence and increased presence of peritoneal macrophages by clodronate and
thioglycollate, respectively, and transient loss of T cells with the severity of infection
and outcome of infection was examined.
SDS is a chemical that causes temporary and reversible breach of BBB (Saija et al,
1997). It has an amphiphilic property which enables this chemical to enter into
interactions with the major membrane components; lipids and proteins (Saija et al,
1997). Unfortunately, in the present work, there was insufficient time to optimise the
effect of SDS on the BBB in terms of the route of administration, (i.v. versus i.p.) and
the duration of the effect on the BBB. However, results obtained in this study following

CHAPTER 4
NEUROVERULENCE AND NEUROINVASIVENESS
114
administration of SDS two or three days after infection with WNV and KUNV showed
an increased incidence of fatal encephalitis in susceptible HeJ mice, as discussed below,
indicating that SDS has an effect on virus neuroinvasiveness.
Concurrent i.p. administration of virus and 240ng SDS did not enhance susceptibility of
adult HeJ mice to flaviviruses tested in this study (Table 4.4 and 4.5). However,
increased mortality rate and reduced ATD were observed when SDS was given two to
three days after i.p. MVEV and WNV infection in adult susceptible mice or i.p. KUNV
in young HeJ mice. Kobiler and co-workers (1989) used i.v. inoculation to deliver
WNV and this route ensured a high virus presence in the blood stream so that the
concurrent SDS treatment would allow virus to enter the brain. However, even when the
virus was delivered direct to the bloodstream, Kobiler and co-workers (1989) estimated
that only 0.1% of the original virus dose entered the brain. Thus, following flavivirus
challenge via i.p. route and concurrent SDS administration as performed in the current
study, it was very likely that less than 0.1% virus was available for entry into the brain
and therefore the amount of virus might have not been sufficient to induce morbidity in
susceptible mice. However, when SDS was inoculated two to three days post infection
to allow viraemia to reach the peak, higher mortality rates and shorter times to death
were observed in susceptible HeJ mice. Thus, the timing of SDS injection is crucial and
its effect on survival only becomes apparent when administration coincides with the
viraemic stage in infected mice.
The inability of SDS to promote a fatal disease in KUNV-infected adult HeJ mice
(Table 4.4) was most probably caused by the lack of tropism for peripheral tissues of
KUNV, as discussed previously, and thus the presence of a breached BBB had no effect
on the infection. However, the age-related susceptibility in peripheral tissues in KUNV-
infected young HeJ mice allowed greater level of virus replication that permitted viral
spread into the brain. The breach of BBB by SDS then resulted in early CNS invasion
of KUNV and therefore early manifestation of fatal encephalitis in young HeJ mice.
Macrophages have the ability to act early in the infection to destroy invading pathogens.
In addition, mouse peritoneal macrophages have also been shown to support flavivirus
growth in vivo and in vitro (Goodman and Koprowski, 1962a; Silvia, 1999), suggesting
a dual role of macrophages in flavivirus infection. In this study, both pathogenic and

CHAPTER 4
NEUROVERULENCE AND NEUROINVASIVENESS
115
protective roles of macrophages were shown to be dependent on the virus strain as well
as the genetic background of the mice.
Previous work performed in the laboratory demonstrated that thioglycollate given 3
days prior to virus infection increased susceptibility of HeJ mice to i.p. WNV challenge
(Pantelic, 2004). Similarly, we found that thioglycollate treatment increased the
incidence of fatal WNV infection from 60% to 100% as well as reducing the ATD in
susceptible HeJ mice (Table 4.7). This further confirms the possible role of
macrophages in harbouring and disseminating WNV in HeJ mice. Thioglycollate causes
sterile inflammation by attracting macrophages to the peritoneal cavity. Thus, at the
time of virus inoculation (3 days after thioglycollate treatment), permissive macrophage
cells were available at high numbers in the peritoneum and may have facilitated their
contact and infection with WNV. Increased infection of peritoneal macrophages
allowed rapid virus infection and multiplication, resulting in higher release of infectious
virus. In contrast, control mice infected i.p. with WNV only had about 10 times lower
numbers of cells in their peritoneum for virus infection. Indeed, thioglycollate treatment
was previously shown to increase and prolong viraemia in WNV-infected HeJ mice
compared to those that did not receive thioglycollate (Pantelic, 2004). The high and
prolonged viraemia following thioglycollate treatment may have promoted a release of
higher amounts of virus for possible invasion of the CNS and subsequently for the
increased incidence of fatal encephalitis in all HeJ mice.
In addition, it has also been suggested that treatment with thioglycollate impairs
immune responses. Since blood monocytes are known to take up an antigen and to
acquire the DC characteristics for antigen presentation to T cells in the lymph nodes
(Murali-Krishna et al, 1996, Mathur et al, 1983, Itano and Jenkins, 2003),
administration of thioglycollate causes the sequestration of monocytes and potentially
leads to impaired antigen presentation and modification of the host antiviral immune
response. Furthermore, thioglycollate down-regulates MHC class II cell surface
molecule expression on peritoneal cells (Adam and Hamilton, 1984), which may also
contribute to the increased susceptibility of thioglycollate treated mice to WNV
infection.
Interestingly, thioglycollate treatment did not induce fatal encephalitis in susceptible
HeJ mice i.p. infected with KUNV (Section 4.2.3.4.1.). Similarly, it has been

CHAPTER 4
NEUROVERULENCE AND NEUROINVASIVENESS
116
demonstrated earlier in this laboratory that thioglycollate-treated HeJ mice did not
display enhanced susceptibility to i.p. MVEV infection (Pantelic, 2004). The fact that
thioglycollate treatment only increases the incidence of fatal encephalitis of HeJ mice
during i.p. infection with WNV but not KUNV or MVEV indicates that macrophage
may only play an important role in the pathogenesis and dissemination of WNV in
susceptible HeJ mice. This is probably because WNV has higher tropism for
macrophages than KUNV and MVEV, as will be presented in Chapter 6.
Macrophages contribute to viral clearance by exerting phagocytic activity and
producing cytokines such as IL-1, TNFα and IL-6. Their importance in the host defence
against flavivirus infection has also been demonstrated by the work of Ben-Nathan and
co-workers (1996). Transient depletion of macrophages exacerbates the course of WNV
infection in mice. Mice showed prolonged viraemia and increased incidence of fatal
disease (Ben-Nathan et al, 1996). Similar results were attained in the study described
here. Transient macrophage depletion increased mortality from 60% to 100% and
reduced average survival time of HeJ mice following i.p. challenge with WNV,
although the significance of this result was not possible to estimate due to a small scale
study (Table 4.9). It has been argued that monocytes repopulate the bloodstream 24
hours post treatment, thus clodronate treatment in the current study resulted in the loss
of scavenger cells only at the early stage of infection and macrophages may have been
repopulated in WNV-infected HeJ mice few days after infection. Nevertheless, it was
demonstrated here that even this initial loss of macrophages was sufficient to impair the
host non-specific immunity. In this case, the importance of macrophages for the early
host antiviral immune response to WNV outweighed their involvement in providing
additional sites for extraneural replication of WNV.
It was reported previously that the host immune response works synergistically with the
flavivirus resistance gene for the prevention of fatal disease in resistant mice upon
flavivirus infection (reviewed in Brinton and Perelygin, 2003). This is because, the
flavivirus resistance gene, Flv, only reduces or slows virus replication, while functional
immune response is required to clear the infection (Brinton and Perelygin, 2003).
Several studies have shown that immunosuppression may abrogate the resistance
expressed by RV mice and consequently mice can become susceptible to flavivirus
infection (Camenga et al, 1974; Bhatt and Jacoby, 1976; Jacoby et al, 1980). For
instance, absence of T cells either by T cell depletion or treatment with anti thymocyte

CHAPTER 4
NEUROVERULENCE AND NEUROINVASIVENESS
117
serum rendered RV mice susceptible to i.p. infection with Banzi, causing a high
mortality of these mice (Bhatt and Jacoby, 1976; Jacoby et al, 1980). However, it was
demonstrated in the study here that a depletion of CD4+ T cells in young DUB mice or
both CD4+ and CD8+ T cells in adult DUB mice did not compromise the survival of
WNV infected-DUB resistant mice. The difference observed in this and other studies
can be attributed to the different viruses used. Although brain is the major target organ,
it is a probable that Banzi virus may have a higher tropism for peripheral organs than
WNV, enabling its better peripheral replication in the absence of functional T cells and
consequently facilitating its invasion of the CNS.
The lack of permissive cells and tissues in resistant DUB mice due to the possible
action of the Flvr-like gene was observed in peripheral tissues (Urosevic et al, 2000;
Pantelic et al, 2004; Chapter 5). Indeed, in vitro KUNV, MVEV and WNV infection of
macrophages isolated from resistant DUB mice resulted not only in lower titres but also
in earlier clearance of the viruses compared to cells derived from susceptible HeJ mice
(see Chapter 5). Thus, as shown for the first time in this study, breaching of the BBB,
attracting macrophages to peritoneal cavity by the thioglycollate treatment as well as
depleting macrophage and T cells had no consequence on the survival of resistant DUB
mice following i.p. inoculation of WNV. This suggests that the infectibility of
extraneural cells with this virus may have been compromised by the expression of the
resistance gene, Flvr-like, that prevented a high virus replication at the periphery.
In conclusion, the data presented in this study provide in vivo characterisation of three
closely related flaviviruses in susceptible HeJ and resistant DUB mice, further
confirming that the severity of flavivirus-induced diseases is the result of complex
relations between viral and host factors.. In this study, it was demonstrated that different
flaviviruses express different virulence characteristics in vivo. However, in is not
known whether these three flaviviruses would exhibit similar infectibility in vitro. In
addition, it remains to be confirmed whether macrophages contribute to the
pathogenesis of WNV only and not MVEV and KUV during i.p. inoculation in
susceptible HeJ, as demonstrated by the thioglycollate treatment studies. Thus,
infection of KUNV, MVEV and WNV in cells lines and primary cell cultures including
macrophages would enable studies on in vitro characterisation of these three closely
related flaviviruses as well as on the dual role of macrophages in certain flavivirus
infections, as described in the proceeding chapter.

CHAPTER 5
INFECTION IN CELL CULTURE
118
5.0 CHAPTER 5: CHARACTERISATION OF KUNV, MVEV AND
WNV INFECTIONS IN CELL CULTURE
5.1 INTRODUCTION
As described in the previous chapter, KUNV, MVEV and WNV, although are closely
related flaviviruses, vary greatly in their virulence in vivo. However, very little is
known about their growth characteristics in cell culture. Thus, this part of the study was
intended to characterise the in vitro infectibility of KUNV, MVEV and WNV in parallel
as well as to elucidate the possible role these cells may have in the pathogenesis of
flaviviruses as suggested in the preceding chapter.
A cell culture approach provides a useful model to study growth characteristics and
replication of different viruses in parallel in an isolated and controlled environment. The
first part of the study was aimed at studying the replication of KUNV, MVEV and
WNV in different cell types. The types of cells used were Vero cells, which are
established fibroblast cell line derived from the kidneys of green monkey, primary
peritoneal macrophages derived from susceptible HeJ and resistant DUB mice and
primary bone marrow-derived DCs isolated from susceptible C57BL/6 mice. In
addition to virus growth, pro-inflammatory cytokine production was also investigated in
thioglycollate elicited-macrophages during infection with KUNV, MVEV and WNV.
The pathogenesis and cellular basis of virulence of certain flaviviruses in vivo could be
due to the ability of macrophage to support replication of these flaviviruses. Thus, the
second aim of this study was to further explore the possibility that macrophages are
potential sites for harbouring WNV in the periphery, as suggested by the thioglycollate
experiment performed in the previous chapter (Chapter 4). To achieve this,
thioglycollate elicited-peritoneal cells were infected with WNV in vitro prior to their
administration back into the mice by the i.p. inoculation.

CHAPTER 5
INFECTION IN CELL CULTURE
119
5.2 RESULTS
5.2.1 VIRUS REPLICATION IN CELL CULTURE
In this study, parallel in vitro characterisation of WNV, KUNV and MVEV infection
was performed on Vero cells, primary mouse macrophages and primary murine DCs to
examine whether these cells exhibit similar permissiveness to these three viruses. Vero
cells were included in this study as a reference permissive cell line that was normally
used to propagate flaviviruses in the laboratory.
5.2.1.1 Determination of dose of infection
Infection analysis performed earlier in this laboratory (Lancaster et al, 1998) indicates
that roughly 60% of Vero cells are infected at the initial stage of MVEV infection which
then increased to 100% 1-2 days later. In contrast, no more than 10% and 5% of HeJ
and DUB macrophages, respectively, could get infected upon WNV in vitro infection
(Pantelic, 2004; Silvia, 1999). It was also shown that infection of MVEV at MOI 1 in
primary murine macrophages resulted in low virus replication (Silvia, 1999). Because of
these, MOI 10 (equivalent to 1 x 10⁷ i.u. or 10
6.2/100μL TCID50 units) was selected as a
standard dose of infection for the present study.
5.2.1.2 Virus replication in Vero cells
In the first part of this in vitro study, the infectibility of three flaviviruses, WNV,
KUNV and MVEV was investigated in Vero cells, which served as reference cells for
the virus infection. Vero cells were seeded in 6 well plates at 1 x 10⁶/well and incubated
for 6 hours to allow cell attachment prior to KUNV, MVEV and WNV infection at
MOI 10. To determine the levels of virus replication in culture supernatants collected
from all infected Vero cells at different time points p.i., TCID50 bioassay used.
Vero cells started to die 5 days after being infected and therefore collection of samples
was discontinued beyond this time point. As shown in Figure 5.1, of all three
flaviviruses used in this study, WNV replicated most efficiently in Vero cells, followed
by KUNV and MVEV. The replication of these three flaviviruses increased sharply
from day 1 p.i. and the highest titres were attained on day 2 p.i. However, WNV titres
CHAPTER 5
INFECTION IN CELL CULTURE
120
were a log higher (8.23 ± 0.1 log10 TCID50; significantly different, Student t test, p <
0.05) at this time point compared to KUNV (7.28 ± 0.6 log10 TCID50) and MVEV (7.34
± 0.2 log10 TCID50). Vero cells looked slightly unhealthy 3 days after infection,
particularly in cultures infected with WNV and KUNV. Coincident with the early
cytopathic effect, production of all 3 viruses started to decrease. Two days later, at day 5
p.i., cytopathic effect induced by the virus replication was apparent in cells infected
with the three viruses (Figure 5.4). At this time point (day 5 p.i.), WNV titres were still
the highest (Student t test, p < 0.01) when compared to the other two viruses despite the
replication of all three viruses was slightly reduced by then. The MVEV titres in Vero
cells were consistently the lowest from day 3 p.i. to day 5 p.i.
5.2.1.3 Virus replication in thioglycollate-elicited macrophages
Thioglycollate is a nutrient rich medium that acts as a sterile inflammatory agent when
injected into the peritoneum. Intraperitoneal injection with this compound results in the
migration and accumulation of blood monocytes to the peritoneal cavity. These cells,
which later differentiate at variable rates into macrophages, contribute to a great cellular
diversity in the peritoneum. Thioglycollate-elicited peritoneal cells comprise of
immature, mature and differently activated macrophages, recruited from both the
circulating and marginal tissue pools. Because of this, the cell exudates obtained
following thioglycollate treatment consist of heterogeneous cell populations (van Furth
et al, 1973). In contrast, the peritoneal cavity of un-stimulated mice consists of a more
homogenous population of mature resident macrophages. In addition, thioglycollate
treatment causes a 10-fold increase in cell numbers in the peritoneum, thus enabling
greater yields of isolated cells from the same number of mice when compared to the
non-treated animals (Silvia, 1999).
In order to prepare primary macrophage cultures, peritoneal macrophages were isolated
from susceptible HeJ and resistant DUB mice three days after administration of 1mL
6% thioglycollate. Following isolation, these cells were cultured in vitro in 6-well plates
at 1 x 10⁶ cells/well and they were kept under adherent conditions for 5 days prior to
infection, in order to allow removal of cytokines that may have been generated due to
thioglycollate treatment in vivo and which may cause a resistance to virus infection in
vitro (Pantelic, 2004).

CHAPTER 5
INFECTION IN CELL CULTURE
121
As shown in Figure 5.2A, the peak of KUNV, MVEV and WNV replication in primary
macrophages derived from susceptible HeJ mice was at day 2 p.i., similar to that
observed in Vero cells. Following this, titres of the three viruses in macrophage cultures
started to decline (Figure 5.2). However, titres of KUNV, MVEV and WNV were 2-3
logs lower compared to Vero cells and no virus-induced cytopathic effect was observed
when infected-macrophages were monitored for up to 15 days p.i. (Figure 5.5). WNV
was also demonstrated to be the most efficient virus to infect macrophages while in
contrast, MVEV showed the lowest replication in these cells. Two days after infection,
WNV titres in macrophages were found to be 6.2 ± 0.4 log10 TCID50. This was a log
higher than KUNV titres and 2 logs higher than MVEV production at the same time
point of infection. Virus replication then gradually decreased and interestingly, on day
15 p.i., WNV and KUNV still persisted at low levels in macrophages (2.02 ± 0.7 log10
TCID50 and 0.6 ± 0.1 log10 TCID50, respectively) while infectious MVEV was no longer
detectable at day 13 p.i.
Macrophages derived from resistant DUB mice are known to express the Flv resistance
gene (Pantelic, 2005). Although cells from resistant mice can be infected with
flaviviruses, the rate of infection is much lower than that observed in cells from
susceptible mice (Silvia 1999; Pantelic et al, 2005). In the current experiments,
thioglycollate-elicited macrophages isolated from flavivirus resistant DUB mice were
subjected to parallel infections with these three flaviviruses for the first time. In
agreement with the previous observations, it was demonstrated here that KUNV,
MVEV and WNV replicated 1-2 logs lower in DUB-derived macrophages than in HeJ-
derived macrophages (Figure 5.2). However, while KUNV showed slightly greater
replication than MVEV, WNV still produced the highest virus titres compared to these
two flaviviruses throughout the course of infection. On day 2 p.i., viral production was
4.3 ± 0.3 log10 TCID50, 3.5 ± 0.03 log10 TCID50 and 3.5 ± 0.2 log10 TCID50 for WNV,
KUNV and MVEV, respectively. The production of these viruses then steadily declined.
However, the rate of KUNV, MVEV and WNV decline in resistant macrophages was
much faster than from susceptible macrophages. In addition, similar to susceptible
macrophages, MVEV infection of DUB-derived macrophages showed the most rapid
rate of virus decline in comparison to KUNV and WNV infection. Both MVEV and
KUNV were no longer detectable on day 9 p.i. while WNV was cleared from resistant
macrophages by day 11 p.i.

CHAPTER 5
INFECTION IN CELL CULTURE
122
The findings in this study demonstrated the different ability of KUNV, MVEV and
WNV to replicate in primary murine macrophages. In vitro infection of HeJ or DUB-
derived macrophages showed that WNV and KUNV consistently have higher levels of
replication than MVEV, suggesting that these cells could potentially support in vivo
replication and consequently be involved in the pathogenesis of WNV and KUNV
during i.p. and i.c. infection, respectively.
5.2.1.4 Virus replication in primary mouse dendritic cells
Although infection of the CNS particularly the neurons is the ultimate target of
flavivirus infection and dictates the outcome of infection, DCs represent an early and
very important target cell type for some flaviviruses. In this part of study, parallel
infection of primary DC cell cultures derived from susceptible C57BL/6 mice with three
flaviviruses, KUNV, MVEV and WNV was studied. In the natural route of flavivirus
infection following mosquito bites, DCs in the skin can become infected and carry the
virus to the local lymph nodes for antigen presentation to T cells (King et al, 2003).
This suggests that, in addition to be involved in initiating and activating the host
immune response, DCs could also possibly contribute to the pathogenesis of
flaviviruses by spreading the virus to other organs. In the proceeding study (Chapter 7),
DCs were also found to accumulate in resistant mouse brains when analysed at 9 days
following i.c. challenge with KUNV and MVEV infection. The role of DCs either as
crucial APCs in the CNS or as immunopathogenic agents during the i.c. virus challenge
however remains controversial (McMahon et al, 2006). Thus, this study was performed
to investigate the permissiveness of DCs to KUNV, MVEV and WNV.
The DCs used in this study were derived from the bone marrow of C57BL/6 mice
(kindly provided by Ms Andrea Lee, from the laboratory of Dr MP Degli-Esposti).
These cells were characterised by their dual expression of CD11b+ and CD11c+ cell
surface markers. Previous studies in the laboratory have already shown that C57BL/6
mice were similarly susceptible to i.p. WNV infection and i.c. KUNV inoculation as
susceptible HeJ mice (Pantelic, 2004; Chapter 4).

CHAPTER 5
INFECTION IN CELL CULTURE
123
0
1
2
3
4
5
6
7
8
9
0 1 2 3 4 5Days post infection
Vir
al ti
tres (
log
10 T
CID
50/1
00u
L)
0
1
2
3
4
5
6
0 1 2 3 4 5 6 7 8 9 10 11Days post infection
Vir
us
titr
es (
log
10 T
CID
50/1
00
uL
)
WNV KUNV MVEV
Figure 5.1. Replication of WNV, KUNV and MVEV in Vero cells
Cells were plated in 6-well culture plates at 1 × 10⁶ cells/well. Cells were infected with
viruses at MOI 10 and cell culture supernatants were collected at different time post
infections. Six samples from 3 separate experiments were assayed at each time points
for viral titres by TCID50 bioassay. Data were shown as average values ± SE.

CHAPTER 5
INFECTION IN CELL CULTURE
124
A
0
1
2
3
4
5
6
7
8
9
0 2 4 6 8 10 12 14
Days post infection
Vir
us t
itre
s (
log
10 T
CID
50/1
00u
L)
B
0
1
2
3
4
5
6
0 2 4 6 8 10 12 14
Days post infection
Vir
us t
itre
s (
log
10 T
CID
50/1
00u
L)
0
1
2
3
4
5
6
0 1 2 3 4 5 6 7 8 9 10 11Days post infection
Vir
us
titr
es (
log
10 T
CID
50/1
00
uL
)
WNV KUNV MVEV
Figure 5.2. Replication of WNV, KUNV and MVEV in A) thioglycollate-elicited
macrophages from flavivirus susceptible HeJ mice and B) resistant DUB mice.

CHAPTER 5
INFECTION IN CELL CULTURE
125
Cells were plated in 6-well culture plates at 1 × 10⁶ cells/well. Macrophages were
incubated for 5 days before being infected with viruses at MOI 10 and cell culture
supernatants were collected at different time post infections. Vero cells were infected
with the same MOI. Six samples from 3 separate experiments were assayed at each time
points for viral titres by TCID50 bioassay. Data were shown as average values ± SE

CHAPTER 5
INFECTION IN CELL CULTURE
126
0
1
2
3
4
5
6
0 1 2 3 4 5 6 7 8 9 10 11
Days post infection
Vir
us
titr
es (
log
10 T
CID
50/1
00u
L)
0
1
2
3
4
5
6
0 1 2 3 4 5 6 7 8 9 10 11Days post infection
Vir
us
titr
es (
log
10 T
CID
50/1
00u
L)
WNV KUNV MVEV
Figure 5.3. Replication of WNV, KUNV and MVEV in C57/BL6 mouse bone
marrow derived dendritic cells.
Cells were plated in 6-well culture plates at 1 x 10⁶ cells/well. DCs were incubated for 5
days before being infected with viruses at MOI 10 and cell culture supernatants were
collected at different time post infections. Three to six samples from 3 separate
experiments were assayed at each time points for viral titres by TCID50 bioassay. Data
were shown as average values ± SE.

CHAPTER 5
INFECTION IN CELL CULTURE
127
A B
C D
Figure 5.4. Cytopathic effect of virus replication in Vero cells.
A) Non-infected Vero cells with normal morphology. Infection with B) WNV C)
KUNV and D) MVEV caused cytopathic effect in Vero cells 5 days after infection.

CHAPTER 5
INFECTION IN CELL CULTURE
128
A B
C D
Figure 5.5. Cytopathic effect of virus replication in macrophage cell cultures.
A) Non-infected macrophage cell cultures. Cell cultures were infected with B) WNV C)
KUNV and D) MVEV on day 15 p.i. The cell cultures were observed daily from day 2
until day 15 p.i. and no cytopathic effect was induced in macrophage cell cultures by
virus replication.

CHAPTER 5
INFECTION IN CELL CULTURE
129
As shown in Figure 5.3, the highest levels of infection of DCs were attained on days 2
and 3 p.i. In addition, WNV consistently replicated to the highest titres throughout the
infection course while KUNV had a lower level of replication than WNV but higher
than MVEV. However, levels of virus production in DCs were significantly lower than
observed in primary macrophages from susceptible HeJ mice at day 2 p.i. (Student t
test, p < 0.004, p < 0.04 and p < 0.004 for WNV, KUNV and MVEV, respectively).
MVEV virus replication sharply declined and by day 7 p.i., infectious virus was no
longer detectable by TCID50 bioassay in DCs from susceptible C57BL/6 mice. Thus,
MVEV was cleared much quicker from DCs derived from susceptible C57BL/6 mice
than from primary macrophages derived from resistant and susceptible mice. While
KUNV persisted at low levels in macrophages from susceptible HeJ mice for 15 days, it
declined much faster in DCs derived from C57BL/6 mice, by day 7 p.i. (Figure 5.3).
Furthermore, WNV was cleared from C57BL/6-derived DCs 4 days earlier than from
HeJ-derived macrophages.
Dendritic cells infected with KUNV, MVEV or WNV did not show any cytopathic
effect when monitored for 15 days after infection (data not shown), indicating a non-
cytopathic infection with flaviviruses, similar to that observed in susceptible
macrophages, although of more transient duration. Combined, these data suggest the
role of DCs in disseminating and establishing flavivirus replication early rather than late
in the infection.
5.2.2 CYTOKINE PRODUCTION IN PRIMARY MOUSE MACROPHAGES
Macrophages are known producers of an array of cytokines in response to various
stimuli. Since WNV, KUNV and MVEV replicated at different levels in macrophages,
it was of interest to study whether these flaviviruses would induce different levels of
cytokines. The production of IFN type I, IFN type II and TNFα were monitored in
infected-primary macrophages derived from susceptible HeJ mice over several days
after infection.
IFN type I was analysed in culture supernatants collected on days 1, 2, 3 and 5 p.i. from
infected macrophages using IFN type I bioassay. IFN type I production was below
detection level on day 1 p.i. after infection with all three viruses (Figure 5.6A). The
maximum production of this cytokine was seen on day 2 p.i. However, WNV induced

CHAPTER 5
INFECTION IN CELL CULTURE
130
the highest production of IFN type I (887.5 ± 72 I.U./mL, Student t test, p < 0.003)
compared with KUNV (312 ± 38 I.U./mL) and MVEV (153 ± 97 I.U./mL). At later time
points after infection (days 3 and 5 p.i.), IFN type I production decreased in all infected
macrophages, which directly correlated with the reduction in virus titres at similar time
points (Figure 5.2).
TNFα expression was measured by a commercial ELISA kit (eBioscience) on days 1, 2,
and 3 p.i. As illustrated in Figure 5.6B, TNFα was below detection level on day 1 p.i.
following infection with KUNV, MVEV and WNV. However, on day 2 p.i., TNFα
expression was induced in macrophages infected with WNV and KUNV with similar
levels of TNFα detected (20.4 ± 0.71 pg/mL and 19.67 ± 6.23 pg/mL, respectively),
while the production of TNFα in MVEV-infected macrophages was still undetectable at
this time point. On day 3 .p.i, WNV infection resulted in the highest level of TNFα
production (45.4 ± 2.4 pg/mL) while the expression of TNFα in KUNV-infected
macrophages remained unchanged (18 ± 3 pg/mL). Macrophages infected with MVEV
showed the induction and low production of TNFα on day 3 p.i. (12 ± 0 pg/mL).
IFNγ which is also known as IFN type II, has both antiviral and immunoregulatory
properties (Boehm et al, 1997). Similar to IFN type I, IFNγ production in infected
macrophages was not observed on day 1 p.i., while its production peaked on day 2
p.i. with 95.6 ± 0 pg/mL, 69.6 ± 13.44 pg/mL and 31.25 ± 0 pg/mL of IFNγ were
detected following infection with WNV, KUNV and MVEV, respectively. On the third
day post infection, IFNγ levels in WNV-infected macrophages drastically reduced to
20.9 ± 5.9 pg/mL (Student t test, p < 0.002). In KUNV-infected macrophages the
average levels of this cytokine dropped to 37.04 ± 9.2 pg/mL while infection of MVEV
resulted in only a slight IFNγ decrease (25.7 ± 38 pg/mL) on day 3 p.i.
Data obtained from these cytokine studies indicated that the production of IFN type I,
TNFα and IFNγ coincided mostly with virus titres. The importance of this finding will
be discussed later.

CHAPTER 5
INFECTION IN CELL CULTURE
131
A
0
200
400
600
800
1000
1 2 3 5
Days post infection
IFN
αβ
(IU
/mL
)
B
0
10
20
30
40
50
1 2 3Days post infection
TN
Fα
(p
g/m
L)
WNV KUNV MVEV
0
10
20
30
40
50
1 2 3Days post infection
TN
Fα
(p
g/m
L)
WNV KUNV MVEV
Figure 5.6. In vitro cytokine productions by HeJ isolated macrophages following
infection with WNV, KUNV and MVEV.

CHAPTER 5
INFECTION IN CELL CULTURE
132
C
0
20
40
60
80
100
120
1 2 3
Days post infection
IFN
γ (
pg
/mL
)
0
10
20
30
40
50
1 2 3Days post infection
TN
Fα
(p
g/m
L)
WNV KUNV MVEV
Thioglycollate-elicited macrophages derived from flavivirus susceptible C3H/HeJ mice
were plated in 6-well culture plates and incubated for 5 days prior to virus infection at
MOI 10. 3 samples of the culture supernatants were collected at different time post
infection and assayed for A) IFNαβ B) TNFα. and C) IFNγ. Presence of IFNαβ was
detected by bioassay while the other two cytokines were examined by ELISA. Three
samples were tested per time point for presence of cytokines. Data shown is average ±
SE.

CHAPTER 5
INFECTION IN CELL CULTURE
133
5.2.3 ADOPTIVE TRANSFER OF VIRUS-INFECTED MACROPHAGES IN MICE
Previous studies (Section 5.2.1) demonstrated that WNV could infect thioglycollate-
elicited macrophages isolated from both susceptible and resistant mice. Additionally,
although macrophages are important in the host non-specific defense, earlier work in
this laboratory (Chapter 4; Pantelic, 2004) indicated that macrophages may also be
involved in the dissemination of virus and the promotion of fatal encephalitis following
WNV infection in susceptible mice. Thioglycollate treatment which recruits
macrophages to the peritoneum increased HeJ susceptibility to i.p. challenge with WNV
(Pantelic, 2004). Thus, further investigation into the pathogenic role of macrophages in
disseminating and spreading virus in resistant mice was conducted. This was performed
by infecting thioglycollate-elicited macrophages in vitro and then transferring these
infected cells into mice. Only WNV was included in this study as this virus was shown
to have higher tropism for macrophages than to KUNV and MVEV.
Thioglycollate-elicited macrophages isolated from susceptible HeJ mice were cultured
under non-adherent conditions. Teflon pots were used for this purpose and the cells
were cultured at a density of 1x 10⁶ cells/mL. When analysed by flow cytometry, about
80-86% of cells showed macrophage morphology (based on the forward scatter and side
scatter analysis) and expressed CD11b+ cell surface markers (data not shown).
Following five days of incubation, macrophages were infected with WNV at MOI 10.
Two days after infection, macrophages cells were centrifuged and washed twice with
PBS to remove any free virus from the media and the cells were resuspended in PBS.
Following this, infected macrophages were injected into mice i.p. and the animals were
monitored for any signs of disease for up to 30 days. The number of macrophages
administered into a mouse was equivalent to the number of peritoneal cells isolated
from one mouse following thioglycollate treatment. As a control, a group of seven
susceptible mice were challenged i.p. with WNV at 2 x 10⁷ i.u./mouse only. As shown
in Table 7.1, four out of seven control HeJ mice infected i.p. with WNV developed fatal
encephalitis. The ATD of the sick mice was 9.5 ± 1.0 days. A negative control
comprising mice that received non-infected macrophages was also included. The control
animals did not develop any illness, indicating that macrophages themselves did not
have any toxic effect on mice. However, all susceptible HeJ mice (8/8) that were given
WNV-infected macrophages developed a fatal disease outcome and were culled.

CHAPTER 5
INFECTION IN CELL CULTURE
134
Table 5.1. Mortality studies following i.p. infection of mice with HeJ peritoneal
macrophages infected in vitro with WNV.
Mouse
strain
Macrophage
transfer
Virus
(WNV) Treatment
Mortality
(no. died/
no. tested)
ATDa
HeJ
(adult)
- + - 57 %
(4/7) 9.5 ± 1.0
+ - - 0 %
(0/5) -
+ + - 100 %
(8/8) 8.5 ± 1.0
DUB
(adult)
- + - 0 %
(0/15) -
+ + - 0 %
(0/10) -
+ + SDS
2 days p.i.
0 %
(0/5) -
DUB
(young) + + -
0 %
(0/5) -
aAverage time to death
Thioglycollate-elicited macrophages isolated from HeJ mice were cultured in non-
adherent status for 5 days. A proportion of macrophage cells were then left uninfected
while the remaining cells were infected with WNV at MOI 10. Two days later, the
infected macrophages were injected i.p. into the mice. Mice were monitored for 30 days
for any signs of diseases. Results were pooled from 2 separate experiments.

CHAPTER 5
INFECTION IN CELL CULTURE
135
Table 5.2. Mortality studies following i.p. infection of mice with DUB peritoneal
macrophages infected in vitro with WNV.
Mouse
strain
Macrophage
transfer
Virus
(WNV) Treatment
Mortality
(no. tested/
no. died)
ATDa
HeJ
- + - 66 %
(2/3) 9.0 ± 0.0
+ - - 80 %
(0/5) -
+ + - 66 %
(2/3) 8.0 ± 0.0
DUB
(3 weeks)
- + - 0 %
(0/5) -
+ + - 0 %
(0/5) -
+ + SDS
2 days p.i.
0 %
(0/5) -
aAverage time to death
Thioglycollate-elicited macrophages isolated from HeJ mice were cultured in non-
adherent status for 5 days. A proportion of macrophage cells were left uninfected while
the remaining cells were infected with WNV at MOI 10. Two days later, the infected
macrophages were injected i.p. into the mice. Mice were monitored for 30 days for any
signs of diseases.

CHAPTER 5
INFECTION IN CELL CULTURE
136
The animals exhibited typical signs of diseases including tremors, hind legs paralysis,
ruffled fur, hunched back and placid tail. Early signs of sickness were observed on days
6 and 7 p.i. and they became more apparent on day 8 p.i. when the majority of mice
were culled. This was in contrast to mice infected i.p. with WNV, where signs of fatal
illness were only observed from day 9 p.i. onwards (Student t test, p > 0.05). In vitro
and in vivo data obtained in this part of the study further supported our findings
presented in the preceding chapter (Chapter 4) on the damaging role of macrophages
during WNV infection. Collectively, it was shown here that macrophages were able to
support high replication of WNV and therefore most probably participated in WNV
dissemination to other peripheral organs and the brain in susceptible HeJ mice.
A similar experiment was also carried out in adult and young resistant DUB mice. As
shown in Table 5.1 and in Chapter 4, i.p. infection of WNV did not cause any mortality
in resistant mice. Similarly, adoptively transferred WNV-infected macrophages also did
not induce fatal encephalitis in adult or young resistant DUB mice. When SDS
(240ng/mouse) was administered into adult DUB mice 2 days after receiving infected
macrophages, mice remained healthy and did not become sick when monitored for 30
days.
The ability of DUB-derived macrophages to be infected with and propagate virus
further was also investigated in a separate small study (Table 7.2). When the WNV-
infected macrophages derived from resistant DUB mice were adoptively transferred to
susceptible HeJ mice, only 2 out of 3 mice succumbed to infection. The mortality rate
was similar to that exhibited by control mice directly infected with WNV although
susceptible HeJ mice receiving WNV-infected macrophages died a day earlier (8 days
p.i.) than the control mice. However, adoptive transfer of infected DUB-macrophages
did not induce death in young DUB mice even when SDS was given two days after the
cell transfer (Table 7.2).
The experiments described above showed that macrophages contributed to i.p. WNV
pathogenesis only in susceptible HeJ mice and not in resistant DUB mice following i.p.
challenge. At present, the inability of macrophage to disseminate flaviviruses to the
CNS of resistant DUB mice is not completely understood although it could be due to the
effect/action of the flavivirus resistance gene, Flvr-like.
CHAPTER 5
INFECTION IN CELL CULTURE
137
5.3 DISCUSSION
Macrophages are important components of the host innate defence mechanisms.
Production of proinflammatory cytokines, nitric oxide and phagocytosis are some of the
antimicrobial actions performed by macrophages to help clear microbial infection
(reviewed in Hendriks et al, 2005). However, macrophages have pleiotropic roles and
they have also been shown to be involved in the pathogenesis of flaviviruses.
Macrophages can serve as sites for flavivirus replication and they may also participate
in ADE of infection, mediated by Fc and complement receptors (Cardosa et al, 1986).
Both mechanisms indicate the pathogenic role of macrophages in flavivirus infection.
This current study was designed to a) study the growth characteristics of KUNV,
MVEV and WNV in Vero cells and two different primary murine cells and b) the role
of macrophages in disseminating flavivirus to the CNS in susceptible HeJ and resistant
DUB mice.
In this study, highly permissive Vero cells were shown to be susceptible to infection
with all three flaviviruses which induced severe CPE several days after infection
(Section 5.2.1.1). In contrast, flavivirus infections did not induce CPE in macrophage or
DCs, similar to observations reported by others (Silvia et al, 2004; Shirato et al, 2006;
Rios et al, 2006). A significant finding of the study is that, of the three flaviviruses
analysed, WNV has the greatest levels of replication for all the cell models studied here.
The higher infectibility of WNV in macrophages particularly those derived from HeJ
mice suggests that these cells could be important for harbouring and dissemination of
WNV in vivo. The macrophage contribution to the severity of WNV infection in HeJ
mice was further confirmed by adoptive transfer of WNV-infected macrophages (to be
discussed later). However, the molecular basis of the ability of WNV to replicate at
higher rates in cell culture than KUNV or MVEV is yet to be elucidated. These three
flaviviruses may carry a number of different virulent determinants that could be
responsible for the variable infection rate observed in vitro as well as different outcomes
of in vivo infection.
The poor infectibility of primary macrophages and DCs with MVEV is interesting
(Figure 5.2 and 5.3). The low replication rate of MVEV in primary cells was observed
despite the same numbers of infectious units of KUNV, MVEV and WNV used for cell
culture infection (1 x 10⁷ i.u. of viruses) and despite the high neuroinvasiveness and

CHAPTER 5
INFECTION IN CELL CULTURE
138
neurovirulence of MVEV in HeJ mice as presented in the preceding chapters (Chapter
4). In contrast to the in vitro findings, i.p. infection with KUNV did not induce any
morbidity in adult susceptible HeJ mice while high death rate in the same mouse strain
was recorded following i.p. challenge with MVEV. Additionally, following i.c.
challenge, a lower amount of MVEV was required to kill 50% of HeJ mice compared to
KUNV. Thus, the finding in this current chapter is intriguing and may indicate that the
mechanisms of MVEV pathogenesis are different from KUNV and may not involve
macrophages and/or DCs.
Macrophages isolated from resistant DUB mice could be infected with flaviviruses as
the genetically determined resistance against flaviviruses does not operate at the level of
virus attachment or entry. Inborn resistance to flaviviruses is reported to function
intracellularly by reducing virus titres and limiting the virus spread (Urosevic and
Shellam, 2002; Brinton, 2001). Because of this, comparable numbers of cells were
shown to be infected in mouse embryo fibroblast (MEF) cultures derived from
susceptible and resistant cultures following challenge with WNV (Brinton et al, 1974).
However, although the titres produced in resistant macrophages usually are lower than
in susceptible macrophages, the difference in titre is usually not as high as observed in
the brain (Silvia et al, 2001; Brinton and Perelygin, 2003). In agreement with this,
KUNV, MVEV and WNV replicated at reduced levels in resistant macrophages cells,
but only 1-2 logs lower compared to susceptible macrophages (Figure 7.1). This is in
contrast to the 3-4 logs brain titre difference observed in susceptible HeJ and resistant
DUB mice during i.c. KUNV and MVEV infection (see Chapter 6). In this project,
2 x 10⁷ i.u. of virus (equals to 10
6.2/100μL TCID50 units) were used for in vitro
infection. However, equal or smaller virus doses were used for the i.c. inoculation in
mice (1.74 x 10⁵ i.u. KUNV and 3.4 x 10
3 i.u. MVEV) which corresponded to
106.7
/100μL TCID50 units and 105/100μL TCID50 units, respectively (see Chapter 6).
Thus, the discrepancy in the initial viral dose in vitro and in vivo is not the cause of the
difference in the extent of resistance/susceptibility observed between in vivo and in vitro
models. In fact, the disparity between these two models of infection can be attributed to
the inability of macrophages derived from susceptible HeJ mice (in vitro) to support as
high levels of flavivirus replication as observed in the brains (in vivo) of susceptible HeJ
mice. So, it appears that the flavivirus replication in primary macrophages is limited to a
single virus life cycle, preventing amplifying step of virus replication as observed in the

CHAPTER 5
INFECTION IN CELL CULTURE
139
brains in vivo and thus keeping the difference in virus titres between susceptible and
resistant macrophages at minimum.
Following natural infection of flaviviruses by mosquito bites, skin DCs are thought to
be the primary cell type to be infected by the virus. In addition, infected DCs transport
the virus to the local draining lymph nodes where the virus is presented to T and B cells
(reviewed in Chambers and Diamond, 2003; Johnston et al, 2000). Using bone-marrow
derived DCs isolated from susceptible C57BL/6 mice, it was demonstrated here that
similar to Vero cells and macrophages, DCs were permissive to KUNV, MVEV and
WNV. Nevertheless, the peritoneal macrophages supported better flavivirus replication
than the bone marrow derived DCs (Figure 5.3). This suggests that the bone-marrow
derived DCs are not the best model for flavivirus infection.
Macrophages can produce an array of cytokines following microbial infection or any
other stimuli. The levels of cytokines; IFNαβ, IFNγ and TNFα in the cell culture
supernatants from infected cells were below detection level on day 1 p.i. (Figure 5.6).
This could due to a lag period where the signalling and activation of cytokine genes
took place. In general, secretion of these cytokines was positively correlated with virus
production. The direct correlation between IFN type I and TNFα and virus titres were
also observed during in vivo i.c. infection of mice with KUNV and MVEV (Chapter 6).
Although both cytokines are known to have direct antiviral properties, the importance
for KUNV, MVE and WNV clearance observed here remains to be investigated. The
use of neutralising antibodies to IFN type I and TNFα, may help to shed more light on
the involvement of these cytokines. Secretion of other cytokines by macrophages such
as IL-1 and IL-6 and their role also remains to be elucidated as well.
Blood-borne macrophages have been implicated in the pathogenesis of Theiler’s murine
encephalitis virus and EAE (Bauer et al, 1995; Brosnan et al, 1981; Rossi et al, 1997).
In Theiler’s virus infection, persistent infection in macrophages has been reported and
depletion of blood-borne macrophages almost completely eliminated viral RNA and
antigen in the CNS (Rossi et al, 1997). The permissiveness of HeJ macrophages to
WNV as well as the ability of the virus to persist in the cells for about 2 weeks suggests
that macrophages also may be involved in the dissemination and pathogenesis of WNV.
Adoptive transfer of in vitro infected thioglycollate-elicited macrophages further
confirmed this theory, as evidenced by the higher mortality exhibited in susceptible HeJ

CHAPTER 5
INFECTION IN CELL CULTURE
140
mice compared to control mice. One hypothesis is that upon transfer of highly infected
HeJ macrophages to the peritoneum of susceptible mice, high titres of infectious virus
would be released in the peritoneal cavity. This would increase the chances of other
susceptible peripheral cells or tissues to be infected. As a consequence, WNV may
replicate at high titres and induce viraemia, enabling this virus to invade the CNS. In
addition, it was shown that WNV infection in macrophages was accompanied by high
levels of TNFα production (Figure 5.6). The toll-like receptor (TLR) 3 dependent
inflammatory responses, particularly TNFα, has been reported to be involved in the
breakdown of the BBB, and subsequently facilitating WNV invasion into the brain
(Wang et al, 2004a). Thus, the production of TNFα by WNV-infected adoptively
transferred macrophages as well as by other peripherally infected cells/tissues would
exacerbate the disease by increasing the permeability of the BBB, enabling the invasion
of infected macrophages into the CNS. Thus, studies shown here further confirmed the
findings of Pantelic (2004) that macrophages may act as ‘Trojan Horses’ to disseminate
flavivirus to the brain.
The increased severity of disease and fatal infection upon adoptive transfer of WNV-
infected HeJ macrophages was only demonstrable in susceptible HeJ mice but not in
adult and young resistant DUB mice. It is possible that although adoptive transfer of
WNV-infected HeJ macrophages in DUB mice may release infectious WNV, the
constitutive expression of the flavivirus resistance gene in extraneural tissues and cells
prevent further replication of WNV in other organs/cells of DUB mice. Consequently,
WNV invasion to the CNS may not occur, resulting in a complete survival of DUB
mice.
In conclusion, findings from this chapter indicated that KUNV, MVEV and WNV could
infect peritoneal macrophages in vitro but replication rate of these viruses was
significantly different. Interestingly, replication levels of these three flaviviruses did not
correlate with their neuroinvasive traits (Chapter 4), suggesting that different pathogenic
mechanisms may be involved following infection with each particular flavivirus tested
in this study. In addition to their protective role, macrophages could also contribute to
the poor outcome of flavivirus infections, although the latter role is greatly regulated by
both virus and host factors. Data in this study further support the previous studies
described in Chapter 4 as well those previously performed in this laboratory (Pantelic,
2004) regarding the possible role played by macrophages in WNV pathogenesis in

CHAPTER 5
INFECTION IN CELL CULTURE
141
susceptible HeJ following i.p. challenge. While macrophages may not play a crucial role
in dissemination of KUNV following i.p. challenge, they may still have an important
role in the pathogenesis of i.c. infection of KUNV.

CHAPTER 6
KUNV AND MVEV INTRACEREBRAL INFECTION
142
6.0 CHAPTER 6: ROLE OF VIRAL REPLICATION AND
IMMUNOPATHOLOGY IN DISEASE DEVELOPMENT
FOLLOWING KUNV AND MVEV INTRACEREBRAL
INFECTION
6.1 INTRODUCTION
Laboratory mice provide a suitable small animal model to study flavivirus-induced
encephalitis since they develop similar disease to that observed in humans (reviewed in
Chambers and Diamond, 2003). The recent emergence/reemergence of WNV in several
continents is alarming due to the high incidence of infection and fatal outcome in
humans (Gould and Fikrig, 2004; Gubler, 2002). It is important to understand the
pathogenesis of flavivirus infections and factors that are associated with the fatal disease
outcome since this will allow development of effective antiviral therapies or vaccines.
Host factors including genetic background, age and immune status determine the level
of host resistance to the infection. However, viral factors such as the virus type, dose
and route of infection also modulate the host response and outcome of infection.
Determination of the role for each of these factors is possible only under controlled
experimental conditions (Sabin, 1954).
A model of genetically resistant mice has been created to study the phenomenon of host
genetic resistance to flaviviruses. Although the inborn resistance conferred by Flv
usually protects mice from developing lethal encephalitis by restricting and reducing
viral production in infected cells and organs, flavivirus resistance mice can still be
infected by flaviviruses (reviewed in Urosevic and Shellam, 2002). This resistance is
sometimes incomplete and flavivirus resistant mice may occasionally succumb to i.c.
infection with certain flaviviruses. It was shown in the previous chapter (Chapter 4) that
while MVEV was the most neurovirulent virus in susceptible HeJ mice compared with
KUNV and WNV, the i.c. challenge with this virus in resistant DUB mice did not
induce any apparent disease or morbidity. In contrast, the i.c. infections with KUNV
and WNV caused relatively high mortalities not only in susceptible mice, but also in
resistant mice. This indicates that, in addition to the genetically host resistant trait, viral
factors may also control the severity of disease in flavivirus resistant mice.

CHAPTER 6
KUNV AND MVEV INTRACEREBRAL INFECTION
143
The development of lethal disease in flavivirus resistant mice during infection with
certain flaviviruses including KUNV could either be due to the inadequate ability of the
resistance gene (Flv) to restrict virus replication or because of inappropriate response of
the host immune system. Based on findings by other investigators (Sabin, 1952a;
reviewed in Brinton and Perelygin, 2003) and in the previous chapter, we hypothesised
that death in flavivirus resistant DUB mice following KUNV infection was not due to
the ability of KUNV to abrogate the effect of the flavivirus resistance gene, but rather
was caused by an excessive host immune response. In contrast, deaths observed in
susceptible HeJ mice may be associated with several factors including high brain viral
titres and immunopathological diseases. To test this hypothesis, the viral burden in the
brains was examined in both HeJ and DUB mice following i.c. infection with KUNV
and MVEV. Additionally, histopathological analysis of mouse brains following similar
i.c. challenge was conducted to investigate the severity of brain inflammation. Viral
infections in the CNS may induce apoptosis of infected cells and activate brain
microglia/macrophages to produce an array of cytokines. Although the phenomenon of
incomplete protection in flavivirus resistant mice against flaviviruses has been observed
for many years (Sabin 1952a, 1952b), it is not understood yet what pathological events
are associated with the fatal outcome of some flavivirus infections in resistant mice. To
date, no study has been performed to identify factors or mechanisms that determine a
poor outcome of infection with some flaviviruses in resistant mice. Thus, using KUNV,
which kills resistant mice and MVEV, which does not cause any apparent disease in the
same mouse strain, studies aimed at further elucidation of the cause of death or recovery
following i.c. infection with these viruses, particularly in flavivirus resistant DUB mice
were designed and conducted as described in this chapter.

CHAPTER 6
KUNV AND MVEV INTRACEREBRAL INFECTION
144
6.2 RESULTS
6.2.1 BRAIN VIRUS TITRES FOLLOWING INTRACEREBRAL INFECTION
6.2.1.2 Analysis of viral titres in mouse brain following KUNV and MVEV infection
Several host and viral factors are involved in shaping the severity of disease following
virus infection. One of these factors is the ability of virus to replicate at high titres in
infected cells. High levels of virus production could disturb the normal function of
target cells, without necessarily causing cell death. Consequently, an infected host may
die, particularly if vital and post-mitotic cells such as neurons are involved.
Development of lethal encephalitis in susceptible mice during flavivirus infections
following the i.c. route of virus inoculation has been reported to be associated with high
viral titres in the brain (Sabin, 1954; Urosevic et al, 1999; Brinton 2001). In contrast,
following i.c. challenge with some flaviviruses which do not induce morbidity in
resistant mice, the peak brain virus titres are usually significantly lower than that
observed in susceptible mice and these viruses are cleared from the brains of resistant
mice (Urosevic et al, 1999). The kinetics of KUNV growth in susceptible and resistant
mice however is not known. Thus, this study was initiated to look at the levels of virus
replication in the brain, especially in flavivirus resistant mice, and the effect of this
replication on mortality or survival of mice following i.c. challenge with KUNV and
MVEV. This would also help to provide further information on whether KUNV could
abrogate the expression of the Flvr-like gene in resistant DUB mice, leading to a high
production of the virus in the brain.
In this study, a viral dose equivalent to 100LD50 as determined in susceptible HeJ mice,
was used as a standard dose for i.c. infection in this study. This dose would kill 100%
susceptible HeJ mice following i.c. infection with either KUNV or MVEV. Since
KUNV and MVEV showed different virulence traits in susceptible HeJ mice, the
calculated 100LD50 doses corresponded to 1.74 x 10⁵ i.u. (10
-1.5 stock virus dilution) of
KUNV and 3.4 x 10³
i.u. (10-2.6
stock virus dilution) of MVEV (Table 6.1). Although
the same in vivo lethal doses of KUNV and MVEV comprised of different amounts of
viral infectious units, as determined by the standard virus titration assay in Vero cells, it

CHAPTER 6
KUNV AND MVEV INTRACEREBRAL INFECTION
145
was found here that LD50 doses are more appropriate for the in vivo virulence studies
than the viral infectious units. The equal amount of infectious virus of two different
flaviviruses might induce similar effect on the same cell culture types in vitro but may
possibly generate different results in vivo. Since the objective of this study was to
understand the different pathogenic mechanisms involved during i.c. infection with
KUNV and MVEV, particularly in resistant DUB mice, the same 100LD50 that would
cause similar mortality rate in susceptible HeJ mice was used.
Table 6.1. The KUNV and MVEV doses used for intracerebral infection in mice
Virus
100LD50
Stock virus
dilution
Infectious
units (i.u.)
Titres in Vero cells
(TCID50 units/5uL)
KUNV 10-1.5
1.74 x 10⁵ 10
5.4
MVEV 10-2.6
3.4 x 10³ 10
3.7
100LD50 as determined in susceptible mice was used for i.c. challenge in mice. Data in
the table show the dose expressed as stock dilution, infectious units and TCID50 values
To monitor KUNV and MVEV replication in infected mouse brains, two groups of
flavivirus resistant DUB mice aged between 8-10 weeks were infected i.c. with either
KUNV or MVEV. In parallel, two groups of age-matched susceptible HeJ mice were
also infected with the same viruses and acted as positive controls. Following infection,
brains from three susceptible HeJ mice were harvested separately each day from day 3
p.i. until mice developed fatal disease (day 5 and 6 p.i. for KUNV and MVEV infection,
respectively) and the level of infectious virus in brain homogenates was determined by a
TCID50 bioassay. The kinetics of brain viral replication in resistant DUB mice were

CHAPTER 6
KUNV AND MVEV INTRACEREBRAL INFECTION
146
monitored from day 3 to day 9 p.i. since KUNV-infected resistant DUB mice on
average, succumbed to the infection 9 days after virus challenge (Chapter 4).
As illustrated in Figure 6.1, virus titres in the brains of susceptible mice were quite high
on day 3 p.i. with both viruses. However, MVEV replicated more than a log higher (7.8
± 0.5 log10 TCID50) than KUNV (6.1 ± 0.4 log10 TCID50) in susceptible HeJ mice.
Replication of both viruses increased over time and mice started to show signs of
disease from day 4 p.i onwards. MVEV reached its highest titres (10.0 ± 0.5 log10
TCID50) in the brains of HeJ mice on day 6 p.i. when mice showed typical signs of
severe disease including tremor, hunched back, ruffled fur, placid tail, substantial
weight loss and they had to be euthanised. In contrast, the peak of KUNV replication
was on day 4 p.i. (7.4 ± 0.5 log10 TCID50) and it reached a plateau until mice became
very sick on day 5 p.i. Although the difference in viral titres found in the brains of HeJ
mice 5 days after MVEV and KUNV infection was significant (Student t test, p < 0.05),
these results indicated that high viral production was associated with the deaths seen in
both KUNV and MVEV-infected susceptible HeJ mice.
In flavivirus resistant DUB mice, the Flvr-like gene acts to reduce viral replication early
in the infection (Urosevic and Shellam, 2002). In support of this, KUNV and MVEV
replicated at significantly lower levels, 3-4 logs lower in the brains of resistant DUB
mice than in the brains of susceptible HeJ mice throughout the course of infection, when
monitored from day 3 to day 9 p.i. (Figure 6.1). Both KUNV and MVEV reached their
peak of replication in the brains of DUB mice on day 5 p.i. Similar to that observed in
susceptible HeJ mice, MVEV titres (5.3 ± 0.5 log10 TCID50) were also higher than
KUNV (4.7 ± 0.1 log10 TCID50) in the brains of resistant DUB mice. After day 5 p.i, the
replication of both viruses declined. Interestingly, while production of infectious MVEV
rapidly decreased and was undetectable by TCID50 bioassay 9 days after infection,
KUNV titres declined at a slower rate and virus was still present in the brains of most of
the infected resistant DUB mice, although at a very low titres (Figure 6.1). The
difference in the rate of virus replication between MVEV and KUNV was significant
on day 8 p.i. (Student t test, p < 0.05). In eight resistant DUB mice that succumbed to
KUNV infection, only one mouse had undetectable virus in the brain while the
remaining seven animals had brain viral tires between 0.5 log10 TCID50/100μL to 3.6
log10 TCID50/100μL.

CHAPTER 6
KUNV AND MVEV INTRACEREBRAL INFECTION
147
It may be concluded from this study that susceptible HeJ mice suffered fatal
encephalitis following i.c. challenge with KUNV and MVEV as they were unable to
limit brain virus production and spread, which may have caused improper functioning
and damage to infected neurons. Despite incomplete clearance of the virus in the brains
of KUNV-infected resistant DUB mice at the time of death, this study demonstrated that
Flvr-like phenotype was not abrogated and virus production was significantly restricted
in moribund resistant DUB mice in comparison to sick susceptible HeJ mice following
KUNV infection.
6.2.1.2 Analysis of viral titres in peripheral organs following KUNV and MVEV
infection
Since abundant virus replication was not observed in the brains of resistant DUB mice
succumbing to KUNV infection as shown in the previous section, a possibility still
existed that these mice succumbed to profound extraneural virus replication. When virus
is inoculated i.c., it is believed that a proportion of virus leaks to the periphery and it
may infect the peripheral organs. In order to clarify the possibility of profound virus
replication in peripheral organs as a possible cause of death, the presence of infectious
virus was tested by TCID50 bioassay in the spleen, liver and kidney of HeJ mice at the
time of death following KUNV and MVEV i.c. challenge. As shown in Table 6.1, no
infectious virus was found in the kidneys of mice infected with either virus. However,
some spleens and livers from KUNV and MVEV-infected HeJ mice had low amounts of
infectious virus. Similar analysis was also performed in the spleen, liver, kidney,
adrenal gland and pancreas tissue harvested from infected resistant DUB mice on 3, 5, 7
and 9 days p.i. However, no infectious virus was detected in any of the organs tested
(data not shown).

CHAPTER 6
KUNV AND MVEV INTRACEREBRAL INFECTION
148
0
2
4
6
8
10
12
3 4 5 6 7 8 9
Days post infection
Bra
in v
iral
titr
es (
Lo
g10T
CID
50/0
.01g
)
MVEV-HeJ MVEV-DUB
KUNV-HeJ KUNV-DUB
*
*
Figure 6.1. Kinetics of viral replication in mouse brains infected with KUNV and
MVEV.
Separate brain homogenates from three to five mice (except for DUB infected with
KUNV and MVEV at day 9 p.i where six to eight mice were used) were analysed
independently to determine viral titres for each time points. The assays sensitivity limit
is 1 log10 TCID50/0.01g. *Significant difference in the average brain virus titres during
KUNV versus MVEV infection were observed on day 5 p.i. and day 8 p.i. in HeJ and
DUB mice, respectively (Student t test, p < 0.05). Brain titres in KUNV-infected mice
on day 9 p.i. and MVEV-infected mice on day 8 p.i. were arbitrary values.
The threshold for this assay is 2.0 log10 TCID50 units for accurate detection of virus
titres, which corresponds to 0.7 × 10² i.u./100μL. As virus was also detectable below the
threshold, these values were expressed by arbitrary values a) 1.0 log10 TCID50 units for
virus titres detected between 0.74 × 10² and 0.35 × 10
2 i.u. b) 0.5 log10 TCID50 units for
virus titres detected between 0.35 × 10² and 0.10 × 10
2 i.u. The virus was not detectable
below 0.10 × 10² i.u./100μL by this assay.

CHAPTER 6
KUNV AND MVEV INTRACEREBRAL INFECTION
149
6.2.2 BRAIN HISTOPATHOLOGICAL AND INFLAMMATION ANALYSIS
6.2.2.1 Brain architecture and inflammation in KUNV and MVEV infection
The study described above indicated that the death of susceptible mice was associated
with high viral titres following i.c. KUNV and MVEV infection. In contrast, resistant
DUB mice that succumbed to i.c. KUNV had low brain viral titres. Substantial evidence
is available indicating that the flavivirus-infected susceptible host may also die due to
an excessive immune response causing tissue damage, in addition to a direct virus-
induced cytopathic effect on the cells (Wang et al, 2003b; reviewed in Chambers and
Diamond, 2003). In order to address the possibility that other factors besides high brain
viral burden may contribute to the death of infected HeJ mice, the extent of brain
inflammation and tissue damage, as well as microglia/macrophages accumulation and
activation in infected susceptible HeJ mice following KUNV or MVEV i.c. challenge
were monitored. Similar histopathological analysis was also performed in infected
resistant DUB mice. This would determine the role of host immune response during
KUNV and MVEV i.c. challenge in resistant DUB mice and test the current hypothesis
that lethal infection observed in KUNV-infected DUB mice was due to excessive brain
inflammation.
6.2.2.2 Brain tissue architecture and leucocytic infiltration in the brains of infected mice
In order to study differences in the brain tissue architecture as well as the accumulation
of immune cells in the brains of mice infected with different flaviviruses, brains from
infected HeJ and DUB mice were harvested at selected time points after infection (at
least 3 brains per time point) and paraffin-embedded brain tissue sections were
prepared. To allow histopathological analysis, brain tissue sections were stained with
haematoxylin and eosin (HE). In susceptible HeJ mice, pathological changes in the
infected brains were examined at day 3 p.i. and at the time of death; day 5 p.i. for
KUNV and day 6 p.i. for MVEV. In resistant mice, similar analysis was performed in
the brains harvested at days 3, 5 and 9 p.i. after KUNV and MVEV i.c. challenge. The
brains from three uninfected HeJ mice were also included in this study as negative
controls.

CHAPTER 6
KUNV AND MVEV INTRACEREBRAL INFECTION
150
Table 6.2 Analysis of viral titres in peripheral organs of KUNV or MVEV-infected
HeJ mice at the time of death.
Virus Virus titres ( log10 TCID50/0.01g)a
Spleen Liver kidney
KUNV
0.5
0
0
0
2.5
2.4
0
0
0
MVEV
0
0
2.0
0
0.5
0
0
0
0
aEach spleen and kidney sample represents a pool of 3 mice per sample. Virus titres
obtained from livers were analysed independently (1 liver per mouse per sample).

CHAPTER 6
KUNV AND MVEV INTRACEREBRAL INFECTION
151
Uninfected control mice showed neither abnormalities in the neuron integrity nor
abnormal immune cells infiltration (Figure 6.2.). Three days after infection with both
viruses, a mild brain inflammation was observed in HeJ mice (data not shown).
However, at the time when HeJ mice succumbed to i.c. KUNV or MVEV infection,
classical evidence of acute encephalitis characterised by perivascular lymphocytic
infiltration, perivascular cuffing, parenchymal infiltration and severe vascular
congestion was observed in the brain tissue sections (Figure 6.3.A, B, C and D.).
Mononuclear cells were the predominant immune cells observed in these mice (Prof. J.
Papadimitriou, pers. comm.). Dilated blood vessels and capillaries with leucocytes
accumulated around them could be seen in different regions throughout the brain.
Additionally, oedema was also observed in some parts of the brain including the
thalamus and meninges. Interestingly, cytoplasmic rarefaction with rounding of
neurons was a prominent feature in the thalamus of HeJ mice following KUNV but not
MVEV infection (Figure 6.3.B). It is not known whether the neuronal dysfunction in the
thalamus contributed to the early death of KUNV-infected HeJ mice. However, despite
the high viral load that was associated with the death of susceptible HeJ mice, only a
small number of neurons showed characteristics of apoptotic or necrotic deaths. While
physical damage to the neurons was not the major feature of late infection, death of
susceptible mice could be attributed to a) a high virus replication in the neurons and b)
extensive brain tissue inflammation, both of which may have affected the normal
functioning of the brain cells. Interestingly, while both KUNV and MVEV induced
severe tissue inflammation in the brains of infected susceptible mice, the severity of the
inflammatory response appeared more pronounced in mouse brains infected with
MVEV than KUNV (Figure 6.3, Table 6.2).
A very mild brain inflammatory response was observed on day 3 p.i. in resistant DUB
mice following i.c. infection with both KUNV and MVEV (data not shown). However,
on day 5 p.i., the brain inflammation in the brains of resistant DUB mice was
mild/medium compared to that seen in the brains of dying susceptible HeJ mice on days
5 or 6 p.i. (Figure 6.4). Fewer dilated blood vessels and leucocytic infiltration were
observed in resistant mice than in susceptible mice at this time point. This coincided
with the low virus titres as shown in Figure 6.1. The extent of brain inflammation then
increased on day 9 p.i. with both virus infections, as more recruitment and extravasation
of immunoinflammatory cells in the parenchyma and meninges were detected (Figure
6.5, Table 6.2). Similar to that demonstrated for susceptible HeJ mice, analysis on

CHAPTER 6
KUNV AND MVEV INTRACEREBRAL INFECTION
152
brains sections taken from infected resistant DUB mice (3-5 mice per virus) suggested
that MVEV also induced a slightly stronger tissue inflammation than KUNV in resistant
DUB mice. This finding was quite intriguing since MVEV did not induce any disease in
resistant DUB mice despite the slightly stronger brain tissues inflammation and greater
virus replication. The difference in the extent of brain tissue inflammation between
KUNV and MVEV in resistant DUB mice was more apparent on day 9 p.i (Figure 6.5).
From this study, it was shown that the extent of brain inflammation was associated with
virus titres but interestingly, not necessarily with the morbidity in mice. MVEV
replicated to higher titres in the mouse brains than KUNV and therefore possibly
induced stronger immune response. It may be concluded that the death of susceptible
HeJ mice infected with either KUNV or MVEV following i.c. challenge was associated
with an excessive host immune response, in addition to the uncontrolled virus growth as
discussed in Section 6.2.1. In contrast, stronger immune response was linked to MVEV
clearance and recovery of infected resistant DUB mice. Thus, this finding rejects the
hypothesis that overly stimulated host immune response (in general, without focusing
on specific inflammatory cells) was the cause of death of KUNV-infected DUB mice.

CHAPTER 6
KUNV AND MVEV INTRACEREBRAL INFECTION
153
Figure 6.2. Brain tissue section from uninfected mouse.
Uninfected HeJ mice showed normal and healthy neurons with no abnormalities in the
meninges and brain parenchyma, indicated by the absence of haemorrhage and lack of
immune cells infiltration. Picture shown above is representative of a number of tissue
sections obtained from 3 healthy mice. Magnification x200.

CHAPTER 6
KUNV AND MVEV INTRACEREBRAL INFECTION
154
A
B
C
D
Figure 6.3. Brain tissue inflammation in susceptible HeJ mice infected with KUNV
(A and B) or MVEV (C and D) at the time of death.
Mouse brains were harvested from sick HeJ mice on day 5 and day 6 p.i. following
KUNV and MVEV infection, respectively (time of death after challenge with each
virus). Figures shown above are sagittal brain tissue sections stained with haematoxylin
and eosin. A small arrow indicates dilated blood vessels and leucocytic infiltration. A
large arrow indicates meningeal leucocytic infiltration while an arrow without tail
shows swollen neurons. Magnification x200.

CHAPTER 6
KUNV AND MVEV INTRACEREBRAL INFECTION
155
A
B
C
D
Figure 6.4. Brain tissue inflammation on day 5 p.i. in DUB mice infected with
KUNV (A and B) or MVEV (C and D).
Figures shown above are sagittal brain tissue sections stained with haematoxylin and
eosin, taken from at least 3 different mice. A small arrow indicates dilated blood vessels
and leucocytic infiltration. A large arrow indicates meningeal leucocytic infiltration.
Magnification x200.

CHAPTER 6
KUNV AND MVEV INTRACEREBRAL INFECTION
156
A
B
C
D
Figure 6.5. Brain tissue inflammation on day 9 p.i. following i.c. KUNV (A and B)
and MVEV (C and D) infection in DUB mice.
Figures shown are representative of sagittal mouse brain sections stained with
hematoxylin and eosin, taken from at least 3 different mice. A small arrow indicates
leucocytic infiltration and dilated blood vessel, while a large arrow indicates leucocytic
infiltration at leptomeninges. Magnification x200.
CHAPTER 6
KUNV AND MVEV INTRACEREBRAL INFECTION
157
6.2.2.3 Analysis of accumulation and activation of microglia/macrophages in the brains
of virus-infected mice
Microglia are cells of the innate immune system in the brain and comprise 20% of total
glial cell population (Raivich and Banati, 2004; Gehrmann, 1996; Streit et al, 2004).
Microglia are thought to be of haematopoetic origin and share many characteristics with
macrophages (Perry and Gordon, 1988). In a normal uninfected brain, microglia reside
in the parenchyma while brain macrophages are normally found in the perivascular
space and meninges (Raivich and Banati, 2004). Following CNS insults, microglia and
brain macrophages are among the first cell types to respond and get activated. Activated
microglia/macrophages can produce an array of cytokines, NO and other inflammatory
stimuli or molecules in a response to intruding pathogens (Streit, 2002). Other host
immune cells respond to these signals and as a result, peripheral leucocytes including
blood borne monocytes which later can differentiate into macrophages, are recruited to
the brain. However, overproduction of the inflammatory stimuli is toxic to host cells
and in many CNS-related diseases such as in experimental allergic encephalomyelitis
and multiple sclerosis (Raivich and Banati, 2004), activated microglia/macrophages
have been implicated in the disease development and severity. Although studies on
brain inflammation (above) in resistant DUB mice indicated that the mortality observed
following KUNV i.c. challenge was not caused by excessive immune response, this
does not exclude the contribution of particular inflammatory cell types to the death of
mice. Thus, immunohistochemical analysis of activated microglia/macrophages was
important for obtaining evidence regarding the role of these cells in the pathogenesis of
both KUNV and MVEV.
A study of activated microglia/macrophages using tomato lectin was performed on
paraffin-embedded brain tissue sections prepared as described in Section 3.6.1.3. The
immunohistochemical staining using tomato lectin could not distinguish between
activated microglia and macrophages. Therefore, cells that stained positive in this study
were grouped together as activated microglia/macrophages. As shown in Figure 6.6 and
6.7, there were differences in morphology and numbers of microglia/macrophages
between early and late infections with both viruses. Almost no activated
microglia/macrophages could be detected in the brains of both susceptible and resistant
mice on day 3 p.i (data not shown). In contrast, brains harvested from susceptible mice
at the time of death showed an abundance of activated microglia with no significant

CHAPTER 6
KUNV AND MVEV INTRACEREBRAL INFECTION
158
difference observed between KUNV and MVEV infections. The numbers of
microglia/macrophages were 92 ± 6 cells/100µm2 and 85 ± 7 cells/100µm
2 in KUNV
and MVEV-infected HeJ, respectively, at the time of death (Table 6.2, Student t test, p
> 0.05). Microglia/macrophage numbers were obtained by counting positively stained
cells on different sections of the brain including cortex, thalamus, hypothalamus, mid
brain, pons, hippocampus and medulla oblongata. The numbers presented in Table 6.2
represent the average values per total brain. In resistant mice, the activated microglia
could be observed for the first time on day 5 p.i. throughout the brains following
challenge with both viruses. The numbers of activated microglia in brains of resistant
mice 5 days after infection with KUNV were found to be double (79 ± 6 cells/100µm2)
the numbers of activated microglia observed 5 days after MVEV infection (40 ± 6
cells/100µm2) in the same mouse strain. On day 9 p.i, the number of microglia increased
in both virus infections (Figure 6.7F and G, Table 6.2) and at this stage unexpectedly,
there were significantly more activated microglia/macrophages (Student t test, p < 0.03)
present in mouse brains infected with MVEV (105 ± 7 cells/100µm2) than KUNV (85 ±
6 cells/100µm2). Additionally, the staining intensity and hairy structures on the cells
also increased, indicating that microglia seen on day 9 p.i. were more activated than
those observed earlier, on day 5 p.i. (Figure 6.7).
The finding in this set of experiment regarding the smaller numbers of activated
microglia detected in mouse brains i.c. infected with KUNV than in those i.c. infected
with MVEV later in the infection, suggests that the activated microglia may not have a
determining role in the fatal outcome of disease following KUNV challenge in resistant
DUB mice.
6.2.2.4 Contribution of apoptosis to fatal outcome of infection
Apoptosis is a programmed cell death by which unwanted cells are eliminated either
during development or infection. It is characterised by rounding of cells, chromatin
condensation and fragmentation of cellular DNA and blebbing of the plasma membrane
that finally leads to a breakup of cell contents into the membrane bound apoptotic
bodies (Levine et al, 2002). Apoptosis is a mechanism that may be effective to prevent
virus maturation and spreading, but sometimes it can be costly to the host, especially
when the post-mitotic cells such as neurons are involved.

CHAPTER 6
KUNV AND MVEV INTRACEREBRAL INFECTION
159
Since virus infection can directly induce apoptosis, and neuronal cell death has been
previously implicated in infections with DENV and WNV (reviewed in Chambers and
Diamond, 2003), this study was undertaken to examine whether KUNV and MVEV
infections in both susceptible HeJ and resistant DUB mice could induce excessive
apoptosis. Furthermore, brain tissue inflammation analysis (section 6.2.2.1) suggested
that apoptosis is not abundant during i.c. flavivirus infection. Thus, this study would
provide further confirmation on this event. The TUNEL assay used in this study detects
fragmentation of DNA, which corresponds to the late stage of apoptosis. Analysis was
performed on susceptible HeJ mice at the time of death (days 5 and 6 p.i.) and on days
5, 7, and 9 p.i on resistant mice. As negative controls, brain tissue sections from
uninfected mice were included in this assay. Additionally, separate tissue sections from
uninfected mice were treated with DNase1 to induce DNA fragmentation and acted as
positive controls. In susceptible mice, there was no difference between the numbers of
apoptotic cells seen following infection with either KUNV or MVEV (Figure 6.8A and
6.8B). Apoptosis was a sporadic event in both infections, with about two to six dead
cells detected in the hippocampus, thalamus as well as in the cortex. The same regions
in the brains of resistant DUB mice were also shown to have some apoptotic cells
following KUNV and MVEV infections on day 9 p.i. (Figure 6.8C and 6.8D). However,
very few cells were detected, approximately one to four dead cells per the similar
regions as in susceptible HeJ mice. There was no apoptotic cells observed on days 5 and
7 p.i. following infection of KUNV and MVEV in DUB mice (data not shown). Cells
that tested positive for apoptosis had morphological characteristics of neurons and
mononuclear cells.
Since only small numbers of dead cells were detected to be positive by the TUNEL
assay, it can be concluded that apoptosis is not the major pathogenic mechanism
associated with the death of either susceptible HeJ or resistant DUB mice during i.c.
KUNV and MVEV challenge.

CHAPTER 6
KUNV AND MVEV INTRACEREBRAL INFECTION
160
A
B
C
Figure 6.6. Detection of activated microglia/macrophages in the brains of
susceptible mice following i.c. KUNV and MVEV infection.
(A) Uninfected brain (B) HeJ with KUNV at day 5 p.i. (C) HeJ with MVEV at day 6 p.i.
(D) DUB with KUNV at day 5 p.i. (E) DUB with MVEV at day 5 p.i. (F) DUB with
KUNV at day 9 p.i. (G) DUB with MVEV at day 9 p.i. Figures shown are
representative of mouse brain tissue sections taken from 3 different mice. Arrows
indicate activated microglia/macrophages. Magnification x200.

CHAPTER 6
KUNV AND MVEV INTRACEREBRAL INFECTION
161
D
E
F
G

CHAPTER 6
KUNV AND MVEV INTRACEREBRAL INFECTION
162
Table 6.3. Summary of viral titres, histopathology and microglia analysis in
susceptible and resistant mice following i.c. infection with KUNV and MVEV.
Virus Mouse
strain
Days post
infection
bViral titres
(Log10
TCID50/0.01g
brain
bLeucocytic
infiltration
and
inflammation
bMicroglia
count
(/100um2)
KUNV
HeJ a5 7.2 0.2 4 92 6
DUB 5 3.8 0.4 2 79 6
DUB a9 c
1.3 0.6 ¾ 85 6
MVEV
HeJ a6 10.1 0.1 5 85 7
DUB 5 4.4 0.2 3 40 6
DUB 9 0 4/5 105 7
aMice were showing terminal signs of diseases.
b3-5 mice were used for each time points for viral titres, histology and microglia studies
cValue obtained from arbitrary values (refer to section 3.7.6 for method of calculation)
Tissue inflammation and leucocytic infiltration
5 - very severe
4 - severe
3 - slightly severe
2 - medium
1 - mild

CHAPTER 6
KUNV AND MVEV INTRACEREBRAL INFECTION
163
A
B
Figure 6.7. Analysis of apoptosis in brains of susceptible and resistant mice
following i.c. KUNV and MVEV infection.
Very few brain cells were apoptotic as shown by TUNEL in A) HeJ infected with
KUNV day 5 p.i. B) HeJ infected with MVEV day 6 p.i. C) DUB with KUNV day 9
p.i. and D) DUB with MVE day 9 p.i. Arrows indicate apoptotic cells. Magnification
x400.

CHAPTER 6
KUNV AND MVEV INTRACEREBRAL INFECTION
164
C
D
CHAPTER 6
KUNV AND MVEV INTRACEREBRAL INFECTION
165
6.3 DISCUSSION
Resistance against flaviviruses conferred by the Flv gene has been shown to be
incomplete against several flaviviruses (Sabin, 1954; Shueb et al, 2005). Some strains
of flaviviruses can still inflict fatal disease in resistant mice, particularly following i.c.
challenge. In the 1950s, Sabin demonstrated that the French neurotropic strain of YFV
induced some mortality in resistant RV mice after i.c. infection (Sabin, 1954).
Additionally, MVE OR155, MVE OR156, Banzi virus and WNV E101 were also
shown to have the ability to ‘evade’ the resistance expressed in flavivirus resistant mice
and cause lethal infection during i.c. challenge (Sangster et al, 1998; Jacoby and Bhatt,
1976; Hanson et al, 1969). In the current study, the pathogenesis of neurovirulent
flavivirus in resistant DUB mice was studied for the first time.
While the morbidity studies following KUNV, MVEV and WNV challenge in
susceptible HeJ and resistant DUB mice were described in Chapter 4, in this chapter,
studies on histopathological changes and brain tissue inflammation associated with the
deaths of susceptible and resistant mice during i.c. flavivirus infection are described.
This is the first study initiated to shed further understanding on why certain flaviviruses
(such as KUNV) cause fatal infection in resistant DUB mice while others (such as
MVEV) are avirulent in this mouse strain despite their higher virulence in susceptible
HeJ mice. Studies using susceptible HeJ mice were also performed in parallel to look at
whether risk factors involved in the pathogenesis of KUNV and MVEV in resistant
mice were similar to that observed in susceptible mice.
The pathogenic mechanisms associated with the virus-induced neurological diseases are
complex. However, in general, a disease severity is either caused by direct virus
replication or by accumulation and activation of resident or recruited inflammatory cells
in response to the infection (Anderson, 2001; Brehm et al, 2004). In this study, the
morbidity and brain tissue inflammation of KUNV and MVEV-infected susceptible HeJ
mice was caused by several factors including high levels of viral replication in the brain.
Considerably higher viral titres were observed in susceptible HeJ mice compared to
resistant DUB mice (Section 6.2.1.1). Neurons are the primary site of flavivirus
replication in the brain (reviewed in Diamond and Engle, 2003). Hase and co-workers
(1990a, 1990b) demonstrated that in JEV infection, virus grows exclusively in the
neuronal secretory system including RER and Golgi apparatus and as a result, the

CHAPTER 6
KUNV AND MVEV INTRACEREBRAL INFECTION
166
cytoplasmic membranous organelles of infected neurons are destroyed. Consequently,
neuronal dysfunction of a large number of infected neurons rather than cell
lysis/apoptosis led to a fatal disease outcome (Hase et al, 1990b, McMinn et al, 1996;
Johnson et al, 1985). In fact, the role of apoptosis in CNS cells in flavivirus
pathogenesis is controversial since challenges with different flaviviruses have not
provided conclusive observations. Neuroadapted DENV has been shown to induce
apoptosis in young mice (Despres et al, 1998). WNV infection in adult hamsters also
generated similar results (Xiao et al, 2001) thus prompting suggestion that
neurovirulent flavivirus is associated with the extent of neuronal cell death it can induce
(Chambers and Diamond, 2003). In contrast, although high mortality occurred in Swiss
mice challenged with MVEV strain BH3479, the occurrence of apoptosis was very low,
only seen in less than 1 per 1000 infected neurons (Andrews et al, 1999). Results
presented in the current study also demonstrated that neurovirulent MVEV and KUNV
did not induce abundant apoptosis in either susceptible HeJ or resistant DUB mice
(Section 6.2.2.3). Thus, no association could be established between apoptosis and
mortality observed in KUNV and MVEV-infected susceptible HeJ mice or KUNV-
infected resistant DUB mice. This disparity may be attributed to the different mouse and
virus models, route of inoculation and virus doses used here and by other investigators.
Thus, KUNV and MVEV-infected susceptible HeJ mice died probably due to a high
viral replication within the neurons and widespread infection within the brain, resulting
in an extensive neuronal dysfunction, as suggested by Hase and co-workers during JEV
infection (1990a, 1990b). In addition to a small number of apoptotic neurons, some of
the apoptotic cells detected morphologically resembled mononuclear cells. This could
be because in the CNS, when inflammatory cells, particularly T cells, do not come in
contact with an antigen and are no longer needed, they may undergo apoptosis (Dorries,
2001).
Interestingly, KUNV induced mortality a day earlier and at lower titres than MVEV in
susceptible HeJ mice. In fact, MVEV replicated to 3 logs higher in the brains of
susceptible mice before they succumbed to the disease (Section 6.2.1.1). This is
intriguing since infection with KUNV and MVEV produced similar viral titres in Vero
cells (see Chapter 5). One possibility is that KUNV may have slightly different
neurotropism than MVEV, targeting vital brain regions which then may induce disease
earlier. Additionally, neurons from various parts of the brain are known to have a
heterogenous response to IFNγ and its antiviral action, resulting in a failure to restrict

CHAPTER 6
KUNV AND MVEV INTRACEREBRAL INFECTION
167
virus replication at the level of individual neurons and in localised areas of the brain
(Binder and Griffin, 2001). This possibility may be supported by the cytoplasmic
rarefaction and swollen neurons observed in the thalamus of HeJ mouse brains
challenged with KUNV (Figure 6.3). In contrast, neurons with these features were
randomly seen throughout the brain and they were not predominant in the thalamus of
MVEV-infected mouse brains. The thalamus has several functions including regulating
the states of sleep and wakefulness (Steriade and Llines, 1988). Damage to the thalamus
can lead to permanent coma. Previous studies performed in the laboratory have shown
that following i.c. MVEV infection, viral RNA was found in the thalamus, cerebral
cortex, hypothalamus, olfactory tuberculum and bulbs, corpus striatum, medulla
oblongata and hippocampus in susceptible mouse brains (Silvia et al, 2004). However,
the spread and neurotropism of KUNV has not been investigated yet. Thus, it would be
interesting to compare the viral spread of KUNV and MVEV in the brains of HeJ mice.
Such a study would assist in determining whether the involvement of different infected
brain regions during KUNV and MVEV infection contributes to the different outcomes
of infection, as observed in both susceptible and resistant mice.
A possible explanation for the different outcomes of i.c. KUNV versus i.c. MVEV
infection in resistant DUB mice is that KUNV, unlike MVEV, has the ability to
abrogate the Flvr-like-controlled resistance, resulting in a high KUNV replication in the
brains of dying resistant DUB mice. As shown in Figure 6.1, MVEV was rapidly
cleared from the resistant mouse brains and was no longer detectable on day 9 p.i. by
TCID50 bioassay. Similar clearance of infectious MVEV from the brains of infected
resistant mice has also been demonstrated in this laboratory (Urosevic et al, 1999).
Similarly, KUNV-infected resistant DUB mice displayed restricted virus replication in
the brains although they became very sick on day 9 p.i., indicating that the flavivirus
resistance gene, Flvr-like, was fully operational and was not abrogated in these mice
(Figure 6.1). However, the death of KUNV-infected resistant DUB mice was associated
with low KUNV titres in the brain. Sabin (1954) reported that a proportion of resistant
RV mice died after i.c. infection with French neurotropic strain of YFV and dying mice
had similar levels of low virus titres compared to that observed in surviving infected RV
mice. In contrast, brain viral titres found in dying RV mice challenged i.c. with WNV
E101 showed an increase compared with infected resistant RV mice that did not exhibit
any signs of disease, although the viral titres were still much lower than that found in
susceptible HeJ mice and the death of resistant mice occurred three to four days later

CHAPTER 6
KUNV AND MVEV INTRACEREBRAL INFECTION
168
than in susceptible mice (Brinton, 1986; Brinton and Perelygin, 2003), suggesting a
partial abrogation of the flavivirus resistance gene in WNV E101-infected resistant RV
mice. Similar high levels of virus replication in the brains of moribund resistant mice
were also reported following Banzi infection in RV mice (Bhatt et al, 1981). In this
laboratory, fatal infection of resistant mice by MVEV OR155 and MVEV OR 156
which are not highly virulent in susceptible mice has been demonstrated (Urosevic et al,
1999; Sangster et al, 1998). MVEV OR 156 is a very unusual strain of MVEV and
exhibits a low i.c./i.p. LD50 ratio in susceptible mice as well as a low infectious virus in
cell culture (Urosevic et al, 1999). Additionally, this virus has 9% divergence in the 5’
portion of the genome from the MVEV strain that was used in the current study
(Poidinger et al, 1996). The differential outcomes of infection by various closely
related flaviviruses as well as the inconsistent brain viral titres (low or high) in resistant
mice that died from certain flavivirus infections suggest two possible scenarios. These
are either non-abrogation (low virus titres as observed in this study) or partial
abrogation of the flavivirus resistance gene effect (high brain viral burden as reported
by Brinton (1986)) in dying resistant mice. In this study, the cause of death of resistant
mice that displayed low brain virus titres was investigated
The inability of KUNV to be cleared from the brains of infected DUB mice is quite
unusual (Figure 6.1). The reason for this incomplete virus clearance is not known. Apart
from the possibility that KUNV may replicate exclusively or to greater levels in neurons
of certain brain regions as mentioned above, it is also possible that KUNV may infect
other CNS cells including brain microglia and macrophages, both of which may lead to
the evasion from host immune surveillance and virus persistence at low titres. Although
flaviviruses have been shown to replicate primarily in neurons in vivo, in vitro infection
demonstrated that a variety of other CNS cells such as astrocytes and oligodendrocytes
can also be infected (reviewed in Chambers and Diamond, 2003; Abraham and
Manjutah, 2006). Cheeran and co-workers (2005) demonstrated that human microglia
could not be infected in vitro, while a persistent JEV infection has been reported in
monocytes (Yang et al, 2004). However, the possibility of brain microglia and
monocytes-derived macrophages as another site of virus infection could not be excluded
for KUNV. A future study whereby brain mononuclear cells will be separated according
to cell surface expression (CD4+, CD8+, and CD11b+) by flow cytometry and tested for
the presence of viral RNA by RT-PCR may yield more information about the

CHAPTER 6
KUNV AND MVEV INTRACEREBRAL INFECTION
169
involvement of microglia/macrophages or other inflammatory cells in the pathogenesis
of flaviviruses.
Unexpectedly, a greater level of brain inflammation was observed following i.c. MVEV
than i.c. KUNV infection. However, higher levels of replication of MVEV than KUNV
perhaps explain the more vigorous mononuclear cell infiltrates seen in the brains of
MVEV-infected susceptible HeJ and resistant mice DUB compared with KUNV-
infected mice (Section 6.2.1.1 and Section 6.2.2.1). In addition, the severity of brain
tissue inflammation was found to be more apparent in susceptible HeJ than resistant
DUB mice, again probably due to a much higher viral replication in the former mice.
From this study, it can be postulated that brain immunoinflammatory cells may play
different roles in different mouse strains. The greater degree of brain inflammation
suggests that immunopathological disease could contribute to the morbidity of
susceptible HeJ mice i.c. infected with either KUNV or MVEV. In contrast, the stronger
recruitment of brain mononuclear cells was associated with the recovery of resistant
DUB mice from i.c. MVEV infection.
The brain has evolved anatomically and physiologically to protect its delicate and vital
function from damaging pathogens or immune-mediated inflammation (Aloise, 2001).
However, the CNS is still constantly under an immune surveillance. Microglia form the
major APC in the CNS parenchyma and are capable of producing an array of cytokines
and chemokines in response to any insults or injury (Kreutzberg, 1996). Because of this,
microglia could also contribute to a development of immunopathological diseases since
the overproduction of cytokines and chemokines are toxic to the brain cells (Hanisch,
2001; Aloise, 2001). While contribution of microglia to CNS infection and disease
development has been documented in numerous studies, there is very little information
regarding the role of microglia in flavivirus infection. Recently, a robust increase of
activated microglia was demonstrated during i.c. infection with JEV in suckling
susceptible BALB/c mice (Ghoshal et al, 2007). Both in vivo and in vitro analysis has
implicated activated microglia in the neuronal death of these mice. Fatal encephalitis in
susceptible HeJ mice during i.c. infection with KUNV and MVEV also coincided with
high numbers of activated microglia/macrophages (Section 6.2.2.2). However, the role
of these cells in the pathogenesis of KUNV and MVEV in susceptible HeJ mice is yet to
be determined. Activated microglia/macrophages secrete a variety of substances that
can contribute to both neuroprotection and neurotoxicity in mice. These include

CHAPTER 6
KUNV AND MVEV INTRACEREBRAL INFECTION
170
cytokines, glutamate, reactive oxygen species and NO (Hanisch, 2002; Streit, 2002).
Inhibition of NO activity has been shown to increase mortality in JEV infected mice
(Lin et al, 1997). Endogenously produced NO in monocytes and macrophages has also
been demonstrated to limit DENV replication (Neves-Souza et al, 2005). In contrast,
NO contributes to TBEV pathogenesis in mice as its inhibition improved the survival of
infected animals (Kreil and Eibl, 1995; 1996). In this laboratory, no difference in brain
NO production was observed between KUNV and MVEV infection in both susceptible
HeJ and resistant DUB mice compared with uninfected mice (Silvia et al, 2001; Shueb
2002). However, the lack of NO induction following i.c. KUNV and MVEV infection
did not eliminate the pathogenic role of microglia/macrophages during KUNV and
MVEV infection in HeJ mice since different effector molecules/substances such as IL-6,
IL-1β, TNFα and MCP-1 may be associated with KUNV and MVEV infection (Ghoshal
et al, 2007).
In resistant mice, brain microglia/macrophages were more activated on day 9 p.i. than
on day 5 p.i., as demonstrated by the increased staining intensity and more hairy
structure of these cells later in the infection. Interestingly, considerable numbers of
microglia/macrophages present in MVEV-infected DUB mice on day 9 p.i. compared
with KUNV-infected DUB mice, suggested that the increased accumulation of
microglia/macrophages may be involved in the clearance of MVEV infection. However,
additional studies are required to confirm this possibility, either by inhibition of
activation or selective depletion of microglia.
In conclusion, it was demonstrated here that the pathogenic mechanisms following
flavivirus infection, particularly with KUNV are different in susceptible versus resistant
mice even though both mouse strains develop fatal disease outcomes. The death in HeJ
mice after KUNV and MVEV i.c. challenge coincided with high brain viral titres,
severe brain inflammation and large numbers of activated microglia/macrophages, all of
which may have the ability to cause neuronal dysfunction without apparent brain cell
death. However, challenge of resistant DUB mice with the same viruses resulted in
significantly lower virus replication, less brain tissue inflammation and comparably
lower numbers of microglia accumulation than in susceptible HeJ mice. However, the
factors involved in such dramatically different outcomes of KUNV and MVEV
infections in resistant mice have not been identified. This study presented the evidence
that the abrogation of phenotypic expression of Flvr-like gene or an excessive immune

CHAPTER 6
KUNV AND MVEV INTRACEREBRAL INFECTION
171
response to virus infection did not contribute to the mortality in KUN-infected DUB
mice. However, the role of individual immune cell types in KUNV and MVEV
pathogenesis particularly in resistant mice is yet to be determined. The possibility that
KUNV may induce a greater accumulation and activation of specific immune cell types
remains to be explored. As will be described in the following chapter, further studies of
pathogenic mechanisms of KUNV and MVEV in susceptible HeJ and resistant DUB
mice targeting specific immune cell populations in the CNS was performed.

CHAPTER 7
IMMUNOPATHOLOGY
172
7.0 CHAPTER 7: ROLE OF CELL MEDIATED IMMUNITY IN
IMMUNOPATHOLOGY OR RECOVERY FOLLOWING
INTRACEREBRAL KUNV AND MVEV INFECTION IN MICE
7.1 INTRODUCTION
The immune system is a highly efficient defence mechanism that is capable of
combating any invading pathogen. The destructive potential of the immune system
however needs to be kept under strict control to prevent its harmful effect on the host
(Bachmann and Kopf, 2002). Deregulation of this control may result in a collateral
damage and could cause immunopathological diseases in the host. Many neurological
diseases are due to sustained, excessive or inappropriate immune response that exerts a
detrimental effect on the host.
The immune cells belonging to both branches of the host immune system, the adaptive
and innate immunity, have been reported to be involved in many immunopathological
diseases. For example, DHF has been suggested to occur due to antibody dependent
enhancement of virus infection of macrophages presumably by increasing the Fc
receptor-mediated internalisation of the virus (Halstead and O’Rourke, 1977).
Additionally, cross-reactive T cells have been demonstrated to contribute to DHF during
secondary infection, either by direct cytolysis or by production of cytokines
(Mongkolsapaya et al, 2006; reviewed in Fink et al, 2006). In the previous chapter,
death in susceptible HeJ mice was shown to be associated with high brain viral titres
following i.c. challenge with KUNV or MVEV. In addition, histological analysis of
infected-HeJ mouse brains suggested that a robust host immune response to flavivirus
infection in the CNS may exacerbate the course of infection, leading to fatal
encephalitis in these susceptible mice. However, at the start of this project, the
involvement of distinct host inflammatory cells in KUNV and MVEV pathogenesis in
susceptible HeJ mice was not known. On the contrary, since the development of fatal
disease in KUNV-infected resistant DUB mice was observed not at the peak of viral
replication, but rather at the time when infectious virus was almost cleared from the
brain, this precluded virus-induced direct cytopathology as the cause of death in
resistant DUB mice during i.c. challenge with KUNV. It was initially thought that the
death of resistant DUB mice following i.c. KUNV challenge was a result of an
CHAPTER 7
IMMUNOPATHOLOGY
173
excessive host immune response to the virus but as shown in the preceding chapter, no
severe tissue inflammation was observed in the brains of these mice. However, rather
than a massive tissue inflammation, the damaging effect of the immune response may
also caused by fine changes in the quantity or accumulation of particular immune cell
subpopulations in the CNS. Thus, the study described in this chapter was aimed at: (1)
performing a more detailed analysis on infiltrating brain leucocytes of infected mice in
order to identify and quantify different types of mononuclear cells accumulating in the
brains, particularly T cells, following KUNV and MVEV i.c. challenge and (2)
investigating whether T cells and cytokines secreted by these cells were associated with
the severity of disease during KUNV infection or recovery from MVEV infection in
resistant DUB mice. Since substantial evidence has linked T cells to either protection or
immunopathological diseases in virus-induced encephalitis (Binder and Griffin, 2003),
we hypothesised that the roles of T cells may vary following KUNV or MVEV infection
in different mouse strains. In susceptible HeJ mice, T cells may contribute to the
severity of diseases during both virus infections. However, in resistant DUB mice, T
cells are possibly linked to fatal outcomes of KUNV infection, yet may have a recovery
role following MVEV infection.
The analysis of different subpopulations of host immune cells included a flow
cytometry analysis to identify cells expressing surface markers for CD4+ and CD8+ T
cells as well as for B cells (CD19+) and microglia/macrophages (CD11b+) in brain
mononuclear cells isolated from infected mice. Studies on depletion of CD4+ or CD8+
T cells or both subsets of T cells prior to virus challenge, and the secretion of cytokines
locally in the brain and systematically in the circulation were also performed.

CHAPTER 7
IMMUNOPATHOLOGY
174
7.2 RESULTS
7.2.1 FLOW CYTOMETRIC ANALYSIS OF BRAIN MONONUCLEAR CELLS
FOLLOWING KUNV AND MVEV INFECTION
Histological analysis of HE stained brain tissue sections as described in Chapter 6
provided only a broad picture of brain inflammation and leucocytic infiltration.
However the role of individual cell types in the pathogenesis or recovery from KUNV
and MVEV infections, respectively, could not be ascertained from such study. In order
to obtain a better insight into the pathogenesis of these two viruses in terms of the types
and numbers of inflammatory cells attracted to the brains of infected mice, a more
targeted approach using flow cytometric analysis was used. To perform this experiment,
two groups of mice were infected i.c. with either KUNV or MVEV. At selected time
points of infection (see below), brains from three mice were harvested and pooled.
Following this, lymphocytes were isolated from the brains by discontinuous Percoll
gradient method and characterised using rat anti-mouse monoclonal antibodies against
cell surface markers for T lymphocytes subsets (CD4+ and CD8+), B (CD19+)
lymphocytes and macrophages/microglia (CD11b+). The total numbers of brain cells
isolated were determined using the Trypan blue exclusion dye assay prior to flow
cytometric analysis and these values were later used to calculate the total cell numbers
of different cell subtypes as shown in the following sections. Unless otherwise stated,
experiments described in this section were performed at least three times to allow for
the statistical analysis.
7.2.1.1 Analysis of cells infiltrating the brains of susceptible HeJ mice upon infection
with MVEV and KUNV
Using the approach described above, analysis of different immune cells present in the
brains of susceptible HeJ mice following virus infection was performed at the time of
death (day 5 p.i. and day 6 p.i. for KUNV and MVEV, respectively). Initial attempts
have been made to isolate brain mononuclear cells from susceptible HeJ mice 3 days
after KUNV or MVEV infection. However, very few cells were obtained which
coincided with the mild brain inflammation observed in these mice (Chapter 6).
Because of this, and as this study was more focused on resistant mice, experiment
planned to analyse brain infiltrates in these mice on day 3 p.i. was abandoned.

CHAPTER 7
IMMUNOPATHOLOGY
175
At the time of death, there were slightly more brain mononuclear cells isolated from
MVEV-infected than KUNV-infected HeJ mice (Table 7.1). This is in accordance with
the observations made in the preceding study (Chapter 6) concerning the stronger brain
inflammation observed in MVEV than in KUNV-infected mice.
As shown in Table 7.1, the predominant cell types present in the brains of infected mice
were microglia/macrophages (CD11b+) followed by T and B cells. Meanwhile, the
average number of CD4+ T cells found in brains of HeJ mice challenged with KUNV
was 9.4 ± 3.4 x 10³ cells, whereas the number of the same T cell subset was double
following MVEV infection (Student t test, p < 0.04). Similarly, B cells and CD11b+
cells were also lower in the brains of KUNV-infected HeJ mice than that observed in
MVEV-infected HeJ mice. The difference in B cell numbers between these two
infections was significant (Student t test, p < 0.03). The higher numbers of CD11b+
cells found in the brains of MVEV-infected mice compared with KUNV-infected mice
did not correlate with the results from the previous study (Chapter 6) performed on
activated microglia. Perhaps this was because during immunohistochemical staining
using tomato lectin on brain tissue sections, only activated microglia/macrophages
present in the brains of infected mice were detected while resting
microglia/macrophages were excluded. In contrast, CD11b+ cell surface marker detects
both resting and activated microglia/macrophages.
Interestingly, KUNV induced a slightly higher numbers of brain infiltrating CD8+ T
cells (11.7 ± 2.5 x 10³ cells) than MVEV (9.9 ± 1.4 x 10
3 cells) although these values
were not remarkably different (Student t test, p > 0.05). However, MVEV induced
higher numbers of total T cells than KUNV in the brains of susceptible HeJ mice. The
average total numbers of T cells recruited to the mouse brains at the time of death were
21.1 x 10³ cells and 27.7 x 10
3 cells after KUNV and MVEV i.c. challenge,
respectively.
The findings above indicate that although similar lethal encephalitis was observed
following i.c. challenge of KUNV and MVEV in susceptible HeJ mice, interestingly,
these two viruses induced recruitment and extravasation of different numbers of
inflammatory cells to the brains of infected mice. Thus, death in KUNV and MVEV-
infected mice may be mediated by the different types of immune cells. It is possible that
CD8+ T cells contributed to the early death observed in HeJ mice during i.c. KUNV

CHAPTER 7
IMMUNOPATHOLOGY
176
challenge. However, further studies are required to confirm this possibility (see Section
7.2.2.2).
7.2.1.2 Analysis of lymphocytes in the brains and spleens of resistant DUB mice
following KUNV and MVEV infection
In this section, the infiltration and accumulation of brain mononuclear cells in resistant
DUB mice following i.c. infection with KUNV and MVEV was examined. These two
viruses have been shown previously (Chapter 4 and 6) to cause different outcomes of
infection in resistant DUB mice. Analysis of brain lymphocytes following virus
infection was carried out daily in resistant DUB mice from day 6 to day 9 p.i. In
addition, analysis of different numbers of mononuclear cells was also performed on the
spleens of infected mice from day 5 to day 9 p.i. As shown in Figure 7.1, the total
numbers of splenocytes decreased over time following both virus infections in resistant
DUB mice, although there were more cells present in the spleens of mice infected with
MVEV than KUNV. The total numbers of splenocytes were significantly different
following challenges with these two virus on days 7 (Student t test, p < 0.02,) and 8 p.i.
(Student t test, p < 0.05). Additionally, on day 8 and 9 p.i, spleens harvested from
KUNV-infected resistant mice had decreased in size and were very small in comparison
to those isolated from MVEV-infected mice. It is not known why this occurred,
although it could be speculated that spleen cells in KUNV-infected mice underwent
apoptosis or were recruited to the brain.
In contrast, brain leucocytes derived from resistant mice infected with KUNV or MVEV
increased in numbers when monitored from day 6 to day 9 p.i. (Figure 7.1). In
agreement with the histopathological study performed in the previous section (6.3.1),
there were consistently more leucocytes isolated from the brains of MVEV-infected
than KUNV-infected resistant mice throughout the course of disease, although these
values were not significantly different (Student t test, p > 0.05).

CHAPTER 7
IMMUNOPATHOLOGY
177
Table 7.1. Number of brain infiltrating leucocytes isolated from HeJ mice that
succumbed to KUNV and MVEV infection.
Total
isolated
brain cells
(x 105)
CD4 T cells
(x 103)
CD8 T cells
(x 103)
B cells
(x 103)
CD11b cells
(x 103)
KUNV 12.2 ± 0.2 9.4 ± 3.4 11.7 ± 2.5 5.9 ± 0.2 542.0 ± 111.8
MVEV 12.4 ± 0.2 17.7 ± 3.3 9.9 ± 1.4 9.0 ± 1.2 781.0 ± 50.0
Susceptible HeJ mice were i.c. infected with 1.7 x 10⁵ i.u. of KUNV or 3.4 x 10
3 i.u. of
MVEV. Brains were harvested from HeJ dying from KUNV or MVEV infection on day
5 and 6 p.i., respectively. Average number of brain cells was derived from 3 mice. Data
shown were average number of cells ± standard errors.

CHAPTER 7
IMMUNOPATHOLOGY
178
In addition to determining the total number of mononuclear cells as reported above, the
numbers of individual cell types, T cells (CD4+ and CD8+), B cells and
microglia/macrophages (CD11b+) were also determined in both the spleens and brains
of infected resistant DUB mice. In general, infection with both viruses resulted in
diminished numbers of cells for all cell types being analysed in the spleens as the
disease progressed. B cells were the most predominant cell type found in the spleens,
followed by CD4+ T cells. However, both T cells subsets, B cells and CD11b+ cells
were demonstrated to be more numerous in the spleens of MVEV-infected mice that
KUNV-infected mice (Figure 7.2). This coincided with the greater numbers of total
cells obtained from these mice compared to those infected with KUNV.
In contrast to that observed in the spleens, CD11b+ cells were the principal
inflammatory cells recruited/residing in the mouse brains following both virus
infections. This is because in addition to recruited macrophages, microglia which are
unique to the brain, express CD11b+ cell surface marker as well. This was followed by
the cells carrying CD8+ cell surface markers. CD11b+ cells were 14-17 times more
numerous than CD8+ cells on day 6 p.i., and 4-9 times on days 7 p.i. to 9 p.i. with
KUNV and MVEV infection. The numbers of brain CD11b+ cells increased to a great
extent from day 6 p.i. to day 7 p.i. in mice infected with either virus. From day 7 p.i. to
day 9 p.i., the numbers of these cells did not change considerably. However, MVEV
induced a greater recruitment of CD11b+ cells to mouse brains than KUNV, although
the difference was not significant at any time point p.i. In addition to macrophages and
microglia, dendritic cells also express CD11b+ cell surface marker. Since presence of
dendritic cells in the brain parenchyma during CNS diseases has been documented
(reviewed in McMahon et al, 2006; Fisher et al, 2001; Fisher et al, 2000), a small scale
study was conducted to investigate whether or not dendritic cells were the major cell
type present in CD11b+ cell population.

CHAPTER 7
IMMUNOPATHOLOGY
179
A Spleen
0
10
20
30
40
50
60
70
80
90
5 6 7 8 9
Days post infection
Nu
mb
er
of
cells (
x10
5)
B Brain
0
2
4
6
8
10
12
14
6 7 8 9
Days post infection
Nu
mb
er
of
cells (
x10
5)
KUN MVE
Figure 7.1. Total number of cells isolated from (A) spleens and (B) brains of
resistant mice challenged i.c. either with KUNV or MVEV.
At different time points (5 to 9 days) after infection, spleens and brains were harvested
from 3 mice and homogenised to obtain cell suspension. Trypan blue exclusion dye was
used to enumerate total number of cells. Spleens were harvested from 3-5 mice and cells
were analysed individually. In contrast, brain cells were pooled from 3 mice and
analysed as one sample. Experiment on brain cells were repeated 3 times. Data
presented as average number of cells ± SE.

CHAPTER 7
IMMUNOPATHOLOGY
180
A CD4
0
5
10
15
20
25
5 6 7 8 9
Days post infection
Nu
mb
er
of
ce
lls
(x
10
6)
B CD8
0
5
10
15
20
25
5 6 7 8 9
Days post infection
Nu
mb
er
of
ce
lls
(x
10
6)
0
2
4
6
8
10
12
14
6 7 8 9
Days post infection
Num
ber
of
ce
lls (
x1
05)
KUNV MVEV
Figure 7.2. Flow cytometric analysis of splenocytes in DUB mice following i.c.
KUNV and MVEV infection.
A) CD4+ T cells B) CD8+ T cells C) B cells D) CD11b+ cells. Data shown are average
values from 3 separate experiments ± standard error. At days 5 to 9 p.i., spleens were
removed and total cells were isolated and enumerated. Aliquots containing 106 cells
were labelled with antibodies specific for CD4+, CD8+, CD19+ (B cells) and CD11b+
cell surface markers. Flow cytometric analysis was later performed and 104 events were
recorded.

CHAPTER 7
IMMUNOPATHOLOGY
181
C B cells
0
5
10
15
20
25
30
35
40
45
50
5 6 7 8 9
Days post infection
Nu
mb
er
of
ce
lls
(x
10
6)
D CD11b+
0
2
4
6
8
10
12
14
5 6 7 8 9
Days post infection
Nu
mb
er
of
ce
lls
(x
10
6)
0
2
4
6
8
10
12
14
6 7 8 9
Days post infection
Num
ber
of
cells
(x10
5)
KUNV MVEV

CHAPTER 7
IMMUNOPATHOLOGY
182
This study was only performed on brain mononuclear cells harvested from resistant
DUB mice 9 days after i.c.challenge with either KUNV or MVEV on day 9 p.i.
Dendritic cells express both CD11b+ and CD11c+ cell surface markers and therefore
dual staining was performed on mononuclear cells using these two cell surface markers
in order to identify dendritic cells. It was found that dendritic cells only comprised
between 6-10% of total CD11b+ cells (data not shown) and thus were not the major cell
type of the brain’s CD11b+ cells in infected-esistant DUB mice.
The second largest population of infiltrating leucocytes found in the brains of resistant
DUB mice during KUNV and MVEV i.c. challenge was CD8+ T cells. DUB mice
infected with MVEV showed a sharp increase of CD8+ T cell numbers from 9.8 x 10³
cells on day 6 p.i. to 127 x 103 cells on day 7 p.i. The numbers of CD8+ T cells
recruited to the brains of MVEV-infected DUB mice peaked on day 7 p.i. Following
this, CD8+ T cells gradually decreased, coinciding with the clearance of infectious
virus, and reached a low level on day 9 p.i (64.6 x 10³ cells) (Figure 7.3B). Similarly,
KUNV infection resulted in the CD8+ T cell recruitment to the brain that reached a
peak on day 7 p.i. (156 x 103 cells). Interestingly, KUNV consistently induced higher
numbers of brain CD8+ T cells than MVEV in resistant mice from days 7 to 9 p.i.
Additionally, CD8+ T cells persisted at relatively high numbers on day 9 p.i. (143 x 103
cells) when mice started to succumb to fatal infection. The numbers of brain CD8+ T
cells on day 9 p.i. following KUNV infection were significantly different than that
observed after non-fatal MVEV infection in the same mouse strain (Student t test, p <
0.03). The prolonged presence of CD8+ T cells in the brains of sick KUNV-infected
DUB mice coincided with the incomplete clearance of infectious virus found in these
mice as detected by TCID50 bioassay. Thus, this study showed that from day 7 p.i. to
day 9 p.i., the numbers of CD8+ T cells positively correlated with the brain viral titres.
Furthermore, although MVEV induced a stronger overall brain inflammation, KUNV
caused a greater CD8+ T cells response and this subtype of T cells may have important
contribution in KUNV pathogenesis and subsequent severe infection in DUB mice.

CHAPTER 7
IMMUNOPATHOLOGY
183
A CD4
0
50
100
150
200
250
6 7 8 9
Days post infection
Nu
mb
er
of
ce
lls
(x
10
3)
B CD8
0
50
100
150
200
250
6 7 8 9
Days post infection
Nu
mb
er
of
ce
lls
(x
10
3)
0
2
4
6
8
10
12
14
6 7 8 9
Days post infection
Num
ber
of
ce
lls (
x1
05)
KUNV MVEV
Figure 7.3. Analysis of brain infiltrating leucocytes in DUB mice following KUNV
and MVEV infection.
A) CD4+ T cells B) CD8+ T cells C) B cells D) CD11b+ cells. At days 6 to 9 p.i.,
brains mononuclear cells were isolated and enumerated. Aliquots containing 106 cells
were labelled with antibodies specific for CD4+, CD8+, CD19+ (B cells) and CD11b+
cell surface markers. Flow cytometric analysis was later performed and 104 events were
recorded. *The number of cells was significantly different between KUNV and MVEV
infection. Data shown are average values from 3 separate experiment ± SEM. In each
separate experiment, 3 brains were harvested and pooled.
*
*

CHAPTER 7
IMMUNOPATHOLOGY
184
C B cells
0
10
20
30
40
50
60
70
6 7 8 9
Days post infection
Nu
mb
er
of
ce
lls
(x
10
3)
D CD11b+
0
100
200
300
400
500
600
700
800
6 7 8 9
Days post infection
Nu
mb
er
of
cell
s (
x10
3)
0
2
4
6
8
10
12
14
6 7 8 9
Days post infection
Num
ber
of
cells
(x10
5)
KUNV MVEV
*

CHAPTER 7
IMMUNOPATHOLOGY
185
Other cell types that were analysed showed the opposite pattern of
recruitment/accumulation to that demonstrated by CD8+ T cells. The numbers of
CD4+T cells in general, increased as the infection with both viruses progressed (Figure
7.3A). However, higher numbers of CD4+ T cells were observed between day 7 to day
9 days after MVEV infection than following KUNV infection. On day 8 p.i., the
difference between the recruited CD4+ T cells in KUNV and MVEV-infected resistant
DUB mice was significant (69 x 103 cell and 104 x 10
3 after KUNV and MVEV
infection, respectively; Student t test, p < 0.005).
The numbers of B cells increased throughout the infection and reached the highest
levels on day 9 p.i. during MVEV infection in DUB mice. In contrast, although
increased numbers of B cells were also observed in the brains of KUNV-infected DUB
mice initially, the numbers of these cells declined on day 9 p.i. when mice succumbed to
the infection. Similar to CD4+ T cells, MVEV infection also caused higher levels of B
cells recruitment into the brains of infected DUB mice compared to KUNV infection,
with the greatest difference demonstrated on day 9 p.i. (Student t test, p < 0.05).
The ratio of brain CD8+ to CD4+ T cells in MVEV-infected DUB mice on days 6, 7, 8
and 9 p.i. were 1:1.1, 2:1, 1:1 and 1:1.4 respectively. Thus, except on day 7 p.i. (when
CD8+ T cells were doubled in comparison to CD4+ T cells), the numbers of CD8+ T
cell and CD4+ T cells recruited to MVEV-infected animals were almost equivalent. In
contrast, CD8+:CD4+ T cells in resistant mice challenged with KUNV on days 6, 7, 8
and 9 p.i. were 1:1.1, 2.9:1, 1.8:1 and 1.7:1 respectively. This clearly demonstrated that
KUNV infection resulted in greater numbers of CD8+ T cells being recruited into the
brains (almost 2-3 times more) than CD4+ T cells from day 7 p.i. onwards. When the
total numbers of T cells were calculated, the numbers of brain T cells in DUB mice
infected with either virus were similar on day 6 p.i. However, on day 7 p.i., there were
on average 210.5 x 10³ T cells following KUNV infection and 189.34 x 10
3 T cells
following MVEV infection. In the next 2 days, the total numbers of T cells following
KUNV infection remained relatively stable (197.7 x 10³ cells and 225.6 x 10
3 cells on
day 8 and 9 p.i. respectively). In contrast, following MVEV challenge, T cell numbers
increased to 213.25 x 10³ cells on day 8 p.i. before declining to 157.52 x 10
3 cells on
day 9 p.i. Significantly different numbers of T cells was observed in the brains of DUB
mice infected with KUNV compared with MVEV on day 9 p.i. (213.2 x 10³ and 157.5
x 103 cells during KUNV and MVEV infection, respectively, Student t test, p < 0.05).

CHAPTER 7
IMMUNOPATHOLOGY
186
As presented in this section, the relative proportion of different inflammatory cell sub-
populations in response to i.c. infection with KUNV and MVEV as determined by flow
cytometry provided a better insight in the quality of inflammatory response elicited by
these viruses. This study has demonstrated that the different proportions of
immunoinflammatory cells recruited to the brain possibly contributed to the different
outcomes of infection observed during KUNV and MVEV i.c. challenge in resistant
DUB mice. While more microglia/macrophages, CD4+ T cells and B cells were present
in the brains of MVEV-infected DUB mice, greater numbers and sustained response of
CD8+ T cells were observed following KUNV challenge. This finding is very crucial as
it showed for the first time that CD8+ T cells may have immunopathological role
following KUNV infection.
7.2.1.3 Analysis of MHC cell surface up-regulation on brain CD11b+ cells following
flavivirus infection.
MHC class I and II molecules play important role in the adaptive immune responses as
these molecules participate in the activation of CD8+ and CD4+ T cells, respectively
(Abraham and Manjunath, 2006). MHC I class I molecules are required for CD8+ CTL
cells to exert their effector function (Dorries, 2001). Unlike other viruses that evade host
immune surveillance by down-regulating MHC class I expression on infected cells,
flaviviruses are known to up-regulate expression of these molecules (King et al, 2003).
In order to further elucidate the pathogenesis of KUNV and its effect on the sustained
CD8+ T cell response, the ability of KUNV to up-regulate cell surface expression of
MHC antigen particularly MHC class I was examined. The main objective of this study
was to compare the levels of MHC molecules up-regulation by KUNV versus MVEV as
possible mechanism for the sustained T cell response observed in KUNV infection.
However, the MHC cell surface molecules analysis was only conducted on CD11b+
cells derived from resistant mouse brains infected with KUNV or MVEV. Only these
cells were chosen as they are known to possess the antigen presenting properties in the
brain and interact with T cells (Hanisch, 2002). Additionally, they could potentially be
infected with flavivirus.
The MHC class I molecules expression can be induced or up-regulated in most cells
following virus infection or exposure to cytokines (King et al, 2004). Thus, MHC class

CHAPTER 7
IMMUNOPATHOLOGY
187
I molecules analysis was initially planned to be performed in parallel with KUNV or
MVEV immunostaining using virus specific mouse anti-NS1 antibodies. This
experiment would help to provide better information on whether CD11b+ cells support
flavivirus infection in vivo, in addition to neurons which are the major permissive cells
for flaviviruses in the brain. Furthermore, the dual staining would also help to determine
whether or not the up-regulation of MHC I molecules on CD11b+ cells is induced
directly by virus infection. Unfortunately, initial flow cytometry analysis of CD11b+
stained cells with anti-NS1 antibodies failed because of a high background problem.
Due to a time constraint and limited reagents available, this dual immunostaining could
not be optimised and had to be abandoned. Alternatively, the flavivirus infection was
monitored in the total mononuclear cells containing CD11b+ cells as well as other
inflammatory cells that were isolated from HeJ mice and cultured ex-vivo for a day to
monitor the virus release in the cell culture supernatant. This method successfully
showed the presence of infectious virus at low titres in total brain mononuclear cells
when assayed by TCID50 bioassay (data not shown). However, this approach did not
target specifically CD11b+ cells, so further CD11b+ cell sorting prior to ex-vivo
cultivation could be introduced for a more specific analysis of virus infection in
microglia/macrophage cell population.
To study the up-regulation of MHC molecules on CD11b+ cells, brains from three
resistant mice infected either with KUNV or MVEV were harvested on different days.
Mononuclear cells were isolated from pooled brains (3 brains) prior to simultaneous
staining with the rat anti-mouse CD11b+ and mouse anti-mouse MHC class Ia
monoclonal antibodies. Flow cytometry was used to analyse the MHC class I
upregulation. As shown in Figure 7.4, CD11b+ cells from brains of uninfected mice did
not show detectable levels of MHC I and II molecules. The up-regulation of MHC I
molecules was observed 5 days after infection. Interestingly, the expression of these
molecules was greater in the cells derived from KUNV (mean fluorescence intensity,
MFI 29.4; data not shown) than in the cells isolated from MVEV-infected resistant
DUB mice (MFI 8.8, data not shown). A greater level of MHC I expression in
CD11b+ cells following KUNV infection than in infection with MVEV was seen
throughout the course of infection. The MFI increased 2 days later in both infections
(54.4 and 48.5 following KUNV and MVEV infection, respectively,) and then slightly
decreased on day 9 p.i. (49.6 and 38.8 after KUNV and MVEV infection, respectively).

CHAPTER 7
IMMUNOPATHOLOGY
188
In addition to MHC class I, the expression level of MHC II cell surface molecules was
also examined. MHC class II expression was found to be also up-regulated in CD11b+
cells isolated from resistant DUB mice following either KUNV or MVEV infection.
The kinetics of expression of MHC II molecules was similar to that observed in the
MHC I up-regulation. Minimal expression was observed on day 5 p.i. and it then
increased by day 7 p.i. However, on day 9 p.i., the expression of MHC II molecules on
CD11b+ cells was slightly reduced after both KUNV and MVEV infections. Similar to
what observed with MHC class I expression, KUNV also induced slightly higher levels
of MHC class II expression than MVEV (data not shown).
The data presented above indicate that KUNV elicits a slightly stronger up-regulation of
the MHC molecules than MVEV on CD11b+ cells when monitored from days 5 to 9 p.i.
Although this experiment could not directly determine the infectibility of CD11b+ cells,
it shows correlation between the upregulation of MHC molecules expression and the
course of in vivo infection, particularly with KUNV. The continuous up-regulation of
MHC class I on CD11b+ cells indicates that the interaction of T cells and CD11b+ cells
in antigen-dependent manner is possible, thus explaining the sustained CD8+ T cell
response observed in brains of KUNV-infected DUB mice.
7.2.2 T CELL DEPLETION STUDIES
Flow cytometry analysis demonstrated that different types of inflammatory cells were
recruited to the brains of infected mice. While higher numbers of brain CD8+ T cells
were found in KUNV-infected HeJ and DUB mice, MVEV-infected mice showed a
greater presence of CD4+ T cells, B cells and microglia/macrophages. This data
implicates CD8+ T cells involvement in the severe outcomes of KUNV infection
particularly in resistant DUB mice.
Several recent studies have been carried out to determine the involvement of T cells in
flavivirus pathogenesis. These studies showed that T cells may have different roles,
depending on virus types, route of infection and mouse strain used (Wang et al, 2003b;
Shrestha and Diamond, 2004). T cells may either be beneficial to the host or they may

CHAPTER 7
IMMUNOPATHOLOGY
189
MHCI MHCII
100
101
102
103
104
FL1-H: FITC
0
20
40
60
80
100
10
010
110
210
310
4
FL1-H: FITC
0
20
40
60
80
100
100
101
102
103
104
FL1-H: FITC
0
20
40
60
80
100
10
010
110
210
310
4
FL1-H: FITC
0
20
40
60
80
100
100
101
102
103
104
FL1-H: FITC
0
20
40
60
80
100
10
010
110
210
310
4
FL1-H: FITC
0
20
40
60
80
100
100
101
102
103
104
FL1-H: FITC
0
20
40
60
80
100
10
010
110
210
310
4
FL1-H: FITC
0
20
40
60
80
100
Figure 7.4. Up-regulation of MHC class I and II molecules in CD11b+ cells
following KUNV and MVEV infection.
Da
y 5
p.i
. D
ay
7 p
.i.
Da
y 9
p.i
. U
nin
fecte
d
Negative control
Uninfected brain
KUNV
MVEV

CHAPTER 7
IMMUNOPATHOLOGY
190
have detrimental effects and contribute to the development of fatal encephalitis. To
further clarify the role of T cells in KUNV and MVEV infection as well as whether this
role would be similar in susceptible HeJ mice and resistant DUB mice, T cells depletion
was performed using anti-CD4+ or CD8+ monoclonal antibodies.
7.2.2.1 Pilot study to determine the optimum antibody depletion time
A small scale pilot study was initially conducted to determine the optimum time for T
cells depletion (data not shown). Two groups of five DUB mice received either 100uL
of anti CD8+ T cell antibodies on days -2, 0, 2, 6 and 8 after KUNV infection, or on
days 5, 7 and 9 p.i. following KUNV infection. A positive control consisting of five
mice infected with KUNV only was also included and development of disease in all
mice was monitored. Following infection, all mice in the control group began to show
signs of sickness such as hunched posture and ruffled fur on day 7 p.i. that became more
apparent on day 8 p.i. By day 9 p.i., these animals were culled as they were very sick
and some of them developed hind leg paralysis. In contrast, KUNV-infected DUB mice
that received anti CD8+ antibodies on -2, 0, 2, 6 and 8 days p.i. only started to have
mild ruffled fur on day 10 p.i. By day 12 p.i., 4 of the mice died. The last remaining
mouse developed fatal disease by day 14 p.i. The signs of disease and development of
fatal encephalitis was also shown to be delayed in the group that received depleting
antibody on days 5, 7 and 9 p.i. These mice only became slightly sick on day 8 p.i. and
on day 10 p.i., three mice succumbed to virus infection. The rest of the mice had fatal
disease outcomes on day 14 p.i. The ATD for different groups of mice were as
followed: day 9 ± 0 p.i. for mice that were infected with virus only, day 12.7 ± 0.7 p.i.
for mice that received antibodies before infection and 11.7 ± 1.2 p.i. for animals that
were treated with depleting antibodies after infection. Since mice treated with depleting
antibodies prior to infection survived much longer than other groups of mice, in the
subsequent studies, anti-CD4+ and CD8+ T cells antibodies were given to resistant
DUB mice on days -2, 0, 2, 6 and 8 p.i. In susceptible HeJ mice, since they succumbed
to KUNV and MVEV infection 5 and 6 days after infection, respectively, anti-CD4+
and CD8+ antibodies were administered on days -2, 0, 2 and 4 p.i.
To confirm depletion of T cells, separate groups of resistant DUB mice were treated
with depleting antibodies on day 1 and day 3 (150uL CD4+ antibodies or 100uL CD8+
antibodies). The concentration was 600 µg/ml and 926 µg/ml for anti-CD4+ and anti

CHAPTER 7
IMMUNOPATHOLOGY
191
Figure 7.5. Analysis of T cells depletion in DUB mice by flow cytometry after
treatment with cytotoxic anti-CD4 and anti-CD8 antibodies.
A) CD8+ T cells composition in normal mouse spleen. B) CD8+ T cells were depleted
following antibody treatment. C) CD4+ T cells composition in normal mouse spleen D)
CD4+ T cells were depleted following antibody treatment. Mice were given 150 L
cytotoxic anti CD4 or 100 µL CD8 culture supernatant on day 1 and day 3 and spleens
were harvested on day 4 and analysed whether depletion had occurred. 96% and 95%
depletion of CD4+ and CD8+ T cells was achieved, respectively following treatment
with corresponding antibodies.
10 0 10 1 10 2 10 3 10 4
FL4-H: Cy5
0
200
400
600
800
1000
SS
C-H
: S
ide
Sca
tte
r
7.03
10 0 10 1 10 2 10 3 10 4
FL4-H: Cy5
0
200
400
600
800
1000
SS
C-H
: S
ide
Sca
tte
r
0.34
10 0 10 1 10 2 10 3 10 4
FL4-H: Cy5
0
200
400
600
800
1000
SS
C-H
: S
ide
Sca
tte
r
0.79 22
10 0 10 1 10 2 10 3 10 4
FL4-H: Cy5
0
200
400
600
800
1000
SS
C-H
: S
ide
Sca
tte
r
A
100
101
102
103
104
FL4-H: Cy5
0
200
400
600
800
1000
SS
C-H
: S
ide S
catt
er
6.83
C
100
101
102
103
104
FL4-H: Cy5
0
200
400
600
800
1000
SS
C-H
: S
ide S
catt
er
6.83
D
100
101
102
103
104
FL4-H: Cy5
0
200
400
600
800
1000
SS
C-H
: S
ide S
catt
er
6.83
CD8 CD8
CD4 CD4
B
100
101
102
103
104
FL4-H: Cy5
0
200
400
600
800
1000
SS
C-H
: S
ide S
catt
er
6.83
B
100
101
102
103
104
FL4-H: Cy5
0
200
400
600
800
1000
SS
C-H
: S
ide S
catt
er
6.83

CHAPTER 7
IMMUNOPATHOLOGY
192
CD8+ culture supernatant, respectively. Then on day 4, splenocytes were harvested and
labeled with rat anti-mouse anti-CD8+ (3.11M) and anti-CD4+ (RL174) monoclonal
antibodies that recognised different epitopes on T cells than those used to deplete CD4+
and CD8+ T cells . By flow cytometric analysis, 95% and 96% depletion was achieved
following treatment with anti CD8+ and CD4+ antibodies, respectively, (Figure 7.5).
Depletion of T cell subsets is a transient process as shown by the repopulation of the
spleens as well as the brains with T cells at later time points post infection. Flow
cytometric analysis of MVEV-infected mice, showed that T cells started to infiltrate the
brain as early as 14 days after infection, which was eight days after the antibody
treatment with anti-CD4+ and CD8+ antibodies ceased (data not shown).
7.2.2.2 Effect of CD4+ or CD8+ T cells depletion on mortality following flavivirus
infection in susceptible mice
This part of the study was aimed at investigating the contribution of T cells to the
pathogenesis of KUNV and MVEV in susceptible HeJ mice. Two groups of five
susceptible HeJ mice received a treatment with anti-CD4 antibodies. Another two
groups consisting of 15 HeJ (pooled from two separate experiments) received a
treatment with anti-CD8 antibodies prior to i.c. challenge with either KUNV or MVEV.
In addition, 10 HeJ mice infected with viruses only were also included as a control
group.
Depletion of CD4+ T cells caused a slight increase in the ATD values with no effect on
mortality rate following both virus infections. While all control HeJ mice died on day 5
or day 6 p.i. after KUNV or MVEV challenge, respectively, only 80% of mice
following CD4+ T cell depletion died on the same day as the control mice while the
other 20% died on the next day (Figure 7.6). The ATD and brain viral titres however did
not differ significantly in these mice (Table 7.2). This study indicated that CD4+ T cells
may only have a slight but not important contribution to the development of fatal
encephalitis in HeJ mice.
Depletion of CD8+ T cells showed different effects on the course of infection of KUNV
versus MVEV in susceptible HeJ mice. All susceptible HeJ mice lacking CD8+ T cells
succumbed to KUNV challenge on the same day as the control mice. Brain viral titres as

CHAPTER 7
IMMUNOPATHOLOGY
193
shown by TCID50 bioassay were also not significantly different between these two
groups of mice. Interestingly, depletion of the same T cell subset seemed to exacerbate
the course of MVEV infection in susceptible mice. Susceptible HeJ mice did not only
showed signs of diseases, including ruffled hair, hunched back and flaccid tail earlier
than the control group (day 4 p.i.), but 10 out of 15 mice also died on day 5 p.i. while
the control group succumbed to the infection on day 6 p.i. The shorter ATD in MVEV-
infected HeJ in the absence of CD8+ T cells (statistically significant, Student t test, p
<0.01) demonstrated that this subset of T cells possibly has a neuroprotective role
following MVEV infection in susceptible HeJ mice. This is in contrast to the lack of
CD8+ T cell depletion effect on the mortality rate of i.c. KUNV-infected susceptible
HeJ mice (Figure 7.6 and Table 7.2). However, mortality rate did not change in MVEV-
infected HeJ mice that lacked CD8+ T cells which indicated that CD8+ T cells have
only a minor contribution to the development of fatal encephalitis in these mice.
From the data obtained, it can be concluded that T cells do not significantly contribute
to the pathogenesis of KUNV or MVEV in susceptible HeJ mice. Furthermore, CD8+ T
cells may exert some protection to susceptible HeJ mice only during i.c. MVEV
infection which is interesting since KUNV induced more CD8+ T cells than MVEV in
the brains of susceptible HeJ mice.
7.2.2.3 Effect of CD4+ or CD8+ T cells depletion on mortality following flavivirus
infection in resistant DUB mice
The role of T cell subsets in flavivirus pathogenesis in susceptible HeJ and resistant
DUB mice has never been studied comparatively and therefore it is not known whether
T cells would assume similar roles in susceptible versus resistant mice following the
same virus infection. However, the effect of similar depletion on survival/mortality rate
was expected to be greater in resistant DUB mice following virus infection. The reasons
for this were 1) the much slower course of virus infection in DUB mice 2) the greater
recruitment of T cells into the brains of these mice and finally 3) the sustained
accumulation of T cells in KUNV-infected resistant mice as a possible cause of the poor
outcome of infection.

CHAPTER 7
IMMUNOPATHOLOGY
194
0
20
40
60
80
100
1 2 3 4 5 6 7
Days post infection
Su
rviv
al
(%)
KUNV
KUNV-CD4
KUNV-CD8
MVEV
MVEV-CD4
MVEV-CD8
Figure 7.6. Effect of CD4 or CD8 cells depletion on mortality following KUNV and
MVEV infection in flavivirus susceptible HeJ mice.
Fifteen mice were used for each group except for groups that received CD4 antibodies,
where only 5 mice were used per group.
Table 7.2. Effect of CD4+ and CD8+ T cells depletion on mortality of HeJ mice
following i.c. challenge with KUNV or MVEV.
Control CD4
depletion
CD8
depletion
KUNV
Survival (%) 0
(0/10)a
0
(0/5)
0
(0/15)
ATDb ( day p.i) 5.0 0.0 5.0 0.3 5.0 0.0
Average viral titres c
(Log10 TCID50/ 0.01g
tissue) 7.8 0.5 7.6 0.5 7.2 0.5
MVEV
Survival (%) 0
(0/10)
0
(0/5)
0
(0/15)
ATDb ( day p.i) 6.0 0.0 6.0 0.5 5.0 0.5
Average viral titres c
(Log10 TCID50/ 0.01g
tissue) 9.8 0.6 9.2 0.3 9.8 0.4
a Number of animals died per total number of animal
b Average time to death
cVirus titres were taken from mice that succumbed to the infection

CHAPTER 7
IMMUNOPATHOLOGY
195
As shown by Figure 7.7, i.c. challenge in 8-10 weeks old resistant DUB mice with
KUNV resulted in all 15 mice developing fatal encephalitis. A very mild signs of
disease was seen on day 6 p.i. in some mice which later became more evident on day 7
p.i. Death was first recorded in three mice on day 8 p.i., followed by another nine mice
on day 9 p.i, and the remaining of mice died on day 10 p.i. The ATD was day 9.0 ± 1.0
p.i. while average brain titres was 0.6 ± 1.0 log10 TCID50/0.01g for these mice (Table
7.3). In contrast, resistant DUB mice depleted of CD4+ T cells prior to KUNV infection
did not show signs of sickness until day 7 p.i., which was a day later than observed in
control KUNV-infected mice. The mice also started to succumb later than the control
infected mice. Two mice succumbed to KUNV infection 9 days after infection. More
deaths were observed on the following days; seven deaths occurred on day 10 p.i. and
four more deaths were reported on day 11 p.i. By day 12 p.i., all mice developed fatal
disease outcomes and had to be euthanised. The ATD was 10.4 ± 0.2 p.i. days, which
was significantly greater than in control infected DUB mice (ATD was 9.0 ± 1.0 p.i.
days Student t test, p < 0.01). The average brain virus titres in CD4+ T cell-depleted
mice succumbing to KUNV infection was 4.6 ± 0.7 log10 TCID50/0.01g, which was four
logs higher than found in control mice (Student t test, p < 0.006) (Table 7.3). This
finding is interesting since the numbers of recruited CD4+ T cells were lower in the
brains of KUNV-infected DUB mice compared to MVEV-infected DUB mice (Section
7.2.1.2) and it was initially thought that CD4+ T cells may not have detrimental effect
in KUNV-infected DUB mice.
Depletion of CD8+ T cells had a much greater effect on the development of disease and
survival of DUB mice following i.c. KUNV infection than depletion of CD4+ T cells. In
general, development of disease was very slow and gradual compared to control
infected mice and CD4+ T cells-depleted mice. Some of resistant DUB mice lacking
CD8+ T cells exhibited severe ruffled fur and hunched back only 9 days following
infection. One death was recorded the following day, which was 2 days later than the
control mice. Later, a few of the remaining mice also developed fatal encephalitis and
by day 18 p.i., only 9 out of 15 mice (60%) succumbed to the infection while the rest
(40%) survived (Kaplan Meier test, p < 0.007 when compared to control infected DUB
mice). CD8+ T cell-depleted mice that died from KUNV infection had an ATD of 12.4
± 0.7 p.i. days which was remarkably longer than in the control group (Student t test, p
< 0.001). Brain viral titres determined in the same mice were also much higher than
the control group (3.3 ± 1.4 log10 TCID50/0.01g, Student t test, p < 0.03).

CHAPTER 7
IMMUNOPATHOLOGY
196
Surprisingly, depletion of CD4+ or CD8+ T cells did not affect the survival of resistant
DUB mice i.c. infected with MVEV (Figure 7.7). As T cells are involved in virus
clearance during flavivirus infection (Shrestha and Diamond, 2004), it was expected
that T cell depletion would affect the resistance of DUB mice to MVEV. However,
resistant DUB mice did not exhibit any signs of disease and survived the infection,
similar to control resistant DUB mice during a 30-days monitoring period. This finding
clearly suggests that CD4+ or CD8+ T cells alone do not play a major role in the
survival of resistant DUB mice during MVEV infection and that the Flv gene may have
a greater contribution to the outcome of infection.
Although the depletion of either subset of T cells did not cause morbidity or abrogation
of resistance to MVEV in DUB mice, we hypothesised that virus titres in the brains of
infected DUB mice may have been affected in the absence of T cells. In order to test
this hypothesis, virus titres in the brains of MVEV-infected DUB mice lacking either
CD4+ or CD8+ T cells were determined in a separate experiment. The brains were
harvested from 3 mice in each group on days 5, 7, 9, 11 and 14 days p.i. and viral titres
assayed by TCID50 bioassay. As shown in Figure 7.8, on day 5 p.i. MVEV-infected
resistant mice showed similar brain viral replication in the presence or absence of
functional CD4+ and CD8+ T cells. However, after day 5 p.i., the brain viral titres in
control DUB mice i.c. infected with MVEV decreased sharply, and by day 9 p.i.,
infectious virus was no longer detected. In contrast, virus production in MVEV-infected
resistant DUB mice that lacked either CD4+ or CD8+ T cells did not decline and
remained relatively the same on day 9 p.i. (Figure 7.8, Table 7.3). The inability of these
mice to clear MVEV infection from the brains late in infection (day 9 p.i.) demonstrates
the pivotal participation of CD4+ and CD8+ T cells in clearing MVEV. However, after
day 9 p.i., MVEV replication in the brains of resistant DUB mice with transiently
impaired CD4+ or CD8+ T cells started to decline and on day 14 p.i., infectious MVEV
was no longer detectable by TCID50. This coincided with the repopulation of CD4+ and
CD8+ T cells observed in the spleens by day 14 p.i. (Section 7.2.2.1) as (data not
shown) as this T cell depletion is a transient process.
The depletion of T cell subsets studies provided the evidence for the first time on the
role of CD4+ and CD8+ T cells in the pathogenesis of KUNV in resistant DUB mice. In
contrast, CD4+ or CD8+ T cells alone were not neuroprotective as the absence of either

CHAPTER 7
IMMUNOPATHOLOGY
197
cell did not have an impact of the well being of MVEV-infected DUB mice despite the
slower clearance of infectious virus in the brains of these mice.
7.2.2.4 Effect of total T cells (CD4+ and CD8+) depletion on mortality following
KUNV and MVEV infection in resistant DUB mice
Since a single depletion of either CD4+ or CD8+ T cells did not affect resistant DUB
mice following i.c. MVEV challenge, the depletion effect of both CD4+ and CD8+ T
cells on mouse survival was examined. Two groups of 15 resistant DUB mice were
given both anti-CD4+ and CD8+ antibodies on days -2, 0, 2, 6 and 8 p.i. and challenged
i.c. with KUNV or MVEV on day 0. In addition, two groups of 15 resistant DUB mice,
which received only a virus challenge (KUNV or MVEV) and acted as control groups
were also included. All the mice were monitored for any signs of illness for 40 days p.i.
As expected, the absence of both sets of T cells prolonged the ATD and increased
survival rate in mice infected with KUNV compared to control group mice (Figure 7.9).
Mice did not show any signs of sickness until 11 days after infection. The first deaths
(30%) were recorded 14 days after infection. Later, mortality increased to 70% on day
17 p.i. The remaining mice (30%) did not develop any signs of diseases when monitored
for up to 40 days. Interestingly, although the percentage of survival was similar to the
survival of DUB mice with depleted CD8+ T cells, the ATD was much longer in T cell-
depleted mice, suggesting that both CD4+ and CD8+ T cells acted in concert to induce
morbidity in KUNV-infected DUB mice. The ATD in T cell-depleted mice was day15.3
± 0.5 p.i. (Table 7.3), which varied considerably when compared to control mice, CD4+
T cell-depleted mice and CD8+ T cell-depleted mice (ANOVA, p < 0.007). In contrast,
the brain viral titres in T cell-depleted mice succumbing to KUNV were not
significantly different from CD4+ or CD8+ T cells depleted mice, although they were
remarkably greater than control mice (Student t test, p < 0.001).

CHAPTER 7
IMMUNOPATHOLOGY
198
0
10
20
30
40
50
60
70
80
90
100
1 2 3 4 5 6 7 8 9 10 11 12 13 14 15 16 17 18 19 20
Days post infection
Su
rviv
al (%
)
KUNV
KUNV-CD4
KUNV-CD8
MVEV
MVEV-CD4
MVEV-CD8
Figure 7.7. Effect of CD4+ or CD8+ T cells depletion on mortality of resistant DUB
mice following challenge with KUNV and MVEV.
Fifteen mice were used in each group. Data were pooled from two separate experiments.
0
1
2
3
4
5
6
5 6 7 8 9 10 11 12 13 14
Days post infection
Lo
g1
0 T
CID
50/0
.01g
MVEV
MVEV-CD4
MVEV-CD8
Figure 7.8. Effect of CD4+ or CD8+ T cells depletion on viral titres following
MVEV infection in resistant DUB mice.
At each time point p.i., average values for virus titres were derived from 3 mice.

CHAPTER 7
IMMUNOPATHOLOGY
199
Figure 7.9. Effect of T cells (CD4+ and CD8+) depletion on mortality of KUNV and
MVEV-infected resistant DUB mice.
Fifteen mice were used in each group. Mice were infected with virus only or pre-treated
with both cytotoxic anti CD4+ and anti CD8+ monoclonal antibodies prior to virus
infection. Mice were monitored for any signs of sickness for 40 days.
0
10
20
30
40
50
60
70
80
90
100
1 3 5 7 9 11 13 15 17 19 21 23 25 27
Days post infection
Su
rviv
al (%
)
KUNV
KUNV-T cells
MVEV
MVEV-T cells

CHAPTER 7
IMMUNOPATHOLOGY
200
Table 7.3. Summary on the effect of T cells depletion in DUB mice challenged with
KUNV or MVEV.
Control CD4
depletion
CD8
depletion
CD4/CD8
depletion
KUNV
Survival (%)
0
(0/15)a
0
(0/15)
40
(6/15)
30
(3/10)
ATDb (day p.i) 9.0 1.0 10.4 0.2 12.4 0.7 15.3 0.5
Average viral
titresc (log10
TCID50 units/
0.01g)
0.6 1.0 4.6 0.7 3.3 1.4 3.8 0.8
MVEV
Survival (%)
100
(15/15)
100
(15/15)
100
(15/15)
33
(5/15)
ATDb (day p.i) - - - 22.0 2.8
Average viral
titresc (log10
TCID50 units/
0.01g)
- - - 0d
a Number of mice died/total number of mice
bAverage time to death
c Virus titres were taken from mice that succumbed to the infection
d No virus was detectable by TCID50 bioassay in mice that died from virus infection
except in one mouse which had 4 log10 TCID50 units/0.01g tissue

CHAPTER 7
IMMUNOPATHOLOGY
201
Depletion of both CD4+ and CD8+ T cells also resulted in some deaths in mice infected
with MVEV. However, disease progression was very slow. Mice were healthy and did
not show any signs of sickness until day 14 p.i., when some of them became slightly
hunched. One mouse later suffered from hind leg paralysis and was culled on day 18 p.i.
Some more deaths were recorded later; between days 20 to 27 p.i. However mice that
died between days 20 to 27 p.i. did not show typical signs of illness such as hunched
posture and ruffled fur as seen in susceptible HeJ mice i.c. infected with KUNV or
MVEV as well as resistant DUB mice that succumbed to i.c. KUNV challenge. In fact,
T cell-depleted resistant mice slowly lost weight, did not show interest in eating and
were unusually very inactive. They were eventually culled when they lost about 30% of
the normal body weight. By day 27 p.i., 10 out of 15 mice died and the rest of the mice
survived the infection when monitored for up to 40 days (67% mortality, Kaplan Meier
test, p < 0.0014 when compared to non-treated i.c. MVEV-infected mice). The ATD for
these mice was 22 ± 2.8 days p.i. (Table 7.3). No virus was detectable by TCID50
bioassay in the brains of dying resistant DUB mice except in 1 out of 10 mice (which
died on day 18 p.i.). This mouse had brain virus titres of 4 log10 TCID50/0.01g at the
time of death (Table 7.3).
On day 27 p.i., brains from two i.c. MVEV-infected DUB mice lacking T cells were
harvested and analysed for presence of T cells by flow cytometry. Interestingly,
mononuclear cells isolated from brains of these mice contained 7.22% CD4+ T cells
and 8.32% CD8+ T cells (data not shown). Exact numbers of CD4+ and CD8+ T cells
however could not be enumerated as the total number of cells from these mice was not
determined. Nevertheless, the detection of CD4+ T and CD8+ T cells in these mice at
very late of infection (day 27.p.i.) suggests that virus may be present at a low level
which was undetectable by TCID50 bioassay but inducing recruitment of inflammatory
cells into the brain.
In summary, T cell depletion (both CD4+ and CD8+ T cells) experiment provided
further insight into the role of these inflammatory cells particularly following i.c.
MVEV infection in resistant DUB mice. T cells exhibited a neuroprotection role in
resistant DUB mice during i.c. MVEV infection but the absence of both subsets of T
cells was required in order to elicit an effect on the survival of resistant DUB mice.

CHAPTER 7
IMMUNOPATHOLOGY
202
7.2.3 ANALYSIS OF CYTOKINE PRODUCTIONS
Cytokines are important regulatory proteins that involved in the regulation of the
immune response and inflammation. Deregulation of cytokine production has been
shown to be responsible for many pathological manifestations in viral diseases (Kunzi
and Pitha, 2000). T lymphocytes are required for cell-mediated immune responses and
antibody production. This dual role is controlled by two distinct T-helper (Th) cell
subsets that produce different sets of cytokines (Kunzi and Pitha, 2000). The cytokine
profile defined as Th1 is associated with production of TNFα, IFNγ, IL-2 and IL-12 and
leads predominantly to the cell-mediated immunity. Th2 cytokine profile is associated
with IL-4, IL-6 and IL-10 secretion and leads to the production of virus-specific
antibodies (Kunzi and Pitha, 2000). Since the previous section (Section 7.2.2.3 and
7.2.2.4) demonstrated that T cells were important determinants of the outcome of
infection, the levels of Th1 cytokines (TNFα, IFNγ and IL-2) versus Th2 cytokines
(IL-4 and IL-10) were examined to investigate whether there was a correlation between
particular cytokine profiles and the severity of infection. To achieve this, susceptible
HeJ and resistant DUB mice were challenged i.c. with either KUNV or MVEV and at
selected time points after infection, serum and brains from a minimum of three mice per
group were collected and used to determine the concentration of Th1 and Th2 cytokines,
using a commercial ELISA assay. The brains were prepared as 50% homogenates for
the ELISA assay.
In addition to Th1/Th2 cytokines, brain IFN type I levels were also measured in this
study as this cytokine is part of the earliest host defense mounted during viral infection
and it is also involved in modulating the immune response and regulating production of
other cytokines. IFN type I production was measured only in the brain since neurons are
the major target cell for neuroinvasive flaviviruses and this cytokine is usually released
by infected cells or tissues. However, the assay employed to measure IFN type I levels
was developed in-house and is based on the antiviral property of this cytokine.

CHAPTER 7
IMMUNOPATHOLOGY
203
7.2.3.1 Cytokine productions in susceptible HeJ mice
In the IFN type I bioassay, serial two-fold dilutions of brain homogenates were tested
for the presence of IFN type I on confluent L929 cells prior to EMCV infection. IFN
type I present in the brain homogenates protects L929 cells from EMCV infection and
consequently cell lysis. Brain IFN type I levels were determined on day 3 p.i. and at the
time of death following KUNV or MVEV i.c. challenge. No IFN type I was detected in
the brains of uninfected mice. Brain IFN levels on day 3 p.i. were 7000 ± 600 and 9600
± 1848 I.U./mL in HeJ mice infected with KUNV and MVEV, respectively, (data not
shown) and then increased to 7466.7 ± 2822.0 I.U./mL following i.c. KUNV infection
and 12800.0 ± 0.0 I.U./mL during i.c. MVEV infection at the time of death (Student t
test, p > 0.05, Table 7.4). The increase in IFN type I levels as the infection progressed
coincided with an increase in the brain viral titres (Section 6.2.1.1).
TNFα is a proinflammatory cytokine which is associated with the Th1 cytokine
response but it is not produced by T cells. Commercial ELISA was used to detect this
cytokine. However, due to limited reagents available, only serum and brain TNFα levels
from dying susceptible HeJ mice on were analysed. TNFα was not detected in the sera
of all susceptible HeJ mice tested. In contrast, susceptible HeJ mice i.c. infected with
KUNV had brain TNFα levels of 126.1 ± 38.9 pg/mL while those infected with MVEV
had on average 182.5 ± 17.5 pg/mL TNFα (Table 7.4).
Sera and brain homogenates were collected from susceptible HeJ mice infected with
either KUNV or MVEV on day 3 p.i. and at the time of death (days 5 and 6 p.i.,
respectively) and tested for Th1 cytokines, IFNγ and IL-2. As shown in Table 7.5, IL-2
could not be detected in either the sera or the brain of any of HeJ mice tested. IFNγ was
also not detected in the sera at both time points or in the brains 3 days after infection.
However, brains harvested from mice dying from KUNV challenge (day 5 p.i.) had on
average 612.5 ± 112.5 pg/mL IFNγ (Table 7.4). Notably, significantly greater brain
levels of the same cytokine (Student t test, p < 0.03) were found in susceptible HeJ mice
that died on day 6 after i.c. challenge with MVEV than in moribund susceptible HeJ
mice i.c. infected with KUNV at day 5 p.i. (Table 7.4). Similar to IFN type I and TNFα,
the higher levels of brain IFNγ in MVEV-infected HeJ mice coincided with the higher
replication levels of MVEV compared with KUNV (Figure 6.1).

CHAPTER 7
IMMUNOPATHOLOGY
204
Table 7.4. Cytokine levels in brains of susceptible HeJ mice at the time of death
following infection with KUNV or MVEV.
TNFα IFNαβ* IL-2 IFN* IL-4 IL-10
KUNV
(day 5 p.i)
126.1 ±
38.9
7466.7 ±
2822.0 BD
a
612.5 ±
112.5
178.4 ±
18.4 BD
MVEV
(day 6 p.i)
182.5 ±
17.5
12800.0 ±
0.0 BD
2222.0 ±
542.0
303.8 ±
103.8 BD
Cytokine levels were measured when HeJ mice succumbed to the virus infection; day 5
p.i for KUNV and day 6 p.i for MVEV. IL-2, IFN, IL-4 and IL-10 levels were also
measured in brains on day 3 p.i and in serum on day 3 and day 5/6 p.i; however the
values were below detection. The cytokines were also below detection in uninfected
mice. *The levels of brain IFNαβ and IFN in MVEV-infected mice were significantly
higher than in KUNV-infected mice (Student t test, p < 0.05).
aBelow detection

CHAPTER 7
IMMUNOPATHOLOGY
205
The levels of two major Th2 cytokines, IL-4 and IL-10 were studied in parallel to Th1
cytokine in the same mice. The levels detected were either too low or were below
detection level following challenge with both viruses in susceptible HeJ mice. IL-10
cytokine was below detection level in all samples tested. One of four mice had 50
pg/mL IL-4 in the brain, 3 days after challenge with KUNV virus while none of the
mice infected with MVEV had detectable IL-4. On day 5 p.i, following KUNV
infection, two out of three mice had detectable IL-4. The average values for this
cytokine from these two mice were 44.6 ± 4.6 pg/mL. Similarly, only two out of three
mice that had fatal MVEV infection showed detectable IL-4, although the average
values were slightly higher than that found following KUNV infection (76 ± 26 pg/mL).
Based on a strong production of IFN type I, TNFα and IFNγ following infection with
KUNV and MVEV, it can be concluded that fatal encephalitis induced by KUNV and
MVEV in HeJ mice was associated with a strong Th1 response.
7.2.3.2 Cytokine productions in resistant DUB mice
The levels of the same cytokines were also investigated in the sera and brains of
flavivirus resistant DUB mice after i.c. infection with KUNV or MVEV. The sera and
brain levels of these cytokines (except for IFN type I where only brain samples were
tested) were measured on days 3, 5, 7 and 9 p.i.
IFN type I levels following infection with both viruses showed a similar trend in
resistant DUB mice (Figure 7.10). On day 3 p.i., small amounts of IFN type I were
detected but the values increased sharply on day 5 p.i. following either KUNV or
MVEV infection. Following this, brain IFN type I started to diminish and on day 9 p.i.,
the level of this cytokine was the lowest detected throughout the course of infection.
However, while both viruses induced similar kinetics of IFN type I response, the brain
levels of this cytokine were found to be higher from day 3 to day 7 p.i. during MVEV
infection than KUNV infection. The difference in the amount of IFN type I produced in
MVEV versus KUNV-infected brains on day 3 p.i. was significant (Student t test, p <
0.03). However, on day 9 p.i., MVEV-infected resistant DUB mice had less than half
the amount of IFN type I ( 70.83 ± 16.35 I.U./mL) produced in mice challenged with
KUNV (180 ± 51.47 I.U./mL, the difference was significant, Student t test, p < 0.05).

CHAPTER 7
IMMUNOPATHOLOGY
206
The amount of IFN type I induced following infection with these two viruses seemed to
be in a direct correlation with the virus replication (Chapter 5, Figure 6.1).
TNFα was not detected in sera of any of the mice tested except on day 9 p.i. in mice
infected with MVEV (data not shown). At this time point, MVEV-infected resistant
DUB mice had on average, 57 ± 10.6 pg/mL TNFα in the sera. By contrast, brain TNFα
levels were detected in all mice throughout the infection with both viruses (Figure 7.10).
The amount of this cytokine was the highest on day 3 after infection with both viruses
and then slowly declined as the disease progressed. However, MVEV constantly
induced higher levels of production of this cytokine than KUNV, with the highest
difference detected on day 3 p.i. (Student T test, p < 0.05).
Th1 cytokines, IFNγ and IL-2 were not detected in the mouse sera when tested on days
3, 5, 7 and 9 p.i (Table 7.5). Similarly, IL-2 cytokine was not detected in the brains of
mice challenged with either KUNV or MVEV at the same time points p.i. (Table 7.6).
However, IFNγ was detected in every mouse brain tested following infection with either
of these two viruses 7 and 9 days after infection. The highest levels of IFNγ were
produced on day 7 p.i. and interestingly KUNV induced significantly higher IFNγ levels
than MVEV (3083 ± 282 pg/mL and 1034 ± 217 pg/mL following KUNV and MVEV
challenge respectively (p < 0.0003). On day 9 p.i., the production of IFNγ significantly
diminished in the brains of mice infected with both viruses.
IL-10 (Th2 cytokine) was only detected in the sera of three out of six DUB mice 9 days
after MVEV infection. IL-4 cytokine was detected in a proportion of mice infected with
both viruses. Following KUNV infection, one out of four mice had 24 pg/mL IL-4 3
days after infection. From the sera collected from seven resistant DUB mice i.c. infected
with MVEV, only two had measurable IL-4 at similar time points during infection. In
KUNV-infected mice which had detectable IL-4, the level of this cytokine increased to
85.88 ± 29 pg/mL on day 5 p.i. and then gradually decreased and became undetectable 9
days after infection. A similar trend was also demonstrated following MVEV infection.

CHAPTER 7
IMMUNOPATHOLOGY
207
A B
0
1
2
3
4
5
6
7
8
9
3 5 7 9
IFN
αβ
(IU
x 1
03/m
L)
0
50
100
150
200
250
300
3 5 7 9
TN
Fα
(p
g/m
L)
Days post infection
KUNV MVEV
Figure 7.10. Brain IFNαβ (A) and TNF (B) levels in resistant DUB mice following
infection with KUNV and MVEV.
Average values for brain cytokine levels were derived from 3 mice. Data presented as
average ± standard error. The cytokines were below detection in brains of uninfected
mice.

CHAPTER 7
IMMUNOPATHOLOGY
208
The levels of IL-4 in the brains of infected resistant mice were inconsistent. In addition,
the kinetics of this cytokine production in animals tested positive for IL-4 was parallel
to the kinetics of IL-4 production in the sera. The average amounts of IL-4 in IL-4-
positive animals increased from day 3 p.i. and reached the highest level on day 7 p.i.,
and then slowly declined to below detectable levels on day 9 p.i. following both virus
infections (Table 7.5 and Table 7.6). Thus, KUNV and MVEV induced cytokines with a
strong bias towards Th1 response in resistant DUB mice, similar to the observation in
HeJ mice.
7.2.3.3 Analysis of major IFNγ producing cells in resistant DUB mice
In the above study (Section 7.2.3.1 and 7.2.3.2), it was clearly demonstrated that IFNγ
response was the strongest compared to other cytokines examined. The presence of this
cytokine at the time when resistant DUB mice started to show signs of disease and
succumb to i.c. KUNV infection was quite intriguing. It is possible that IFNγ may have
a role in the pathogenesis of KUNV infection in DUB mice. Therefore, this study was
designed to identify the major cells that produce IFNγ in resistant DUB mice during
KUNV and MVEV infection by using flow cytometry analysis.
Previous data showed that the highest brain IFNγ levels were at day 7 p.i., and hence
this time point was selected to study different cell types that produce IFNγ. It is known
that T cells, NK cells and macrophages are capable of producing IFNγ following
appropriate stimulation. However, since NK cells were shown to have no apparent role
in the pathogenesis of flavivirus (Chambers and Diamond, 2003), NK cells were
excluded from this study. Brain mononuclear cells were harvested from resistant DUB
mice 7 days after virus challenge and then divided into three groups. Two groups were
dually stained for the cell surface marker of TcR (activation marker for T cells) and for
either CD4+ or CD8+ cell surface markers. The third group of cells was stained for
CD11b+ cell surface marker. Following this, intracellular staining for IFNγ was
performed in all groups of cells. Results were evaluated by flow cytometry and cells
were gated for Tcr+/CD4+, TcR+/CD8+ or CD11b+ prior to analysing IFNγ+ cells. The
actual number of cells positive for IFNγ was calculated from the total numbers of
CD4+, CD8+ or CD11b+ cells as the percentage of IFNγ+ cells (obtained from flow
cytometric analysis).

CHAPTER 7
IMMUNOPATHOLOGY
209
As shown in Figure 7.11A, CD11b+ cells were the predominant cell type found in the
brains of KUNV and MVEV-infected DUB mice. The second largest population was
CD8+ T cells and these data were in agreement with the previous quantitative analysis
performed on brain mononuclear cells of infected resistant mice (Section 7.2.1.2).
However, on day 7 p.i. after KUNV and MVEV infection, CD8+ T cells were the main
producers of IFNγ (Figure 7.11B). The numbers of CD8+ T cells that produced IFNγ
were more than 4 times greater than the numbers of IFNγ-producing CD4+ or CD11b+
cells (Figure 7.11B). KUNV infection on average induced slightly higher numbers of
IFNγ+ CD8+ T cells (4.58 ± 0.13 x 10³ cells) than MVEV infection (4.13 ± 0.1 x 10
3
cells). The numbers of CD4+ T cells that produced IFNγ were lower; 1.38 ± 0.4 x 10³
and 1.76 ± 0.13 x 10³ cells in the brains of DUB mice challenged with KUNV and
MVEV, respectively. Interestingly, although CD11b+ cells were the predominant cell
type found in the brain, they were less efficient producer of IFNγ compared to T cells.
However, 1.305 ± 0.37 x 10³ CD11b+ cells produced IFNγ in KUNV-infected mouse
brains, which was significantly higher (p<0.03) than that found after MVEV infection
(0.37 ± 0.07 x 10³ cells). The average of total IFNγ producing cells were 7.2 x 10
3 and
6.2 x 10³ cells found in DUB mice following i.c. KUNV and MVEV challenge,
respectively.
In summary, the data presented here showed that CD8+ T cells were the major
producers of IFNγ in the brains of resistant mice following i.c. infection with either
KUNV or MVEV. This finding bears a great significance and in combination with the
data presented in the previous sections highlights the role of CD8+ T cells in KUNV
pathogenesis in the model of genetically resistant mice. In addition, this finding also
suggests that CD8+ T cells may exert detrimental effect in infected resistant DUB mice
through IFNγ production.

CHAPTER 7
IMMUNOPATHOLOGY
210
Table 7.5. Th1-Th2 cytokines in DUB mouse sera following infection with KUNV
and MVEV.
IFNγ
(pg/mL)
IL-2
(pg/mL)
IL-4
(pg/mL)
IL-10
(pg/mL)
KUNV
d3
-a
-
-
-
-
-
-
-
-
-
24.0
-
-
-
-
-
d5
-
-
-
-
-
-
156.2
156.2
50.0
43.0
-
24.0
-
-
-
d7
-
-
-
-
-
-
-
-
-
-
-
-
85.8
106.8
91.5
61.2
34.5
52.3
33.2
42.2
-
-
-
-
-
-
-
d9
-
-
-
-
-
-
-
-
-
-
-
-
MVEV
d3
-
-
-
-
-
-
-
-
37.8
48.0
-
-
-
-
-
-
-
-
d5
-
-
-
-
-
-
156.2
109.34
-
-
-
-
-
-
-
d7
-
-
-
-
-
-
-
-
-
-
-
-
-
134.0
230.0
134.0
-
23.4
24.0
-
-
-
98.4
98.4
70.4
d9
-
-
-
-
-
-
-
-
-
-
-
-
The cytokines were detected by ELISA and assay sensitivities were 2000-15pg/mL,
200-2pg/mL, 500-4pg/mL and 2000-15pg/mL for IFNγ, IL-2, IL-4 and IL-10,
respectively. The cytokines were also below detection in uninfected mice. Each number
represent sample taken from one mouse. aBelow detection.

CHAPTER 7
IMMUNOPATHOLOGY
211
Table 7.6. Th1-Th2 cytokines in DUB mouse brains following infection with KUNV
and MVEV.
IFNγ*
(pg/mL)
IL-2
(pg/mL)
IL-4
(pg/mL)
IL-10
(pg/mL)
KUNV
d3
- a
-
-
-
-
-
-
-
30.0
-
-
-
-
-
-
-
d5
-
-
-
-
-
-
190.0
169.2
-
68.0
185.0
-
-
-
d7
2880.0
3706.0
2823.0
3278.0
3857.0
1957.0
-
-
-
-
-
-
-
171.0
177.0
-
-
-
55.0
160.0
-
-
-
-
-
-
d9
432.0
458.0
408.0
-
-
-
-
-
-
-
-
-
MVEV
d3
-
-
-
-
-
-
-
-
95.0
-
50.0
30.0
-
-
-
-
d5
-
-
-
-
-
-
105.0
200.0
240.0
-
-
-
d7
632.0
662.0
706.0
1280.0
927.0
2000.0
-
-
-
-
-
-
-
-
-
134.0
230.0
134.0
70.0
105.0
68.0
-
-
-
-
-
-
d9
233.7
433.0
400.0
-
-
-
-
-
-
-
-
-
The cytokines were detected by ELISA and assay sensitivities were 2000-15pg/mL,
200-2pg/mL, 500-4pg/mL and 2000-15pg/mL for IFNγ, IL-2, IL-4 and IL-10,
respectively. The cytokines were also below detection in uninfected mice. Each number
represent sample taken from one mouse. aBelow detection. *IFNγ levels were
statistically different during KUNV versus MVEV infection on day 9 p.i.

CHAPTER 7
IMMUNOPATHOLOGY
212
A
Total number of cells
0
50
100
150
200
250
300
350
400
450
500
CD8+TcR+ CD4+TcR+ CD11b+
Nu
mb
er
of
cells (
x 1
03)
B
IFNγ producing cells
0
1
2
3
4
5
6
CD8+TcR+ CD4+TcR+ CD11b+
Nu
mb
er
of
cell
s (
x10
3)
KUNV MVEV
Figure 7.11. Analysis of IFN producing cells in resistant DUB mouse brains 7 days
after infection with KUNV or MVEV.
(A) Total numbers of brain CD8+ T cells, CD4+ T cells and microglia/macrophages
(CD11b+) isolated from KUNV or MVEV-infected DUB mice (B) Numbers of CD8+ T
cells, CD4+ T cells and microglia/macrophages that produced IFNγ. *Significant
different observed in KUNV induced CD11b+ cells verus MVEV induced CD11b+
cells (Student t test, p < 0.03)
*

CHAPTER 7
IMMUNOPATHOLOGY
213
7.3 DISCUSSION
Disease severity is a function of either a direct virus-induced cytopathology and/or a
virus triggered excessive or inappropriate immune response (Brehm et al, 2004). In the
previous chapter (Chapter 6), histological analysis of brain tissue sections harvested
from KUNV and MVEV-infected susceptible and resistant mice suggested that the
extent of brain inflammation is in a direct correlation with the virus strain but not with
the outcome of disease. However, this information is rather general and in order to
obtain a better insight into the critical factors that dictate the severity of infection, a
more detailed analysis targeting specific mononuclear cell subtypes recruited into the
infected brains was carried out. In this chapter, a more sensitive approach utilising flow
cytometry was used to quantify four types of inflammatory cells, CD4+ T cells, CD8+ T
cells, B cells and CD11b+ cells.
It was shown in this study (Section 7.2.1.2) that i.c. MVEV challenge resulted in greater
numbers of inflammatory cells (in total) recruited into the brains of infected susceptible
HeJ and resistant DUB mice than KUNV infection. This was in agreement with the
histopathological studies as described in the preceding chapter. However, interestingly,
the quantities of specific mononuclear cell subtypes recruited to the mouse brains were
different during different flavivirus infections. While KUNV caused more infiltration of
CD8+ T cells to the brains of susceptible HeJ and resistant DUB mice, MVEV induced
greater recruitment of CD4+ T cells, B cells as well as CD11b+ cells.
Although greater brain tissue inflammation was observed and more brain mononuclear
cells were isolated from KUNV and MVEV-infected susceptible HeJ mice at the time of
death than from infected resistant DUB mice from day 6 to day 9 p.i., the numbers of
brain CD4+, CD8+ and B cells were at least 10 times lesser in susceptible HeJ mice.
More importantly, T cells, B cells and CD11b+ cells that were isolated from the brains
of susceptible HeJ mice represented only approximately half of the total cells infiltrating
the brains of HeJ mice. The identity of the remaining infiltrating cells in HeJ mouse
brains is unknown and should be further investigated. However, the possibility is that
NK and polymorphonuclear cells may accumulate in the brains of susceptible HeJ mice
more readily than in resistant DUB mice during KUNV and MVEV infections. Brain
NK cells were shown to be pathogenic during virulent Semliki Forest infection in
C57BL/6J mice (Alsharifi et al, 2006).

CHAPTER 7
IMMUNOPATHOLOGY
214
A considerable numbers of research have been conducted recently to elucidate the role
of CD8+ T cells in flavivirus infection of susceptible hosts (reviewed in Chambers and
Diamond, 2003; An et al, 2004). Because of this, functions and implications of CD8+ T
cells in flavivirus infections are better understood than CD4+ T cells. CD8+ T cells
were shown to have a neuroprotective role during infection with WNV New York strain
and low doses of WNV Sarafend (Shrestha and Diamond, 2004; Wang et al, 2003b). In
contrast, CD8+T cells contribute to the pathogenesis of WNV Sarafend when mice were
infected at high doses (Wang et al, 2003b). In this study it was found that the greater
numbers of CD8+ T cells present in KUNV-infected susceptible mice compared to that
observed in MVEV-infected HeJ mice did not contribute to either protection or
pathogenesis of KUNV, as determined by the CD8+ T cells depletion study (Figure 7.6
and Table 7.3). CD8+ T cell-depleted susceptible HeJ mice had similar rate of
susceptibility to i.c. KUNV infection as control susceptible HeJ mice. Thus, this
suggests that susceptible HeJ mice succumb to i.c. KUNV infection because of a direct
virus infection with unrestricted replication in the CNS and CD8+T cells seem not to
contribute to the severity of KUNV infection. In contrast, absence of CD8+ T cells
rendered MVEV-infected HeJ mice more susceptible to the infection, demonstrated by
the shorter ATD (one day earlier). Since T cells have no significant
immunopathological role in susceptible HeJ mice, it would be interesting in future to
determine other inflammatory cells that could contribute to the fatal encephalitis caused
by KUNV and MVEV.
Although a slight protective role of CD8+ T cells against MVEV infection in HeJ mice
was in agreement with the role of CD8+ T cells in the host defence against WNV NY
strain and low doses of WNV Sarafend infection (Shrestha and Diamond, 2004; Wang
et al, 2003b), the mechanism by which CD8+ T cells contribute to the control of disease
severity following MVEV infection in susceptible HeJ mice is unknown. Contrary to
the previous reports which suggest that CD8+ T cells play essential role in controlling
and clearing flavivirus infection (Shrestha and Diamond, 2004; Wang et al, 2003b), in
this current study, the lack of CD8+ T cells did not affect brain virus titres in
susceptible HeJ mice.
Virus-specific CD4+ T cells have disparate roles in flavivirus infection, depending on
the model of infection used. For instance, the lack of CD4+ T cells does not increase

CHAPTER 7
IMMUNOPATHOLOGY
215
susceptibility of mice to DENV infection (Shresta et al, 2004). In contrast, CD4+ T
cells are important for priming memory CD8+ T cells during YFV infection in mice
(Liu and Chambers, 2001). Recently, CD4+ T cells have been suggested to have
immunoprotective role by sustaining antibody production and effector CD8+ T cells in
the CNS during the infection with WNY NY strain in susceptible C57/BL6 mice (Sitati
and Diamond, 2006). The absence of CD4+ T cells resulted in persistent WNV infection
in the brain and consequently 100% mortality of infected susceptible C57/BL6 mice
while only 30% of control C57/BL6 mice died from WNV infection (Sitati and
Diamond, 2006). In contrast, data presented in this chapter suggest a slight detrimental
effect of CD4+ T cells in susceptible HeJ mice following i.c. challenge with KUNV and
MVEV. Twenty percent of KUNV or MVEV-infected HeJ mice lacking CD4+ T cells
had a delayed death (a day later compared to control mice) (Figure 7.6 and Table 7.3).
However, since only a small numbers of susceptible HeJ mice involved in CD4+ T cell
depletion experiment (5 mice), this study should be repeated in future to allow statistical
analysis of the experiment.
Previously published studies have demonstrated that resistant and susceptible mice
mount immune responses with similar kinetics and extent (reviewed in Brinton and
Perelygin, 2003). As the flavivirus resistance gene only restricts virus replication and
spread, an intact immune response is usually required to clear the virus from an infected
host. If the virus is not cleared, resistant mice generally will die from the infection
(reviewed in Brinton and Perelygin, 2003). However, this conclusion was derived from
a limited number of studies using selected flaviviruses in resistant RV mice (Goodman
and Koprowski, 1962a; Bhatt and Jacoby, 1976). It was shown that immunosuppression
of i.p. Banzi-infected RV mice with treatments such as x-irradiation, cyclophosphamide
or thymectomy decreased their survival time (Bhatt and Jacoby, 1976). Interestingly,
cyclophosphamide did not change the ATD in i.c. Banzi-infected resistant RV mice,
suggesting that inoculation route may influence the beneficial or detrimental role of the
host antiviral reaction. Unfortunately, no further studies have been performed to look at
the role of specific immune cells in preventing or contributing to fatal encephalitis in
flavivirus resistant mice.
Quantitative analyses showed that MVEV induced almost similar numbers of CD4+ and
CD8+ T cells throughout the course of infection in resistant DUB mice (except on day 5
p.i.). In contrast, CD8+ T cells were about double or triple the numbers of CD4+ T cells

CHAPTER 7
IMMUNOPATHOLOGY
216
following KUNV challenge (from day 7 to 9 p.i.) (Figure 7.3). Contributing factors that
lead to the different polarisation of recruited lymphocytes are unknown and requires
further studies. Chemokines and cytokines are known to be crucial for signalling and
recruiting lymphocytes to the infected areas (Kunzi and Pitha, 2000). Neuronal
CXCL10 chemokine for instance, directs CD8+ T cell recruitment to the brain during
WNV infection (Klein et al, 2005). In this current study, the levels of proinflammatory
cytokines during i.c. KUNV versus MVEV infection in resistant DUB mice were
different (to be discussed later) but the beneficial or damaging effect of these cytokines
and their involvement in recruiting peripheral inflammatory cells are yet to be
determined. Additionally, while the numbers of CD4+ T cells increased over time
following both virus infections, CD8+ T cell numbers decreased after MVEV infection
but did not vary significantly during the course of KUNV infection in resistant DUB
mice (except on day 5 p.i.). Activated T cells migrating to the brain parenchyma usually
are not retained in the CNS unless contact with antigen is maintained (Kimura and
Griffin, 2003). Thus, the possibility exists that the low levels of infectious virus or
virus antigen were responsible for attracting and sustaining these inflammatory cells,
particularly CD8+ T cells in the brains of resistant DUB mice 9 days after KUNV
infection.
The decline in the total numbers of splenocytes during the course of KUNV and MVEV
infection in resistant DUB mice coincided with the increased numbers of lymphocytes
in the brain (Figure 7.1). This strongly implicated cell migration from the spleens to the
brains, as opposed to extensive local cell division within the CNS, as the major source
of lymphocytes accumulation in the brain. Intriguingly, as observed in the brains, there
were higher numbers of splenocytes isolated from MVEV-infected resistant DUB mice
than from KUNV-infected mice. The reason for such occurrence is unknown although it
is possible that KUNV may induce apoptosis of splenocytes in infected resistant DUB
mice.
The prevalence of T cells in the brain particularly late in infection usually is an
indication of their role in the recovery or severity of diseases in flavivirus infection. In
this study, KUNV induced-T cells have been demonstrated for the first time to have an
immunopathological role and to be involved in the fatal disease of resistant DUB mice.
More importantly, CD8+ T cells were shown to play a larger part on the development of
lethal encephalitis than CD4+ T cells during i.c. KUNV infection in resistant DUB

CHAPTER 7
IMMUNOPATHOLOGY
217
mice, probably due to the greater numbers of CD8+ T cells recruited into the brain than
CD4+ T cells (Figure 7.6). This was apparent by the delayed ATD as well as higher
survival rate of CD8+-depleted resistant DUB mice than control DUB mice or CD4+-
depleted DUB mice (Table 7.3). It is worth noting here that although prolonged ATD
was observed in KUNV-infected resistant DUB mice lacking CD4+ or CD8+ T cells,
these mice had significantly greater brain viral burdens at the time of death than dying
control resistant DUB mice infected with KUNV only. This suggests that a) cellular
immunity is important in clearing flavivirus infection, which is in agreement with other
studies (Wang et al, 2003b; Shrestha and Diamond, 2004) and b) high viral titres alone
in the absence of CD4+ and CD8+ T cells could not promote fatal disease in KUNV-
infected resistant mice.
Another important finding of this study was that depletion of both CD4+ and CD8+ T
cells promoted longer survival time of resistant DUB mice than a transient loss of a
single subset of T cells during i.c. KUNV challenge (Figure 7.9). This suggests that
immunopathological role of CD4+ and CD8+ T cells were not redundant during i.c.
KUNV infection in resistant DUB mice as depletion of total T cells had a synergistic
effect on the average survival time. However, T cell depletion could not prevent
complete death of KUNV-infected resistant DUB mice as 70% of mice lacking both T
cells subsets eventually succumbed to the infection, indicating that there were other
factors involved in the pathogenesis of KUNV.
Unexpected yet interesting findings were obtained during i.c. MVEV challenge in
resistant DUB mice lacking either CD4+ or CD8+ T cells. Depletion of either CD4+ or
CD8+ T cells alone did not render these animals susceptible to MVEV infection at all
(Figure 7.7). This suggests that the lack of either CD4+ or CD8+ T cells was not critical
for neuroprotection of DUB mice against MVEV.
Interestingly, when infectious MVEV was cleared from the brains of control infected
resistant DUB mice on day 9 p.i., CD4+ T cell-depleted as well as CD8+ T cell-
depleted DUB mice still had relatively high brain viral titres despite the absence of any
sign of sickness (Figure 7.8). Similar to that observed during i.c. KUNV challenge,
these results further implicate the presence of additional factors, in addition to virus
titres, that are required to promote fatal disease in resistant DUB mice following i.c.
flavivirus challenge. Mice depleted of CD4+ and CD8+ T cells eventually cleared

CHAPTER 7
IMMUNOPATHOLOGY
218
MVEV in the brain on day 14 p.i. by which time these cells repopulated the brain.
Alternatively, following the absence of one T cell subset (such as CD4+ T cells), the
other subset of T cells (such as CD8+ T cells) together with the Flvr-like gene probably
acted in concert to reduce and eventually clear MVEV from the infected brains although
not as efficiently as when both subsets of T cells were present.
In contrast, the absence of both CD4+ and CD8+ T cells (all T cells) resulted in resistant
DUB mice to be highly susceptible to i.c. MVEV challenge (Figure 7.9) (67% mortality
rate). On average, the death of these mice occurred on day 22 p.i., which was 7 days
longer than KUNV-infected DUB mice that received similar treatment. Although only
one out of ten sick MVEV-infected DUB mice had a detectable brain virus titre, it is
possible that all resistant DUB mice that succumbed to MVEV infection following
depletion of T cells still had a low presence of infectious virus which was undetectable
by TCID50 bioassay. Alternatively, virus antigen rather than the infectious virus may
present in the brains of these mice. This was supported by the analysis of mononuclear
cells isolated from two mice that died on day 27 p.i. In these mice, CD4+ and CD8+ T
cells were still detected at the time of death. The recruitment and maintenance of
peripheral immune cells in the brain parenchyma occurs typically in the presence of
virus since T cells are rarely retained in the brain unless they are in contact with the
virus antigen. Due to the lack of T cells to clear the virus early, it is possible that MVEV
was retained for a prolonged period of time and this may have caused some functional
damage to the CNS cells especially the neurons. When the effect of depleting antibodies
diminished and T cells re-entered the brain, the host adaptive immune response might
be too late to prevent fatal disease outcome. In fact, T cells recruited at a very late stage
in infection may be immunopathogenic and could exacerbate the course of MVEV
infection in T cell-depleted resistant DUB mice. Signs of diseases displayed in T cell-
depleted resistant DUB mice following MVEV infection were different to those
typically shown by susceptible HeJ mice suffering from flavivirus-induced encephalitis.
The lack of interest in feeding, lethargy and weight lost also further suggests that in the
sick resistant DUB mice, normal neuronal functions in certain parts of the brain were
affected.
Experimental work conducted in this chapter put an emphasis on the role of T cells
during the challenge with two flaviviruses. However, it should be mentioned here that
brain CD11b+ cells were the predominant mononuclear cells found during MVEV and

CHAPTER 7
IMMUNOPATHOLOGY
219
KUNV challenge in both strains of mouse. The numbers of these cells were about 10
times more than the other identified leucocytes. Future studies perhaps should be
carried out to further characterise CD11b+ cell population during different flavivirus
infections in different mouse strains since various cells including microglia,
macrophages and neutrophils are known to express CD11b+ cell surface markers.
Resting microglia and activated microglia/recruited macrophages can be distinguished
by the level of expression of cell surface marker CD45 (Sedgwick et al, 1991). While
resting microglia express CD45low
/CD11b+, activated microglia and recruited
macrophage can be readily identified by CD45high
/CD11b+ surface marker expression
(Ford et al, 1995). In addition, dual staining of CD11b+ and GR1 cell surface markers
would help to identify neutrophils. These cells have been implicated in the pathogenesis
of MVEV strain 3749 in weanling Swiss mice since depletion of neutrophils coincides
with prolonged survival time and decreased mortality (Andrews et al, 1999). TNFα was
thought to be responsible for triggering the production of neutrophil-attracting
chemokines in these mice. Since TNFα was detected in infected HeJ and DUB mice
(see later), neutrophils could be present in the brains of HeJ and DUB mice during
KUNV or MVEV infection.
Development of lethal encephalitis in susceptible HeJ mice during KUNV and MVEV
infection coincided with high production of Th1 and proinflammatory cytokines
(Section 7.2.2.2). However, MVEV induced greater levels of IFN type I, TNFα and
IFNγ than KUNV in the brains of susceptible HeJ mice at the time of death, probably
due to the greater levels of brain MVEV titres in these mice. TNFα can induce
expression of adhesion molecules and chemokine synthesis in cerebrovascular
endothelial cells and astrocytes. This in turn will facilitate leucocyte extravasation and
recruitment in the CNS (Aloise, 2001). In agreement with this, as shown in Chapter 5,
stronger brain inflammation was observed in MVEV-infected HeJ mice compared to
KUNV-infected mice. However, the reason for greater levels of IFNγ during i.c. MVEV
challenge in susceptible HeJ mice is unknown, given that less brain CD8+ T cells were
detected in these mice compared to KUNV-infected HeJ mice.
Following i.c. inoculation of KUNV and MVEV in resistant DUB mice, an elevated
production of IFN type I and TNFα were detected early in the infection and then they
gradually reduced over time, which paralleled virus reduction or clearance (Section
7.2.3.1). The secretion of TNFα as early as day 3 p.i., in advance of any histologic

CHAPTER 7
IMMUNOPATHOLOGY
220
evidence of brain inflammation suggested that intrinsic CNS cells particularly microglia
were the main producers of TNFα. Furthermore, astrocytes and neurons have been
reported to be capable of producing TNFα (Munoz-Fernandez and Fresno, 1998).
Similar to that observed in HeJ mice, greater levels of brain IFN type I and TNFα
productions were seen in MVEV-infected DUB mice which may be responsible for the
more vigorous brain tissue inflammation demonstrated in DUB mice infected with this
virus than KUNV. In contrast, KUNV infection induced higher IFNγ production in
resistant DUB mice (Section 7.2.3.2). The detection of IFNγ in the brain tissue but not
in the sera indicated that effector function of T cells was only acquired in the brain (at
the site of infection within the CNS). The greatest IFNγ levels were observed on day 7
p.i. when KUNV-infected DUB mice started to show signs of diseases and production
of this cytokine reduced dramatically on day 9 p.i. when mice succumbed to the
infection.
CD8+ T cells were demonstrated to be the major IFNγ producing cells on day 7 p.i.
during i.c. KUNV and MVEV challenge in resistant DUB mice (Section 7.2.3.3). CD4+
and CD11b+ cells were also capable of producing IFNγ, albeit less efficient. This could
be an indication of the immunopathogenic role of this cytokine. It is possible that T
cells, particularly CD8+ T cells, participated in the development of lethal KUNV
infection through IFNγ production. However, further work using IFNγ neutralising
antibodies or resistant DUB mice deficient in functional IFNγ during KUNV or MVEV
i.c. challenge could confirm the function of T cells in resistant DUB mice.
In addition to IFNγ, another effector function of CD8+ T cells is cytolysis. Killing of
the target cells by Tc cells occurs primarily via the granule exocytosis pathway or the
Fas-Fas ligand mechanism. Antigen-specific killing by CD8+ T cells requires the
migration of lymphocytes to the site of infection. Shrestha and Diamond (2004) showed
that killing of target cells occurs by perforins during infection with WNV NY strain. In
contrast, during WNV Sarafend infection, the survival of mice is partially dependent on
exocytosis and/or Fas-mediated cytolytic activity (Wang et al, 2004b). However, both
findings strongly suggested that the virus clearance following flavivirus infection partly
contributed by the cytolytic mechanism of T cells. Initial study conducted in our lab
(data not shown) indicates that MVEV infection in resistant mice induced earlier
cytolytic activity compared to KUNV infection. This may contribute to early clearance
of infectious MVEV in resistant DUB mice.

CHAPTER 7
IMMUNOPATHOLOGY
221
The MHC molecule expression on CD11b+ cells from infected DUB mice was
examined from day 5 p.i. onwards (Section 7.2.1.3). The up-regulation of this cell
surface molecule can be induced by IFN type I, IFNγ as well as TNFα. Early in
infection, MHC molecule expression is induced by IFNαβ while later in the infection,
expression of these molecules is maintained by IFNγ (Kunzi and Pitha, 2000). In
addition, flaviviruses are capable of inducing expression of MHC class I molecules
independent of cytokines (King et al, 2004). Since levels of these cytokines and brain
viral titres were different in DUB infected with KUNV and MVEV, MHC molecule
expression in these mice was expected to be different. However, it is not clear why
CD11b+ cells isolated from MVEV-infected DUB on day 5 p.i. had a minimal MHC I
expression, since the levels of brain proinflammatory cytokines (IFNαβ and TNFα) and
viral titres were higher in these animals than in KUNV-infected DUB mice.
Unfortunately, the data were generated from a single experiment and needs to be
repeated. However, the greater levels of MHC molecules expression on CD11b+ cells
from KUNV-infected DUB mice than MVEV-infected DUB mice seemed to directly
correlate with the higher numbers of CD8+ T cells recruited to the brains of KUNV-
infected DUB mice.
The level of MHC I up-regulation in infected resistant DUB mice was initially
monitored in parallel with the immunostaining of viral antigens experiment.
Unfortunately, the latter analysis aimed at investigating the presence of viral antigen in
brain macrophages/microglia failed due to technical problems. Although previous
studies indicated that neurons are the preferential site of replication for flaviviruses and
that microglia could not be infected in vitro, this does not exclusively preclude the
ability of flavivirus to infect CD11b+ cells at a very low level.
In conclusion, the data presented in this chapter indicate that i.c. infection with KUNV
or MVEV induced recruitment of different types of host immune cells that may result in
the engagement/activation of different pathways of pathogenesis/viral clearance of these
flaviviruses in susceptible HeJ and resistant DUB mice. Several major findings of the
study described in this chapter were: 1) KUNV induced greater recruitment of CD8+ T
cells into the brains of infected susceptible and resistant mice than MVEV, which
coincided with the development of severe infection 2) CD8+ T cells had
immunoprotective role in MVEV-infected HeJ mice since the absence of CD8+ T cells
CHAPTER 7
IMMUNOPATHOLOGY
222
induced earlier deaths in these mice 3) However, direct CNS viral replication was more
likely to have a larger contribution to fatal encephalitis in susceptible HeJ mice
following i.c. KUNV or MVEV challenge than T cell accumulation 4) CD8+ T cells
had a greater contribution than CD4+ T cells to KUNV-induced immunopathological
disease in resistant mice 5) T cells were pivotal in flavivirus clearance from brains of
infected resistant mice although the presence of high viral titres did not always coincide
with the fatal disease outcome 6) KUNV induced a significantly greater production of
brain IFNγ than MVEV in resistant mice at later time p.i. and this cytokine was
produced predominantly by CD8+ T cells, highlighting the immunopathological role of
CD8+ T cells in KUNV infection. Combined, these findings confirmed the dual role of
T cells particularly CD8+ T cells in flavivirus infection, depending on various factors
including the virus and mouse strain used (Wang et al, 2003b; Shrestha and Diamond,
2004). It remains to be elucidated what other elements of the host antiviral immunity
that could also have a role in the death of these mice.

CHAPTER 8
GENERAL DISCUSSION
223
8.0 CHAPTER 8: GENERAL DISCUSSION
The ratio of apparent to inapparent infections following flavivirus infection in humans is
quite low, suggesting that the complex interaction between the virus and the host that
could result in a poor outcome of infection only occurs in a small number of cases
(reviewed in Chambers and Diamond, 2003). In this study, 3 flaviviruses, KUNV,
MVEV and WNV and two congenic mouse strains, flavivirus susceptible HeJ and
resistant DUB mice were used to study these interactions that could act in many discrete
ways to produce different outcomes of infection or severity of diseases (Solomon and
Mallewa, 2001).
Laboratory mice were shown to develop encephalitis following flavivirus infection,
similar to that observed in humans (Sabin, 1954; reviewed in Urosevic and Shellam,
2002). Because of this, they have been used as a small animal model to study the
pathogenesis of flavivirus-induced encephalitis. Most laboratory mouse strains are
susceptible to flavivirus infections whereas resistance is prevalent in wild type mice
(reviewed in Urosevic and Shellam, 2001). This resistance is conferred by a single
autosomal dominant gene which is known as Flv (Sabin, 1952b; Green, 1989). To study
the mechanism of resistance, several congenic mouse strains have been developed by
introducing resistance genes from wild mice into the genetic background of susceptible
HeJ mice (Sangster et al, 1993; Urosevic et al, 1999). Two strains of resistant mice,
MOLD and DUB were developed in this laboratory and they were shown to express
different degrees of resistance to flavivirus infection (Urosevic et al, 1999).
Protection conferred by the flavivirus resistance gene is known to be incomplete since
several flaviviruses have been shown to induce fatal encephalitis in flavivirus resistant
mice when infected by the i.c. route (Shueb et al, 2005; Sabin, 1954; reviewed by
Brinton and Perelygin, 2003). However, the cause of death of these resistant mice has
never been elucidated. This project was designed to identify molecular and cellular
factors responsible for the development of fatal disease in resistant mice following i.c.
infection with KUNV. In addition, the pathogenicity of KUNV was compared to the
pathogenicity of two other closely related flaviviruses, MVEV and WNV in susceptible
HeJ and resistant DUB mice during i.p. and i.c. challenge.

CHAPTER 8
GENERAL DISCUSSION
224
In the early part of this study, in vivo and in vitro characterisation of KUNV, MVEV
and WNV was carried out. As shown in Chapter 4, KUNV was non-neuroinvasive in
adult susceptible HeJ and resistant DUB mice although it could induce high morbidity
in young HeJ mice during i.p. infection. In contrast, a high mortality was observed
following i.c. inoculation in both strains of mice and in fact, KUNV was the most
neurovirulent virus compared with WNV to resistant DUB mice. Meanwhile, WNV
displayed neuroinvasiveness only in HeJ mice but was neurovirulent to both strains of
mice tested. Interestingly, i.p. and i.c. MVEV challenge resulted in high mortality of
susceptible HeJ mice. However, MVEV did not induced severe disease in DUB mice
during i.c. infection. Combined with data from in vitro characterisation of similar
viruses (to be discussed later), it was demonstrated here that each of the flaviviruses
used in this study ‘favoured’ a different mouse strain or model of infection, which is a
remarkable finding. While MVEV is highly virulent to susceptible HeJ mice, KUNV
and WNV display higher virulence/tropism for DUB mice and cell cultures,
respectively.
KUNV was not neuroinvasive in adult HeJ mice and it did not induce death during i.p.
inoculation despite various treatments used to modulate macrophage response or alter
BBB permeability in adult mice. Some investigators have suggested that a glycosylation
of the E protein is an important determinant of the flavivirus neuroinvasiveness (Shirato
et al, 2006). The exact mechanism related to the E protein glycosylation-associated
neuroinvasion is not known but it may be due to the increased binding of virus to the
cell receptors and its greater penetration into the cells resulting in enhanced viral
infectivity (Chambers and Diamond, 2003). Thus, possibly, KUNV may be unable to
replicate efficiently in peripheral tissues compared with WNV, leading to the lack of
neuroinvasiveness of this virus. Alternatively, the E protein glycosylation may increase
virus virulence indirectly, by enhancing the vulnerability of the infected host as
suggested by Shirato and co-workers (2006). These investigators have recently
demonstrated that a glycosylated variant of WNV induced higher serum TNFα levels
than non-glycosylated virus (Shirato et al, 2006) and this cytokine has been linked to
BBB breaching leading to early viral invasion into the brain (Wang et al, 2004a).
KUNV MRM16 was previously shown to be a non-glycosylated virus while WNV
Sarafend carries a glycosylated E protein (Scherret et al, 2001). However, the
glycosylation status of the same viruses used in the project is unknown since the number

CHAPTER 8
GENERAL DISCUSSION
225
of laboratory passages could affect this. It remains to be investigated whether the
observed different neuroinvasiveness of KUNV and WNV is caused by this feature.
In addition to innate resistance to flaviviruses, other host factors could also contribute to
the severity of disease following virus infection. One of the most crucial steps leading to
fatal encephalitis is the virus invasion of the brain. The mechanisms that allow
flaviviruses to enter the brain involve either breaching the BBB or evading it. Since
breaching of the BBB is considered the major mechanism of viral entry into the brain,
transient change in the BBB permeability after SDS treatment was examined in mice.
As shown in Chapter 4, SDS treatment rendered adult HeJ mice more susceptible to i.p.
WNV and MVEV infection although this was only observed when SDS was given 2 or
3 days after infection. In addition, this treatment also exacerbated the course of KUNV
infection in young HeJ mice.
The activation of macrophages is a critical step in the early non-specific defense against
many viral infections (Guidotti and Chisari, 2001) and therefore, these cells represent a
very important factor in determining the outcome of infection. Studies have shown that
the absence of macrophages renders animals highly susceptible to viral infections (Ben-
Nathan, 1996). Accordingly, a single injection of liposome encapsulated clodronate
aimed at transient depletion of macrophages very early in the infection (but not
throughout the course of infection) resulted in increased mortality rate and rapid ATD in
HeJ mice during i.p. WNV infection (Chapter 4). This suggested that the initial control
of WNV replication by macrophages is crucial for reducing severity of infection. The
lack of macrophages may allow early viraemia and consequently early virus invasion of
the CNS.
It was shown in this study that macrophages could also be pathogenic in HeJ mice
during i.p. WNV challenge, thus further supporting earlier findings in this laboratory
regarding the dual roles of macrophages during certain flavivirus infections (Pantelic,
2004). Monocytes/macrophages are known to be the principal site of replication for
DENV and they have important roles in DENV pathogenesis through the antibody-
dependent enhancement of infection and production of cytokines/chemokines (Chen and
Wang, 2002; Cardosa et al, 1986; Gollins and Porterfield, 1984). With other
flaviviruses, it is yet to be determined which peripheral tissues or organs are important
sites of viral replication, and whether the magnitude of viral production in these tissues

CHAPTER 8
GENERAL DISCUSSION
226
determines viral invasion of the CNS (reviewed in Chambers and Diamond, 2003). In
vitro and in vivo studies in this project indicated that macrophages could support WNV
replication and consequently, these cells could contribute to the pathogenesis of this
flavivirus in HeJ mice (Chapter 4 and Chapter 5). Thioglycollate injection significantly
increased the availability of permissive cells in the peritoneum (peritoneal
macrophages) (Pantelic, 2004) and consequently, exacerbated the severity of disease in
i.p. WNV infected-HeJ mice, as shown by the 100% death and shorter survival time
compared with control mice (Chapter 4). When thioglycollate-elicited macrophages
were isolated and cultured for in vitro characterisation of WNV, KUNV and MVEV, it
was demonstrated that WNV has a better infectibility in these cells than the other two
flaviviruses (Chapter 5). This was evidenced by the higher WNV titres in thioglycollate-
elicited macrophage cultures. In addition, in vitro WNV infection of these cells elicited
higher levels of TNFα production three days after infection than KUNV and MVEV
infection. This proinflammatory cytokine, as previously mentioned, can facilitate viral
invasion of the CNS by increasing the BBB permeability (Wang et al, 2004a). Similar
high infectibility of WNV has also been shown during in vitro infection in monocytes
and monocyte-derived macrophages may be an indication that monocytes/macrophages
could also be infected in vivo and be transmitted to other persons through blood
transfusion (Rios et al, 2006). From in vivo and in vitro studies, it can be postulated that
the increased incidence of fatal encephalitis in thioglycollate-treated susceptible HeJ
mice was due to the greater numbers of WNV-infected cells present in the peritoneum
of these mice. Consequently, this may induce higher and early viraemia as well as
higher serum TNFα production compared to control WNV-infected mice. The
increased TNFα production may have occurred around the same time as viraemia (2-3
days p.i), thus these two possibly act synergistically to cause a more severe disease
outcome.
The pathogenic role of macrophages following WNV infection in susceptible HeJ mice
was further supported by the adoptive transfer of infected thioglycollate-elicited
macrophages (Chapter 5). Similar to thioglycollate pretreatment, adoptive transfer of
WNV-infected macrophages also increased mortality and decreased ATD in HeJ mice.
Therefore, in human infections, although DCs are infected and responsible for
transporting virus to the lymph nodes following natural infection via mosquito bites,
macrophages may still have an important contribution to the dissemination of
flaviviruses and subsequent development of flavivirus-induced encephalitis. The

CHAPTER 8
GENERAL DISCUSSION
227
flavivirus-infected monocytes/macrophages then could migrate from the blood into the
peripheral tissues and the CNS, disseminating the virus throughout the body and
contributing to local tissue inflammation. Combined, in vivo and in vitro data clearly
indicate that macrophages play an important role in the pathogenesis of WNV in
susceptible mice during i.p. challenge. In contrast, their role in KUNV and MVEV
infection appears to be less significant.
Thioglycollate-elicited macrophages differ from resident peritoneal macrophages in
terms of types of cell population, activation state as well as morphology. While the
resident peritoneal macrophages are relatively homologous cell populations, mainly
consisting of mature macrophages, the thiogycollate-elicited macrophages are
heterogeneous cell populations which include immature, inflammatory macrophages
recruited from the circulating and marginal pools (van Furth, 1981). Thus, although it
was shown in this study that among thioglycollate-elicited macrophages, there are cells
that could support flavivirus infection, particularly WNV, it is not known what
particular macrophage sub-types could act as ‘Trojan Horses’ to disseminate the virus to
other organs. Previous work in this laboratory was conducted to look at the
permissiveness of different tissue macrophages to WNV infection (Pantelic, 2004).
While alveolar and bone marrow-derived macrophages have low susceptibility, resident
peritoneal macrophages can support WNV replication (Pantelic, 2004). Data from this
current study clearly suggested that in addition to the resident peritoneal macrophages,
thioglycollate treatment elicits additional cells that could play a role in distributing
WNV to other peripheral tissues and the brain.
One of the important findings of this study was that the resistance of DUB mice to i.p.
infection with WNV was not affected by any of the various treatments used in this
project to modulate the host non-specific immunity (macrophage), acquired immunity
(T cell) or the integrity of BBB. Treatments with thioglycollate (macrophage
enrichment in peritoneum), clodronate (macrophage depletion), SDS or LPS (breaching
of BBB), and depletion of CD4 and CD8+ T cells did not induce morbidity in resistant
DUB mice following i.p. WNV challenge most probably because the flavivirus
resistance gene is expressed in the peripheral tissues. This led to the unavailability of
highly permissive cells/tissues to support flavivirus replication and hence highlighting
the dominant role of Flvr gene over other host defense mechanisms in the protection of
i.p. flavivirus infection.

CHAPTER 8
GENERAL DISCUSSION
228
The second part of this project was focused on identifying underlying mechanisms that
could contribute to the outcome of infection during i.c. KUNV and MVEV in
susceptible HeJ and resistant DUB mice. Although KUNV was not neuroinvasive, i.c.
infection of this virus resulted in high incidence of fatal encephalitis of susceptible HeJ
and resistant DUB mice. HeJ and DUB mice succumbed to i.c. KUNV infection on day
5 and day 9 p.i., respectively. In contrast, i.c. MVEV inoculation only caused morbidity
to susceptible HeJ mice (died on day 6 p.i.) but not to resistant DUB mice. Although
incomplete protection in flavivirus resistant mice during certain i.c. flavivirus infections
have been reported earlier (Sabin, 1954; reviewed in Brinton and Perelygin, 2003,
Shueb, 2002), the cause of death of these mice has never been fully elucidated.
It was shown in this study that different factors were associated with the death of
susceptible and resistant mice during i.c. infection. This finding is significant since it
suggests that different pathogenic pathways are involved in different mouse strains
although similar fatal encephalitis could be observed. Death of susceptible HeJ mice
following KUNV and MVEV i.c. challenge was associated with high viral titres, severe
brain tissue inflammation and robust proinflammatory and Th1 cytokine production
(Chapter 6 and 7). Apoptosis of brain cells was found not to be associated with severe
KUNV and MVEV infection in HeJ as well as DUB mice as the occurrence of apoptosis
was not abundant.
Further flow cytometry analysis on four different types of brain mononuclear cells
indicated that CD11b+ cells were the predominant mononuclear cell population in the
brains of both susceptible HeJ and resistant DUB mice i.c. infected with either KUNV
or MVEV. Cells expressing CD11b+ surface markers may include resting microglia,
activated microglia as well as peripherally recruited macrophages and NK cells. The
next common cell type found was brain CD8+ T cells although the numbers varied
during different flavivirus infection. In both strains of mouse, KUNV induced more
infiltration of CD8+ T cells while MVEV caused more recruitment of CD4+ T cells, B
cells and microglia/macrophages (Chapter 7). The predominant accumulation of CD8+
T cells compared to CD4+ T cells in the brains of infected mice was in accordance with
studies on other flaviviruses (Liu et al, 1989a; Wang et al, 2003b). The accumulation of
CD8+ T cells in the CNS is intriguing, since lysis of CNS cells by cytotoxic T cells can
be fatal especially if this involves post mitotic cells such as neurons. It was found in this

CHAPTER 8
GENERAL DISCUSSION
229
project that in vivo KUNV and MVEV infection induced a greater increase in the
expression of MHC class I than MHC class II. This may explain the greater recruitment
of CD8+ T cells than CD4+ T cells to the brain.
Extensive studies have established that an intact immune system in general is required
for control of flavivirus infections (Chambers and Diamond, 2003). Mice with some
defects of the immune response become more vulnerable to virus infection.
Interestingly, in this study, CD4+ T cells had only a small contribution to KUNV and
MVEV pathogenesis in HeJ mice, as evidenced by T cell depletion studies. This result
is not in accordance with the findings recently reported on the requirement of CD4+ T
cells to sustain CD8+ T cell levels in the brain and in controlling WNV NY strain (Sitati
and Diamond, 2006), a virus that belongs to the same lineage as KUNV (WNV lineage
I). Similar crucial role of CD4+ T cells has been reported during i.c. infection of
neurotropic JHM strain of mouse hepatitis virus, whereby the absence of CD4+ T cells
induced apoptosis of CD8+ T cells in the CNS (Hickey, 1999; Stohlman et al, 1998).
CD4+ T cells could also contribute to the host antiviral defense by facilitating antibody
response, directing inflammatory/antiviral cytokine production and promoting memory
response (Mullbacher et al, 2003). The importance of CD4+ T cells in eliminating
infection and protecting the host from lethal disease has also been reported during
infection with measles virus, LCMV, rotavirus, Herpes simplex virus type 2 and
influenza virus, although the CD4+ T cells-dependent mechanisms vary significantly
between these viruses (Fehr et al, 1998; Jennings et al, 1991; Belz et al, 2002).
In contrast, CD8+T cells had no apparent role during i.c. KUNV infection in HeJ mice,
while they were neuroprotective in MVEV-infected HeJ. In other flavivirus infections,
CD8+ T cells also have disparate roles, further emphasizing that the role of T cells in
development of flavivirus-induced diseases varies, depending on mouse strain, route of
inoculation, virus strain, and dose of virus (Shrestha et al, 2004; Wang et al, 2003b;
reviewed in King et al, 2007). T cells may have both a protective and
immunopathological effect in mice infected with low doses of WNV Sarafend, as mice
lacking functional CD8+ T cells or depleted of these cells displayed increased mortality
but survived longer compared to control mice (Wang et al, 2003b). In contrast, T cells
were detrimental during MVEV and high doses of WNV Sarafend infection (Wang et
al, 2003b; Regner et al, 2001; Licon Luna et al, 2002). It remains to be investigated
what other inflammatory cells could possibly contribute to the fatal encephalitis of

CHAPTER 8
GENERAL DISCUSSION
230
KUNV and MVEV-infected susceptible HeJ mice since severe brain inflammation was
observed in these mice but with no pathogenic T cell role.
A strong brain Th1 cytokine response was elicited in HeJ mice infected with either
viruses, evidenced by the high levels of IFN and TNF. Nevertheless, the role of these
cytokines during KUNV and MVEV pathogenesis in HeJ mice is not known and would
be an interesting subject for future studies. In MVEV 1-51 i.v. infection, IFNαβ has
been demonstrated to be critical for protection against fatal encephalitis (Lobigs et al,
2003a). IFNαβ knockout mice had increased and persistent viraemia with subsequent
100% mortality observed after MVEV i.v. challenge. In contrast, IFNγ and NOS-2
knockout mice only displayed marginally increased susceptibility to the same virus
infection (Lobigs et al, 2003a).
The mechanism/event leading to earlier death of KUNV-infected HeJ mice than
MVEV-infected HeJ mice is yet to be elucidated. This is quite interesting given that
MVEV replicated to greater levels in brains of HeJ mice than KUNV. Furthermore, the
reasons for the incomplete KUNV clearance in sick DUB mice are also unknown. It is
possible that KUNV has different neurotropisms than MVEV in mice, infecting either
neurons in different part of the brain and/or in some inflammatory cells.
Hypochromatism, vacuolisation, and neuronophagia of neurons were evident in the
thalamus of KUNV-infected HeJ mice but not MVEV-infected HeJ mice, suggesting
that rigorous virus replication at this site may occur, leading to structural or functional
damage of the neurons. Involvement of macrophages/microglia has been reported in
several CNS-related diseases. For instance, immune-mediated demyelination induced by
mouse hepatitis virus strain JHM is associated with macrophage infiltration. Microglia
activation is also associated with a range of other diseases such as Alzheimers,
Parkinsons and HIV-associated dementia (Vilhardt, 2005). These activated
microglia/macrophages could have detrimental effects through the release of a myriad
of cytokines, free radicals and other mediators which could be toxic to the cells when
overproduced (Hanisch, 2002). Increased iNOS, IL-1β, IL-6, TNFα and MCP-1
expression have been implicated in microglia activation and neuronal death during JEV
infection in mice (Ghoshal et al, 2007). Recently, Wang and co-workers (2006) found
that some brain cells carrying cell surface marker CD11b+ were positive for WNV
when analysed by immunostaining. Thioglycollate-elicited macrophages of HeJ and
DUB mice supported in vitro KUNV replication better than MVEV, as previously

CHAPTER 8
GENERAL DISCUSSION
231
shown in Chapter 4. This suggests the possibility that macrophages and/or microglia to
act as reservoirs for KUNV in the brain. This may contribute to the severity of infection
in KUNV-infected DUB mice and to the earlier death of HeJ mice infected with KUNV
compared to MVEV. To further elucidate the role of microglia/macrophages during
KUNV and MVEV infection, depletion of blood borne macrophages using clodronate or
perivascular microglia/macrophages using mannosylated clodronate should be
performed (Bauer et al, 1995; Polfliet et al, 2001).
The Flv gene is responsible for limiting flavivirus infection and spread to other tissues
while host immune response usually involves in viral clearance. In this study, it was
revealed that the death of i.c. KUNV-infected DUB mice was not due to the ability of
KUNV to abrogate the expression and action of the flavivirus resistance gene, Flvr,
since a similar reduction of brain viral titres in resistant DUB mice following i.c.
infection with either KUNV or MVEV was observed. In fact, death of KUNV-infected
DUB mice was rather associated with an incomplete KUNV clearance. KUNV was
detected at low titres at the time of death, a similar finding to that reported during i.c.
French neurotropic YFV infection in RV mice (Sabin, 1954).
It was further showed in this project that a fatal infection in resistant DUB mice during
i.c. KUNV challenge could be attributed to an immunopathological disease, partly
caused by T cells. KUNV induced higher numbers of brain CD8+ T cells in resistant
DUB mice that persisted at the late stage of infection (day 7 to 9 p.i.) while brain CD8+
T cell levels declined at similar time points after i.c. MVEV challenge. CD8+ T cell
persistence has been reported during TMEV infection. SJL/J mice which are susceptible
to TMEV infection failed to clear the virus, leading to persistent infection in the brain
and consequently to the accumulation and retention of virus specific CD8+ T cells
(Lyman et al, 2004). From T cell depletion studies, CD8+ T cells were shown to have a
larger contribution to the development of fatal encephalitis in DUB mice infected with
KUNV than CD4+ T cells, possibly due to the higher numbers of the former cells in the
brain compared to the latter cells. Alternatively, CD4+ T cells might not be as important
as CD8+ T cells in the pathogenesis of KUNV. This finding bears a great significance
since this was the first time that the immunopathological role of T cells has been
described in resistant DUB mice. This finding also defines the cause of death of KUNV-
infected DUB mice. Interestingly, the results clearly showed that although KUNV
caused greater recruitment of brain CD8+ T cells in both susceptible HeJ and resistant

CHAPTER 8
GENERAL DISCUSSION
232
DUB mice, these cells have disparate role in different mouse strains. In sharp contrast,
T cells were neuroprotective during i.c. MVEV infection in resistant DUB mice since
mice lacking these cells exhibited signs of sickness. Depletion of a single subset of T
cells intriguingly did not render DUB mice susceptible to MVEV infection, suggesting
that CD4+ T cells and CD8+ T cells act in concert and perhaps able to compensate for
one another’s absence.
Although they can be pathogenic, T cells were shown to be necessary for viral clearance
following i.c. flavivirus infections in resistant DUB mice. This was supported by the
significantly higher brain titres in mice that lacked T cells compared to control mice.
This result is in accordance with findings reported by other investigators (reviewed in
Chambers and Diamond, 2003; Wang et al, 2004).
CD8+ T cells assume effector functions either by cytolysis or by production of IFN
(non-cytolytic mechanism) (Chesler and Reiss, 2002). CD8+ T cells-mediated cytolysis
is involved in limiting WNV Sarafend and WNV NY infection in mice (Wang et al,
2004b; Shrestha et al, 2006). However, given that apoptosis was not apparent during
KUNV infection in DUB mice, CD8+ T cells may not exert detrimental effect on DUB
mice via cytolysis of infected cells. In fact, based on the data attained in this study, T
cells probably inflict fatal encephalitis of KUNV-infected DUB mice through IFNγ
production. This was supported by the significantly higher brain IFNγ levels observed
in KUNV-infected DUB mice compared to MVEV (Student t test, p < 0.0003) at the
time when mice inoculated with the former virus displayed signs of sickness (day 7
p.i.). Further flow cytometric analysis confirmed that CD8+T cells were the major
producer of IFNγ at this time point. Future experimental work using IFNγ neutralising
antibodies or knockout mice are required to verify the immunopathogenic contribution
of IFNγ in KUNV-infected resistant DUB.
IFNγ is a pleiotropic cytokine and an important component of the cytokine-mediated
immune response to viral infections (Boehm et al, 1997). IFN may be involved in the
regulation of the host immune system, stimulation of antigen presentation MHC class I
and II, recruitment of leucocytes and control of cell proliferation and apoptosis (Boehm
et al, 1997). Contribution of this cytokine to immunopathological disease or host
recovery varies, depending on several aspects including genetic background of mouse
model, virus strain, route of inoculation and virus dose. Studies with several neurotropic

CHAPTER 8
GENERAL DISCUSSION
233
viruses indicated that IFNγ emerged more as an important host antiviral rather than a
pathogenic factor. Secretion of IFN by CD8+ T cells was shown to be essential for the
survival of hosts infected with poxvirus and Semliki Forest virus (Ramshaw et al, 1997;
Alsharifi et al, 2006). Furthermore, IFN was also involved in the clearance of LCMV,
mouse hepatitis virus, neuroadapted Sindbis virus and Borna virus (Bartholdy et al,
2000; Parra et al, 1999; Burdeinick-Kerr and Griffin, 2005; Hausmann et al, 2005). In
flavivirus infection, the role of IFN is paradoxical. The route of virus inoculation and
virus strain seems to affect the role of this cytokine in WNV infection. IFN does not
have any crucial role during i.v. infection of WNV Sarafend and KUNV since the lack
of IFN only marginally increased the susceptibility of mice (Wang et al, 2006)
However, IFN may be directly or indirectly associated with the immunopathological
disease of mice i.p. challenged with WNV Sarafend, as evidenced by the enhanced
survival rates (3 fold) of infected IFN knockout mice (King et al, 2003). In contrast,
increased vulnerability to virus infection was reported in mice lacking IFN production
or signalling following WNV NY strain inoculation by the s.c. route (Shrestha et al,
2006). Mortality increased to 90% in infected IFN knockout mice compared with only
30% death rate observed in wild type mice. Furthermore, the lack of IFN correlated
with higher levels of viraemia and viral replication in lymphoid tissues. This suggests
that during s.c. WNV NY infection, IFN has an early antiviral role that provides
protection in the peripheral tissues, thereby preventing virus invasion of the CNS
(Shrestha et al, 2006). However, none of these studies were performed in flavivirus
resistant mice or in susceptible mice of the C3H background. In fact, this is the first
study in which KUNV was shown to cause death to flavivirus resistant mice and CD8+
T cells that produced high levels of IFN contributed to the severity of the disease.
Interestingly, 7 days after i.c. KUNV and MVEV infection in DUB mice, although the
IFNγ outputs were remarkably different, the numbers of IFNγ producing-CD8+ T cells
were comparable (Table 7.11). This suggests that KUNV could induce higher IFNγ
production per CD8+ T cells than MVEV. Additionally, brain CD11b+ cells which
consisted largely of microglia/macrophages could contribute to the differential output of
IFNγ since CD11b+ cell population capable of producing IFNγ were more than double
in number in KUNV-infected than MVEV-infected DUB mice. However, on day 9 p.i.,
despite the higher CD8+ T cell numbers in the CNS of KUNV-infected, compared to
MVEV-infected DUB mice (more than double), similar brain IFNγ production was

CHAPTER 8
GENERAL DISCUSSION
234
observed during both infections. The reason for this is not readily explainable. It is
possible that as KUNV titres drastically declined from day 7 p.i. onwards, there were
less proinflammatory cytokines and infectious virus in the CNS. This may have led to
lower MHC expression on infected cells and APCs, as suggested by the lower
expression of these molecules seen on CD11b+ cells 9 days after infection (Section
7.2.1.3). Since activated T cells only perform their effector functions upon encountering
MHC-presented peptide on target cells (Boehm et al, 1997), the lacked of MHC
expression probably led to less interaction of T cells with target cells and eventually to
reduced IFNγ production. Additionally, two distinct signals delivered by APCs are
required for T cell activation, namely the peptide/MHC and co-stimulatory signals.
Interaction of CD28 on T cells with B7 on APCs generates one of the most important
co-stimulatory signals for T cell activation (reviewed in Boehm et al, 1997). However,
upon activation, T cells can also express CTLA-4 which is known to have high avidity
for B7 and binding of this ligand/receptor may send an inactivation signal to curtail T
cell responses. This may limit the effector role of activated T cells and consequently it
could influence the production of IFNγ in DUB mice 9 days after KUNV infection.
However, further studies are required to clarify this. During TMEV strain DA and strain
BeAN infection, the different level and avidity of virus-specific CD8+ T cells has been
suggested to contribute to the different outcome of disease in mice (Kang et al, 2002).
The activation status, level and avidity of virus-specific T cells during i.c. KUNV versus
MVEV infection however is unknown and would be an interesting subject for future
work.
In conclusion, data presented in this thesis have advanced our understanding on the
pathogenesis of three closely related flaviviruses; KUNV, WNV and MVEV in cell
culture and mouse models. As evidenced by the current study, virulence of flaviviruses
must be assessed independently or separately in different models of infection and cannot
be assumed to be similar even between very closely related flaviviruses. Each of these
viruses has different neuroinvasiveness and neurovirulence traits in susceptible versus
resistant mice. Macrophages were shown to have a dual role in i.p. WNV infection in
susceptible HeJ mice, both in host innate defense and as sites of WNV replication. In
addition to supporting flavivirus replication, macrophages may contribute to WNV
pathogenesis in susceptible mice by production of TNFα that is likely to alter the BBB
permeability. Although KUNV is a non-neuroinvasive virus, it is highly neurovirulent
in both susceptible and resistant mice. Thus, KUNV may pose a danger to humans if it

CHAPTER 8
GENERAL DISCUSSION
235
escapes the host antiviral immunity and enters the brain. This scenario may happen, for
example, in immuno-compromised people, although in this study, modulation of
macrophages (using thioglycollate and clodronate) and BBB permeability (using LPS
and SDS) in mice did not increase the virulence of KUNV in adult mice following i.p.
challenge.
Intracerebral infection with KUNV and MVEV induced different polarisation of the
host immune response in susceptible and resistant mice, which ultimately contributed to
different outcomes of infection, particularly in resistant mice. The results described in
this thesis provide further insight and important information regarding the mechanisms
of KUNV and MVEV pathogenesis in susceptible and resistant mice with a C3H
background. In susceptible mice, although a strong immune response was observed in
the brain during i.c. KUNV and MVEV infection, T cells did not have a significant
immunopathological role in development of fatal encephalitis. In contrast, T cells,
particularly CD8+ T cells, were shown to greatly contribute to the death of KUNV-
infected resistant DUB mice. The different numbers of recruited immune cells in the
brains of resistant mice could be partly attributed to the varying amounts of
proinflammatory cytokines such as IFN type I and TNFα produced following KUNV
and MVEV infection. CD8+ T cells exert a damaging effect on resistant DUB mice,
probably through excessive production of IFNγ. It remains to be answered why KUNV
cannot be cleared completely from the brains of infected resistant mice, what factors are
involved in regulating and polarising the recruited inflammatory cells and what immune
cells other than T cells contribute to the death or survival of KUNV and MVEV-
infected HeJ and DUB mice. The disparity in immune response and pathogenesis
observed when mice were challenged with different flaviviruses indicates that the
immune responses generated by the host-virus interactions cannot be generalized, even
between closely related flaviviruses (Wang et al, 2006).

REFERENCES
236
9.0 REFERENCES
Abbott, N.J., Ronnback, L.R.S., and Hanson, E. (2005). Astrocytes-endothelial
interactions at the blood-brain barrier. Nat. Rev. Neurosci. 7: 41-53.
Abraham, S., and Manjunath, R. (2006). Induction of classical and nonclassical MHC-
I on mouse brain astrocytes by Japanese encephalitis virus. Virus Research, 119: 216-
220.
Adam, D.O., and Hamilton, T.A. (1984). The cell biology of macrophage activation.
Ann. Rev. Immunol. 2: 283-318.
Aloise, F. (2001). Immune function of microglia. GLIA 36: 165-179.
Alsharifi, M., Lobigs, M., Simon, M.M., Kersten, A., Muller, K., Koskinen, A., Lee,
E., and Mullbacher, A. (2006). NK cell-mediated immunopathology during an acute
viral infection of the CNS. Eur. J. Immunol. 36: 887-896.
Alvarez, D.E., De Lella Ezcurra, A.L., Fucito, S., and Gamarnik, A.V. (2005). Role of
RNA structures present at the 3’UTR of dengue on translation, RNA synthesis, and
viral replication. Virology. 339: 200-212.
An, J., Zhou, D.S., Zhang, J.L., Morida, H., Wang, J.L., and Yasui, K. (2004).
Dengue-specific CD8+ T cells have both protective and pathogenic roles in dengue
virus infection. Immunol. Letters. 95: 167-174.
Anderson, J.R. (2001). The mechanisms of direct, virus-induced destruction of
neurons. Curr. Top.Microbiol. Immunol. 253: 15-33.
Anderson, R. (2003). Manipulation of cell surface macromolecules by flaviviruses.
Adv. Virus Res. 59: 229-274.
Andrews, D.M., Matthews, V.B., Sammels, L.M., Carrello, A.C., and McMinn, P.C.
(1999). The severity of Murray Valley encephalitis in mice is linked to neutrophil
infiltration and inducible nitric oxide synthase activity in the central nervous system.
J. Virol. 73: 8781-8790.
Asensio, V.C., and Campbell, I.L. (2001). Chemokines and viral diseases of the

REFERENCES
237
central nervous system. Adv. Virus Res. 56: 127-173.
Bachmann, M.F. and Kopf, M. (2002). Balancing protective immunity and
immunopathology. Curr. Opin. Immunol. 14: 413-419.
Bajetto, A., Bonavia, R., Barbero, S., and Schettini, G. (2002). Characterization of
chemokines and their receptors in the central nervous system: physiopathological
implications. J. Neurochem. 82: 1311-1329.
Barret, A.D.T., Cubitt, W.D., and Dimmock, N.J. (1984). Defective interfering
particles of Semliki forest virus are smaller than particles of standard virus. J. Gen.
Virol. 65: 2265-2268/
Bartholdy, C., Christensen, J.P., Wodarz, D., and Thomsen, A.R. (2000). Persistent
virus infection despite chronic cytotoxic T-lymphocyte activation in gamma
interferon-deficient mice infected with lymphocytic choriomeningitis virus. J. Virol.
74: 10304-10311.
Bauer, J., Huitinga, I., Zhao, W., Lassman, H., Hickey, W.F., and Dijkstra, C.D.
(1995). The role of macrophages, perivascular cells and microglial cells in the
pathogenesis of experimental autoimmune encephalomyelitis. GLIA. 15: 437-446.
Beasley, D.W., Li, L., Suderman, M.T., and Barrett, A.D. (2002). Mouse
neuroinvasive phenotype of West Nile virus strains varies depending upon virus
genotype. Virology. 296: 17-23.
Becher, B., Prat, A., and Antel, J.P. (2000). Brain-Immune Connection: Immuno-
regulatory properties of CNS-resident cells. GLIA. 29: 293-304.
Belardelli, F., Gessani, S., Proietti, E., Locardi, C., Borghi, P., Watanabe, Y., Kawade,
Y., and Gresser, I. (1987). Studies on the expression of spontaneous and induced
interferons in mouse peritoneal macrophages by means of monoclonal antibodies to
mouse interferons. J. Gen. Virol. 68: 2203-2212.
Belz, G. T., Wodarz, D., Diaz, G., Nowak, M. A. and Doherty, P. C. (2002).
Compromised influenza virus-specific CD8-T-cell memory in CD4-T-cell deficient
mice. J. Virol. 76:12388–12393.

REFERENCES
238
Ben-Nathan, D., Huitinga, I., Lustig, S., van Rooijen, N., and Kobiler, D. (1996). West
Nile virus neuroinvasion and encephalitis induced by macrophage depletion in mice.
Arch Virol. 141: 459-469.
Beutler, B. (2004). Inferences, questions and possibilities in Toll-like receptor
signalling. Nature. 430: 257-263.
Bhatt, P.N., and Jacoby, R.O. (1976). Genetic resistance to lethal flavivrus
encephalitis. II. Effect of immunosuppression. J. Infect. Dis. 134: 166-173.
Bhatt, P.N., Johnson, E.A., Smith, A.L., and Jacoby, R.O. (1981). Genetic resistance
to lethal flaviviral encephalitis. III. Replication of Banzi virus in vitro and in vivo in
tissues of congenic susceptible and resistant mice. Arch. Virol. 69: 273-286.
Biewenga, J., van der Ende, M.B., Krist, L.F., Borst, A., Ghufron, M., and van
Rooijen, N. (1995). Macrophage depletion in the rat after intraperitoneal
administration of liposome-encapsulated clodronate: depletion kinetics and accelerated
repopulation of peritoneal and omental macrophages by administration of Freund's
adjuvant. Cell Tissue Res. 280: 189-196.
Binder, G.K., and Griffin, D.E. (2001). Interferon--mediated site-specific clearance
of Alphavirus from CNS neurons. Science. 293: 303-306.
Binder, G.K., and Griffin, D.E. (2003). Immune-mediated clearance of virus from the
central nervous system. Microbes Infection. 5: 439-448.
Blackwell, J.L., and Brinton, M.A. (1997). Translation elongation factor-1 alpha
interacts with the 3' stem-loop region of West Nile virus genomic RNA. J. Virol. 71:
6433-6444.
Boehm, U., Klamp, T., Groot, M., and Howard, J.C. (1997). Cellular responses to
interferon-. Annu. Rev. Immunol. 15: 749-795.
Bogdan, C. (2001). Nitric oxide and the immune response. Nat. Immunol. 2: 907-916.
Bradl, M., and Flugel, A. (2002). The role of T cells in brain pathology. Curr. Topics
Microb. Immunol. 265: 141-162.
Brault, A.C., Langevin, S.A., Bowen, R.A., Panella, N.A., Biggerstaff, B.J., Miller,

REFERENCES
239
B.R., and Komar, N. (2004). Differential virulence of West Nile strains for American
crows. Emerg. Infect.Dis. 10: 2161-2168.
Brehm, M.A., Selin, L.K., and Welsh, R.M. (2004). CD8 T cell responses to viral
infections in sequence. Cell.Microbiol. 6: 411-421.
Brinton, M.A. (1981). Isolation of a replication-efficient mutant of West Nile virus
from a persistently infected genetically resistant mouse cell culture. J. Virol. 39: 413-
421.
Brinton, M.A. (1983). Analysis of extracellular West Nile virus particles produced by
cell cultures from genetically resistant and susceptible mice indicates enhanced
amplification of defective interfering particles by resistant cultures. J. Virol. 46: 860-
870.
Brinton, M.A. (1986). Replication of Flaviviruses, p.327-365. In: S. Schlesinger, M.J.
Schlesinger (eds), The Togaviridae and Flaviviridae. Plenum Press, New York.
Brinton, M.A. (1997). Host susceptibility to viral disease, p.303-328. In: N.
Nathanson, R. Ahmed, F. Gonzalez-Scarano, et al, (eds.), Viral pathogenesis.
Lippincott-Raven Publishers, Philadelphia.
Brinton, M.A. (2001). Host factors involved in West Nile virus replication. Ann. NY
Acad. Sci. 951: 207-219.
Brinton, M.A. (2002). The molecular biology of West Nile Virus: a new invader of the
western hemisphere. Annu. Rev. Microbiol. 56: 371-402.
Brinton, M.A., and Perelygin, A.A. (2003). Genetic resistance to flaviviruses. Adv.
Virus Res. 60: 43-85.
Brinton, M.A., Arnheiter, H., and Haller, O. (1982). Interferon independence of
genetically controlled resistance to flaviviruses. Infect. Immun. 36: 284-288.
Brinton, M.A., Kurane, I., Mathew, A. Zeng, L., Shi, P.Y., Rothman, A., and Ennis,
F.A. (1998). Immune mediated and inherited defeces against flaviviruses. Clin.
Diag.Virol. 10: 129-139.
Brinton-Darnell, M., and Koprowski, H. (1974). Genetically determined resistance to

REFERENCES
240
infection with group B arboviruses. II.Increased production of interfering particles in
cell cultures from resistant mice. J. Infect. Dis. 129: 248-256.
Brinton-Darnell, M., Koprowski, H., and Lagerspetz, K. (1974). Genetically
determined resistance to infection with group B arboviruses. I. Distribution of
resistance gene among various populations and characteristics of gene expression in
vivo. J. Infect. Dis. 129: 240-247.
Broom, A.K., Wallace, M.J., Mackenzie, J.S., Smith, D.W., Hall, R.A. (2000).
Immunisation with gamma globulin to murray valley encephalitis virus and with an
inactivated Japanese encephalitis virus vaccine as prophylaxis against australian
encephalitis: evaluation in a mouse model. J. Med. Virol. 61: 259-265.
Brosnan, C.F., Bornstein, M.B., and Bloom, B.R. (1981). The effects of macrophage
depletion on the clinical and pathologic expression of experimental allergic
encephalomyelitis. J. Immunol. 126:614-620.
Burdeinick-Kerr, R., and Griffin, D.E. (2005). Gamma interferon-dependent,
noncytolytic clearance of Sindbis virus infection from neurons in vitro. J Virol. 79:
5374-5385.
Burke, D.S., and Monath, T.P. (2001). Flaviviruses, p.1043-1125. In: D.M. Knipe,
P.M. Howley, D.E. Griffin, et al. (eds.), Fields Virology. 4th
edition. Lippincott
Williams and Wilkins, Philadelphia.
Cabarrocas, J., Bauer, J., Piaggio, E., Liblau, R., and Lassmann, H. (2003). Effective
and selective immune surveillance of the brain by MHC class I-restricted cytotoxic T
lymphocytes. Eur. J. Immunol. 33: 1174-82.
Calisher, C.H., and Gould, E.A. Taxonomy of the virus family Flaviviridae. (2003).
Adv. Virus. Res. 59: 1-19.
Calisher, C.H., Karabatsos, N., Dalrymple, J., Shope, R.E., Porterfield, J.S.,
Westaway, E.G., and Brand, W.E. (1989). Antigenic relationships between
flaviviruses as determined by cross-neutralisation tests with polyclonal antisera. J.
Gen Virol. 70: 37-43.
Calvert, A.E., Huang, C.Y.H., Kinney, R.M., and Roehrig, J.T. (2006). Non-structural

REFERENCES
241
proteins of dengue-2 virus offer limited protection to interferon-deficient mice after
dengue 2 virus challenge. J. Gen. Virol. 87: 339-346.
Camenga, D.L., Nathanson, N., and Cole, G.A. (1974). Cyclophosphamide-potentiated
West Nile viral encephalitis: relative influence of cellular and humoral factors. J.
Infect. Dis. 130: 634-641.
Cardosa, M.J., Gordon, S., Hirsch, S., Springer, T.A., and Poterfield, J.S. (1986).
Interaction of West Nile virus with primary murine macrophages: Role of cell
activation and receptors for antibody and complement. J. Virol. 57: 952-959.
Cardosa, M.J., Poterfield, J.S., and Gordon, S. (1983). Complement receptor mediates
enhances flavivirus replication in macrophages. J.Exp. Med. 158: 258-263.
Castle, E., Nowak, T., Leidner, U., Wengler, G., and Wengler, G. (1985). Sequence
analysis of the viral core and the membrane associated proteins VI and NV2 of the
flavivirus West Nile and of the genome sequence for these proteins. Virology. 145:
227-236.
Chambers, T.J., and Diamond, M.S. (2003). Pathogenesis of flavivirus encephalitis.
Avd. Virus Res. 60: 273-342.
Chambers, T.J., Hahn, C.S., Galler, R., and Rice, C.M. (1990a). Flavivirus genome
organization, expression, and replication. Ann. Rev. Microbiol. 44: 649-688.
Chambers, T.J., Halevy, M., Nestorowicz, A., Rice, C.M., and Lustig, S. (1998). West
Nile virus envelope proteins: nucleotide sequence analysis of strains differing in
mouse neuroinvasiveness. J. Gen. Virol. 79: 2375-2380.
Chambers, T.J., Weir, R.C., Grakoui, A., McCourt, D.W., Bazan, J.F., Fletterick, R.J.,
and Rice, C.M. (1990b). Evidence that the N-terminal domain of nonstructural protein
NS3 from yellow fever virus is a serine protease responsible for site-specific cleavages
in the viral polyprotein. Proc. Natl. Acad. Sci. USA. 87: 8898-8902.
Chaturvedi, U.C., Dhawan, R., Khanna, M., and Mathur, A. (1991). Breakdown of the
blood-brain barrier during dengue virus infection of mice. J. Gen. Virol. 72: 859-866.
Cheeran, M.C., Hu, S., Sheng, W.S., Rashid, A., Peterson, P.K., and Lokensgard, J.R.
(2005). Differential responses of human brain cells to West Nile virus infection. J.

REFERENCES
242
Neurovirol. 11: 512-524.
Chen, C.J., Kuo, M.D., Chien, L.J., Hsu, S.L., Wang, Y.M., and Lin, J.H. (1997).
RNA-protein interactions: Involvement of NS3, NS5 and 3’ noncoding region of
Japanese encephalitis virus genomic RNA. J. Virol. 71: 3466-3473.
Chen, C.J., Liao, S.L., Kuo, M.D., and Wang, Y.M. (2000). Astrocytic alteration
induced by Japanese encephalitis virus infection. Neuroreport. 11:1933-1937.
Chen, Y.C., and Wang, S.Y. (2002). Activation of terminally differentiated human
monocytes/macrophages by dengue virus: productive infection, hierarchical
production of innate cytokines and chemokines, and the synergistic effect of
lipopolysaccharide. J. Virol. 76: 9877-9887.
Cheng, Y., King, N.J., and Kesson, A.M. (2004). Major histocompatibility complex
class I (MHC-I) induction by West Nile virus: involvement of 2 signalling pathways in
MHC-I up-regulation. J. Infect. Dis. 189: 658-668.
Chesler, D.A., and Reiss, C.S. (2002). The role of IFN-gamma in immune responses
to viral infections of the central nervous system. Cytokine Growth Factor Rev. 13:
441-454.
Chu, J.J., Choo, B.G., Lee, J.W. amd Ng, M.L. (2003). Actin filaments participate in
west Nile (Sarafend virus maturation process. J. Med. Virol. 71: 463-472.
Chu, J.J.H., and Ng, M.L. (2002). Trafficking mechanism of west Nile (Sarafend)
virus structural proteins. J. Med. Virol. 67: 127-136.
Chu, P.W.G., and Westaway, E.G. (1985). Replication strategy of Kunjin virus:
Evidence for recycling role of replicative form RNA as template in semi-conservative
and asymmetric replication. Virology. 140: 68-79.
Chung, K.M., Nybakken, G.E., Thompson, B.S., Engle, M.J., Marri, A., Fremont,
D.H., and Diamond, M.S. (2006). Antibodies against West Nile Virus nonstructural
protein NS1 prevent lethal infection through Fc gamma receptor-dependent and -
independent mechanisms. J. Virol. 80: 1340-1351.
Ciavarra, R.P., Buhrer, K., Van Rooijen, N., and Tedeschi, B. (1997). T cell priming
against vesicular stomatitis virus analyzed in situ: red pulp macrophages, but neither
REFERENCES
243
marginal metallophilic nor marginal zone macrophages, are required for priming
CD4+ and CD8+ T cells. J Immunol. 158: 1749-1755.
Clark, D.C., Lobigs, M., Lee, E., Howard, M.J., Clark, K., Blitvich, B.J. and Hall,
R.A. (2007). In situ reactions of monoclonal antibodies with a viable mutant of
Murray Valley encephalitis virus reveal an absence of dimeric NS1 protein. J. Gen.
Virol. 88: 1175-1183
Cobbold, S.P., Jayasuriya, A., Rash, A., Prospero, T.D. and Waldmann, H. (1984).
Therapy with monoclonal antibodies by elimination of T cell subsets in vivo. Nature.
312: 584-550.
Cockfield, S.M., Ramassar, V., Noujaim, J., van der Meide, P.H., Halloran, P.F.
(1993). Regulation of IFN-gamma expression in vivo. IFN-gamma up-regulates
expression of its mRNA in normal and lipopolysaccharide-stimulated mice. J.
Immunol. 150: 717-725.
Coia, G., Parker, M.D., Speight, G., Byrne, M.E., and Westaway, E.G. (1988).
Nucleotide and complete amino sequences of Kunjin virus: definitive gene order and
characteristics of the virus-specified proteins. J. Gen. Virol. 69: 1-21.
Cole, G.A., and Nathanson, N. (1968). Potentiation of experimental arbovirus
encephalitis by immunosuppressive doses of cyclophosphamine. Nature. 220: 399-
401.
Courageot, M.P., Catteau, A., and Despres, P. (2003). Mechanisms of Dengue virus-
induced cell death. Adv. Virus Res. 60: 157-186.
Dalgarno, L., Trent, D.W., Strauss, J.H., and Rice, C.M. (1986). Partial nucleotide
sequence of the Murray Valley encephalitis virus genome. Comparisons of the
encoded polypeptides with Yellow fever virus structural and non structural proteins. J.
Mol. Biol. 187: 309: 323.
Darnay, B.G., and Aggarwal, B.B. (1999). Signal transduction by tumor necrosis
factor and tumor necrosis factor related ligands and their receptors. Ann. Rheum. Dis.
58: I2-I13.
Darnell, M.B., Koprowski, H., and Lagerspetz, K. (1974). Genetically determined

REFERENCES
244
resistance to infection with group B arboviruses. I. Distribution of the resistance gene
among various mouse populations and characteristics of gene expression in vivo. J.
Infect. Dis. 129: 240-247.
Desai, A., Murali-Krishna, K., Ramireddy, K., Ravi, V., and Manjunath, R. (1997). In
vivo clearance of Japanese encephalitis virus by adoptively transferred virus specific
cytotoxic T lymphocytes. J. Biosci. 22: 33-45.
Desai, A., Shankar, S.K., Ravi, V., Chandramuki, A., and Gourie-Devi, M. (1995).
Japanese encephalitis virus antigen in the human brain and its topographic
distribution. Acta Neuropathol (Berl). 89: 368-373.
Despres, P., Flamond, M., Ceccaldi, P.-E., and Deubel, V. (1996). Human isolates of
Dengue type 1 virus induce apoptosis in mouse neuroblastoma cells. J. Virol. 70:
4090-4096.
Despres, P., Frenkiel, M.-P., Ceccaldi, P.-E., Duarte Dos Santos, C., and Deubel, V.
(1998). Apoptosis in the mouse central nervous system in response to infection with
mouse neurovirulent dengue viruses.J. Virol. 72: 823-829.
Deubel, V., Fiette, L., Gounon, P., Drouet, MT., Khun, H., Huerre, M., Banet, C.,
Malkinson, M., and Despres, P. (2001). Variations in biological features of West Nile
viruses. Ann. N. Y. Acad. Sci. 951: 195-206.
Di Marzio, P., Gessani, S., Locardi, C., Borghi, P., Baglioni, C., and Belardelli, F.
(1990). Effects of different biological response modifiers on interferon expression in
bacterial lipopolysaccharide (LPS)-responsive and LPS-hyporesponsive mouse
peritoneal macrophages. J. Gen. Virol. 71: 2585-2591.
Diamond, M.S. (2003). Evasion of innate and adaptive immunity by flavivirues.
Immunol. Cell Biol. 81: 196-206.
Diamond, M.S., and Harris, E. (2001). Interferon inhibits Dengue virus infection by
preventing translation of viral RNA through a PKR-independent mechanism.
Virology. 289: 297-311.
Diamond, M.S., Roberts, T.G., Edgil, D., Lu, B., Ernst, J., Harris, E. (2000).
Modulation of Dengue virus infection in human cells by alpha, beta and gamma

REFERENCES
245
interferons. J. Virol. 74: 4957-4966.
Diamond, M.S., Shrestha, B., Marri, A., Mahan, D., and Engle, M. (2003b). B cells
and antibody play critical roles in the immediate defense of disseminated infection by
West Nile encephalitis virus. J. Virol. 77: 2578-2586.
Diamond, M.S., Shrestha, B., Mehlhop, E., Sitati, E., and Engle, M. (2003a). Innate
and adaptive immune responses determine protection against disseminated infection
by West Nile encephalitis virus. Viral Immunol. 16: 259-278.
Dietzschold, B., Kao, M., Zheng, Y.M., Chen, Z.Y., Maul, G., Fu, Z.F., Rupprecht,
C.E., and Koprowski, H. (1992). Delineation of putative mechanisms involved in
antibody-mediated clearance of rabies virus from the central nervous system. Proc.
Natl. Acad. Sci. USA. 89: 7252-6. Erratum in: Proc. Natl. Acad. Sci. USA 89: 9365.
Doherty, R.L., Carley, J.G., Mackerras, M.J., and Marks, E.N. (1963). Studies of
arthropodborne virus infections in Queensland. III. Isolation and characterization of
virus strains from wild-caught mosquitoes in North Queensland. Aust. J Exp. Biol.
Med. Sci. 41: 17-39.
Dorries, R. (2001). The role of T-cell-mediated mechanisms in virus infections of the
nervous system. Curr. Top. Microbiol. Immunol. 253: 219-45.
Duane, J.G., and Roehrig, J.T. (2000). Arboviruses (Togaviridae and Flaviviridae),
p.579-600. In: L. Collier, A. Balows, M. Susswan et al., (eds.), Topley and Wilson’s
Microbiology and microbial infections 9th
edition, Oxford University Press, New
York.
Dulbecco, R. (1990). Interference with viral multiplication, p. 381-418. In: B.D.
Davis, R. Dulbecco, H.N., Eisen, and H.S. Ginsberg (eds.), Microbiology, Harper
International edition.
Elkon KB, Liu CC, Gall JG, Trevejo J, Marino MW, Abrahamsen KA, Song X, Zhou
JL, Old LJ, Crystal RG, Falck-Pedersen E. (1997). Tumor necrosis factor alpha plays a
central role in immune-mediated clearance of adenoviral vectors. Proc Natl Acad Sci
U S A. ;94 : 9814-9819.
Engle, M.J., and Diamond, M.S. (2003). Antibody prophylaxis and therapy against

REFERENCES
246
West Nile virus infection in wild type and immunodeficient mice. J. Virol. 77: 12941-
12949.
Fehr, T., Naim, H. Y., Bachmann, M. F., Ochsenbein, A. F., Spielhofer, P., Bucher,
E., Hengartner, H., Billeter, M. A., and Zinkernagel, R. M. (1998). T-cell independent
IgM and enduring protective IgG antibodies induced by chimeric measles viruses. Nat.
Med. 4: 945–948
Fink, J., Gu, F., and Vasudevan, S.G. (2006). Role of T cells, cytokines and antibody
in dengue fever and dengue haemorrhagic fever. Rev. Medic. Virol. 16: 263-275.
Fischer, H.G., and Reichmann, G. (2001). Brain dendritic cells and
macrophages/microglia in central nervous system inflammation. J. Immunol. 166:
2717-2726.
Fisher, H.G., Bonifas, U., and Reichmann, G. (2000). Phenotype and functions of
brain dendritic cells emerging during chronic infection of mice with toxoplasma
gondii. J. Immunol. 164: 4826-4834.
Fuhlbrigge, R.C., Chaplin, D.D., Kiely, J.M., and Unanue, E.R. (1987). Regulation of
interleukin 1 gene expression by adherence and lipopolysaccharide. J. Immunol. 138:
3799-802.
Garcia-Tapia, D., Loiacono, C.M., and Kleiboeker, S.B. (2006). Replication of West
Nile virus in equine peripheral blood mononuclear cells. Veterinary Immunol.
Immunopathol. 110: 229-244.
Gehrmann, J. (1996). Microglia: a sensor to threats in the nervous system? Res. Virol.
147: 79-88.
Ghoshal, A., Sulagna, D., Ghosh, S., Mishra M.K., Sharma, V., Koli, P., Sen, E., and
Basu, A. (2007). Proinflammatory mediators released by activated microglia induce
neuronal death in Japanese encephalitis. GLIA. 55: 483-496.
Glass, W.G., Lim, J.K., Cholera, R., Pletnev, A.G., Gao, J.L., and Murphy, P.M.
(2005). Chemokine receptor CCR5 promotes leucocyte trafficking to the brain and
survival in West Nile infection. J. Exp. Med. 202:1087-1098.
Gollins, S.W., and Porterfield, J.S. (1984). Flavivirus infection enhancement in

REFERENCES
247
macrophages: Radioactive and biological studies on the effect of antibody on viral
fate. J. Gen. Virol. 65: 1261-1272.
Gollins, S.W., and Porterfield, J.S. (1985). Flavivirus infection enhancement in
macrophages: an electron microscopic study of viral cellular entry. J. Gen. Virol.
66:1969-1982.
Goodman, G.T., and Koprowski, H. (1962a). Study of the mechanism of innate
resistance to virus infection. J. Cell. Comp. Physiol. 59: 333-373.
Goodman, G.T., and Koprowski, H. (1962b). Macrophages as a cellular expression of
inherited natural resistance. PNAS. 148:160-5.
Gould, L.H., and Fikrig, E. (2004). West Nile virus: a growing concern? J. Clin.
Invest. 113: 1102-1107.
Gouwy, M., Struyf, S., Proost, P., and Van Damme, J. (2005). Synergy in cytokine
and chemokine networks amplifies the inflammatory response. Cytokine and Growth
Factors Reviews. 16: 561-580.
Green, M.C. (1989). Catalogue of mutant genes and polymorphic loci, p. 8-274. In:
Green, M.C. (ed), Genetic Variants and Strains of the Laboratory mouse. Gustav
Fischer Verlag, Stuttgart, New York.
Gregg, A.R., Lee, C.G., Herman, G.E., and O’Brian, W.E. (1995). Endothelial nitric
oxide synthase (Nos3) maps to the proximal region of mouse chromosome 5. Mamm.
Genome. 6: 152.
Griffin, D.E. (1995). Arbovirses and the central nervous system. Springer Semin.
Immunopathol. 17: 121-132.
Griffin, D.E. (2003). Immune responses to RNA-virus infections of the CNS. Nature
Reviews Immunol. 3: 493-502.
Groschel, D., and Koprowski, H. (1965). Development of a virus-resistant inbred
mouse strain for the study of innate resistance to Arbo B viruses. Arch. Ges.
Virusforsch. 17:379-391.
Gubler, D.J. (2002). The global emergence/resurgence of arboviral disease as public

REFERENCES
248
health problem. Arch. Med. Res. 33: 330-342.
Guidotti, L.G., and Chisari, F.V. (2001). Noncytolitic control of viral infections by the
innate and adaptive immune response. Annu. Rev. Immunol. 19: 65-91.
Guo, J.T., Hayasi, J., and Seeger, C. (2005). West Nile virus inhibits the signal
transduction pathway of alpha interferon. J. Virol. 79: 1343-1350.
Haahr, S. (1971). The influence of poly I:C on the course of infection in mice
inoculated with West Nile virus. Arch. Gesamte Virusforch. 35: 1-9.
Halevy, M., Akov, Y., Ben-Nathan, D., Kobiler, D., Lachmi, B., and Lustig, S. (1994).
Loss of active neuroinvasiveness in attenuated strains of West Nile virus:
pathogenecity in immunocompetent and SCID mice. Arch. Virol. 137: 355-370.
Hall, R.A., Brand, T.N.H., Lobigs, M., Sangster, M.Y., Howard, M.J., and Mackenzie,
J.S. (1996). Protective immune responses to the E and NS1 proteins of Murray Valley
encephalitis virus in hybrids of flavivivirus-resistant mice. J. Gen. Virol. 77: 1287-
1294.
Hall, R.A., Broom, A.K., and Smith, D.W. (2002). The ecology and epidemiology of
Kunjin virus. Curr. Topic Microbiol. Immunol. 267: 253-270.
Hall, R.A., Khromykh, A.A., Mackenzie J.M., Scherret, J.H., Khromykh, T.I.
Mackenzie, J.S. (1999). Loss of dimerisation of the Nonstructural Protein NS1 of
Kunjin virus delays viral replication and reduces virulence in mice, but still allows
secretion of NS1. Virology. 264: 66-75.
Hall, R.A., Scherret, J.H., and Mackenzie, J.S. (2001). Kunjin Virus An Australian
variant of West Nile? Ann. NY Acad. Sci. 951: 153-160.
Haller, O., Arnheiter, H., Gresser, I., and Lindenmann, J. (1979). Genetically
determined interferon-independent resistance to influenza virus in mice. J. Exp. Med.
149: 601-612.
Haller, O., Arnheiter, H., Lindenmann, J., and Gresser, I. (1980). Host gene influences
sensitivity to interferon action selectively for influenza virus. Nature 283: 660-662.
Haller, O., Kochs, G., and Weber, F. (2006). The interferon response circuit: Induction

REFERENCES
249
and suppression by pathogenic viruses. Virology. 344: 119-130.
Halstead, S.B., and O'Rourke, E.J. (1977). Antibody-enhanced dengue virus infection
in primate leukocytes. Nature. 265: 739-741.
Hanisch, U.K. (2002). Microglia as a source and target of cytokines. Glia. 40: 140-
155.
Hanson, B., Koprowski, H., Baron, S., and Buckler, C.E. (1969). Interferon-mediated
natural resistance of mice to ArboB virus infection. Microbios. 1B:51-68.
Hase, T., Dubios, D.R., and Summers, P.L. (1990b). Comparative study of mouse
brains infected with Japanese encephalitis virus by intracerebral or intraperitoneal
inoculation. Int. J. Exp. Path. 71: 857-869.
Hase, T., Summers, P.L., and Dubous, D.R. (1990a). Ultrastructural changes of mouse
brains neurons infected with Japanese encephalitis virus. J. Exp. Pathol. 71: 493-505.
Hase, T., Summers, P.L., Eckels, K.H., and Baze, W.B. (1987). An electron and
immunoelectron microscopic study of dengue-2 virus infection of cultured mosquito
cells: maturation events. Arch. Virol. 92: 273-291.
Haskill, S., Johnson, C., Eierman, D., Becker, S., and Warren, K. (1988). Adherence
induces selective mRNA expression of monocyte mediators and proto-oncogenes. J.
Immunol. 140: 1690-1694.
Hausmann, J., Pagenstecher, A., Baur, K., Richter, K., Rziha, H.J., and Staeheli, P.
(2005). CD8 T cells require gamma interferon to clear borna disease virus from the
brain and prevent immune system-mediated neuronal damage. J. Virol. 79: 13509-
13518.
Hay, S., and Kannoroukis, G. (2002). A time to kill: viral manipulation of the cell
death program. J. Gen. Virol. 83: 1547-1564.
Heinz, F.X. (1986). Epitope mapping of flavivirus glycoproteins. Adv. Virus Res. 31:
103-168.
Heinz, F.X. (2003). Molecular aspects of TBE virus research. Vaccine. 21: S1/3-
S1/10.

REFERENCES
250
Heinz, F.X., and Allison, S.L. (2002). The machinery for flavivirus fusion with host
cell membranes. Curr. Opinion Microbiol. 4: 450-455.
Heinz, F.X., Collett, M.S., Purcell, R.H., et al. (2000). Family Flaviviridae, p.859-878.
In: M.H.V. van Reggenmortel, C.M. Fauquet, D.H.L. Bishop et al., (eds.), Virus
Taxonomy. Classification and Nomenclature of Viruses. 7th
report of the International
Committee for the Taxonomy of Viruses, Academic Press, San Diego, CA.
Hendriks, J.J., Teunissen, C.E., de Vries, H.E., and Dijkstra, C.D. (2005).
Macrophages and neurodegeneration. Brain Res. Brain Res. Rev. 48: 185-195.
Hickey, W.F. (1999). Leucocyte traffic in the central nervous system: the participants
and their roles. Semin. Immunol. 11: 125-137.
Higashi, Y., Sokowa, Y., Watanabe, Y., Kawade, Y., Ohno, S., Takaoka, C., and
Taniguchi, T. (1983). Structure and expression of a cloned cDNA for mouse
interferon-beta. J. Biochem. Chem. 258: 9522-9529.
Hill, A.B., Mullbacher, A., Parrish, C., Coia, G., Westaway, E.G., and Blanden, R.V.
(1992). Broad cross-reactivity with marked fine specificity in the cytotoxic T cell
response to flaviviruses. J. Gen. Virol. 73: 1115-1123.
Hober, D., Shen, L., Benyoucef, S., De Groote, D., Deubel, V., and Wattre, P. (1996).
Enhanced TNF production by monocytic-like cells exposed to dengue virus antigens.
Immunol. Letters. 53: 115-120.
Hooper, D.C., Sauder, C., Scott, G.S., Dietzschold, B., and Richt, J.A. (2002).
Immunopathology and immunoprotection in CNS virus infections: Mechanisms of
virus clearance from the CNS. Curr. Topics Microb. Immunol. 265: 163-182.
Hurrelbrink, R.J., and McMinn, P.C. (2001). Attenuation of Murray Valley
encephalitis virus by site-directed mutagenesis of the hinge and putative receptor-
binding regions of the envelope protein. J. Virol. 75: 7692-7702.
Hurrelbrink, R.J., and McMinn, P.C. (2003). Molecular determinants of virulence: The
structural and functional basis for flavivirus attenuation. Adv. Virus. Res. 60: 1-42.
Irani, D.N., and Griffin, D.E. (1996). Regulation of lymphocyte homing into the brain

REFERENCES
251
during viral encephalitis at various stages of infection. J. Immunol. 156: 3850-3857.
Irani, D.N., Lin, K.I., and Griffin, D.E. (1997). Regulation of brain-derived T cells
during acute central nervous system inflammation. J. Immunol. 158: 2318-2326.
Ishak, R., Tovey, D.G., and Howard, C.R. (1988). Morphogenesis of yellow fever
virus 17D in infected cell cultures. J. Gen. Virol. 169: 325-35.
Itano, A.A., and Jenkins, M.K. (2003). Antigen presentation to naïve CD4 T cells in
the lymph node. Nat. Immunol. 4: 733-739.
Jacoby, R.O., and Bhatt, P.N. (1976). Genetic resistance to lethal flavivirus
encephalitis I. Infection of congenic mice with Banzi virus. J. Infect. Dis. 134: 158-
165.
Jacoby, R.O., Bhatt, P.N., and Schwartz, A. (1980). Protection of mice from lethal
flavivirus encephalitis by adoptive transfer of splenic cells from donors infected with
Banzi virus. J. Infect. Dis. 141: 617-624.
Jennings, S. R., Bonneau, R. H., Smith, P. M., Wolcott, R. M. and Chervenak, R.
(1991). CD4-positive T lymphocytes are required for the generation of the primary but
not the secondary CD8-positive cytolytic T lymphocyte response to herpes simplex
virus in C57BL/6 mice. Cell. Immunol. 133:234–252.
Johnson, L.J., Halliday, G.M., and King, N.J.C. (2000). Langerhans cells migrate to
local lymph nodes following cutaneous infection with arbovirus. J. Invest. Dermatol.
114: 560-568.
Johnson, R.T., Burke, D.S., Elwell, M., Leake, C.J., Nisalak, A., Hoke, C.H., and
Lorsomrudee, W. (1985). Japanese encephalitis: immunocytochemical studies of viral
antigen and inflammatory cells in fatal cases. Ann. Neurol. 18: 567-573.
Kajaste-Rudnitski, A., Mashimo, T., Frenkiel, M.P., Guenet, J.L., Lucas, M., and
Despres, P. (2006). The 2’, 5’-oligoadenylate synthetase 1b is a potent inhibitor of
West Nile replication inside infected cells. J. Biol. Chem. 281: 4624-4637.
Kesson, A.M., and King, N.J.C. (2001). Transcriptional regulation of major
histocompatibility complex class I by flavivirus West Nile is dependent on NF-kB

REFERENCES
252
activation. J. Infect. Dis. 184: 947-954.
Kesson, A.M., Blanden, R.V., and Mullbacher, A. (1987). The primary in vivo
cytotoxic T cell response to the flavivirus, West Nile. J. Gen. Virol. 68: 2001-2006.
Kesson, A.M., Blanden, R.V., and Mullbacher, A. (1988). The secondary in vitro
murine cytotoxic T cell response to the flavivirus, West Nile. Immunol. Cell Biol. 66:
23-32.
Kesson, A.M., Cheng, Y., and King, N.J.C. (2002). Regulation of immune recognition
molecules by Flavivirus, West Nile. Viral. Immunol. 15: 273-283.
Khromykh, A.A., Meka, H., Guyatt, K.J., and Westaway, E.G. (2001). Essential role
of cyclization sequences in flavivirus RNA replication. J. Virol. 75: 6719-6728.
Kimura, T., and Griffin, D.E. (2000). The role of CD8+ T cells and major
histocompatibility complex class I expression in the central nervous system of mice
infected with neurovirulent Sindbis virus. J.Virol. 74: 6117-6125.
Kimura, T., and Griffin, D.E. (2003). Extensive immune-mediated hippocampal
damage in mice surviving infection with neuroadapted Sindbis virus. Virology. 311:
28-39.
King, N.J.C., Getts, D.R., Getts, M.T., Rana, S., Shrestha, B, and Kesson, A.M.
(2007). Immunopathology of flavivirus infections. Immunol. Cell Biol. 85: 33-42.
King, N.J.C., and Kesson, A.M. (1988). Interferon-independent increases in class I
major histocompatibility complex antigen expression follow flavivirus infection. J.
Gen. Virol. 69: 2535-2543.
King, N.J.C., and Kesson, A.M. (2003). Interaction of flaviviruses with cells of the
vertebrate host and decoy of the immune response. Immunol. Cell Biol. 81: 207-216.
King, N.J.C., Shrestha, N., and Kesson, A.M. (2004). Immuno modulation by
flaviviruses. Adv. Virus. Res. 60: 121-151.
Klein, R.S., Lin, E., Luster, A.D., Tollett, J., Samuel, M.A., Engle, M., and Diamond,
M.S. (2005). Neuronal CXCL10 directs CD8+ T-cell recruitment and control of West
Nile virus encephalitis. J. Virol. 79: 11457-11466.

REFERENCES
253
Kobiler, D., Lustig, S., Gozes, Y., Ben-Nathan, D., and Akov, Y. (1989). Sodium
dodecylsulphate induces a breach in the blood-brain barrier and enables a West Nile
virus variant to penetrate into mouse brain. Brain Res. 496: 314-316.
Kodukula, P., Liu, T., Rooijen, N.v., Jager, M.J., and Hendricks, R.L. (1999).
Macrophage control of herpes simplex virus type I replication in the peripheral
nervous system. J. Immunol. 162: 2895-2905.
Konishi, E., Yamaoka, M., Khin-Sane-Win, Kurane, I., Takada, K., Mason, P.W.
(1999). The anamnestic neutralizing antibody response is critical for protection of
mice from challenge following vaccination with a plasmid encoding the Japanese
encephalitis virus premembrane and envelope genes. J. Virol. 73: 5527-5534.
Kontny, U., Kurane, I., and Ennis, A. (1998). Gamma interferon augments Fc
receptor-mediated Dengue virus infection of human monocytic cells. J. Virol. 62:
3928-3933.
Kreil, T.R., and Eibl, M.M. (1995). Viral infection of macrophage profoundly alters
requirements for induction of nitric oxide synthesis. Virology. 212: 174-178.
Kreil, T.R., and Eibl, M.M. (1996). Nitric oxide and viral infection: NO antiviral
activity against a Flavivirus in vitro, and evidence for contribution to pathogenesis in
experimental infection in vivo. Virology 219: 304-306.
Kreil, T.R., Byrger, I., Bachmann, M., Fraiss, S., and Eibl, M.M. (1997). Antibodies
protect mice against challenge with tick-borne encephalitis virus (TBEV)-infected
macrophages. Clin. Exp. Immunol. 110: 358-361.
Kreutzberg, G.W. (1996). Microglia: a sensor for pathological events in the CNS.
Trends Neurosci. 19: 312-318.
Kunzi, M.S., and Pitha, P.M. (2000). The role of cytokines in viral infections, p.193-
210. In: L. Collier, A. Balows, M. Susswan, et al., (eds.), Topley and Wilson’s
Microbiology and microbial infections 9th
edition, Oxford University Press, New
York.
Kurane, I. (2002). Immune responses to Japanese encephalitis virus. Curr. Topic.
Immunol. Microbiol. 267: 91-104.

REFERENCES
254
Kurane, I., Hebblewaite, D., Brandt, W.E., and Ennis, F.A. (1984). Lysis of dengue
virus-infected cells by natural cell-mediated cytotoxicity and antibody-dependent cell-
mediated cytotoxicity. J. Virol. 52: 223-230.
Kurane, I., Innis, B.L., Nimmannitya, S., Nisalak, A.M., Meager, A., Janus, J., and
Ennis, F.A. (1991). Activation of T lymphocytes in dengue virus infections: high
levels of soluble interlukin 2 receptor, soluble CD4, soluble CD8, interleukin 2, and
interferon-γ in sera of children with dengue. J Clin. Invest. 88: 1473-1480.
Labrada, L., Liang, X.H., Zheng, W., Johnston, C., and Levine, B. (2002). Age-
dependent resistance to lethal alphavirus encephalitis in mice: analysis of gene
expression in the central nervous system and identification of a novel interferon-
inducible protective gene, mouse ISG12. J. Virol. 76: 11688-11703.
Lanciotti, R.S., Ebel, G.D., Deubel, V., Kerst, A.J., Murri, S., Meyer, R., Bowen, M.,
McKinney, N., Morrill, W.E., Crabtree, M.B., Kramer, L.D., and Roehrig, J.T. (2002).
Complete genome sequence and phylogenetic analysis of West Nile virus strains
isolated from the United States, Europe and the Middle East. Virology. 298: 96:105.
Lanciotti, R.S., Roehrig, J.T., Deubel, V., Smith, J., Parker, M., Steele, K., Crise, B.,
Volpe, K.E., Crabtree, M.B., Scherret, J.H., Hall, R.A., MacKenzie, J.S., Cropp, C.B.,
Panigrahy, B., Ostlund, E., Schmitt, B., Malkinson, M., Banet, C., Weissman, J.,
Komar, N., Savage, H.M., Stone, W., McNamara, T., and Gubler, D.J. (1999). Origin
of the West Nile virus responsible for an outbreak of encephalitis in the northeastern
United States. Science. 286: 2333-2337.
Lathbury, L.J., Allan J.E., Shellam, G.R. and Scalzo, A.A. (1996). Effect of host
genotype in determining the relative roles of natural killer cells and T cels in
mediating protection against murine cytomegalovirus infection. J. Gen. Virol. 77:
2603-2613.
Lee, C.G.L., Gregg, A.R., and O’Brien, W.E. (1995). Localisation of the neuronal
form of nitric oxide synthetase to mouse chromosome 5. Mamm. Genome. 6: 56-57.
Lee, E., Fernon, C., Simpson, R., Weir R.C., Rice, C.M. and Dalgarno, L. (1990).
Sequence of the 3’ half of Murray Valley encephalitis virus and mapping of the non-
structural NS1, NS3 and NS5. Virus Genes. 4: 197-213.

REFERENCES
255
Lee, E., and Lobigs, M. (2002). Mechanism of virulence attenuation of
glycosaminoglycan-binding variants of Japanese encephalitis virus and Murray Valley
encephalitis virus. J. Virol. 76: 4901-4911.
Lee, J.W.M., Chu, J.J.H., and NG, M.L. (2006). Quantifying the specific binding
between West Nile vurs envelope domain III protein and the cellular receptor αVβ3
integrin. J Biol. Chem. 281: 1352-1360.
Levine, B. (2002). Apoptosis in viral infections of neurons: a protective or
pathological host response? Curr. Topic Microb. Immunol. 265: 95-118.
Li, J., Bhuvanakantham, K., Howe, J., and Ng, M.L. (2005). Identifying the region
influencing the cis-mode of maturation of West Nile (Sarafend) virus using chimeric
infectious clones. Biochem. Biophys. Res. Commun. 334: 714-720.
Li, Y.M., Baviello, G., Vlassara, H., and Mitsuhashi, T. (1977). Glycation products in
aged thioglycollate medium enhance the elicitation of peritoneal macrophages. J.
Immunol. 201: 183-188.
Li, Y.M., Baviello, G., Vlassara, H., and Mitsuhashi, T. (1977). Glycation products in
aged thioglycollate medium enhance the elicitation of peritoneal macrophages. J.
Immunil. Meth. 201: 183-188.
Liao, C.L., Lin, Y.L., Wang, J.J. Huang, Y.L., Yeh, C.T., Ma, S.H., and Chen, L.K.
(1997). Effect of enforced expression of human bcl-2 on Japanese encephalitis virus-
induced apoptosis in cultured cells. J. Virol. 71: 5963-5971.
Libraty, D.H., Pichyangkul, S., Ajariyakhajorn, C., Endy, T.P., and Ennis, F.A.
(2001). Human dendritic cells are activated by dengue virus infection: Enhancement
by gamma interferon and implications for disease pathogenesis. J. Virol. 75: 3501-
3508.
Licinio, J., Prolo, P., McCann, S.M., and Wong, M.L. (1999). Brain iNOS: current
understanding and clinical implications. Mol. Med. Today 5: 225-232.
Licon Luna, R.M., Lee, E., Mullbacher, A., Blanden, R.V., Langman, R., and Lobigs,
M. (2002). Lack of both Fas ligand and perforin protects from flavivirus-mediated
encephalitis in mice. J. Virol. 76: 3202-3211.
REFERENCES
256
Liebert, U.G. (2001). Slow and persistent virus infections of neurones – a compromise
for neuronal survival. Curr. Top. Microbiol. Immunol. 253: 35-60.
Liehne, P.F., Anderson, S., Stanley, N.F., Liehne, C.G., Wright, A.E., Chan, K.H.,
Leivers, S., Britten, D.K., and Hamilton, N.P. (1976). Isolation of Murray Valley
encephalitis virus and other arboviruses in the Ord River Valley 1972-1976. Aust. J.
Exp. Biol. Med. Sci. 59: 347-356.
Ligon, B.L. (2005). Dengue feverand dengue haemorrhagic fever: A review in history,
transmission, treatment and prevention. Semin. Pediatr. Infect. Dis. 16: 60-65.
Lin, Y.L., Huang, Y.L., Ma, S.H., Yeh, C.T., Chiou, S.Y., Chen, L.K., and Liao, C.L.
(1997). Inhibition of Japanese encephalitis virus infection by nitric oxide: antiviral
effect of nitric oxide on RNA virus replication. J. Virol. 71: 5227-5235.
Lindenbach, B.D., and Rice, C.M. (1999). Genetic interaction of flavivirus
nonstructural proteins NS1 and NS4A as a determinant of replicase function. J.Virol.
736: 4611-4621.
Lindenbach, B.D., and Rice, C.M. (2001). Flaviviridae: The viruses and their
replication, p.991-1041. In: D.M. Knipe, P.M. Howley, D.E. Griffin et al. (eds.),
Fields Virology. 4th
edition, LippinCort Williams and Wilkins, Philadelphia.
Lindenbach, B.D., and Rice, C.M. (2003). Molecular biology of flaviviruses.
Adv. Virus Res. 59: 23-61.
Liou, M.L., and Hsu, C.Y. (1998). Japanese encephalitis virus is transported across the
cerebral blood vessels by endocytosis in mouse brain. Cell Tissue Res. 293: 389-394.
Liu, T., and Chambers, T.J. (2001). Yellow Fever virus encephalitis: Properties of the
brain-associated T-cell response during virus clearance in normal and gamma
interferon-deficient mice and requirement for CD4+ lymphocytes. J. Virol. 75: 2107-
2118.
Liu, W.J., Chen, H.B., and Khromykh, A.A. (2003). Molecular and functional analysis
of Kunjin virus infectious cDNA clones demonstrate the essential roles for NS2A in
virus assembly and for a nonconservative residue in NS3 in RNA replication. J. Virol.
77: 7804-7813.

REFERENCES
257
Liu, W.J., Wang, X.J., Clark, D.C., Lobigs, M., Hall, R.A., and Khromykh, A.A.
(2006). A single amino acid substitution in the West Nile virus nonstructural protein
NS2A disables its ability to inhibit alpha/beta interferon induction and attenuates virus
virulence in mice. J. Virol. 80: 2396-2404.
Liu, Y., Blanden, R.V., and Mullbacher, A. (1989a). Identification of cytolytic
lymphocytes in West Nile virus infected murine central nervous system. J. Gen. Virol.
70: 565-573.
Liu, Y., King, N.J.C., Kesson, A.M., Blanden, R.V., and Mullbacher, A. (1989b).
Flavivirus infection up-regulates the expression of class I and class II major
histocompatibility antigens on and enhances T cell recognition of astrocytes in vitro. J.
Neuroimmunol. 21: 157-168.
Lo, M.K., Tilgner, M., Bernard, K.A., and Shi, P.Y. (2003). Functional analysis of
mosquito-borne flavivirus conserved sequence elements within 3’ untranslated region
of West Nile virus by use of a reporting replicon that differentiates between viral
translation and RNA replication. J. Virol. 77: 10004-10014.
Lobigs M., Mullbacher A., and Regner M. (2003b). MHC class I up-regulation by
flaviviruses: Immune interaction with unknown advantage to host or pathogen.
Immunol. Cell. Biol. 81: 217-223.
Lobigs, M., and Lee, E. (2004). Inefficient signalase cleavage promotes efficient
nucleocapsid incorporation into budding flavivirus membranes. J. Virol. 78: 178-186.
Lobigs, M., Arthur, C.E., Mullbacher, A., and Blanden, R.V. (1994). The flavivirus
nonstructural protein NS3 is a dominant source of cytotoxic T cell peptide
determinants. Virology. 202: 195-201.
Lobigs, M., Mullbacher, A., Wang, Y., Pavy, M., and Eva, L. (2003a). Role of type I
and type II interferon responses in recovery from infection with an encephalitic
flavivirus. J.Gen. Virol. 84: 567-572.
Lobigs, M., Usha, R., Nestorowicz, A., Marshall, I.D., Weir, R.C., and Dalgarno, L.
(1990). Host cell selection of Murray Valley encephalitis virus variants altered at an
RGD sequence in the envelope protein and in mouse virulence. Virology. 176: 587-

REFERENCES
258
595.
Loke, H., Bethell, D.B., Phuong, C.X., Dung, M., Schneider, J., White, N.J., Day,
N.P., Farrar, J., and Hill, A.V. (2001). Strong HLA class
I-restricted
T
cell
responses
in
dengue hemorrhagic fever:
a
double-edged
sword?
J. Infect. Dis. 184: 1369-1373.
Lorenz, I.C., Allison, S.L., Heinz, F.X., and Helenius, A. (2002). Folding and
dimerization of tick-borne encephalitis virus envelope proteins prM and E in the
endoplasmic reticulum. J. Virol. 76: 5480-5491.
Lorenz, I.C., Kartenbeck, J., Mezzacasa, A., Allison, S.L. Heinz, F.X., and Helenius,
A. (2003). Intracellular assembly and secretion of recombinant subviral particles from
tick-borne encephalitis virus. J. Virol. 77: 4370-4382.
Lucas, M., Mashimo, T., Frenkiel, M.P., Simon-Chazottes, D., Montagutelli, X.,
Ceccaldi, P.E., Guenet, J.L., and Despres, P. (2003). Infection of mouse neurones by
West Nile virus is modulated by interferon-inducible 2’-5’ oligoadenylate synthetase
1b protein. Immunol. Cell Biol. 81: 230-236.
Lucas, S.M., Rothwell, N.J., and Gibson, R.M. (2006). The role of inflammation in
CNS injury and disease. British J. Pharmacology. 147: S232-S240.
Lucey, D.R., Clerici, M., and Shearer, G.M. (1996). Type 1 and Type 2 Cytokine
Dysregulation in Human Infectious, Neoplastic, and Inflammatory Diseases. Clin.
Microb. Rev. 9: 532-562.
Lustig, S., Danenberg, H.D., Kafri, Y., Kobiler, D., and Ben-Nathan, D. (1992). Viral
neuroinvasion and encephalitis induced by lipopolysaccharide and its mediators. J.
Exp. Med. 176: 707-712.
Lyman, M.A., Myoung, J., Mohindru, M., and Kim, B.S. (2004). Qualitative, not
quantitative, differences in CD8+ T cell responses to Theiler’s murine
encephalomyelitis virus between resistant C57BL/6 and susceptible SJL/J mice. Eur.
J. Immunol. 34: 2730-2739.
Lynch, C.J., and Hughes, T.P. (1936). The inheritance of susceptibility to yellow fever
encephalitis in mice. Genetics. 21: 104-112.
Mackenzie, J.M., and Westaway, E.G. (2001). Assembly and maturation of the

REFERENCES
259
flavivirus Kunjin appear to occur in the rough endoplasmic reticulum and along the
secretory pathway, respectively. J. Virol. 75: 10787-10799.
Mackenzie, J.M., Jones, M.K., and Young, P.R. (1996). Immunolocalization of the
Dengue virus nonstructural glycoprotein NS1 suggests role in viral RNA replication.
Virology. 220: 232-240.
Mackenzie, J.S., Barret, A.D.T., and Deubel, V. (2002a). The Japanese encephalitis
serological group of Flaviviruses: a brief introduction to the group. Curr. Top.
Microbiol. Immunol. 267: 1-10.
Mackenzie, J.S., Gubler, D.J., and Peterson, L.R. (2004). Emerging flaviviruses: the
spread and resurgence of Japanese encephalitis, West Nile and dengue viruses. Nat.
Med. Supp. 10: 98-109.
Mackenzie, J.S., Johansen, C.A., Ritchie, S.A., van den Hurk, A.F., and Hall, R.A.
(2002b). Japanese encephalitid as an emerging virus: the emergence and spread of
Japanese encephalitis virus in Australasia. Curr. Top. Microbiol. Immunol. 267: 49-74.
Mandl, C.W., Guirakhoo, F., Holzmann, H., Heinz, F.X., and Kunz, C. (1989).
Antigenic structure of the flavivirus envelope protein E at the molecular level, using
tick-borne encephalitis virus as a model. J. Virol. 63: 564-71.
Mangada, M.M., Endy, T.P., Nisalak, A., Chunsuttiwat, S., Vaughn, D.W., Libraty,
D.H., Green, S., Ennis, F.A., and Rothman, A.L. (2002). Dengue-specific T cell
responses in peripheral blood mononuclear cells obtained prior to secondary dengue
virus infections in Thai schoolchildren. J. Infect. Dis. 185: 1697-1703.
Mashimo, T., Lucas, M., Simon-Chazottes, D., Frenkiel, M.P., Montagutelli, X.,
Ceccaldi, P.E., Deubel, V., Guenet, J.L., Despres, P.A. (2002). Nonsense mutation in
the gene encoding 2'-5'-oligoadenylate synthetase/L1 isoform is associated with West
Nile virus susceptibility in laboratory mice.
Proc. Natl. Acad. Sci. USA. 99:11311-6.
Mathur, A., Arora, K.L., and Chaturvedi, U.C. (1983). Host defence mechanisms
against Japanese Encephalitis virus infection in mice. J. Gen Virol. 64: 805-811.
Mathur, A., Khanna, N., and Chaturvedi, U.C. (1992). Breakdown of blood-brain

REFERENCES
260
barrier by virus-induced cytokine during Japanese encephalitis virus infection. Int. J.
Exp. Path. 73: 603-611.
McMahon, E.J., Bailey, S.L., and Miller, S.D. (2006). CNS dendritic cells: critical
participants in CNS inflammation? Neurochem. Int. 49: 195-203.
McMinn, P.C. (1997). The molecular basis of virulence of the encephalitogenic
flaviviruses. J. Gen. Virol. 78: 2711-2722.
McMinn, P.C., Dalgarno, L., and Weir, R.C. (1996). A comparison of the spread of
Murray Valley encephalitis viruses of high or low neuroinvasiveness in the tissues of
swiss mice after peripheral inoculatin. Virology. 220: 414-423.
McMinn, P.C., Lee, E., Hartley, S., Roehrig, J.T., Dalgarno, L., and Weir, R.C.
(1995). Murray Valley encephalitis virus envelope protein antigenic variants with
altered hemagglutination properties and reduced neuroinvasiveness in mice. Virology.
211: 10-20.
Mims, C.A. 1960. Intracerebral injections and the growth of viruses in the mouse
brain. Br. J. Exp. Pathology. 41: 52-59.
Mizuno, T., Goto, Y., Bab, K., Masuda, K., Ohno, K., and Tsujimoto, H. (2001).
TNF-induced cell death in Feline Immunodeficiency virus-infected cells is mediated
by the caspase cascade. Virology. 287: 446-455.
Momburg, F., Mullbacher, A., and Lobigs, M. (2001). Modulation of transporter
associated with antigen processing (TAP)-mediated peptide import into the
endoplasmic reticulum by Flavivirus infection. J. Virol. 75: 5663-5671.
Monath, T.P., and Borden, E.C. (1971). Effects of thorotrast on humoral antibody,
viral multiplication, and interferon during infection with St. Louis encephalitis virus in
mice. J. Infect. Dis. 123: 297-300.
Mongkolsapaya, J., Duangchinda, T., Dejnirattisai, W., Vasanawathana, S., Avirutnan,
P., Jairungsri, A., Khemnu, N., Tangthawornchaikul, N., Chotiyarnwong, P., Sae-Jang,
K., Koch, M., Jones, Y., McMichael, A., Xu, X., Malasit, P., and Screaton, G. (2006).
T cell responses in dengue hemorrhagic fever: are cross-reactive T cells suboptimal? J.
Immunol. 176: 3821-3829.

REFERENCES
261
Mullbacher, A., and Lobigs, M. (1995). Up-regulation of MHC class I by flavivirus-
induced peptide translocation into the endoplasmic reticulum. Immunity. 3: 207-214.
Mullbacher, A., Lobigs, M., and Lee, E. (2003). Immunology of mosquito-borne
encephalitic flavivirus. Adv. Virus. Res. 60: 87-120.
Mullbacher, A., Lobigs, M., Hia, R.T., Tran, T., Stehle, T., and Simon, M.M. (2002).
Antigen-dependent release of IFN-γ by cytotoxic T cells up-regulates Fas on target
cells and facilitates exocytosis-independent specific target cell lysis. J. Immunol. 169:
145-150.
Munoz-Jordan, J.L., Sanchez-Burgos, G.G., Laurent-Rolle, M., and Garcia-Sastre, A.
(2003). Inhibition of interferon signaling by dengue virus. PNAS. 100: 14333-14338.
Murali-Krishna, K., Ravi, V., and Manjunath, R. (1994). Cytotoxic T lymphocytes
raised against Japanese encephalitis virus: Effector cell phenotype, target specificity
and in vitro virus clearance. J. Gen. Virol. 75: 799-807.
Murali-Krishna, K., Ravi, V., and Manjunath, R. (1996). Protection of adult but not
newborne mice against lethal intracerebral challenge with Japanese encephalitis virus
by adoptively transferred virus-specific cytotoxic T lymphocytes: requirement for
L3T4+ T cells. J. Gen. Virol. 77: 705-714.
Murray, J.M., Aaskov, J.G., and Wright, P.J. (1993). Processing of the dengue virus
type 2 proteins prM and C-prM. J. Gen. Virol. 74: 175-182.
Muylaert, I.R., Chambers, T.J., Galler, R.G., and Rice, C.M. (1996). Mutagenesis of
the N-linked glycosylation sites of yellow fecer virus NS1 protein: Effects on virus
replication and mouse neurovirulence. Virology. 222: 159-168.
Nash, A.A., and Usherwood, E.J. (2000). The immune response to viral infections,
p.173-191. In: L. Collier, A. Balows, M. Susswan, et al., (eds.), Topley and Wilson’s
Microbiology and microbial infections 9th
edition, Oxford University Press, New
York.
Nathan, C. (1992). Nitric oxide as a secretory product of mammalian cells. FASEB 6:
3051-3064.
Nathanson, N., and Cole, G.A. (1970). Fatal Japanese encephalitis virus infection in

REFERENCES
262
immunosuppressed spider monkeys. Clin. Exp. Immunol. 6: 161-166.
Navarro-Sanchez, E., Depres, P., and Cedillo-Barron, L. (2005). Innate immune
responses to Dengue virus. Arch. Medic.Res. 36: 425-435.
Neves-Souza, P.C., Azeredo, E.L., Zagne, S.M., Valls-de-Souza, R., Reis, S.R.,
Cerqueira, D.I., Nogueira, R.M., and Kubelka, C.F. (2005). Inducible nitric oxide
synthase (iNOS) expression in monocytes during acute Dengue Fever in patients and
during in vitro infection. BMC Infect Dis. 5: 64.
Ng, M.L., and Chu, J.H. (2002). Interaction of West Nile and Kunjin viruses with
cellular components during morphogenesis. Curr. Topic. Microbiol. Immunol. 267:
353-372.
Ng, M.L., and Lau, L.C. (1988). Possible involvement of receptors in the entry of
Kunjin virus into Vero cells. Arch. Virol. 100: 199-211.
Ng, M.L., Sreenivasan, V., and Mulders, J.J.L. (1994). Flavivirus West Nile
(Sarafend) egress at the plasma membrane. Arch. Virol. 137: 303-313.
Ng, M.L., Tan, S.H., and Chu, J.J.H. (2001). Transport and budding at two distinct
sites of visible nucleocapsids of West Nile (Sarafend) virus. J. Med. Virol. 65: 758-
764.
O'Garra, A. (1998). Cytokine induce the development of functionally heterogenous T
helper subsets. Immunity. 8: 275-283.
Pantelic, L. (2004). Peritoneal macrophages as an in vitro model of flavivirus
replication and their role in the pathogenesis of WN virus. Ph.D. thesis. Discipline of
Microbiology, School of Biomedical and Chemical Sciences, The University of
Western Australia.
Pantelic, L., Sivakumaran, H., and Urosevic, N. (2005). Differential induction of
antiviral effects against West Nile virus in primary mouse macrophages derived from
flavivirus-susceptible and congenic resistant mice by alpha/beta interferon and poly(I-
C). J. Virol. 79: 1753-1764.
Parquet, M.C., Kumatori, A., Haseba, F., Mathenge, E.G., and Igarashi, A. (2002). St.
Louis encephalitis virus induced pathology in cultured cells. Arch. Virol. 147: 1105-

REFERENCES
263
1119.
Parra, B., Hinton, D.R., Marten, N.W., Bergmann, C.C., Lin, M.T., Yang, C.S., and
Stohlman SA. (1999). IFN-gamma is required for viral clearance from central nervous
system oligodendroglia. J. Immunol. 162: 1641-7.
Perelygin, A.A., Scherbik, S.V., Zhulin, I.B., Stockman, B.M., Li, Y., and Brinton,
M.A. (2002). Positional cloning of the murine flavivirus resistance gene. Proc. Natl.
Acad. Sci. USA. 99: 9322-9327.
Perelygin, A.A., Scherbik, S.V., Zhulin, I.B., Stockman, B.M., Li, Y., and Brinton,
M.A. (2002). Positional cloning of the murine flavivirus resistance gene. Proc. Natl.
Acad. Sci. USA. 99: 9322-9327.
Perez, A.B., Garcia, G., Sierra, B., Alvarez, M., Vazquez, S., Cabrera, M.V.,
Rodriquez, R., Rosario, D., Martinez, E., Denny, T., and Guzman, M.G. (2004). IL-10
levels in Dengue patients: Some findings from the exceptional epidemiological
conditions in Cuba. J. Med. Virol. 73: 230-234.
Perry, V.H., and Gordon, S. (1988). Macrophage and microglia in the nervous system.
TINS. 11: 273-277.
Pletnev, A.G., Bray, M., Huggins, J., Lai, C.J. (1992). Construction and
characterization of chimeric tick-borne encephalitis/dengue type 4 viruses.
Proc. Natl. Acad. Sci. USA. 89: 10532-10536.
Polfliet, M.M., Goede, P.H., van Kesteren-Hendrikx, E.M., van Rooijen, N., Dijkstra,
C.D., and van den Berg, T.K. (2001). A method for the selective depletion of
perivascular and meningeal macrophages in the central nervous system. J.
Neuroimmunol. 116: 188-195.
Pope, M., Marsden, P.A., Cole, E., Sloan, S., Fung, L.S., Ning, Q., Ding, J.W.,
Leibowitz, J.L., Phillips, M.J., and Levy, G.A. (1998). Resistance to murine hepatitis
virus strain 3 is dependent on production of nitric oxide.
J. Virol. 72: 7084-70s90.
Prikhod’ko, G.G., Prikhod’ko, E.A., Pletnev, A.G., and Cohen, J.I. (2002). Langat
flavivirus protease NS3 binds caspase 8 and induces apoptosis. J.Virol. 76: 5701-5710.

REFERENCES
264
Raghupathy, R., Chaturverdi, U.C., Al-Sayer, H., Elbishbishi, E.A., Agarwal, R.,
Nagar, R., Kapoor, S., Misra, A., Mathur, A., Nusrat, H., Azizieh, F., Khan, M.A., and
Mustafa, A.S. (1998). Elevated levels of IL-8 in dengue hemorrhagic fever. J. Med.
Virol. 56: 280-285.
Raivich, G., and Banati, R. (2004). Brain microglia and blood-derived macrophages:
molecular profiles and functional roles in multiple sclerosis and animal models of
autoimmune demyelinating disease. Brain Res. Brain Res. Rev. 46: 261-281.
Ramshaw, I.A., Ramsay, A.J., Karupiah, G., Rolph, M.S., Mahalingam, S., and Ruby,
J.C. (1997). Cytokines and immunity to viral infections. Immunol Rev. 159: 119- 35.
Ravi, V., Parida, S., Desai, A., Chandramuki, A., Gourie-Devi, M., and Grau, G.E.
(1997). Correlation of tumor necrosis factor levels in the serum and cerebrospinal fluid
with clinical outcome in Japanese encephalitis patients. J. Med. Virol. 51: 132-136.
Redwine, J.M., and Evans, C.F. (2002). Markers of central nervous system glia and
neurons in vivo during normal and pathological conditions. Curr. Top Microbiol.
Immunol. 265: 119-140.
Reed, L.J., and Muench, H. (1938). A simple method of estimating fifty per cent
endpoint. Am. J. Hyg. 27: 493-497.
Regner, M., Lobigs, M., Blanden, R.V., and Mullbacher, A. (2001). Effector cytolytic
function but not IFNγ production in cytotoxic T cells triggered by virus-infected target
cells in vitro. Scan. J. Immunol. 54: 366-374.
Reiss, C.S., and Komatsu, T. (1998). Does nitric oxide play a critical role in viral
infections. J. Virol. 72: 4547-4551.
Reiss, C.S., Chesler, D.A., and Hodges, J. (2002). Innate immune responses in viral
encephalitis. Curr. Topics Microb. Immunol. 265: 63-94.
Rice, C.M. (1996). Flaviviridae: the viruses and their replication, p.931-960. In:
Fields, B.N., Knipe, D.M., and Howley, P.M. (eds.), Fields Virology, 3rd
edition.
Lippincott-Raven Publishers, Philadelphia.
Rice, C.M., Lenches, E.M., Eddy, S.R., Shin, S.J., Sheets, R.L., and Strauss, J.H.
(1985). Nucleotide sequence of yellow fever virus: implications for flavivirus gene

REFERENCES
265
expression and evolution. Science. 229: 726-33.
Rios, M., Zhang, M.J., Grinev, A., Srinivasan, K., Daniel, S., Wood, O., Hewlett, I.K.,
and Dayton, A.I. (2006). Monocytes-macrophages are potential target in human
infection with West Nile virus through blood transfusion. Transfusion. 46: 659-667.
Roehrig, J.T., Hunt, A.R., Johnson, A.J., and Hawkes, R.A. (1989). Synthetic peptides
derived from the deduced amino acid sequence of the E-glycoprotein of Murray
Valley encephalitis virus elicit antiviral antibody.Virology. 171: 49-60.
Rossi, C.P., Delcroix, M., Huitinga, I., McAllister, A., van Rooijen, N., Claassen, E.,
and Brahic, M. (1997). Role of macrophages during Theiler's virus infection. J. Virol.
71: 3336-3340.
Sabin, A.B. (1952a). Genetic, horomonal and age factors in natural resistance to
certain viruses. N Y Acad. Sci. 54: 936-945.
Sabin, A.B. (1952b). Nature of inherited resistance to viruses affecting the nervous
system. Proc. Natl. Acad. Sci. USA. 38: 540-546.
Sabin, A.B. (1954). Genetic factors affecting susceptibility and resistance to viruse
diseases of the nervous system. Res. Publ. Assoc. Res. Nerv. Ment. Dis. 33: 57-66.
Saija, A., Princi, P., Trombetta, D., Lanza, M., and De Pasquale, A. (1997). Changes
in the permeability of the blood-brain barrier following sodium dodecyl sulphate
administration in the rat. Exp. Brain. Res. 115: 546-551.
Sambhi, S.K., Kohonen-Corish, M.R.J., and Ramshaw, I.A. (1991). Local production
of tumor necrosis factor encoded by recombinant vaccinia virus is effective in
controlling viral replication in vivo. Proc. Natl. Acad. Sci. USA. 88: 4025-4029.
Samuel, C.E. (2001). Antiviral action of interferons. Clin. Microbiol. Rev. 14: 778-
809.
Samuel, C.E. (2002). Host genetic variability and West Nile virus susceptibility. Proc.
Natl. Acad. Sci. USA. 99: 11555-11557.
Samuel, M.A., and Diamond, M.S. (2005). Alpha/beta interferon protects against
lethal West Nile virus infection by restricting cellular tropism and enhancing neuronal

REFERENCES
266
survival. J. Virol. 79: 13350-13361.
Sangster, M.Y., and Shellam, G.R. (1986). Genetically controlled resistance to
flaviviruses within the house mouse complex of species. Current Top. Microbiol.
Immunol. 127: 313-318.
Sangster, M.Y., Heliams, D.B., MacKenzie, J.S., and Shellam, G.R. (1993). Genetic
studies of flavivirus resistance in inbred strains derived from wild mice: Evidence for
a new resistance allele at the flavivirus resistance locus (Flv). J. Virol. 67: 340-347.
Sangster, M.Y., Mackenzie, J.S., and Shellam, G.R. (1998). Genetically determined
resistance to flavivirus infection in wild Mus musculus domesticus and other
taxonomic groups in the genus Mus. Arch. Virol. 143: 697-715.
Sangster, M.Y., Urosevic, N., Mansfield, J.P., MacKenzie, J.S., and Shellam, G.R.
(1994). Mapping the Flv locus controlling resistance to flaviviruses on mouse
Chromosome 5. J. Virol. 68: 448-452.
Santana, M.A., and Rosenstein, Y. (2003). What it takes to become an effector T cells:
The process, the cells involved, and the mechanisms. J Cell. Physiol. 195: 392-401.
Satoh, J., Lee, Y.B., and Kim, S.U. (1995). T-cell costimulatory molecules B7-1
(CD80) and B7-2 (CD86) are expressed in human microglia but not in astrocytes in
culture. Brain Res. 704: 92-96.
Saxena, S.K., Singh, A., and Mathur, A. (2000). Antiviral effect of nitric oxide during
Japanese encephalitis virus infrction. Int. J. Exp. Path. 81: 165-172.
Scalzo, A.A., Fitzgerald, N.A., Simmons, A., La Vista, A.B., and Shellam, G.R.
(1990). Cmv-1, a genetic locus that controls murine cytomegalovirus replication in the
spleen. J. Exp. Med. 171: 1469-1483.
Scalzo, A.A., Lyons, P.A., Fitzgerald, N.A., Forbes, C.A., Yokoyama, W.M., and
Shellam, G.R. (1995). Genetic mapping of Cmv1 in the region of mouse chromosome
6 encoding the NK gene complex-associated loci Ly49 and musNKR-P1. Genomics.
27: 435-441.
Scherbik, S.V., Paranjape, J.M., Stockman, B.M., Silverman, R.H., and Brinton, M.A.
(2006). RNase L plays a role in the antiviral response to West Nile virus. J. Virol. 80:

REFERENCES
267
2987-2999.
Scherret, J.H., Poidinger, M., Mackenzie, J.S., Broom, A.K., Deubel, V., Lipkin, W.I.,
Briese, T., Gould, E.A., and Hall, R.A. (2001). The relationships between West Nile
and Kunjin viruses. Emerg. Infect. Dis. 7: 697-705.
Schneider-Schaules, S., Dunster, L.M., and ter Meulen, V. (2000). Infections of the
central nervous system. In: Collier L, Balows A, Susswan M, et al., editors. Topley
and Wilson’s Microbiology and microbial infections 9th
edition. New York: Oxford
University Press; 2000:p835-871.
Shaw, D.R., and Griffin Jr, F.M. (1982). Thioglycollate-elicited mouse peritoneal
macrophages are less efficient then resident macrophages in antibody-dependent cell-
mediated cytolysis. J. Immunol. 128: 433-440.
Shaw, G.D., Boll, W., Taira, H., Mantei, N., Lengyel, P., and Weissmann, C. (1983).
Structure and expression of cloned murine IFN-alpha genes. Nucleic Acids Res. 11:
555-573.
Shawar, S.M., Vyas, J.M., Rodgers, P.R., and Rich, R.R. (1994). Antigen presentation
by major histocompatibility complex class I-B molecules. Annu. Rev. Immunol. 12:
839-880.
Shellam, G.R., Sangster, M.Y., and Urosevic, N. (1998). Genetic control of host
resistance to flavivirus infection in animals. Rev. Sci. Tech. Off. Int. Epiz. 17: 231-248.
Shen, J., Devery, J.M., and King, N.J.C. (1995a). Adherence status regulates the
primary cellular activation responses to the flavivirus West Nile. Immunology. 84:
245-264.
Shen, J., Devery, J.M., and King, N.J.C. (1995b). Early induction of interferon-
dependent virus-specific ICAM-1 (CD54) expression by flavivirus in quiescent but not
proliferating fibroblast. Virology. 208: 437-449.
Shen, J., T-To, S.S., Schrieber, L., and King, N.J.C. (1997). Early E-selectin, VCAM-
1, ICAM-1 and late major histocompatibility complex antigen induction on human
endothelial cells by flavivirus and comodulation of adhesion molecule expression by
immune cytokines. J. Virol. 9323-9332.

REFERENCES
268
Shi, P.Y., Tilgner, M., and Lo, M.K. (2002). Construction and characterization of
subgenomic replicons of New York strain of West Nile virus. Virology, 296: 219-233.
Shieh, W.J., Guarner, J., Layton, M., Fine, A., Miller, J., Nash, D., Campbell, G.L.,
roehrig, J.T., Gubler, D.J., and Zaki S.R. (2000). The role of pathology in an
investigation of an outbreak of West Nile encephalitis in New York 1999. Emerg.
Infect. Dis. 6: 370-372.
Shirato, K., Kimura, T., Mizutani, T., Kariwa, H., and Takashima, I. (2004b).
Different chemokine expression in lethal and non-lethal murine West Nile virus
infection. J. Med. Virol. 74: 507-513.
Shirato, K., Miyoshi, H., Goto, A., Ako, Y., Ueki, T., Kariwa, H., and Takashima, I.
(2004a). Viral envelope protein glycosylation is a molecular determinant of the
neuroinvasiveness of the New York strain of West Nile virus. J. Gen. Virol. 85: 3637-
3645.
Shirato, K., Miyoshi, H., Kariwa, H., and Takashima, I. (2006). The kinetics of
proinflammatory cytokines in murine peritoneal macrophages infected with envelope
protein-glycosylated or non-glycosylated West Nile virus. Virus Res. 121:11-6.
Shresta, S., Kyle, J.L., Snider, H.M., Basavapatna, M., Beatty, P.R., and Harris, E.
(2004). Interferon-dependent immunity is essential for resistance to primary dengue
virus infection in mice, whereas T- and B-cell-dependent immunity are less critical.
J. Virol. 78: 2701-2710.
Shrestha, B., and Diamond, M.S. (2004). Role of CD8+ T cells in control of West Nile
virus infection. J. Virol. 78: 8312-8321.
Shrestha, B., Gottlieb, D., and Diamond, M.S. (2003). Infection and injury of neurons
by West Nile encephalitis virus. J. Virol. 77: 13202-13213.
Shrestha, B., Samuel, M.A., and Diamond, M.S. (2006). CD8+ T cells require perforin
to clear west nile virus from infected neurons. J. Virol. 80: 119-129.
Shtrichman, R., and Samuel, C.E. (2001). The role of gamma interferon in
antimicrobial immunity. Curr. Opinion. Microbiol. 4: 251-259.
Shueb, R.H. (2002). Abrogation of host resistance in flavivirus resistant mice

REFERENCES
269
following infection with Kunjin virus. MSc. Prelim. Discipline of Microbiology,
School of Biomedical, Biomolecular and Chemical Sciences, The University of
Western Australia.
Shueb, R.H., Pantelic, L. and Urosevic, N. (2005). A delayed morbidity in genetically
resistant mice triggered by some flaviviruses. Arbovir. Res. Australia. 9: 344-351.
Silvia, O.J. (1999). The analysis of natural resistance to flaviviruses in mice and
different cell culture models. Ph.D. thesis. Discipline of Microbiology, School of
Biomedical and Chemical Sciences, The University of Western Australia.
Silvia, O.J., and Urosevic, N. (1999). Variations in LPS responsiveness among
different mouse substrains of C3H lineage and their congenic derivative sublines.
Immunogenetics. 50: 354-357.
Silvia, O.J., Pantelic, L., Mackenzie, J.S., Shellam, G.R., Papadimitriou, J., and
Urosevic, N. (2004). Virus spread, tissue inflammation and antiviral response in brains
of flavivirus susceptible and resistant mice acutely infected with Murray Valley
encephalitis virus. Arch. Virol. 149: 447-464.
Silvia, O.J., Shellam, G.R., and Urosevic, N. (2001). Innate resistance to flavivirus
infection in mice controlled by Flv is nitric oxide-independent. J. Gen. Virol. 82: 603-
607.
Sitati E.M., and Diamond, M.S. (2006). CD4+ T-cell responses are required for
clearance of West Nile virus from the central nervous system.
J Virol. 80:12060-12069.
Sittisombut, N., Maneekam, N., Kanjanahaluethai, A., Kasinrerk, W., Viputtikul, K.,
and Supawadee, J. (1995). Lack of augmenting effect of interferon-gamma on dengue
virus multiplication in human peripheral blood monocytes. J.Med.Virol. 45: 43-49.
Smith, A.L. (1981). Genetic resistance to lethal flavivirus encephalitis: effect of host
age, and immune status and route of inoculation on production of interfering Banzi
virus in vivo. Am. J. Trop. Med. Hyg. 30: 1319-1232.
Smith, P.L., Lombardi, G., and Foster, G.R. (2005). Type I interferon and the innate
immune response – more than just antiviral cytokines. Mol. Immunol. 42: 869-877.

REFERENCES
270
Solomon, T., and Mallewa, M. (2001). Dengue and other emerging flaviviruses. J.
Infect. 42:104-15.
Solomon, T., and Vaughn, DW. (2002). Pathogenesis and clinical features of Japanese
encephalitis and West Nile virus infections. Curr. Topic Microbiol. Immunol. 267:
171-194.
Solomon, T., Dung, N.M., Kneen, R., Gainsborough, M., Vaughn, D.W., and Khanh,
V.T. (2000). Japanese encephalitis. J. Neurol. Neurosurg. Psychiatry. 68: 405-415.
Solomon, T., Dung, N.M., Wills, B., Kneen, R., Gainsborough, M., Diet, T.V., Thuy,
T.T., Loan, H.T., Khank, V.C., Vaughn, D.W., White, N.J., and Farrar, J.J. (2003).
Interfon alpha-2a in Japanese encephalitis: A randomized double-blind placebo-
controlled trial. Lancet. 361: 821-826.
Soos, J.M., Ashley, T.A., Morrow, J., Patarroyo, J.C., Szente, B.E., and Zamvil, S.S.
(1999). Differential expression of B7 co-stimulatory molecules by astrocytes
correlates with T cell activation and cytokine production.
Int Immunol. 11:1169-79.
Sreenivasan, V., Ng, K.L., and Ng, M.L. (1993). Brefeldin A affects West Nile virus
replication in Vero cells but not C6/36 cells. J. Virol. Methods. 45: 1-17.
Steriade, M. and Llines, R. (1988). The functional states of the thalamus and the
associated neuronal interplay. Physiol. Rev. 68: 699-742.
Stohlman, S.A., Bergmann, C.C., Lin, M.T., Cua, D.J., and Hinton, D.R. (1998). CTL
effector function within the central nervous system required CD4+ T cells. J.
Immunol. 160: 2876-2904.
Stohlman, S.A., Bergmann, C.C., Lin, M.T., Cua, D.J., and Hinton, D.R. (1998). CTL
effector function within central nervous system requires CD4+ T cells. J. Immunol.
160: 2896-2904.
Streit, W. (2002). Microglia as neuroprotective, immunocompetent cells of the CNS.
GLIA. 40: 133-139.
Streit, W.J., Mrak, R.E., and Griffin, W.S. (2004). Microglia and neuroinflammation:

REFERENCES
271
a pathological perspective. J Neuroinflammation. 30:1-14.
Sumiyoshi, H., Mori, C., Fuke, I., Morita, K., Kuhara, S., Kondou, J., Nagamatu, H.,
and Igarashi, A. (1987). Complete nucleotide sequence of the Japanese encephalitis
virus genome RNA. Virology. 161: 497-510.
Suzuki, T., Ogata, A., Tashiro, K., Nagashima, K., Tamura, M., Yasui, K., and
Nishihira, J. (2000). Japanese encephalitis virus up-regulates expression of
macrophage migration inhinitory factor (MIF) mRNA in the mouse brain. Biochim.
Biophys. 1517: 100-106.
Takada, K., Masaki, H., Konishi, E., Takahashi, M., and Kurane, I. (2000). Definition
of an epitope on Japanese encephalitis virus (JEV). Arch. Virol.145: 523-534.
Thomsen, A.R., Nansen, A., Madsen, A.N., Bartholdy, C., and Christensen, J.P.
(2003). Regulation of T cell migration during viral infection: role of adhesion
molecules and chemokines. Immunol. Letters. 85: 119-127.
Tsai, T.F. (2000). Flaviviruses. In: Mandell GL, Bennet JE, Bolin R, editors. Volume
2: Infectious Diseases and Their Etiologic Agents, Principles and Practice of
Infectious Diseases. Fifth edition. Philadelphia, Pensylvania: Churchill Livingstone;
2000, p1715-1736.
Tsai, T.F., Popovici, F., Cernescu, C., Campbell, G.L. and Nedelcu, N.I. (1998). West
Nile encephalitis epidemic in southeastern Romania. Lancet. 352: 767-771.
Urosevic, N. (2003). Is flavivirus resistance interferon type I-independent?
Immunol. Cell Biol. 81:224-9.
Urosevic, N., and Shellam, G.R. (2002). Host genetic resistance to Japanese
encephalitis group viruses. Curr Topics Microbiol Immunol, 267: 153-170.
Urosevic, N., Mann, K., Hodgetts, S.I., and Shellam, G.R. (1997b). The use of
microsatellites in high-resolution around the mouse flavivirus resistance locus (Flv).
Arbovirus Res. Aust. 7: 296-299.
Urosevic, N., Ondine, J.S., Sangster, M.Y., Mansfield, J.P., Hodgetts, S.I., and
Shellam, G.R. (1999). Development and characterization of new flavivirus resistant
mouse strains bearing Flvr-like and Flv
mr alleles from wild or wild-derived mice. J.

REFERENCES
272
Gen. Virology. 80: 897-906.
Urosevic, N., Sangster, M.Y., Mansfield, J.P., and Shellam, G.R. (1993). Flavivirus
resistance (Flvr) gene is mice: mapping studies. Arbovirus Res. Aust. 6: 130-134.
Urosevic, N., Silvia, O.J., and Shellam G.R. (2000). Host natural resistance to
flaviviruses controlled by Flv. Res. Adv. Virol. 1: 79-89.
Urosevic, N., van Maanen, M., Mansfield, J.P., Mackenzie, J.S., and Shellam, G.R.
(1990). Molecular characterization of virus-specific RNA produced in the brains of
flavivirus susceptible and resistant mice after challenge with Murray Valley
encephalitis virus. J. Gen. Virol. 78: 23-29.
Vainio, T. (1963a). Virus and hereditary resistance in vitro. I. Behavior of West Nile
(E101) virus in the cultures prepared from genetically resistant and susceptible strains
of mice. Ann. Med. Exp. Biol. Fenn. 41: 1-24.
Vainio, T. (1963b). Virus and hereditary resistance in vitro. II. Behavior of West Nile
(E101) virus in the cultures prepared from challenged resistant, challenged backcross
and non-challenged susceptible mice. Ann. Med. Exp. Biol. Fenn. 41: 25-35.
Vainio, T., Gwatkin, R., and Koprowski, H. (1961). Production of interferon by brains
of genetically resistant and susceptible mice infected with West Nile Virus. Virology.
14: 385-387.
van der Most, R.G., Harrington, L.E., Giuggio, V., Mahar, P.L., and Ahmed, R.
(2002). Yellow fever virus 17D envelope and NS3 proteins are major targets of the
antiviral T cell response in mice. Virology. 296: 117-124.
van Furth R. (1977). The role of phagocytic cells in the defence of the host.
Acta Paediatr Belg. 30: 133-144.
van Furth, R., Diesselhoff-Den Dulk, M.M.C., and Mattie, H. (1973). Quantitative
study on the production and kinetics of mononuclear phagocytes during an acute
inflammatory reaction. J. Exp. Med. 138: 1314-1328.
van Furth, R. (1981). Current view of the mononuclear phagocyte system. Haematol.
Blood Transfus. 27: 3-10.

REFERENCES
273
van Rooijen, N., and Sanders, A. (1994) Liposome mediated depletion of
macrophages: mechanism of action, preparation of liposomes and applications. J
Immunol Methods. 174: 83-93.
Vasconcelos, P.F., Rosa, A.P., Rodrigues, S.G., Rosa, E.S., Monteiro, H.A., Cruz,
A.C., Barros, V.L., Souza, M.R., and Rosa, J.F. (2001). Yellow fever in ParAi State,
Amazon region of Brazil, 1998-1999: entomologic and epidemiologic findings.
Emerg. Infect. Dis. 7: 565-569.
Vilhardt, F. (2005). Microglia: phagocyte and glia cell. Int. J. Biochem. Cell. Biol. 37:
17-21.
Wang, T., Scully, E., Yin, Z., Kim, J.H., Wang, S., Yan, J., Mamula, M., Anderson,
J.F., Craft, J., and Fikrig, E. (2003a). IFN-producing dT cells help control murine
West Nile virus infection. J. Immunol. 171: 2524-2431.
Wang, T., Town, T., Alexopoulou, L., Anderson, J.F., Fikrig, E., and Flavell, R.A.
(2004a). Toll-like receptor 3 mediates West Nile virus entry into the brain causing
lethal encephalitis. Nat. Medicine. 10: 1366-1373
Wang, Y., Lobigs, M., Lee, E., and Mullbacher, A. (2003b). CD8+ T cells mediate
recovery and immunopathology in West Nile virus encephalitis. J. Virol. 77: 13323-
13334.
Wang, Y., Lobigs, M., Lee, E., and Mullbacher, A. (2004b). Exocytosis and Fas
mediated cytolytic mechanisms exert protection from West Nile virus induced
encephalitis in mice. Immunol. Cell Biol. 82: 170-173.
Wang, Y., Lobigs, M., Lee, E., Koskinen, A., and Mullbacher A. (2006). CD8(+) T
cell-mediated immune responses in West Nile virus (Sarafend strain) encephalitis are
independent of gamma interferon. J Gen Virol. 87:3599-609.
Webster, L.T. (1937). Inheritence of resistance of mice to enteric bacterial and
neurotropic viral infections. J. Exp. Med. 65: 261-286.
Webster, L.T., and Clow, A.D. (1936). Experimental encephalitis (St. Louis type) in
mice with high inborn resistance. A chronic subclinical infection. J Exp. Med. 63:
827-945.

REFERENCES
274
Webster, L.T., and Johnsen, M.S. (1941). Comparative virulence of St. Louis
encephalitis virus cultured with brain tissue from innately susceptible and innately
resistant mice. J. Exp. Med. 74: 489-494.
Westaway, E.G. (1987). Flavivirus replication strategy. Adv Virus Res. 33: 45-90.
Westaway, E.G., Brinton, M.A., Gaidamovich, S.Y, Horzinek, M.C., Igarashi, A.,
Kaariainen, L., Lvov, D.K., Porterfield, J.S., Russell, P.K., and Trent, D.W. (1985).
Flaviviridae: Report of Togaviridae study group, Vertebrate Virus Subcommittee,
International Committee on Taxonomy of Viruses. Intervirology. 24: 183-192.
Westaway, E.G., Mackenzie, J.M., and Khromykh, A.A. (2002). Replication and gene
function in Kunjin virus. Curr. Topic. Microbiol. Immunol. 267: 323-352.
Westaway, E.G., Mackenzie, J.M., Kenney, M.T., Jones, M.J., and Khromykh, A.A.
(1997). Ultrasutructure of Kunjin virus infected cells: colocalization of NS1 and NS3
with double-stranded RNA and of NS2B with NS3 in virus induced membrane
structures. J. Virol. 71: 6650-6661.
Whitmire, J.K., Tan, J.T., and Whitton, J.L. (2005). Interferon-γ acts directly on CD8+
T cells to increase their abundance during virus infection. J. Exp. Medicine. 201:
1053-1059.
Whitton, J.L., Slifka, M.K., Liu, F., Nussbaum, A.K., and Whitmire JK. (2004). The
regulation and maturation of antiviral immune responses.
Adv Virus Res. 63:181-238.
Winter, P.M., Dung, N.M., Loan, H.T., Kneen, R., Wills, B., Thu, L.T., House, D.,
White, N.J., Farrar, J.J., Hart, A., Solomon, T. (2004). Proinflammatory cytokines and
chemokines in humans with Japanese encephalitis. J. Infect. Dis. 190: 1618-1626.
Wu, G.F., and Perlman, S. (1999). Macrophage infiltration, but not apoptosis is
correlated with immune-mediated demyelination following murine infection with a
neurotropic coronavirus. J. Virol. 73: 8771-8780.
Wu, J., Bera, A.K., Kuhn, R.J., and Smith, J.L. (2005). Structure of the Flavivirus
helicase: Implications for catalytic activity, protein interactions, and proteolytic
processing. J. Virol. 79: 10268-10277.

REFERENCES
275
Wu, S.J., Grouard-Vogel, G., Sun, W., Mascola, J.R., Brachtel, E., Putvatana, R.,
Louder, M.K., Filgueira, L., Marovich, M.A., Wong, H.K., Blauvelt, A., Murphy,
G.S., Robb, M.L., Innes, B.L., Birx, D.L., Hayes, C.G., and Frankel, S.S. (2000).
Human skin Langerhans cells are targets of dengue virus infection. Nature Med. 6:
816-820.
Xiao, S.Y., Guzman, H., Zhang, H., Travassos da Rosa, A.P., and Tesh, R.B. (2001).
West Nile virus infection in the golden hamster (Mesocricetus auratus): a model for
West Nile encephalitis.Emerg Infect Dis. 7:714-21.
Yamshchikov, V.F., and Compans, R.W. (1993). Regulation of the late events in
flavivirus protein processing and maturation. Virology. 192: 38-51.
Yang, D., Yeh, W.T., Chen, R.F., Chuon, H.L., Tsai, H.P., Yao, C.W., and Shaio,
M.F. (2004). A model to study neurotropism and persistency of Japanese encephalitis
virus infection in human neuroblastoma cells and leukocytes. J. Gen. Virol. 85: 635-
642.
You, S., Falgout, B., Markoff, L., and Padmanabhan, R. (2001). In vitro RNA
synthesis from exogenous dengue viral RNA templates requires long range
interactions between 5'- and 3'-terminal regions that influence RNA structure. J Biol
Chem. 276: 15581-15591.
Zhao, J., Hinton, D.R., Stohlman, S.A., Liu, C.P., Zhong, L., and Marten, N.W.
(2005). Maintenance of CD8+ T cells during acute viral infection of the central
nervous system required CD4+ T cells but not Interleukin-2. Virol. Immunol. 18: 162-
169.
Zhou, A., B. A. Hassel, and R. H. Silverman. 1993. Expression cloning of 2-5A-
dependent RNase: a uniquely regulated mediator of interferon action. Cell 72:753-
765.
Zisman, B., Wheelock, E.F., and Allison, A.C. (1971). Role of macrophages and
antibody in resistance of mice against yellow fever virus. J Immunol. 107: 236-43.