contrasting electroabsorbance behavior of two borderline class ii/class iii mixed-valence systems
TRANSCRIPT
www.elsevier.com/locate/chemphys
Chemical Physics 319 (2005) 28–38
Contrasting electroabsorbance behavior of two borderline classII/class III mixed-valence systems
Peter H. Dinolfo, Robert D. Williams, Joseph T. Hupp *
Department of Chemistry, Northwestern University, 2145 Sheridan Road, Evanston, IL 60208-3113, USA
Received 6 May 2005; accepted 10 May 2005Available online 5 July 2005
Abstract
Intervalence Stark effect spectroscopy of a symmetrically substituted and an asymmetrically substituted derivative of the Creutz–Taube ion, ðNH3Þ5Ru-pyrazine-RuðNH3Þ5þ5 , is reported. Like the formally mixed-valent parent ion, both appear to lie near theboundary between valence delocalization and valence localization. Remarkably, despite the close structural similarities of thetwo compounds investigated, the corresponding electroabsorbance spectra are grossly different. Furthermore, neither spectrum iswell fit by a classic Liptay approach. An alternative, qualitative approach that allows for the possibility that the externally appliedelectric field itself affects the degree of valence delocalization and, therefore, the electroabsorbance spectrum, was employed. Thealternative approach relies upon the availability of compounds closely analogous to the investigated compounds, but differingslightly in degree of redox asymmetry. A subtle method for creating such compounds is to partially encapsulate a parent compoundwith a crown ether, such that a lower symmetry assembly is obtained. Using this approach the unusual Stark responses, includingthe disparate responses for symmetric vs. asymmetric structures, are reasonably well reproduced. Intervalence-enhanced resonanceRaman spectra provide additional support for the proposed interpretation.� 2005 Elsevier B.V. All rights reserved.
Keywords: Mixed-valence; Electroabsorbance; Delocalization
1. Introduction
The Creutz–Taube ion, ðNH3Þ5Ru-pyrazine-Ru-ðNH3Þ5þ5 ð1Þ, was one of the first intentionally preparedmixed-valence complexes. It was initially intended toserve as a model system for evaluating key intramolecu-lar electron transfer reaction parameters – specifically,reorganization energies and electronic coupling energies– from intervalence absorption band energies and inten-sities [1,2]. The complex was found to display the hoped-for intervalence absorption, but the properties of theabsorption band differed from those anticipated fromthe classical theory of Hush [3] for Robin-Day class II
0301-0104/$ - see front matter � 2005 Elsevier B.V. All rights reserved.
doi:10.1016/j.chemphys.2005.05.007
* Corresponding author. Fax: +1 847 491 7713.E-mail address: [email protected] (J.T. Hupp).
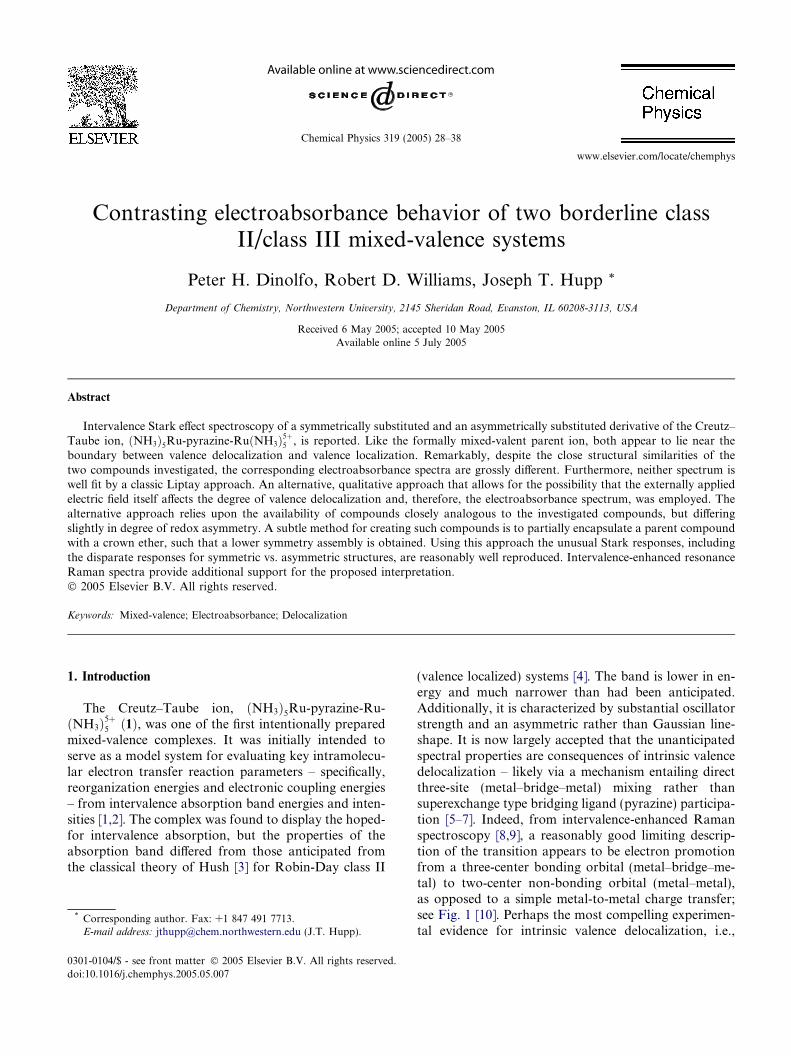
(valence localized) systems [4]. The band is lower in en-ergy and much narrower than had been anticipated.Additionally, it is characterized by substantial oscillatorstrength and an asymmetric rather than Gaussian line-shape. It is now largely accepted that the unanticipatedspectral properties are consequences of intrinsic valencedelocalization – likely via a mechanism entailing directthree-site (metal–bridge–metal) mixing rather thansuperexchange type bridging ligand (pyrazine) participa-tion [5–7]. Indeed, from intervalence-enhanced Ramanspectroscopy [8,9], a reasonably good limiting descrip-tion of the transition appears to be electron promotionfrom a three-center bonding orbital (metal–bridge–me-tal) to two-center non-bonding orbital (metal–metal),as opposed to a simple metal-to-metal charge transfer;see Fig. 1 [10]. Perhaps the most compelling experimen-tal evidence for intrinsic valence delocalization, i.e.,
antibonding
nonbonding
bonding
dπxz dπxzπ∗
Rua Rubpz
N N
ν6a
Fig. 1. Qualitative three-state orbital diagram for the Creutz–Taubeion. The combination of two dpxz(Ru) orbitals and one p*(pyrazine)orbital yields three-center bonding and antibonding molecular orbitals,and a two-center non-bonding orbital. In this model, the intervalencetransition corresponds to promotion of an electron from the bondingorbital to the antibonding orbital. Raman measurements show that them6a mode of pyrazine is strongly coupled to the intervalence transition.
P.H. Dinolfo et al. / Chemical Physics 319 (2005) 28–38 29
Robin-Day class III behavior, comes from electroabsor-bance or Stark spectroscopy. According to Liptay, anelectronic transition that involves a change in dipole mo-ment will display a second-derivative Stark spectralcomponent whose magnitude is proportional to the di-pole moment change or net charge-transfer distance[11]. Consistent with the scheme in Fig. 1 or othercharge-delocalized descriptions, the experimental Starkspectrum of 1 has essentially no second-derivative char-acter [12,13].
Despite the delocalized electronic description, theCreutz–Taube ion appears to fall close to the classIII/class II boundary, perhaps even comprising a‘‘class III–II’’ system in the language of Demadiset al. [14]. Evidence for borderline behavior comes,in part, from studies of chemical perturbations. Seem-ingly small perturbations, either of the external envi-ronment or the primary coordination sphere, caninduce substantial spectral changes – changes that ap-pear to signal the onset of charge localization [15].This is especially true when the perturbations intro-duce a degree of redox asymmetry into the system.(‘‘Redox asymmetry’’ is defined as the energy differ-ence between vibrationally relaxed final and initialstates in the hypothetical limit of no electroniccoupling. For completely symmetrical mixed-valencesystems, the redox asymmetry is zero.) For example,selective encapsulation of one end of the Creutz–
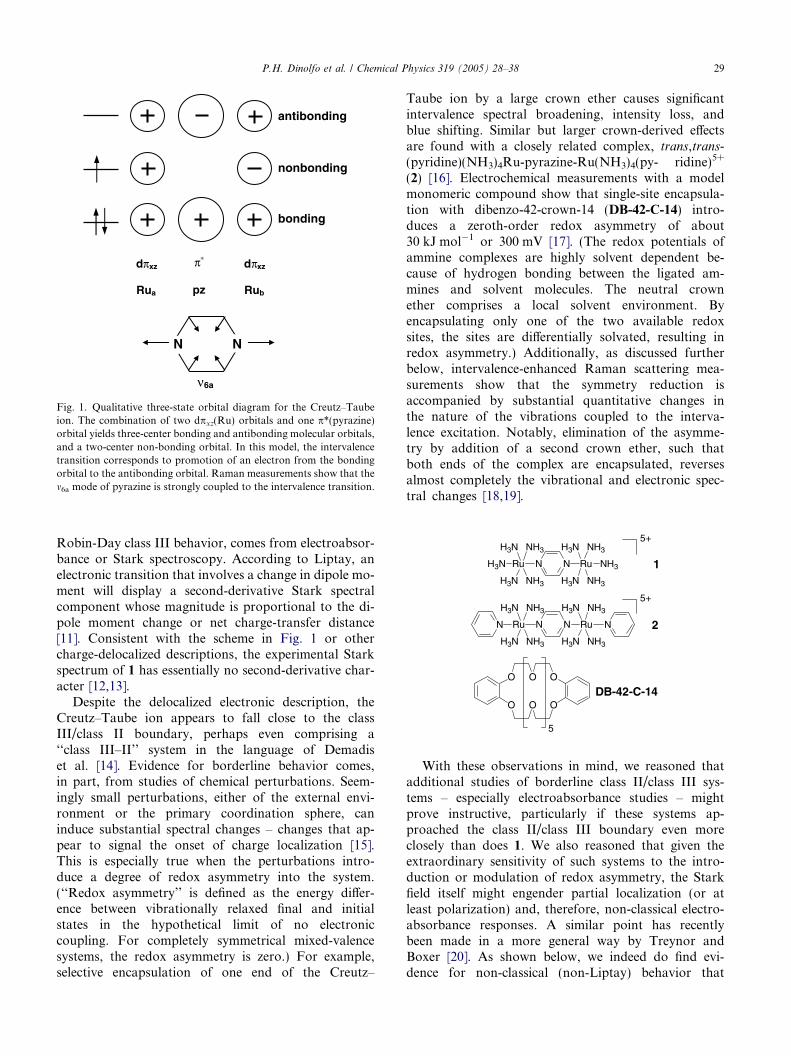
Taube ion by a large crown ether causes significantintervalence spectral broadening, intensity loss, andblue shifting. Similar but larger crown-derived effectsare found with a closely related complex, trans,trans-(pyridine)(NH3)4Ru-pyrazine-Ru(NH3)4(py- ridine)5+
(2) [16]. Electrochemical measurements with a modelmonomeric compound show that single-site encapsula-tion with dibenzo-42-crown-14 (DB-42-C-14) intro-duces a zeroth-order redox asymmetry of about30 kJ mol�1 or 300 mV [17]. (The redox potentials ofammine complexes are highly solvent dependent be-cause of hydrogen bonding between the ligated am-mines and solvent molecules. The neutral crownether comprises a local solvent environment. Byencapsulating only one of the two available redoxsites, the sites are differentially solvated, resulting inredox asymmetry.) Additionally, as discussed furtherbelow, intervalence-enhanced Raman scattering mea-surements show that the symmetry reduction isaccompanied by substantial quantitative changes inthe nature of the vibrations coupled to the interva-lence excitation. Notably, elimination of the asymme-try by addition of a second crown ether, such thatboth ends of the complex are encapsulated, reversesalmost completely the vibrational and electronic spec-tral changes [18,19].
N N RuRu N
H3N NH3
H3N NH3 H3N
NH3H3N
NH3
N
N N RuRu NH3
H3N NH3
H3N NH3 H3N
NH3H3N
NH3
H3N 1
2
5+
5+
O
O
O O
O O
5
DB-42-C-14
With these observations in mind, we reasoned thatadditional studies of borderline class II/class III sys-tems – especially electroabsorbance studies – mightprove instructive, particularly if these systems ap-proached the class II/class III boundary even moreclosely than does 1. We also reasoned that given theextraordinary sensitivity of such systems to the intro-duction or modulation of redox asymmetry, the Starkfield itself might engender partial localization (or atleast polarization) and, therefore, non-classical electro-absorbance responses. A similar point has recentlybeen made in a more general way by Treynor andBoxer [20]. As shown below, we indeed do find evi-dence for non-classical (non-Liptay) behavior that
30 P.H. Dinolfo et al. / Chemical Physics 319 (2005) 28–38
may well reflect incipient electric-field-induced chargelocalization and/or delocalization. Curiously, however,the putative field-induced effects are manifest in dis-tinctly different ways for symmetrical vs. moderatelyasymmetrical mixed-valence systems.
2. Experimental
2.1. Materials
Di-ruthenium complexes 1, 2, 3, and 4 were synthe-sized, as 4+ ions (hexafluorophosphate salts), accordingto the literature methods [15]. Butyronitrile was pur-chased from Aldrich and stored over molecular sieves.NOPF6, employed as an oxidant, was purchased fromStrem and used as received.
2.2. Stark spectroscopy
Samples were prepared by dissolving �1–5 mg of the4+ ions in 1–2 mL of butyronitrile in a quartz cuvettewith a Teflon screw top cap. Small aliquots (a fewmicroliters) of a saturated NOPF6-butyronitrile solu-tion were added to the cell, the mixture was agitatedfor �2 min, and the NIR absorption spectrum was re-corded. Further, oxidant was added until the absorp-tion intensity reached a maximum. The sample wasthen filtered through a 0.22 lm Teflon filter and usedimmediately. Stark measurements were performedusing the same experimental setup as previously de-scribed [21]. Ni coated (�7 nm) glass slides, preparedby thermal evaporation, were used as semi-transparentelectrodes. The cell pathlength was typically 50 lm.Typical field strengths were 6–8 · 107 V/m and typicaloscillation frequencies were 220 Hz. Signals were de-tected by lock-in amplification at twice the modulationfrequency.
2.3. Stark absorption analysis
Analysis of the data was initially performed using theLiptay method [11] as described in detail elsewhere [22].Briefly, each Stark spectrum was fit to a linear combina-tion of the zeroth, first, and second derivatives of thelow-temperature absorption spectrum A(t)
DAðtÞ ¼ AvAðtÞ þBvt15hc
d½AðtÞ=t�dt
þ Cvt
30h2c2d2½AðtÞ=t�
dt2
� �F2int.
ð1ÞIn Eq. (1), DA(t) is the frequency-dependent absorptionchange resulting from electric-field modulation, h isPlanck�s constant, c is the speed of light in vacuum,and t is the frequency of the absorbed light. Fint is theinternal electric field experienced by the chromophoreand can be written as
Fint ¼ f � Fext; ð2ÞwhereFext is the externally applied electric field and f is thelocal-field correction. f = 1.3, a value typically assumedfor organic solvents [12,13], was used. It should be noted,however, that uncertainties of perhaps 20% exist for f. Thecoefficients Av, Bv, and Cv provide information aboutelectric-field-induced changes in the transition dipole mo-ment, and about excited-state/ground-state polarizabilityand dipole moment differences, respectively. The molecu-lar parameters are determined as follows:
Av ¼hami3
þ 1
30ð3cos2v� 1Þ½3hbmi � 2hami�; ð3Þ
Bv ¼5
2TrDaþ ð3cos2v� 1Þ 3
2g � Da � g� 1
2TrDa
� �; ð4Þ
Cv ¼ jDlvj2½5þ ð3cos2n� 1Þð3cos2v� 1Þ�. ð5Þ
In these equations, hami and hbmi are the scalar portionsof the transition moment polarizability and hyperpolar-izability tensors, TrDa is the trace of the polarizabilitydifference between the excited and ground electronicstates, g � Da � g is the polarizability change along thetransition moment (g is the unit vector), Dlv is the vec-tor change in dipole moment, v is the angle between thelight and electric-field vectors, and n is the angle betweentransition dipole moment and Dlv vectors.
3. Results
3.1. Choice of systems
Delocalization in the Creutz–Taube ion arises pri-marily from strong p back-bonding by the Ru dpxz orbi-tals into the p* orbitals of pyrazine (the z-directioncoincides with the metal–metal axis; the x-direction isperpendicular to the pyrazine plane). One way of dimin-ishing the electronic coupling responsible for delocaliza-tion is to replace the purely r bonding ammine ligandstrans to the bridge with p*-orbital-containing ligandscapable of competing with pyrazine for Ru dpxz electrondensity [2,15]. 2 is a good example and was chosen forfurther investigation.
As noted above, another way of influencing the ex-tent or depth of delocalization is to introduce redoxasymmetry. For a simple two-state system lackingappreciable vibronic coupling, the comparison of inter-est is twice the electronic coupling energy, Hab, vs. thesum of the reorganization energy, k, and the redoxasymmetry, DE. While the Creutz–Taube ion likely sat-isfies neither the two-state criterion nor the negligiblevibronic coupling criterion, redox asymmetry will never-theless influence electronic localization/delocalization.Attractive examples of asymmetry introduction, becausethey leave unchanged other effects such as back-bond-ing, are crown-ether adducts of otherwise symmetrical
P.H. Dinolfo et al. / Chemical Physics 319 (2005) 28–38 31
systems. Unfortunately, our attempts to examine suchsystems by Stark spectroscopy were inhibited by aninability to find a solvent that permitted both stoichiom-etric adduct formation and low-temperature glass for-mation. Consequently, asymmetry was engendered byligand alteration and trans-ðpyridineÞðNH3Þ4-Ru-pyr-azine-RuðNH3Þ5þ5 ð3Þ was examined.
N N RuRu NH3
H3N NH3
H3N NH3 H3N
NH3H3N
NH3
N 3
5+
3.2. Low-temperature electronic absorption
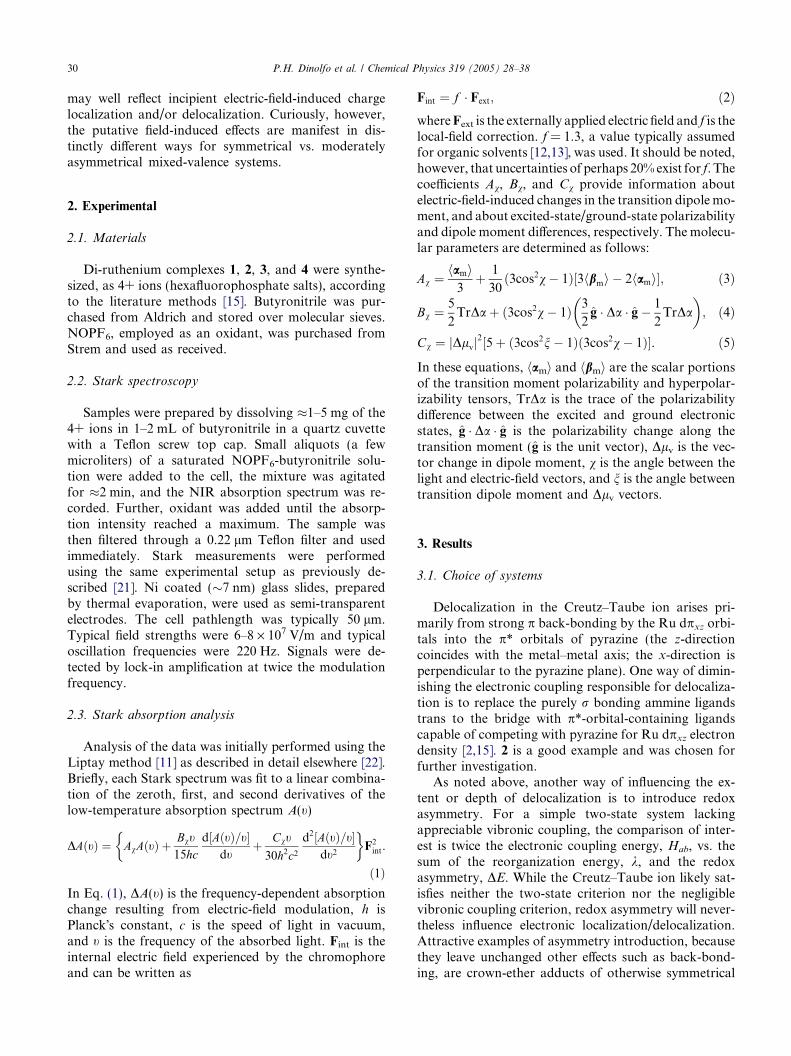
Fig. 2 shows the relative intensities of the intervalenceabsorption spectra of 1, 2, and 3 at 77 K in a butyronit-rile glass as solvent. The band maxima for 1 and 2 areslightly red shifted compared to their room temperaturevalues in CH3CN (6240 vs. 6270 cm�1 for 1 and 5860 vs.5940 cm�1 for 2). The absorption band for 2 is margin-ally wider than for 1, but both are slightly narrower thanthe corresponding room temperature absorption bands.Like the room temperature spectra, the low-temperaturespectra are highly asymmetric, with diminished absor-bance on the low-energy side of the band maximum.In contrast, the intervalence band for 3 is nearly Gauss-ian. At low temperatures, however, this band is alsoclearly asymmetric, with diminished intensity on thelow energy side. Unlike 1 and 2, the absorption bandfor 3 is significantly blue shifted (7400 vs. 6270 cm�1)and broader (2540 vs. 2420 cm�1) than the room tem-perature absorption in CH3CN. Despite the lineshapedifferences, the transition dipole moments at 77 K forthe three complexes are similar: lt � 0.75 e A.
Fig. 3. Liptay analysis of Stark spectra for 2. Panel (a) shows theunperturbed absorption spectrum at 77 K in butyronitrile (solid line)and panel (b) shows the energy weighted first and second derivatives(solid and dashed line, respectively). Panel (c) shows the measuredStark signals at v = 90� and 55� (solid and dashed lines, respectively)and fits (open circles). The wavelength region over which the Starksignal was fit is signified by the bold black line of the absorptionspectra in panel (a). Panel (d) shows the measured Stark signal atv = 55� with the corresponding contributions from the zeroth-, first-and second-derivative components (grey lines) of the fit (open circles).Panel (e) shows the measured Stark signal at v = 55� with the fitparameters from panel (c) used to generate a spectrum covering the fullwavelength range.
Wavenumber (cm-1)
4000 6000 8000 10000 12000
No
rmal
ized
Ab
sorp
tio
n
0.0
0.2
0.4
0.6
0.8
1.0
1
2
3
Fig. 2. Normalized IT absorption bands for 1 (solid line), 2 (longdashed line), and 3 (dashed-dotted line) butyronitrile at 77 K.
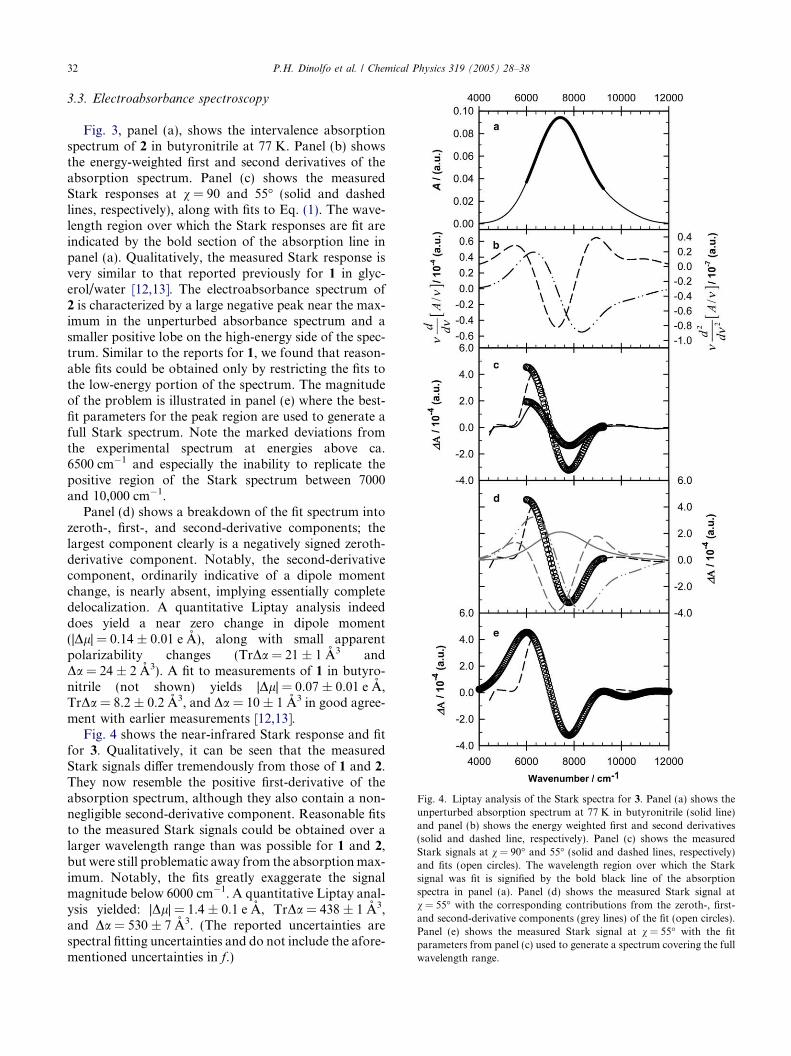
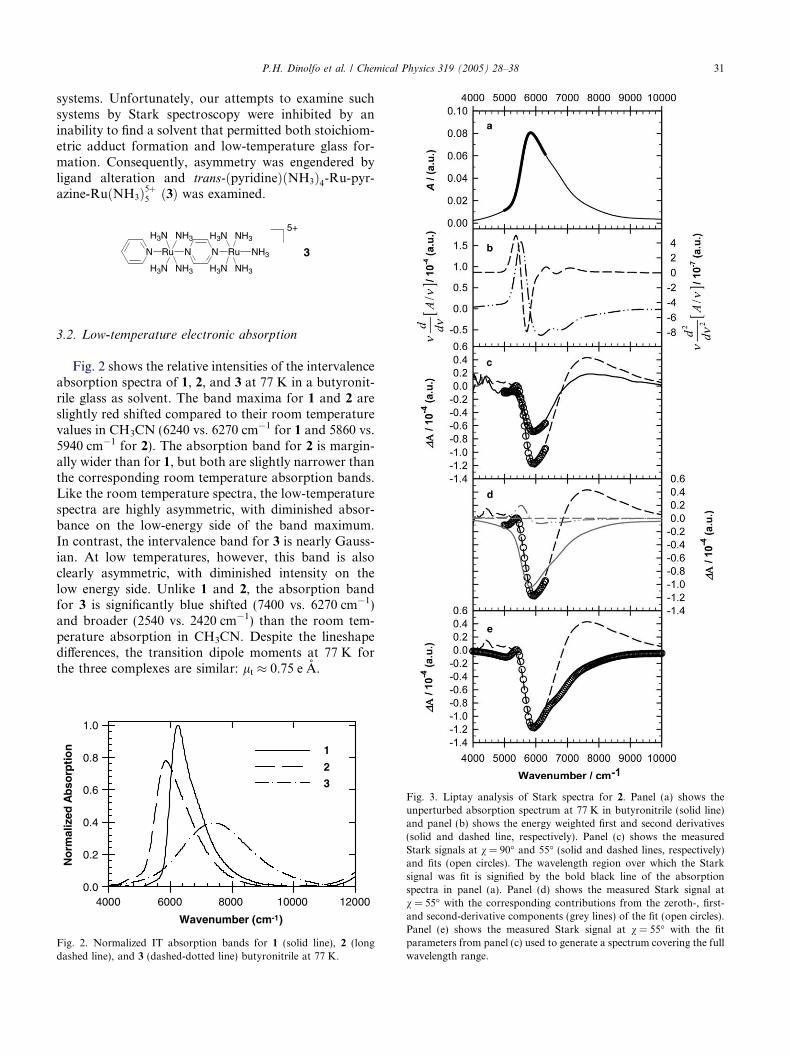
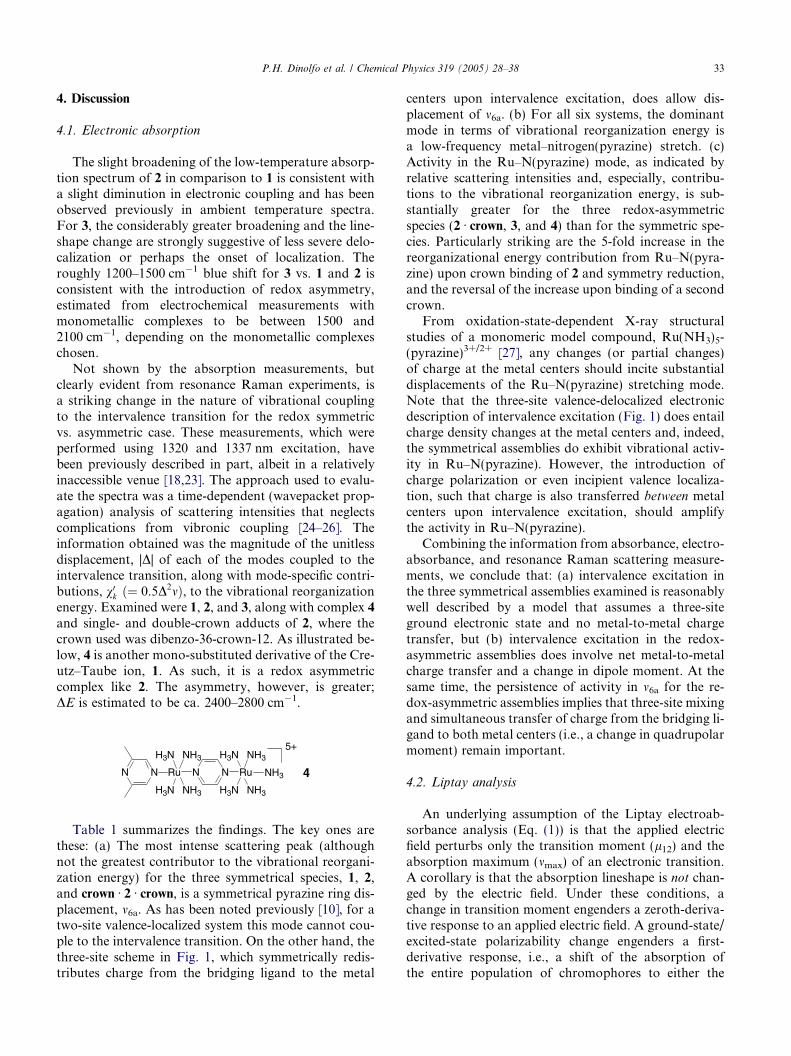
Fig. 4. Liptay analysis of the Stark spectra for 3. Panel (a) shows theunperturbed absorption spectrum at 77 K in butyronitrile (solid line)and panel (b) shows the energy weighted first and second derivatives(solid and dashed line, respectively). Panel (c) shows the measuredStark signals at v = 90� and 55� (solid and dashed lines, respectively)and fits (open circles). The wavelength region over which the Starksignal was fit is signified by the bold black line of the absorptionspectra in panel (a). Panel (d) shows the measured Stark signal atv = 55� with the corresponding contributions from the zeroth-, first-and second-derivative components (grey lines) of the fit (open circles).Panel (e) shows the measured Stark signal at v = 55� with the fitparameters from panel (c) used to generate a spectrum covering the fullwavelength range.
32 P.H. Dinolfo et al. / Chemical Physics 319 (2005) 28–38
3.3. Electroabsorbance spectroscopy
Fig. 3, panel (a), shows the intervalence absorptionspectrum of 2 in butyronitrile at 77 K. Panel (b) showsthe energy-weighted first and second derivatives of theabsorption spectrum. Panel (c) shows the measuredStark responses at v = 90 and 55� (solid and dashedlines, respectively), along with fits to Eq. (1). The wave-length region over which the Stark responses are fit areindicated by the bold section of the absorption line inpanel (a). Qualitatively, the measured Stark response isvery similar to that reported previously for 1 in glyc-erol/water [12,13]. The electroabsorbance spectrum of2 is characterized by a large negative peak near the max-imum in the unperturbed absorbance spectrum and asmaller positive lobe on the high-energy side of the spec-trum. Similar to the reports for 1, we found that reason-able fits could be obtained only by restricting the fits tothe low-energy portion of the spectrum. The magnitudeof the problem is illustrated in panel (e) where the best-fit parameters for the peak region are used to generate afull Stark spectrum. Note the marked deviations fromthe experimental spectrum at energies above ca.6500 cm�1 and especially the inability to replicate thepositive region of the Stark spectrum between 7000and 10,000 cm�1.
Panel (d) shows a breakdown of the fit spectrum intozeroth-, first-, and second-derivative components; thelargest component clearly is a negatively signed zeroth-derivative component. Notably, the second-derivativecomponent, ordinarily indicative of a dipole momentchange, is nearly absent, implying essentially completedelocalization. A quantitative Liptay analysis indeeddoes yield a near zero change in dipole moment(|Dl| = 0.14 ± 0.01 e A), along with small apparentpolarizability changes (TrDa = 21 ± 1 A3 andDa = 24 ± 2 A3). A fit to measurements of 1 in butyro-nitrile (not shown) yields |Dl| = 0.07 ± 0.01 e A,TrDa = 8.2 ± 0.2 A3, and Da = 10 ± 1 A3 in good agree-ment with earlier measurements [12,13].
Fig. 4 shows the near-infrared Stark response and fitfor 3. Qualitatively, it can be seen that the measuredStark signals differ tremendously from those of 1 and 2.They now resemble the positive first-derivative of theabsorption spectrum, although they also contain a non-negligible second-derivative component. Reasonable fitsto the measured Stark signals could be obtained over alarger wavelength range than was possible for 1 and 2,but were still problematic away from the absorptionmax-imum. Notably, the fits greatly exaggerate the signalmagnitude below 6000 cm�1. A quantitative Liptay anal-ysis yielded: |Dl| = 1.4 ± 0.1 e A, TrDa = 438 ± 1 A3,and Da = 530 ± 7 A3. (The reported uncertainties arespectral fitting uncertainties and do not include the afore-mentioned uncertainties in f.)
P.H. Dinolfo et al. / Chemical Physics 319 (2005) 28–38 33
4. Discussion
4.1. Electronic absorption
The slight broadening of the low-temperature absorp-tion spectrum of 2 in comparison to 1 is consistent witha slight diminution in electronic coupling and has beenobserved previously in ambient temperature spectra.For 3, the considerably greater broadening and the line-shape change are strongly suggestive of less severe delo-calization or perhaps the onset of localization. Theroughly 1200–1500 cm�1 blue shift for 3 vs. 1 and 2 isconsistent with the introduction of redox asymmetry,estimated from electrochemical measurements withmonometallic complexes to be between 1500 and2100 cm�1, depending on the monometallic complexeschosen.
Not shown by the absorption measurements, butclearly evident from resonance Raman experiments, isa striking change in the nature of vibrational couplingto the intervalence transition for the redox symmetricvs. asymmetric case. These measurements, which wereperformed using 1320 and 1337 nm excitation, havebeen previously described in part, albeit in a relativelyinaccessible venue [18,23]. The approach used to evalu-ate the spectra was a time-dependent (wavepacket prop-agation) analysis of scattering intensities that neglectscomplications from vibronic coupling [24–26]. Theinformation obtained was the magnitude of the unitlessdisplacement, |D| of each of the modes coupled to theintervalence transition, along with mode-specific contri-butions, v0k ð¼ 0.5D2mÞ, to the vibrational reorganizationenergy. Examined were 1, 2, and 3, along with complex 4and single- and double-crown adducts of 2, where thecrown used was dibenzo-36-crown-12. As illustrated be-low, 4 is another mono-substituted derivative of the Cre-utz–Taube ion, 1. As such, it is a redox asymmetriccomplex like 2. The asymmetry, however, is greater;DE is estimated to be ca. 2400–2800 cm�1.
N N RuRu NH3
H3N NH3
H3N NH3 H3N
NH3H3N
NH3
NN 4
5+
Table 1 summarizes the findings. The key ones arethese: (a) The most intense scattering peak (althoughnot the greatest contributor to the vibrational reorgani-zation energy) for the three symmetrical species, 1, 2,and crown Æ 2 Æ crown, is a symmetrical pyrazine ring dis-placement, m6a. As has been noted previously [10], for atwo-site valence-localized system this mode cannot cou-ple to the intervalence transition. On the other hand, thethree-site scheme in Fig. 1, which symmetrically redis-tributes charge from the bridging ligand to the metal
centers upon intervalence excitation, does allow dis-placement of m6a. (b) For all six systems, the dominantmode in terms of vibrational reorganization energy isa low-frequency metal–nitrogen(pyrazine) stretch. (c)Activity in the Ru–N(pyrazine) mode, as indicated byrelative scattering intensities and, especially, contribu-tions to the vibrational reorganization energy, is sub-stantially greater for the three redox-asymmetricspecies (2 Æ crown, 3, and 4) than for the symmetric spe-cies. Particularly striking are the 5-fold increase in thereorganizational energy contribution from Ru–N(pyra-zine) upon crown binding of 2 and symmetry reduction,and the reversal of the increase upon binding of a secondcrown.
From oxidation-state-dependent X-ray structuralstudies of a monomeric model compound, Ru(NH3)5-(pyrazine)3+/2+ [27], any changes (or partial changes)of charge at the metal centers should incite substantialdisplacements of the Ru–N(pyrazine) stretching mode.Note that the three-site valence-delocalized electronicdescription of intervalence excitation (Fig. 1) does entailcharge density changes at the metal centers and, indeed,the symmetrical assemblies do exhibit vibrational activ-ity in Ru–N(pyrazine). However, the introduction ofcharge polarization or even incipient valence localiza-tion, such that charge is also transferred between metalcenters upon intervalence excitation, should amplifythe activity in Ru–N(pyrazine).
Combining the information from absorbance, electro-absorbance, and resonance Raman scattering measure-ments, we conclude that: (a) intervalence excitation inthe three symmetrical assemblies examined is reasonablywell described by a model that assumes a three-siteground electronic state and no metal-to-metal chargetransfer, but (b) intervalence excitation in the redox-asymmetric assemblies does involve net metal-to-metalcharge transfer and a change in dipole moment. At thesame time, the persistence of activity in m6a for the re-dox-asymmetric assemblies implies that three-site mixingand simultaneous transfer of charge from the bridging li-gand to both metal centers (i.e., a change in quadrupolarmoment) remain important.
4.2. Liptay analysis
An underlying assumption of the Liptay electroab-sorbance analysis (Eq. (1)) is that the applied electricfield perturbs only the transition moment (l12) and theabsorption maximum (mmax) of an electronic transition.A corollary is that the absorption lineshape is not chan-ged by the electric field. Under these conditions, achange in transition moment engenders a zeroth-deriva-tive response to an applied electric field. A ground-state/excited-state polarizability change engenders a first-derivative response, i.e., a shift of the absorption ofthe entire population of chromophores to either the
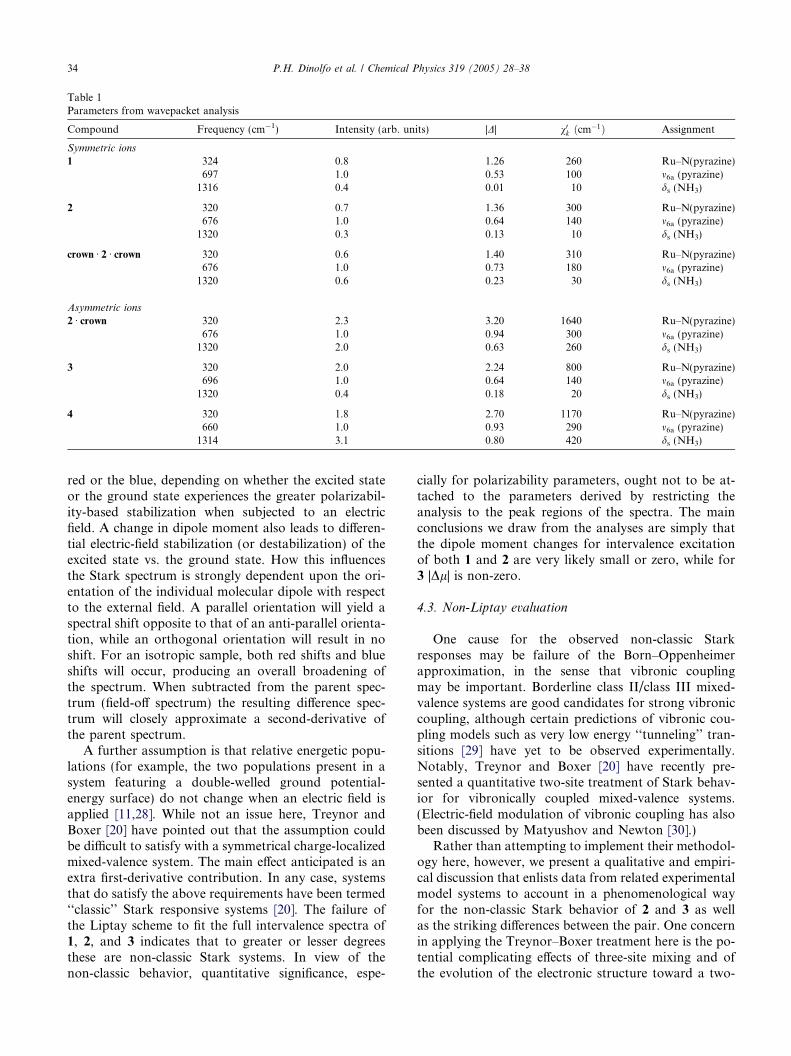
Table 1Parameters from wavepacket analysis
Compound Frequency (cm�1) Intensity (arb. units) |D| v0k ðcm�1Þ Assignment
Symmetric ions
1 324 0.8 1.26 260 Ru–N(pyrazine)697 1.0 0.53 100 m6a (pyrazine)1316 0.4 0.01 10 ds (NH3)
2 320 0.7 1.36 300 Ru–N(pyrazine)676 1.0 0.64 140 m6a (pyrazine)1320 0.3 0.13 10 ds (NH3)
crown Æ 2 Æ crown 320 0.6 1.40 310 Ru–N(pyrazine)676 1.0 0.73 180 m6a (pyrazine)1320 0.6 0.23 30 ds (NH3)
Asymmetric ions
2 Æ crown 320 2.3 3.20 1640 Ru–N(pyrazine)676 1.0 0.94 300 m6a (pyrazine)1320 2.0 0.63 260 ds (NH3)
3 320 2.0 2.24 800 Ru–N(pyrazine)696 1.0 0.64 140 m6a (pyrazine)1320 0.4 0.18 20 ds (NH3)
4 320 1.8 2.70 1170 Ru–N(pyrazine)660 1.0 0.93 290 m6a (pyrazine)1314 3.1 0.80 420 ds (NH3)
34 P.H. Dinolfo et al. / Chemical Physics 319 (2005) 28–38
red or the blue, depending on whether the excited stateor the ground state experiences the greater polarizabil-ity-based stabilization when subjected to an electricfield. A change in dipole moment also leads to differen-tial electric-field stabilization (or destabilization) of theexcited state vs. the ground state. How this influencesthe Stark spectrum is strongly dependent upon the ori-entation of the individual molecular dipole with respectto the external field. A parallel orientation will yield aspectral shift opposite to that of an anti-parallel orienta-tion, while an orthogonal orientation will result in noshift. For an isotropic sample, both red shifts and blueshifts will occur, producing an overall broadening ofthe spectrum. When subtracted from the parent spec-trum (field-off spectrum) the resulting difference spec-trum will closely approximate a second-derivative ofthe parent spectrum.
A further assumption is that relative energetic popu-lations (for example, the two populations present in asystem featuring a double-welled ground potential-energy surface) do not change when an electric field isapplied [11,28]. While not an issue here, Treynor andBoxer [20] have pointed out that the assumption couldbe difficult to satisfy with a symmetrical charge-localizedmixed-valence system. The main effect anticipated is anextra first-derivative contribution. In any case, systemsthat do satisfy the above requirements have been termed‘‘classic’’ Stark responsive systems [20]. The failure ofthe Liptay scheme to fit the full intervalence spectra of1, 2, and 3 indicates that to greater or lesser degreesthese are non-classic Stark systems. In view of thenon-classic behavior, quantitative significance, espe-
cially for polarizability parameters, ought not to be at-tached to the parameters derived by restricting theanalysis to the peak regions of the spectra. The mainconclusions we draw from the analyses are simply thatthe dipole moment changes for intervalence excitationof both 1 and 2 are very likely small or zero, while for3 |Dl| is non-zero.
4.3. Non-Liptay evaluation
One cause for the observed non-classic Starkresponses may be failure of the Born–Oppenheimerapproximation, in the sense that vibronic couplingmay be important. Borderline class II/class III mixed-valence systems are good candidates for strong vibroniccoupling, although certain predictions of vibronic cou-pling models such as very low energy ‘‘tunneling’’ tran-sitions [29] have yet to be observed experimentally.Notably, Treynor and Boxer [20] have recently pre-sented a quantitative two-site treatment of Stark behav-ior for vibronically coupled mixed-valence systems.(Electric-field modulation of vibronic coupling has alsobeen discussed by Matyushov and Newton [30].)
Rather than attempting to implement their methodol-ogy here, however, we present a qualitative and empiri-cal discussion that enlists data from related experimentalmodel systems to account in a phenomenological wayfor the non-classic Stark behavior of 2 and 3 as wellas the striking differences between the pair. One concernin applying the Treynor–Boxer treatment here is the po-tential complicating effects of three-site mixing and ofthe evolution of the electronic structure toward a two-
P.H. Dinolfo et al. / Chemical Physics 319 (2005) 28–38 35
site picture as redox asymmetry is introduced. Nonethe-less, it would be interesting to discover at some pointwhether the Treynor–Boxer treatment is already suffi-ciently general to describe well the behavior of 2 and 3.
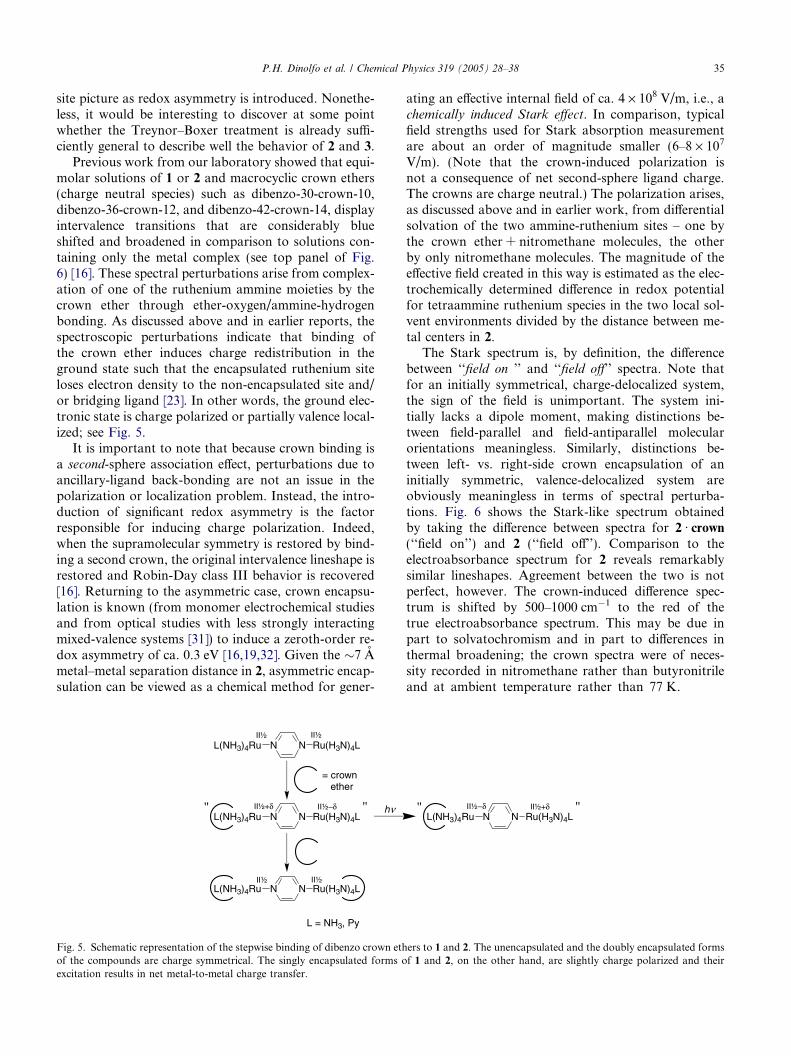
Previous work from our laboratory showed that equi-molar solutions of 1 or 2 and macrocyclic crown ethers(charge neutral species) such as dibenzo-30-crown-10,dibenzo-36-crown-12, and dibenzo-42-crown-14, displayintervalence transitions that are considerably blueshifted and broadened in comparison to solutions con-taining only the metal complex (see top panel of Fig.6) [16]. These spectral perturbations arise from complex-ation of one of the ruthenium ammine moieties by thecrown ether through ether-oxygen/ammine-hydrogenbonding. As discussed above and in earlier reports, thespectroscopic perturbations indicate that binding ofthe crown ether induces charge redistribution in theground state such that the encapsulated ruthenium siteloses electron density to the non-encapsulated site and/or bridging ligand [23]. In other words, the ground elec-tronic state is charge polarized or partially valence local-ized; see Fig. 5.
It is important to note that because crown binding isa second-sphere association effect, perturbations due toancillary-ligand back-bonding are not an issue in thepolarization or localization problem. Instead, the intro-duction of significant redox asymmetry is the factorresponsible for inducing charge polarization. Indeed,when the supramolecular symmetry is restored by bind-ing a second crown, the original intervalence lineshape isrestored and Robin-Day class III behavior is recovered[16]. Returning to the asymmetric case, crown encapsu-lation is known (from monomer electrochemical studiesand from optical studies with less strongly interactingmixed-valence systems [31]) to induce a zeroth-order re-dox asymmetry of ca. 0.3 eV [16,19,32]. Given the �7 Ametal–metal separation distance in 2, asymmetric encap-sulation can be viewed as a chemical method for gener-
N N Ru(H3N)4LL(NH3)4Ru
N N Ru(H3N)4LL(NH3)4Ru
N N Ru(H3N)4LL(NH3)4Ru
II½ II½
II½ II½
" "
= crown ether
L = NH3, Py
II½+δ II½−δ hν
Fig. 5. Schematic representation of the stepwise binding of dibenzo crown ethof the compounds are charge symmetrical. The singly encapsulated forms oexcitation results in net metal-to-metal charge transfer.
ating an effective internal field of ca. 4 · 108 V/m, i.e., achemically induced Stark effect. In comparison, typicalfield strengths used for Stark absorption measurementare about an order of magnitude smaller (6–8 · 107
V/m). (Note that the crown-induced polarization isnot a consequence of net second-sphere ligand charge.The crowns are charge neutral.) The polarization arises,as discussed above and in earlier work, from differentialsolvation of the two ammine-ruthenium sites – one bythe crown ether + nitromethane molecules, the otherby only nitromethane molecules. The magnitude of theeffective field created in this way is estimated as the elec-trochemically determined difference in redox potentialfor tetraammine ruthenium species in the two local sol-vent environments divided by the distance between me-tal centers in 2.
The Stark spectrum is, by definition, the differencebetween ‘‘field on ’’ and ‘‘field off’’ spectra. Note thatfor an initially symmetrical, charge-delocalized system,the sign of the field is unimportant. The system ini-tially lacks a dipole moment, making distinctions be-tween field-parallel and field-antiparallel molecularorientations meaningless. Similarly, distinctions be-tween left- vs. right-side crown encapsulation of aninitially symmetric, valence-delocalized system areobviously meaningless in terms of spectral perturba-tions. Fig. 6 shows the Stark-like spectrum obtainedby taking the difference between spectra for 2 Æ crown(‘‘field on’’) and 2 (‘‘field off’’). Comparison to theelectroabsorbance spectrum for 2 reveals remarkablysimilar lineshapes. Agreement between the two is notperfect, however. The crown-induced difference spec-trum is shifted by 500–1000 cm�1 to the red of thetrue electroabsorbance spectrum. This may be due inpart to solvatochromism and in part to differences inthermal broadening; the crown spectra were of neces-sity recorded in nitromethane rather than butyronitrileand at ambient temperature rather than 77 K.
N N Ru(H3N)4LL(NH3)4Ru" "II½−δ II½+δ
ers to 1 and 2. The unencapsulated and the doubly encapsulated formsf 1 and 2, on the other hand, are slightly charge polarized and their
No
rmal
ized
Ab
s
0.00
0.02
0.04
0.06
0.08
0.10
2
2-[DB-14-C-42]
Ab
s∆
-0.08
-0.06
-0.04
-0.02
0.00
0.02
Wavenumber (cm-1)
5000 6000 7000 8000 9000 10000 11000
Ab
s x
10-4
-1.4-1.2-1.0-0.8-0.6-0.4-0.20.00.20.40.6
a
b
c
∆
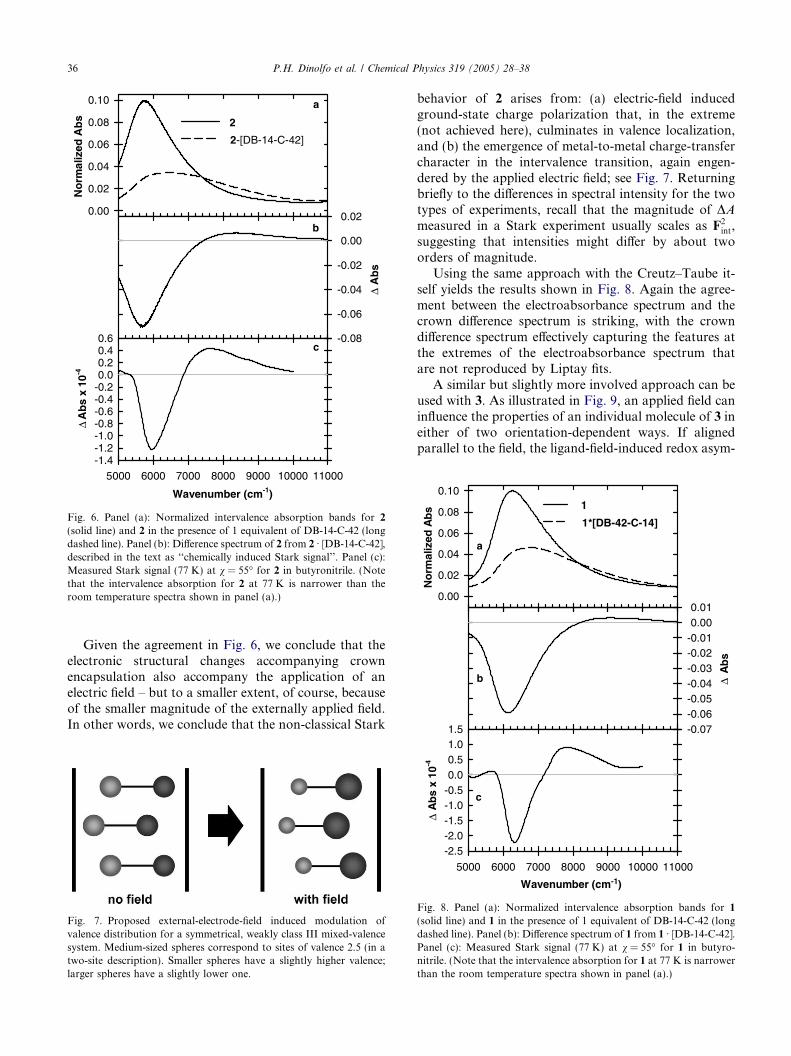
Fig. 6. Panel (a): Normalized intervalence absorption bands for 2
(solid line) and 2 in the presence of 1 equivalent of DB-14-C-42 (longdashed line). Panel (b): Difference spectrum of 2 from 2 Æ [DB-14-C-42],described in the text as ‘‘chemically induced Stark signal’’. Panel (c):Measured Stark signal (77 K) at v = 55� for 2 in butyronitrile. (Notethat the intervalence absorption for 2 at 77 K is narrower than theroom temperature spectra shown in panel (a).)
Ab
∆s
-0.07-0.06-0.05-0.04-0.03-0.02-0.010.000.01
No
rmal
ized
Ab
s
0.00
0.02
0.04
0.06
0.08
0.101
1*[DB-42-C-14]
1.5
a
b
36 P.H. Dinolfo et al. / Chemical Physics 319 (2005) 28–38
Given the agreement in Fig. 6, we conclude that theelectronic structural changes accompanying crownencapsulation also accompany the application of anelectric field – but to a smaller extent, of course, becauseof the smaller magnitude of the externally applied field.In other words, we conclude that the non-classical Stark
Fig. 7. Proposed external-electrode-field induced modulation ofvalence distribution for a symmetrical, weakly class III mixed-valencesystem. Medium-sized spheres correspond to sites of valence 2.5 (in atwo-site description). Smaller spheres have a slightly higher valence;larger spheres have a slightly lower one.
behavior of 2 arises from: (a) electric-field inducedground-state charge polarization that, in the extreme(not achieved here), culminates in valence localization,and (b) the emergence of metal-to-metal charge-transfercharacter in the intervalence transition, again engen-dered by the applied electric field; see Fig. 7. Returningbriefly to the differences in spectral intensity for the twotypes of experiments, recall that the magnitude of DAmeasured in a Stark experiment usually scales as F2
int,suggesting that intensities might differ by about twoorders of magnitude.
Using the same approach with the Creutz–Taube it-self yields the results shown in Fig. 8. Again the agree-ment between the electroabsorbance spectrum and thecrown difference spectrum is striking, with the crowndifference spectrum effectively capturing the features atthe extremes of the electroabsorbance spectrum thatare not reproduced by Liptay fits.
A similar but slightly more involved approach can beused with 3. As illustrated in Fig. 9, an applied field caninfluence the properties of an individual molecule of 3 ineither of two orientation-dependent ways. If alignedparallel to the field, the ligand-field-induced redox asym-
Wavenumber (cm-1)
5000 6000 7000 8000 9000 10000 11000
Ab
s x
10-4
-2.5-2.0-1.5-1.0-0.50.00.51.0
c
∆
Fig. 8. Panel (a): Normalized intervalence absorption bands for 1
(solid line) and 1 in the presence of 1 equivalent of DB-14-C-42 (longdashed line). Panel (b): Difference spectrum of 1 from 1 Æ [DB-14-C-42].Panel (c): Measured Stark signal (77 K) at v = 55� for 1 in butyro-nitrile. (Note that the intervalence absorption for 1 at 77 K is narrowerthan the room temperature spectra shown in panel (a).)
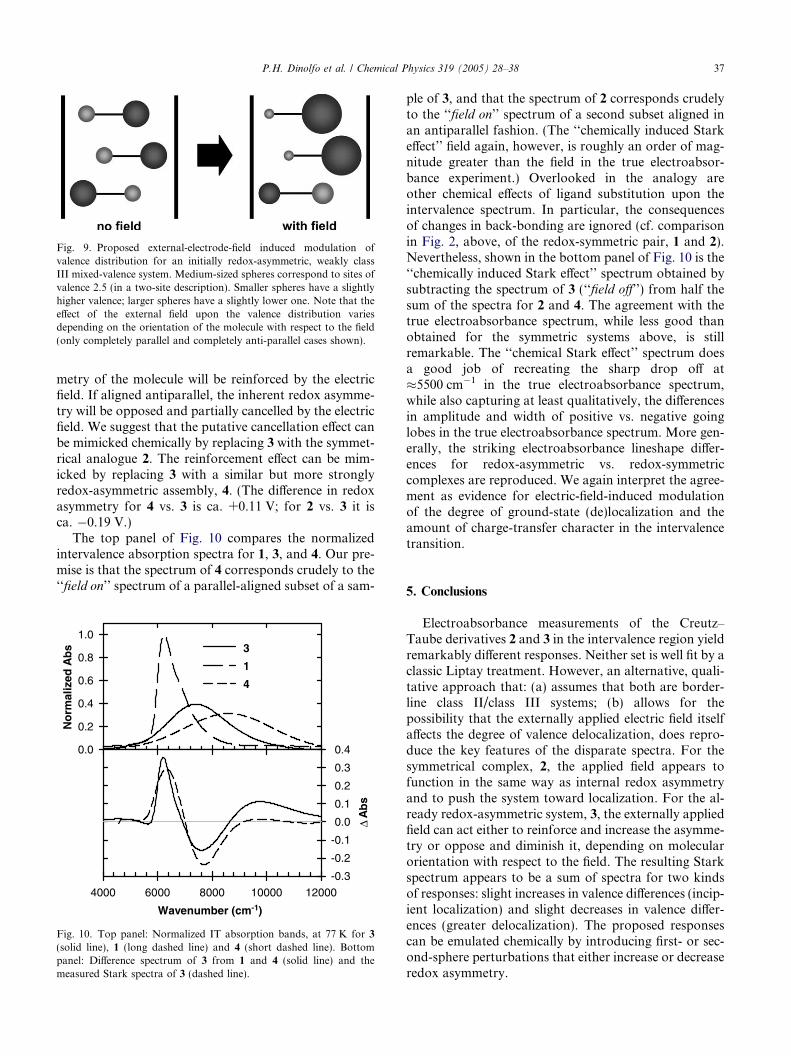
Fig. 9. Proposed external-electrode-field induced modulation ofvalence distribution for an initially redox-asymmetric, weakly classIII mixed-valence system. Medium-sized spheres correspond to sites ofvalence 2.5 (in a two-site description). Smaller spheres have a slightlyhigher valence; larger spheres have a slightly lower one. Note that theeffect of the external field upon the valence distribution variesdepending on the orientation of the molecule with respect to the field(only completely parallel and completely anti-parallel cases shown).
P.H. Dinolfo et al. / Chemical Physics 319 (2005) 28–38 37
metry of the molecule will be reinforced by the electricfield. If aligned antiparallel, the inherent redox asymme-try will be opposed and partially cancelled by the electricfield. We suggest that the putative cancellation effect canbe mimicked chemically by replacing 3 with the symmet-rical analogue 2. The reinforcement effect can be mim-icked by replacing 3 with a similar but more stronglyredox-asymmetric assembly, 4. (The difference in redoxasymmetry for 4 vs. 3 is ca. +0.11 V; for 2 vs. 3 it isca. �0.19 V.)
The top panel of Fig. 10 compares the normalizedintervalence absorption spectra for 1, 3, and 4. Our pre-mise is that the spectrum of 4 corresponds crudely to the‘‘field on’’ spectrum of a parallel-aligned subset of a sam-
No
rmal
ized
Ab
s
0.0
0.2
0.4
0.6
0.8
1.03
1
4
Wavenumber (cm-1)
4000 6000 8000 10000 12000
Ab
∆s
-0.3
-0.2
-0.1
0.0
0.1
0.2
0.3
0.4
Fig. 10. Top panel: Normalized IT absorption bands, at 77 K for 3
(solid line), 1 (long dashed line) and 4 (short dashed line). Bottompanel: Difference spectrum of 3 from 1 and 4 (solid line) and themeasured Stark spectra of 3 (dashed line).
ple of 3, and that the spectrum of 2 corresponds crudelyto the ‘‘field on’’ spectrum of a second subset aligned inan antiparallel fashion. (The ‘‘chemically induced Starkeffect’’ field again, however, is roughly an order of mag-nitude greater than the field in the true electroabsor-bance experiment.) Overlooked in the analogy areother chemical effects of ligand substitution upon theintervalence spectrum. In particular, the consequencesof changes in back-bonding are ignored (cf. comparisonin Fig. 2, above, of the redox-symmetric pair, 1 and 2).Nevertheless, shown in the bottom panel of Fig. 10 is the‘‘chemically induced Stark effect’’ spectrum obtained bysubtracting the spectrum of 3 (‘‘field off’’) from half thesum of the spectra for 2 and 4. The agreement with thetrue electroabsorbance spectrum, while less good thanobtained for the symmetric systems above, is stillremarkable. The ‘‘chemical Stark effect’’ spectrum doesa good job of recreating the sharp drop off at�5500 cm�1 in the true electroabsorbance spectrum,while also capturing at least qualitatively, the differencesin amplitude and width of positive vs. negative goinglobes in the true electroabsorbance spectrum. More gen-erally, the striking electroabsorbance lineshape differ-ences for redox-asymmetric vs. redox-symmetriccomplexes are reproduced. We again interpret the agree-ment as evidence for electric-field-induced modulationof the degree of ground-state (de)localization and theamount of charge-transfer character in the intervalencetransition.
5. Conclusions
Electroabsorbance measurements of the Creutz–Taube derivatives 2 and 3 in the intervalence region yieldremarkably different responses. Neither set is well fit by aclassic Liptay treatment. However, an alternative, quali-tative approach that: (a) assumes that both are border-line class II/class III systems; (b) allows for thepossibility that the externally applied electric field itselfaffects the degree of valence delocalization, does repro-duce the key features of the disparate spectra. For thesymmetrical complex, 2, the applied field appears tofunction in the same way as internal redox asymmetryand to push the system toward localization. For the al-ready redox-asymmetric system, 3, the externally appliedfield can act either to reinforce and increase the asymme-try or oppose and diminish it, depending on molecularorientation with respect to the field. The resulting Starkspectrum appears to be a sum of spectra for two kindsof responses: slight increases in valence differences (incip-ient localization) and slight decreases in valence differ-ences (greater delocalization). The proposed responsescan be emulated chemically by introducing first- or sec-ond-sphere perturbations that either increase or decreaseredox asymmetry.
38 P.H. Dinolfo et al. / Chemical Physics 319 (2005) 28–38
Intervalence-enhanced resonance Raman spectros-copy measurements for a total of six mixed-valence sys-tems support the contention that the symmetricalcomplex 2, in unperturbed form, is a valence delocalizedsystem with delocalization occurring via three-site mix-ing. The Raman measurements for the asymmetrical sys-tem, 3, also indicate three-site mixing and suggestsignificant delocalization. Additionally, however, theyprovide evidence for some degree of metal-to-metalcharge-transfer upon intervalence excitation and there-fore, some degree of valence differentiation. When redoxasymmetry is introduced into 2 by encapsulating oneend with a crown ether, Raman spectroscopic evidencefor the emergence of metal-to-metal charge-transferbehavior is similarly obtained – evidence that disappearswhen symmetry is restored by encapsulating both endsof the complex.
Acknowledgments
We thank the Office of Science, Basic Energy SciencesProgram, U.S. Department of Energy for financial sup-port of our work under Grant No. DE-FG87ER-13808.
References
[1] C. Creutz, H. Taube, J. Am. Chem. Soc. 91 (1969) 3988.[2] C. Creutz, H. Taube, J. Am. Chem. Soc. 95 (1973) 1086.[3] N.S. Hush, Prog. Inorg. Chem. 8 (1967) 391.[4] M.B. Robin, P. Day, Adv. Inorg. Chem. Radiochem. 10 (1967)
247.[5] U. Fuerholz, H.B. Buergi, F.E. Wagner, A. Stebler, J.H. Amme-
ter, E. Krausz, R.J.H. Clark, M.J. Stead, A. Ludi, J. Am. Chem.Soc. 106 (1984) 121.
[6] C. Creutz, Prog. Inorg. Chem. 30 (1983) 1.[7] B.S. Brunschwig, C. Creutz, N. Sutin, Chem. Soc. Rev. 31 (2002)
168.
[8] V. Petrov, J.T. Hupp, C. Mottley, L.C. Mann, J. Am. Chem. Soc.116 (1994) 2171.
[9] H. Lu, V. Petrov, J.T. Hupp, Chem. Phys. Lett. 235 (1995) 521.[10] M.J. Ondrechen, J. Ko, L.T. Zhang, J. Am. Chem. Soc. 109
(1987) 1672.[11] W. Liptay, in: E.C. Lim (Ed.), Excited States, Academic Press,
New York, 1974, p. 129.[12] D.H. Oh, S.G. Boxer, J. Am. Chem. Soc. 112 (1990) 8161.[13] D.H. Oh, M. Sano, S.G. Boxer, J. Am. Chem. Soc. 113 (1991)
6880.[14] K.D. Demadis, C.M. Hartshorn, T.J. Meyer, Chem. Rev. 101
(2001) 2655.[15] F. Salaymeh, S. Berhane, R. Yusof, R. de la Rosa, E.Y. Fung, R.
Matamoros, K.W. Lau, Q. Zheng, E.M. Kober, J.C. Curtis,Inorg. Chem. 32 (1993) 3895.
[16] Y. Dong, J.T. Hupp, D.I. Yoon, J. Am. Chem. Soc. 115 (1993)4379.
[17] M.D. Todd, Y. Dong, J. Horney, D.I. Yoon, J.T. Hupp, Inorg.Chem. 32 (1993) 2001.
[18] R.D. Williams, Ph.D. Thesis, Northwestern University, Evanston,IL, 1998.
[19] J.T. Hupp, Y. Dong, Inorg. Chem. 33 (1994) 4421.[20] T.P. Treynor, S.G. Boxer, J. Phys. Chem. A 108 (2004) 1764.[21] P.H. Dinolfo, J.T. Hupp, J. Am. Chem. Soc. 126 (2004) 16814.[22] G.U. Bublitz, S.G. Boxer, Annu. Rev. Phys. Chem. 48 (1997)
213.[23] V. Petrov, R.D. Williams, J.T. Hupp, Resonance Raman in the
extended near infrared: experimental time dependent scatteringstudies of mixed-valence systems, in: S.A. Asher, P. Stein (Eds.),Proceedings of the XVth International Conference of RamanSpectroscopy, Wiley, New York, 1996, p. 768.
[24] E.J. Heller, Acc. Chem. Res. 14 (1981) 368.[25] A.B. Myers, Acc. Chem. Res. 30 (1997) 519.[26] J.T. Hupp, R.D. Williams, Acc. Chem. Res. 34 (2001) 808.[27] M.E. Gress, C. Creutz, C.O. Quicksall, Inorg. Chem. 20 (1981)
1522.[28] W. Liptay, Angew. Chem., Int. Ed. Engl. 8 (1969) 177.[29] S.B. Piepho, E.R. Krausz, P.N. Schatz, J. Am. Chem. Soc. 100
(1978) 2996.[30] D.V. Matyushov, M.D. Newton, J. Phys. Chem. A 105 (2001)
8516.[31] M.D. Todd, Y. Dong, J.T. Hupp, Inorg. Chem. 30 (1991) 4685.[32] X.L. Zhang, D.I. Yoon, J.T. Hupp, Inorg. Chim. Acta 240 (1995)
285.