contract research report 372/2001 - health … research report 372/2001 hse health & safety...
TRANSCRIPT
HSEHealth & Safety
Executive
An assessment of measures in use for gaspipelines to mitigate against damage
caused by third party activity
Prepared byWS Atkins Consultants Ltd
for the Health and Safety Executive
CONTRACT RESEARCH REPORT
372/2001
HSEHealth & Safety
Executive
An assessment of measures in use for gaspipelines to mitigate against damage
caused by third party activity
John Mather, Chris Blackmore,Andrew Petrie & Charlotte Treves
WS Atkins Consultants LtdBirchwood Boulevard
BirchwoodWarrington
WA3 7WA
The main source of leaks occurring from high-pressure gas transmission pipelines in both the UK andEurope is due to the damage caused by third party activity. In order for the Health and SafetyExecutive (HSE) to be able to predict pipeline failure frequencies for damage caused by third partyactivity, a computer program entitled PIPIN is used. This study has used two main sources of pipelinefailure data; namely the EGIG ‘97 report and BG Transco’s incident database to refine and update thethird party activity failure model in the PIPIN program. The third party activity failure model takes intoaccount such factors as:-
� pipeline diameter;
� pipeline wall thickness;
� pipeline location;
� depth of cover; and
� pipeline damage prevention measures in place.
An extensive literature search has been carried out into the use and effectiveness of third party pipelinedamage prevention measures used both in the UK and World-wide. The results of the literature searchhave been assessed and incorporated into the third party activity failure model where appropriate.
The result of the study has been the development of an up-to-date predictive model, which can beused to assess the likelihood of pipeline failure caused by third party activity for existing and proposedpipelines.
This report and the work it describes were funded by the Health and Safety Executive. Its contents,including opinions and/or conclusions expressed, are those of the authors alone and do not necessarilyreflect HSE policy.
HSE BOOKS

ii
© Crown copyright 2001Applications for reproduction should be made in writing to:Copyright Unit, Her Majesty’s Stationery Office,St Clements House, 2-16 Colegate, Norwich NR3 1BQ
First published 2001
ISBN 0 7176 2113 8
All rights reserved. No part of this publication may bereproduced, stored in a retrieval system, or transmittedin any form or by any means (electronic, mechanical,photocopying, recording or otherwise) without the priorwritten permission of the copyright owner.

iii
TABLE OF CONTENTS
Page
1. INTRODUCTION 1
2. SCOPE OF WORK 3
3. LITERATURE SEARCH 4
3.1 Purpose Of The Literature Search 4 3.2 Identification Of Key Search Parameters 4 3.3 Sources Of Information 4 3.4 Literature Search Methodology 5 3.5 Results Of Literature Search 7 3.6 Results Of Bg Transco Literature Search 7
4. PIPELINE DAMAGE PREVENTION MEASURES 8
4.1 Introduction 8 4.2 Types Of Pipeline Damage Prevention Measure 8
4.2.1 Pipeline damage prevention measures installed during pipeline construction 8 4.2.2 Pipeline damage prevention measures undertaken post-pipeline construction 8 4.2.3 Examples of pipeline damage prevention measures installed during pipeline
construction 9 4.2.4 Examples of pipeline damage prevention measures post-pipeline construction 11
4.3 Pipeline Safety Legislation 14 4.4 UK Practice For The Installation Of Gas Transmission Lines 15
5. ANALYSIS OF THE EGIG FAILURE DATA 16
5.1 Introduction 16 5.2 Collection Of Data 16 5.3 Classification Of Damage 17 5.4 Data Analysis 17
5.4.1 General 17 5.4.2 Determination of failure frequency per diameter class 18 5.4.3 Use of a statistical technique to determine missing failure frequency values 18 5.4.4 Use of refined statistical technique to determine failure frequency values 19 5.4.5 Validity of the use of linear regression analysis 21 5.4.6 Determination of failure frequency for individual damage classifications 22 5.4.7 Determination of failure frequency per depth of cover 25 5.4.8 Determination of failure frequency per wall thickness class 27
5.5 Limitations Of EGIG Data 28
6. ANALYSIS OF THE BG TRANSCO DATA 29
6.1 Introduction 29 6.2 Description Of The Bg Transco Database 29 6.3 Classification Of Damage 29 6.4 Data Analysis 30
iv
6.4.1 Determination of overall failure frequency for damage caused by third party activity 30
6.4.2 Determination of failure frequency per class diameter 32 6.4.3 Use of refined statistical technique to determine failure frequency values 33 6.4.4 Validity of the use of linear regression analysis 34 6.4.5 Determination of failure frequency for individual damage classifications 34 6.4.6 Comparison of predicted failure frequency values derived from EGIG and BG
Transco data 36 6.4.7 Determination of failure frequency per depth of cover 37 6.4.8 Determination of failure frequency per wall thickness class 39 6.4.9 Determination of pipeline location failure frequency 41 6.4.10 Determination of effectiveness of pipeline damage prevention measures 42
6.5 Analysis Of The Third Party Activities Causing Pipeline Failure 46 6.6 Limitations Of BG Transco Data 49
7. DEVELOPMENT OF THIRD PARTY ACTIVITY FAILURE MODEL 50
7.1 Existing Failure Model 50 7.2 Refinement Of Failure Model For Third Party Activity 50 7.3 Refinement Of Failure Frequency Data Produced By PIPIN To Make It
Compatible For Use With MISHAP 54
8. RECOMMENDATIONS 55
9. REFERENCES 56
10. APPENDICES 58

v
GLOSSARY
ABBREVIATIONS AND ACRONYMS BG Transco BG Transco (represented by BG Technology) CONCAWE Conservation for Clean Air and Water in Western Europe D-GPS Differential Global Positioning System DOT Department Of Transportation EGIG European Gas Pipeline Incident Data Group GPS Global Positioning System HF High Frequency HSE Health and Safety Executive IGE Institution of Gas Engineers JIP Joint Industry.Project MISHAP Model for the estimation of Individual and Societal risk from HAzards of
Pipelines OPS Office of Pipeline Safety PIPIN PIPeline INtegrity model UHF Ultra High Frequency USA United States of America

vi
1
1. INTRODUCTION
The Health and Safety Executive (HSE) commissioned WS Atkins in 1993 to undertake a review of the feasibility of refining pipeline data. One of the main points emanating from this study was that there was no central co-ordinated source providing pipeline failure data for commodities such as gas, oil and oil products. Documents reviewed during the study cited the European oil company’s organisation “Conservation for Clean Air and Water in Western Europe” (CONCAWE) and the equivalent gas company’s organisation “European Gas Pipeline Incident Data Group” (EGIG) as the main reference sources. Following this first report a further two studies were commissioned in 1997. The first was to develop a predictive probabilistic failure model based upon fracture mechanics theory for pipeline failures caused by third party interference. The second study was a continuation of the initial feasibility project and was aimed at collecting, collating and utilising the available pipeline failure data from the public domain and developing a failure model. The results of both of these projects were combined together in the form of a single computer model referred to as “PIPIN” which provides failure mode and frequency data for input into the HSE’s “MISHAP” risk model. The ‘MISHAP’ model in turn calculates individual and societal risk values from pipelines conveying hazardous substances. Following on from the three previous studies, the HSE wished to refine and update their pipeline failure model, to this end the HSE commissioned WS Atkins to undertake two further projects in relation to pipelines. This, the first project, focuses on third party activity and its implication on the failure frequencies of gas pipelines. Third party activity has been identified as being responsible for the majority of pipeline failures both in Europe and World-wide.(1) Previous studies have found that the degree of damage caused by third party activity is affected by parameters such as; depth of cover, wall thickness, location and pipeline damage prevention measures. The aim of this study was to revise/update the failure data for third party activity and where possible to introduce factors for these parameters. The main driving force for this study was the provision of new data by BG Technology (representing BG Transco) under a Joint Industry Project (JIP) with HSE. Under this arrangement, BG Technology provided internal company reports and information in the form of two databases; one providing operational pipeline details and the other providing details of incidents arising from third party activity for the period from 1968 to 1999. Also since the previous studies new information was available in a recent report from EGIG giving a summary of European failure data for the period 1970 to 1997 and this was used as a comparison with the BG Technology data and to update the European data currently contained within PIPIN. In addition to these data sources, a literature review was undertaken for completeness, to ensure that no useful alternative data source was overlooked. The aim of the second project was to revise/update the pipeline failure data, for modes of failure other than third party activity, for pipelines carrying gas, oil and oil products worldwide. This project was completed using the most recent data from CONCAWE and

2
EGIG, along with other relevant data from the public domain and is reported elsewhere. The results obtained from the two projects will be used to update the ‘PIPIN’ software program.
3
2. SCOPE OF WORK
The PIPIN software contains a database of information from which failure rates can be predicted for pipelines carrying gas, crude oil and oil products. This study concentrated on refining the database and predictive pipeline failure frequency methods, taking into account factors such as; pipeline diameter, pipeline wall thickness, depth of cover , pipeline location and pipeline damage prevention measures used as protection for gas transmission pipelines. This study was carried out as a joint industry initiative between HSE and BG Transco, with WS Atkins acting on behalf of HSE. As part of this initiative, BG Transco provided incident data from their historical records, technical resource to interpret the data and joint management of the project with HSE. The scope of work developed for completion during this phase of the project included the following:- • identification of measures in use for gas transmission pipelines to mitigate against damage
caused by third party activity; • a literature search to obtain published information on the effectiveness of these measures; • collection of data from pipeline operating companies, in particular BG Transco and EGIG
members, relating to incidents where damage to the pipeline had occurred as a result of third party activity, considering the effect of population density on the damage profile and the effectiveness of the pipeline damage prevention measures used;
• analysis of information and data provided by pipeline operating companies to determine appropriate algorithms for incident and failure frequencies to enable factors from which failure frequencies could be adjusted for each type of pipeline damage prevention measure; and
• a report summarising the findings of the project. The scope of work to be completed as part of the second pipeline project included:- • modification of the PIPIN software and the accompanying documentation to include the
new factors determined.
4
3. LITERATURE SEARCH
3.1 PURPOSE OF THE LITERATURE SEARCH The purpose of the literature search was to:- • identify the measures in use for gas transmission pipelines to mitigate against damage
caused by third party activity; and • to research published information on the effectiveness of measures currently used to
mitigate against damage caused by third party activity. References were sought from the UK, Europe, Canada and the USA.
3.2 IDENTIFICATION OF KEY SEARCH PARAMETERS The completion of a successful literature search required the identification of key search parameters. The following key word/phrases and combinations thereof proved most suitable when conducting this literature search: - • depth of cover; • slabbing; • sleeving; • third party damage; • pipeline safety; • pipeline damage; • pipeline damage prevention measures; and • pipeline failure.
3.3 SOURCES OF INFORMATION BIDS Database The initial step in acquiring relevant literature for the project was to use the BIDS on-line search engine Ingenta, which produced a list of abstracts that could then be reviewed. The databases searched included: - • Chemical Abstracts Data Base; • Ei Compendex; • Royal Society of Chemistry; • Chemical Engineering and Biotechnological Abstracts data base; • Analytical Science; • Chemical Safety News Base; • Health and Safety; and • Chemical Business News.
5
The reference databases were scanned back as far as the late seventies to obtain suitable references. HSE Library A search of the CD ROMS held in the HSE library in Sheffield was undertaken and provided brief summaries of relevant journals and HSE articles. WS Atkins Library The WS Atkins Library performed an on-line search using the search engine Dialogue and results were obtained from the following databases:- • ABI/Inform®; • TULSAC (Petroleum ABS); • Energy Sci Tec; • Pascal; and • IAC Trade & Industry. Institute of Chemical Engineers The Institute of Chemicals Engineers Library was contacted to perform an online search and database search of WinSPIRS 2.0 CD ROM. Institution of Gas Engineers The Institution of Gas Engineers (IGE) was contacted and they performed searches of their library and the American gas line database. American Office of Pipeline Safety The American Office of Pipeline Safety, a division of the U.S. Department of Transportation (DOT), oversees transportation policy and compilation of statistics. The DOT is divided into a number of divisions, one of which is the Office of Pipeline Safety (OPS). The OPS is responsible for ensuring that operators of transmission and distribution pipelines follow the mandated Regulations in the U.S. U.S federal law requires that incident data on pipeline failures must be available to the public. A copy of the database for all the transmission and gathering line incidents between 1984 and 1999 was obtained.
3.4 LITERATURE SEARCH METHODOLOGY The literature search methodology used during the course of the study is illustrated in Figure 1.
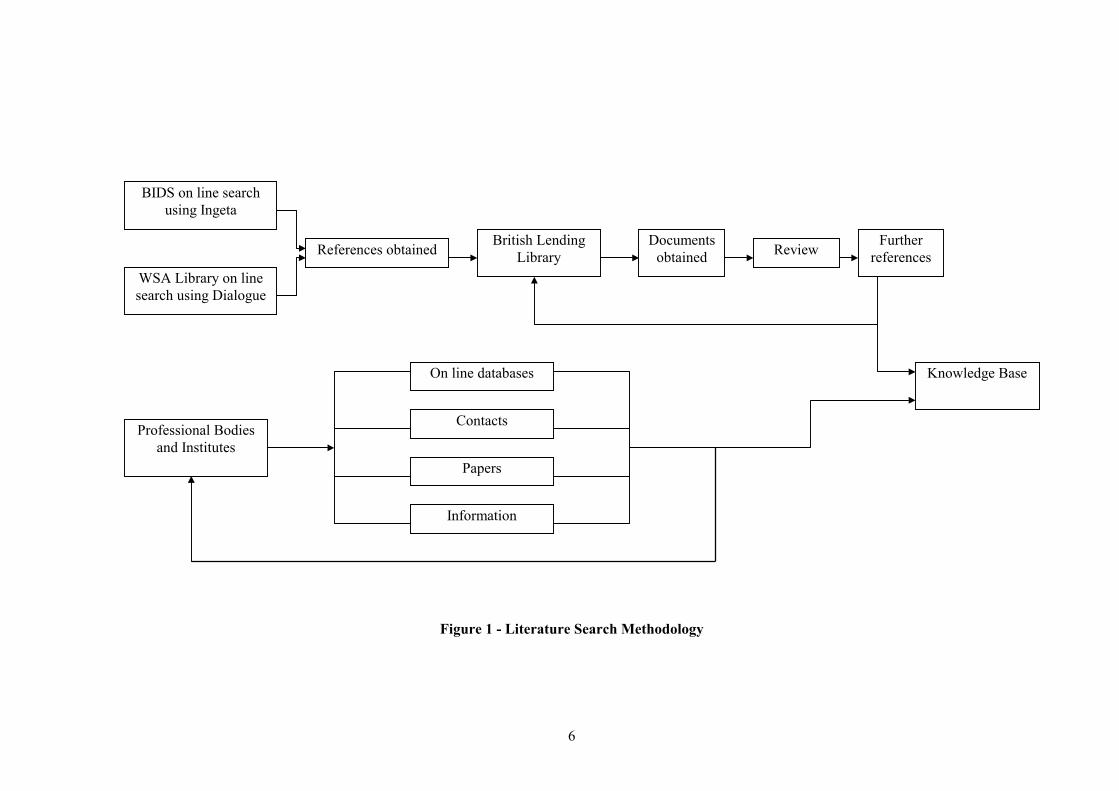
6
Figure 1 - Literature Search Methodology
BIDS on line search using Ingeta
WSA Library on line search using Dialogue
References obtained British Lending Library
Documents obtained Review Further
references
Professional Bodies and Institutes
On line databases
Contacts
Papers
Information
Knowledge Base
7
3.5 RESULTS OF LITERATURE SEARCH A number of relevant references were identified during the course of the literature search which were subsequently obtained from the British Library. The BIDS Database search identified the largest number of relevant articles, 15 in total. The Institute of Gas Engineers’ search identified 5 articles and the HSE and the Institution of Chemical Engineers’ search identified 2 articles which were also found by the BIDS Database search. WS Atkins’ library search identified one useful article. Information of relevance derived from these references was summarised and presented in Appendix A.
3.6 RESULTS OF BG TRANSCO LITERATURE SEARCH BG Transco conducted a literature review of their internally published reports and identified 11 of relevance to the study. The reports dated back to 1974, with the most recent being prepared in 1995. The contents of the reports have been reviewed and relevant information was summarised and presented in Appendix B.

8
4. PIPELINE DAMAGE PREVENTION MEASURES
4.1 INTRODUCTION Pipeline damage prevention measures are designed to:- • alert third parties to the presence of the pipeline prior to commencing their activities; • limit the extent of pipeline damage caused by third activity; and • initiate a mechanism by which the pipeline operator establishes a suitable monitoring
regime for activities conducted along the pipeline route.
4.2 TYPES OF PIPELINE DAMAGE PREVENTION MEASURE There are several types of measure that are used in association with gas transmission pipelines to mitigate against the damage caused by third party activity and these have been categorised on the basis of:- • pipeline damage prevention measures installed during pipeline construction; and • pipeline damage prevention measures undertaken post-pipeline construction.
4.2.1 Pipeline damage prevention measures installed during pipeline construction
This type of pipeline damage prevention measure is designed to alert third parties as to the presence of the pipeline prior to commencing their activities. In other cases, this type of pipeline damage prevention measure is designed to provide additional pipeline protection, thus reducing the damage caused by third party activity. In the event of an excavation, the machine operator would become aware that there was a pipeline under the workings. The excavation work would be stopped and the pipeline operator contacted in the event of damage having been caused. This type of pipeline damage prevention measure can also be installed retrospectively should the circumstances require.
4.2.2 Pipeline damage prevention measures undertaken post-pipeline construction
This type of pipeline damage prevention measure generally takes the form of pipeline monitoring such as ground patrols, airborne/satellite surveillance etc. and aims to ensure that that nothing, be it use of excavating machines or building works, is in such close proximity to a pipeline that it could result in damage. These measures also detect pipeline damage caused by natural phenomena such as ground movement.
9
4.2.3 Examples of pipeline damage prevention measures installed during pipeline construction
A review of the different types of pipeline damage prevention measures installed during pipeline construction has been undertaken and their relative advantages/disadvantages are presented below:- Slabs, Tiles and Plates Reinforced concrete slabs, tiles or steel plates are buried above the pipeline so that in the event of excavation the slab, tile or plate is encountered before the pipeline. In theory, damage is limited to the slab, tile or plate and not the pipeline.(1) Advantages • May be installed retrospectively by removing a few centimetres of earth above the
pipeline; • Experiments have demonstrated that this method is especially effective when used in
conjunction with warning tapes.(2) Disadvantages • Only suitable for use over short distances; • Thin concrete slabs can be penetrated by large excavation equipment (i.e. excavators over
20 tonnes).(1) Sleeving The pipeline is placed in a sleeve made of either concrete or steel. The annulus between the sleeve and the pipe is filled with cementitious grout or, alternatively, inert gas.(3)
Advantages • The sleeve provides an additional layer of protection to the pipeline. Disadvantages • The sleeve coating does not identify the contents of the underlying pipeline. Therefore,
third party activity often continues until the pipeline is damaged.(2)
10
High Tensile netting A high tensile net is buried above the pipeline and is designed to work on the same basis as slabbing / plating. Advantages • This method is especially effective when used in conjunction with warning tapes;(3) • Netting does not effect the drainage around the pipe; • Netting would not effect any external scans of the pipeline that may be required.(3) Disadvantages • Only suitable for use over short distances. Increased wall thickness This particular pipeline damage prevention measure is used in areas where the pipeline is considered to be at increased risk from third party activity or where the pipeline is routed underneath a road or railway. Advantages • Thick wall pipelines can be installed at the time of construction; • The increased wall thickness provides additional protection, which may lessen the degree
of damage in the event of third party activity. Disadvantages • This particular mitigation alone will not prevent damage to the pipeline occurring in the
event of third party activity. Marker posts Marker posts are placed at strategic point along the length of the pipeline, usually at field and road boundaries.(4) Advantages • Relatively cheap to install; • Can be used cover the full length of the pipeline. Disadvantages • Offer a warning only that the pipeline is present; • May not be visible to the third parties when spaced too widely apart; • Are susceptible to damage and vandalism.

11
Marker tape This pipeline damage prevention measure is often used in conjunction with other forms of pipeline protection such as the use of sleeves, slabs or tiles. The marker tape is generally buried at a distance above the level at which the pipeline is laid. Advantages • Relatively cheap to install; • Can be used to identify the contents of the pipeline; • Can be used cover the full length of the pipeline. Disadvantages • Offer a warning only that the pipeline is present. Additional Wrapping Additional wrapping is generally used as protection against pipeline corrosion and is not used as a measure to limit the impact of the damage caused by third party activity.
4.2.4 Examples of pipeline damage prevention measures post-pipeline construction
A review of the different types of pipeline damage prevention measure conducted post-pipeline construction has been undertaken. Generally, this type of pipeline damage prevention measure takes the form of some kind of surveillance activity. Some building and excavation activities last a relatively short period of time, often less than a couple of weeks, which means that the surveillance activity must be undertaken on a relatively frequent basis to be of benefit. The relative advantages and disadvantages of pipeline damage prevention measures conducted post-pipeline construction are presented below:- Helicopter Surveillance A helicopter, carrying an observer, flies over the complete pipeline route at a height of 200 m and speed of 145km/hr whilst looking for unusual activities near the pipeline.(5) IGE recommend that aerial patrols be carried out every two weeks.(3)
Advantages • Large areas may be covered quickly; • Presence of the helicopter acts as a deterrent. Disadvantages • Bad weather conditions may mean that the survey does not go ahead.

12
Vantage Point Survey Vantage points, such as high ground, are used to identify any unusual activity along the path of a pipeline. Vantage point surveys may be used as an alternative to aerial surveys, provided the whole pipeline is covered in an equivalent manner to an aerial survey.(3) Advantages • The survey can be applied selectively to target problem areas. Disadvantages • Third party activities are not always easily visible; • This surveillance technique is generally more expensive than helicopter surveillance. Full Walking Survey The route of the pipeline is walked, usually about every two years. The walkers look for any unusual activities that are being, have been or are due to be carried out near the route of the pipeline. IGE recommend that the entire pipeline should be walked at least every two years.(3) Advantages • This method offers a very thorough inspection regime to be undertaken; • Other factors, which could result in pipeline damage such as ground movement may also
be identified. Disadvantages • This method is time consuming and can prove expensive. Satellite Surveillance Satellite surveillance may be used as an alternative to aerial methods which are recommended by IGE to be carried out every two weeks.(3) Various companies offer satellite surveillance services, which generally involves taking a picture of the pipeline route which is subsequently updated at regular intervals. Pictures can vary in quality from black and white 2-D images to 3-D colour contour maps.(6) Satellite imaging technology is constantly improving and the picture resolution increasing, such that satellite surveillance may become a more feasible option in the future. Advantages • Cost effective method for large areas of land e.g. a desert or the Arctic; • Enables a progressive picture of the pipeline system to be built up.

13
Disadvantages • The resolution obtained is not currently suitable for the type of geography found in the
UK (i.e. small fields, woodland, hedges etc.) where building and excavation activities may not be detected;
• Some satellite systems only work in daylight and in clear weather, which can not be relied upon in the UK;
• The cost can vary between 10p a km/year to £9 a km/year depending on the resolution required and frequency of scans.
GPS and D-GPS Using Global Positioning Systems (GPS) it is possible to locate a vehicle to within 1m of its exact position on the ground. Differential - Global Positioning System (D-GPS) is a more accurate method of satellite positioning that utilises a static reference station to allow a differential measurement to be made, improving the accuracy of positioning down to 1 cm.(7) This technique relies on mechanical excavation equipment being fitted with a positioning systems. The mechanical diggers’ position is then relayed back to a central location where it is compared with the known location of gas transmission pipelines. Should a mechanical digger commence work too close to a pipeline, then an alarm would sound in the driver’s cabin. The use of such a pipeline damage prevention measure would require every mechanical digger to have:- • an antenna (D-GPS) mounted near the bucket; • an antenna (HF or UHF) on the roof; • a processing unit located inside the cabin; and • an alarm. Advantages • The pipeline itself does not require the installation of surveillance equipment; • The pipeline operator has the ability to know exactly where activities are being
undertaken in relation to the pipeline. Disadvantages • A digitised map of the pipeline layout has to be prepared such that the mechanical
diggers’ position can be superimposed; • Each mechanical digger would be required to carry expensive equipment. This might be
practical for equipment belonging to the pipeline operator, but many incidents are caused by third parties who might not have the equipment installed.

14
Electromagnetic Detection A variable current is injected into the pipeline, which causes a magnetic field to be set up. A magnetic field sensor once installed in the excavator’s bucket would then be able to detect the magnetic field.(7) Advantages • The pipeline need only be partially disturbed to put the measure in place; • This measure can be effective over relatively long sections of pipeline. Disadvantages • The current can only travel a few km, so booster transmitters must be installed. • Each mechanical digger would have to have a detection system installed.
4.3 PIPELINE SAFETY LEGISLATION The UK implemented a statutory regime to secure pipeline safety in the Pipeline Safety Regulations 1996 (PSR 1996). The Regulations set out a single, risk-based, goal setting approach for both onshore and offshore pipelines.(8) The Regulations are applicable throughout the pipeline lifecycle and apply from initial conception through to decommissioning. Previous work has shown that 70% of all pipeline related incidents are due to third party activity.(9) PSR 1996 deals with this issue in terms of the requirements laid down under Regulations 15 and 16: Regulation 15 states ‘No person shall cause such damage to a pipeline as may give rise to a danger to persons’. This Regulation could apply to the operator of a pipeline or third parties. The damage that the pipeline sustains, however inconsequential, must be reported to the pipeline operator. Failure to do so could result in a breach of the Health and Safety at Work etc. Act 1974. Regulation 16 states ‘For the purpose of ensuring that no damage is caused to a pipeline, the operator shall take steps to inform persons of its existence and whereabouts as are reasonable’. The guidance on the Regulations do not prescribe the form of protection to be used during pipeline construction, other than describing the use of marker tape. The guidance recommends that the operator takes reasonable steps to inform people of the existence of the pipeline and that they should be in regular contact with the owners/occupiers of the land and that appropriate periodic surveying of the pipeline route should take place.

15
4.4 UK PRACTICE FOR THE INSTALLATION OF GAS TRANSMISSION LINES
The Institution of Gas Engineers makes recommendations concerning the installation of steel pipelines for high pressure gas transmission in its publication IGE/TD/1.(3)
Three distinct types of area, designated R, S and T, are defined that represent locations adjacent to the pipeline. The area types require different pipeline design criteria in order to protect the public from hazards associated with the operation of the pipeline. The population density per unit area in proximity to the pipeline determines whether a rural (R ), suburban (S) or town (T) designation applies and subsequently which design criteria apply. The following definitions apply:- • type R - rural areas with a population density not exceeding 2.5 persons per hectare; • type S - suburban areas in which the population density exceeds 2.5 persons per hectare
and which may be extensively developed with residential properties, schools, shops etc.; and
• type T - town (or city) centre areas with a high population density including multi-storey buildings, dense traffic and numerous underground services. As defined by The Institution of Gas Engineers, a town area has not been assigned a population density.
Additional recommendations are made covering the construction and operation of the pipeline in terms of:- • minimum depth of cover; • minimum wall thickness for pipelines in proximity to traffic routes; • forms of protection for pipelines with relatively small wall thickness in suburban areas;
and • inspection and surveillance regimes.
16
5. ANALYSIS OF THE EGIG FAILURE DATA
5.1 INTRODUCTION In 1982, six European gas transmission system operators decided to pool individual data relating to the unintentional release of gas from their pipeline transmission systems under the collective banner of the European Pipeline Incident Data Group (EGIG). The aim of pooling data from a number of operators was to provide a broad basis for statistical use, producing a more realistic picture of the frequencies and probabilities of incidents than would be possible with the independent data of each operator considered separately. The collection and analysis of safety related data has grown in significance as a result of increasing interest shown by local, national and international authorities responsible for safe gas transmission. In 1997, a total of nine pipeline operators, comprising all of the major gas transmission system operators in Western Europe, were registered as EGIG members. The participating operators were:- • Dansk Gasteknisk Centre a/s, represented by DONG (Denmark); • ENAGAS, S.A. (Spain); • Gaz de France (France); • N.V. Nederlandse Gasunie (Netherlands); • Ruhrgas AG (Germany); • S.A. Distrigaz (Belgium); • SNAM S.p.A (Italy); • SWISSGAS (Switzerland); and • BG Transco, represented by BG Technology (UK) Given the number of participants, the extent of the pipeline system and the exposure period involved, from 1970 onwards for most of the participating operators, the EGIG database is regarded as a valuable and reliable source of information. Regional differences between the participating members are not taken into account in the preparation of the report. Hence, the results reported present the ‘average position’ of all the participating operators.
5.2 COLLECTION OF DATA The 3rd EGIG report 1970-1997(10) was used to determine a failure frequency for gas pipelines due to third party activity from data presented in a graphical form. The Secretary of the EGIG group was contacted to see whether the actual raw data provided by the pipeline operators could be made available for use within this project. Unfortunately, the raw data submitted by the pipeline operators’ is considered strictly confidential by EGIG and therefore could not be passed on for use in this project. Representatives from the individual pipeline operators were approached with a request to provide their data. All, with the exception of BG Transco, declined to participate in this study.

17
5.3 CLASSIFICATION OF DAMAGE The 3rd EGIG report contained pipeline incident data that had been collected from the pipeline operators for the period 1970 to 1997. The criteria for the inclusion of incidents in the EGIG analysis was as follows:- • there was an unintentional release of gas; • the incidents were related to onshore transmission pipelines;
♦ with a design pressure greater than 15 bar; ♦ outside the fences of installations; and ♦ excluding associated equipment e.g. valves or parts other than the pipeline itself.
Damage was classified on the basis of one of the following, depending on leak size:- • pinhole, with a diameter of defect less than or equal to 2 cm; • hole, with a diameter of defect greater than 2cm and less than or equal to the diameter of
the pipeline; and • rupture, with a diameter of defect greater than the diameter of the pipeline. Incidents were recorded according to the initial cause of the damage, based on:- • third party activity; • corrosion; • construction defect/material failure; • hot-tap made by error; • ground movement; and • other and unknown causes. The data presented in the EGIG report covered 1,980,000 km-years of operational pipeline experience and contained 945 reported incidents that resulted in an unintentional release of gas. Only the third party activity data has been analysed for the purpose of this report.
5.4 DATA ANALYSIS
5.4.1 General
It is known that the extent of damage caused by third party activity is dependent on factors such as: • Pipe diameter; • Depth of cover; • Wall thickness; and • Material of construction grade/yield strength. It should be noted that the effect of material of construction grade/yield strength on the extent of damage caused by third party activity has not been examined for the purpose of this report because of the limited data available.

18
5.4.2 Determination of failure frequency per diameter class
In order to be able to use the data from the EGIG report it had to be interpreted from a series of graphical representations. Figure 11 of the EGIG report gave the failure frequency per diameter class for external interference in terms of pinhole, hole and rupture size leaks. External interference was considered to have been caused by third party activity. The data presented in Figure 11 was ‘measured’ in order to obtain failure frequency values for different diameter ranges and damage classification. This data is reproduced in Table 1.
Table 1
Third party activity – failure frequency per diameter class Diameter Diameter Damage classification Total
range range (1000 km-years)-1 (1000 km-years)-1
[inches] [mm] Pinhole Hole Rupture 0-4 0-100 0.231 0.314 0.157 0.702
5-10 125-250 0.086 0.252 0.071 0.409 12-16 300-400 0.055 0.105 0.031 0.191 18-22 450-550 0.018 0.018 0.025 0.061 24-28 600-700 - 0.009 0.009 0.018 30-34 750-850 - - 0.012 0.012 36-40 900-1000 - - - - 40+ 1000+ - - - -
(- indicates that no data was available from the graph)
The diameter range, was reported in inches in the EGIG data, but for the purpose of this report the equivalent measurement in millimetres has been used. For the purpose of analysis, the failure frequency was assigned to the midpoint of the diameter range. However, for the range 0-100 mm the ‘midpoint’ was deemed to be at 100 mm since gas transmission pipelines generally do not have pipelines diameters less than 75mm. In support of this assumption an analysis of the BG Transco operational pipeline database demonstrated that over 70% of the pipeline network, in the range 0 – 100 mm, was 100 mm diameter. Similarly, for the pipeline diameter range of 1000 mm+, the ‘midpoint’ was deemed to be at 1050 mm (or 42 inches). In support of this assumption an analysis of the BG Transco operational pipeline database demonstrated that over 95% of the pipeline network with a diameter in excess of 1000 mm, was 1050 mm diameter. The EGIG report provided failure frequency data for pipelines with diameters less than 900 mm diameter. For pipelines of a larger diameter, where no pipeline failures were reported, a failure frequency could not be calculated. In the absence of such data, statistical techniques were used to determine failure frequency values.
5.4.3 Use of a statistical technique to determine missing failure frequency values
Previous studies(11) used a simple technique to estimate missing failure frequency values based on using the last available failure frequency value for each damage classification and subsequent pipe diameter. The use of this technique resulted in generation of relatively high failure frequency values for the larger pipeline diameters. Table 2 shows how values of failure frequency would be estimated using this technique.
19
Table 2 Estimated total third party activity failure frequency values
Diameter Diameter Damage classification Total range midpoint (1000 km-year)-1 (1000 km-year)-1
[mm] [mm] Pinhole Hole Rupture 0-100 100 0.231 0.314 0.157 0.702
125-250 187 0.086 0.252 0.071 0.409 300-400 350 0.055 0.105 0.031 0.191 450-550 500 0.018 0.018 0.025 0.061 600-700 650 0.018 0.009 0.009 0.036 750-850 800 0.018 0.009 0.012 0.039
900-1000 950 0.018 0.009 0.012 0.039 1000+ 1050 0.018 0.009 0.012 0.039
The use of this statistical technique introduced some inconsistencies into the analysis, such that the total failure frequencies for certain pipe diameters were higher than that for smaller pipe diameters. In an attempt to resolve these inconsistencies an alternative statistical technique was used.
5.4.4 Use of refined statistical technique to determine failure frequency values
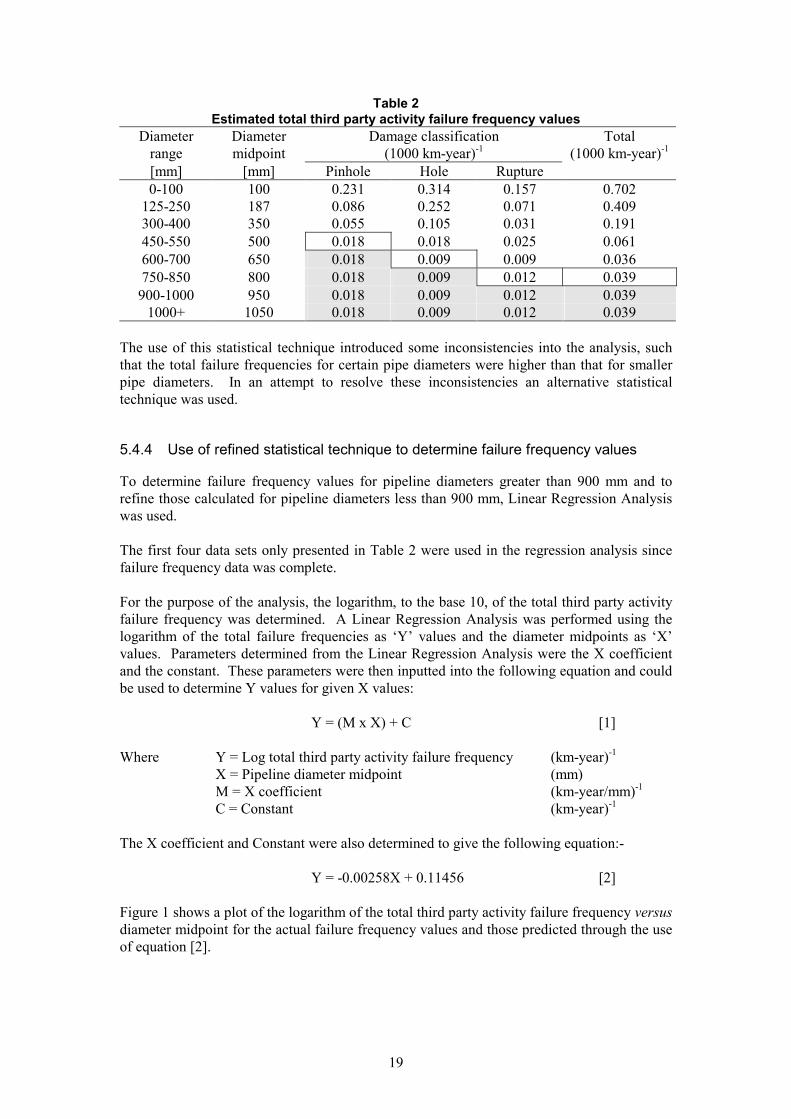
To determine failure frequency values for pipeline diameters greater than 900 mm and to refine those calculated for pipeline diameters less than 900 mm, Linear Regression Analysis was used. The first four data sets only presented in Table 2 were used in the regression analysis since failure frequency data was complete. For the purpose of the analysis, the logarithm, to the base 10, of the total third party activity failure frequency was determined. A Linear Regression Analysis was performed using the logarithm of the total failure frequencies as ‘Y’ values and the diameter midpoints as ‘X’ values. Parameters determined from the Linear Regression Analysis were the X coefficient and the constant. These parameters were then inputted into the following equation and could be used to determine Y values for given X values:
Y = (M x X) + C [1] Where Y = Log total third party activity failure frequency (km-year)-1
X = Pipeline diameter midpoint (mm) M = X coefficient (km-year/mm)-1
C = Constant (km-year)-1
The X coefficient and Constant were also determined to give the following equation:-
Y = -0.00258X + 0.11456 [2] Figure 1 shows a plot of the logarithm of the total third party activity failure frequency versus diameter midpoint for the actual failure frequency values and those predicted through the use of equation [2].
20
Figure 1 Log - Linear plot of actual and predicted total third party activity failure frequencies
versus pipeline diameter midpoint As can be seen in Figure 1, equation [2] was used to predict values of total third party activity failure frequency for diameter midpoints outside the actual data range – a process known as extrapolation. Within the range of diameter midpoint values evaluated, the behaviour of the data is known. Outside this range the behaviour of the data is largely unknown and the straight line, shown extrapolated in Figure 2, may no longer be a good fit to the actual data. Hence, great caution is needed when making extrapolated estimates. The antilogarithm of the predicted total third party activity failure frequency values was determined and this data has been presented in Table 3.
Table 3
Comparison of actual and predicted total third party activity failure frequency for EGIG data
Diameter Diameter Actual total failure Predicted total failure Range midpoint frequency Frequency [mm] [mm] (1000 km-year)-1 (1000 km-year)-1
0-100 100 0.702 0.719 125-250 187 0.409 0.429 300-400 350 0.191 0.163 450-550 500 0.061 0.067 600-700 650 0.018 0.027 750-850 800 0.012 0.011
900-1000 950 - 0.005 1000+ 1050 - 0.002
Data in bold is predicted. As shown in Table 3, predicted total third party activity failure frequency values were determined for pipelines with diameters greater than 600 mm. Actual total third party activity failure frequency data was determined from the EGIG report for pipelines with diameters in the range 600-700 mm and 750-850 mm. For reasons described above, this data
-3
-2.5
-2
-1.5
-1
-0.5
00 200 400 600 800 1000 1200
Diameter midpoint [mm]
log
10 fa
ilure
freq
uenc
y (1
000
kmye
ar)-1
Actual Predicted

21
was not used in the Linear Regression Analysis. However, this actual data was compared with the predicted values and a judgement made as to the validity of the Linear Regression Analysis method. The use of Linear Regression Analysis resulted in differences between the actual and predicted total third party activity failure frequency values. In most cases, for a specified diameter range, the actual total third party activity failure frequency was found to be lower than the predicted total third party activity failure frequency, thus erring on the side of caution. For the diameter range 300-400 mm the actual total third party activity failure frequency was determined to be some 17% higher than the predicted total third party activity failure frequency. For pipelines with diameters in the range 600-700 mm the actual total third party activity failure frequency was determined to be some 30% lower than the predicted value. Despite this, the use of Linear Regression Analysis was considered to be an appropriate statistical method for predicting failure frequency values. Figure 2 shows the actual total third party activity failure frequency data interpreted from the EGIG report and the predicted total third party activity failure frequency from equation [2].
Figure 2 Comparison of actual and predicted total third party activity failure frequencies versus
pipeline diameter midpoint
5.4.5 Validity of the use of linear regression analysis
In section 5.4.4 it was stated that the use of Linear Regression Analysis was considered to be an appropriate statistical method for predicting failure frequency values. Further justification for this statement is provided below. On of the outputs of the Linear Regression Analysis was to define a coefficient of determination, which compared the Y values estimated from the analysis with the actual values. The coefficient of determination ranges in value from 0 to 1. A coefficient of determination with a value of 1 exactly, indicates there is a perfect correlation between actual and predicted data. Therefore, the closer the coefficient of determination is to a value of 1, the better the ‘fit’ to the correlation.
00.10.20.30.40.50.60.70.8
0 200 400 600 800 1000 1200
Diameter midpoint [mm]
Failu
re fr
eque
ncy Actual
Predicted
0
0.1
0.2
0.3
0.4
0.5
0.6
0.7
0.8
0 200 400 600 800 1000 1200
Diameter midpoint [mm]
Failu
re fr
eque
ncy
(100
0 km
yea
r)-1
ActualPredicted
22
The coefficient of determination was found to be 0.989 for the data analysed, thus indicating that the actual data was a relatively good fit to the correlation. The coefficient of determination ‘measures’ the proportion of the total variation that can be explained by the regression equation. Hence, in the case presented above, 98.9% of the variations in failure frequency can be explained by the regression equation, leaving approximately 1% to be explained by other factors. Although the relatively high coefficient of determination indicated that a correlation existed, the justification cannot be made for a cause and effect relationship. However, the correlation does add weight to a relationship which theory suggests does exist. Through the use of Linear Regression Analysis, a regression equation was determined which indicated the nature of the relationship between pipeline diameter and total third party activity failure frequency, and a relatively high coefficient of determination was derived. However, the question as to whether the evidence justified the conclusion that a correlation existed had to be addressed. The method used to test the conclusion was to undertake a significance test on the coefficient of determination. It was assumed that the sample data was drawn from a population with a zero correlation coefficient. A relationship can be said to occur where the F-observed statistic is greater than the F-critical value. The F-observed statistic was determined to be 182.33. The F-critical value was obtained by reference to a table of F-critical values.(12) The following assumptions were made in order to determine the F-critical value: • a single-tailed test was applied at the 5% level; and • 2 degrees of freedom (number of data points – 2). The F-critical value was found, from tables, to be 18.5. Since the F-observed statistic, 182.33, was found to be substantially greater than the F-critical value, 18.5, the regression equation was therefore deemed to provide a useful means of predicting values of third party activity failure frequency. On the basis of the statistical analysis, the predicted total third party activity failure frequency data was subsequently used in the PIPIN model for specified pipeline diameter ranges. This decision was justified on the basis that the predicted data determined from the correlation was similar to that determined from the EGIG report. In addition, the total failure frequencies for pipeline diameters in the range 0 – 100 mm and 125 – 250 mm predicted through the use of the correlation were determined to be greater than the actual failure frequency values determined from the EGIG report, thus erring on the side of caution. The use of the correlation also enabled inconsistencies in the actual failure frequency data to be smoothed thus eliminating a source of concern arising from the use of the first version of PIPIN.
5.4.6 Determination of failure frequency for individual damage classifications
Although total third party activity failure frequency data had been determined for specified pipeline diameter ranges, failure frequencies for the individual damage classifications required refinement. Such refinement was necessary to smooth out inconsistencies in the actual data and to predict failure frequency values where data points were missing. Since a data set had been fully defined for total third party activity failure frequency versus diameter midpoint, it was now possible to determine a series of distribution factors that could

23
be applied in order to determine failure frequencies for the individual damage classifications. This was done by dividing the individual damage classification failure frequencies by the total third party activity failure frequency for that pipeline diameter range. The average failure frequency for the individual damage classifications was then calculated to determine the distribution factors.
Table 4
Determination of distribution factors Diameter Diameter Damage classification factor Total
range midpoint
[mm] [mm] Pinhole Hole Rupture 0-100 100 0.329 0.447 0.224 1.000
125-250 187 0.210 0.616 0.174 1.000 300-400 350 0.288 0.550 0.162 1.000 450-550 500 0.295 0.295 0.410 1.000
Total 1.122 1.908 0.969 4.000 Average 0.281 0.477 0.242 1.000
Table 4 shows the calculation of damage classification factors obtained by dividing the failure frequency for each damage classification by the total frequency for a specified diameter range for which data was complete in Table 1. The distribution factors were then applied to the predicted total failure frequencies for each diameter range shown in Table 3 in order to determine failure frequencies for the individual damage classifications. The results are shown in Table 5.
Table 5 Distribution factors applied to damage classifications for all diameter ranges
Diameter Diameter Damage classification Total Range Midpoint (1000 km-year)-1 (1000 km-year)-1
[mm] [mm] Pinhole Hole Rupture 0-100 100 0.202 0.343 0.174 0.719
125-250 187 0.121 0.205 0.104 0.429 300-400 350 0.046 0.078 0.039 0.163 450-550 500 0.019 0.032 0.016 0.067 600-700 650 0.008 0.013 0.007 0.027 750-850 800 0.003 0.005 0.003 0.011
900-1000 950 0.001 0.002 0.001 0.005 1000+ 1050 0.001 0.001 0.001 0.002
The application of Linear Regression Analysis enabled equation [2] to be determined. This equation was used to predict values for the total third party activity failure frequency, based on diameter midpoints. Actual pipeline diameters could be inputted into equation [2] to determine total third party activity failure frequencies. However, it was considered that such an approach would introduce error. Pipelines, for example, with diameters greater than the diameter midpoint (within a specified diameter range) would have lower predicted failure frequencies than the midpoint value. Conversely, pipelines with diameters less than the diameter midpoint would have higher predicted failure frequencies than the midpoint value. It was therefore decided to apply the predicted third party activity failure frequency values across the specified diameter range.

24
Figures 3, 4 and 5 show the actual third party activity failure frequency data interpreted from the EGIG report and predicted third party activity failure frequency values following application of the distribution factor for each classification of damage.
Figure 3 Comparison of actual and predicted total third party activity failure frequencies versus
pipeline diameter midpoint for EGIG data for pinhole damage
Figure 4 Comparison of actual and predicted total third party activity failure frequencies versus
pipeline diameter midpoint for EGIG data for hole damage
0
0.05
0.1
0.15
0.2
0.25
0 200 400 600 800 1000 1200
Diameter midPoint [mm]
Failu
re F
requ
ency
(100
0 km
year
)-1
ActualPredicted
0
0.05
0.1
0.15
0.2
0.25
0.3
0.35
0.4
0 200 400 600 800 1000 1200
Diameter midpoint [mm]
Failu
re fr
eque
ncy
(100
0 km
year
)-1
ActualPredicted
25
Figure 5 Comparison of actual and predicted total third party activity failure frequencies versus
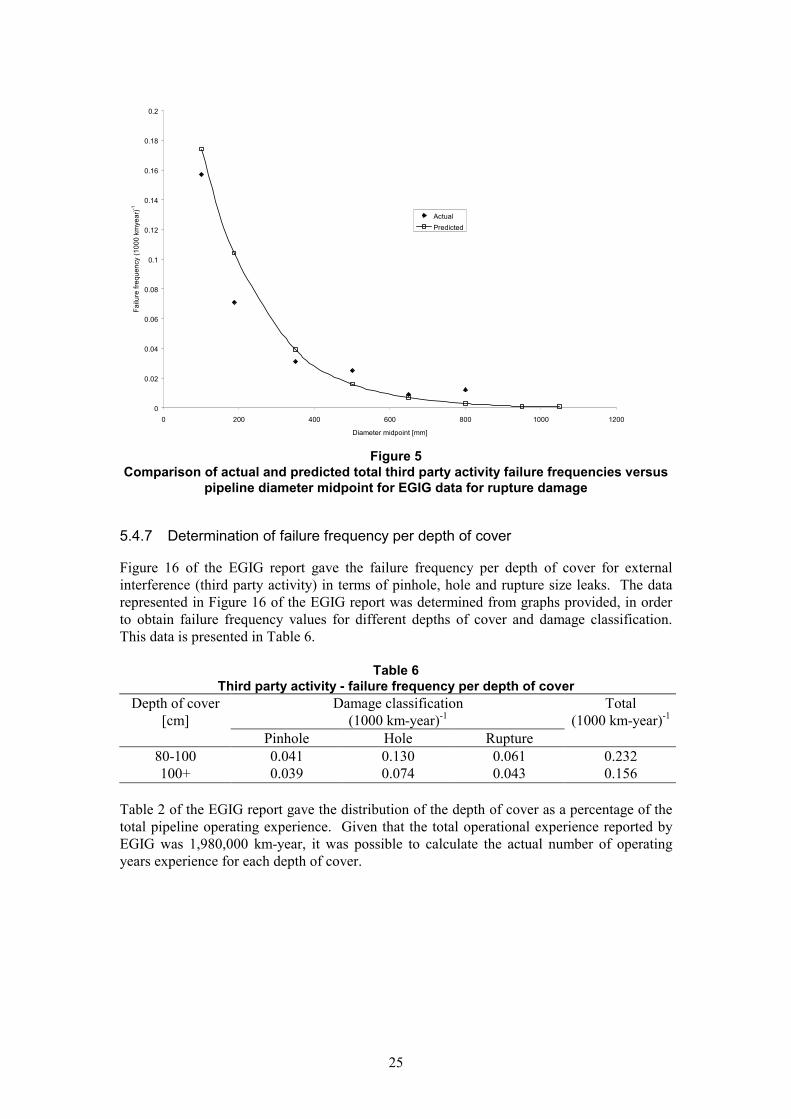
pipeline diameter midpoint for EGIG data for rupture damage
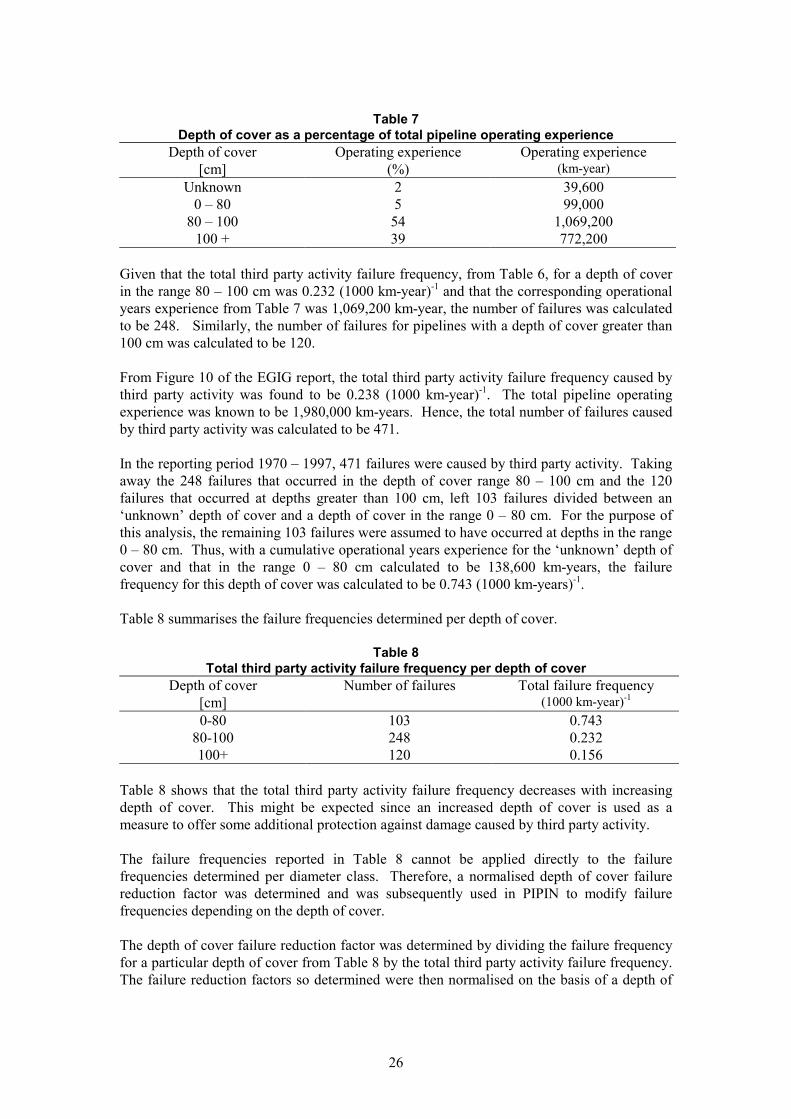
5.4.7 Determination of failure frequency per depth of cover
Figure 16 of the EGIG report gave the failure frequency per depth of cover for external interference (third party activity) in terms of pinhole, hole and rupture size leaks. The data represented in Figure 16 of the EGIG report was determined from graphs provided, in order to obtain failure frequency values for different depths of cover and damage classification. This data is presented in Table 6.
Table 6 Third party activity - failure frequency per depth of cover
Depth of cover Damage classification Total [cm] (1000 km-year)-1 (1000 km-year)-1
Pinhole Hole Rupture 80-100 0.041 0.130 0.061 0.232 100+ 0.039 0.074 0.043 0.156
Table 2 of the EGIG report gave the distribution of the depth of cover as a percentage of the total pipeline operating experience. Given that the total operational experience reported by EGIG was 1,980,000 km-year, it was possible to calculate the actual number of operating years experience for each depth of cover.
0
0.02
0.04
0.06
0.08
0.1
0.12
0.14
0.16
0.18
0.2
0 200 400 600 800 1000 1200
Diameter midpoint [mm]
Failu
re fr
eque
ncy
(100
0 km
year
)-1
ActualPredicted
26
Table 7
Depth of cover as a percentage of total pipeline operating experience Depth of cover Operating experience Operating experience
[cm] (%) (km-year) Unknown 2 39,600
0 – 80 5 99,000 80 – 100 54 1,069,200
100 + 39 772,200 Given that the total third party activity failure frequency, from Table 6, for a depth of cover in the range 80 – 100 cm was 0.232 (1000 km-year)-1 and that the corresponding operational years experience from Table 7 was 1,069,200 km-year, the number of failures was calculated to be 248. Similarly, the number of failures for pipelines with a depth of cover greater than 100 cm was calculated to be 120. From Figure 10 of the EGIG report, the total third party activity failure frequency caused by third party activity was found to be 0.238 (1000 km-year)-1. The total pipeline operating experience was known to be 1,980,000 km-years. Hence, the total number of failures caused by third party activity was calculated to be 471. In the reporting period 1970 – 1997, 471 failures were caused by third party activity. Taking away the 248 failures that occurred in the depth of cover range 80 – 100 cm and the 120 failures that occurred at depths greater than 100 cm, left 103 failures divided between an ‘unknown’ depth of cover and a depth of cover in the range 0 – 80 cm. For the purpose of this analysis, the remaining 103 failures were assumed to have occurred at depths in the range 0 – 80 cm. Thus, with a cumulative operational years experience for the ‘unknown’ depth of cover and that in the range 0 – 80 cm calculated to be 138,600 km-years, the failure frequency for this depth of cover was calculated to be 0.743 (1000 km-years)-1. Table 8 summarises the failure frequencies determined per depth of cover.
Table 8 Total third party activity failure frequency per depth of cover
Depth of cover Number of failures Total failure frequency [cm] (1000 km-year)-1 0-80 103 0.743
80-100 248 0.232 100+ 120 0.156
Table 8 shows that the total third party activity failure frequency decreases with increasing depth of cover. This might be expected since an increased depth of cover is used as a measure to offer some additional protection against damage caused by third party activity. The failure frequencies reported in Table 8 cannot be applied directly to the failure frequencies determined per diameter class. Therefore, a normalised depth of cover failure reduction factor was determined and was subsequently used in PIPIN to modify failure frequencies depending on the depth of cover. The depth of cover failure reduction factor was determined by dividing the failure frequency for a particular depth of cover from Table 8 by the total third party activity failure frequency. The failure reduction factors so determined were then normalised on the basis of a depth of

27
cover in the range 80 – 100 cm. This depth of cover range was chosen for the basis of normalisation since it is understood to be that specified by pipeline installation codes(3). The normalised depth of cover failure reduction factor could therefore be used to compare the effect of depth of cover for pipelines buried at depths outside that specified by code.
Table 9 Depth of cover failure reduction factor
Depth of cover Depth of cover failure reduction factor
Normalised depth of cover failure reduction factor
[cm] 0-80 3.12 3.2
80-100 0.97 1.0 100+ 0.66 0.7
5.4.8 Determination of failure frequency per wall thickness class
Figure 12 of the EGIG report gave the failure frequency per wall class thickness for external interference (third party activity) in terms of pinhole, hole and rupture size leaks. Failure frequency values for different wall thickness and damage classification were determined from the graphical representation in Figure 12. This data is presented in Table 10.
Table 10 Third party activity – failure frequency per wall thickness
Wall thickness Damage classification Total [mm] (1000 km-year)-1 (1000 km-year)-1
Pinhole Hole Rupture 0-5 0.130 0.315 0.170 0.615 5-10 0.029 0.098 0.043 0.170
10-15 - 0.022 - 0.022 15-20 - - - -
(- indicates that no data was available from the graph) Wall thickness is generally related to pipeline diameter in so far as pipe is manufactured with a ‘standard’ wall thickness. Some pipe may be manufactured with a ‘heavy wall gauge’, thus indicating that the wall thickness was greater then the standard. The data obtained from EGIG and presented in Table 10 does not enable pipeline failure frequencies to be determined where a wall thickness other than the standard was used. Hence, no further analysis was conducted on the effect of wall thickness on third party activity failure frequency. However, from the data presented in Table 10, it is possible to conclude that the use of thicker wall pipe has a beneficial effect and results in a reduction in the failure frequency due to damage caused by third party activity.
28
5.5 LIMITATIONS OF EGIG DATA One of the main problems with the EGIG data was the lack of failure data for large diameter pipelines. However, in the absence of such data a statistical technique was applied in order to determine suitable failure frequency data. The data could not be accessed in a ‘raw’ format and therefore had to be interpreted from a series of graphs. Errors were undoubtedly introduced when interpreting data using such techniques. The EGIG report did not identify the effect of population density in the vicinity of pipelines on the damage profile. Therefore, it was not possible to determine factors by which the failure rates could be adjusted to take into account the influence of population density. In addition, the EGIG report did not identify the measures used by pipeline operators to mitigate against the damage caused by third party activity. Nor did the report provide an analysis of the effectiveness of such measures. Therefore, it was not possible to determine appropriate factors by which the failure rates could be adjusted for the types of pipeline damage prevention measure in use.
29
6. ANALYSIS OF THE BG TRANSCO DATA
6.1 INTRODUCTION BG Transco has developed an operational and incident database, which has been populated with data over the last thirty years. The database contained the most comprehensive source of historical gas transmission line incidents in the UK.
6.2 DESCRIPTION OF THE BG TRANSCO DATABASE BG Transco provided WS Atkins with two sections of its database. The first section of the database records operational pipeline details and was populated with some 2226 entries. This section of the database contained details of the mode of construction and operating parameters for BG Transco’s gas transmission network in the UK. The second section of the database recorded ‘interference’ faults, which contained incidents directly attributable to third party activity. The interference fault database included incidents where damage to pipelines, tees, bends, valves and other components had occurred. To ensure consistency with the EGIG, incidents resulting in damage to valves and other components have been excluded from the analysis. The earliest recorded interference fault in the BG Transco database was 6th May 1968. In order to directly compare the BG Transco data with EGIG data, the same reference period was used i.e. 1st January 1970 until 31st December 1997. Incidents recorded outside this reference period were not included within the analysis.
6.3 CLASSIFICATION OF DAMAGE The criteria for inclusion of incidents in the BG Transco database was as follows:- • all incidents are recorded regardless of the damage caused to the pipeline; • the incidents are related to onshore transmission pipelines;
♦ with a design pressure greater than 7 bar; ♦ including associated equipment e.g. valves or other parts of the pipeline.
Within the interference fault database, damage was classified on the basis of ‘damage extent’ and ‘hole size’. This information does not readily enable damage to be classified in terms of pinhole, hole or rupture so that a direct comparison with the EGIG data cannot be made without making some assumptions.

30
The ‘damage extent’ was classified in terms of:- • loss – fracture, with the defect resulting in a loss of gas; • loss – leak, with the defect resulting in a loss of gas; • severe damage, where a defect greater than 20% of the thickness of the pipeline had been
formed; • slight damage, where a defect less than 20% of the thickness of the pipeline had been
formed; • coating only, where the external coating of the pipeline had been damaged; and • unknown. For the purpose of the study, the main focus of the analysis related to those incidents where third party activity had resulted in severe pipeline damage such that there had been an unintentional release of gas. Therefore, the analysis focused on loss- fracture and loss – leak incidents. Loss – fracture incidents were considered to be equivalent to rupture incidents reported in the EGIG database. Loss – leak incidents were considered to be equivalent to pinhole and hole incidents reported in the EGIG database, but did not provide a means of distinguishing between the two damage classifications. In order to determine the equivalent damage classification for a loss - leak incident, the ‘hole size’ parameter in the database was used. The ‘hole size’ was recorded in terms of an area in mm2. After discussions with BG Transco it was decided that the area should be considered as an equivalent circle. Once an equivalent hole size had been calculated, the damage was classified on the basis of:- • pinhole, with a diameter of defect equal to or less than 2 cm; and • hole, with a diameter of defect greater than 2 cm and less than or equal to the diameter of
the pipeline. Where the ‘hole size’ was not given for a particular Loss – leak incident, the ‘comments’ entry in the database was reviewed and evaluation made of the likely damage classification.
6.4 DATA ANALYSIS
6.4.1 Determination of overall failure frequency for damage caused by third party activity
The BG Transco interference fault database was interrogated to determine the number of incidents where the damage caused by third party activity resulted in an unintentional release of gas. Table 11 shows the results of this analysis and also includes incidents where damage to the pipeline other than a loss of gas had occurred.
31
Table 11 Incidents reported in the BG Transco incident interference fault database
Damage extent Number of incidents Loss – Fracture 10
Loss – Leak 22 Severe damage 81 Slight damage 378 Coating only 70
Unknown 3 Total 564
Within the reference period 1970 to 1997, the BG Transco database contained 564 reported incidents, of which 32 resulted in the unintentional release of gas. The total pipeline operational experience was calculated between 1st January 1970 and 31st December 1997 for pipelines commissioned before 1970 and between date of commissioning and 31st December 1997 for pipelines commissioned after 1970. The total pipeline operational experience was calculated to be 457,254 km-years. Table 12 shows the overall failure frequency for damage caused by third party activity for BG Transco compared with EGIG, the rest of Europe and the Department of Transportation in the USA.
Table 12 Comparison of overall failure frequency for damage caused by third party activity
BG Transco
(’70 – ‘97)
EGIG
(’70 – ‘97)
Rest of Europe
(’70 – ‘97)
DOT
(’85 – ’95)
Number of failures 32 471 439 250 Operating experience [km-year] 457,254 1,980,000 1,522,746 5,018,340 Failure frequency [1000 km-year]-1 0.070 0.238 0.288 0.050 Failure frequency factor 0.293 1 1.210 -
The number of failures and operating experience for the rest of Europe was calculated by subtracting the BG Transco data away from the EGIG data. Data obtained from the Department of Transportation (DOT) related to the reference period 1985 to 1995.(13) It should be noted that the DOT data includes an analysis of ‘severe’ incidents only which are defined, in this case, as those where damage resulted in fatalities or a ‘loss’ greater than $50,000. Hence, the failure frequency derived form DOT data is not directly comparable to that derived from Transco or EGIG data. The results presented in Table 12 show that the overall failure frequency for damage caused by third party activity for pipelines operated by BG Transco was considerably lower than that for other pipeline operators in Europe. However, it should be noted that the DOT data included an analysis of severe incidents only i.e. those where damage resulted in fatalities or a loss greater than $50,000. Therefore, the failure frequency derived from the DOT data was not directly comparable to Transco and EGIG data. A failure frequency factor, based on the overall EGIG failure frequency, was determined. One might be tempted to simply apply the BG Transco failure frequency factor to the EGIG
32
data determined in the Chapter 5. However, such an approach would introduce significant errors. The BG Transco data was therefore analysed on the same basis as the EGIG data.
6.4.2 Determination of failure frequency per class diameter
The BG Transco operational pipeline database was interrogated to calculate the operating experience and cross referenced to the interference fault database to determine the number of failures that had occurred for different pipeline diameter ranges. The pipeline diameter ranges chosen were those used in the EGIG analysis. The failure frequency per diameter class was also calculated and the results are presented in Table 13.
Table 13 Third party activity – failure frequency per diameter class for BG Transco data Diameter Diameter Operating Number of Failure
range midpoint experience failures frequency [mm] [mm] [km year] (1000 km-year)-1
0-100 100 22985 5 0.218 125-250 187 83547 15 0.180 300-400 350 84220 8 0.095 450-550 500 69864 3 0.043 600-700 650 83494 0 - 750-850 800 24342 1 0.041
900-1000 950 72985 0 - 1000+ 1050 15817 0 - Total - 457254 32 0.070
(- indicates that no data was available) Further analysis of the BG Transco interference fault database enabled the failure frequencies for different classifications of damage to be determined. The results are reported in Table 14.
Table 14 Failure frequency per diameter class in terms of pinhole, hole and rupture size leaks
Diameter Diameter Damage classification Total range midpoint (1000 km-year)-1 (1000 km-year)-1
[mm] [mm] Pinhole Hole Rupture
0-100 100 0.044 0.087 0.087 0.218 125-250 187 0.072 0.060 0.048 0.180 300-400 350 0.024 0.071 - 0.095 450-550 500 0.029 - 0.014 0.043 600-700 650 - - - - 750-850 800 - - 0.041 0.041
900-1000 950 - - - - 1000+ 1050 - - - -
(- indicates that no data was available) The information presented in Table 14 shows that there are a significant number of gaps in the failure frequency data. In the absence of such data, a statistical technique was used to determine failure frequency values.
33
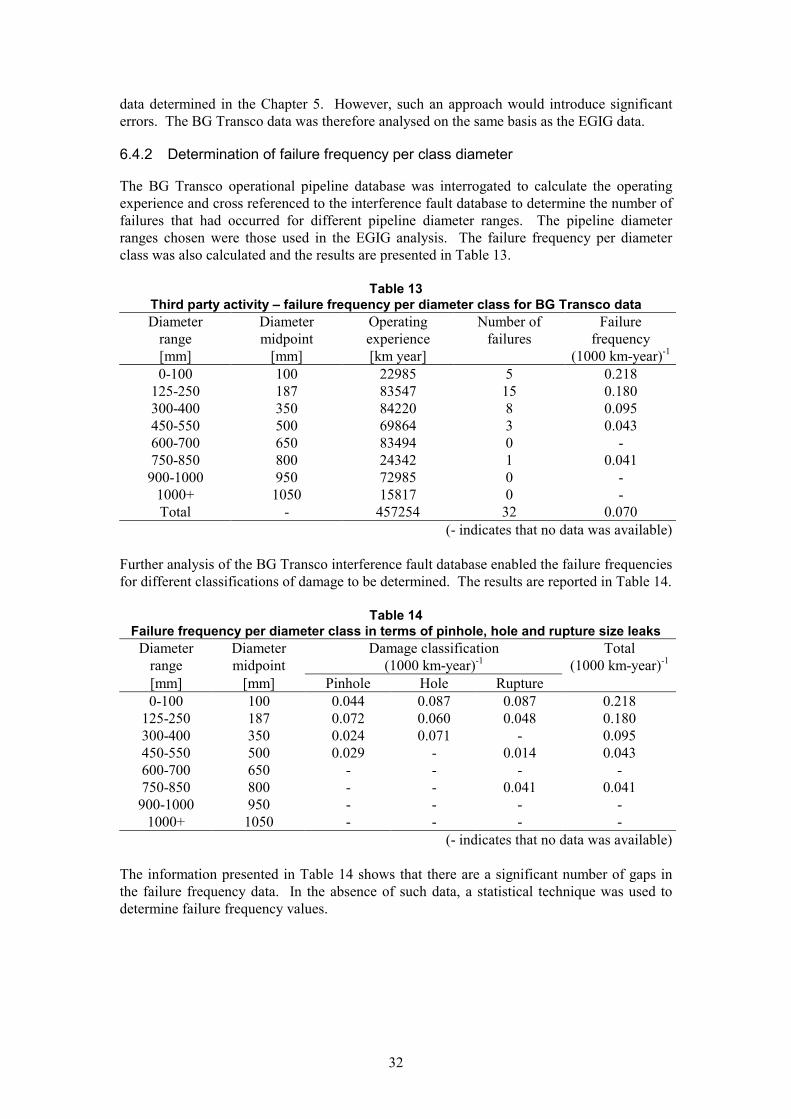
6.4.3 Use of refined statistical technique to determine failure frequency values
To determine total third party activity failure frequency values and refine those calculated from the BG Transco database, Linear Regression Analysis was used as described in section 5.4.3. The information contained in Table 15 presents a comparison of the actual total failure frequency data versus the predicted total failure frequency values determined by Linear Regression Analysis.
Table 15 Comparison of actual and predicted total third party activity failure frequency for BG
Transco data Diameter Diameter Actual total failure Predicted total failure
Range Midpoint frequency frequency [mm] [mm] (1000 km-year)-1 (1000 km-year)-1
0-100 100 0.218 0.239 125-250 187 0.180 0.168 300-400 350 0.095 0.086 450-550 500 0.043 0.046 600-700 650 - 0.025 750-850 800 0.041 0.014
900-1000 950 - 0.007 1000+ 1050 - 0.005
Data in bold is predicted. Figure 6 shows the actual total third party activity failure frequency data interpreted from the BG Transco data and the predicted total third party activity failure frequency from the correlation.
Figure 6 Comparison of actual and predicted total third party activity failure frequencies versus
pipeline diameter midpoint for BG Transco data
0
0.05
0.1
0.15
0.2
0.25
0.3
0 200 400 600 800 1000 1200
Diameter midpoint [mm]
Failu
re F
requ
ency
(100
0km
yr)-1
ActualPredicted

34
6.4.4 Validity of the use of linear regression analysis
Linear Regression Analysis was used to determine the following equation from the BG Transco data:
Y = -0.00178X - 0.44306 [3] Where Y = Log total third party activity failure frequency (km-year)-1
X = Pipeline diameter midpoint (mm) For defined diameter midpoints, equation 3 enabled predicted values of total failure frequency to be determined. The coefficient of determination was found to be 0.981, thus indicating that the actual data was a relatively good fit to the correlation. A significance test on the coefficient of determination was undertaken at the 5% level. The F-critical value was found, from tables, to be 18.51. Since the F-observed statistic, 105.65, was found to be substantially greater than the F-critical value, 18.51, the regression equation was therefore deemed to provide a useful means of predicting values of third party activity failure frequency.
6.4.5 Determination of failure frequency for individual damage classifications
The predicted failure frequency values were used to determine a series of distribution factors, to be applied in order to determine failure frequencies for the individual damage classifications. The results are shown in Table 16.
Table 16
Distribution factors applied to damage classifications for all diameter ranges Diameter Diameter Damage classification Total
range midpoint (1000 km-year)-1 (1000 km-year)-1
[mm] [mm] Pinhole Hole Rupture 0-100 100 0.072 0.087 0.080 0.239
125-250 187 0.051 0.061 0.056 0.168 300-400 350 0.026 0.031 0.029 0.086 450-550 500 0.014 0.017 0.015 0.046 600-700 650 0.008 0.009 0.008 0.025 750-850 800 0.004 0.005 0.005 0.014
900-1000 950 0.002 0.003 0.002 0.007 1000+ 1050 0.001 0.002 0.002 0.005
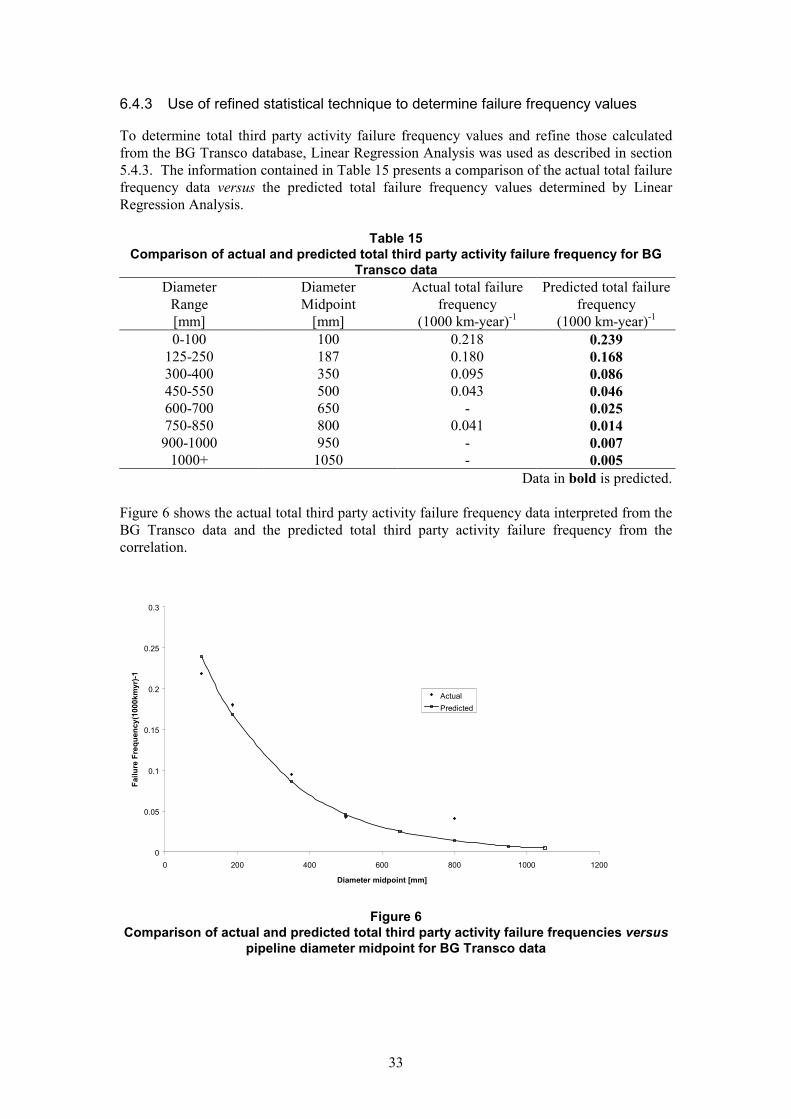
Figures 7, 8 and 9 shows the actual failure frequency data interpreted from the BG Transco data and predicted failure frequency values following application of the distribution factor for each classification of damage.
35
Figure 7
Comparison of actual and predicted total third party activity failure frequency data versus pipeline diameter midpoint for BG Transco data pinhole damage
Figure 8 Comparison of actual and predicted total third party activity failure frequency data
versus diameter midpoint for BG Transco data hole damage
0
0.01
0.02
0.03
0.04
0.05
0.06
0.07
0.08
0 200 400 600 800 1000 1200
Diameter midpoint [mm]
Failu
re F
requ
ency
(100
0km
yr)-1
ActualPredicted
0
0.01
0.02
0.03
0.04
0.05
0.06
0.07
0.08
0.09
0.1
0 200 400 600 800 1000 1200
Diameter midpoint [mm]
Failu
re F
requ
ency
(100
0km
yr)-1
ActualPredicted

36
Figure 9
Comparison of actual and predicted total third party activity failure frequency data versus diameter midpoint for BG Transco data for rupture damage
It should be noted that Figures 7, 8 and 9 show a comparatively poor fit of the BG Transco actual and predicted failure frequencies for pinhole, hole and rupture damage classifications, especially when compared with similar figures derived from EGIG data. An improved fit of the actual and predicted failure frequencies might have been derived but the analysis was limited by the data set available.
6.4.6 Comparison of predicted failure frequency values derived from EGIG and BG Transco data
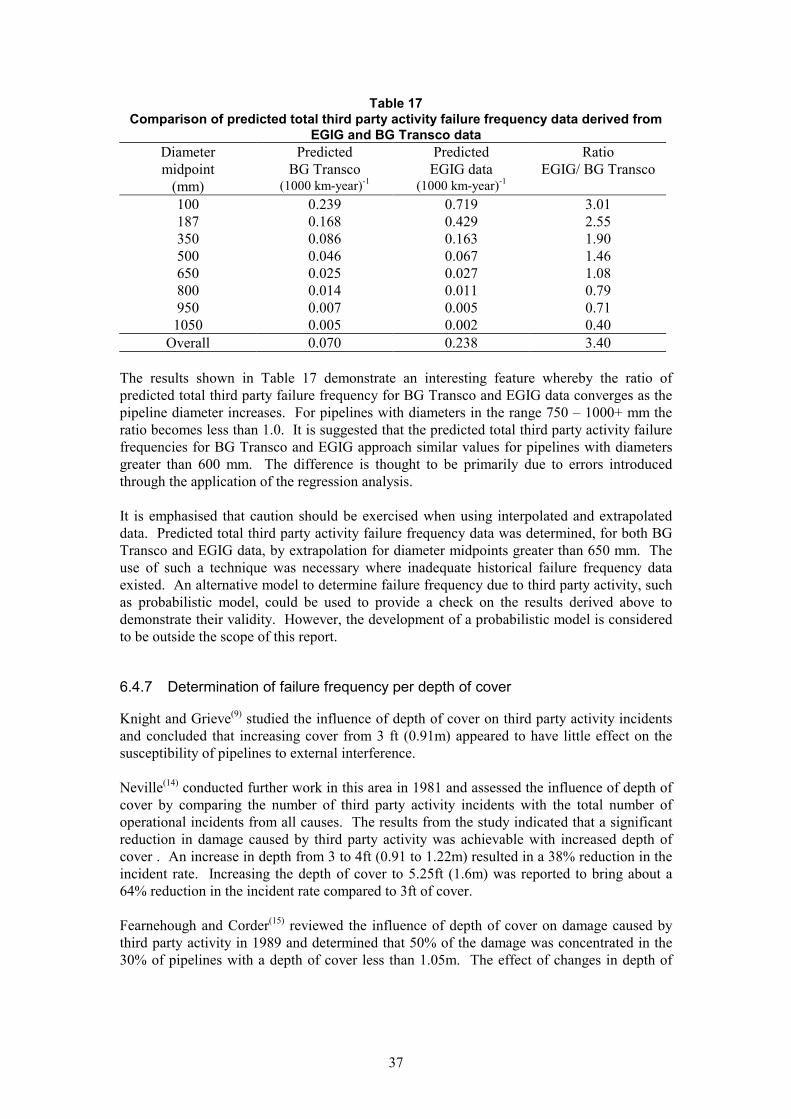
As described in section 6.4.1, a failure frequency factor, based on the overall EGIG failure frequency, had been determined. The application of the overall BG Transco failure frequency factor to the EGIG data was counselled against. The predicted failure frequency values derived from the EGIG report (see Table 5) and the BG Transco database (see Table 16) showed a marked difference. This was particularly the case for incidents resulting in pinhole, hole and rupture damage for pipeline diameters up to 550 mm. A comparison of the predicted total third party activity failure frequency values derived from EGIG and BG Transco data is presented in terms of a ratio in the table below.
0
0.01
0.02
0.03
0.04
0.05
0.06
0.07
0.08
0.09
0.1
0 200 400 600 800 1000 1200
Diameter midpoint [mm]
Failu
re F
requ
ency
(100
0km
yr)-1
ActualPredicted
37
Table 17 Comparison of predicted total third party activity failure frequency data derived from
EGIG and BG Transco data Diameter Predicted Predicted Ratio midpoint BG Transco EGIG data EGIG/ BG Transco
(mm) (1000 km-year)-1 (1000 km-year)-1 100 0.239 0.719 3.01 187 0.168 0.429 2.55 350 0.086 0.163 1.90 500 0.046 0.067 1.46 650 0.025 0.027 1.08 800 0.014 0.011 0.79 950 0.007 0.005 0.71 1050 0.005 0.002 0.40
Overall 0.070 0.238 3.40 The results shown in Table 17 demonstrate an interesting feature whereby the ratio of predicted total third party failure frequency for BG Transco and EGIG data converges as the pipeline diameter increases. For pipelines with diameters in the range 750 – 1000+ mm the ratio becomes less than 1.0. It is suggested that the predicted total third party activity failure frequencies for BG Transco and EGIG approach similar values for pipelines with diameters greater than 600 mm. The difference is thought to be primarily due to errors introduced through the application of the regression analysis. It is emphasised that caution should be exercised when using interpolated and extrapolated data. Predicted total third party activity failure frequency data was determined, for both BG Transco and EGIG data, by extrapolation for diameter midpoints greater than 650 mm. The use of such a technique was necessary where inadequate historical failure frequency data existed. An alternative model to determine failure frequency due to third party activity, such as probabilistic model, could be used to provide a check on the results derived above to demonstrate their validity. However, the development of a probabilistic model is considered to be outside the scope of this report.
6.4.7 Determination of failure frequency per depth of cover
Knight and Grieve(9) studied the influence of depth of cover on third party activity incidents and concluded that increasing cover from 3 ft (0.91m) appeared to have little effect on the susceptibility of pipelines to external interference. Neville(14) conducted further work in this area in 1981 and assessed the influence of depth of cover by comparing the number of third party activity incidents with the total number of operational incidents from all causes. The results from the study indicated that a significant reduction in damage caused by third party activity was achievable with increased depth of cover . An increase in depth from 3 to 4ft (0.91 to 1.22m) resulted in a 38% reduction in the incident rate. Increasing the depth of cover to 5.25ft (1.6m) was reported to bring about a 64% reduction in the incident rate compared to 3ft of cover. Fearnehough and Corder(15) reviewed the influence of depth of cover on damage caused by third party activity in 1989 and determined that 50% of the damage was concentrated in the 30% of pipelines with a depth of cover less than 1.05m. The effect of changes in depth of
38
cover was quantified and showed that increasing the depth of cover from 1.1 to 2m reduced the mechanical damage frequency by a factor of 6. To support the findings reported above and to demonstrate the influence of increasing depth of cover on the damage profile, it was assumed that only third party activity incidents were likely to be affected by depth of cover. Therefore, the variation in the proportion of number of failure incidents caused by third party activity and number of damage incidents caused by third party activity with depth of cover provided an indication of its influence. BG Transco’s interference fault database was interrogated to determine the number of damage incidents and the number of pipeline failures that had occurred at different pipeline depth of cover ranges. The total number of failure incidents was calculated by summation of the leak and fracture incidents for a particular depth of cover range. The depth of cover ranges studied were different to those used in the EGIG analysis. The main reason for this was that much of the BG Transco pipeline network was constructed prior to 1985, when the pipelines were buried at depths measured in Imperial units i.e. feet and inches. Therefore the ranges chosen for the purpose of this analysis corresponded to the depth of cover typically used at the time and recorded in the database. The probability that the extent of damage caused by third party activity would be so severe that gas would be released from the pipeline was calculated for each depth of cover range. The results are presented in Table 18.
Table 18 Influence of depth of cover on the damage probability
Depth of cover range
Number of damage incidents
Number of failure incidents
Damage probability
%
< 3ft < 0.91m 197 16 8.1 3 – 4 ft 0.91 – 1.22m 192 13 6.8
>4ft > 1.22m 163 3 1.8 Unknown - 12 - -
Thus, for a depth of cover less than 0.91m, the extent of damage would be so severe as to cause pipelines to fail in 8% of cases that third party activity conducted in the vicinity of the pipeline caused some degree of pipeline damage. Similarly, for a depth of cover greater than 1.22m a pipeline would be expected to fail in approximately 2% of cases that third party activity caused pipeline damage. The results presented in Table 18 clearly demonstrate the added benefits of burying pipelines deeper. The failure frequency per depth of cover was calculated and the results are presented in Table 19.
Table 19 Third party activity – failure frequency per depth of cover for BG Transco data
Depth of cover Operating Number of Total failure Experience failures Frequency
[m] [km-year] (1000 km-year)-1 < 0.91 90120 16 0.178
0.91-1.22 237437 13 0.055 > 1.22 79261 3 0.038
Unknown 50436 0 -
39
As can be seen from the results presented in Table 19, the total third party activity failure frequency decreases with increasing depth of cover. This follows the trend determined from EGIG data. A depth of cover failure frequency factor was determined and subsequently used in PIPIN to modify failure frequencies dependent on the depth of cover. The factors were determined on a similar basis as that used for EGIG data. A normalised depth of cover failure reduction factor was determined to compare the effect of depth of cover for pipelines buried at depths outside that normally required by installation codes.
Table 20 Depth of cover failure reduction factors
Depth of cover [m]
Depth of cover failure frequency factor
Normalised depth of cover failure frequency factor
< 0.91 2.54 3.3 0.91-1.22 0.78 1.0
> 1.22 0.54 0.7 The results presented in Table 20 are not directly comparable with the normalised depth of cover failure reduction factors determined from EGIG data because of the different depth of cover ranges used in the analysis. Therefore, depth of cover failure frequency factors derived from the BG Transco data should only be used to modify the BG Transco’s failure frequency data. The same rule should be applied to EGIG data. Pipelines tend to be buried with an increased depth of cover in locations where there is a perceived increased risk of damage caused by third party activity. The effect of depth of cover on the failure frequency due to damage caused by third party activity was examined for pipelines buried in rural, suburban and town locations. The results of this study are presented in Table 21.
Table 21 Effect of depth of cover on third party activity failure frequency for pipelines buried in
different locations Depth of cover Failure frequency
[m] (1000 km-year)-1 Rural Suburban Town
< 0.91 0.171 0.326 4.944 0.91-1.22 0.047 0.135 -
> 1.22 0.013 1.033 - The results tend to follow the trend previously determined, that is the failure frequency decreases with increasing depth of cover for a pipeline buried in a particular location. However, pipelines buried in suburban and town locations are seen to be at increased risk of failure arising from damage caused by third party activity compared to those buried in rural locations. This issue will be discussed further in section 6.4.7.
6.4.8 Determination of failure frequency per wall thickness class
The Institution of Gas Engineers makes minimum wall thickness recommendations for high pressure gas transmission pipelines in its publication IGE/TD/1(3). The BG Transco operational and fault databases were interrogated to determine the failure frequency caused
40
by third party activity for pipelines with wall thickness less than/or equal to and greater than those specified in IGE/TD/1. The results are presented in Table 22.
Table 22
Influence of wall thickness on failure frequency due to damage caused by third party activity
Diameter range Minimum wall thickness
Failure frequency (1000 km-year)-1
[mm] [mm] Wall thickness <= minimum
Wall thickness > minimum
<= 150 4.8 0.453 0.081 > 150 <= 450 6.4 0.218 0.059 > 450 <= 600 7.9 - - > 600 <= 900 9.5 - 0.011
> 900 <= 1050 11.9 - - > 1050 12.7 - -
Table 22 shows that where pipelines were constructed with a wall thickness greater than the minimum specified by IGE/TD/1 then the failure frequency due to damage caused by third party activity was lower than that for pipelines where the minimum wall thickness was used. Caution should be exercised when considering the use of wall thickness failure frequency values from the data presented in Table 22. For a specified diameter range, the use of increased thickness of wall for some pipelines was found to vary quite markedly. For example, pipelines within the diameter range > 150 <=450 mm had been laid with wall thickness’ up to 15.9 mm – greatly exceeding the minimum requirements of IGE/TD/1. Therefore, the BG Transco data was analysed further to determine how the failure frequency due to damage caused by third party activity varied with increasing wall thickness across a specified diameter range.
Table 23 Variation of failure frequency due to damage caused by third party activity with
increased wall thickness Diameter
range Minimum wall
thickness Failure frequency (1000 km-year)-1
[mm] [mm] Wall thickness range [mm] <=4.8 >4.8<=6.4 >6.4<=7.9 >7.9<=9.5 >9.5
<= 150 4.8 0.425 0.083 - - - > 150 <= 450 6.4 0.212 0.087 0.049 - > 450 <= 600 7.9 - - - > 600 <= 900 9.5 - 0.010 > 900<=1050 11.9 -
> 1050 12.7 - The results presented in Table 23 confirm the findings reported above, namely that the failure frequency due to damage caused by third party activity decreased with increasing wall thickness. Table 23 is relatively sparsely populated with failure frequency data, thus making the prediction and determination of normalised wall thickness failure reduction factors relatively difficult. For the diameter range <= 150 mm, the normalised wall thickness failure reduction factor was calculated by dividing the failure frequency determined for the wall thickness
41
range >4.8<=6.4 mm by the failure frequency determined for the wall thickness <=4.8mm. A simple technique was applied to determine missing normalised failure reduction factors based on the last available normalised failure reduction factor for each specified diameter range. Table 24 shows how the values of normalised wall thickness failure reduction factors would be estimated using this technique.
Table 24 Determination of normalised wall thickness failure reduction factors
Diameter range
Minimum wall thickness
Normalised wall thickness failure frequency factor (1000 km-years)-1
[mm] [mm] Wall thickness range [mm] <=4.8 >4.8<=6.4 >6.4<=7.9 >7.9<=9.5 >9.5
<= 150 4.8 1.0 0.2 0.2 0.2 0.2 > 150 <= 450 6.4 1.0 0.4 0.2 0.2 > 450 <= 600 7.9 1.0 0.2 0.2 > 600 <= 900 9.5 1.0 0.2 > 900<=1050 11.9 1.0
> 1050 12.7 1.0 For the diameter range > 450 <= 600 mm, for which no failure frequency data was available, the normalised wall thickness failure frequency factor was assigned the same value as that attributed to the wall thickness range (i.e. 7.9<=9.5 mm) reported for pipelines >150 <= 450 mm. The normalised wall thickness failure reduction factors will be used in the PIPIN model to modify failure frequencies dependent on the pipeline wall thickness.
6.4.9 Determination of pipeline location failure frequency
The BG Transco database was interrogated to determine the number of incidents and the extent of damage that had occurred in rural, suburban and town areas. The results are presented in Table 25.
Table 25 Classification of the extent of damage caused by third party activity
Location Extent of damage Unknown Coating Slight
damage Severe damage
Loss -leak
Loss – fracture
Total
Rural 2 41 236 53 13 9 354 Suburban 1 20 122 27 8 1 179
Town 0 5 10 1 1 0 17 Unknown 0 4 10 0 0 0 14 As can be seen from the data presented in Table 25, the majority of the recorded incidents occurred in rural areas. This finding was not unexpected since over 80 % of the pipeline network was located in rural areas. The location failure frequency was calculated for pipelines buried in rural, suburban and town areas by dividing the number of failures occurring in a particular area by the operating experience. The location failure frequency factor was determined by dividing the failure frequency for a particular location by the overall frequency for damage caused by third party

42
activity derived from BG Transco data. Normalised location failure frequency factors were then determined on the basis of pipelines buried in rural areas since this is where the majority of gas transmission pipelines in the UK are buried.
Table 26
Third party activity – determination of pipeline location failure frequency factors for BG Transco data
Location Pipeline length [km]
Operating experience [km-year]
Number of failure incidents
Failure frequency
(1000 km-year)-1
Location failure
frequency factor
Normalised location failure
frequency factor
Rural 16156 386398 22 0.057 0.81 1.0 Suburban 1580 40664 9 0.221 3.16 3.9
Town 34 761 1 1.314 18.77 23.1 Unknown 1338 29431 0 - - - The results presented in Table 26 show that the failure frequency of pipelines due to third party activity in suburban areas was about 4 times that in rural areas. This finding agreed with that of Fearnehough and Corder.(15) The location failure frequency factors will be used in the PIPIN model to modify failure frequencies depending on the proposed pipeline location. It is known that the location failure frequency factor and other factors determined for depth of cover and wall thickness are interrelated. Care has therefore to be taken to ensure that the factors have not cancelled each other out when applied within the PIPIN model.
6.4.10 Determination of effectiveness of pipeline damage prevention measures
The literature search identified one reference in which the author reported on the effectiveness of measures used to prevent damage to pipelines caused by third party activity. Corder(1) reported that British Gas (now known as BG Transco) had undertaken a field trial to study the effectiveness of a range of protective measures in preventing damage to buried pipelines arising from the use of heavy excavating machinery. The approach used was to bury protected sections of pipe and ask Contractors who were not informed of the presence of the pipeline to excavate trenches across them to a greater depth than the pipeline cover. A total of 53 excavation tests were carried out to study the effectiveness of the following pipeline damage prevention measures in preventing damage to buried pipelines:- • a combination of 3m wide concrete slab with warning tape (15 tests); • a combination of 3m wide steel plate with warning tape (15 tests); • an unmarked reinforced concrete slab (16 tests); • warning tape only (5 tests); and • no protective measures.
The results are summarised in Table 27.
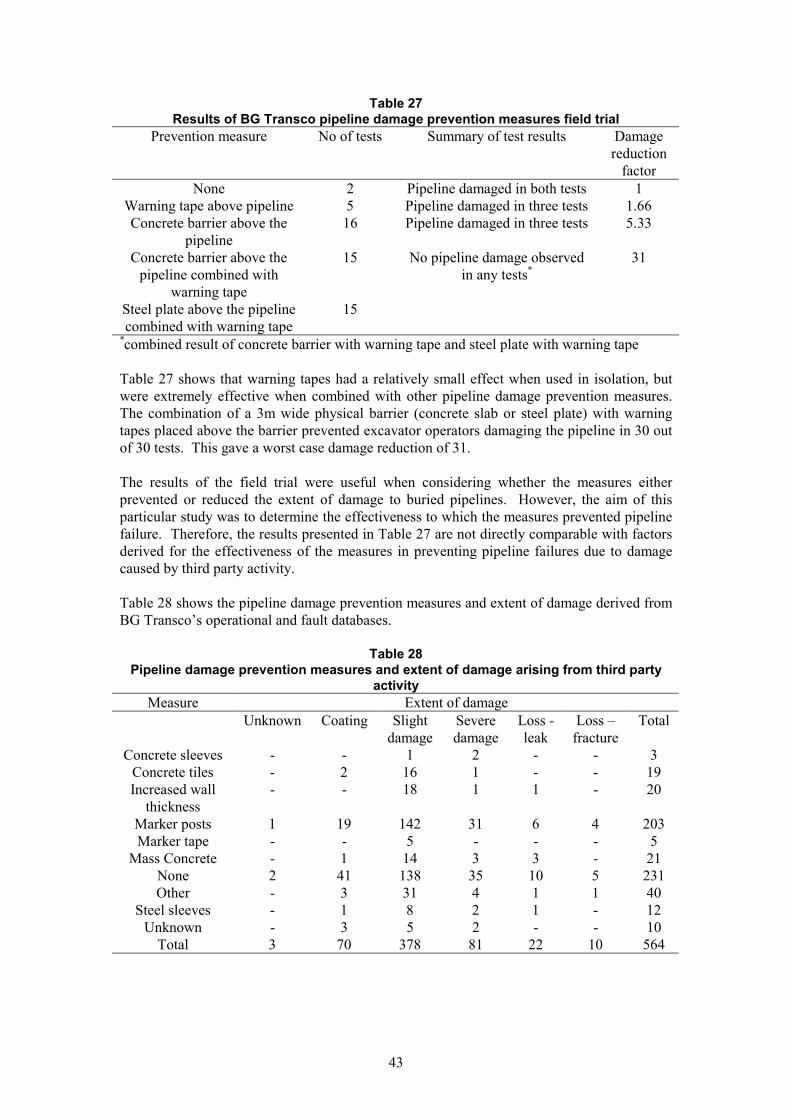
43
Table 27 Results of BG Transco pipeline damage prevention measures field trial
Prevention measure No of tests Summary of test results Damage reduction
factor None 2 Pipeline damaged in both tests 1
Warning tape above pipeline 5 Pipeline damaged in three tests 1.66 Concrete barrier above the
pipeline 16 Pipeline damaged in three tests 5.33
Concrete barrier above the pipeline combined with
warning tape
15 No pipeline damage observed in any tests*
31
Steel plate above the pipeline combined with warning tape
15
*combined result of concrete barrier with warning tape and steel plate with warning tape Table 27 shows that warning tapes had a relatively small effect when used in isolation, but were extremely effective when combined with other pipeline damage prevention measures. The combination of a 3m wide physical barrier (concrete slab or steel plate) with warning tapes placed above the barrier prevented excavator operators damaging the pipeline in 30 out of 30 tests. This gave a worst case damage reduction of 31. The results of the field trial were useful when considering whether the measures either prevented or reduced the extent of damage to buried pipelines. However, the aim of this particular study was to determine the effectiveness to which the measures prevented pipeline failure. Therefore, the results presented in Table 27 are not directly comparable with factors derived for the effectiveness of the measures in preventing pipeline failures due to damage caused by third party activity. Table 28 shows the pipeline damage prevention measures and extent of damage derived from BG Transco’s operational and fault databases.
Table 28 Pipeline damage prevention measures and extent of damage arising from third party
activity Measure Extent of damage
Unknown Coating Slight damage
Severe damage
Loss -leak
Loss – fracture
Total
Concrete sleeves - - 1 2 - - 3 Concrete tiles - 2 16 1 - - 19 Increased wall
thickness - - 18 1 1 - 20
Marker posts 1 19 142 31 6 4 203 Marker tape - - 5 - - - 5
Mass Concrete - 1 14 3 3 - 21 None 2 41 138 35 10 5 231 Other - 3 31 4 1 1 40
Steel sleeves - 1 8 2 1 - 12 Unknown - 3 5 2 - - 10
Total 3 70 378 81 22 10 564
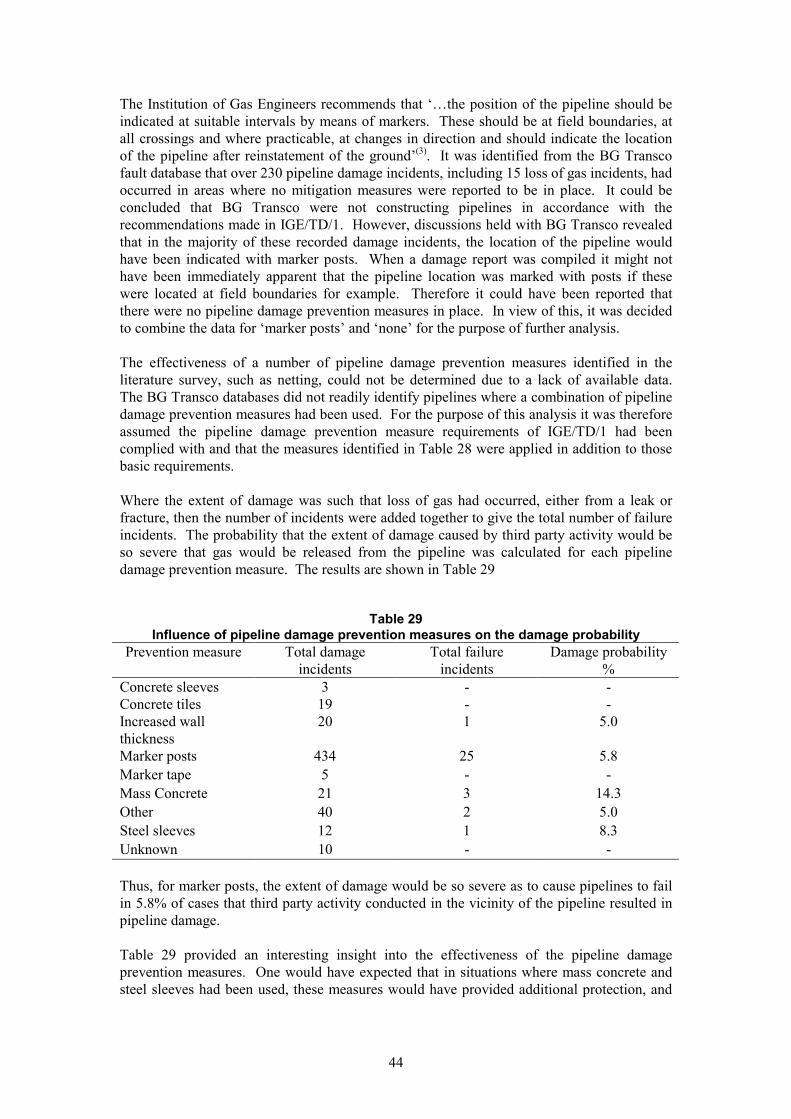
44
The Institution of Gas Engineers recommends that ‘…the position of the pipeline should be indicated at suitable intervals by means of markers. These should be at field boundaries, at all crossings and where practicable, at changes in direction and should indicate the location of the pipeline after reinstatement of the ground’(3). It was identified from the BG Transco fault database that over 230 pipeline damage incidents, including 15 loss of gas incidents, had occurred in areas where no mitigation measures were reported to be in place. It could be concluded that BG Transco were not constructing pipelines in accordance with the recommendations made in IGE/TD/1. However, discussions held with BG Transco revealed that in the majority of these recorded damage incidents, the location of the pipeline would have been indicated with marker posts. When a damage report was compiled it might not have been immediately apparent that the pipeline location was marked with posts if these were located at field boundaries for example. Therefore it could have been reported that there were no pipeline damage prevention measures in place. In view of this, it was decided to combine the data for ‘marker posts’ and ‘none’ for the purpose of further analysis. The effectiveness of a number of pipeline damage prevention measures identified in the literature survey, such as netting, could not be determined due to a lack of available data. The BG Transco databases did not readily identify pipelines where a combination of pipeline damage prevention measures had been used. For the purpose of this analysis it was therefore assumed the pipeline damage prevention measure requirements of IGE/TD/1 had been complied with and that the measures identified in Table 28 were applied in addition to those basic requirements. Where the extent of damage was such that loss of gas had occurred, either from a leak or fracture, then the number of incidents were added together to give the total number of failure incidents. The probability that the extent of damage caused by third party activity would be so severe that gas would be released from the pipeline was calculated for each pipeline damage prevention measure. The results are shown in Table 29
Table 29
Influence of pipeline damage prevention measures on the damage probability Prevention measure Total damage
incidents Total failure
incidents Damage probability
%
Concrete sleeves 3 - - Concrete tiles 19 - - Increased wall thickness
20 1 5.0
Marker posts 434 25 5.8 Marker tape 5 - - Mass Concrete 21 3 14.3 Other 40 2 5.0 Steel sleeves 12 1 8.3 Unknown 10 - - Thus, for marker posts, the extent of damage would be so severe as to cause pipelines to fail in 5.8% of cases that third party activity conducted in the vicinity of the pipeline resulted in pipeline damage. Table 29 provided an interesting insight into the effectiveness of the pipeline damage prevention measures. One would have expected that in situations where mass concrete and steel sleeves had been used, these measures would have provided additional protection, and

45
hence a smaller damage probability, compared with pipelines where marker posts were used. This was not the case and was thought to be due to the location in which the pipelines had been buried, since such pipeline damage prevention measures would generally be used for pipelines that were perceived to be at increased risk from third party activity e.g. at road crossings in areas of high population densities. The failure frequency per pipeline damage prevention measure was calculated and the results are presented in Table 30.
Table 30 Third party activity – failure frequency per pipeline damage prevention measure for BG
Transco data Prevention measure Operating
Experience Number of failures Failure frequency
[km-year] (1000 km-year)-1 Concrete sleeves 998 - - Concrete tiles 6067 - - Increased wall Thickness
5297 1 0.189
Marker posts 347525 25 0.072 Marker tape 17371 - - Mass Concrete 2014 3 1.490 Other 8502 2 0.235 Steel sleeves 7707 1 0.130 Unknown 61773 - - The effect of increased wall thickness on third party activity failure frequency was examined in some detail in section 6.4.7 and was therefore not considered further for the purpose of this study. The results presented in Table 30 proved inconclusive. It was expected that the use of pipeline damage prevention measures to counteract the damage caused by third party activity would have produced lower failure frequency values than those determined for marker posts alone. To attempt to determine pipeline damage prevention measure failure reduction factors from the failure frequency data presented in Table 30 would only serve to demonstrate that the use of such measures would have resulted in an increased likelihood that the pipeline would fail due to the damage caused by third party activity. Clearly this is at odds with the concept of their use as pipeline damage prevention measures which is intended to reduce the failure frequency due to damage caused by third party activity. However, pipeline damage prevention measures would only be used in high-risk areas, thus explaining the apparent increase in failure frequency. For the purpose of this study, a summation of the operating years experience and pipeline failures was made for pipeline damage prevention measures other than marker posts. The results are presented in Table 31.

46
Table 31 Determination of pipeline damage prevention measure failure reduction factors for BG
Transco data Prevention measure
Operating Experience
[km-year]
Number of failures
Failure frequency
(1000 km-year)-1
Prevention measure failure reduction factor
Normalised prevention
measure failure reduction factor
All other measures
109729 7 0.064 0.91 0.9
Marker posts 347525 25 0.072 1.03 1.0 The prevention measure failure reduction factor was determined by dividing the failure frequency factor for a particular prevention measure by the overall failure frequency for damage caused by third party activity. Table 31 also shows the normalised prevention measure failure reduction factor for all other measures compared with marker posts. The factor produced shows the modest beneficial effects of using pipeline damage prevention measures, especially when compared with the results of studies undertaken by Corder(1). Where a particular measure such as concrete sleeves, concrete tiles, marker tape, mass concrete, steel sleeves or others were to be used to mitigate against the damage caused by third party activity, then the failure reduction factor to be applied would be that determined for ‘all other measures’. The prevention measure failure reduction factors will be used in PIPIN to modify failure frequencies depending on the pipeline damage prevention measures applied.
6.5 ANALYSIS OF THE THIRD PARTY ACTIVITIES CAUSING PIPELINE FAILURE
Stoves and Couchman(16) reported that approximately 33% of all pipeline faults were caused by third party activity and that the worst external interference hazard resulting in a loss of gas was due to the use of earth moving equipment. BG Transco’s interference fault database recorded details of:- • the type of machinery causing damage to pipelines; • the type of third party activity being undertaken; and • the method of detection.
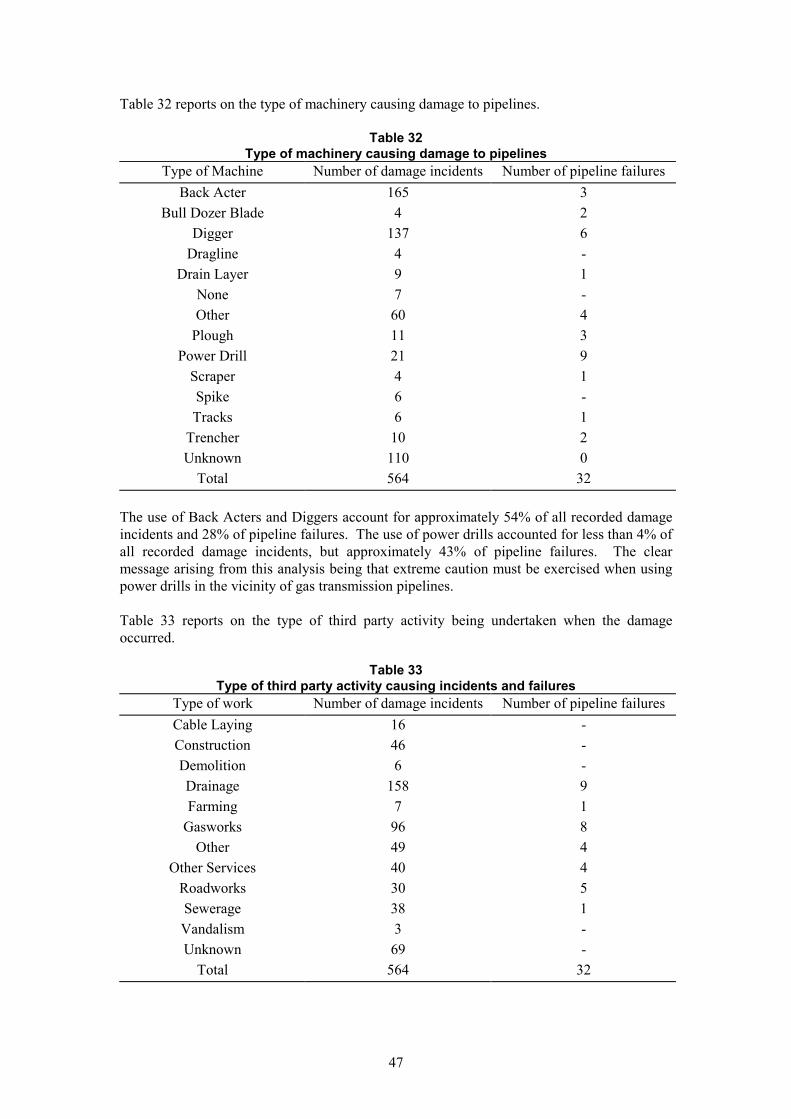
47
Table 32 reports on the type of machinery causing damage to pipelines.
Table 32 Type of machinery causing damage to pipelines
Type of Machine Number of damage incidents Number of pipeline failures Back Acter 165 3
Bull Dozer Blade 4 2 Digger 137 6
Dragline 4 - Drain Layer 9 1
None 7 - Other 60 4
Plough 11 3 Power Drill 21 9
Scraper 4 1 Spike 6 - Tracks 6 1
Trencher 10 2 Unknown 110 0
Total 564 32 The use of Back Acters and Diggers account for approximately 54% of all recorded damage incidents and 28% of pipeline failures. The use of power drills accounted for less than 4% of all recorded damage incidents, but approximately 43% of pipeline failures. The clear message arising from this analysis being that extreme caution must be exercised when using power drills in the vicinity of gas transmission pipelines. Table 33 reports on the type of third party activity being undertaken when the damage occurred.
Table 33
Type of third party activity causing incidents and failures Type of work Number of damage incidents Number of pipeline failures Cable Laying 16 - Construction 46 - Demolition 6 - Drainage 158 9 Farming 7 1
Gasworks 96 8 Other 49 4
Other Services 40 4 Roadworks 30 5 Sewerage 38 1 Vandalism 3 - Unknown 69 -
Total 564 32

48
Most of the damage incidents occurred during drainage or gas works activities. Drainage activities accounted for 28% of damage incidents and 28% of pipeline failures. Whereas, gas works activities accounted for 17% of damage incidents and 25% of pipeline failures. Third party activity conducted in relation to the provision of ‘other services’ and roadworks accounted for approximately 7% and 5% respectively of all reported damage incidents and yet resulted in approximately 13% and 16% respectively of pipeline failures. A large proportion of the activities undertaken by third parties were reported to BG Transco in advance of them taking place. However, a proportion remained unreported. BG Transco were aware of 46% of third party activities that resulted in pipeline damage and 44% of activities that resulted in pipeline failure. The third party undertaking the activity was aware of the presence of the pipeline in 28 out of the 32 incidents where the damage was so severe that the pipeline was caused to fail. Surveillance programmes are undertaken by BG Transco, the main aims of which are to minimise the damage caused by third party activity. Aerial and/or ground surveys are used to identify activities being conducted in the vicinity of the pipeline in order that action may be taken to avoid pipeline damage. Additional measures involve the use of liaison schemes to promote awareness of planned activities. Aerial and ground patrol surveys have been in operation for more than 30 years. Current surveillance procedures applied to BG Transco’s transmission system conform to those prescribed by The Institution of Gas Engineers(3) and include a two week aerial survey or vantage point survey of all pipelines. In addition to the fortnightly surveys, a full line walk of all pipeline routes continues to be undertaken every two to four years. Liaison with the landowner through which the pipelines run takes place every six to twelve months. Table 34 shows the method of discovery of pipeline damage arising from third party activity.
Table 34 Method of discovery of pipeline damage arising from third party activity
Discovery method Number of damage incidents Number of pipeline failures Air Patrol 29 -
Ground Patrol 138 - Other 130 8 Police 2 2 Public 14 3
Site Contractor 150 16 On Line Inspection 13 -
Pearson Survey 63 - Unknown 25 3
Total 564 32 On Line Inspection is a technique used to inspect the condition of a pipeline whilst in service and is capable of measuring and recording the position, nature and severity of suspected defects in the wall coating of the pipeline. Pearson Survey is a method of testing the integrity of the protective coating of a buried pipeline by ground surface survey.
49
Site contractors reported approximately 27% of the identified pipeline damage incidents and 50% of pipeline failures. Air and ground patrols identified approximately 30% of the identified pipeline damage incidents. Whilst the information contained in Table 34 was of interest, it did not permit the effectiveness of the surveillance techniques used by BG Transco to be evaluated since the total number of third party encroachment incidents over the reporting period, including those where no damage occurred, was not known. Corder and Archer(5) made the following observations in their studies on the effectiveness of helicopter surveillance:- • the helicopter gave the first sighting of activity in 30 – 60% of incidents; and • a considerable number of activities were missed because of their short duration. Between
60% and 90% of the total encroachment activities lasted less than 2 weeks. Due to the lack of available data, it was not possible to assess the effectiveness of the various surveillance techniques in their role of damage prevention. BG Transco are conducting studies in this area with a view to refining the current surveillance regime.(17)
6.6 LIMITATIONS OF BG TRANSCO DATA Despite the comprehensive nature of BG Transco’s database, there have been relatively few reported loss of gas incidents, which caused some difficulty in determining failure frequencies and factors. In the absence of such data, statistical techniques, identical to that used to analyse EGIG data, were applied. In both the operational and interference fault databases a number default values were entered or ‘unknown’ was stated in datafields. Where this was the case, a degree of judgement had to be applied to interpret the data.
50
7. DEVELOPMENT OF THIRD PARTY ACTIVITY FAILURE MODEL
7.1 EXISTING FAILURE MODEL Fewtrell(11) developed a third party activity failure model based on data published by EGIG. A computer based program called PIPIN was developed and enabled pipeline failure frequencies based on pipe diameter, damage classification and depth of cover to be determined. The EGIG data was used to demonstrate that the deeper a pipeline was buried, the less likely it was to be affected by third party activity. To account for this, a depth of cover modifying factor was derived and included as part of an ‘AND’ gate in the fault tree. The pipeline failure model developed by Fewtrell(11) for third party activity is shown in Figure 10 below.
7.2 REFINEMENT OF FAILURE MODEL FOR THIRD PARTY ACTIVITY
The aim of this study was to develop an improved model for predicting pipeline failure frequencies arising from third party activity. In developing the refined model for third party activity the following actions were undertaken:- • an opportunity was taken to review and update the EGIG data analysis based upon the
report issued in 1997; • techniques were developed for estimating values for ‘missing’ data points and smoothing
the actual data points to remove inconsistencies; • the BG Transco data was used to determine pipeline failure frequencies based on pipe
diameter and damage classification; and • the BG Transco data was analysed to determine factors for depth of cover, pipeline wall
thickness, pipeline location and the effectiveness of pipeline damage prevention measures.
These points were addressed in previous sections of the report and have been brought together to produce a refined failure model for third party activity. The refined pipeline failure model is presented in Figure 11 and will be used to develop the PIPIN code. Sample calculations, which demonstrate the use of the failure model are presented in Appendix C.

51
Figure 10
Existing pipeline failure model
52
Figure 11 - Third Party Activity Failure Mechanism
Location failurereduction factor
P10
Pin hole damage
P1
Hole damage
P2
Rupture damage
P3
EGIG third partyactivity failurefrequency perdiameter class
Mitigation failurereduction factor
P11
Third Party ActivityFailure Mechanism
Combine Pipeline FailureMechanism
Total third partyactivity failurefrequency perdiameter class
Overall third partyactivity failure
frequency factor
Apply EGIG factorto EGIG failure
frequencies
P7
Apply BGTranscofactor to
BGTransco failurefrequencies
P8
Depth of coverfailure reduction
factorPin hole damage
P4
Hole damage
P5
Rupture damage
P6
BGTransco thirdparty activity failure
frequency perdiameter class P=1
Reduction factors
Wall thicknessfailure reduction
factor
P9

53
Priority "OR" gate
"AND" gate
Primary or basicevent
Output exists if all input events occur simultaneously
Output exists if either input event exists but not both
Primary failure event
H1House event, either working (probability = 1) or not working(probability = 0). Used to turn sections of a fault tree on/off.
Legend for Figure 11

54
7.3 REFINEMENT OF FAILURE FREQUENCY DATA PRODUCED BY PIPIN TO MAKE IT COMPATIBLE FOR USE WITH MISHAP
HSE requested that in order for the data calculated by PIPIN to be compatible with its MISHAP computer programme, then the damage classification in terms of Pinhole, Hole and Rupture would need to be refined. The MISHAP programme requires failure frequency data to be based on the following leak sizes: • a diameter of defect less than or equal to 25mm; • a diameter of defect equivalent to 40mm; • a diameter of defect equivalent to 110mm; and • a diameter of defect greater than the diameter of the pipeline. Currently HSE uses the following rules: • a diameter of defect less than or equal to 25mm was assigned the same failure frequency
values derived for Pinhole; • a diameter of defect equivalent to 40mm was assigned 50% of the failure frequency
values derived for hole; • a diameter of defect equivalent to 110mm was assigned 50% of the failure frequency
values derived for hole; and • a diameter of defect greater than the diameter of the pipeline was assigned the same
failure frequency values derived for Rupture. Additional work is to be undertaken in this area to determine whether this is a valid technique and the findings will be incorporated into the final version of PIPIN to derive the four leak sizes required by HSE’s MISHAP programme.

55
8. RECOMMENDATIONS
1. It is only through further co-operation with European gas pipeline operators and industry groups that the detailed information necessary to develop the PIPIN model will be obtained. Pipeline operators were approached to provide incident data, but declined to do so for the purpose of this report. Armed with the findings of this report, it is recommended that the pipeline operators be approached again to obtain their incident data to corroborate the work conducted in this study.
2. The development of a probabilistic model should be considered for the population of
pipelines where inadequate historical failure frequency data exists. The data so derived should then be compared with that derived through regression analysis of the historical data.
3. The use of American data supported the failure rates due to damage caused by third
party activity determined for UK and European pipeline operators. This indicates that similar engineering standards and operating conditions are being used in these countries and as such confirm that these sources of data offer an alternative source of pipeline data for further development of failure rate data for the PIPIN fault tree model. However, one should be aware of the different basis used by the Americans when registering pipeline accidents.
4. Sources of data identified in America enabled a comparison with UK and European
failure rates at the top level failure mode for third party activity to be determined. However, no data was available which would enable factors for depth of cover, pipeline location and effectiveness of pipeline damage prevention measures to be determined. The indication from the US DOT is that access to even more detailed information than is currently contained in their databases is available for individual incidents under the Freedom of Information Act. This could provide detailed data on the location of incidents with respect to factors that are believed to influence failure rates. The feasibility of extracting more detailed information from the US DOT should be further investigated.
5. Ageing and corrosion possibly has an effect on the extent of damage caused by third
party activity. Whilst these factors will not effect the frequency of third party activity, they could effect the extent of damage and therefore the likelihood of pipeline failure. This phenomena has not been studied to date and might prove a suitable topic for further research work.
6. This study identified occasions where pipelines were caused to fail due to the
activities undertaken by third parties despite the fact that they were aware of the presence of the pipeline. It is recommended that a review of the procedures undertaken by third parties be undertaken with a view to establishing best practice and advice for third parties. Additionally, this study also identified occasions when the pipeline operating company was aware of the activities being undertaken by third parties and yet pipeline failures occurred. Again it is recommended that a review of the procedures implemented by the pipeline operator be undertaken and incorporated into the best practice guide.
56
9. REFERENCES
1. CORDER I, BRITISH GAS The application of risk techniques to the design and operation of pipelines C502/016©IMechE 1995 2. ROSE M
Pipelines protective measures field trials- final report BG Transco R5400
3. INSTITUTION OF GAS ENGINEERS
Recommendations on transmission and distribution practice, Steel Pipelines for High pressure Gas Transmission IGE/TD/1 Edition 3:1993
4. SLJVIC S
Pipeline safety management and the prevention of third party interference Pipes and Pipelines International, Nov Dec 1995, Vol 40, No 6 pp14-16
5. CORDER I ARCHER GL
A Preliminary study of Helicopter surveillance BG Transco R2154
6. MCKEOWN M
Potential of Recent advances in satellite aerial technology for transmission pipeline planning and surveillance BG Transco R5452
7. LOTHON A, AKEL S Techniques for preventing accidental damage to pipelines Proceedings of the International Pipeline Conference, IPC,1996, Vol 2,pp643-650 8. FISHER A Pipeline Safety from a UK Legal perspective Pipes & Pipelines International Jan/Feb, Vol. 42, No. 1, 13-26 9. GRIEVE B, KNIGHT RCA
Influence of depth of cover on incidents on high pressure gas transmission pipelines. BG Transco R0637
10. EUROPEAN GAS PIPELINE INCIDENT DATA GROUP 3rd EGIG- report 1970-1997 EGIG 98.R.0120 December 1998
11. FEWTRELL P, SIDDIQUE A and MATHER J
Pipeline Failure Model WS Atkins report number AM5099/430/R8000/WP1.00

57
12. DEVORE JL Probability and statistics for engineering and the sciences – 3rd edition Brookes/Cole Publishing Company, 1991
13. MATHER J, WHITEHEAD R, FLOWER C, MILLS C Comparison of European data on pipeline failure with other world-wide data WS Atkins report number AM5227 14. NEVILLE D
Hazards analysis of the transmission system part 4 influence of depth of cover on the external interference
BG Transco R2308 15. FEARNEHOUGH GD AND CORDER I
The effect of pipeline depth of cover on mechanical interference BG Transco R.4132
16. COUCHMAN P, STONE D
Pipeline Surveillance Model BG Transco R3618
17. FINNIGAN N
Proposed Methodology to determine optimum surveillance intervals BG Transco R5347

58
10. APPENDICES
59
Appendix A
Summary of Literature Search Articles Ref.
No.
Title Author/s Journal Summary
1 The application of risk techniques
to the design and operation of
pipelines
I Corder C502/016©IMechE 1995 Risks presented by Gas Pipelines and an
explanation to British Gas design and
maintenance procedures. Increased depth of
cover, the use of protective measures and
surveillance are 3 pipeline damage
prevention measures used to reduce the risk
of external interference. A number of pipes
were buried with different forms of
protective covering.
2 Fitness for Purpose Revalidation
of Pipelines
C J Argent, J C
Braithwaite and
W P Jones
IGE 56th Autumn meeting, 27-28 November
1990, London (IGE COMM 1438)
Pipeline testing to ensure fitness for
purpose. Measures are taken by British Gas
operations to reduce risk from helicopters or
vantage point surveys complemented by
extensive landowner and contractor liaison.
It states that external force is rarely
responsible for complete failure. It goes on
to describe revalidation methods such as
hydrostatic testing, magnetic flux pig (on

60
Ref.
No.
Title Author/s Journal Summary
line testing) external inspections (above
ground)
3 Pipeline Monitoring and
Inspection
P Hopkins IEA International Conference on Natural
Gas Technologies 31 October -3
November1993, Kyoto, Japan
The paper describes the need for monitoring
and pipeline inspection. In western Europe
the greatest cause of damage is by third
party interference. This paper says third
party damage may cause major ruptures
with severe consequences.
4 Pipeline accident, failure
probability determined from
historical data
E J Farmer and
D J Hovey
Oil & Gas Journal, 1993, Vol. 91, No. 28,
pp104 –107
The major conclusions of analysis of
statistics complied by US Department of
Transportation (1982-1991) liquid
pipelines. US regulations require reporting
to DOT of all accidents that involve
• explosion or fire
• loss of 50bbl or more of liquid
• death of any person
• estimated property damage exceeding
$5000
The report shows statistic as failure rates
for different lengths of pipeline and
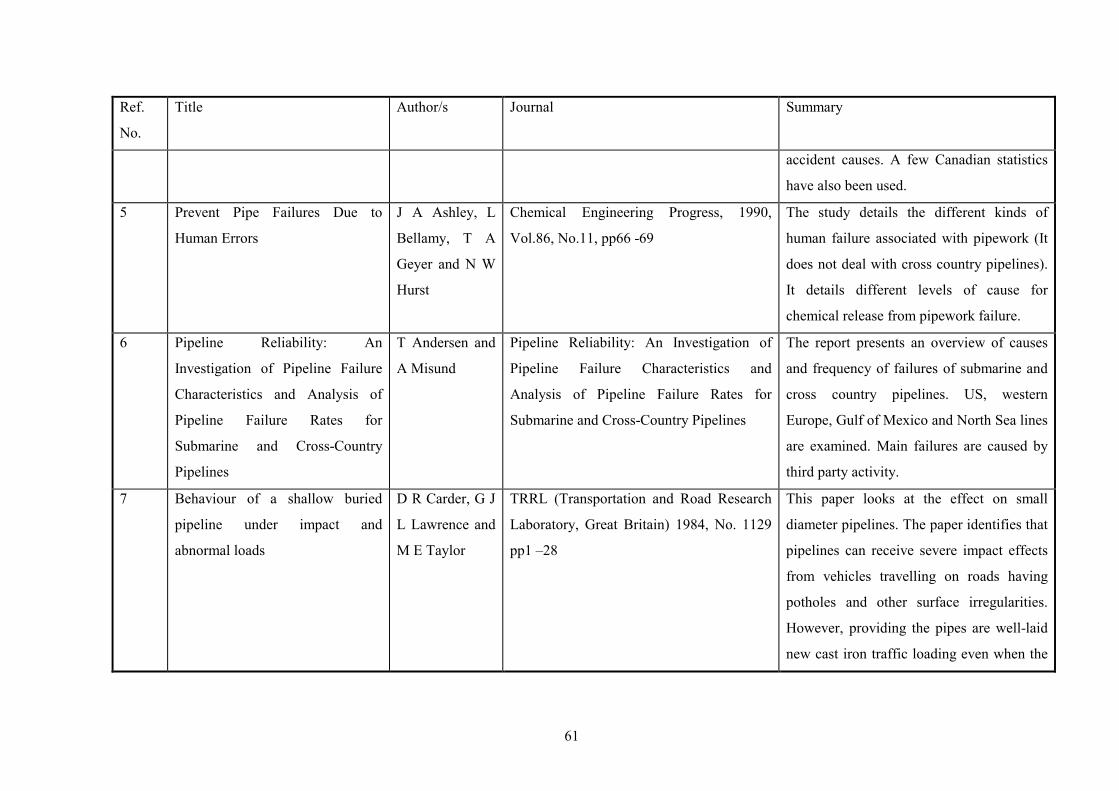
61
Ref.
No.
Title Author/s Journal Summary
accident causes. A few Canadian statistics
have also been used.
5 Prevent Pipe Failures Due to
Human Errors
J A Ashley, L
Bellamy, T A
Geyer and N W
Hurst
Chemical Engineering Progress, 1990,
Vol.86, No.11, pp66 -69
The study details the different kinds of
human failure associated with pipework (It
does not deal with cross country pipelines).
It details different levels of cause for
chemical release from pipework failure.
6 Pipeline Reliability: An
Investigation of Pipeline Failure
Characteristics and Analysis of
Pipeline Failure Rates for
Submarine and Cross-Country
Pipelines
T Andersen and
A Misund
Pipeline Reliability: An Investigation of
Pipeline Failure Characteristics and
Analysis of Pipeline Failure Rates for
Submarine and Cross-Country Pipelines
The report presents an overview of causes
and frequency of failures of submarine and
cross country pipelines. US, western
Europe, Gulf of Mexico and North Sea lines
are examined. Main failures are caused by
third party activity.
7 Behaviour of a shallow buried
pipeline under impact and
abnormal loads
D R Carder, G J
L Lawrence and
M E Taylor
TRRL (Transportation and Road Research
Laboratory, Great Britain) 1984, No. 1129
pp1 –28
This paper looks at the effect on small
diameter pipelines. The paper identifies that
pipelines can receive severe impact effects
from vehicles travelling on roads having
potholes and other surface irregularities.
However, providing the pipes are well-laid
new cast iron traffic loading even when the
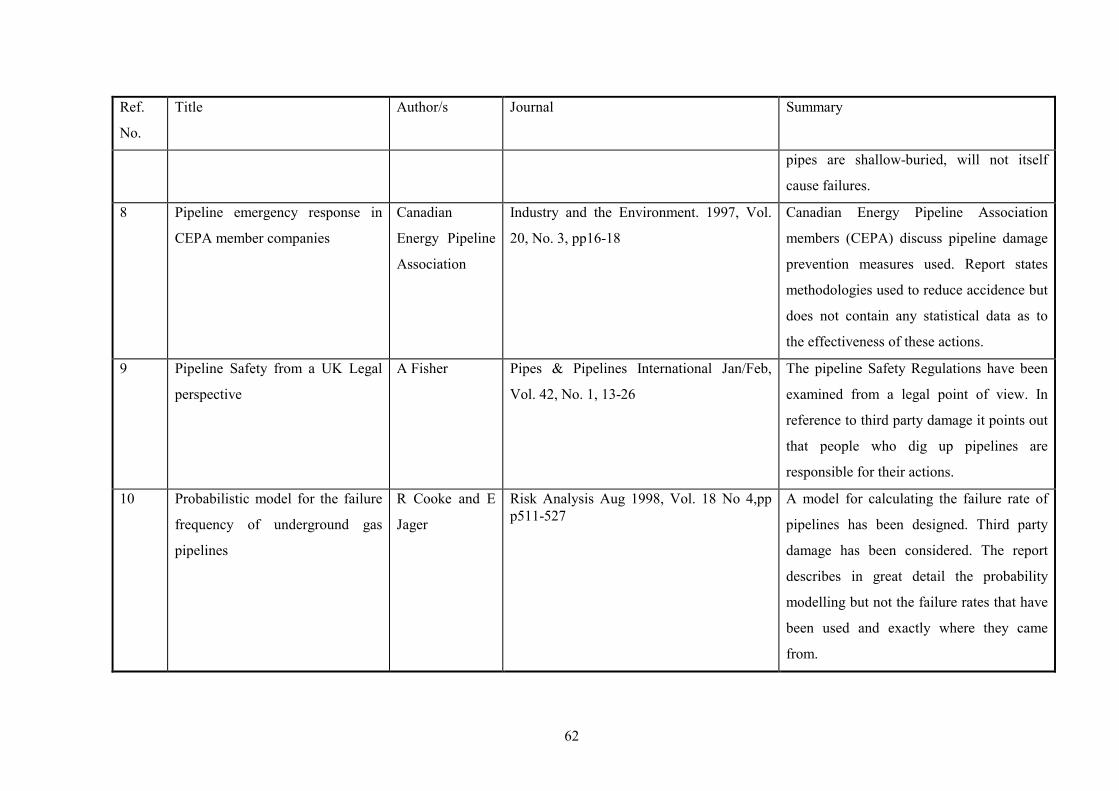
62
Ref.
No.
Title Author/s Journal Summary
pipes are shallow-buried, will not itself
cause failures.
8 Pipeline emergency response in
CEPA member companies
Canadian
Energy Pipeline
Association
Industry and the Environment. 1997, Vol.
20, No. 3, pp16-18
Canadian Energy Pipeline Association
members (CEPA) discuss pipeline damage
prevention measures used. Report states
methodologies used to reduce accidence but
does not contain any statistical data as to
the effectiveness of these actions.
9 Pipeline Safety from a UK Legal
perspective
A Fisher Pipes & Pipelines International Jan/Feb,
Vol. 42, No. 1, 13-26
The pipeline Safety Regulations have been
examined from a legal point of view. In
reference to third party damage it points out
that people who dig up pipelines are
responsible for their actions.
10 Probabilistic model for the failure
frequency of underground gas
pipelines
R Cooke and E
Jager
Risk Analysis Aug 1998, Vol. 18 No 4,pp p511-527
A model for calculating the failure rate of
pipelines has been designed. Third party
damage has been considered. The report
describes in great detail the probability
modelling but not the failure rates that have
been used and exactly where they came
from.
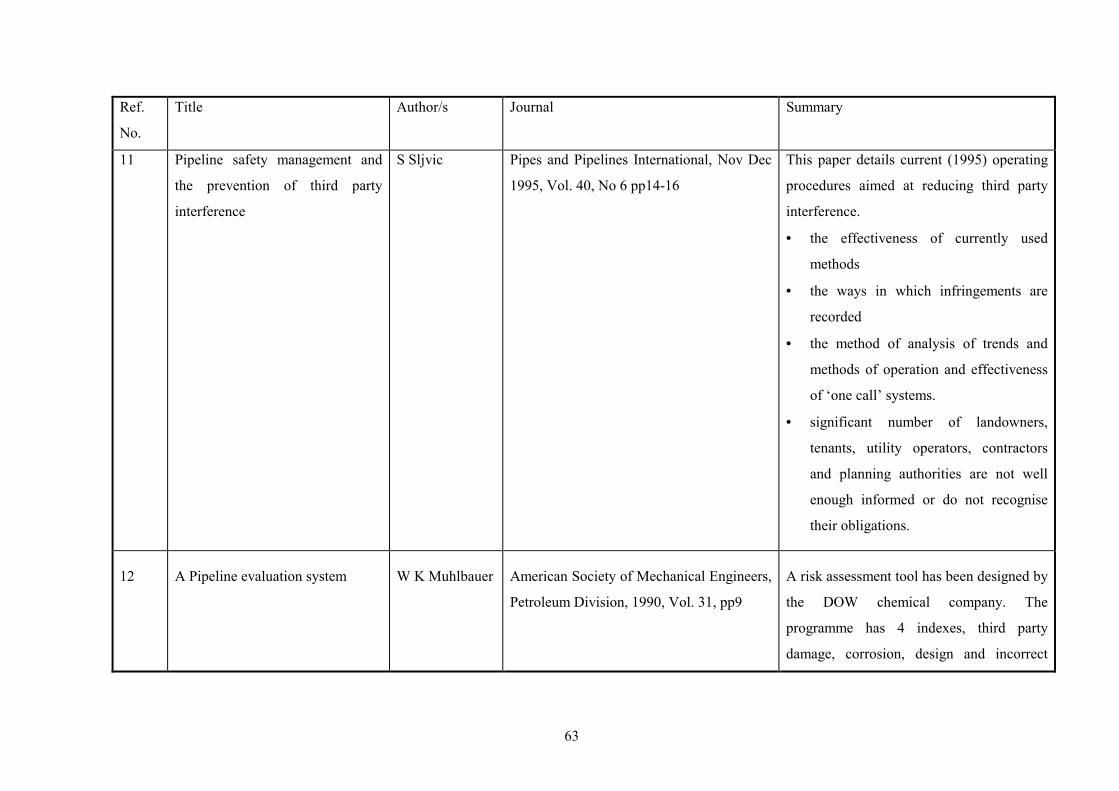
63
Ref.
No.
Title Author/s Journal Summary
11 Pipeline safety management and
the prevention of third party
interference
S Sljvic
Pipes and Pipelines International, Nov Dec
1995, Vol. 40, No 6 pp14-16
This paper details current (1995) operating
procedures aimed at reducing third party
interference.
• the effectiveness of currently used
methods
• the ways in which infringements are
recorded
• the method of analysis of trends and
methods of operation and effectiveness
of ‘one call’ systems.
• significant number of landowners,
tenants, utility operators, contractors
and planning authorities are not well
enough informed or do not recognise
their obligations.
12 A Pipeline evaluation system W K Muhlbauer American Society of Mechanical Engineers,
Petroleum Division, 1990, Vol. 31, pp9
A risk assessment tool has been designed by
the DOW chemical company. The
programme has 4 indexes, third party
damage, corrosion, design and incorrect
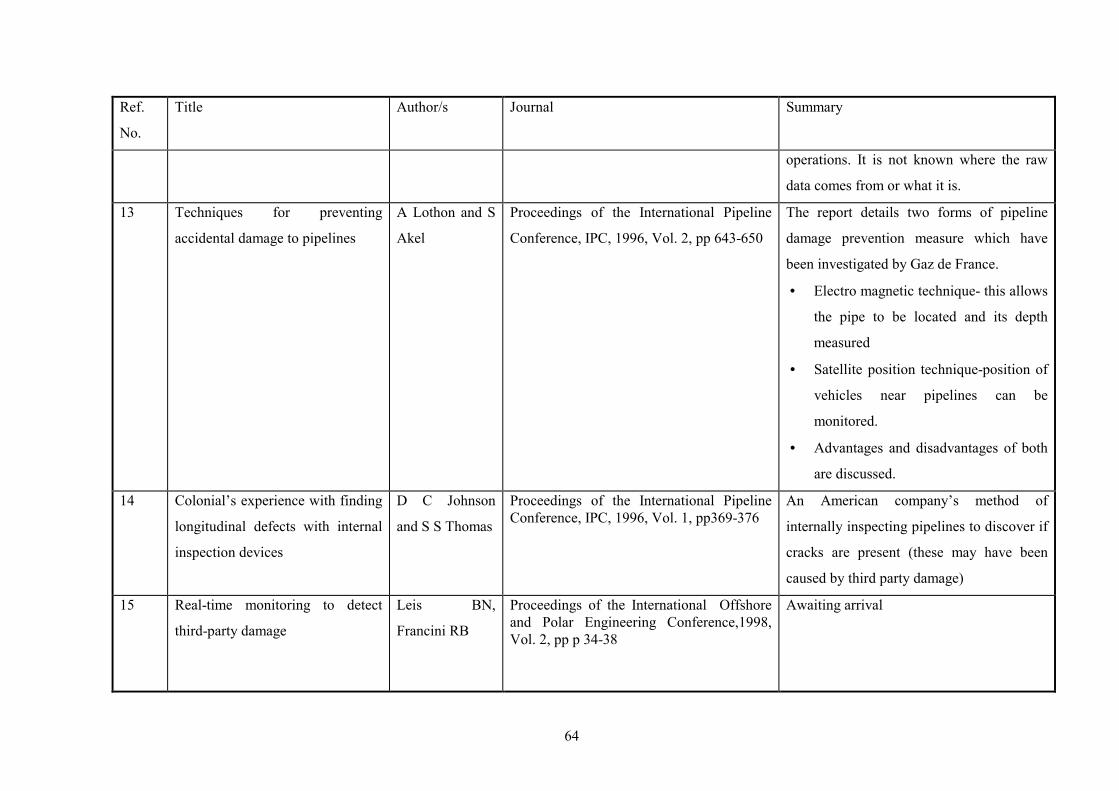
64
Ref.
No.
Title Author/s Journal Summary
operations. It is not known where the raw
data comes from or what it is.
13 Techniques for preventing
accidental damage to pipelines
A Lothon and S
Akel
Proceedings of the International Pipeline
Conference, IPC, 1996, Vol. 2, pp 643-650
The report details two forms of pipeline
damage prevention measure which have
been investigated by Gaz de France.
• Electro magnetic technique- this allows
the pipe to be located and its depth
measured
• Satellite position technique-position of
vehicles near pipelines can be
monitored.
• Advantages and disadvantages of both
are discussed.
14 Colonial’s experience with finding
longitudinal defects with internal
inspection devices
D C Johnson
and S S Thomas
Proceedings of the International Pipeline Conference, IPC, 1996, Vol. 1, pp369-376
An American company’s method of
internally inspecting pipelines to discover if
cracks are present (these may have been
caused by third party damage)
15 Real-time monitoring to detect
third-party damage
Leis BN,
Francini RB
Proceedings of the International Offshore and Polar Engineering Conference,1998, Vol. 2, pp p 34-38
Awaiting arrival

65
Ref.
No.
Title Author/s Journal Summary
16 Effect of vehicles on buried, High-
pressure pipe
R J C Potter Journal of Transportation Engineering, May
1985
The mechanical effects of traffic on buried
high pressure pipes have been examined on
America’s Colorado Interstate Gas Pipeline.
Pressurised pipes sustained much lower
deflection. The maximum total deflection
expected at zero cover was 2.2% which is
well within the operating specifications of
the pipe (5%).
17 Probabilistic estimation of life
remaining of a pipeline in the
presence of active corrosion
defects
M Ahammed International Journal of Pressure Vessels and Piping, April 1998, Vol. 75 No4 pp p321-329
A methodology for calculating life
remaining in a pipeline is presented.
Random variables such as ‘third party’
damage have only briefly been included.
18 A Classification of scheme for
pipework failures to include
human and sociotechnical errors
and their contribution to pipework
failure frequencies
J A Ashley, L
Bellamy, T A
Geyer and N W
Hurst
Journal of Hazardous Materials(Amsterdam) 1991, Vol. 26, No2 pp159-186
Same as Ref. 5
19 MISHAP -HSE’S Pipeline risk
assessment methodology
M Bilo and P
Kinsman
Pipes and Pipelines International, July- August,1997,pp5-12.
Description of MISHAP - Model for the
estimation of Individual and Societal risk
from Hazard of Pipeline
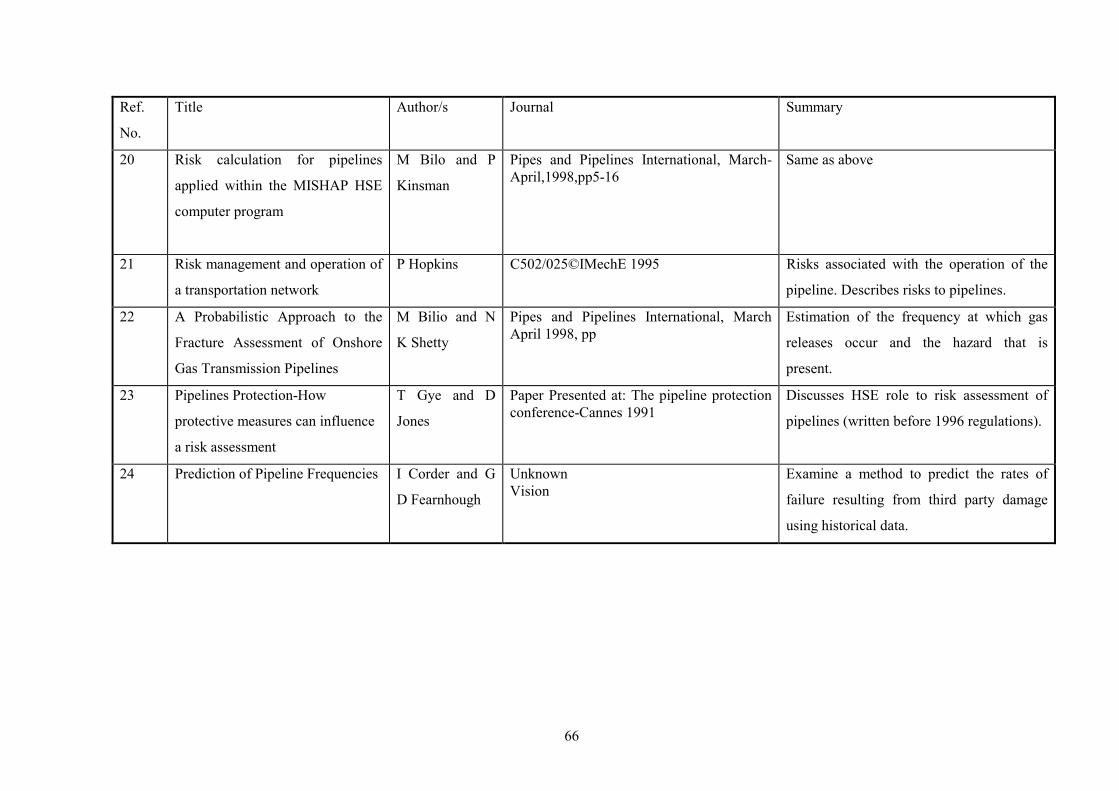
66
Ref.
No.
Title Author/s Journal Summary
20 Risk calculation for pipelines
applied within the MISHAP HSE
computer program
M Bilo and P
Kinsman
Pipes and Pipelines International, March- April,1998,pp5-16
Same as above
21 Risk management and operation of
a transportation network
P Hopkins C502/025©IMechE 1995 Risks associated with the operation of the
pipeline. Describes risks to pipelines.
22 A Probabilistic Approach to the
Fracture Assessment of Onshore
Gas Transmission Pipelines
M Bilio and N
K Shetty
Pipes and Pipelines International, March April 1998, pp
Estimation of the frequency at which gas
releases occur and the hazard that is
present.
23 Pipelines Protection-How
protective measures can influence
a risk assessment
T Gye and D
Jones
Paper Presented at: The pipeline protection conference-Cannes 1991
Discusses HSE role to risk assessment of
pipelines (written before 1996 regulations).
24 Prediction of Pipeline Frequencies I Corder and G
D Fearnhough
Unknown Vision
Examine a method to predict the rates of
failure resulting from third party damage
using historical data.
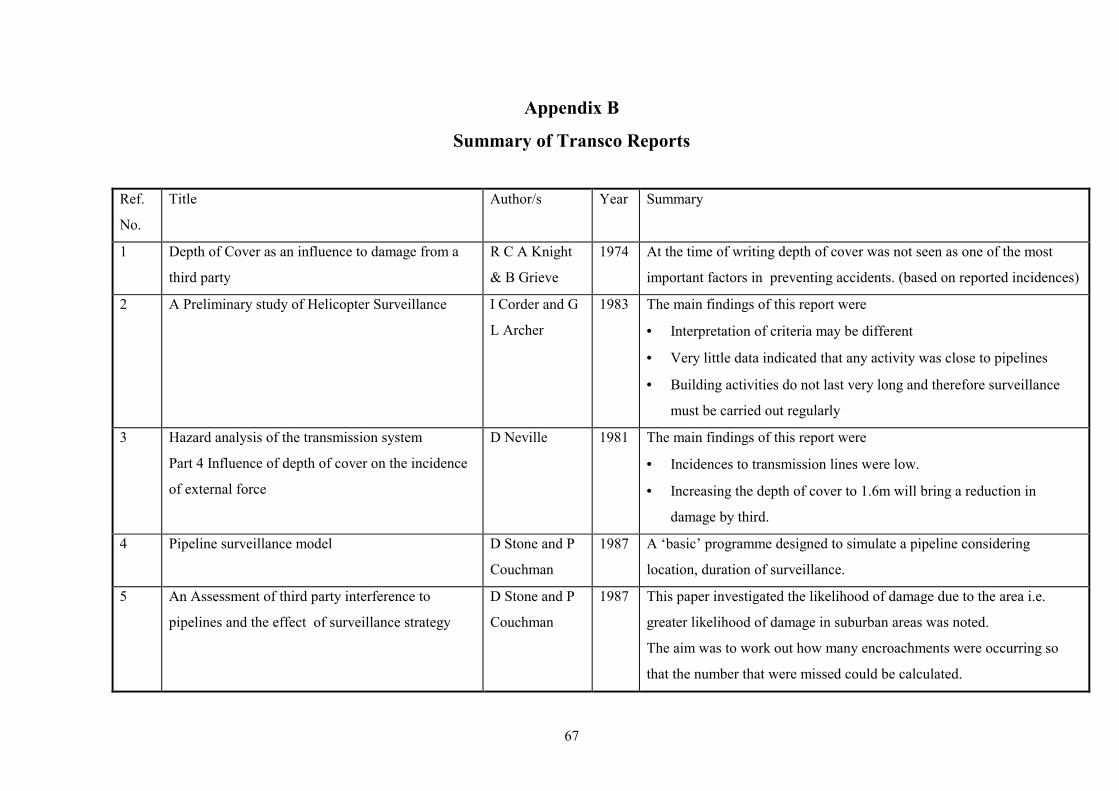
67
Appendix B
Summary of Transco Reports
Ref.
No.
Title Author/s Year Summary
1 Depth of Cover as an influence to damage from a
third party
R C A Knight
& B Grieve
1974 At the time of writing depth of cover was not seen as one of the most
important factors in preventing accidents. (based on reported incidences)
2 A Preliminary study of Helicopter Surveillance I Corder and G
L Archer
1983 The main findings of this report were
• Interpretation of criteria may be different
• Very little data indicated that any activity was close to pipelines
• Building activities do not last very long and therefore surveillance
must be carried out regularly
3 Hazard analysis of the transmission system
Part 4 Influence of depth of cover on the incidence
of external force
D Neville 1981 The main findings of this report were
• Incidences to transmission lines were low.
• Increasing the depth of cover to 1.6m will bring a reduction in
damage by third.
4 Pipeline surveillance model D Stone and P
Couchman
1987 A ‘basic’ programme designed to simulate a pipeline considering
location, duration of surveillance.
5 An Assessment of third party interference to
pipelines and the effect of surveillance strategy
D Stone and P
Couchman
1987 This paper investigated the likelihood of damage due to the area i.e.
greater likelihood of damage in suburban areas was noted.
The aim was to work out how many encroachments were occurring so
that the number that were missed could be calculated.

68
Ref.
No.
Title Author/s Year Summary
6 A pipeline surveillance system for detecting
mechanical interference: Development and testing
of a system suitable for field use
G L Archer
Osborne
1988 Investigations into a particular method of testing for mechanical
interference. The pipe is connected to various different geophones which
record noise from the pipeline to see if it has sustained an impact.
7 The effect of depth of cover on mechanical
interference
G D
Fearnehough
1989 • Using corrosion as a guide to depth of cover suggests that rural , R,
areas have a greater depth of cover than suburban, S, areas
• 50% of damage is concentrated in the 30% of pipelines that have a
depth of cover of <1.05 m
• The frequency of mechanical damage is 4 times greater in S areas
than other areas.
8 Proposed methodology to determine optimum
surveillance intervals
N Finnigan 1995 In 1995 the surveillance procedure that applies to BG Transmissions lines
are Aerial Surveys and Ground Patrol Surveys.
Aerial Survey
• 600ft @145km/hr
• large lengths may be covered
• presence of the helicopter acts as a deterrent
• bad weather conditions means that the survey does not go a head
• follow up visits are required for every sitting
Ground Patrol Survey
• the survey can easily be applied selectively
• it is not subject to satisfactory weather conditions

69
Ref.
No.
Title Author/s Year Summary
• activities are not as easy to see
• generally more expensive
9 Airborne pipeline Surveillance opportunities for
cost reduction
P J Allen 1995 Computer aided technique for fly over by aircraft without an observer.
10 Pipeline Protective measures field trail M Rose 1995 Five combinations of pipeline damage prevention measures
• Reinforced concrete slabs with marked strips.
• Steel plate with marked warning strips
• Reinforced concrete
• Steel plate
• Warning strips
Only the warning strips with either the concrete or the steel plate
protected the pipeline completely. The tapes could not been seen from the
cab of the digger so they did not stop digging from proceeding. Without
the waning tapes the protective measures were dug up and the pipes
sustained damage.
11 Potential of Recent advances in satellite aerial
technology for transmission pipeline planning and
surveillance
M McKeown 1995 Resent advances in satellite technology have been investigated in this
paper. At the time of writing they do not give a detailed enough picture to
be able to detect if third party action is taking place.

70
Appendix C
Sample calculations
Calculation 1 Consider a gas transmission pipeline with a 300mm nominal bore diameter, buried with a depth of cover of 120cm in a European country other than the UK. Step 1 – Input pipe diameter = 300 Since the pipeline is buried in a European country other than the UK, the EGIG data will be used.
Table 5 Distribution factors applied to damage classifications for all diameter ranges
Diameter Diameter Damage classification Total Range Midpoint (1000 km-year)-1 (1000 km-year)-1
[mm] [mm] Pinhole Hole Rupture 0-100 100 0.202 0.343 0.174 0.719
125-250 187 0.121 0.205 0.104 0.429 300-400 350 0.046 0.078 0.039 0.163 450-550 500 0.019 0.032 0.016 0.067 600-700 650 0.008 0.013 0.007 0.027 750-850 800 0.003 0.005 0.003 0.011
900-1000 950 0.001 0.002 0.001 0.005 1000+ 1050 0.001 0.001 0.001 0.002
Output
Damage classification (1000 km-year)-1
Pinhole 0.046 Hole 0.078
Rupture 0.039 Total 0.163
Step 2 – Input depth of cover = 120 cm
Table 9 Depth of cover failure reduction factor
Depth of cover Depth of cover failure reduction factor
Normalised depth of cover reduction factor
(cm) 0-80 3.12 3.2
80-100 0.97 1.0 100+ 0.66 0.7

71
Since the pipeline is buried with a depth of cover greater than 100 cm, the 100+ cm depth of cover factor will be applied. Output
Depth of cover reduction factor Depth of cover
(cm) Depth of cover failure
reduction factor 100+ 0.66
Step 3 – Apply factor to damage classification to give final output of the calculation:
Pinhole 0.046 x 0.66 = 0.030 Hole 0.078 x 0.66 = 0.051 Rupture 0.039 x 0.66 = 0.026 Total 0.107
Giving the final output of the calculation as:
Final failure frequency and distribution Damage classification Predicted
Failure frequency (1000 km year)-1
Pinhole 0.030 Hole 0.051
Rupture 0.026 Total 0.107

72
Calculation 2 Consider a gas transmission pipeline with a 450 mm nominal bore diameter and least minimum wall thickness defined by IGE/TD/1, buried with a 100 cm depth of cover. The pipeline is to be buried in a suburban location in the UK, with marker tape buried some distance above the pipeline. Step 1 – Input pipe diameter = 450 mm Since the pipeline is buried in the UK, the BG Transco data will be used
Table 16 Distribution factors applied to damage classifications for all diameter ranges
Diameter Diameter Damage classification Total range Midpoint (1000 km-year)-1 (1000 km-year)-1
[mm] [mm] Pinhole Hole Rupture 0-100 100 0.072 0.087 0.080 0.239
125-250 187 0.051 0.061 0.056 0.168 300-400 350 0.026 0.031 0.029 0.086 450-550 500 0.014 0.017 0.015 0.046 600-700 650 0.008 0.009 0.008 0.025 750-850 800 0.004 0.005 0.005 0.014
900-1000 950 0.002 0.003 0.002 0.007 1000+ 1050 0.001 0.002 0.002 0.005
Output
Damage classification (1000 km-year)-1
Pinhole 0.014 Hole 0.017
Rupture 0.015 Total 0.046
Step 2 – Input depth of cover factor = 100 cm
Table 20 Depth of cover failure reduction factors
Depth of cover (m)
Depth of cover failure frequency factor
Normalised depth of cover failure frequency factor
< 0.91 2.54 3.3 0.91-1.22 0.78 1.0
> 1.22 0.54 0.7 The pipeline is buried with a depth of cover in the range 0.91 – 1.22 m. Output
Depth of cover factor Depth of cover
(m) Depth of cover failure
reduction factor 0.91 – 1.22 0.78
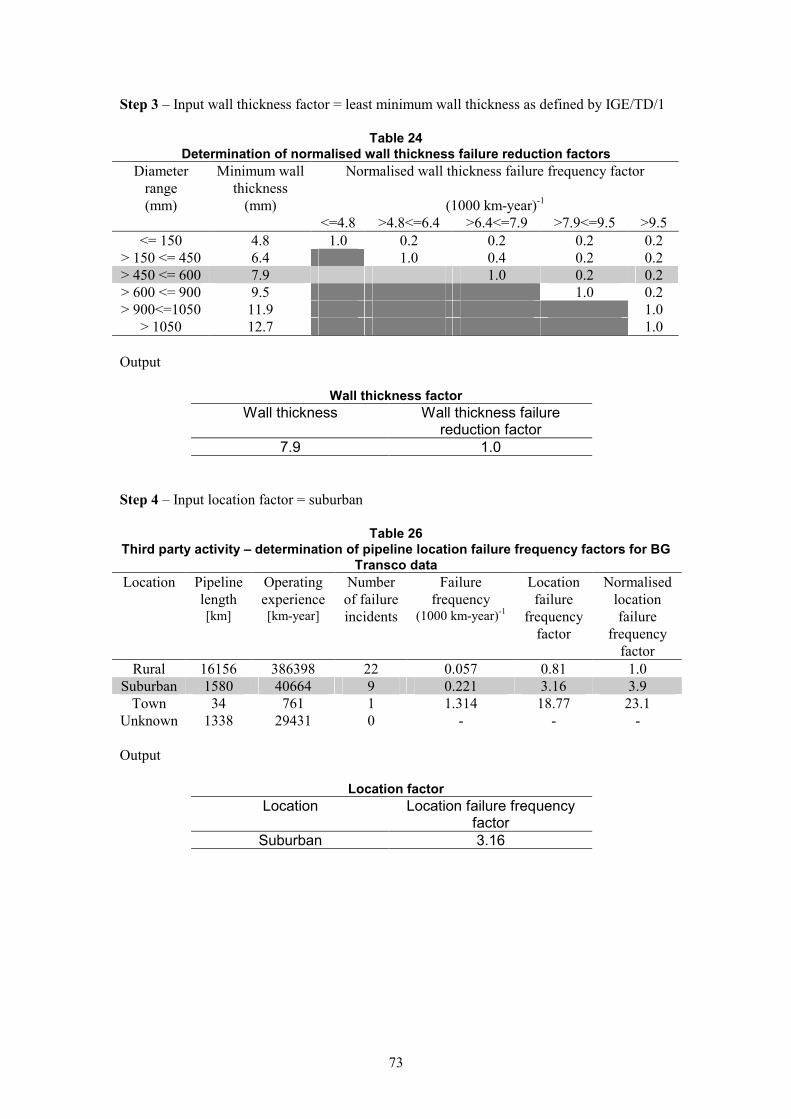
73
Step 3 – Input wall thickness factor = least minimum wall thickness as defined by IGE/TD/1
Table 24 Determination of normalised wall thickness failure reduction factors
Diameter range
Minimum wall thickness
Normalised wall thickness failure frequency factor
(mm) (mm) (1000 km-year)-1 <=4.8 >4.8<=6.4 >6.4<=7.9 >7.9<=9.5 >9.5
<= 150 4.8 1.0 0.2 0.2 0.2 0.2 > 150 <= 450 6.4 1.0 0.4 0.2 0.2 > 450 <= 600 7.9 1.0 0.2 0.2 > 600 <= 900 9.5 1.0 0.2 > 900<=1050 11.9 1.0
> 1050 12.7 1.0 Output
Wall thickness factor Wall thickness
Wall thickness failure
reduction factor 7.9 1.0
Step 4 – Input location factor = suburban
Table 26 Third party activity – determination of pipeline location failure frequency factors for BG
Transco data Location Pipeline
length [km]
Operating experience [km-year]
Number of failure incidents
Failure frequency
(1000 km-year)-1
Location failure
frequency factor
Normalised location failure
frequency factor
Rural 16156 386398 22 0.057 0.81 1.0 Suburban 1580 40664 9 0.221 3.16 3.9
Town 34 761 1 1.314 18.77 23.1 Unknown 1338 29431 0 - - - Output
Location factor Location
Location failure frequency
factor Suburban 3.16
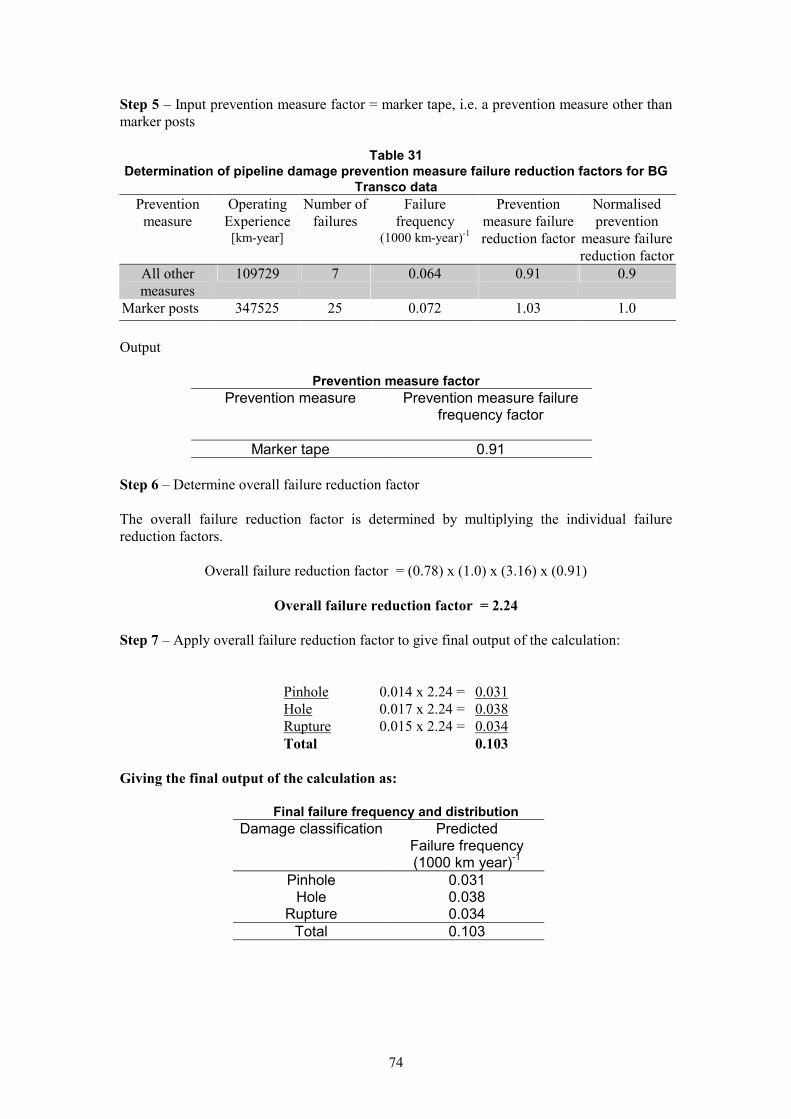
74
Step 5 – Input prevention measure factor = marker tape, i.e. a prevention measure other than marker posts
Table 31 Determination of pipeline damage prevention measure failure reduction factors for BG
Transco data Prevention measure
Operating Experience
[km-year]
Number of failures
Failure frequency
(1000 km-year)-1
Prevention measure failure reduction factor
Normalised prevention
measure failure reduction factor
All other measures
109729 7 0.064 0.91 0.9
Marker posts 347525 25 0.072 1.03 1.0 Output
Prevention measure factor Prevention measure
Prevention measure failure
frequency factor
Marker tape 0.91 Step 6 – Determine overall failure reduction factor The overall failure reduction factor is determined by multiplying the individual failure reduction factors.
Overall failure reduction factor = (0.78) x (1.0) x (3.16) x (0.91)
Overall failure reduction factor = 2.24 Step 7 – Apply overall failure reduction factor to give final output of the calculation:
Pinhole 0.014 x 2.24 = 0.031 Hole 0.017 x 2.24 = 0.038 Rupture 0.015 x 2.24 = 0.034 Total 0.103
Giving the final output of the calculation as:
Final failure frequency and distribution Damage classification Predicted
Failure frequency (1000 km year)-1
Pinhole 0.031 Hole 0.038
Rupture 0.034 Total 0.103

75

Printed and published by the Health and Safety ExecutiveC30 1/98
Printed and published by the Health and Safety ExecutiveC1 10/01

CRR 372
£15.00 9 780717 621132
ISBN 0-7176-2113-8