contract no. nas 7-505 5 a study to analyze the …
TRANSCRIPT

Contract No. NAS 7-505
(Period 5 July 1966 to 5 October 1967)
A STUDY TO ANALYZE THE PERMEATION OF HIGH DENSITY GASES
AND PROPELLANT VAPORS THROUGH SINGLE LAYER TEFLON OR
TEFLON STRUCTURE MATERIALS AND LAMINATIONS
INTERIM FINAL PROGRESS REPORT
25 October 1967 07282-6016-R000
Prepared for:
NASA Western Operations Office
Pasadena, California
Prepared by •
R. L. Johnso_roJect ManagerAdvanced Technology Department
Approved by:
P. G. Bhuta, Manager
Advanced Technology Department
M. 9.-Barton_ Man-_er
Engineering Mechanics Laboratory
TRW Systems
One Space Park
Redondo Beach, California
E

w
L_
ACKNOWLEDGMENT
The work reported herein was carried out by TRW Systems
for the NASA Western Operations Office under Contract
No. NAS 7-505. The contract was monitored for NASA Western
Operations Office by the Jet Propulsion Laboratory, Pasadena,
California. The Technical Manager for the Jet Propulsion
Laboratory was Mr. DonaldL. Young. Mr. Richard Weiner, also
of the Jet Propulsion Laboratory, advised with the experi-
mental aspects of the program.
The project manager for the contractor was Dr. R. L. Johnson
of the Advanced Technology Department, Engineering Mechanics
Laboratory. The analytical part of the program was carried out
by Dr. Johnson with the assistance of Dr. F. W. Thomas, also
of the Advanced Technology Department. The numerical programming
was carried out by Mr. J. E. Melde and Mr. D. E. Coats of the
Computation and Data Reduction Center. The experimental part of
the program was under the direction of Mr. L. J. Van Nice of the
Chemistry Department, Chemistry and Materials Laboratory.
Mr. Van Nice was assisted by Mr. H. M. Hoffman in performance
of the experiments and the interpretation of the data.
k .
Ii

w
w
J
w
_=
ABSTRACT
This report contains the results of a fifteen month analytical and
experimental study of the leakage rate of the pressurant gases (N2, He)
and the propellant vapors (N204, N2H 4) through bladder structures con-
sisting of two layers of Teflon separated by a metallic foil diffusion
barrier containing microscopic orlarger holes.
Results were obtained for the steady state leakage rate through
circular holes and long rectangular openings in the barrier for arbitrary
thicknesses of the two Teflon layers. The effect of hole shape and
relative hole position on the leakage rate were studied. The transient
problem was analyzed and it was shown that steady state calculations
are adequate for estimating the leakage rate. A computer program
entitled "Diffusion Analyzer Program" was developed to calculate the
leakage rate, both transient and steady state. Finally, the analytical
results were compared to experimentally determined values of the leakage
rate through a model laminated bladder structure. The results of the
analysis are in good agreement with experiment.
The experimental effort (Part II of the Bladder Permeation Program)
measured the solubility, diffusion coefficient and permeability of helium,
nitrogen and nitrogen tetroxide vapor through Teflon TFE and FEP membranes.
Data were obtained in the temperature range of 25 to 100°C at pressures
ranging from near vacuum to about 20 atmospheres. Results of the experi-
mental effort were compared with the limited data previously reported.
As a verification to the applicability of results to actual bladder sys-
tems, counter diffusion tests were performed with a laminated sample
containing aluminum foil with a selected group of holes.
iii

_a
L
L •
w
l
w
1.0
2.0
3.0
4.0
TABLE OF CONTENTS
INTRODUCTION .......................
i.I Descrlptfon of the Problem .............
1.2 Multfcomponent Counter Diffusion in Teflon .....
1.3 Leakage Through Laminated Bladder Structures ....
1.4 Investigations Carried Out Under Part I
of the Study ....................
STEADY STATE LEAKAGE THROUGH LAMINATED BLADDER STRUCTURES
2.1 Leakage Rate Through Two Layers of PermeableMaterial With One Circular Hole in the Barrier . .
2.2 Leakage Rate Through Two Layers of Permeable
Material With an Infinite Sllt in the Barrier . . .
2.3 Effective Area of Influence of Holes .......
2.4 Leakage Through Periodic Sifts ...........
2.5 Effect of Hole Shape on Leakage Rate ........
STEADY STATE LEAKAGE THROUGH HOLES IN METAL FOIL BARRIERS
3.1 Leakage Through a Circular Hole in a Metal Foll
Separating Pressurant Gas From Liquid Propellant . .
3.2 Effect of the Teflon Coating on Leakage .......
TRANSIENT LEAKAGE THROUGH BLADDER STRUCTURES .......
4.1 Approximate Calculation of the Transient Periodfor a Laminated Bladder with a Circular Hole
in the Barrier ...................
4.2 Further Remarks on the Transient Problem ......
5.0 INSPECTION TECHNIQUES FOR DETERMINING THE PRESENCE
OF MICROSCOPIC HOLES IN METAL FOIL ............
6.0 SUMMARY OF ANALYTICAL RESULTS ...............
6.1 Summary of Results .................
6.2 Comparison of Calculated with the ExperimentallyMeasured Leak Rate .................
6.3 Suggestions for Further Study ............
7.0 E_ERIMENTAL EFFORT ...................
Page
i-I
I-i
1-2
1-5
2-1
2-11
2-19
2-23
2-28
3-1
3-1
3-8
4-1
5-1
6-1
6-1
6-2
6-6
7-1
w
iv

_-_=
W
w
-==
w
i
W
8.0
9.0
I0.0
TABLE OF CONTENTS (cont)
_CHNIC_ DISCUSSION 8-1iiii.oieoeiioaleIIQel
8 1 Adso_tlon Tests 8-1• ,eei,ie,ee,,,a,.Ioll
8 2 Pe_eatlon Tests 8-5• ,,,em,i,Ii,gIJee,IeI
8.2.1 Unidirectional Pe_eatlon ............
8.2.2 Counter Diffusion ................
8-8
8-12
9-1
9-2
RESULTS ...........................
9.1 Solubility Data .....................
9.2 Diffusion Coefficients ................. 9-5
9.3 Permeability Constants ................. 9-10
9.4 Summary of Results ................... 9-18
9.4. i Helium Permeation ................ 9-18
9.4.2 Nitrogen Permeation ............... 9-20
9,4,3 Nitro_ern Tetroxlde Permeation .......... 9-21
9.5 Leakage Through Holes .................. 9-25
REFERENCES .......................... i0-i
A-IAppendix A .........................
B-IAppendix B .........................
C-IAppendix C .........................
I
I
v

v
L .-"
m
1.0 INTRODUCTION
I.i Description of the Problem
The objective of this program was to study the leakage of pressurant
gases and propellant vapors through bladder structures composed of
laminates of Teflon and thin sheets of stainless steel or aluminum foil
serving as a diffusion barrier. As a result of pin-holes developed
during manufacture and cracks which appear due to failure during flexure,
the barriers are never perfect. If the barrier had no openings there
would not be any leakage since the common pressurant gases as well as
propellant vapors are not soluble to any degree in aluminum or stainless
steel. Consequently, the purpose of the study can be stated as the
calculation of the leakage rate through laminated bladder structures
having holes in the diffusion barrier.
A typical such laminated bladder structure consists of one layer
of Teflon exposed to the pressurant gas, another exposed to the propel-
lant, with a sheet of aluminum or stainless steel about i mil thick
placed between. When there is an opening in the barrier, pressurant
gas dissolves in the Teflon layer on the gas side and diffuses through
the Teflon to the opening. It streams through the opening, or diffuses
tbrough, depending on whether or not the opening is filled with Teflon
and dissolves in the other layer of Teflon. Subsequently, it diffuses
through this layer of Teflon to the liquid side. Assuming no formation
of gas between the liquid and the Teflon, the gas leaving the Teflon is
dissolved in the liquid propellant and is transported by diffusion to
the far reaches of the propellant. The driving force for this process
is the gradient of the chemical potential, or the Gibbs free energy
of the gas in solution. It can usually be stated as being merely due
to the existence of a concentration gradient. Simultaneously, and by
the same process, the propellant diffuses through the bladder into the
pressurant gas space.
Obviously, the problem, if taken in all its complexity, Is quite
difficult. A complete solution to the problem would require that one
consider diffusion in the gas space, in the first Teflon layer, and
through more than one irregularly shaped and spaced opening in the
i-i

_m
v
m
v
ImE
v
barrier, followed by diffusion through the other Teflon layer, and then
finally through the liquid propellant. In addition one must consider
that propellant in molecular form simultaneously diffuses in the opposite
direction, and that in general, the two diffusion processes are coupled,
that is, the mass flux vector for the flow of the gas through the Teflon
depends not only on the gradient of the concentration of the gas in
Teflon but on that of the prov=ilant as well. It _:ems reasonable to
assume, however, that adequate e_gi_e_in_ results can be obtaine_ using
a somewhat simplified model. The model adopted is discussed in the
following sections along wlth its Justification.
1.2 Multicomponent Counter Diffuslcn in Teflon
The flow of one chemical component (the solute) in dilute solution
in a second component (the solvent) obeys Ficks' Law (1) as is well known
According to this law, the mass flux _ector of the solute or the net
amount of solute crossing unit area in unit time is proportional to the
gradient of the concentration of the solute In the solution composed of
the mixture of solute and solvent. Thus
^
J = -pDVc (1.2.1)
where j denotes the mass flux vector, p the density of the solution,
c the concentration of the solute In the solution, and D Is the diffusion
coefficient. The units of concentration chosen are those of mass
fraction, i.e., ci = pi/O, where Pl is the grams/cm 3 ef _pecies i present
and p is the total gms/cm 3 of the mixture, _. = _0 i. Combining
eq. (1.2.1) with the law of conservation of the mass of the solute
_c ^= -v-j (1.2.2)
leads to the diffusion equation for a two component mixture
_cp_= V'pDVc
(1.2.3)
1-2

w
w
m
v
i
w
Equation (1.2.1) is valid for dilute solutions, in the absence of
temperature gradients, pressure gradients, and chemical reactions. Thus
eq. (1.2.3) is subject to the same restrictions. In fact both tempera-
ture gradient diffusion and pressure gradient diffusion are very small
effects so that for practical purposes eq. (1.2.3) is valid in the
presence of quite large temperature and pressure gradients. The
presence of a chemical reaction leads to a source term on the right side
of eq. (1.2.3).
When there are more than two components present, eq. (1.2.1) is
more complex. The flow of component i depends on the gradient of the
concentration of the other components present as well as that of com-
^ n-i
ponent i(2) .
(1.2.4)
Thus in a mixture composed of pressurant gas with concentration Cl,
propellant with concentration c2, and solid of concentration 1 - cI - c2,
we have
Jl = -PDIIVCl - PDI2VC2(1.2.5)
J2 = -oD21VCl - 0D22Vc2(1.2.6)
^ ^
where Jl is the mass flux vector for pressurant gas, J2 that for
propellant. The law of conservation of mass then requires two equations
_c I
p3--_--= V'PDIIVCl + V'PDI2VC2(1.2.7)
3c2
p_-'-_--= V'PD21VCl + V'PD22Vc2(1.2.8)
The coefficients DI2 and D21 are called cross diffusion coefficients by
some writers. The numberSDll and D22 are the direct diffusion coeffi-
cients.
1-3
f
w
=__
r--
L
w
It is not possible to demonstrate theoretically the relative
magnitudes of the cross diffusion and the direct diffusion effects.
This can only be done by the actual measurement of all four coeffi-
cients which would be an expensive and time consuming task. Instead,
it will be assumed that the coupling between the two diffusive flows
is negligible so that the concentration of each component obeys an
equation of the form of (1.2.3). Thus we assume that the pressurant
gas diffuses through the Teflon in one direction entirely independent
of the presence of the pressurant diffusing in the opposite direction
and conversely. Physically, one would expect a coupling to exist when
the two components compete to a significant degree for the available
lattice vacancies. Thus for dilute solutions, neglect of coupling
effects should not lead to any serious error.
This assumption can be tested experimentally by measuring the
permeation rate for a given component in the absence of any counter-
diffusing component and when one is present and comparing the two
results. This was carried out as part of the experimental part of
this program. It was found that the permeation rate of the pressurant
gases was increased by the presence of counter diffusing N204, while that
of N204 decreased. The direct diffusion coefficients can, however, be
adjusted to account for the effect to within the accuracy of the data.
In the diffusion of N204 through Teflon some chemical reaction
apparently take place leading to swelling and discoloration of the
Teflon. This effect could probably be accounted for by a direct
diffusion coefficient which depends both on time and concentration of
N204 in Teflon. No effort was made under this contract to include
these effects in measured values of the dlffusivlty. However, the
span of time over which D varies is probably small compared to times
of interest for long term space missions so that sufficiently accurate
calculations can be made using the asymptotic value of D(the dlffusivlty).
Finally it should be noted that leakage through the Teflon could
be due to leakage through capillaries in the Teflon, that is, Knudsen's
flow, in addition to diffusion. Such a transport process would not
1-4

z
qm_
L_
I
iI
i
ww
obey the diffusion equation. Experiments carried out under this
program, however, have found no evidence for the occurrence of such
a process. (See Part II)
1.3 Leakage Through Laminated Bladder Structures
Suppose that a plane laminated bladder structure separates the
gas and propellant spaces within a tank as shown in figure (i.i).
x
Gas Space
-- r _/-Te flon
Liquid Space !I kk Teflon
Figure (i.i)
Let subscript 1 denote the diffusing component under consideration,
for example, pressurant gas, leaking through the bladder into the
propellant. As a result of the above assumptions concerning the
diffusion of gas through the Teflon, we can write the following
differential equations for the concentration cI of the diffusing
component.
In the gas space:
= D V2Cl h < x < = (1.3.1)g
In the first Teflon layer:
_c I
= DiV2c I 0 < x < h (1.3.2)
In the second Teflon layer:
_Cl =D2V2c I -b < x < 0 (1.3.3)
1-5

_j
i
_---2
m_
v
i
In the liquid propellant:
-_ < x < -b (1.3.4)
Here subscript D refers to the diffusion coefficient of pressurant gasg
through a solution of pressurant gas and propellant molecules which
have leaked through the bladder. D I is that for gas through the first
layer of Teflon, D 2 for the second and D_ is that for pressurant gas
through liquid propellant. The barrier, for convenience, is considered
to have zero thickness. This assumption will not affect the accuracy
of the calculations provided eqs. (1.3.2) and 1.3.3) are connected by
the correct boundary conditions across the openings in the barrier.
For finite gas and propellant spaces, the above equations have,
strictly speaking, no non-trivial steady state solution. The pressurant
gas, for example, leaks through the bladder structure into the liquid
space, its concentration in the liquid space constantly increasing
with time, until the entire liquid body becomes saturated with propel-
1ant gas. That is, the entire system reaches thermodynamic equilibrium,
after which there is no longer any mass flux of either pressurant or
propellant. However, for the nearly perfect barriers in which we are
primarily interested, the openings are small and the leakage rate is also
small. Quasl-steady state solutions are then possible which give a
finite leak rate because the change in the concentration of the solute
with time in either the pressurant or propellant space is very slow
compared to the relaxation time of the bladder structure itself.
Further, for small (microscopic) openings in the barrier, the region
over which the distribution of concentration varies is very small
compared with the volume of either the pressurant gas space or the
liquid propellant space. These spaces may then, for purposes of
calculation, be considered as seml-lnflnlte space separated by a
permeable bladder structure.
In Part I - Appendix A, it is shown that under certain conditions
the gas and liquid spaces are ignorable in solving eqs. (1.3.1 - 1.3.4).
The total system is then replaced by one which considers only diffusion
within the two Teflon layers, the concentration of solute being held at
1-6

i
r _
a constant value on one surface and at zero value on the other. The
conditions required are essentially that the permeation rates through
the gas and liquid of the solute be much larger than that through the
Teflon. Based on order of magnitude estimates of the diffusion parame-
ters of gas through gas and gas through liquid and the values measured
under this program for Teflon, the conditions seem to be well satisfied.
The above system of equations are then replaced by
L_
w
_c I 9
V_c I 0 < x < h (1.3.5)_t - DI
_c2 _c 2 -b < x < 0 (1.3.6)= D 2
where we now denote by c2 the concentration of solute in Teflon layer
two for convenience. The boundary conditions can now be chosen as
and
cI = co =Klp 0 (x = h) (1.3.7)
c 2 = 0 (x = -b) (1.3.8)
and the conditions of thermodynamic equilibrium (3) and conservation
of diffusing particles across any opening in the barrier. _i is the
solubility of solute in material i and P0 is the total system pressure.
Outside the openings in the barrier the diffusive fluxes must vanish.
The last condition is stated mathematically as
_Cl I _c2 I-- - = 0 (1.3.9)_x Ix=0 _x x=0
whenever (x,y) the coordinates in the plane lie outside the region of
an opening in the barrier. Conservation of diffusing particles within
the opening requires
_Cl = _c2(1.3.10)
OlDl_-_-Ix=0 02023-_--x= 0
whenever (x,y) lies inside the region of the opening,. Here 01 and 02
refer to the total density of materials i and 2 respectively.
1-7

I-!
w
The condition of thermodynamic equilibrium at the interface between
the two materials requires that the thermodynamic potential of the solute
be equal at the interface. For dilute solutions of pressurant gas or
propellant in solids the thermodynamic potential takes the form (4)
= RT_c + f(p,T) (1.3.11)
when P is the thermodynamic potential (Gibbs' Free Energy), R is the
gas constant, T the temperature and f(p,T) denotes a function of the
pressure and temperature. From eq. (1.3.11) the condition of equilibrium
is
RT£nc I + fl(P,T) = RT£nc 2 + f2(P,T)
w
1
r
or
Cl - (fl(P,T)-f2 (p ,T) )/RT
c 2
e-fl/RTi
e-f2/RT(1.3.12)
The right side of eq. (1.3.12) is however Just the ratio of the Henry
Law solubility of component 1 in material 1 to that in material 2.
Denoting the solubility by K we have
cI KI.... y (1.3.13)
c2 K2
as the condition of thermodynamic equilibrium at the interface between
materials 1 and 2.
Equations (1.3.7) through (1.3.13) indicate that the physical
parameters needed to specify the leakage rate through a structure
composed of two laminates of Teflon are the solubility and the
diffusivity of the solute in each Teflon laminate. Since these
quantities were not available in the literature, it was one of the
objectives of this program to experimentally obtain these quantities as
a function of pressure and temperature. The results of that phase of
the program are reported in Part II.
1-8
_',==_
[3
I=W
w
O
m
u
i
m
2.0 STEADY STATE LEAKAGE THROUGH LAMINATED BLADDER STRUCTURES
As was stated in section 1.3 steady state calculations of the
leak rate through a laminated bladder structure are meaningful because
for small leak rates the mean concentration of the diffusing species
in either the pressurant or propellant tank changes significantly only
over periods of the order of days whereas the transient period for a
typical bladder structure is of the order of a few hours. Thus over
long periods of time the concentration on the boundary of the bladder
does not change appreciably so that the leakage rate can be calculated
by assuming the concentration is constant. By assuming a maximum
value of the concentration on one side, zero on the other, an upper
bound for the steady state leak rate is obtained. Such results will be
useful for engineering purposes and have the advantage of being con-
servative, that is, they give the maximum leak rate.
2.1 Leakage Rate Through Two Layers of Permeable MaterialWith One Circular Hole in the Barrier
This problem was worked out and reported in great detail in
references 5 and 6 and will therefore only be outlined here. Consider
Figure 2.1 which is a schematic of the cross-section of a laminated
bladder structure containing a circular hole in the barrier foil
of radius a. The concentration of the solute is held at cO everywhere
on the upper boundary, c 2 = 0 everywhere on the lower boundary.
X
Iel-- C o
x=+h
I Material i
i _ r Concentration c1
........... , ........._. Barrier
! r Material 2r=a Concentration c 2
X -----b
I c2= 0
Figure 2.1
2-1

B
w
L..
As a consequence of the assumption of independent diffusion of the
various species through the bladder material, the steady state concentra-
tion of any given species obeys Laplace's Equation. This follows from
the usual diffusion equation by setting the time derivative equal to
zero. If cl(r,x) is the concentration of the diffusing species in
medium i, c2(r,x) that in medium 2, then in cylindrical coordinates
_Cl Br2 r B-_--+ _x2 = 0 (0 < x _<h) (2.1.1)
and
_2c2 i Bc2 B2c2
V2c 2 = --+ ----+ --= 0 (-b < x < O) (2.1.2)@r2 r Dr Bx2 - -
L_
r
On the surface, x = h, the concentration cl(r,h) must go to a
constant value, while on x = -b, c2(r,-b) is to vanish. Thus,
cl(r,h) = Co (all r) (2.1.3)
c2(r,-b) = 0 (all r) (2.1.4)
At the interface between the two materials there must be no diffusive
flow except within the radius of the hole. Thus the presence of the
barrier is simulated by
_cI= 0 x = O, r > a (2.1.5)
@x
and
_c 2= 0 x = O, r > a (2.1.6)
@x
w
2-2

Y_
Within the radius of the hole the conditions to be satisfied are
cl(r,0) . _ Yc2(r,0) (x -- 0, r < a) (2.1.7)
_cl(r,0) _l(r,0)
DI _x = D2 _x (x = 0, r < a) (2.1.8)*
%iJ
r :
Equations (2.1.7) and (2.1.8) state, respectively, that the concentra-
tions in the adjoining materials within the radius of the hole are
proportional, and that the number of particles is conserved (conservation
of mass). The proportionality of cI and c 2 requires the assumption of
thermodynamic equilibrium at the interface between the two materials.
The proportionality constant, Y, is known as Nernst's constant and is
equal to the ratio _/_ of the solubilities of the solute in the two
materials. It is not strictly constant but depends on temperature and
(4)pressure, principally the temperature . Finally, note that c in
o
eq. (2.1.3) is not the concentration of diffusing component (i.e.,
He gas) in the space above x = h, but is the equilibrium concentration
of this substance in material 1 when it is exposed to a bath of pure
diffusing component. Thus, co must be calculated from thermodynamic
equilibrium data which will be obtained experimentally.
For convenience, we solve not for cl(r,x) in region i, but for the
function _(r,x) defined by
,(r,x) = co - cl(r,x) (2.1.9)
This function has the advantage of vanishing at x = h, and enables one
to avoid the use of non-convergent integrals. Obviously, it satisfies
Laplace's equation,
0_r2 r 3x2 =
0 < x < h (2.1.i0)
*We assume the two Teflon materials have the same density, 01 = P2"The results are easily modified to include the more general case.
2-3
=
Taking the zero-order Handel Transform of Equation (2.1.10) removes the
r dependence. The transform is defined as
(k,x) = r_r,x) r J (kr)dr (2.1.11)
Jo o
w
Lw
z
m
Using eq. (2.1.11) in eq. (2.1.10) gives as the differential equation
obeyed by _(k,x)
d2_- k2 _(k,x) = 0 (2.1.12)
dx 2
The solution to this equation which vanishes at the boundary x = h is
slnh k(h-x)_(k,x) = Al(k) sinh kh (2. I. 13)
where Al(k) is an unknown function of k. Of course, the denominator of
eq. (2.1.13) can be absorbed in the function Al(k) if desired. By the
inversion theorem for Hankel transforms,
w
L_w
W
_(r,x) = rk Al(k ) sinh k(h-x)sinh kh Jo (kr)dkJo
(2. i. 14)
so that
_ _o k Al(k ) sinh k(h-x)cl(r'x) = Co sinh kh J (kr)dk (2.1.15)O
In the same manner it is found that the solution for x < a is given by
c2(r,x ) = _kA2(k ) sinhsinhk(b+X)kbJo (kr) dk*O
(2.1.16)
2-4

w
The two sets of boundary conditions (2.1.5), (2.1.6) and (2.1.8)
can be combined to state that
_cI _c2= x = 0 (2.1.17)
DI _x D2 _--x- '
for all r. Application of this condition to eqs.(2.1.15) and (2.1.16)
then gives
w
[_ k2Al(k )D1 ctnh kh Joo
(kr)dk = D2 _o k2A2(k) ctnh kb Jo(kr) dk
(2.i.i8)
Since this equation is valid for all r, the Hankel inversion theorem
states that
. 7
i --
2 1W
L
D I Al(k) ctnh kh = D2A2(k) ctnh kb
or
DI ctnh kh
A2(k) = D2 ctnh kb Al(k) (2.1.19)
for all k. Using now the condition, eq. (2.1.7) and eq. (2.1.19)
we find that for r < a,
_o kAl(k) YDItanh kh [tanh kh + D_-- tanh kb) Jo(kr)dk = Co (2.1.20)
while for r > a, from eq. (2.1.5),
w
k2Al (k)tanh kh Jo (kr) dk = 0(2.1.21)
w
= =
2-5

The latter equation being required in order that the current vanish for
r > a. Putting
k2Al (k)
tanh kh = f(k)
reduces eqs. (2.1.20) and (2.1.21) to the pair
7_
L
r_
L
f Y°# ]f(k) tanh kh + tanh kb Jo(kr) dk = ck o'o
_ f(k) J (kr) dk = 0 , r > a00
(r < a)
(2.1.22)
(2.1.23)
--4
L
" J
W
L_
k = _ a = h and 8 = bSubstituting p = a' a' a a we have the set
o _u tanh _u + D_-- tanh Bu Jo(0U)du= c p
o
and
I] f(u) Jo(OU)du = 0O > 1
< i
(2.1.24)
(2.1.25)
These two equations are of the form
_G(u) f(u) J (pu)du = cO O o
p < 1 (2.1.26)
w
w
where
_ f(u) J (pu)du = 0oo
G(u) 1 [tanh _u + YD1 )= u _ tanh 8u
P > i (2.1.27)
(2.1.28)
2-6

w
w
(7) is available for thisA general method of solution, due to Tranter ,
type of dual integral equations. It is based on the fact that if f(u)
is expanded as a seri_s of Bessel functions of ascending order,r
eq. (2.1.27) is identically satisfied. The coefficients in the expansion
have then to be chosen so that eq. (2.1.26) is satisfied. The procedure
is complex, however, and can only be carried out to yield closed form
solutions in a few cases. Putting
l-k (2.1.29)f(u) = u _ am J2m+k(U)m_o
eq. (2.1.27) is satisfied due to the discontinuous nature of the
resulting integrals. The substitution of eq. (2.1.29) into eq. (2.1.26)
leads to an infinite set of linear inhomogeneous equations for the
expansion coefficients am. Tranter presents an iterative technique for
solving these equations which works well in some cases. A slight
modification of his technique works well in this case also so long as
and B are large. Large a and B corresponds to the case where the
thickness of the permeable laminate is much greater than the hole
radius. This is a practically important case.
The details of the calculation of the coefficients a andm
subsequently the leak rate are given in reference 6. Here we
quote and discuss the result for the total flow rate W which is given
by
2-7

w
w
r_
Z_
w
w
lij
w
w
P
W II (oo)[ ,4DIaP i + (YDI/D 2) i + _ i + (YDI/D 2) +----D2
+ 1 + (YDI/D2)' - 4_ 1 + (YDI/D2)_
(_'DI/D2)'_ [ YDI'_2+ + \T/ 4,, 3i a._
1 + (_'DI/D2)_ b3
21 2 yD1 a
1 + (VDIID 2) D 2 hb
i 3 /a3 + YDI+ --3(2_n2)3 (1 (VD1/D2)) YD1+ D2 _h2b D2
(2.1.30)
accurate to terms of third degree.
The quantity W/4DlaCoP depends on three parameters. These are
the ratios a/h, a/b, and the factor YDI/D2. Figure 2.2 shows a typical
set of curves for various values of y - b/h, the ratio of the thickness
of the two slabs and for YDI/D 2 = 0.5. The parameter YDI/D 2 is, in
fact, the ratio of the permeability of material i to material 2. A
more complete set of curves is available in the Design Gulde (9) .
The result Is expected to be valid for ratios of hole diameter
to laminate thickness as large as 0.5, perhaps even larger. The
reason for this is that eq. (2.1.30) is not very sensitive to the terms
nonlinear in a/h or a/b since the coefficient of these terms is small
compared to that of the linear terms. The quantity _(3) in eq. (2.1.30)
denotes the R/emann Zeta function of argument 3.0 and has the value
1.202 nearly.
2-8

w
• °r
w
w
= =
w
w
v
0.95
0.90
0.85
0.80
O.0
_,. 0.75
0.70 j ,,
IY = 0.50
0.75
/
1.00
1.25
1.50
2.00
YD I-- _0.5D2
0.65
0
Figure 2.2
0.i 0.2 a/h 0.3 0.4 0.5 0.6
Dependence of Flow Rate on the Ratio of Hole Radius to
Slab Thickness
Nomenclature:
hole radius W
Teflon thickness, side i P
Teflon thickness, side 2 co
ratio of Teflon thicknesses
diffusion coefficients
ratio solubility constants
a
h
b
Y
D 1 , D 2Y
mass flow rate
Teflon density
Concentration of diffusion gas
absorbed by Teflon at Teflon-
gas space interface, dimensions
of mass of gas per unit mass ofTeflon
2-9

W
w
w
v
w
w
m
To use the results to calculate W, the total flow rate per unit
time, one must have the value of _, the two diffusion coefficients, the
hole radius, and the thickness of the two slabs. In addition, one needs
to know the value of the concentration co , on one surface. If, for
example, it is desired to calculate the leakage of Nitrogen pressurant
gas through the bladder structure to the propellant side, the value of
c is obtained from the Henry law constant and the pressure of the gasO
by co = <ip , where <i is the Henry law constant for material i and p
is the pressure of the gas pressurant. The constant y is the ratio of
the two Henry law constants for the two permeable materials, that is,
T = KI/_ 2.
Given y and the two dlffuslon coefficients one can estimate the
parameter YDI/D 2. From the known value of a/h, the ratio of hole radius
to gas side slab thickness, and y = b/h, the ratio of the liquid side
slab thickness to that of the gas side one, the quantity W/4DlaCo0 can
be obtained from the curves.
If the value of YDI/D 2 does not exactly match any of the plotted
values, linear interpolation between two charts can be used. From the
numerical value of W/4DlaCo0 thus obtained, one obtains the value of W.
The value of O in W/4DlaCoP refers to the density of the solvent,
that is, the permeable material. It has been assumed that the density
of the two layers is the same (eq. 2.1.8). If not, we replace D I by
oID I and D2 by 02D 2 in the expression i + YDI/D 2 which appears in
eq. (2.1.30) and replace 0 by 02 in W/4DlaCo0.
I
w
v
2-i0
L_
J
L
r
2.2 Leakage Rate Through Two Layers of Permeable Material
With an Infinite Slit in the Barrier
In the precedlng section the problem of the leakage rate through
a bladder structure composed of two laminates of permeable material
separated by an impermeable barrier with one circular hole was solved.
The solution obtained was rigorous provided the radius of the hole is
less than the thickness of either laminate. The only other simple
geometry is obtained when the opening is an infinite slit. Such an
opening corresponds to the real case of a rectangular opening which
is very narrow so that the effects of the ends can be neglected.
It has not been possible to find a rigorous solution to this
problem in the manner used for circular openings in section 2.1,
although several attempts were made. An approximate solution can be
constructed however by assuming a form for the leakage current across
the slit opening and equating the average concentration values on each
side of the sllt proportioned by the ratio of the solubilities. A
good assumption for the form of the leakage current is that for
leakage through a sllt into a semi-infinite medium. By comparing the
results of such a calculation with those obtained using the digital
computer, we can assess the validity of the assumption. The analytical
calculations have advantages over those obtained using the digital
program since the results can be tabulated in terms of dimensionless
parameters as for a circular hole and will be available without the
expense and effort of a computer run for any given case. Further, the
assumptions stated above are quite reasonable so that the results are
not expected to differ significantly from those of a more rigorous
solution.
A cross section of the structure is shown in figure (2.3).
Barrier
The
cI -- c°
....... i y = +hMaterial I, Concentration cI-%
Material 2, Concentration c- x-- 2
y = -bc2=0
Figure 2.3
2-11

T--FF
v
v
width of the slit is 2a. In material i, for y > 0, the concentration
of the solute c I satisfies Laplace's equation in two dimensions
_2c I _2c I--+--=0
_2 _2(2.2.1)
and takes on the boundary condition c I = Co at y ffi+h for all x.
Specification of the flow through the slit leads to a complete solution
for y > 0. Along y = 0 we put
_Cl(X,O)=_(_) , ]xJ<a
PlDI _y(2.2.2)
--0 Jxl>a
As stated above, the form of w(x) for flow into or out of a semi-
infinite medium through a slit of width 2a is w(x) i/_a2-2
We determine the proportionality constant so that the integral of w(x)
over the width of the slit is equal to the total steady state flow
rate W (gms/sec per unit depth of slit). Since
+a +a
fw x, xI-a -a
dE
/a 2 _ x 2
=
this is accomplished by putting
w(x) = W i (2.2.3)
_a 2 _ x2
The second boundary condition then reads
_Cl(X'0) W i- Ixl < a
oID I _y _
= 0 Ix] > a
(2.2.4)
2-12

=
i
As in section 2.1, replace cI by co
by _(x,y) are
02 2
8x 37
- _(x,y). The conditions satisfied
(2.2.5)
_(x,h) = 0 (2.2.6)
,2
m
a_(x,0) w 1----_ 2-01DI 3 Y _ _a 2 - x
(2.2.7)
Since the problem is completely symmetrical about x = 0, the
Fourier cosine transform can be employed. This is defined as
Cl(k'Y) = _o Cl(X,y) cos kx dx
m
w
w
w
with inverse
cI(x'Y) = __ _o Cl(k,y) cos kx dk
The cosine transform of _(x,y) satisfies
d2_k'Y) - k2 _k,y) = 02
dy
with solution vanishing on y = h,
slnh k(h - y)
_k,y) = Al(k) slnh kh
(2.2.8)
(2.2.9)
r
r 2-13

m
:=__
w
v
= =
E---
w
Taking the cosine transform of eq. (2.2.7) gives
fo faa_ ,0) cos kx dx = _WWPlDI
O O
cos kx dx
2
The left hand side is PlDI _while the value of the right sidedy
Wis -_ Jo(ka) where Jo(ka) is the zero order Bessel Function (8) Using
eq. (2.2.9) we obtain
W
PlDI kAl(k) ctnh kh = _-Jo(ka)(2.2. i0)
from which
W tanh kh sinh k(h-y) (2.2.11)
_(k,y) = _IDI k Jo (ka) slnh kh
Taking the inverse transform gives Cl(X,y).
_
W tanh kh sinh k(h-y)Cl(X'Y) = Co oIDI# o sinh kh Jo(ka) cos kx dkk
(2.2.12)
The value of W cannot be determined from this result. It must be
calculated by obtaining a similar result for y < 0 and then requiring
that the concentrations be propotlonal within the slit opening.
The solution for c2(k,y) which vanishes at y - - b is
sinh k(b+y)c2(k'Y) = A2(k) sinh kb
(2.2.13)
Again the condition given by eq. (2.2.4) must be satisfied which gives
W tanh kb
A2(k) - 2P2D 2 k Jo(ka) (2.2.14)
and upon using the value of Al(k) and applying the inversion theorem
we obtain
c2(x,y) =_W | tanh kb
o2D2 _ Josinh k(b+y) Jo(ka) cos kx dksinh kb k
(2.2.15)
2-14

r_
m
N
The flow rate W is now determined by requiring that
Cl(X,.O) = Te2(x,O)0 < x < a (2.2.16)
n
as in section 2.1, where V is the ratio of the permeabilities of the
two materials. From eqs. (2.2.12) and (2.2.15) we obtain
Co _
dkW tanh kh Jo(ka) cos kx _-
_PlDI o
= _o KdkY_P--_2 tanh kh J (ka) cos kx-r- 0 < x < aO w
(2.2.17)
Clearly this will lead to a unique determination of W only if
the integrals in eqs. (2.2.17) are independent of x in the interval
0 < x < a. That this is not the case can be determined from the value
of the integrals for small h and b. In that case tanh kh can be
replaced in the integral by kh and the value of the resulting integral
is h/4a 2 2- x for 0 < x < a. The only way out of this difficulty ism
to average the equation over the sllt opening by integrating out x.
This gives
co
eco
W f tanh kh J (ka) sin ka dk
wa01Dl Jo o k 2
oo
W (2.2.18)m 7_aP2D2 _o tanh kh Jo(ka) d_
Solving for W giveswhich is independent of x.
W ___.
_aPlDlC o
= (tanh kh + PlDIo _ tanh kh) Jo(ka)
sin ka
k 2dk
(2.2.19)
m
2-15
r
Z
w
=--
The integrals are evaluated in Part i, Appendix B by the Theory of
Residues. The integrals are of the same type and depend only on either
h and a or b and a. Using the result obtained in Appendix B, we find
2aPlDlC oW=
TOID____I 2 G(b) ) (2.2.20)
as the leakage rate in mass per unit time per unit length through a
bladder composed of two laminates of thickness h and b respectively
with a slit of width 2a in the barrier. The function G is given by
G(a) =_ l°[(n_)_a] (n_)_ae- (2.2.21)
n=o (n_)
when I denotes the zero order modified Bessel function.o
The quantity (2aPlDlCo)/ [h+(YPlDl/P2D2)b]is the leakage rate
through a two laminate bladder of width 2a and unit depth in the absence
of a barrier. In order for the expression (2.3.20) for the leakage rate
to give the correct value for a >> h; a >> b it is necessary that G
vanish for large values of the argument a/h; a/b. This is indeed the
case (See Appendix B).
Figure 2.4 shows a typical curve of W/PlDIC ° plotted as a function
of the ratios a/h and y = b/h. A more complete collection of such curves
will be found in reference 9. Note that for a given value of
YPlDI/O2D2 and y the curves become linear in a, the slit half width,
when a/h is of the order of 0.5. This indicates that when the total
width of the slit, 2a, is of the order of the laminate thickness the
effect of slit edge effects are negligible and the leakage rate can be
calculated using the formula quoted above for leakage through a strip
composed of two permeable slabs without a barrier, the width of the
strip, of course, being 2a. Since the results were obtained by an
approximate method we have compared them with numerical calculations
using the Diffusion Analyzer Program, DAP. Figure 2.5 gives a compari-
son of the two results. It can be seen that the approximate analysis
is quite adequate.
2-16

E_
M
w
W
m
Wm
m
m
w
oo
II
_ o4
l
I I,M
0
,--t _i 4..I
.._ _
r_ o.,.4•H _ _ _._1_
"H Q; _ O
_ _ _ "c_ _ _ 0_ _._
,.Coo 0 o _ c_
o [-_ _ ,o E_ _,_ _"0
II li II ii II II II II II
_.c._ _(_ o_-
o
u
2-17
o
o0
_D
-.1"
o
.c
C'_ .
_C
.M
.M
_D.H
o
_4
_4-1 ,,H
,1-1

• J
_AL_
,= 7
2.5
_ 2.0
w
M 1.5__I
u° 1.0
%
0.5
w
0
0
Y
- 0.4
--i.0
J
Computer Results
_ _ Analytical Results
Note: See Figure 2.4 for
definition of symbols
0.4
Figure 2.5
0.8 1.2 1.6 2.0
2a/h
Comparison of Computer Results with Analytical
Results for N 2 Flow Through Laminated Bladderwith Infinite Slit in Barrier
2.4
J_
i
m
I
2-18

E7w
[]
U
J
m
g
2.3 Effective Area of Influence of Holes
Calculations of the leakage rate through a single hole in the
barrier can be used for multiple holes provided these holes are
sufficiently far apart. The calculation of section 2.1 can be used
to determine the distance by which circular holes must be separated
in order that leakage through two holes can be considered independent.
Referring to section (2.1), the concentration in the upper
material (material i) is given by
cl(r,x) = Co - _(r,x) (2.3.1)
and from eq. (2.1.14) _ is given by
oo_(r,x) = kAl(k) sinh k(h-x)sinh kh Jo (kr) dko
(2.3.2)
when the value of Al(k) is known from reference 6. If there were no
hole in the barrier the concentration throughout material i would
equal c . Therefore the radius at which _(r,o) effectively vanishesO
is a good measure of the area effected by the hole. Inserting the
value of Al(k) from reference 6 we have
oo_(r,o) = kAl(k) Jo(kh)o
_o
dk ffia al/2| tanh kh
o Jo kI/2J1/2 (ka) Jo(kr) dk
m
L
J
w
+ alal/2I=o tanhk1/2kh Js/2(ka) Jo(kr) dk
(2.3.3)
Since aI is much smaller than a° and also the second integral is
smaller than the first, we can write
_al/2 tanh kh
_(r,o) - a° o kI/2 Jl/2(ka) Jo(kr) dk(2.3.4)
2-19

closely._ eq. (2.3.4) is equivalent toSince Jl/2 (ka) = (ka) I/2 '
_o _ sin ka J (kr)dk¢(r,o) -- ao k o
(2.3.5)
Putting ka " u reduces eq. (2.3.5) to
i_ (_u) du_(r,o) = ao tanh _u sin u Jo0
where B _ h/a and $ = r/a. Finally, using the expansion
-2sBu
tanh _u = i +2_ (-l)s e
(2.3.6)
gives u_ du (2.3.7)_ (_u)-_
,(r,O) =_ ao I l1 + 2 s_= (-1)s e-ZSB sin u J o0
integrating term by term after interchanging the order of integration
and summation gives
du
_(r,o) =_ao I sin u Jo(TU) -_0
-2sSU sin u J (Vu) d__uUo
We are interested in Y > i. In this case the value of the first term
is (8) 3 3 5 ._
ao sin ( = r
(2.3.8)
2-20
H
= =L
|
_Z
The second integral is also known.
_ e-2SBU sln u.j (yu) du -u oo
r 2 _cV/4s282
We thus find
_2 i 3 3 a+ 4--_--_+ . .Ip(r,o) = a° + 6- r r
(-i) sln-l[_s2B2 + (i + a)r2 _4s262 + (i - --r)
(2.3.9)
The leading term in a is independent of hole radius and ratioo
of slab thicknesses to hole radius. Therefore we calculate the ratio
_(r,o)/a ° as a function of a/r for various values of 8. Figure 2.5
shows a plot of _(r,o)/a ° as a function of a/r from eq. (2.3.9). It
can be seen that the value of this quantity at a/r = 5.0 is about 10%
of its value at a/r = 1.0, the hole edge. This ratio is not strongly
dependent on the value 8. Therefore, we conclude that 10-20 hole
radii should be about the maximum extent over which the effect of a
hole is felt. The same conclusion is, of course, valid for the
second material.
_=_
m
2-21
i
[3
--4
_=__m__
i
w
N
i
= =
IW
r _
i
: I
_= !
,'-q •
"r-I
0 ..CI
_ o
H •
o _ _t_
o "_o,.-I _ .r'l
_ O
_ m
o _ .,4
,.-4o
_1 TM
o
II
D _
n _
\
L
!,.l.ao,--4
oo.-c_.,.-,i.iJ o
l.ar_
,.c:
tsl u
oE
2-22
u_
Oq
.r.I
,-'1
0-,-.4
I
',,0
(.,;
h
O0-r'lg_
J
: z
. =
= =
- ,_
:=e
= ,
2
- 2
_=
w
2.4 Leakage Through Periodic Slits
There is one other case which can be treated analytically in an
approximate manner and which is of interest for determining the effect
of adjacent holes on the leakage through each. This is the case of a
laminated bladder structure constructed of laminates of permeable
material and a barrier with periodic slits. A cross section of such
a structure is shown in figure (2.7). The concentration on the barrier
side is held at c while that on the opposite side is zero. Each of theo
slits is of equal width, 2a, and the intervening barrier is of width
2(d -a). y
c=0
y=hPermeable Material
,11..im _ x• i
_I C = C O
d4Figure 2.7
The concentration obeys Laplace's Equation in two dimensions (x,y).
_2 c _2 c--+--= 0
_x 2 8y2
(2.4.1)
Since the concentration must be a periodic function with period 2d
we expand c(x,y) as follows:
E n_x (2.4.2)c(x,y) = fn(y) cos dn-o
where fn(y) is an arbitrary function of y. Substitution of eq. (2.4.2)n_x
in (2.4.1) and use of the linear independence of the set cos --_-gives
as the equation of the fn
d2fn .n_.2
2 _-_) fn (y) = 0dy
(2.4.3)
2-23

r
%.@
with solution vanishing on y = h of
fn(y) = An
sinh _(h-y)
n_hsinh
(2.4.4)
w
w
r
L
w
w
where the A are arbitrary constants. Hencen
sinh _(h-y)
c(x,y) = E An n_h cos
n=o sinh
n_x (2.4.5)d
The current flow is
n_h
_ ___ cosh-_- n_x_c(x_o) (2.4.6)
= _D An _ cos -_--0D _yn=o sinh
d
The flow rate in the interval 0 < x < d can be expanded in a Fourierw w
cosine series. If W is the total leakage rate through the slit
-a < x < +a and if we assume the flow is uniform then W/2a is the local
current (per unit depth of bladder). The current vanishes, of course,
for a < x < d.
W E n_x_-_a = Bn cos _d (2.4.7)n=o
where
i| d" W i W a= WB= -- J _a dx - d 2a 2-_
O fl o
Therefore
2 r d W n_x W I n_a
Bn = _ J 2-_ cos -_-dx = _--_an sin _dO
W W W _ i .n_a. ,n=x._a = _ +-Wa --nsin (--_--)cos k-_;(2.4.8)
2-24

r •
v
._J
v
w
_=
_==_
L_
r
k_
w
Equating the two expressions for the current gives
ctnb t-_-) ( )oD + 7 n A cosn=l
ffi2dW +_aW _n sin (n_a cos (-_--)
Thus n_h.W h W d sin (d) tanh (-_--)
A _---- ; A = 2OD 2o 2OD d n a n
giving at y = 0
n _a n _h
h w d _ sin (_) tanh (-7-)W
c(x,o) = 2u_p_7 + aoD n=l n
(2.4.9)
cos n_x (2.4.9)d
We now equate the average value of c(x,o) over 0 < x < a to c o, the
concentration there. This givesn_a n_h
W h W d 2 _ sin -_- tanh -_-- sin n_a (2.4. ii)
Co = 2-pD d + -- 7 _ 3_3pD n
Solving for W we obtain
2pD c
W = o (2.4.12)
[_ _ _)tanh (-_- .]
+2 d! _ (sin n_a 2 .n_h)
3 2 3a n
Since there are i/2d openings per unit length, the leakage rate per unit
area of the bladder if we assume a unit length for the depth is
pD cW o
W
'= "[h 2 n___ "n_a"_ _I
d 3 ® sin [____)2 tanh (
(2.4.13)
L_
w
2-25

I
A plot of W'/0Dc as a function of a/d is shown in figure 2.8.o
As shown a/d is equal to the percent open area. For these calculations
h was fixed at 5 mils and a at i mil and d was varied. This is
unimportant, however, since W'/pDc depends only on the ratio a/do
(as well as h/d, h and d). From the plot we draw the following
conclusions.
o For small percent open area the leakage rate increases
linearly with a/d and very rapidly. At 15% open area the
barrier permits about 60% of the leakage rate without any barrier
at all. Thus a barrier which has more than a few percent open
area will not be effective. To be really effective a barrier
must be about 99% intact.
o For open areas greater than about 15% the approximately linear
dependence of the leakage rate on slit width no longer holds.
This is apparently the region in which adjoining slits begin
to significantly influence each other since the leakage rate
for one slit is proportional to the slit width for large
widths. This agrees in order of magnitude with our previous
results for circular openings where it was concluded that
about I0 hole radii separation was sufficient for non-
interference.
=_
2-26

t
o
_9
o
o
• II _ _I _
_o u • .,4
o ,._ _u _ ,-.._
_ _ _ _,.c: o _o _ 0 o ,_ _
II n II II
o
o
_J
-Ho.H
oo
o
II
o.i-iu)
_3
_-_o
_,_
I:I _I II
II 11
ou
o
o
o
k_
o
-..'1"
o
o
o
I
0__J
o
o
_o
I
o_
0J
0
o
o
_J
o
o_J
oOD
oo
C_
D_
2-27
0

= =
r
V
r
v
z,
2.5 Effect of Hole ShaRe on Leakage Rate
Pin holes as well as cracks which appear in the barrier of a
laminated bladder st_u_cture will not, generally speaking, possess the
geometrically regular shapes for which an analysis is possible. It
is necessary, therefore, to determine as well as is possible the
effect that hole shape itself will have on the leakage rate. To do
this we compare the leakage rate through holes of different shape but
having the same area. It seems reasonable to expect that the leakage
rate will be about the same for holes having roughly similar shape
but will diverge for holes which are very dissimilar, for example, a
thin crack compared with a circular opening. The results obtained
bear out this assertion.
First a comparison of some results obtained using computer
program DAP (9) comparing circular and square holes are given below
Table 2.1
gms N 2
Hole Size Leakage Rate 2sec(mil)
Side or Diameter Square Hole Circular Hole
10-12 10 -122 mils 1.0 x i.I x
• 10 -13 10 -138 mils 3 7 x 3.9 x
It can be seen that the leakage rate through a square hole and a
circular hole of equal area are close enough to each other so that for
practical purposes they may be considered the same. The above calcula-
tions were obtained for a bladder consisting of two layers of Teflon
with Nitrogen gas diffusing. The results, of course, depend only on
the geometry and not on the particular solute chosen.
A further comparison can be made using the analytical results of
sections (2.1) and (2.2) for circular holes and retangular slits. A
value is chosen for the hole radius, ah and the leakage rate obtained
for typical conditions using the curves for circular holes. A slit
2-28
L
w
L__
w
p
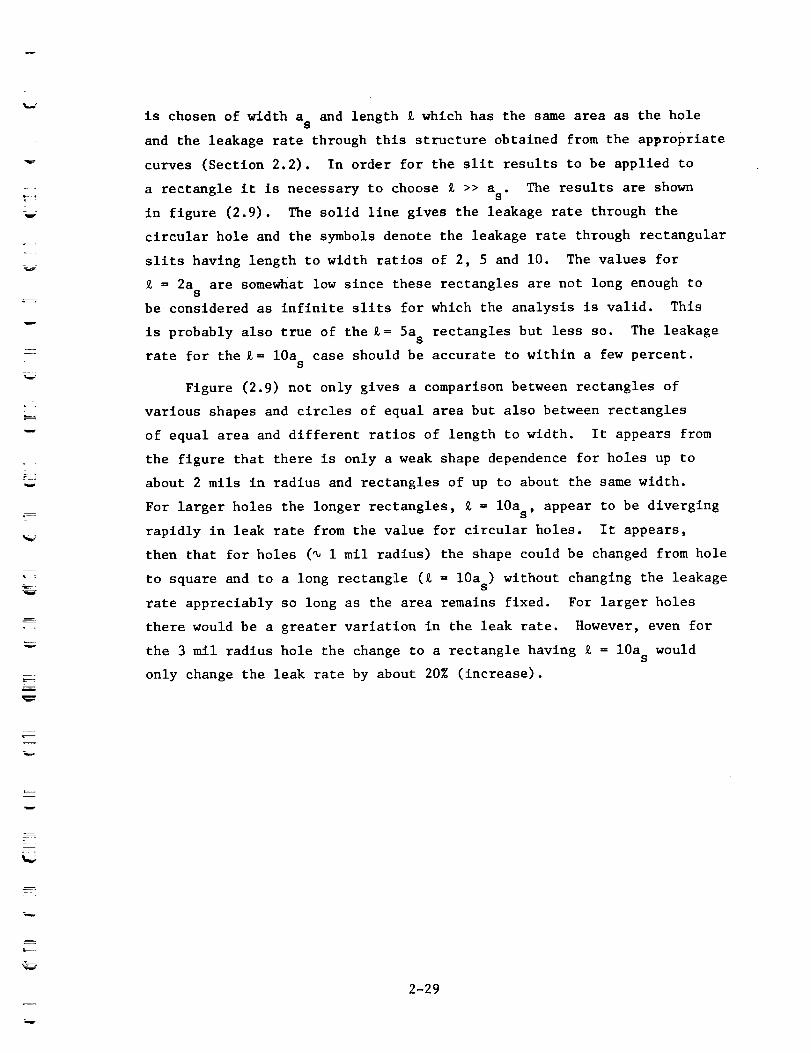
v
is chosen of width a and length _ which has the same area as the holeS
and the leakage rate through this structure obtained from the appropriate
curves (Section 2.2). In order for the sllt results to be applied to
a rectangle it is necessary to choose _ >> a . The results are shownS
in figure (2.9). The solid line gives the leakage rate through the
circular hole and the symbols denote the leakage rate through rectangular
slits having length to width ratios of 2, 5 and i0. The values for
= 2a are somewhat low since these rectangles are not long enough toS
be considered as infinite slits for which the analysis is valid. This
is probably also true of the _ = 5a s rectangles but less so. The leakage
rate for the _ = 10a case should be accurate to within a few percent.S
Figure (2.9) not only gives a comparison between rectangles of
various shapes and circles of equal area but also between rectangles
of equal area and different ratios of length to width. It appears from
the figure that there is only a weak shape dependence for holes up to
about 2 mils in radius and rectangles of up to about the same width.
For larger holes the longer rectangles, _ = 10as, appear to be diverging
rapidly in leak rate from the value for circular holes. It appears,
then that for holes (_ i mll radius) the shape could be changed from hole
to square and to a long rectangle (6 = 10a s) without changing the leakage
rate appreciably so long as the area remains fixed. For larger holes
there would be a greater variation in the leak rate. However, even for
the 3 mll radius hole the change to a rectangle having _ = 10a s would
only change the leak rate by about 20% (increase).
L_
2-29

L
mm
m
B
v
IB
o,--4
X
Q
35
2_
15
COMPARISON OF LEAKAGE RATE FOR CIRCULAR HOLES
AND RECTANGULAR SLITS OF EQUAL AREA
¶P
OE= 2aS
)A_ = 5a
s
V _ = lOas
YD1_=0.51)2
y: 1.0
a -sllt widthS
_k
ah - hole radius
----- leakage rate throughcircular hole
0.002
a h in.
0.0064
_0.0020
_m
a for £ = 2as S
0. 0040
a for £ = 5as S
0.0028
a for £ = lOas S
Figure 2.9
2-30
0.003
I_...._0.0096

f_
v
3.0 STEADY STATE LEAKAGE THROUGH HOLES IN METAL FOIL BARRIERS
The leakage rate through a laminated bladder structure with a
circular hole in the barrier was calculated in section 2.1. In this
section we calculate the rate of leakage of pressurant gas into liquid
propellant through a circular opening in an uncoated barrier, that is,
a barrier consisting only of metal foil. The leakage rate through
such a structure has intrinsic interest since this is the simplest
type of bladder. The results also afford the opportunity to evaluate
the effectiveness of the Teflon coating as an inhibitor of leakage.
E_
=
=
3.1 Leakage Through a Circular Hole in a Metal Foil
Separating Pressurant Gas From Liquid Propellant
A finite body of liquid propellant is separated from the pressurant
gas volume by an impermeable barrier containing one small circular hole
of radius a. The total pressure is the same throughout the pressurant
gas-liquid propellant container so that there is no net differential
pressure across the barrier. Assuming that the hole is formed after
the pressurant and propellant are in place, after formation the
pressurant gas will be dissolved in the liquid within the radius of the
hole and will subsequently diffuse into the body of the liquid.
Simultaneously propellant is vaporized into the pressurant gas there and
subsequently the vapor diffuses into the body of the pressurant gas.
Equilibrium occurs when the total body of liquid is uniformly saturated
with dissolved pressurant gas and the pressurant gas everywhere contains
propellant vapor with a partial pressure corresponding to the vapor
pressure of the liquid at the system temperature.
If the hole in the barrier is small and there are large volumes of
gas and liquid present (relative to the dimensions of the hole), it
should be possible to obtain a reasonable estimate of the leakage rate
by considering the system as infinite with mass flow rate by diffusion
between two semi-inflnite media connected by a small opening. It will
be shown subsequently (Section 4.3) that the mass flow rate obtained
in this manner is a good approximation to the actual leakage rate between
two finite volumes for most of the time span during which mass flow takes
place.
3-i
| J
w
I=7
B
I
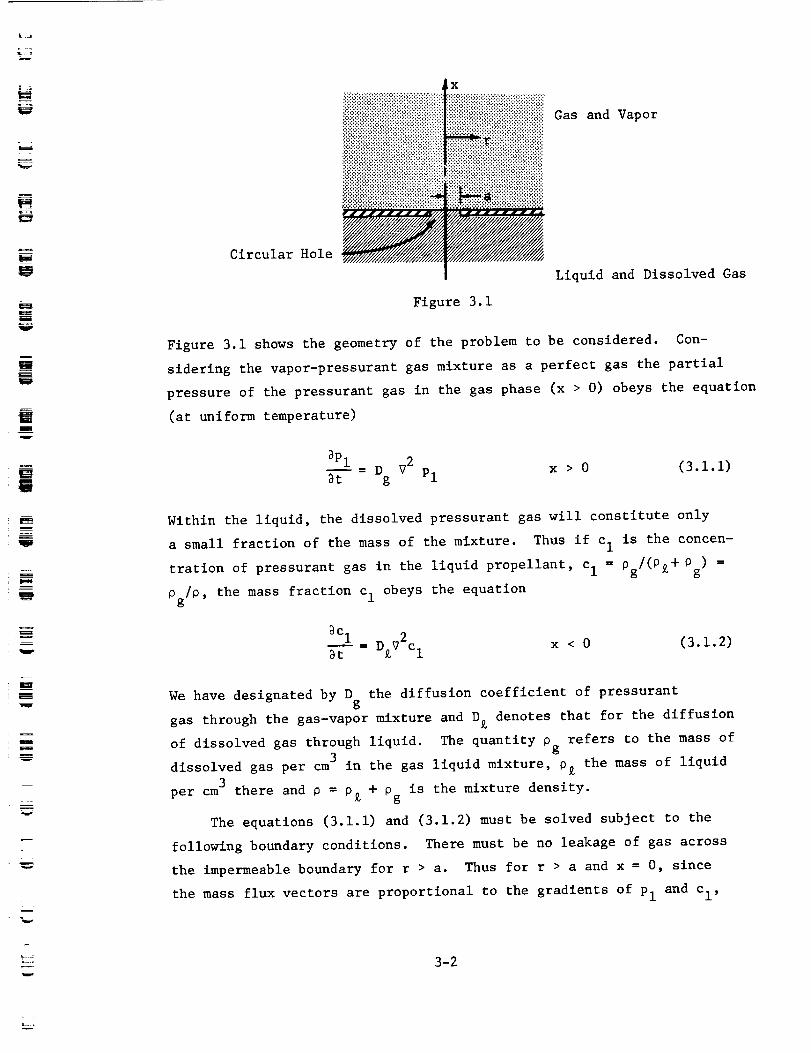
Circular Hole
_x
Figure 3.1
Gas and Vapor
Liquid and Dissolved Gas
Figure 3.1 shows the geometry of the problem to be considered. Con-
sidering the vapor-pressurant gas mixture as a perfect gas the partial
pressure of the pressurant gas in the gas phase (x > O) obeys the equation
(at uniform temperature)
_Pl D V 2_-_--= g Pl x > 0 (3.1.1)
Within the liquid, the dissolved pressurant gas will constitute only
a small fraction of the mass of the mixture. Thus if c I is the concen-
tration of pressurant gas in the liquid propellant, c I = pg/(p£+ P ) =g
pg/p, the mass fraction c I obeys the equation
_Cl DEV2Cl= x < 0 (3.1.2)
We have designated by D the diffusion coefficient of pressurantg
gas through the gas-vapor mixture and D E denotes that for the diffusion
of dissolved gas through liquid. The quantity pg refers to the mass of3
dissolved gas per cm in the gas liquid mixture, PE the mass of liquid3
= is the mixture density.per cm there and p PE + Pg
The equations (3.1.1) and (3.1.2) must be solved subject to the
following boundary conditions. There must be no leakage of gas across
the impermeable boundary for r > a. Thus for r > a and x = O, since
the mass flux vectors are proportional to the gradients of Pl and Cl,
3-2

mmmr
B
w
i
i
I
J
mm
m
m
[]
m
m
m
m
u
8Pl 8ci.... 0 (3.1.3)@x @x
For r < a (and x = O) the mass flux must be continuous. In the liquid^
the mass flux vector is - 0D£Vc I and its x component is -pD£(_Cl/_X) i^
where i is a unit vector in direction x. In the gas phase the mass flux^
vector is -m I DgVnl,with x component, -m I Dg(_nl/_X) i . Here, mI is
the mass of the pressurant gas molecule and n I is the number of such
molecules per unit volume. The number of molecules per unit volume is
related to the partial pressure (for a perfect gas mixture) by
A
nl
when A is Avogadro's number, R is the gas constant in appropriate units
and T is the absolute temperature. The mass flux in terms of the par£ial
pressure is then
MD __A _Pl i = __i___ _Pl i (3.1.4)iN 1 Dg RT _x RT _x
where M 1 --mlA is the molecular weight of the pressurant gas. Thus
conservation of mass requires
@cIMiDg BPl (3.1.5)
pD£ _ = RT 8x
for x = 0, and all r since both _pl/BX and BCl/BX vanish for r > a.
Finally for r < a and x = O, we assume local thermodynamic
equilibrium between the pressurant gas dissolved in the propellant and
the pressurant gas dissolved in the gas phase. This gives the result,
valid for dilute solutions of pressurant in propellant,
cI = K Pl (3.1.6)
when K depends only on the temperature. Here < is, of course, the
Henry's Law Solubility for pressurant gas in liquid propellant.
3-3

U
E9
UK_
w
i:
In a cylindrical coordinate system, and for the steady state,
eqs. (3.1.i) and (3.1.2) take the form
_2@2pl 1 @Pl Pl--+ ----+
_r 2 r _r _x 2
i)2Cl i _)Cl _2ci
Br2 r @r @x2
= 0 x > 0 (3.1.7)
= 0 x < 0 (3.1.8)
A solution to these equations subject to the boundary conditions
enumerated above, eqs. (3.1.5) and (3.1.6) must be found in order to
calculate the steady state leak rate through the opening. The justifi-
cation for obtaining a steady state solution is our surmise that the
transient in the neighborhood of the opening should be short-lived so
that the leakage rate will be virtually equal to the steady-state rate
over most of the time span of interest. It will be shown later that
the transient is indeed short compared to times of interest to a typical
space mission.
For large values of_r 2 + x 2 the pressure Pl must go to the total
system pressure, Po' say, since there the gas will contain no vapor.
So we put _ = Po - Pl for x > a and
Br2 r _x2(3.1.9)
The function _ tends to zero for large values of r or x. Taking the
Hankel Transform of order zero of eq. (3.1.9) with respect to the
radial coordinate r, defined as
I_ Jo(kr)_(_,x) = r _(r,x) dro
(3.1.10)
gives as the differential equation satisfied by (k,x)
d2_(k,x)
2cx
- k2 ¢(k,x) = 0 (3.1.11)
3-4

DU
mmm
W
u
m
lW
m
==
w
The solution to this equation which vanishes for large x is
-kx_(k,x) = Al(k) e (3.1.12)
Al(k) being some function of k which must be found from the boundary
conditions. From the inversion theorem for Hankel Transforms
I_ Al(k )_(r,x) = k
o
-kxe J (kr) dk (3.1.13)
o
and therefore
ooPl (r'x) = Po - k Al(k)e-kX Jo(kr) dko
x > 0 (3.1.14)
The solution for cl(r,x) is the same except for the sign of the
exponent
oocl(r,x) = k A2(k) ekx Jo(kr) dko
x < 0 (3.1.15)
Applying the condition of conservation of mass flux at x = 0,
eq. (3.1.5) leads to
I= F k2A2 (k)MIDgRT k 2 Al(k) Jo(kr) dk = pD£ Jo(kr) dk (3.1.16)o _o
which, since this must hold for all r, implies
M D
A2(k ) _-"'I _K_ Al(k ) (3.1.17)RT 0D£
The condition of local thermodynamic equilibrium, eq. (3. i. 6) glves,
after using eq. (3.1.17)
M I Dg k Al(k) Jo(kr) dk (3.1.18)K o - o k Al(k) Jo(kr) d --R-_ 0D£ o
3-5

r
=
r
= ==
_ =
w
which must hold for r < a. Finally for r > a, _pl/SX = 0 at x = O,
or
_ k2 Al(k) Jo(kr) dk = 0 (3.1.19)o
Hence we have the following set of dual integral equations for the
unknown function Al(k).
_ k Al(k) Jo(kr) dk =o
Po
M 1 Di +__-_- 1
RT oD E K
(r < a) (3.1.20)
_ k 2 Al(k) Jo(kr) dk = 0o
The solution to this set of equations is known (7)
r > a (3.1.21)
i Po sin ka._
RT pD£ _:
(3.1.22)
Combining eqs. (3.1.22), (3.1.17) and (3.1.15) gives for the concentra-
tion of dissolved pressurant gas in liquid propellant,
clrx2MI (IPo)I°slnkakx.... k e J (kr) dk (3.1.23)oRT pD£ M I D _ o
+--
RT pD£ K
From this result the leakage rate per unit area is
X=O2MI(po)sR-_ Dg MI __ sin ka Jo(kr) dk
i+-- 1 o
RT pD£ <(3.1.24)
The integral vanishes for r > a as it should.! 2
I/Wa 2 - r . Thus
Its value for r < a is
w(r) = ----2 MID_(RT M_'DP° ) !
i +- i Sa 2 r2
RT pD£ K
(3.1.25)
3-6
%__
r
L
F_
F
v
z
The total leakage rate is
W = 2_ w(r)r dr
o
and is given by
1po)MI
+--
RT pD£ K
(3.1.26)
(3.1.27)
The leakage rate thus depends directly on the total system pressure
the radius of the hole, a, and the group of parameters DgMI/RT.Po'
The retarding effect of the solubility in and diffusion of the gas
through the liquid is contained in the group of parameters(Ml/RT)
(Dg/pD)(i/<), which can be recognized as the ratio of the gas to the
liquid permeation rates. We estimate the value of this ratio for the
typical case of Helium diffusing through N204. For Helium at a tempera-
ture of 273°K, M1/RT - 1.78 x 10⁻⁴. According to the data of Chang
and Gokcen(12) , K =_ 4.3 x 10 -6 atm -I. The density of N204 is about
1.45 gms/cm 3. No data is available for the diffusivity of Helium in
liquid N204, but the value should not exceed 10 -4 cm2/sec (I) . For
gases through gases, the diffusivity is always of order 1.0. Using these
numbers we find
MI DK_ ! _ 106
RT pD£ K
We conclude that the leakage rate is controlled by the solubility and
diffusivity of the gas through the liquid and for all practical purposes
eq. (3.1.27) reduces to
W = 4a p< Po D£ (3.1.28)
Equation (3.1.28) is the same result that one would get if the
gas phase was entirely ignored and the problem was considered to be
leakage through a hole into a half-space containing the liquid propellant,
the pressurant gas within the radius of the hole being held at the value
K PO"
3--7

=__
According to eq. (3.1.28) the leakage of pressurant gas into the
liquid is directly proportional to the solubility of the gas in the
liquid, the total system pressure and the diffusivity of the gas in the
liquid as well as the_radius of the hole. In the next section the
leakage rate through such an opening will be compared with that obtained
for leakage through a similar hole in the barrier of a Teflon laminated
structure.
3.2 Effect of the Teflon Coatin_ on Leakage
Assume that the hole in the barrier is 1 mil in radius and is
circular. Take the total system pressure as 40 atmospheres. The value
of D_ is estimated at 10-5 cm2/sec. According to Jost(1) all diffusion
coefficients in liquids have a value in the neighborhood of this number.
In the case of system N 2 gas diffusing through N204, the solubility,
K, is somewhat larger than for the system He-N204. For N 2 gas in N204,
K = 1.8 x 10⁻⁴ atms -I (i). The leakage rate obtained for the two systems
from eq. (3.1.28) is shown below
System
He-N204
N 2 - N204
W gms/sec
2.5 x i0 -II
1.06 x 10 -9
For purposes of comparison the leakage rate through a one mil radius
hole in the barrier separating 5 mils of FEP on the gas side from 5 mils
of TFE on the liquid side at the same total system pressure is shown
below.
Pressurant Gas W gms/sec
He 3.0 x i0 -II
N 2 1.67 x I0 -II
Thus the Teflon coating reduces the leakage rate by about two orders
of magnitude in the case of N2 but does not significantly affect the
leakage rate in He-N204 systems. The reason for this is that the diffu-
sivity of He into Teflon is the same order of magnitude of He through
N204. These conclusions as stated above are based on estimated values of
the diffusion coefficients of both gases [He and N2 through liquid N204]
of about 10 -5 cm2/sec and therefore must be regarded as tentative since
at present there is no experimental data for the diffusivity of N 2 and
H gases into liquid N204.e3-8

m
w
4.0 TRANSIENT LEAKAGE THROUGH BLADDER STRUCTURES
It was pointed out in section i.i that for a closed system, that
is a gas reservoir separated by a permeable bladder from a liquid
reservoir, the only steady state solution to the diffusion equation is
the trivial one corresponding to an everywhere uniform concentration
and no leakage. What must occur in reality is that after loading the
system with pressurant and propellant, or, if after loading, a rupture
in the diffusion barrier occurs there is a transfer of mass between
the two compartments until the liquid is everywhere saturated with gas
and conversely. This process does not take place at steady state but
is accompanied by a constantly diminishing leak rate as each tank nears
saturation since the driving force for the mass transfer steadily
decreases.
However, if the leakage rate through the bladder is slow, that is,
the holes in the barrier are small and if the pressurant and propellant
reservoirs are relatively large, that is, so large that at the given
leak rate the time required for saturation is long, it is possible to
consider quasi-steady state solutions to the leakage problem. The steady
state leakage rates calculated in sections (2.0) and (3.0) apply to this
situation. This type of solution will give an accurate estimate of the
leakage rate for periods of time over which the concentration of the
solute at the bladder surface does not change appreciably. If the
calculations are to be applicable to a real bladder situation it is
clearly necessary that the transient time of the bladder structure
itself be short compared to the time span over which the solute concen-
tration in either the liquid or gas reservoirs changes appreciably. The
latter time span must be large, of course, if the bladder is functioning
properly, that is, preventing leakage. One of the main purposes of the
transient calculations, therefore, is to determine if the relaxation time
for the bladder is short compared to that for the system as a whole.
If the ratio of the two times is sufficiently small the leakage rate
through a bladder structure can be calculated from the steady state
results since the integrated leakage over the bladder transient will be
small compared to the steady state leakage integrated over periods of
time of the order of a mission lifetime.
4-1

4.1 Approximate Calculation of the Transient Period For a LaminatedBladder with a Circular Hole in the Barrier
Consider a semi-infinite slab of material i, extending from x = 0
to x = h axially and to infinity radially. The plane x = 0 is covered
by an impermeable sheet except for an opening of radius a which is
exposed to the diffusing vapor. The concentration on the plane x _ h
is held at zero. Initially, the concentration of the diffusing sub-
stance throughout the slab is zero. A cross section of the bladder
is shown in the schematic.
x
H
U
mmm
m
H_
U
g
[]
!m
_1111111_11
x=h
ir=a
Cl=O
_Barrier
Figure 4.1
The basic difficulty with all problems of this type arises due to the
mixed boundary condition which must be satisfied on the plane x = O.
Thus, one specifies the concentration for r < a and the gradient of
the concentration (zero) for r > a. If it were possible to specify
either the concentration or the gradient over the whole plane x = 0
then the problem would be straightforward. This cannot be done exactly,
of course. As an approximation, however, one can postulate that the
flow rate across the opening (r < a, x = O) experiences a very short
transient before it takes on the final steady state value. The
difference between the leakage rate, which is the flow across the
plane x = h at any given time and its steady state value is then due
to the storage of diffusing material in material i. This approach
might be expected to give accurate results after the passage of a
4-2
[]

L_j
L
Mer_
[ ]
[]
f-. 2--
period of time short compared to the relaxation time for the bladder as
a whole because equilibrium should be reached very rapidly in the
immediate vicinity of the hole.
To find the transient behavior of the leakage rate under these
assumptions we solve
32Cl 1 _Cl 32Cl 1 _Cl
V2Cl - + ----+--= (4.1 I)3r2 r Br 3x2 D1 3t
Subject to the boundary and initial conditions,
cl(r,h,t) - 0
cl(r,x,0) = 0
_cI
-D 1 3-_--(r,0,t) = f(r,t)
(4. i. 2a)
(4.1.2b)
(4.1.2c)
where f(r,t) is zero for r > a, and is equal to the steady state flow2
rate divided by _a for r < a. That is
W
f(r,t) = o__2
_a
r < a (4.1.2d)
f(r,t) = 0 r > a (4.1.2e)
The Laplace Transform of Equation (4.1.1) then gives, using (4.1.2b)
s _2cl(r'x's) i _cl(r'x's) _2cl(r'x's)
D-- Cl (r'x's) = + -- + 2 (4.1.3)3r2 r _r 3 xi
where
oocl(r,x,s ) = e-st cl(r,x,t) dtO
Taking the zero order Hankel Transform of Equation (4.1.3) gives
d2Cl(k,x,s)
dx 2_ (k2 + s___) Cl(k,x,s ) = 0
DI
where
_Cl(k,x,s) = r Jo(kr)cl(r,x,s)dro
(4.1.4)
4-3

r
Hw
H
U
I
i
w
_=_
= :
w
L J
The solution to equation (4.1.4) which satisfies the condition (4.1.2a)
is
Cl(k,x,s) ffiAl(k,s)
slnh_/k2+D_ (h-x)
p
slnhv/k2+_s_ hDI
(4.1.5)
The Hankel-Laplace Transform of the conditions (4.1.2d) and (4.1.2e)
determines Al(k,s) , that is
dCl(k,0,s)
-DI dx la Jo _o -st W= r (kr) dr e off_ dt
2O _a
W aJ 1 (ka)o i
2s_a
(4.1.6)
We thus find
WO
Cl(k,x,s) =_a 2 D I
sinh k2+ s
a Jl(ka) i _ (h-x)p_
s(4.1.7)
_
The Hankel-Laplace transform of the flow rate through the plane x ffih is
dCl(k,h,s) W a Jl(ka)o i i= (4.1.8)
W(k,x) ffi-D 1 dx 2 k s cosh_ k2+ s hwa
Performing the Hankel inversion gives
W i_ Jo(kr) Jl(ka)W(r,s) = o a dk (4.1.9)
2 s h,,v_z_-_a o cos h
The total leakage rate, or rather its Laplace transform is given by
fo 7oW(s) ffi2_ r dr W(r,s) = o a2s rdra o
Jo (kr) Jl (ka) dk
cosh v_DI h
(4.1.10)
4-4

LJ
W
E
w
m
w
r •
w
w
Interchanging the order of integration, and using the delta function
character of the integral with respect to r, i.e.,
/_ r J (kr) dr =_(k)o k
where 6_) denotes the Dirac delta function, we get
w(s) -Wo 1
s cosh D_" h
(4. I. Ii)
Performing the Laplace inversion, which is straightforward in this case
yields2 _2DI
4h 2 t} (4.1.12)1 _ -(2n+l)W(t) -Wo _--_4 = (_)n e
The leakage rate as a function of Dlt has been plotted in Figure (4.2).
From the figure, it can be estimated, that for a 5 mll thick slab that
the transient period will last about 700 seconds if DI is as large as
10-6 cm2/sec, while for D I as small as 10-9 this period will last 194
hours.
The value of the diffusion coefficient for pressurant gases through
Teflon are about 10 -7 cm2/sec (see the experimental section of this
report). From figure (4.2) the transient time for a 5 mil thick Teflon
laminated structure is about 3 hours or 104 seconds. For a bladder
composed of two Teflon Laminates the time required would be about 4 times
as long since the transient time depends on the square of the bladder
thickness (eq. 4.1.12).
Although the above analysis is based on an approximate model, it
is expected to give the accurate asymptotic solution because for long
times the leakage rate across the opening must be the steady state
leakage rate. This has been verified by running the problem on the
digital computer using DAP. Figure (4.3) shows the analytical results
for a 5 mil thick Teflon slab and a barrier with a one mil radius
circular hole and the results obtained using the digital computer.
It can be seen that the results are in fair agreement even over the
early part of the transient and converge nicely for long times.
4-5
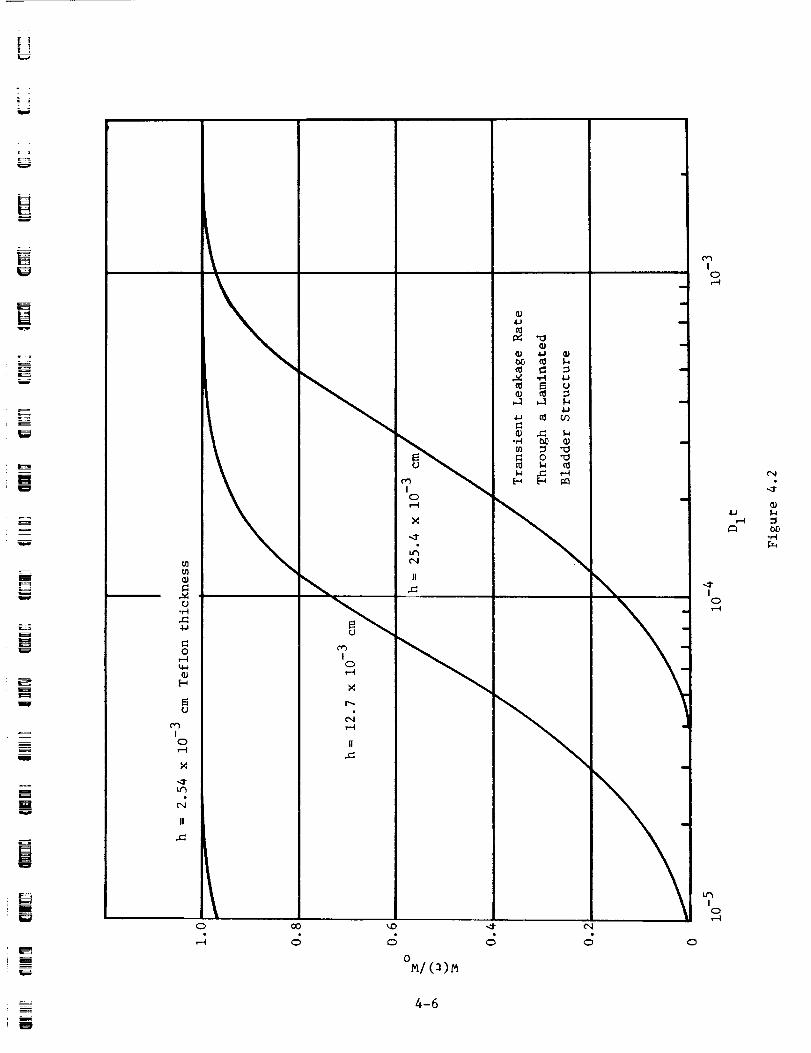
i!
J
[]
w
[]U
w
m
W
z
!
|
W
4=
a-J
0
t_
[-_
C3
On
I
0
L_
C"4
II
4J
E_ U
I0
_4
II
II
0
c_
°M/(:_)M
d
4-6
i
m
C'4
d 0
IC_
!
0
u*_
!
0
,--I
C'4
.t.-.I
r-_
r
W
@
U
o
i
liilil
[]m
!
g
W
4J
_u_ _
c_
_ o C_ o
o o _ __cD _.q
I _ ou
•I.J _'] u ._
o
oI I • I
o
• I o
_J
4J {_
o
c_cL
I_ "_ . 00___
_J
_,-. .
1.1 .H
_ ,-.4,.,4 o
oJ I I I
uas/ZN smS - [iOI x (_)_
4-7
_D
_n
Co(J
I
_J
0'1
J
t_
B
m
@
[]
[]
The following general conclusions can be drawn from the above
results.
o Transient times for a typical laminated bladder structure are
of the order of a few hours. This is very short compared to
the mission lifetime required for deep space exploration.
For a one mil radius hole in the barrier the steady state leakage
rate for N 2 gas through two layers of Teflon each 5 mils thick
(see section 3.2) is about 3.42 x 10 -12 gms/sec. In a period
of 105 seconds which should greatly exceed the transient time
of the bladder structure, the accumulated steady state leakage
rate would be 3.42 x 10 -7 gms. The accumulated transient
leakage rate would be less than this as can be seen from
Figure 4.2. Such a low integrated leakage would scarcely
affect the concentration of N 2 gas in the liquid propellant
over a period of time of the order of 1012 seconds which is
very long compared to the 104 second or so bladder transient
time.
4-8

!q
v_
r_u
N
m
L .
i
4.2 Further Remarks on the Transient Problem
Another instructive example for which an asymptotic (large values
of the time) solution can be obtained is that of the transient diffusion
of pressurant gas through a circular hole in a metallic foll bladder
into an infinite body of liquid. This solution is developed in detail
in reference 13. Here for the sake of brevity only the results will be
given.
The initial conditions on the problem are that there is no gas
dissolved in the liquid at time t = 0, and it is assumed that the concen-
tration of the pressurant gas within the opening is held at the constant
value c . This latter assumption is Justified in section (3.1) and isO
due to the fact that diffusion through the gas phase is much more rapid
than through the liquid. The leakage rate in gms/sec through a hole of
radius a is then found to be
3 pD£co 33 5 pD£co
W(t) = 4apD_c ° + a D£t + _ a 2(D£t)
+ .... (4.2.1)
This formula is validfor sufficiently large values of the time and
clearly goes to the steady state leakage rate
W ° = 4apDgc ° (4.2.2)
for large values of the time,
From eq. (4.2.1) the leading term in the time is small compared
with the first when
or when
2
a-_--- << 1
4D_t
2
_ 4D_t >> a (4.2.3)
For a one mil hole, and an assumed value of D_ of 10-5 cm2/sec, the
leading transient term in eq. (4.2.1) is 1% of the steady state term when
t - 16 seconds. At this time the ratio of the next transient term to the
steady state term is 1.35 x 10 -4, i.e., very small. Thus the transient
is very short-lived for the hole sizes under discussion here.
4-9

w
H
--7
--=
= :
Let us now compare this transient time with the time required to
saturate a given quantity of propellant by leakage through a one mil
radius hole at the steady state rate, eq. (4.2.2). At 40 arms the
equilibrium concentration of He gas in N204 is about
1.74 x 10 -4 (gms He)/(cm 3 N204) according to the data of Chang and Gokcen.
One ft 3 of propellant contains 2825 cm 3 and at saturation 0.492 gms of
Helium. The steady state leakage rate from eq. (4.2.2) is
i0-II2.5 x gms/sec. The time required to saturate 1 ft 3 of propellant
i0 I0at the steady state leak rate would then be 1.96 x secs or
5.46 x 10⁶ hrs. Actually it would require longer since the steady
state leak rate above is greater than the actual leak towards the end
of the time period required for saturation. Thus the transient period
is extremely short compared to the time required for the transfer of
any significant quantity of pressurant gas. Furthermore the leakage
rate can be accurately calculated from eq. (4.2.2) for periods of time
of the order of the time required for a deep space mission.
Finally it should be pointed out that the DAP program is now
available for solving many transient problems involving two laminates
of permeable material separated by a barrier with a hole in it. The
hole shape may be circular, square, or rectangular. Running time for
a typical transient problem, say leakage through two 5 mil layers of
Teflon with a 1 mil circular hole in the barrier, will be from I0
to 20 minutes. The program is not particularly well suited for problems
like the one discussed above where the transient time is very short,
however. The computing time required is too long. For more detailed l
information on the program see reference 9.
4-10

%..a
k_
w
w
w
w
v
E_
5.0 INSPECTION TECHNIQUES FOR DETERMINING THE PRESENCEOF MICROSCOPIC HOLES IN METAL FOIL
Before the leakage rate through a given laminated bladder structure
can be predicted, the size, shape, and distribution of holes in the
barrier foil must be known to sufficient accuracy. Of these quantities
the size and distribution are most important since as was shown in
section (2.5) the leakage rate is only weakly dependent on the hole
shape for not too gross differences in the shape. For small holes,
however, the leakage rate is strongly dependent on the size of the hole
in the sense that the leakage per unit open area is not constant. Thus
the leakage rate through two circular holes will exceed that through one
circular hole having an area equal to the sum of the areas of the smaller
two holes. In addition, a certain minimum hole separation is necessary
in order to be able to treat the holes individually. According to the
results of section (2.3) this should be about 5 times the major open
dimension of the hole. Thus an accurate estimate of the leakage rate
through a bladder structure can only be made if a considerable amount
of detailed information is available describing the holes in the barrier.
One of the most economical and well developed techniques for
obtaining such information appears to be dye testing. This technique
utilizes liquid dyes which are extremely good surface wetters along
with subsidiary techniques for observing the hole. It appears that such
techniques could be used for locating and photographing holes as small
as i mil diameter in metal foil.
One such process is known as dy-chek and is a product of Turco
Corporation. This test is carried out by first cleaning both surfaces
of the foil carefully and then applying liquid dye-penetrant which is
non-corrosive. After the dye-penetrant has dried an emulsifier is added
followed by a developer. The presence of a hole is indicated by the
appearance of dye coloring on the opposite side of the foil. An elabora-
tion of this process is Zyglo, a product of the Magnaflux Corporation.
It is similar to dy-chek except that the dye is flourescent and can be
viewed and photographed under black light. It should be possible to
r_ 5-1

U
H
w
obtain both the shape and size of the openings from enlargements of such
photographs. After measurement of the holes in this manner the method
could be checked by a gas leak rate test which would give the total open
area available for gas leakage.
More exotic techniques can be imagined such as 8 particle attenua-
tion, or optical methods using laser light. However these methods should
not be attempted until the simpler and more economical methods suggested
above have been exhausted.
w
5-2

rL
w
w
Dm
W
w
w
J
[ ;
w
m
m
6.0 SUMMARY OF ANALYTICAL RESULTS
In this section we summarize those general conclusions which can be
drawn from the analytical study, compare the analytically predicted leak
rate with experimentally measured values and point out those areas which
need further attention.
6.1 Summary of Results
As a result of the work reported in sections one through five above,
and elsewhere, several general conclusions concerning leakage and its
calculation through laminated bladder structures consisting of two layers
of permeable material separating a barrier with a hole can be stated.
The most important of these for an understanding of the overall process
are
o The transient time for a typical bladder structure is small
compared to the time required for a significant change in the
concentration of the gas in the liquid propellant. This means
that meaningful leakage rate calculations can be made by assuming
the bladder structure is exposed to steady state conditions on
each of its surfaces.
o Concentration gradients in the gas phase can be ignored. This
is shown in Appendix A. The reason is the gas offers essentially
zero resistance to diffusion compared to the Teflon.
o Concentration gradients in the liquid phase (propellant) can
also be ignored to a first approximation. This conclusion,
however, must remain tentative at present since there are no
experimentally measured diffusion parameters available for the
pressurant gases (N2, He) in the common earth storable propel-
lants (N204, N2H4).
o As a consequence of the above results the upper bound for the
leakage rate through a bladder structure can be calculated by
specifying a constant concentration on the solute side, zero
on the opposite side of the bladder. The solute here designates
the diffusing component.
6-1

[
U[]
H
D
W
m
m
g
m
[]
g
w
Mmi
P
W
6
o The shape of the hole in the bladder only weakly affects the
leakage rate per unit area through the hole over a wide class
of hole shapes. For example, a rectangular slot having a length
i0 times its width will permit about the same leakage rate as
a circular hole of the same area.
o Openings in the barrier can be treated as independent provided
they are separated by about i0 or more times the major dimension
of the opening.
o Provided the diffusion coefficients of the pressurant gases
(N2, He) in liquid propellant (N204, N2H 4) are no smaller than
about 10-5 cm2/sec, the Teflon coating on the barrier foil
reduces the leakage rate through the bladder structure signifi-
cantly over what it would be for an uncoated bladder (plain foil
with a hole).
Comparison of Calculat_ed with the Experimentally Measured Leak Rate
_o determine the validity of the analytical approach experiments
were carried out to measure the leakage rate through a typical laminated
bladder structure containing circular holes in the barrier, The sample
bladder structure consists of a I0 mil layer of FEP separated from a i0 mil
layer of TFE by a one mil thick aluminum foil. The loll was drilled with
i00, 5 mil radius circular holes in a square pattern, approximately
125 mils on centers. The sample laminated bladder structure was obtained
from the Dielectrlx Corporation; the holes were previously drilled in
the foil by National Jet Corporation.
The tests were carried out by initially evacuating both sides of the
test assembly, then pressurizing one side with Helium gas, the other with
N204 vapor. The two sides are separated by the laminated bladder struc-
ture. To eliminate the leakage during the transient period from the
measured value of the leak rate, the gas and vapor were flowed through
their respective sides of the assembly for several hours before the system
was closed off. After close-off sufficient time was allowed to elapse
to obtain a measurable quantity of the solute in the opposite chamber.
The samples were analyzed using gas chromatography.
iv
6-2

U
F
U
H
[]
N
I
H
m
w
[]IiB
BU
iU
m
[]
m
I
z
_=_
The experimental runs were carried out with the results shown in the
table below. The leakage rat_ through the assembly was ca_G_late_d _f-_--_
the _ _i/__._. using the _a_a_m_-_mm=_- ___ _ ,o-.-4/¢_./_,_...a_._,7_ ___ #.,,.v_*._'e-_'" _ r_ (F-;_/'
:._ ...... m__ LA--.c'L_ it- .... & _-L4_A,,I_,=_]I=_I=.¢_ " //
Test Temp. Press. Duration W gmslsec W gmslsec
(OF) (Atm) (hrs) (Exper.) (Calc)
1 187 9.6 2 He+N204 2.72 x 10 -9 4.20 x 10 -9
N204+He (Not Measurable)
2 200 i0 64.5 He+N204 15.5 x 10 -9 4.8 x 10 -9
N204+He 3.1 x 10 -8 4.35 x 10 -8
3 150 4.9 44 He+N204 17.35 x 10 -9 2.11 x 10 -9
N204+He 1.6 x 10 -8 1.7 x 10 -8
All of the tests were carried out with the TFE on the N204 side.
It was subsequently found that Test 1 was invalid because the gas
and vapor were not allowed to flow through the system for a sufficient
length of time prior to closing the system off. The measured leakage
rate is therefore an average value over a transient period and for this
reason is low. The test was also of too short duration to allow the
determination of the N204 rate.
For tests 2 and 3 the system was not only exposed to Helium and
N204 for a sufficient length of time before close off but also the test
was allowed to run for a period long compared to the estimated transient
time for the laminated bladder structure. In this way valid determina-
tions of the steady state leak rate were obtained.
_ne _al_ul_te_u values uf Lh_ _e_ak rate weLe ubta_Tred using the"
sel-ubil!ly and diffusivlty data of tab!co 9-!, 9 _,--an6-_-7.
_a used was that obtained from-unidi._utional cxpcrlmcn*._
/The experimental leakage rate was obtained by measuring the total accumu-
W,_ lated leakage and dividing by the elapsed time. From the results of
tests 2 and 3 above, it can be seen that the predicted Helium leak rate
is consistently lower than that measured while the predicted N204 rate
/

w
Hw
t
m
I
w
w
m
w
l__
J
m
is reasonably close to the measured value. However, there are several
factors which must be considered before evaluating the accuracy of the
predicted leak rate. The most important of these are the following.
(i) After completing the tests the laminated bladder structure was
removed from the test assembly for examination. It was found that the
TFE which was on the N204 side of the bladder was completely separated
from the aluminum foil. The FEP bond remained intact however. In
addition, there were cracks in the foil barrier at various places along
the surface where the bladder met and was compressed by the flanges of
the test assembly. Both these defects tend to increase the measured flow
rate over what it would be for an unfaulted bladder structure. The
theoretical calculations were based on the assumption that the bladder
material was not separated from the foil barrier and that the only holes
in the barrier were the drilled circular holes. Quantitatively the
effect of the separation and rupture of the barrier on the leakage rate
is difficult to account for precisely since the open area of the crack
is not known, and the amount by which separation increases the leak rate
is difficult to determine. Separation of one layer should not increase
the leakage rate by more than 50% however, and a visual examination of
the cracks indicate that the total open area was considerably less than
that of the I00 drilled 5 mil radius holes. Thus one would expect the
measured leakage rate through a bladder structure which did not experi-
ence separation and which had no cracks to be no less than about half
the measured values reported above. In short the observed failures of
the experimental sample could cause only a small change in the leakage
rate, not order of magnitude changes.
z
w
z
w
[]w
w
(2) The permeation rate for Helium through Teflon in the presence of
counterflowing N204 is higher than that for unidirectional flow of Helium
alone. This result was observed experimentally by comparing the results
of _unidirectional and _ counterflow tests.=_nd the rosa!to are_-
r-eeo_ded ir_,_±: _---n-7_When these values of the permeation rate are
used, the following calculated leakage rates are obtained for tests 2
and 3.
6-4

m
i
u
mw
m
E
Test W(gms/sec)
-92 12.0 x i0
3 ii.0 x 10 -9
When these results are compared with the experimental leak rates given
above, it can be seen that the experimental (as measured) and calculated
leak rates are in fair agreement. When allowance is made for the
observed defects in the bladder as discussed in (i) above, it appears
that the calculated and experimental gas leak rates are in excellent
agreement. Unfortunately, it is not possible to state this without
reservation since no quantitative measure of the effect of the defects
in the bladder structure is available.
(3) The experimentally determined effect of counterflow on the N204
leakage rate is to reduce it by about a factor of i0. <See figure 9._
_es the ex_eriment_l r..-_- Thus when counter diffusion
of Helium is taken into account the calculated leakage rates shown in
the table for tests 2 and 3 would be reduced by about a factor of i0.
Thus the agreement would not be nearly as good as is indicated by the
table. On the other hand the experimental leakage rates are too high
for the reasons discussed in (i) but not by as much as a factor of i0.
(4) The experimental data is itself uncertain perhaps to as much as a
factor of i0. Further, there is considerable scatter between different
samples of Teflon. Since the experimental data used to make the theoreti-
cal calculations was obtained from different Teflon from that used for the
experimental leakage tests, there is some uncertainty involved.
When all the possible sources of error such as those discussed in
(1)-(4) are taken into consideration, it seems reasonable to assert that
the prediction of the leakage rates to within an order of magnitude is
acceptable. Our experiments and analysis indicate that the unidirectional
diffusion data is adequate for this purpose and that the leakage rates
calculated using this data is in satisfactory agreement with the experi-
mentally measured leakage rates,
6-5

v
h
c_
D,
6.3 Suggestions for Further Study
The results obtained under this contract and reported above are all
obtained by isolating the bladder structure from the rest of the system
and calculating the leak rate as though it were in a fixed environment
with respect to the diffusing components. It has been shown that so far
as the gas space is concerned this is a very good assumption over long
periods of time (times of the order of that required for deep space
missions). However, the assumption of a vanishing concentration of the
diffusing pressurant gas on the face of the bladder exposed to the liquid
propellant is subject to question. True, if the ratio of the permeability
of the gas through the liquid is much greater than that through the Teflon
the mathematical problem can be treated as though the concentration in the
Teflon vanishes at the surface exposed to the liquid (Part i, Appendix A).
We do not know that this condition is adequately satisfied since we do not
know the permeation rate of pressurant gases through liquid propellants.
Even if it is, the model depends on the bladder surface remaining in con-
tact with the liquid, that is, no vapor phase is formed in the propellant
space. But according to Raoults' law (14) the pressure in the liquid
space will increase due to absorption of the pressurant gas in the liquid
tending to force the bladder away from the liquid and forming a body of
vapor in the liquid space. In fact, the formation of the vapor phase on
the liquid side of the bladder has been observed.
The rate of formation of the vapor phase (we refer to the mixture of
pressurant gas and propellant vapor as vapor phase) on the liquid side as
a function of the degree of perforation of the diffusion barrier is a
problem of considerable importance, since the presence of gas on the liquid
side of the bladder can lead to engine malfunction if large quantities are
present. Thus, the conditions under which a bubble forms and the rate of
formation of the vapor phase for a given set of conditions should be
studied. This can be carried out by extending the present study to in-
clude the liquid propellant and the pressurant gas adjacent to the bladder
structure and making allowance in the calculations for the motion of the
bladder. Further experimental work to determine the diffusion parameters
of the pressurant gases through liquid propellant will be necessary in
order to carry out this study.
6-6

L
r
v
v
v
P
E_
v
_uw
7.0 EXPERIMENTAL EFFORT
The purpose of the experimental effort (Part II of the Bladder
Permeation Program) wSs to support the development of an analytical
model of bladder leakage by providing transport property data and
identifying the mechanisms involved. In order to achieve the objective
an experimental program was conducted to:
i. Measure the diffusion coefficient and solubility of gases
and propellant vapors in bladder materials.
2. Assess the effects of two component counter diffusion.
The experimental program consisted of tests with a i0 mil sample
of polytetrafluoroethylene (TFE), a i0 mil sample of tetrafluoroethylene-
hexafluoropropylene copolymer (FEP) and a composite sample consisting of
i mil of aluminum foil with i0 mils of TFE bonded to one face and i0 mils
of FEP bonded to the other face. The gases and vapors of interest to
the program were helium, nitrogen, nitrogen tetroxide and hydrazine. The
teflon specimens were purchased from Dilectrix Corporation and were
fabricated by the spray method normally used for fabricating bladders.
The propellants were from lots analyzed to meet MIL-specifications and
the pressurant gases were industrial cylinder gases.
For simple geometries, the permeation constant is directly propor-
tional to the leakage rate. The mathematics involved and the mechanism
are widely reported and discussed, for example, References 15 and 16.
However, for the analysis of bladder leakage which involves flow through
holes in an otherwise impermeable barrier, the transport property data
required are solubility data in terms of a Henry's law constant and the
diffusion coefficient. These data are seldom reported in the literature
and, in fact, an extensive literature survey was reported in Quarterly
Progress Report No. 2* which located only permeation constants.
*Report No. 07282-6006-R000 dated 4 January 1967.
7-1

z :
S
7
i_ __
v
t '
The articles included in the survey pertinent to the present study are
References 17, 18 and 19 which give helium and nitrogen permeation con-
stants in TEP and FEP. A continuing search for data, particularly for
nitrogen tetroxide and hydrazine, yielded only four additional reports
(References 20 to 23) all of which report permeation data for nitrogen
tetroxide. Diffusion coefficients were not located for any of the
systems of interest and only one source gave data which involves solu-
bility in any of the systems of interest. Reference 23 reported that at
75 +__5°F after 183 days immersion in liquid nitrogen tetroxide, TFE
increased 3.8% in volume and 2.6% in weight. This gives a solubility
of 56 mg of nitrogen tetroxide per cm 3 of TFE compared to 22 mg/cm 3
which could be predicted from extrapolating the low pressure tests
discussed in Section 8.0. The comparison of the available permeation
data with results of this study is given in Section 9.4.
From an examination of the apparatus and results reported in the
literature two types of experiments were selected to provide the required
data. The first was an adsorption test to provide solubility data and
the second was a permeation test to provide permeabillties and diffusion
coefficients. These tests are discussed in Section 8.0 and the results
obtained from the test program are given and discussed in Section 9.0.
7-2

w
v
_ I
w
__I
i
E
v
w
v
8.0 TECHNICAL DISCUSSION
The experimental program provided the measured values of the Henry's
Law solubility constant, the diffusion coefficient and the permeability
constant through the reduction of data from two types of experiments.
The solubility of gases or vapors in a solid of known volume was measured
by introducing a known quantity of each in a closed bomb and allowing
time for equilibrium to be reached. From the equilibrium values the
solubility was calculated. In those tests where the transient decay
was sufficiently long, the diffusion coefficient also was calculated.
The permeability constant for unidirectional gaseous diffusion through
a membrane was measured by an apparatus in which a membrane was sub-
Jected initially to a small differential pressure. The differential
pressure decreases in the closed system as a function of time due to
permeation of gas from the high pressure to the low pressure side. From
an evaluation of the differential pressure-time data, the permeability
constant was calculated.
The following sections describe the tests which were conducted as
a part of this study. Section 8.1 describes the experiments using the
adsorption apparatus and Section 8.2 describes the unidirectional
permeation and counter flow tests using the permeation cell.
8.1 Adsorption Tests
In principle, the adsorption tests for gas solubility in solids
is a relatively uncomplicated test that provides a maximum of information.
In actual practice, it is capable of producing good results but requires
careful calibration and attention to detail. The schematic diagram of
the adsorption apparatus used in this program is given in Figure 8.1.
The supply tank fill system, the evacuation connections and the associ-
ated valving were omitted in order to provide a clear understanding of
the basic apparatus.
There are three key volumes which must be known accurately. These
are: i) the volume included between the two valves which includes the
transducer, 2) the volume of the empty adsorption bomb and all fittings
v
w
8-1

r
__E__
L_
-imm
R__m
mi
w
o _j_
o cH
p_
i
.SJ
_J
0
0r_
I-4
o_
m
m
_wr
8-2

i
w
v
LI=]
and connections, and 3) the volume of the Teflon sample. In addition,
the complete apparatus must be carefully temperature controlled for, in
effect, it functions as a gas thermometer.
The procedure which was followed during a test is the following:
i. The sample volume and transducer section were swept with the
gas or vapor and evacuated for a length of time sufficient
to assure desorption of all gases. (Typically one to sixteen
hours.)
2. A sample of gas or vapor was introduced into the calibrated
volume between the two valves and its pressure was allowed
to stabilize.
3. The valve between the transducer and the sample was opened
and the pressure in the system was periodically read on a
potentiometer until no further decrease was observed.
4. This valve was closed and a second sample of gas or vapor was
admitted to the calibrated volume as in step 2.
5. This second sample was added to the first as in step 3 and the
procedure of steps 2 and 3 continued until the desired total
pressure was attained. (Usually a total of four or five times.)
The data were reduced in a direct manner when a permanent gas
(nitrogen or helium) was used but by a more complicated technique when
nitrogen tetroxide was used. For permanent gases, the mass (or
standard volume) of gas in the system at any time was calculated from
the pressure volume relationships. The difference between the quantity
added and the quantity indicated at any time is the quantity adsorbed in
the Teflon sample.
CC(STP) gas = 273.15
CC Teflon VTefTPTR VTR + Po(VB - VTEF) - PEQ(VTR + VB - VTef_
(8.1.1)
where
8-3w

+
v
%-w
=
r
=
T = temperature, °K
3
VTe f = volume of the teflon sample, cm
3
VB = volume of ads6rptlon bomb, cm
3
VTR © volume of transducer section, cm
PTR = pressure in transducer section prior to addition to the bomb, atm
P = equilibrium pressure in the bomb prior to the addition, atmo
PEQ = equilibrium pressure in the bomb after the addition, atm
When the nitrogen tetroxide adsorption data was reduced it was
necessary to account for the dissociation reaction
N204_ 2 N02 (8.1.2)
which is a function of temperature and pressure. A second factor related
to the fact that it was a condensable vapor. Liquid nitrogen tetroxlde
was held in the supply tank at the same temperature as the complete
apparatus. When a vapor sample was drawn into the transducer section
a variable quantity of liquid was entrained with the vapor. Thus, it
was not possible from the initial transducer pressure-volume relationship
to determine the quantity of nitrogen tetroxide added to the sample bomb.
Since the adsorption of nitrogen tetroxide in Teflon is a slow process,
it was possible to take a large number of pressure-tlme readings after
the nitrogen tetroxide was introduced but before equilibrium was attained.
From these measurements, it was possible to derive both the zero time
pressure of the bomb (actually the gas density was used) and the diffusion
coefficient of nitrogen tetroxlde into the Teflon sheet. The equation
which describes the gas density in the bomb as a function of time is:
0o - P _ Po= i - 2p= 2 2
Po - P= n=l Po - Po p= + P=qn
Dqn t(8.1.3)
exp £2
v
8-4

I 7
=__
L
7 -
where:
0 = density of gas in the bomb at any time, mg/cm 3
p = unknown zero time density, mg/cm 3o
p_ = equilibrium density in the bomb, mg/cm 3
= half thickness of the sheet, cm
D = unknown diffusion coefficient, cm2/sec
t = time, sec
qn = all non zero positive roots of the equation
qn0_
tan qn = Po - 0_(8.1.4)
A generalized least squares method was applied to the pressure-time data
for each test and the best estimate for 0° and D were obtained.
Figures 8.2 and 8.3 show data for two nitrogen tetroxide/TFE runs
at different temperatures. The solid curve in each Figure was calculated
from the best 0° and D while the circled points are the experimental
data.
8.2 Permeation Tests
Two types of permeation tests were conducted during this study.
The unidirectional tests were conducted by admitting the same gas or
vapor to each side of a membrane but at approximately a i0 psi pressure
difference. The counter diffusion tests were conducted with nitrogen
or helium on one side and nitrogen tetroxide on the opposite side of
the membrane at a near zero pressure differential. The method of
operation and the method of data reduction differed for the two types
of tests and thus are described separately.
w
8-5

w
0
m !
d d
|
d
o
oo
o
! °°_zo
r_ C
_.g _f_o
¢M
0
8-6

rL
E
E
!
E
z
B
0
_ o0
I 0 _ 0 00 0 _ __ _ _ 0 _ II
o
0 _ _
o __ _ _
II II tl
_ o 8
0
z
0
oo/gm ',(:)$sua(I _O;_N
8-7
o_O,1
r,O
I
0o__O
4-J
o_0 0
O9_J
0
1.1
zI.M0
°°_4.1
0
QI
"1"4
0
e,i
L_
w
l
m
m
w
a__
v
8.2.1 Unidirectional Permeation
The unidirectional permeation of a single gas, vapor or liquid
through a membrane is widely measured and reported in the literature.
Many designs of cells are described which produce scientific data,
comparative data or go-no go results. The tests conducted as a part
of this study were designed to provide scientific data and in particular
the permeation constant defined by
Q= pAAP£ t (8.2.1)
where:
Q = quantity passed through the membrane in time (t), CC(STP) or g
CC(STP)cm gcmP = the permeation constant, 2 or 2
sec cm atm sec cm atm
AP = pressure difference across the membrane, atm
£ = membrane thickness, cm
2A = active area, cm
t = time, sec
A diagram of the unidirectional permeation apparatus is given in
Figure 8.4. The fill lines and vacuum lines and associated valving were
omitted for clarity. The test procedure consisted of the following
steps:
i. The bypass valve was opened and the cell and transducers were
thoroughly degassed under vacuum.
2. The test gas or vapor was introduced to the cell until the
desired total pressure of the test was reached. In most tests
one side of the cell was initially at vacuum and this step was
eliminated.
3. The bypass valve was closed and additional gas was introduced
into the high pressure side (left side in the Figure) until
the desired initial AP was established.
z
8-8

L
L_
m
Pressure Transducer
I AP Transducer
Jlt
--- Membrane
Permeation Cell]
Supply Tank
Remote Valves Bypass Valve
Figure 8.4 Unidirectional Permeation Apparatus
8-9

L--
r===
D
L
w
U_
w
, The supply gas valve was closed and both the absolute pressure
and the differential pressure were recorded as a function of
time. Normally the tests were terminated when the differential
pressure was one-half to three-fourths of its initial value.
As in the case of the adsorption bomb tests described previously,
the data reduction method for nitrogen tetroxide was different than the
method for the permanent gases. When the change in differential pressure
is small, it is possible to select an average AP and to obtain the
permeation constant by an algebraic solution. However, when AP changes
are large during the test and when a statistical treatment of the data
is desired, the differential equation must be solved. For the permanent
gases which obey the ideal gas low a closed form solution was obtained
when :
£n AP = £n A pO _ RTA_____t(i + &)pM£ VH VL
(8.2.2)
AP = differential pressure at any time, arm
AP ° = differential pressure at the start of the test, atm
R = gas constant, 82.054
M = gas molecular weight
T = temperature, OK
3cm arm
g mole OK
2A-- active cross-sectional area, cm
g = membrane thickness, cm
t - time, sec
3
VH = volume on high pressure side, cm
3
VL = volume on low pressure side, cm
P = permeability constant, _ cm2
sec cm arm
The best value of p is determined by a least square treatment of the AP
vs t data derived during the test.
8-10

L
L_
=
r
L
r
For nitrogen tetroxide in which dissociation is a function of
temperature and pressure, a closed form solution was not found. The
differential equation which defines the permeation is the following:
dm
dt A I C2(_- m) + [2 C2(_ - m) + 1] 1/2Cl
-C3(_ + m)- [2 C3( _ + m)+ 111/2 1 (8.2.3)
where:
CI = Kp/8
4RT
C2 = 46.008 VH KP
4RT
C3 = 46.008 VL KP
K = the equilibrium constant of dissociationP
PNO22
PN204
T = the absolute temperature, OK
VL = the volume of the low pressure side of the permeation
3cell cm
VH = the volume of the high pressure side of the permeation3
cell cm 3cm atm
R = universal gas constant, 82.054g mole OK
om L = the zero time mass on the low pressure side of the
membrane, g
omH = the zero time mass on the high pressure side of the
membrane, g
(8.2.4)
(8.2.5)
(8.2.6)
Various values of P are assumed and the equation is numerically
integrated. The value of P is selected which gives a least square
error of pressure difference as a function of time calculated from
the integrated values compared with the measured pressure differences.
8-11

-w
i
8.2.2 Counter Diffusion
The simultaneous counter diffusion of two gases through a membrane
with a partial pressure difference but no total pressure difference is
useful in determining whether interactions occur which affect permeation
rates. The experimental apparatus which was used for this testing is
shown in Figure 8.5. Again some accessory lines and valves were omitted
to provide clarity. The test involved a continuous flow of the two
gases from the supply tanks, through the cell and into or through the
sample bottles. By careful adjustments of the several valves, the flow
rate, the cell pressure and differential pressure were adjusted. After
sufficient time was allowed for equilibrium to be established, a sample
of each gas was taken for analysis.
In all cases the partial pressure difference was equivalent to the
absolute pressure of the cell and data reduction required only the
algebraic solution of the standard permeation equation
pA APQ = _ t (3.2.7)
where the terms were defined previously.
8-12

w
===
m
[]
m
Bm
m
m
m-E
L
m
Supply Tanks
Remote Valve
Isduc er
V1
/
[
Sample Bottles
AP Transducer
Membrane
Permeation Cell
Throttling Valves
Throttling Valves
To Vacuum
Figure 8.5 Counter Diffusion Apparatus
8-13

k_
9.0 RESULTS
There are three basic classes of engineering data which were obtained
during this study. Th_se classes are: primary (calculated directly from
the experimental measurement), secondary (calculated from the experi-
mental data but requiring assumptions relative to mechanism) and derived
(calculated from primary or secondary data). It is evident that
solubility is primary data, since the quantity of a gas which dissolves
in a unit volume of a material is directly measurable. However, the
Henry's Law constant (S) which is defined by
_m
k_
tw=#
where:
q = SP (9.0.i)
q = the quantity dissolved per unit volume (usually
CC(STe) or -m-3 3
cm cm
P = pressure, atm
S = proportionality constant
is secondary data which depends on the manner in which the solubilities
follow the assumed law over the pressure range of interest. Similarly
the diffusion coefficient computed from the transient adsorption data
and the permeation constant obtained from the permeation cell tests
represent secondary data. Examples of derived data include S, D or P
calculated from the other two using the equation
where:
p = DS (9.0.2)
p= permeability constant,CC (STP) cm
2see cm atm
D = diffusion coefficient, cm2/sec
S = Henry Law constantCC(STe)
3atm cm of Teflon
9-1

L. =
r
M
N
K..,
=_
!@L
7---
Thus, it should be noted that the engineering data required for the
analysis of bladder leakage which was obtained as a result of the
experimental effort is all of the secondary and derived types. In
some cases the theory was found to be only marginally applicable and
extrapolation of data outside of the range of measurement must be
considered a dangerous practice.
9.1 Solubility Data
Henry's Law constants (S) were obtained from the bomb tests for
nitrogen, helium and nitrogen tetroxide in polytetrafluoroethylene (TFE)
and tetrafluoroethylene-hexafluoropropylene copolymer (FEP). Numerous
attempts were made to obtain solubility data for hydrazlne vapor but
the gas phase decomposition was sufficiently rapid in the Cres steel
(Types 316) apparatus to prevent meaningful data from being obtained.
For both nitrogen (N 2) and helium (He), S was found to be inde-
pendent of pressure over the range of pressure investigated and could
be fit to the usual Arrhenlus type equation for temperature with an
apparent accuracy of about _ 10%. Nitrogen tetroxide (NTO) data showed
that S increased with increasing pressure but over the pressure range
studied (i.e., about one-tenth to one-half the vapor pressure) an
average value was selected which represented the data within about +__25%.
Figure 9.1 shows an example of the nitrogen tetroxide solubility
data. The Henry's law constants which best represent these data give
the straight lines which cross the data. Clearly the curved lines
represent the data more accurately.
The equations for these curves are:
NT0/TFE q = 3.42 x 10 -3
NTO/FEP
1.36p g/cm 3 (9.1.1)
(9. I. 2)1.59
q -- 1.84 x 10 -3 p g/cm 3
These equations represent the experimental data within +2%.
defined as dq/dP, then
NT0/TFE
NTO/FEP
S = 4.65 x 10 -3 p0.36 g/arm cm 3
S = 2.93 x 10⁻³ p0.59 g/arm cm 3
If S is
(9.1.3)
(9.1.4)
9-2

L
m
= --
r7
L -
3O
25
2O
O
"- 15
4_
,-4
-r4
I0O
Cn
-.T
O
('4
_m
TFE
FEP
| !°o 1 2 _
Figure 9.1
Pressure, atm
Nitrogen Tetroxide Solubility in Teflon
at 160 +5°F
L 9-3

w
w
H
W
w
w
[]w
u
m
However, average values for S in the experimental range were used. These
data were fit to an Arrhenius type equation to provide a good representa-
tion of the effect of temperature. The experimental data are summarized
in Table 9 in the form of Arrhenlus type plots which represent the
experimental data to approximately the indicated accuracy.
Table 9-1
Henry's Law Solubility Constants
N2/TFE (_ 10%)
1500 3
S = 6.6 x 10 -4 exp _ CC(STP)/atm cm4-30 atm
25-i00°C
N2/FEP (_i0%)
900 3S = 4.2 x 10⁻³ exp _--_CC(STP)/atm cm 8-30 atm
25-i00°C
He/TFE (_10%)
1400 3S = 2.5 x 10⁻⁴ exp _ CC(STP)/atm cm 6-30 atm
25-i00°C
He/FEP (+__10%)
ii00 3S = i.i x 10 -3 exp _ CC(STP)/atm cm
8-25 atm
25-i00°C
NTO/TFE (_25%)
3300 3S = 3.4 x i0 -7 exp T--_--K g/arm cm
NT0/FEP (_25%)
10-73600 3
S = 1.2 x exp _--A-G--vg/atm cm
9-4

F_ 4
i
I
w
W
z
W
I
w
[]
w
i
II
w
i
!
9.2 Diffusion Coefficients
Diffusion coefficients for gases and vapors in teflon were obtained
both as secondary data and derived data. In this section only the
secondary data, namely those obtained from the bomb tests, are discussed.
Data were obtained for both nitrogen and nitrogen tetroxide with TFE
and FEP. With helium the adsorption was so rapid, useful data points
were not recorded and hydrazine vapor decomposed as discussed previously.
Data for nitrogen diffusion were derived point by point and
Figure 9.2 shows the adsorption curve for one test and the calculated
point by point diffusion coefficients for this test and also for a
duplicate test. The data were generally within _20% of the mean value
for each temperature.
Data for nitrogen tetroxlde diffusion required a computer solution
due to the dissociation reaction. These data are given in Tables 9-2
and 9-3 for TFE and FEP respectively. There appears to be some pressure
dependence for D, particularly in the NTO/TFE system, but the scatter
is sufficient to limit this to an observation only. The high temperature
tests generally contained an insufficient number of data points in each
test to provide high confidence in any specific value of D. However,
the 3_ deviations are given to indicate the conformity of the data from
each run to the best value of the calculated diffusion coefficient.
The NTO/TFE data (except for the one point at lO0°C) were fit to an
Arrhenius equation which was then evaluated at the four test temperatures.
The results given in Table 9-2 show that most data points are within
+50% and the worst is about a factor of 3 from that best fit to the
Arrhenius equation. The NTO/FEP data given in Tables 9-3 show less
scatter. The lower scatter in the data is attributed to the lower value
for D which permitted a larger number of data points to be taken during
each test. For NTO/FEP the data generally is within +20% and the worst
point is less than a factor of 2 from the best fit to the Arrhenius
equation.
The diffusion coefficient data obtained from the adsorption bomb
test and the indicated accuracy are summarized in Table 9-4.
9-5

t z
L_
F==_
H
w
W
mm
W
m
m
W
[]w
z
J m
w
O
O
O
O
O
XO
oo
O
O
o_s/ mo _s_ueToT_oo0 uoTsn$_Te
9-6
AI4 '_nd_no Ioonpsue_I

=2
L=
i
B
W
m
@
m_
v
Table 9-2
Experimental D for NTO/TFE
Temp. °C P ave_ atm D x 108 , cm2/sec
27 .15 2.86 + .20
27 .25 4.77 + .63
28 .3 5.98 + .63
73 1.4 30.4 _+ 4.0
73 2.2 33.7 + 6.4
73 2.9 38.8 + 1.4
74 3.5 66.3 + 4.4
96 5.8 156 + 6
96 7.5 ll3 + ll
96 8.7 137 + 14
96 9.7 186 + 3
96 8.0 87
i00 3.3 77 + 13
i00 4.3 63 + 5
i00 5.1 152 + 560
i00 5.8 34 + 2
Calculated from Arrhenius Equation
27 4.5 x 10 -8 cm2/see
273 38 x 10 .8 em /sec
296 90 x 10-8 cm /sec
2I00 i00 x 10-8 cm /sec
Remarks
15 data points
14 data points
12 data points
8 data points
5 data points
5 data points
5 data points
4 data points
4 data points
5 data points
4 data points
2 data points
4 data points
4 data points
4 data points
(deleted)
4 data points
9-7
v
v
L=:
z_
w
r==*
v
Table 9-3
Experimental D for NT0/FEP
1081 2Temp. °C P ave, arm D x cm /sec
26 0.3 0.90 + .14
28 0.3 0.81 + .13
29
76
77
77
78
78
92
92
93
94
95
0.2 0.97 + .07
2.3 19.8 + 2.4
4.4 19.9 + 3.3
4.9 36.1 + i.i
3.2 17.9 + 1.9
3.9 21.2 + 2.5
2.3 40.3 + 6.3
4.1 41.6 + 4.2
5.8 53. + 15
7.2 70. + i0
8.4 54 + II
Calculated from Arrhenius Equation
28 0.8 x 10 -8 cm2/sec
77 20 x 10 -8 cm2/sec
93 50 x 10-8 cm2/sec
Remarks
Uncertainty in final
Temperature measure-
ment, 9 data points
16 data points
5 data points
6 data points
5 data points
7 data points
5 data points
6 data points
5 data points
4 data points
3 data points
6 data points
9-8

Table 9-4
Diffusion Coefficients
_7
r "
L
N2/T_ (±20z)
4500 2D = 0.83 exp -_-_-- cm /sec
3 - 30 atm
25 - i00 °C
N2/FEP (±20%)
4000 2D = 5.5 x l0 -2 exp - T---d_-K cm /sec i0 - 25 atm
25 - i00 °C
NT0/TFE (+--50%)
24800 cm /see
D = 0.40 exp T 0.1 - 0.4 v.p.
25 - 100 °C
NT0/FEP (!20%)
D = 56 exp 6800 2-_ cm /sec 0.2 - 0.4 v.p.
25 - lO0 °C
w
9-9

v
v
--=
° .
9.3 Permeability Constants
Unidirectional permeation measurements were made with helium,
nitrogen and nitrogen tetroxide through TFE and FEP membranes. The
results of these measurements are given in Table 9-5. The helium data
gave permeability constants that were independent of total pressure
and differential pressure and were a function of temperature only.
Except for two tests, nitrogen gave similar results.
The nitrogen tetroxide data presents a more complicated picture.
The calculated permeability constants in both TFE and FEP show no
clear dependence on temperature but are strongly influenced by the total
pressure. The pressure dependence was computed by least squares and
gave the following relationships:
i0 I0NTO/TFE px = 5 + 8 P atm = 23 x 10 -10g cm
2sec atm cm
NT0/TFE px i0 I0 = 3.7 + 2.3 P atm g cm
2sec atm cm
c = 1.8 x i0 -I0
Clearly in the case of NT0/TFE, the data have excessive scatter as
indicated by the high value of c and the equation cannot be used with any
confidence. Additional testing at high pressure is required to define
more accurately the pressure dependence.
Counter flow permeation measurements were made with helium and
nitrogen tetroxide through TFE and FEP. These data are presented in
Table 9-6 in the same format and order as the unidirectional data of
Table 9-5. The permeability data for all systems including nitrogen
tetroxide appear to have a tendency to increase with increasing tempera-
ture. There are a sufficient number of exceptions to limit this to an
observation only.
The counter diffusion data generally shows that helium permeates
more rapidly by a factor of 2 or 3, nitrogen tetroxide permeates more
slowly at low pressure by a factor of 2 to 5 and nitrogen varies in
both directions within a factor of about 2.
9-10

: ±
w
v
Table 9-5
Experimental Unidirectional Permeation
Temp, °C P ave, atm AP, atm
He/TFE
23 0.6 0.6
23 3.3 0.6
65 0.6 0.6
74 18.3 0.6
86 1.4 0.8
He/FEP
21 17.5 0.2
39 0.3 0.2
39 0.7 0.7
60 18.9 0.7
65 0.6 0.6
90 0.8 0.8
N2/TFE
29 4.7 0.7
38 0.6 0.6
69 0.6 0.6
69 5.8 0.7
77 19.3 0.7
90 0.7 0.7
CC(STP) cmP' 2
sec cm atm
3.4 + 0.01 x i0 -7
3.4+0.1
8.1+0.4
7.9+0.1
8.2+0.6
2.5 + 0.2 x i0 -7
2.8 + 0.02
2.7 + 0.2
4.3 + 0.i
4.8 + 0.5
9.8 + 0.5
1.5 + 0.2 x I0 -8
1.7 + 0.7
6.1+0.1
9.8+0.7
8.5+0.5
1.4+0.1
9-11

fi :
L
J
=
_ I
m
L_
v
r
w
Table 9-5 (cont.)
Temp, °C P ave, atm AP, atm
N2/FEP
35 5.6 0.7
37 O.3 0.2
38 17.6 0.6
39 5.1 0.7
40 1.1 0.7
62 0.7 0.7
62 19.3 0.7
85 17.8 O.7
91 0.5 0.5
NT0/TFE
26 0.6 0.6
60 0.7 0.6
61 4.9 0.5
64 0.5 0.5
85 O.6 O.6
87 7.9 0.7
NT0/FEP
25 0.5 0.5
64 5.2 0.6
65 0.5 0.5
84 0.5 0.5
84 8.1 0.5
9-12
CC (STP) cmP, 2
sec cm atm
2.2 + 0.5 x l0 -8
0.8+0.3
ll.2 + 0.3
1.7+0.8
0.5+0.1
3.2+0.3
4.7+0.4
7.1+0.8
10.3 + O.2
cmP' 2
sec cm atm
5.1 + 0.5 x lO -lO
7.9+0.5
84. + 1
4.7+0.1
6.2+0.4
45. + 8
5.1 + 0.8 x lO -lO
18 + 1.5
3.4+0.6
4.9+0.1
21 + 0.3

w
Table 9-6
Experimental Counter Flow Permeation
Temp, °C P ave, atm AP, atm P, CC(STP) cm2
sec cm atm
He/TFE
25 0.3 0.6 9.2 x 10 -7
62 1.0 2.0 23.
87 0.6 1.3 26.
89 1.0 2.0 27.
He/FEP
25 0.3 0.7 8.7 x 10 -7
30 0.3 0.7 1.3
88 0.3 0.7 8.9
88 0.6 1.3 7.6
88 1.0 2.1 16.
N2/TFE
25 0.3 0.7
87 0.6 1.3
87 1.0 2.0
N2/FEP
88
12 x 10 -8
(quest ionable
analysis)
2.3
3.8
1.0 2.0 13. x 10 -8
9-13

=
Lm
7--
k... _
_m
L
%..
Temp, °C
NT0/TFE
25
25
62
87
87
87
89
NT0/FEP
25
30
88
88
88
88
P ave, atm
0.4
0.3
1.0
0.6
1.0
0.6
1.0
0.3
0.3
0.3
0.7
1.0
1.0
Table 9-6 (cont.)
AP, atm
0.8
0.7
2.1
1.3
2.0
1.3
2.0
0.7
0.7
0.7
1.3
2.1
2.0
9-14
_ _ cm2
sec cm atm
0.29 x i0-I0
0.42
2.4
0.96
1.25
1.67
3.1
0.18 x I0 -I0
<0.i
0.78
< 0.09
1.03
1.35

f
A review of all the experimental and analytical steps involved in
making the permeability measurements showed no clear reason for the
variability of the data. The least squares determination of the uni-
directional permeation data for nitrogen tetroxide reported in Table 9-5
(see Section 8.2) showed that p is not constant but decreases during
each run. The reported values are the best constant which fits the
data over the pressure range for each test. It was estimated from the
apparent pressure sensitivity that p would not vary by more than about
20% during any test. The effect on the tabulated data would probably
be small since an average pressure, rather than the final, pressure
was reported. Table 9-7 summarizes the permeability results and
indicates the range of conditions over which the data were obtained.
w
9-15

=
r---
=
Table 9-7
Permeation Constants
He/TFE
Pu
0.88 x i0-4 1650 CC(STP)cmexp - TOK 2
sec cm atm
Pc = 9 to 27 x 10 -7CC (STP) cm
2sec cm atm
He/FEP
1950Pu = 1.5 x 10⁻⁴ exp - _-O-_
CC(STP)cm
2sec cm atm
Pc
= 1.3 to 16 x 10-7 CC(STP)em2
sec cm atm
N2/TFE
Pu = 2.0 x 10⁻² exp
Pc = about 3 x 10 -8
4300 CC(STP)cm
T 2sec cm atm
CC(STP)cm
2sec cm atm
N2/FEP
Pu -- 2.4 x 10 -2 exp
Pc = about 13 x 10 -8
45OO
TOKCC(STP)cm
2sec cm atm
CC(STP)cm2
sec cm atm
NT0/TFE
= i0 -I0Pu about 6 x
gcm
2sec cm atm
= i0 -I0Pc 0.3 to 3x
cm
2sec cm atm
0.5 - 18 atm
20 - 90°C
0.3 - i atm
25 - 90°C
0.3 - 19 arm
20 - 90°C
0.3 - i atm
25 - 90°C
0.6 - 19 arm
30 - 90°C
0.6 - i atm
85°C
0.3 - 19 atm
35 - 90°C
1 atm
90°C
0.6 atm
25 - 90°C
0.3 - I atm
25 - 90°C
L_
9-16

Table 9-7 (Cont.)
NT0/FEP
Pu = about 5 _ _i0-I0 g cm2 0.5 atmsec cm arm 25 - 90°C
= i0-i0 g cmPc 0.2 to 1.4 x 2sec cm arm
0.3 - i atm
25 - 90°C
Pu = permeability constant from unidirectional tests
Pc = permeability constant from counter flow tests
9-17

l
r i
i
%,.-
9.4 Summary of Results
The preceding sections presented the experimental results separately
for each type of test conducted during the experimental program. In this
section the complete data generated by the experimental program is inter-
compared and then compared with the available literature. Since only
permeability constants were found in the literature, it is most convenient
to examine all data in terms of the permeability constant. This constant
for many flow geometries is directly proportional to the leakage rate.
9.4.1 Helium Permeation
Helium permeation data are available from the experimental program
for both counter diffusion and unidirectional permeation through TFE and
FEP. Since diffusion coefficients for helium could not be measured during
the adsorption tests, there is no permeation data derived from the SD
product.
Stern et al (Reference 18) give an Arrhenius type equation for
helium permeation in FEP which applies over the measured range of 0.i to
4 atm and 25 to 100°C. Their equation reduces to the following:
2400 CC(STP)cmPHe _ 1.4 x 10⁻³ exp T 2
sec atm cm
In an earlier article, Stern et al (Reference 19) gave data for helium
permeation in TFE in graphical form over the same temperature range.
Graphical data from duPont was also reported by Redel (Reference 22) in
the same temperature range.
The only other data found for helium permeation of Teflon is from
Rocketdyne (Reference 21) where data is given for a mixed sheet of TFE
and FEP and for TFE sheet containing aluminum flakes. This cannot be
readily compared with data for pure materials.
All the available permeation data are summarized in Figure 9.3.
The literature values are represented by the solid lines and the least
square fits of the unidirectional permeation data are represented by the
9-18

k
L
w
H
r_
w
m
D
H
10-_
4J
4_
or_
,H
.H
]04
Helium Permeation
e FEP unidirectional
O FEP counter flow
TFE unidirectional
• TFE counter flow
T, °C
80 60 40 20
I/T°K x 103
Figure 9.3 Experimental Permeation of Helium
9-19

w
fmq
J
L ,
=
w
w
i W
w
=
dashed lines. The actual unidirectional data are shown as open circles
and triangles and the counter flow data by the corresponding filled
symbols. The literature data is in good agreement with the data obtained
during this study.
9.4.2 Nitrogen Permeation
Nitrogen permeation data are available from the experimental
program for both counter diffusion and unidirectional permeation through
TFE and FEP. It also was possible to compute the S.D product for both
TFE and FEP from the data measured in the adsorption bomb tests, namely:
10-4 3000 CC(STP)cmN2/TFE S'D = 5.5 x exp - _ 2
sec atm cm
3100 CC(STP)cmN2/FEP S'D = 2.3 x 10⁻⁴ exp T 2
sec atm cm
Stern et al (Reference 18) give an Arrhenius type equation for nitrogen
permeation in FEP which is applicable at pressures from 0.i to 4 atm at
temperatures from 60 ° to 100°C. Below 60°C it is applicable at low
pressures and higher, at least as high as 4 atmospheres if sufficient
time is allowed for equilibrium to be attained. At room temperature
the times required for equilibrium appears to be of the order of a few
hours. Their equation reduces to the following:
p= 3.2 x 10⁻³ exp - 3600 CC(STP)cmT 2
sec atm cm
In an earlier article Stern et al (Reference 19) gave data for nitrogen
permeation in TFE in graphical form over the range 25 to 90°C. No
mention was made of pressure dependence at low temperature with TFE.
Lebovits (Reference 17) gave a value of 1.6 x 10 -8
CC(STP)cm/sec atm cm 2 for the permeation constant of nitrogen through FEP
at 20 to 30°C and Rocketdyne reported a value of 4.6 x 10 -9
2CC(STP)cm/sec atm cm at 21 to 24°C. Graphical data from duPont for
nitrogen permeation of FEP over the temperature range of 0 to 100°C was
reported by Redel (Reference 22).
9-20

w
L =
w
w
W
4
W
W
!-m__
These data are summarized in Figure 9-4. The literature data are
represented by solid lines, the least square fits of the unidirectional
permeation data obtaimed during this study are represented by dashed lines
and the SD products are shown by dotted lines. The unidirectional and
counter flow data points are shown in the figure as open and filled symbols
respectively. The literature data and those data obtained during this
study are in good agreement. In view of the discussion of Stern (Refer-
ence 18) of the long times required for N2/FEP to reach equilibrium at
pressure as high as 4 atmospheres and at temperatures below 60°C, the
unidirectional data at 35 to 40°C should be noted. These data range from
25 x l0-9 to 1.1 x l0 -7 CC(STP)cm/sec atm cm for average pressures ranging
from 0.3 to 18 atmospheres. The highest value taken at 18 atm was not
included in the curve fit which is believed to represent the equilibrium
values. Considering the probable precision of the experiments, it is
likely that this point represents a nonequilibrium value of the perme-
ability constant.
9.4.3 Nitrogen Tetroxide Permeation
Nitrogen tetroxide permeation data were obtained in the experimental
program for both unidirectional and counter flow through TFE and FEP.
Since the adsorption tests provided both solubilities and diffusion
coefficients, it was also possible to obtain the corresponding SD product
S-D = 1.4 x l0-7 exp1500
T
3200 __K cmNTO/TFE S'D = 6.7 x l0-6 exp T 2
sec atm cm
namely :
NTO/TFEg cm
2sec atm cm
The literature also provided some permeation data but these data
were available at only one or two temperatures and in a form which requires
assuming the differential pressure to derive the permeability constant.
JPL (Reference 20) reported the results of a test at 20°C through a i0 mil
teflon film (assumed to be TFE) which showed an equilibrium leakage rate
of 5.6 x 10⁻⁴ g/ hr in 2. From the nature of the experiment, it was
possible to estimate an equilibrium permeability constant of
i0-i0 26.5 x g cm/sec atm cm .
_ 9-21

El
w
.. rFE(Ref 19)
"TFE(s-D)
FEP
(Ref 18, 22)\ -.\
\.'x TFE (TRW)
\ FEP (S.D)
\" FI_ (r_)
Nitrogen Permeation
@FEP unidirectional
e FEP counter flow
£ TFE unidirectional
ATFE counter flow
®FEP from Ref. 21
_--_FEP from Ref. 17
T$ °C
80 60 40 20
Figure 9.4
I/T°K x 103
Experimental Permeation of Nitrogen
9-22

zE 7
v
=
L_w,
i
=
W
7--E
i
i
v
Redel (Reference 22) reported leakage rates of 1.7 to 4.7 x 10 -2
g/hr in 2 through single 2 rail sheets of FEP at 24°C and 7 x 10 -3 g/hr in 2
through double 2 mil sheets of FEP. These leakage rates permitted
permeability constants to be calculated ranging from 3.0 x 10 -9 to
21.0 x 10⁻⁸ g cm/sec atm cm .
Rocketdyne reported the results of a large number of tests using
several test procedures and several pure and composite samples. The data
for pure materials are given in Table 9-8 together with the calculated
permeability constants.
Table 9-8
NTO Permeability (Reference 21)
Material T,°C Q/A, Ibs/hr in 2 p calc, g cm/sec atm cm 2
i0 rail FEP 74 6.76 x 10⁻⁵ 4.0 x 10 -9
i0 rail FEP 74 6.13 x 10⁻⁵ 3.7 x 10⁻⁹
i0 mil FEP 74 13.7 x 10⁻⁵ 8.2 x 10 -9
i0 mil FEP 74 13.6 x 10 -5 8.2 x 10⁻⁹
15 rail TFE 74 4.67 x 10 -5 4.2 x 10 -9
15 rail TFE 25 0.29 x 10 -5 2.2 x 10 -9
i0 mil FEP 21 0.43 x 10⁻⁵ 8.0 x i0 -I0
All nitrogen permeability data obtained to the experimental program
and calculated from the literature are given in Figure 9.5. The uni-
directional and counter flow data were discussed in detail in the previous
section but it is more evident from the figure that unidirectional tests
gave permeation constants up to an order of magnitude higher than the
counter flow tests. The S.D product, shown by the dotted lines is in
better agreement with the unidirectional data as would be expected from
the nature of the adsorption test. Most of the literature values gave
results higher than all but the high pressure unidirectional tests of
this study. It was not always possible to determine whether the litera-
ture test represented counter flow or unidirectional. The JPL data and
apparently the Redel data and some of the Rocketdyne data are counter flow
9-23
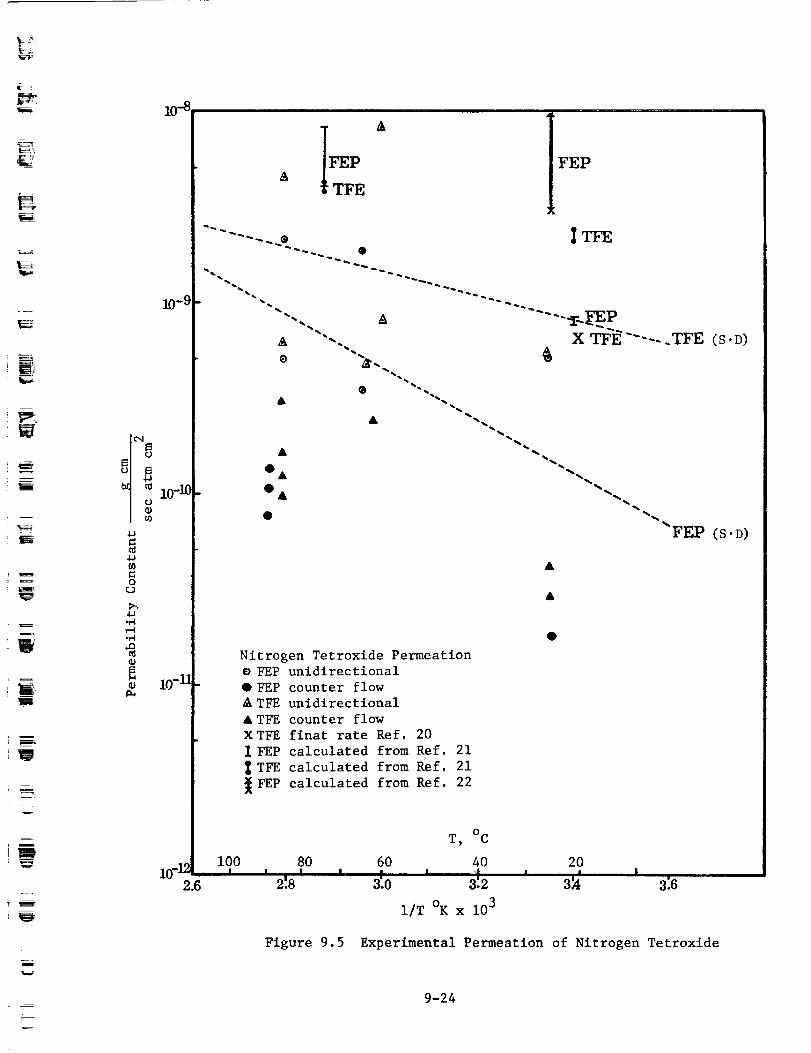
°
L-A
L=_
W
Ii
l'
i0-_
10--_
_i 10-10
4-J
{d
f_
oF,D
.,-4
,-I
_ 10-11
2.6
FEPTFE
A
FEP
"'-.... A
&
X TI_F.'----.TFE (S.D)
" FEP (s.D)
Nitrogen Tetroxlde Permeation
e FEP unidirectional
O FEP counter flow
A TFE unidirectional
• TFE counter flow
X TFE finat rate Ref. 20
I FEP calculated from Ref. 21
TFE calculated from Ref. 21
_FEP calculated from Ref. 22
I00 80 60
' ' 2'.8' ' _o
Figure 9.5
T, °C
4O
i!2I/T OK x 103
2O
3_4 3:6
Experimental Permeation of Nitrogen Tetroxide
9-24
results. The high permeation rate data of Rocketdyne at 74°C are
apparently counter flow but the remainder may be unidirectional. In all
cases, t_ae literature data seems to have liquid nitrogen tetroxide rather
than vapor in contact with the membrane and therefore the test pressures
at each temperature were above those of this study.
m
_w
w
v
u
i
z
v
w
9.5 Leakage Through Holes
A final part of the test program involved counter flow tests with
a laminated sample containing a selected hole area. The sample was made
from i mll aluminum foll containing i00 ten mil diameter holes spaced on
O.1 inch centers of a i0 by i0 square pattern. To this foll I0 mils of
TFE and FEP were applied to opposite faces. The sample was placed in the
permeation cell and run in the counter diffusion mode with nitrogen
tetroxlde on the TFE side of the sample and helium on the FEP side.
During the first of three tests, the sample was evacuated at 187°F
and when thoroughly degassed nitrogen tetroxide vapor and helium gas
were introduced to a total pressure of 145 psla on each side of the
sample. The cell was closed off and after 2 hours the gases on each side
of the membrane were withdrawn for analysis. This test gave a helium
leakage rate of 1.5 x 10⁻⁵ CC(STP)/sec, but an undetectably low concentra-
tion of NO 2. Equilibrium clearly was not attained during this time
period.
The two later tests were conducted with a modified procedure. After
evacuating the sample, the nitrogen tetroxide and helium were slowly
flowed past the membrane at approximately the pressure to be used during
the test. After a period of several hours, the cell was closed off as
in the first test and allowed to remain for the specified test duration.
The gas from each side was withdrawn for analysis as in the first test.
Helium analyses in nitrogen tetroxlde were by a gas chromatographic
method with nitrogen as a carrier gas and nitrogen tetroxlde analyses in
helium were by an infrared technique.
9-25

_k
z
l
! .....
q
The results of these tests are as follows:
Temperature, °C
Pressure, atm
Flow time, hours
Test time, hours
Helium leak rate, CC(STP)/sec
Nitrogen tetroxlde leak
rate g/sec
Test 2 Test 3
86 93
9.9 4.9
6 2
64.5 44
8.6 x lO-8 1.6 x lO -5
3.1 x lO -8 1.6 x lO -8
The membrane was not inspected between tests, but at the conclusion
of the tests the laminated sample was removed and examined. Several
changes had occurred. The membrane was supported on the TFE side by a
screen and on the FEP side by a porous metal sheet so that gross move-
ment due to momentary pressure differentials was restrained. Neverthe-
less, at some time during the test series sufficient movement occurred
to tear the aluminum foil near the flange. This may have occurred when
flow rates were being adjusted at the start of Test 2 or Test 3, or
possibly when the gas samples were taken at the end of any of the three
tests. At any rate, the time at which this additional leakage path
through the barrier occurred cannot be determined.
Another change also was evident. There was complete separation of2
the TFE and aluminum over the full 45.5 cm area of the sample. This
separation could have occurred at any time during the test series, but
it is likely to have occurred during the initial test either during
evacuation or during depressurization as the gas samples were withdrawn.
Thus, very likely Tests 2 and 3 were made with only the FEP bonded to
the foil. The sample as received had a weak bond at the TFE-foil inter_
face. As in all the previous tests involving FEP membranes, the FEP
was considerably lighter in color after exposure to nitrogen tetroxide
but no significant effect was attributed to the bleaching. Earlier
laminated samples which had insufficient hole areas were tested in the
adsorption bomb with similar results relative to bleaching and delamina-
tion. It appears that improvements in bonding between TFE and aluminum
foil are necessary.
9-26

r
m
q--
m
V
i0.0 REFERENCES
i. Jost, W., Diffusion in Solids, Liquids, Gases, Academic Press Inc.,
New York, 1960. Third Printing with Addendum.
2. DeGroot, S. R. and P. Mazur, Non-Equilibrium Thermodynamics,
Intersclence Publishers Inc., New York, 1962.
3. Landau, L. F. and E. M. Lifshitz, Statistical Physics, Addison
Wesley Publishing Co., New York, 1960.
4. Sommerfeld, A., Thermodynamics and Statistical Mechanics, Academic
Press Inc., New York, 1956.
5. Johnson, R. L., "An Approximate Calculation of the Leakage Rate
Through a Laminated Bladder Structure When the Diffusion Barrier
is Faulted," TRW Systems Report No. EM 16-12, October 1966.
6. Johnson, R. L., "Diffusion Through a Hole in an Otherwise Impermeable
Boundary Between Two Semi-Infinite Slabs," TRW Systems Report
No. EM 16-13, October, 1966.
7. Tranter, C. J., Integral Transforms in Mathematical Physics,
John Wiley & Sons, Inc., New York, 1959.
8. Gradshteyn, I. S., and I. M. Ryzhik, Table of Integrals, Series,
and Products, Academic Press, New York, 1965, Fourth Edition.
9. Johnson, R. L., "A Study to Analyze the Permeation of High Density
Gases and Propellant Vapors Through Single Layer Teflon or Teflon
Structure Materials and Laminations, Design Guide," TRW Systems
Report 07282-0617-R000.
Milne-Thomson, L. M., Theoretical Hydrodynamics, The MacMillan Co.,
New York, 1961, Fourth Edition.
Copson, E. T., An Introduction to the Theory of Functions of a
Complex Variable, Oxford University Press, Amen House, London, 1960.
Chang, E. T., and N. A. Gokcen, "Thermodynamic Properties of Gases
in Propellants and Oxidizers, I. Solubilities of He, N2, 02, Ar, and
N203 in Liquid N204," Journal of Physical Chemistry, 70, 2394, 1966.
i0.
Ii.
12.
I0-i

m
i
m
wm
l
m
13. Johnson, R. L., "Leakage Through a Circular Hole in an Impermeable
Barrier Separating Two Soluble Phases," TRW Systems Report
No. EM 17-12, August, 1967.
14. Prutton, C. F., and S. H. Maron, Fundamental Principles of Physical
Chemistry, The MacMillan Co., New York, 1951.
15. Crank, J., The Mathematics of Diffusion, Oxford University Press,
London (1956)
16. Rickles, R. N., "Molecular Transport in Membranes," Ind. Eng. Chem.
58 (6) 19 (June 1966).
17. Lebovits, A., "Permeability of Polymers to Gases, Vapors, and
Liquids," Modern Plastics 43 (7) 139 (March 1966).
18. Stern, S. A., et al, "Helium Recovery by Permeation," Ind. Eng. Chem.
57 (2) 49 (Feb. 1965).
19. Stern, S. A., et al, "An Improved Permeability Apparatus of the
Variable - Volume Type," Modern Plastics 42 (2) 154 (Oct. 1964).
20. Bauman, A. J. and C. H. Stembridge, "A Continuous-Recording Auto-
matic Permeameter, with Application to the Permeation of Nitrogen
Tetroxide Through Teflon," JPL Space Programs Summary, No. 37-30,
Vol. VI, p. 206.
21. Settle, J. P. and F. T. Schuler, "Permeation Tests of Candidate
Gemini Oxidizer Expulsion Bladder Materials at Temperatures in the
Range 15 - 165°F, '' Rocketdyne Report MPR 3-253-020 (18 Feb. 1963).
22. "Teflon Sandwich Permeability Studies, Final Report," Redel
Report RI #520-339-Final (14 Oct. 1963).
23. "Storable Liquid Propellants N_trogen Tetroxide/Aerozine 50,"
Aerojet Report No. LRP 198 (June 1962).
v
10-2

7
L •
i
DEqm_
J
lE
Appendix A
Consider a laminated bladder structure separating two infinite half
spaces. The upper half space contains gas, the lower liquid, and the
laminated structure consists of two layers of material permeable to the
pressurant gas separated by an impermeable barrier which has one circu-
lar hole in it. We wish to determine the leakage rate of the gas
through the bladder and into the liquid taking into account the effect
of the gas and liquid spaces. Let Pl be the partial pressure of the
pressurant gas in the gas mixture, cI the concentration (in mass fraction)
of the gas in the first layer of Teflon, c2 that in the second layer,
and c3 its concentration in the liquid propellant. Then from figure
(A.I) x
V2pl - 0 , x > h
V2Cl _ 0 , 0 < x < h
V2c2 = 0 ,-b < x < 0
V2c 3 = 0 , x < -b
Barrier
_r
Gas
x -- +h
Material i
- x= 0
Material 2X _ --b
Liquid
Figure A.1
Instead of Pl we solve for _ = Po - Pl where Po is the total
system pressure. Since Pl goes to p at distances far removed from the
(x2+r2)i/2opening, @ vanishes for large . In cylindrical coordinates*
_r 2 r _x 2
(A. l)
The Hankel Transform of zero order of eq. (A.I) gives
d2_(k'x) - k 2 @(k,x) = 0
dx 2
as the equation satisfied by the Hankel Transform of @(r,x).
solution which vanishes for large _x 2 + r2 is
(A.2)
The
2
i-
*We assume a circular shaped hole for convenience.
however valid for holes of any shape.
A-1
The results are

7
L
E_
_(k,x) = Al(k)e-kX (A.3)
where, of course, Al(k) is an unknown function of k. Forming the
Hankel inversion and using the definition of _(r,x) gives
I_ kAl(k)e-kXPl (r'x) = Po - Jo(kr)dk , x > h (A.4)o
For the Hankel Transform of cl(r,x) we find in the same manner
Cl(k,x ) = A2(k) cosh kx + A3(k) sinh kx (A.5)
with inverse,
fcl(r,x ) = kA2(k) cosh kx Jo(kr) dko
w
I
i
!
w
i __
+ | kA3(k)__ sinh kx Jo(kr) dk , 0 < x < hIo
(A.6)
The boundary conditions which must be satisfied at x = h are
and
cl(r,h ) = KlPl(r,h ) (A.7)
_cl(r,h) M D= _ _Pl (A.8)PlDI _x RT Bx
In the first equation KI is the solubility of pressurant gas in material i
while in the second Pl is density of material 1 and D1 is the diffusivity
of pressurant gas through material I. Also M is the molecular weightg
of the pressurant, D the binary diffusion coefficient for the mixtureg
of pressurant gas and propellant vapor, R is the gas constant and T
the gas temperature. Applying eqs. (A. 7) and (A.8) to equations (A.4)
and (A.6) we obtain from (A.7)
A-2

tJ
_J
w
P
m
E
Ev
v
E
J_
kA2(k) cosh kh Jo(kr) dk + kA3(k) slnh kh Jo(kr) dk
I_kA I e-kh= Klp ° - K I (k) J (kh) dko(A.9)
and from (A.8)
[_o k2A2 (k) S_ k2A3(k) k1OD I sinh kh J (kr) dk + cosh kh J (kr) dO Oo
M D I_ k2Al k)e -kh= _K_K ( J (kr) dkRT o o
(A.10)
These equations hold for all r. We may, therefore, write from the
second equation
MD
A2(k) sinh kh + A3(k) eosh kh = _ Al(k)e-kh (A. II)P ID1 RT
Using the representation of the delta function
r Jo = k (A. 12)
we obtain, after multiplying equation (A.9) by r J (k,r) and integratingo
over all r,
-kh _(k)A2(k) cosh kh + A3(k) sinh kh + <iAl(k)e = KlPo k (A. 13)
From eqs. (A.II) and (A.13) we eliminate Al(k) and solve for A3(k)
in terms of A2(k). Substituting the value of A3(k) in terms of A2(k)
in eq. (A.5) we obtain
KIPo slnh kx 61k[Cl(k'x) = tanh kh + _ cosh kh k
+ A2(k) [cosh kx -1 + 8tanh kh slnh k"-] (A. 14)tanh kh + 8
A-3

? i
Ic
r--
_J
where 8 = KIPlDIRT/MgDg. If 8 is very small, that is, zero, eq. (A.14)
reduces to
sinh k(h-x)sinh kx 6(k) + A2(k) (A.15)Cl(k'x) = KlPo sinh kh k sinh kh
which, upon inversion gives
I°cl(r,x) = Klp ° _" + kA2(k)o
sinh k(h-x) Jo(kr) dk (A.16)sinh kh
Putting6(k)
A2(k) = KlPo T - A2 (k)
gives finally
I_ sinh k(h-x)= - kA2'(k) sinh khcl(r'x) KIP° o
Jo(kr) dk (A. 17)
=
=
This is the same equation for A 2' as was found in section 2.1 for the
case of constant concentration, co = KIP o, on the boundary x = h. We
conclude that when B = 0 the gas phase can be ignored and the problem
reduces to that with a constant concentration on the gas phase boundary
of the bladder.
Let us examine the order of magnitude of 8 under typical conditions.
For Nitrogen gas the measured value of the solubility K 1 is of the order
of 10 -4 [(gms N2)/(cm3)]/[(gms Teflon)/(cm3)] arm -I. At 300°K
• RT/M = (82.05)(300)/28 = 0.88 x 10³ while DI/Dg _ 10 -6 since theg
measured value of D. is about 10 -7 and for binary gas solutions Di g
is always about i0 -I • The density of Teflon is of the order of 1.0 so
is of the order of 10-7 .
<IPlDI RT8 -
MDg g
Thus 8 is expected to be very small.
A-4

L
The leakage rate must, for a physically meaningful solution, be
a continuous function of the parameters, for example B, upon which
it depends. Therefome the leakage rate for very small values of B
will differ only slightly from its value for 8 = 0. As we have shown
above B - 0 corresponds to the assumption of a constant gas concentra-
tion on the interface between the bladder and the pressurant gas space.
Therefore, the leakage rate through the structure can be calculated to
good accuracy by ignoring diffusion in the gas space.
A similar analysis for the interface between bladder and liquid
space gives the result that the concentration on this interface can
be assumed to be zero provided (O_D_K_)/(O2D2K2) >> 1. Here 0E is
the density of the liquid propellant, D_ is the diffusivity of pressurant
gas in liquid propellant, K 2 is the solubility of the gas in material 2,
O 2 is the density of material 2 and K£ is the solubility of the gas in
liquid propellant. In this case P£ _ 02, D_ _ i0 -5 cm2/sec (a best
estimate from the literature, see reference l) K2 _ l0-4 as above,
D2 _ 10-7 as above, and K_ _ 10 -4 according to the data of Chang and
Gokcen (12) . Thus the magnitude of the ratio is about l02. It appears
that neglecting diffusion through the liquid is not so good an approxima-
tion as neglecting it through the gas. However, 102 is sufficiently
large compared to 1.0 for us to expect that calculations based on
assuming the concentration vanishes at the liquid-bladder interface
will give a good engineering approximation to the leak rate.
, m
A-5

F
K==E_
L .......
Appendix B
In this section the integrals necessary for the calculation of the
leakage rate through rectangular slits (Section 2.2) will be evaluated.
From eq. (2.2.18) the integral is
_o tanh kh J (ka) sin ka dko k2 = F (B.I)
Let ka = u; dk/k 2 = a(du/u2); kh = (h/a)u = eu wheree= h/a.
(B.I) is equivalent to
_o duF(a) = a tanh eu Jo(U) sin u--_U
Then
(B.2)
To evaluate the integral it is necessary to represent tanh _u by its
expansion in partial fractions (I0) .
tanh eu
U
2E i= -- 2 +2(2/2)_'n=o u + (n
(B.3)
Using (B.3) in (B.2) gives, after interchanging the order of summation
and integration
OO
F(_) _ 2-_a _ _o J°(u)sin u d"-U-U
a n=o (u2 + Yn 2) u
(B.4)
= _)_ Since the integrand is an even function of u, wewhere Yn (n + 2 _"
can write eq. (B.4) as
where
OO
F(a) = a E fn(_)
n--o
__ Jo(U) sin u dufn (_) = 2 _-(u2 + Yn )
(B.5)
B-I

I
m
w
To evaluate the fn(_) consider the complex integral
iz
I Jo (z)e dz
c (z 2 +Yn 2) z
where z = u + iv, and the contour C is a semi-circle in the upper half
complex plane indented at the origin as shown.
R 8
N
I, R
By the theory of residues we have
M
== m
F:=:
iz (u) e iu du
S Jo(z)e dz = I-e Jo2 2 z Yn 2)c z + -R u(u 2 +
n
iz
I jo(Z)e+ 2)
Fl(Z2 + Yn
dE
z
R Jo(U) iu [ jo(Z)eiZ
e (u 2 + Yn 2) u
dz
= 2_i I On (B.6)n
thwhere On denotes the n residue of the integrand within the contour.
On F9 (the large semi-circle) from the asymptotic expansion of
Jo(z_(ll) we have
B-2

f ,
B
la
i
e
U
l
E
%--.
ize J (z)
oz-i/2 Iz-- e cos(z- _/4)
z-i/2eiZ (ei(z_)2
Since on £2, z -- R(cos e + i sin e),
_ i (e -21zjsIn8 + i)
-21zlsin ee 1_- +
izl/21 izX/21
Now sin 8 is positive in the interval 0 < 8 < _ so that
e-JZ I sin8___ 0 as Izl becomes large everywhere on the contour except
possibly at 8 = 0 and e = _. Thus everywhere on F 2
< AJeiZJo(Z) I RI/2
(B.7)
where A is a finite constant and R I/2 = jzl/2 1 . Then
I eiZJo(Z)z(z2 + 2)
n
A
< 7/2 (B.8)
Since the length of the contour is _R, the integral over F 2 vanishes
as R--+_ like I/R 5/2.
B-3

F_
F
L
i m
Emm
!
m
The only singularity of the Integrand in the upper half plane is at
a simple pole at z -- I¥ n. The residue of the integrand there is
J(iYn) e-Yn lo(Yn)e-YnI m
2 2-2Y n 2T n
(B.9)
where lo(T n) _ Jo(iTn). Using the above results in eq. (B.6) gives the
following preliminary results.
I f luJo(U) elU iz R Jo(U) e-e Jo (z)e dz +
du+ 2 z u2 + Yn2 2 u z2+yn-R u + Yn F1
du
2 u
= -2_ilo(Yn)e-Yn
2
2T n
(B.IO)
i0 i0
On F1 put z = ee dz = Ee i dO to get
i fJo (z)eiz dz = Jo (eeie) i'_J (0)2 2 z 2 i dO = o = _ i_...__..-
0=_ 2el O+ 2 2rl z + Yn Yn Yn Yn
for small e, since J (0) = i.o
result
Letting e--+0 and R--+ = , we obtain the
iu lo(Yn)e-Yn
Jo (u)e du = i_ i_P
2 u 2 2u2 + Yn Yn Tn
(B. 11)
Where the P denotes that the principal value of the integral is
intended. On expanding the exponential in the integrand eq. (B.II)
becomes
B-4

L_
_+_ _ _. = Jo(U) sin up cos _u _J°(u) __du + iP
_'2 + "fn 2 u u 2 + yn 2
du
u
]
I
oi"
and
2 lo(Y) e-
cos u JotUJ'" du--ffiO
2 2 uu+_
= ( Jo(U) sin u
J__ u 2 + yn 2
d_uu w io(¥n) e-u = --_ (1 - Yn)Yn
(s.12)
(B. 13)
(B.14)
where the P has been omitted from the last integral since it exists in
the ordinary sense.
! _ From eq. (B.5)
_ _- F(u) = a__1 _ 12 a l_ U U
Yn ffi_ _ n=o no
Io(Yn)e-Yn
2Yn
(B.15)
m._
The first term is summable. From
tanh au = _2U U
n 0
1
2 2u +'_n
=
B-5

| •
t
L_
we have
Hence
tanh au 2 _-_lira L_u a
n=o
Oo
alict al_ _o
12
Yn
gives
I o (¥n) e-Yn
2
T n
2 .22 1_
Substituting the value of a ffi h/a and Yn ffi(n +p _--a2
_h h EF(a) = -n=o
i- wa_a e- (n-_J--/-To[(n + ½) y]
2
(n +½)
(B.16)
(B.17)
E
Ft
(B. 18)
Using this result in eq. (2.2.19) and multiplying numerator and
denominator by 21_ we obtain the result expressed in eq. (2.2.20).
The function denoted by G(a) in section 2.2 is, of course, the second
term on the right of eq. (B.18) multiplied by 2/_h.
i ,E
B
B-6

t._:
m
,--7
E
i L
%--
=
Appendix C
UNIDIRECTIONAL PERMEATION OF NITROGEN TETROXIDE
The permeability constant P is defined by the differential
equation
dm = A pap (C.I)dt
where
m is the net mass transferred from time zero (a function of time)
d--mis the net mass transfer rate (a function of time)dt
A is the area of the membrane (constant)
is the membrane thickness (constant)
AP is the pressure differential across the membrane (PH - PL )
(a function of time)
The pressure on each side of the membrane is a function of the
volume, the temperature and the total number of mole of gas. The
volume and temperature are fixed by the experimental conditions. The
number of moles on each side however, varies with the mass. Using the
high pressure side for example the relationship between pressure and
mass can be developed. Defining:
mH
T temperature, OK
3
VH volume on high pressure side, cm
R gas constant, 82.054 atm cm3/g mole OK
PH pressure, atm
n I g moles N204
n 2 g moles NO 2
nT total moles (nI + n 2)
K equilibrium constant for reaction N204_ 2N02, armP
(defined by T)
total mass of gas on the high pressure side, g
C-I

| i
iN
BC
! m
E
w
r
Perfect gas law
Total Mass
PHVH = n T RT
mH = 92.016n I + 46.008n 2
mH/46.008 ffi2n I + n 2
Equilibrium relationship
(PN02)2K m m
P PN204
(n2/n T) 2P HK ffiP (nl/n T)
(XN02)2 (PH)2 (XN02) 2 PH
XN204 PH _204
(n22)PH
nln T
The relationship defining pressure in terms of mass is derived as
follows. Solving equation C.2 for nT
eH vHnT = RT
and combining with equation C.62
n2 RTK =P n I VH
Solving equation C.8 for n I
Substituting C.9 into C.4
RT 2
nl --HV-Kp n2
mH 2RT
46.008 VHK p
2
n 2 + n 2
C-2
(C.2)
(c.3)
(C.4)
' (c.5)
(C.6)
(C. 7)
(c.8)
(C.9)
(C.IO)

t.J
t_
L
[]
E
and solving C.10 for n2
n2=
-I + 1 + 8 vHRTp 46q008")
RT4_
VHK p
(C.11)
Substituting C.II and C.9 into C.2
(C. 12)
A similar equation for the low pressure side may be written
Kp[ 4RT mL
PL = 8 LVLKp 46.008(1 8RT mL _i/21
- i + + VLK p 46_08J J(c.13)
Returning to equation C.I the following definitions can be made
omH = mH - m (C.14)
o (c 15)mLffi L+m
owhere mH is the total mass on the high pressure side at time zero
and _ is total mass on the low pressure side at time zero.
o omH and mL can be defined in terms of initial pressure using
relationships defined in a manner similar to Equations C.12 and C.13.
The differential Equation C.I can be written now as follows:
Letting CIH = CIL = Kp/8. (C.16)
4 RT (C.17)
C2H ffiVHK p 46.008
4 RT (C.18)
C2L ffiVLK p 46.008
C-3

[L
L_L
L
dm Ap CIH C2H(mH _ m) - I + 2C2H(mH - mdt
(C. 19)
This equation was solved numerically with various values of p using
Milne's method to define m = m(t). A computer program incorporating
the solution of the equation and the generalized least squares deter-
mination of p was written for the analysis of the experimental data.
LE
!8
i:E
F-
#
C-4