continuous probability distributions n uniform probability distribution n normal probability...
TRANSCRIPT

Continuous Probability DistributionsContinuous Probability Distributions
Uniform Probability DistributionUniform Probability Distribution Normal Probability DistributionNormal Probability Distribution Exponential Probability DistributionExponential Probability Distribution
f (x)f (x)
x x
UniformUniform
xx
f f ((xx)) NormalNormal
xx
f (x)f (x) ExponentialExponential
Continuous Probability DistributionsContinuous Probability Distributions
A A continuous random variablecontinuous random variable can assume any can assume any value in an interval on the real line or in a value in an interval on the real line or in a collection of intervals.collection of intervals.
It is not possible to talk about the probability of It is not possible to talk about the probability of the random variable assuming a particular value.the random variable assuming a particular value.
Instead, we talk about the probability of the Instead, we talk about the probability of the random variable assuming a value within a given random variable assuming a value within a given interval.interval.

Continuous Probability DistributionsContinuous Probability Distributions
The probability of the random variable The probability of the random variable assuming a value within some given interval assuming a value within some given interval from from xx11 to to xx22 is defined to be the is defined to be the area under area under the graphthe graph of the of the probability density functionprobability density function betweenbetween x x11 andand x x22..
f (x)f (x)
x x
UniformUniform
xx11 xx11 xx22 xx22
xx
f f ((xx)) NormalNormal
xx11 xx11 xx22 xx22
xx11 xx11 xx22 xx22
ExponentialExponential
xx
f (x)f (x)
xx11
xx11
xx22 xx22
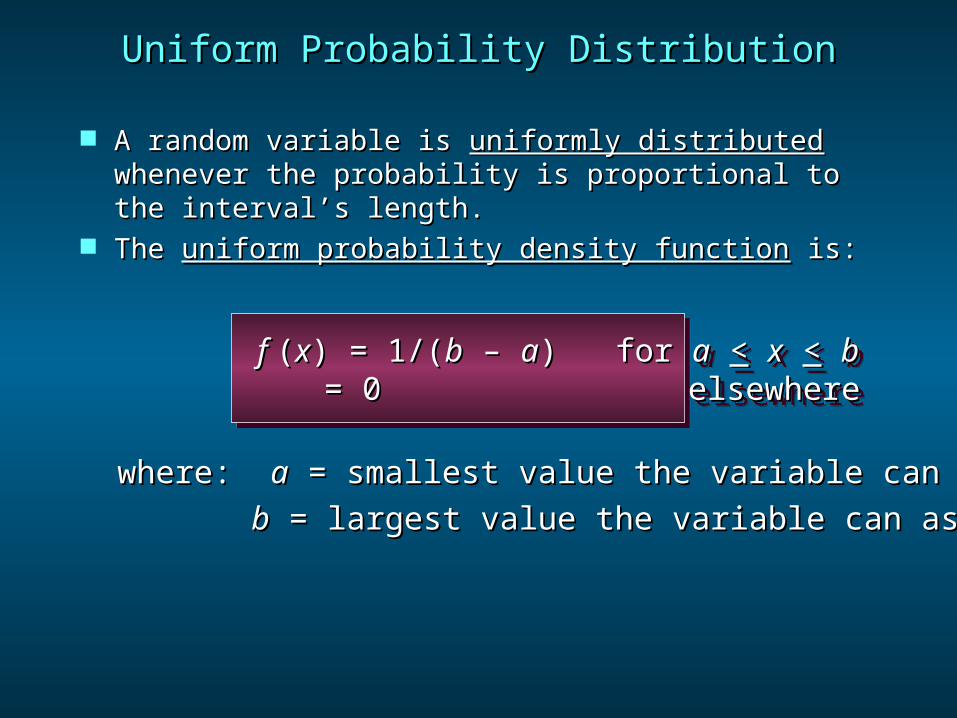
A random variable is A random variable is uniformly distributeduniformly distributed whenever the probability is proportional to the whenever the probability is proportional to the interval’s length. interval’s length.
The The uniform probability density functionuniform probability density function is: is:
Uniform Probability DistributionUniform Probability Distribution
where: where: aa = smallest value the variable can assume = smallest value the variable can assume
bb = largest value the variable can assume = largest value the variable can assume
f f ((xx) = 1/() = 1/(bb – – aa) for ) for aa << xx << bb = 0 elsewhere= 0 elsewhere f f ((xx) = 1/() = 1/(bb – – aa) for ) for aa << xx << bb = 0 elsewhere= 0 elsewhere

Expected Value of Expected Value of xx
Variance of Variance of xx
Var(Var(xx) = () = (bb - - aa))22/12/12Var(Var(xx) = () = (bb - - aa))22/12/12
E(E(xx) = () = (aa + + bb)/2)/2E(E(xx) = () = (aa + + bb)/2)/2
Uniform Probability DistributionUniform Probability Distribution

Example: Slater's BuffetExample: Slater's Buffet
Uniform Probability DistributionUniform Probability DistributionSlater customers are chargedSlater customers are charged
for the amount of salad they take. for the amount of salad they take. Sampling suggests that theSampling suggests that theamount of salad taken is amount of salad taken is uniformly distributeduniformly distributedbetween 5 ounces and 15 ounces.between 5 ounces and 15 ounces.

Uniform Probability Density FunctionUniform Probability Density Function
Example: Slater's BuffetExample: Slater's Buffet
ff((xx) = 1/10 for 5 ) = 1/10 for 5 << xx << 15 15
= 0 elsewhere= 0 elsewhere
ff((xx) = 1/10 for 5 ) = 1/10 for 5 << xx << 15 15
= 0 elsewhere= 0 elsewhere
where:where:
xx = salad plate filling weight = salad plate filling weight

Example: Slater's BuffetExample: Slater's Buffet
Expected Value of Expected Value of xx
Variance of Variance of xx
E(E(xx) = () = (aa + + bb)/2)/2
= (5 + 15)/2= (5 + 15)/2
= 10= 10
E(E(xx) = () = (aa + + bb)/2)/2
= (5 + 15)/2= (5 + 15)/2
= 10= 10
Var(Var(xx) = () = (bb - - aa))22/12/12
= (15 – 5)= (15 – 5)22/12/12
= 8.33= 8.33
Var(Var(xx) = () = (bb - - aa))22/12/12
= (15 – 5)= (15 – 5)22/12/12
= 8.33= 8.33
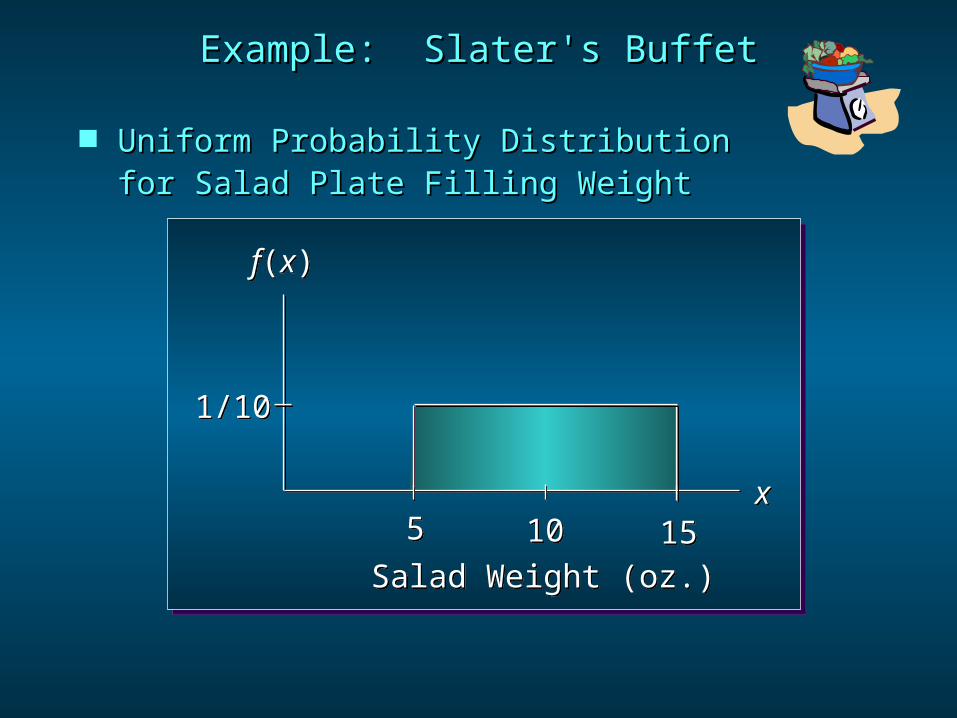
Uniform Probability DistributionUniform Probability Distributionfor Salad Plate Filling Weightfor Salad Plate Filling Weight
f(x)f(x)
x x55 1010 1515
1/101/10
Salad Weight (oz.)Salad Weight (oz.)
Example: Slater's BuffetExample: Slater's Buffet

f(x)f(x)
x x55 1010 1515
1/101/10
Salad Weight (oz.)Salad Weight (oz.)
Example: Slater's BuffetExample: Slater's Buffet
P(12 < x < 15) = 1/10(3) = .3P(12 < x < 15) = 1/10(3) = .3
What is the probability that a customerWhat is the probability that a customer
will take between 12 and 15 ounces of will take between 12 and 15 ounces of salad?salad?
1212

Normal Probability DistributionNormal Probability Distribution
The The normal probability distributionnormal probability distribution is the most is the most important distribution for describing a important distribution for describing a continuous random variable.continuous random variable.
It is widely used in statistical inference.It is widely used in statistical inference.

HeightsHeightsof peopleof peopleHeightsHeights
of peopleof people
Normal Probability DistributionNormal Probability Distribution
It has been used in a wide variety of It has been used in a wide variety of applications:applications:
ScientificScientific measurementsmeasurements
ScientificScientific measurementsmeasurements

AmountsAmounts
of rainfallof rainfall
AmountsAmounts
of rainfallof rainfall
Normal Probability DistributionNormal Probability Distribution
It has been used in a wide variety of It has been used in a wide variety of applications:applications:
TestTest scoresscoresTestTest
scoresscores

Normal Probability DistributionNormal Probability Distribution
Normal Probability Density FunctionNormal Probability Density Function
2 2( ) / 21( )
2xf x e
2 2( ) / 21( )
2xf x e
= mean= mean
= standard deviation= standard deviation
= 3.14159= 3.14159
ee = 2.71828 = 2.71828
where:where:

The distribution is The distribution is symmetricsymmetric, and is , and is bell-shapedbell-shaped.. The distribution is The distribution is symmetricsymmetric, and is , and is bell-shapedbell-shaped..
Normal Probability DistributionNormal Probability Distribution
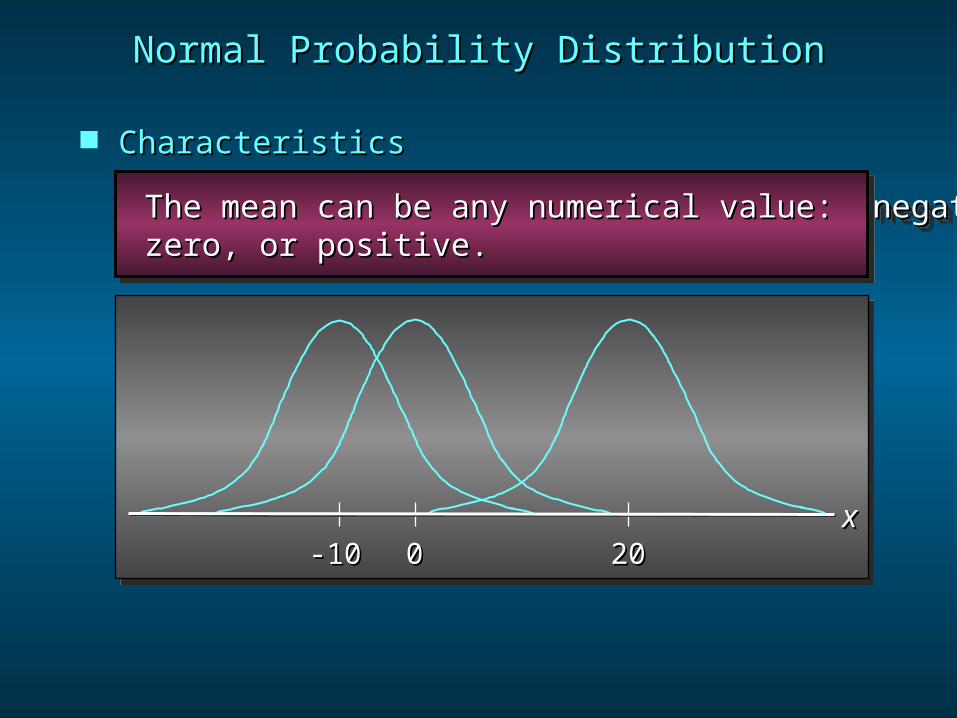
CharacteristicsCharacteristics
xx

The entire family of normal probabilityThe entire family of normal probability distributions is defined by itsdistributions is defined by its meanmean and its and its standard deviationstandard deviation . .
The entire family of normal probabilityThe entire family of normal probability distributions is defined by itsdistributions is defined by its meanmean and its and its standard deviationstandard deviation . .
Normal Probability DistributionNormal Probability Distribution
CharacteristicsCharacteristics
Standard Deviation Standard Deviation
Mean Mean xx
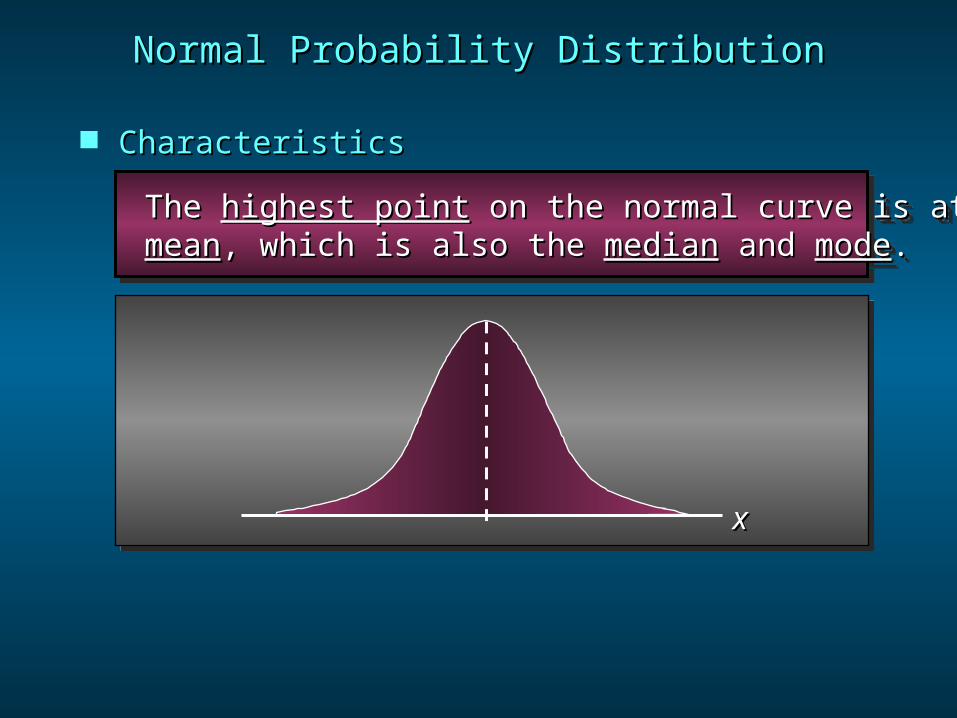
The The highest pointhighest point on the normal curve is at the on the normal curve is at the meanmean, which is also the , which is also the medianmedian and and modemode.. The The highest pointhighest point on the normal curve is at the on the normal curve is at the meanmean, which is also the , which is also the medianmedian and and modemode..
Normal Probability DistributionNormal Probability Distribution
CharacteristicsCharacteristics
xx
Normal Probability DistributionNormal Probability Distribution
CharacteristicsCharacteristics
-10-10 00 2020
The mean can be any numerical value: negative,The mean can be any numerical value: negative, zero, or positive.zero, or positive. The mean can be any numerical value: negative,The mean can be any numerical value: negative, zero, or positive.zero, or positive.
xx

Normal Probability DistributionNormal Probability Distribution
CharacteristicsCharacteristics
= 15= 15
= 25= 25
The standard deviation determines the width of theThe standard deviation determines the width of thecurve: larger values result in wider, flatter curves.curve: larger values result in wider, flatter curves.The standard deviation determines the width of theThe standard deviation determines the width of thecurve: larger values result in wider, flatter curves.curve: larger values result in wider, flatter curves.
xx

Probabilities for the normal random variable areProbabilities for the normal random variable are given by given by areas under the curveareas under the curve. The total area. The total area under the curve is 1 (.5 to the left of the mean andunder the curve is 1 (.5 to the left of the mean and .5 to the right)..5 to the right).
Probabilities for the normal random variable areProbabilities for the normal random variable are given by given by areas under the curveareas under the curve. The total area. The total area under the curve is 1 (.5 to the left of the mean andunder the curve is 1 (.5 to the left of the mean and .5 to the right)..5 to the right).
Normal Probability DistributionNormal Probability Distribution
CharacteristicsCharacteristics
.5.5 .5.5
xx

Normal Probability DistributionNormal Probability Distribution
CharacteristicsCharacteristics
of values of a normal random variableof values of a normal random variable are within of its mean.are within of its mean.
of values of a normal random variableof values of a normal random variable are within of its mean.are within of its mean.68.26%68.26%68.26%68.26%
+/- 1 standard deviation+/- 1 standard deviation+/- 1 standard deviation+/- 1 standard deviation
of values of a normal random variableof values of a normal random variable are within of its mean.are within of its mean.
of values of a normal random variableof values of a normal random variable are within of its mean.are within of its mean.95.44%95.44%95.44%95.44%
+/- 2 standard deviations+/- 2 standard deviations+/- 2 standard deviations+/- 2 standard deviations
of values of a normal random variableof values of a normal random variable are within of its mean.are within of its mean.
of values of a normal random variableof values of a normal random variable are within of its mean.are within of its mean.99.72%99.72%99.72%99.72%
+/- 3 standard deviations+/- 3 standard deviations+/- 3 standard deviations+/- 3 standard deviations

Normal Probability DistributionNormal Probability Distribution
CharacteristicsCharacteristics
xx – – 33 – – 11
– – 22 + 1+ 1
+ 2+ 2 + 3+ 3
68.26%68.26%95.44%95.44%99.72%99.72%

Standard Normal Probability DistributionStandard Normal Probability Distribution
A random variable having a normal distributionA random variable having a normal distribution with a mean of 0 and a standard deviation of 1 iswith a mean of 0 and a standard deviation of 1 is said to have a said to have a standard normal probabilitystandard normal probability distributiondistribution..
A random variable having a normal distributionA random variable having a normal distribution with a mean of 0 and a standard deviation of 1 iswith a mean of 0 and a standard deviation of 1 is said to have a said to have a standard normal probabilitystandard normal probability distributiondistribution..

00zz
The letter The letter z z is used to designate the standardis used to designate the standard normal random variable.normal random variable. The letter The letter z z is used to designate the standardis used to designate the standard normal random variable.normal random variable.
Standard Normal Probability DistributionStandard Normal Probability Distribution

Converting to the Standard Normal Converting to the Standard Normal DistributionDistribution
Standard Normal Probability DistributionStandard Normal Probability Distribution
zx
zx
We can think of We can think of zz as a measure of the number of as a measure of the number ofstandard deviations standard deviations xx is from is from ..

is used to compute the is used to compute the zz value value given a cumulative probability.given a cumulative probability.
is used to compute the is used to compute the zz value value given a cumulative probability.given a cumulative probability.
NORMSINVNORMSINVNORMSINVNORMSINVNORM S INVNORM S INV
is used to compute the cumulativeis used to compute the cumulative probability given a probability given a zz value. value.
is used to compute the cumulativeis used to compute the cumulative probability given a probability given a zz value. value.NORMSDISTNORMSDISTNORMSDISTNORMSDISTNORM S DISTNORM S DIST
Using Excel to ComputeUsing Excel to ComputeStandard Normal ProbabilitiesStandard Normal Probabilities
Excel has two functions for computing Excel has two functions for computing probabilities and probabilities and zz values for a values for a standardstandard normal distribution:normal distribution:
(The “S” in the function names reminds(The “S” in the function names remindsus that they relate to the us that they relate to the standardstandardnormal probability distribution.)normal probability distribution.)

Formula WorksheetFormula Worksheet
Using Excel to ComputeUsing Excel to ComputeStandard Normal ProbabilitiesStandard Normal Probabilities
A B12 3 P (z < 1.00) =NORMSDIST(1)4 P (0.00 < z < 1.00) =NORMSDIST(1)-NORMSDIST(0)5 P (0.00 < z < 1.25) =NORMSDIST(1.25)-NORMSDIST(0)6 P (-1.00 < z < 1.00) =NORMSDIST(1)-NORMSDIST(-1)7 P (z > 1.58) =1-NORMSDIST(1.58)8 P (z < -0.50) =NORMSDIST(-0.5)9
Probabilities: Standard Normal Distribution
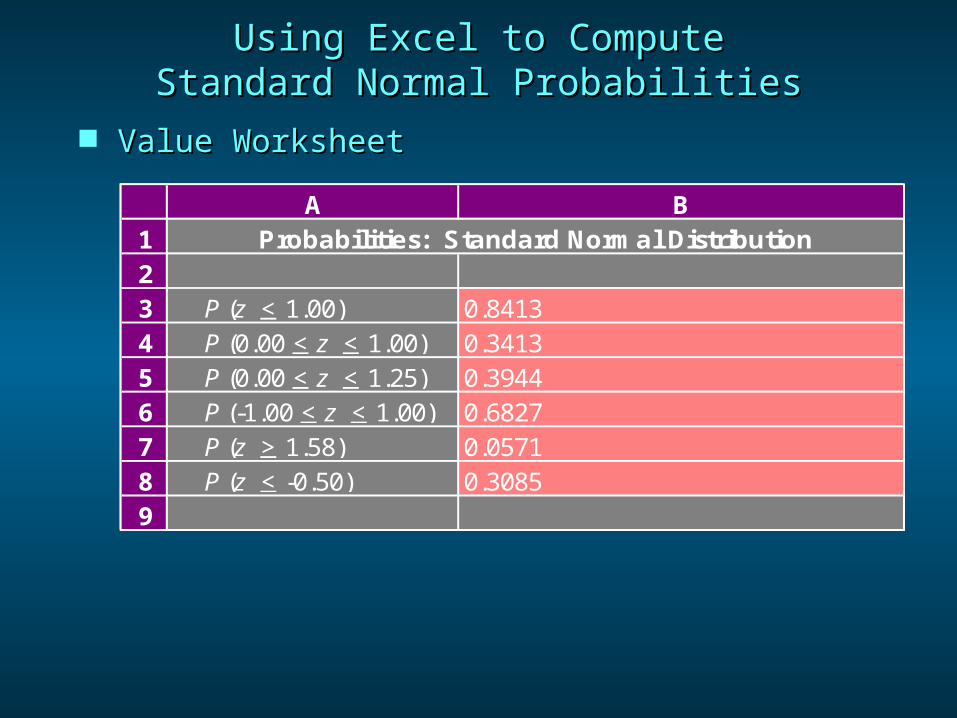
Value WorksheetValue Worksheet
Using Excel to ComputeUsing Excel to ComputeStandard Normal ProbabilitiesStandard Normal Probabilities
A B12 3 P (z < 1.00) 0.84134 P (0.00 < z < 1.00) 0.34135 P (0.00 < z < 1.25) 0.39446 P (-1.00 < z < 1.00) 0.68277 P (z > 1.58) 0.05718 P (z < -0.50) 0.30859
Probabilities: Standard Normal Distribution
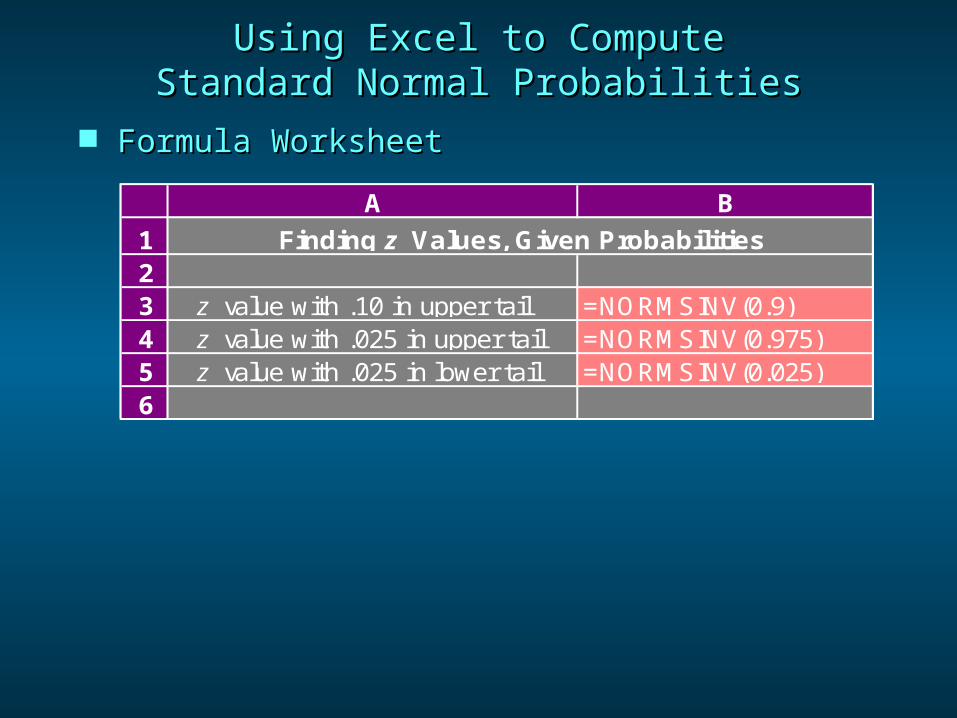
Formula WorksheetFormula Worksheet
Using Excel to ComputeUsing Excel to ComputeStandard Normal ProbabilitiesStandard Normal Probabilities
A B
12 3 z value with .10 in upper tail =NORMSINV(0.9)4 z value with .025 in upper tail =NORMSINV(0.975)5 z value with .025 in lower tail =NORMSINV(0.025)6
Finding z Values, Given Probabilities

Value WorksheetValue Worksheet
A B
12 3 z value with .10 in upper tail 1.284 z value with .025 in upper tail 1.965 z value with .025 in lower tail -1.966
Finding z Values, Given Probabilities
Using Excel to ComputeUsing Excel to ComputeStandard Normal ProbabilitiesStandard Normal Probabilities

Example: Pep ZoneExample: Pep Zone
Standard Normal Probability DistributionStandard Normal Probability Distribution
Pep Zone sells auto parts and suppliesPep Zone sells auto parts and supplies
including a popular multi-grade motorincluding a popular multi-grade motor
oil. When the stock of this oil drops tooil. When the stock of this oil drops to
20 gallons, a replenishment order is20 gallons, a replenishment order is
placed.placed.
PepZone5w-20Motor Oil

Example: Pep ZoneExample: Pep Zone
Standard Normal Probability DistributionStandard Normal Probability Distribution
The store manager is concerned that The store manager is concerned that sales are being lost due to stockouts while sales are being lost due to stockouts while waiting for an order. It has been determined waiting for an order. It has been determined that demand during replenishment leadtime is that demand during replenishment leadtime is normally distributed with a mean of 15 gallons normally distributed with a mean of 15 gallons and a standard deviation of 6 gallons. and a standard deviation of 6 gallons.
The manager would like to know the The manager would like to know the probability of a stockout, probability of a stockout, PP((xx > 20). > 20).
PepZone5w-20
Motor Oil

zz = ( = (xx - - )/)/ = (20 - 15)/6= (20 - 15)/6 = .83= .83
zz = ( = (xx - - )/)/ = (20 - 15)/6= (20 - 15)/6 = .83= .83
Solving for the Stockout ProbabilitySolving for the Stockout Probability
Example: Pep ZoneExample: Pep Zone
Step 1: Convert Step 1: Convert xx to the standard normal distribution. to the standard normal distribution.Step 1: Convert Step 1: Convert xx to the standard normal distribution. to the standard normal distribution.
PepZone5w-20
Motor Oil
Step 2: Find the area under the standard normalStep 2: Find the area under the standard normal curve between the mean and curve between the mean and zz = .83. = .83.Step 2: Find the area under the standard normalStep 2: Find the area under the standard normal curve between the mean and curve between the mean and zz = .83. = .83.
see next slidesee next slide see next slidesee next slide

Probability Table for theProbability Table for theStandard Normal DistributionStandard Normal Distribution
z .00 .01 .02 .03 .04 .05 .06 .07 .08 .09
. . . . . . . . . . .
.5 .1915 .1695 .1985 .2019 .2054 .2088 .2123 .2157 .2190 .2224
.6 .2257 .2291 .2324 .2357 .2389 .2422 .2454 .2486 .2517 .2549
.7 .2580 .2611 .2642 .2673 .2704 .2734 .2764 .2794 .2823 .2852
.8 .2881 .2910 .2939 .2967 .2995 .3023 .3051 .3078 .3106 .3133
.9 .3159 .3186 .3212 .3238 .3264 .3289 .3315 .3340 .3365 .3389
. . . . . . . . . . .
Example: Pep ZoneExample: Pep ZonePep
Zone5w-20
Motor Oil
PP(0 (0 << zz << .83) .83)

PP((z z > .83) = .5 – > .83) = .5 – PP(0 (0 << zz << .83) .83) = 1- .2967= 1- .2967
= .2033= .2033
PP((z z > .83) = .5 – > .83) = .5 – PP(0 (0 << zz << .83) .83) = 1- .2967= 1- .2967
= .2033= .2033
Solving for the Stockout ProbabilitySolving for the Stockout Probability
Example: Pep ZoneExample: Pep Zone
Step 3: Compute the area under the standard normalStep 3: Compute the area under the standard normal curve to the right of curve to the right of zz = .83. = .83.Step 3: Compute the area under the standard normalStep 3: Compute the area under the standard normal curve to the right of curve to the right of zz = .83. = .83.
PepZone5w-20
Motor Oil
ProbabilityProbability of a of a
stockoutstockoutPP((xx > > 20)20)

Solving for the Stockout ProbabilitySolving for the Stockout Probability
Example: Pep ZoneExample: Pep Zone
00 .83.83
Area = .2967Area = .2967Area = .5 - .2967Area = .5 - .2967
= .2033= .2033
zz
PepZone5w-20
Motor Oil

Standard Normal Probability DistributionStandard Normal Probability Distribution
If the manager of Pep Zone wants the If the manager of Pep Zone wants the probability of a stockout to be no more probability of a stockout to be no more than .05, what should the reorder point be?than .05, what should the reorder point be?
PepZone5w-20
Motor Oil
Example: Pep ZoneExample: Pep Zone

Solving for the Reorder PointSolving for the Reorder Point
PepZone5w-20
Motor Oil
00
Area = .4500Area = .4500
Area = .0500Area = .0500
zzzz.05.05
Example: Pep ZoneExample: Pep Zone

Solving for the Reorder PointSolving for the Reorder Point
Example: Pep ZoneExample: Pep ZonePep
Zone5w-20
Motor Oil
Step 1: Find the Step 1: Find the zz-value that cuts off an area of .05-value that cuts off an area of .05 in the right tail of the standard normalin the right tail of the standard normal distribution.distribution.
Step 1: Find the Step 1: Find the zz-value that cuts off an area of .05-value that cuts off an area of .05 in the right tail of the standard normalin the right tail of the standard normal distribution.distribution.
z .00 .01 .02 .03 .04 .05 .06 .07 .08 .09
. . . . . . . . . . .
1.5 .4332 .4345 .4357 .4370 .4382 .4394 .4406 .4418 .4429 .4441
1.6 .4452 .4463 .4474 .4484 .4495 .4505 .4515 .4525 .4535 .4545
1.7 .4554 .4564 .4573 .4582 .4591 .4599 .4608 .4616 .4625 .4633
1.8 .4641 .4649 .4656 .4664 .4671 .4678 .4686 .4693 .4699 .4706
1.9 .4713 .4719 .4726 .4732 .4738 .4744 .4750 .4756 .4761 .4767
. . . . . . . . . . .
z .00 .01 .02 .03 .04 .05 .06 .07 .08 .09
. . . . . . . . . . .
1.5 .4332 .4345 .4357 .4370 .4382 .4394 .4406 .4418 .4429 .4441
1.6 .4452 .4463 .4474 .4484 .4495 .4505 .4515 .4525 .4535 .4545
1.7 .4554 .4564 .4573 .4582 .4591 .4599 .4608 .4616 .4625 .4633
1.8 .4641 .4649 .4656 .4664 .4671 .4678 .4686 .4693 .4699 .4706
1.9 .4713 .4719 .4726 .4732 .4738 .4744 .4750 .4756 .4761 .4767
. . . . . . . . . . .We look up the We look up the
areaarea(.5 - .05 = .45)(.5 - .05 = .45)

Solving for the Reorder PointSolving for the Reorder Point
Example: Pep ZoneExample: Pep ZonePep
Zone5w-20
Motor Oil
Step 2: Convert Step 2: Convert zz.05.05 to the corresponding value of to the corresponding value of xx..Step 2: Convert Step 2: Convert zz.05.05 to the corresponding value of to the corresponding value of xx..
xx = = + + zz.05.05
= 15 + 1.645(6)= 15 + 1.645(6)
= 24.87 or 25= 24.87 or 25
xx = = + + zz.05.05
= 15 + 1.645(6)= 15 + 1.645(6)
= 24.87 or 25= 24.87 or 25
A reorder point of 25 gallons will place the probabilityA reorder point of 25 gallons will place the probability of a stockout during leadtime at (slightly less than) .05.of a stockout during leadtime at (slightly less than) .05.

Solving for the Reorder PointSolving for the Reorder Point
Example: Pep ZoneExample: Pep ZonePep
Zone5w-20
Motor Oil
By raising the reorder point from 20 gallons to By raising the reorder point from 20 gallons to 25 gallons on hand, the probability of a stockout25 gallons on hand, the probability of a stockoutdecreases from about .20 to .05.decreases from about .20 to .05. This is a significant decrease in the chance that PepThis is a significant decrease in the chance that PepZone will be out of stock and unable to meet aZone will be out of stock and unable to meet acustomer’s desire to make a purchase.customer’s desire to make a purchase.

Using Excel to ComputeUsing Excel to ComputeNormal ProbabilitiesNormal Probabilities
Excel has two functions for computing Excel has two functions for computing cumulative probabilities and cumulative probabilities and xx values for values for anyany normal distribution:normal distribution:
NORMDISTNORMDIST is used to compute the cumulative is used to compute the cumulativeprobability given an probability given an xx value. value.NORMDISTNORMDIST is used to compute the cumulative is used to compute the cumulativeprobability given an probability given an xx value. value.
NORMINVNORMINV is used to compute the is used to compute the xx value given value givena cumulative probability.a cumulative probability.NORMINVNORMINV is used to compute the is used to compute the xx value given value givena cumulative probability.a cumulative probability.

Formula WorksheetFormula Worksheet
Using Excel to ComputeUsing Excel to ComputeNormal ProbabilitiesNormal Probabilities
A B
12 3 P (x > 20) =1-NORMDIST(20,15,6,TRUE)4 56 7 x value with .05 in upper tail =NORMINV(0.95,15,6)8
Probabilities: Normal Distribution
Finding x Values, Given Probabilities
PepZone5w-20
Motor Oil
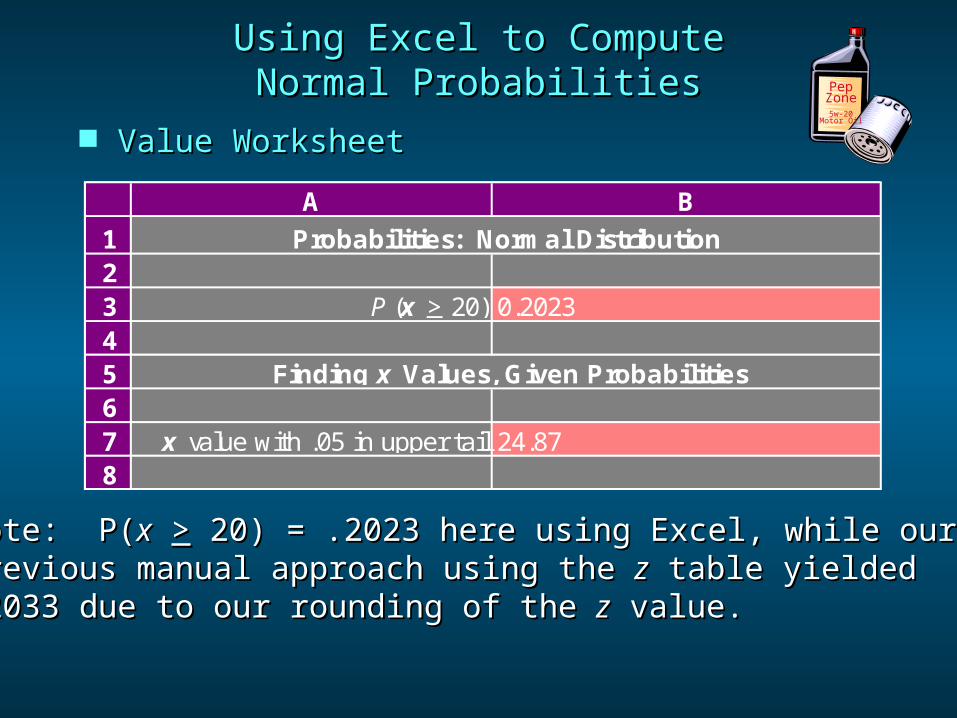
Value WorksheetValue Worksheet
Using Excel to ComputeUsing Excel to ComputeNormal ProbabilitiesNormal Probabilities
Note: P(Note: P(xx >> 20) = .2023 here using Excel, while our 20) = .2023 here using Excel, while our previous manual approach using the previous manual approach using the zz table yielded table yielded .2033 due to our rounding of the .2033 due to our rounding of the zz value. value.
A B
12 3 P (x > 20) 0.20234 56 7 x value with .05 in upper tail 24.878
Probabilities: Normal Distribution
Finding x Values, Given Probabilities
PepZone5w-20
Motor Oil

Exponential Probability DistributionExponential Probability Distribution
The exponential probability distribution is The exponential probability distribution is useful in describing the time it takes to useful in describing the time it takes to complete a task.complete a task.
The exponential random variables can be used The exponential random variables can be used to describe:to describe:
Time betweenTime betweenvehicle arrivalsvehicle arrivalsat a toll boothat a toll booth
Time betweenTime betweenvehicle arrivalsvehicle arrivalsat a toll boothat a toll booth
Time requiredTime requiredto completeto complete
a questionnairea questionnaire
Time requiredTime requiredto completeto complete
a questionnairea questionnaire
Distance betweenDistance betweenmajor defectsmajor defectsin a highwayin a highway
Distance betweenDistance betweenmajor defectsmajor defectsin a highwayin a highway
SLOW

Density FunctionDensity Function
Exponential Probability DistributionExponential Probability Distribution
where: where: = mean = mean
ee = 2.71828 = 2.71828
f x e x( ) / 1
f x e x( ) / 1
for for xx >> 0, 0, > 0 > 0
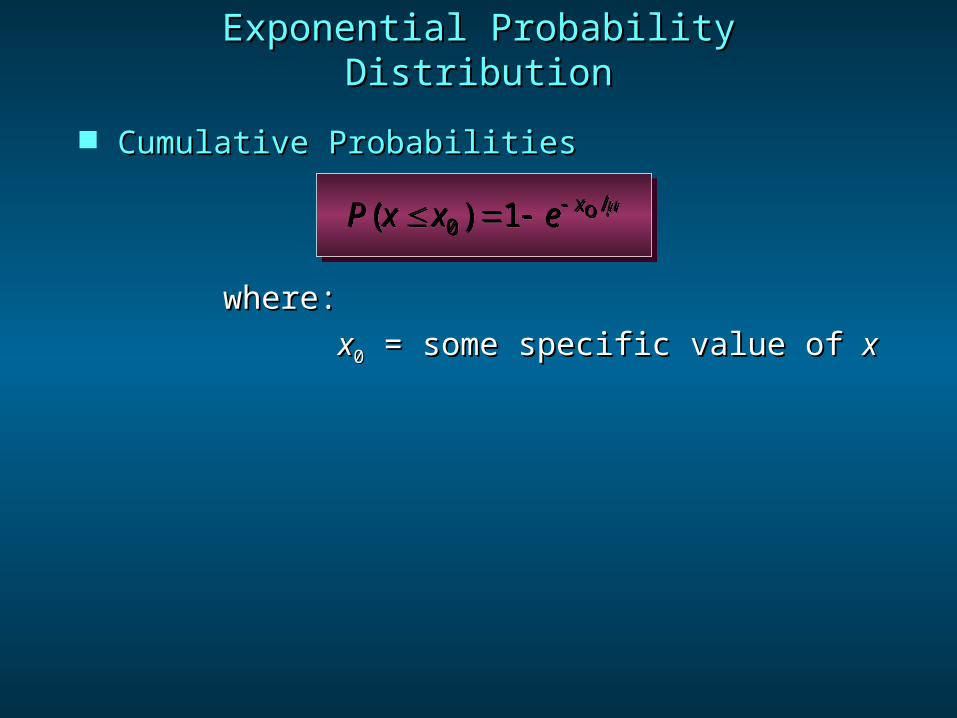
Cumulative ProbabilitiesCumulative Probabilities
Exponential Probability DistributionExponential Probability Distribution
P x x e x( ) / 0 1 o P x x e x( ) / 0 1 o
where:where:
xx00 = some specific value of = some specific value of xx

Using Excel to ComputeUsing Excel to ComputeExponential ProbabilitiesExponential Probabilities
The The EXPONDISTEXPONDIST function can be used to compute function can be used to compute exponential probabilities.exponential probabilities. The The EXPONDISTEXPONDIST function can be used to compute function can be used to compute exponential probabilities.exponential probabilities.
The EXPONDIST function has The EXPONDIST function has three argumentsthree arguments:: The EXPONDIST function has The EXPONDIST function has three argumentsthree arguments::
11stst The value of the random variable The value of the random variable xx 11stst The value of the random variable The value of the random variable xx
22ndnd 1/1/ 22ndnd 1/1/
33rdrd “TRUE” or “FALSE” “TRUE” or “FALSE” 33rdrd “TRUE” or “FALSE” “TRUE” or “FALSE”
the inverse of the the inverse of the meanmeannumber of number of occurrencesoccurrences in an intervalin an intervalwe will always enterwe will always enter
““TRUE” because we’re TRUE” because we’re seeking a cumulative seeking a cumulative
probabilityprobability

Using Excel to ComputeUsing Excel to ComputeExponential ProbabilitiesExponential Probabilities
Formula WorksheetFormula Worksheet
A B
12 3 P (x < 18) =EXPONDIST(18,1/15,TRUE)4 P (6 < x < 18) =EXPONDIST(18,1/15,TRUE)-EXPONDIST(6,1/15,TRUE)5 P (x > 8) =1-EXPONDIST(8,1/15,TRUE)6
Probabilities: Exponential Distribution

Value WorksheetValue Worksheet
Using Excel to ComputeUsing Excel to ComputeExponential ProbabilitiesExponential Probabilities
A B
12 3 P (x < 18) 0.69884 P (6 < x < 18) 0.36915 P (x > 8) 0.58666
Probabilities: Exponential Distribution

Exponential Probability DistributionExponential Probability DistributionThe time between arrivals of carsThe time between arrivals of cars
at Al’s full-service gas pump followsat Al’s full-service gas pump followsan exponential probability distributionan exponential probability distributionwith a mean time between arrivals of with a mean time between arrivals of 3 minutes. Al would like to know the3 minutes. Al would like to know theprobability that the time between two probability that the time between two successivesuccessivearrivals will be 2 minutes or less.arrivals will be 2 minutes or less.
Example: Al’s Full-Service PumpExample: Al’s Full-Service Pump

Exponential Probability DistributionExponential Probability Distribution
xx
f(x)f(x)
.1.1
.3.3
.4.4
.2.2
1 2 3 4 5 6 7 8 9 10 1 2 3 4 5 6 7 8 9 10Time Between Successive Arrivals (mins.)Time Between Successive Arrivals (mins.)
Example: Al’s Full-Service PumpExample: Al’s Full-Service Pump
PP((xx << 2) = 1 - 2.71828 2) = 1 - 2.71828-2/3-2/3 = 1 - .5134 = .4866 = 1 - .5134 = .4866 PP((xx << 2) = 1 - 2.71828 2) = 1 - 2.71828-2/3-2/3 = 1 - .5134 = .4866 = 1 - .5134 = .4866
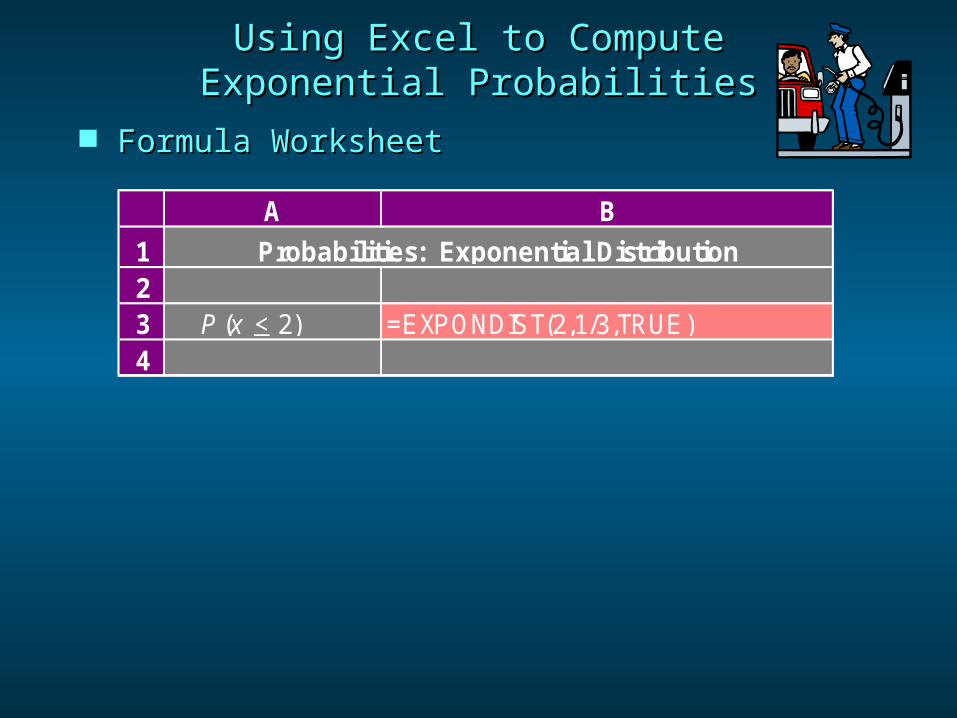
Formula WorksheetFormula Worksheet
Using Excel to ComputeUsing Excel to ComputeExponential ProbabilitiesExponential Probabilities
A B
12 3 P (x < 2) =EXPONDIST(2,1/3,TRUE)4
Probabilities: Exponential Distribution

Value WorksheetValue Worksheet
Using Excel to ComputeUsing Excel to ComputeExponential ProbabilitiesExponential Probabilities
A B
12 3 P (x < 2) 0.48664
Probabilities: Exponential Distribution

Relationship between the PoissonRelationship between the Poissonand Exponential Distributionsand Exponential Distributions
The Poisson distributionThe Poisson distributionprovides an appropriate descriptionprovides an appropriate description
of the number of occurrencesof the number of occurrencesper intervalper interval
The Poisson distributionThe Poisson distributionprovides an appropriate descriptionprovides an appropriate description
of the number of occurrencesof the number of occurrencesper intervalper interval
The exponential distributionThe exponential distributionprovides an appropriate descriptionprovides an appropriate description
of the length of the intervalof the length of the intervalbetween occurrencesbetween occurrences
The exponential distributionThe exponential distributionprovides an appropriate descriptionprovides an appropriate description
of the length of the intervalof the length of the intervalbetween occurrencesbetween occurrences