continuing vocational training survey 2010 (cvts 4) eu ... · pdf fileeuropean commission...
TRANSCRIPT

EUROPEAN COMMISSION EUROSTAT Directorate F: Social statistics Unit F-5: Education, health and social protection
Continuing Vocational Training Survey 2010
(CVTS 4)
EU Quality Report
(20 October 2015)
2
Table of Contents
1 Introduction .........................................................................................................................................4
2 CVT – definitions and classifications ....................................................................................................6
2.1 Definitions .....................................................................................................................................6
2.2 Classifications................................................................................................................................8
2.2.1 The classification of economic activities (NACE) ...................................................................8
2.2.2 Enterprise size classes..........................................................................................................10
3 Overview of designs and methods used for CVTS 4 ..........................................................................11
3.1 Coverage .....................................................................................................................................11
3.2 Compulsory participation............................................................................................................11
3.3 Reference period.........................................................................................................................11
3.4 Sampling design and sampling frames........................................................................................ 12
3.5 Weighting factors........................................................................................................................13
3.6 Methods of data collection .........................................................................................................14
4 Relevance ...........................................................................................................................................16
5 Accuracy .............................................................................................................................................18
5.1 Sampling errors ...........................................................................................................................18
5.2 Non-sampling errors ...................................................................................................................20
5.2.1 Coverage errors....................................................................................................................20
5.2.2 Measurement errors............................................................................................................22
5.2.3 Processing errors..................................................................................................................23
5.2.4 Non-response errors ............................................................................................................23
6 Timeliness and punctuality ................................................................................................................25
7 Accessibility and clarity ......................................................................................................................26

3
8 Coherence and comparability ............................................................................................................27
8.1 Differences in concepts and methods used................................................................................27
8.2 Comparability over time .............................................................................................................28
Annex I: Legal basis ...............................................................................................................................30
Annex II: Weighting procedures ...........................................................................................................31
Annex III: Country abbreviations ..........................................................................................................36
4
1 Introduction Lifelong learning is defined as "all the learning activities undertaken throughout life, with the aim of improving knowledge, skills and competences within a personal, civic, social and employment-related perspective". It is a key element in developing and promoting a skilled, trained and adaptable workforce.
Continuing vocational training (CVT) – being a specific component of lifelong learning – is a central theme in European lifelong learning strategies, and particularly with a view to the Europe 2020 strategy. The 'Agenda for new skills and jobs' flagship initiative aims to provide people with the right skills for employment throughout their working lives. Lifelong learning is a key element of this. To reach this aim and underpin the actions connected to this flagship initiative there is a need for quality data on skills, skill needs and training strategies, both at individual and enterprise levels.
Enterprise investment in CVT, designed to promote human capital resources, is a key dynamic of economic performance, competitiveness and employment in Europe and reflects the role of enterprises in resolving labour market imperfections and employment imbalances. A sound statistical tool reflecting the continuing vocational training activities of European enterprises is an indispensable asset in the assessment of enterprise competitiveness and workforce employability.
As a part of defining and assessing the situation of lifelong learning in European countries and in order to measure the enterprises' commitment to provide vocational training for their staff, the continuing vocational training survey (CVTS) was developed.
The first survey (CVTS 1) was carried out in 1994 in the then 12 Member States of the European Union based on a “gentlemen’s agreement” between countries and Eurostat. It was part of the action programme for the development of continuing vocational training in the European Community (FORCE) based on Council Decision 90/267/EEC of 29 May 1990.
The growing policy interest in data on continuing vocational training in enterprises together with the demand for CVT data to cover the 15 Member States led the Commission to promote a second and more developed Continuing Vocational Training Survey (CVTS 2) in 2000. This survey, covering CVT activities which took place in 1999, was carried out in all EU Member States, in Norway and in nine candidate countries based on a “gentlemen’s agreement” between countries and Eurostat.
The 3rd data collection (CVTS 3) was carried out in 2006 for CVT activities which took place in 2005. It was for the first time underpinned by a European legal act (Regulation (EC) No 1552/2005). Implementing details were provided in Commission Regulation (EC) No 198/2006.
5
An amendment to Commission Regulation (EC) No 198/2006 was prepared in 2009-2010 in order to further improve the quality of the results on vocational training in enterprises and lower the statistical burden on enterprises as well as to ensure coherence with the information to be made available through Regulation (EC) No 452/2008 concerning the production of statistics on education and lifelong learning, and in particular as regards the Adult Education Survey (AES). This resulted in Commission Regulation (EU) No 822/2010 which adapted the coding scheme as well as the sampling, precision and quality requirements for CVTS 4 by:
- simplifying the list of variables;
- adding a few variables to highlight in particular how continuing vocational training can help the enterprise meeting future skill needs;
- adapting the precision requirements to the classification of economic activities NACE Rev. 2 as well as additional requirements for the representativeness of the results in large countries (i.e. using a stratification based on six enterprise classes instead of three in the past), ensuring the production of more accurate EU results.
According to its legislation the survey is taking place every five years and its results are published on Eurostat's website. CVTS 4 with 2010 as the reference period had been carried out in 2011 and 2012. On the whole, all EU Member States (except Ireland) took part in the survey. Croatia (which was not a Member State at that time) and Norway also implemented CVTS 4.
The following report is the EU Quality Report of the 2010 Continuing Vocational Training Survey (CVTS 4). It is mainly based on the national standard quality reports received by Eurostat from participating countries1. Other metadata collected by Eurostat have also been used when possible as well as further documents on the CVTS project and updates reported by CVTS national coordinators.
The structure of this report follows the chapters on the quality of statistical outputs of the European Statistics Code of Practice of the European Statistical System. All dimensions of quality for statistical outputs are considered: relevance, accuracy and reliability, timeliness and punctuality, coherence and comparability, accessibility and clarity. Many dimensions have sub-components which are explained at the beginning of each section. The acronym CVT largely used in the report stands for continuing vocational training.
1 At the time of drafting this report, the Greek quality report was still missing and the quality report from the United Kingdom was only partially filled in.
6
2 CVT – definitions and classifications
2.1 Definitions
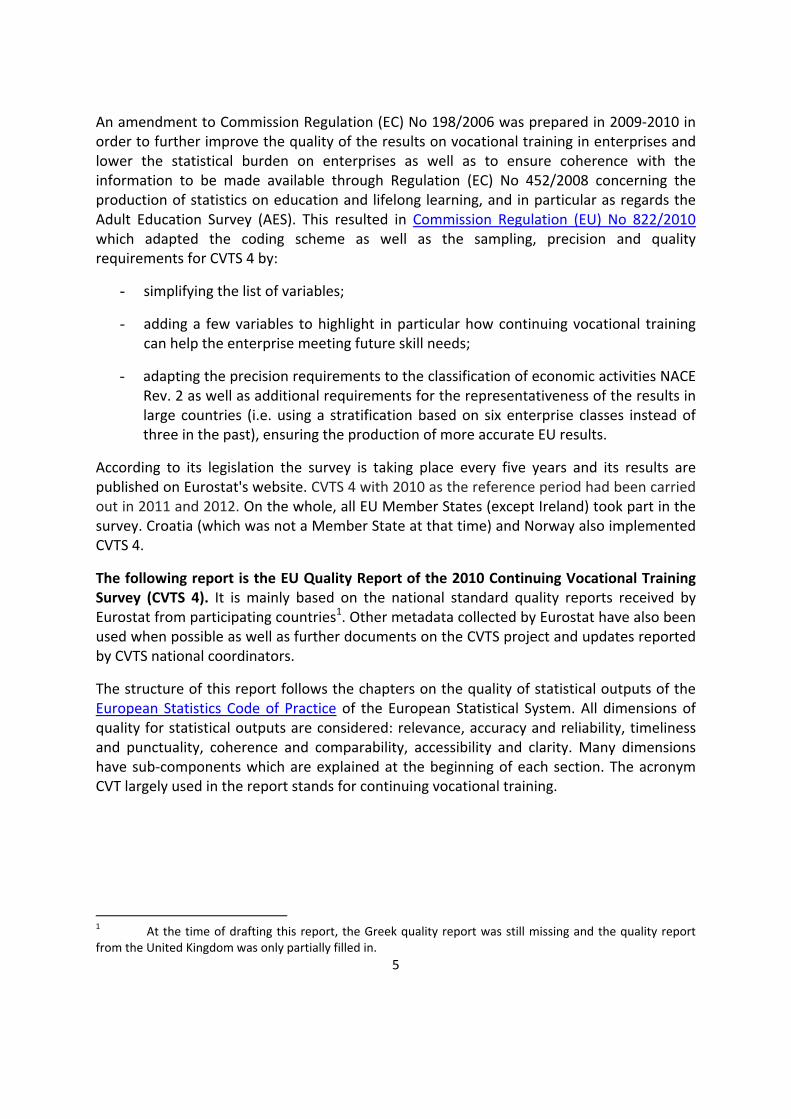
The primary objective of CVTS 4 was to collect data on continuing vocational training (CVT) in enterprises, and in particular
• the strategies of enterprises in training their persons employed, • the training intensity (number of participants, training hours), • the training modalities, • the costs of training.
The following main terms/concepts apply. For further information see the CVTS 4 manual.
Term Definition
Enterprises Council Regulation (EEC) No 696/93 of 15 March 1993 on the statistical units for the observation and analysis of the production system in the Community:
The enterprise is the smallest combination of legal units that is an organisational unit producing goods or services, which benefits from a certain degree of autonomy in decision-making, especially for the allocation of its current resources. An enterprise carries out one or more activities at one or more locations. An enterprise may be a sole legal unit.
Continuing vocational training (CVT)
Continuing vocational training are training measures or activities which have as their primary objectives the acquisition of new competencies or the development and improvement of existing ones and which must be financed at least partly by the enterprises for their persons employed who either have a working contract or who benefit directly from their work for the enterprise such as unpaid family workers and casual workers. Persons employed holding an apprenticeship or training contract should not be taken into consideration for CVT (these could be relevant candidates for IVT).
The training measures or activities must be planned in advance and must be organised or supported with the special goal of learning. Random learning and initial vocational training (IVT) are explicitly excluded.

7
Term Definition
Initial vocational training (IVT)
In CVTS 4, initial vocational training (IVT) is restricted to apprenticeships at ISCED 1997 level 2 to 4. The following criteria apply:
(1) The apprenticeship must be a (component of a) formal programme at ISCED 1997 level 2 to 4.
(2) The completion of the apprenticeship is mandatory to obtain a qualification or certification for this programme.
(3) The duration of the apprenticeship is from 6 months to 6 years.
(4) The apprentices receive remuneration.
The measure is often financed (partly or wholly) by the enterprise although this is not a mandatory condition. Apprentices often have a special training contract.
CVT courses CVT courses are typically clearly separated from the active work place (learning takes place in locations specially assigned for learning like a classroom or training centre).
They exhibit a high degree of organisation (time, space and content) by a trainer or a training institution. The content is designed for a group of learners (e.g. a curriculum exists).
Two distinct types of CVT courses are identified: - internal CVT courses - external CVT courses
Other forms of CVT Other forms of continuing vocational training are typically connected to the active work and the active work place, but they can also include attendances (instruction) at conferences, trade fairs etc. for the purpose of learning.
They are often characterised by a degree of self-organisation (time, space and content) by the individual learner or by a group of learners. The content is often tailored according to the learners’ individual needs in the workplace. In the context of CVTS 4 the following types of other forms of CVT are identified: - Planned training through guided on-the-job training; - Planned training through job-rotation, exchanges, secondments or study visits; - Planned training through participation in learning or quality circles; - Planned training through self-directed learning; - Planned training through attendance (instruction received) at conferences, workshops, trade fairs and lectures.

8
Term Definition
Principal economic activity of the enterprise
According to the NACE Rev. 2 classification, the principal economic activity of the organisation is the activity that contributes most to the gross value added at factor cost. The NACE code of the enterprise should be taken from the statistical business register (SBR) or be coded to the NACE 4-digit level on the basis of information supplied by the enterprises.
Persons employed Persons employed are: - working proprietors, partners working regularly in enterprise, unpaid family workers; - persons from the enterprise and paid by it who work away from the enterprise (e.g. sales representatives, delivery personnel, repair and maintenance teams), part-time workers and seasonal workers; - people absent for a short period (e.g. sick leave, paid leave or special leave); - those on strike but not absent for an indefinite period.
It excludes anyone who is working at the enterprise but whose salary is paid by another company, e.g. persons employed of firms under contract or seconded staff. Also not included are persons absent and not being paid during the whole reference period (e.g. for parental leave or long time compulsory military service).
2.2 Classifications
2.2.1 The classification of economic activities (NACE) NACE is the “statistical classification of economic activities in the European Community” and is subject to legislation at the European Union level, which imposes the use of the classification uniformly within all the Member States. It is the European standard classification of productive economic activities. NACE presents the universe of economic activities partitioned in such a way that a NACE code can be associated with a statistical unit carrying them out.
To ensure comparability of the results across all countries, NACE Rev. 22 was used to define and categorise the main activities of the enterprises. The following table provides information on the grouping of economic activities used in CVTS 4.
2 See also http://ec.europa.eu/eurostat/web/nace-rev2/overview.

9
NACE 20: Categories for sample size calculations and analysis in CVTS 4
NACE 20
codes
Section/ Sub-
section Division Name
2001 B B05-B09 Mining and quarrying 2002 C C10-C12 Manufacture of food products; beverages; tobacco products 2003 C C13-C15 Manufacture of textiles; wearing apparel; leather and related products
2004 C C17-C18 Manufacture of paper and paper products; printing and reproduction of recorded media
2005 C C19-C23 Manufacture of coke and refined petroleum products; chemicals and chemical products; basic pharmaceutical products and pharmaceutical preparations; rubber and plastic products; other non-metallic mineral products
2006 C C24-C25 Manufacture of basic metals; fabricated metal products, except machinery and equipment
2007 C C26-C28+ C33
Manufacture of computer, electronic and optical products; electrical equipment; machinery and equipment n.e.c.; repair and installation of machinery and equipment
2008 C C29-C30 Manufacture of motor vehicles, trailers and semi-trailers; other transport equipment
2009 C C16+ C31-C32
Manufacture of wood and of products of wood and cork, except furniture; manufacture of articles of straw and plaiting materials; furniture; other manufacturing
2010 D-E D-E Electricity, gas, steam and air conditioning supply; water supply; sewerage, waste management and remediation activities
2011 F F Construction 2012 G G45 Wholesale and retail trade and repair of motor vehicles and motorcycles
2013 G G46 Wholesale trade, except of motor vehicles and motorcycles
2014 G G47 Retail trade, except of motor vehicles and motorcycles
2015 H H Transportation and storage
2016 I I Accommodation and food service activities 2017 J J Information and communication
2018 K K64-K65 Financial service activities, except insurance and pension funding; insurance, reinsurance and pension funding, except compulsory social security
2019 K K66 Activities auxiliary to financial services and insurance activities
2020 L, M, N, R, S
L+M+N+R+S
Real estate activities; professional, scientific and technical activities; administrative and support service activities; arts, entertainment and recreation; other service activities
10
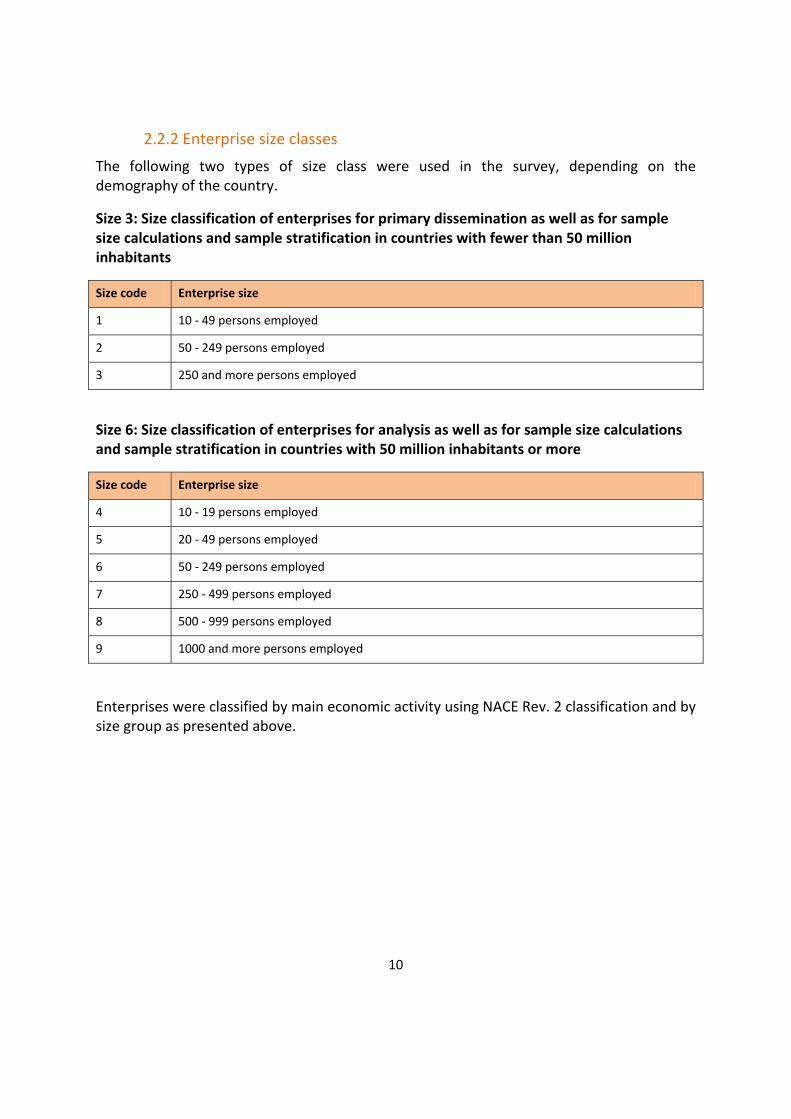
2.2.2 Enterprise size classes The following two types of size class were used in the survey, depending on the demography of the country.
Size 3: Size classification of enterprises for primary dissemination as well as for sample size calculations and sample stratification in countries with fewer than 50 million inhabitants
Size code Enterprise size
1 10 - 49 persons employed
2 50 - 249 persons employed
3 250 and more persons employed
Size 6: Size classification of enterprises for analysis as well as for sample size calculations and sample stratification in countries with 50 million inhabitants or more
Size code Enterprise size
4 10 - 19 persons employed
5 20 - 49 persons employed
6 50 - 249 persons employed
7 250 - 499 persons employed
8 500 - 999 persons employed
9 1000 and more persons employed
Enterprises were classified by main economic activity using NACE Rev. 2 classification and by size group as presented above.

11
3 Overview of designs and methods used for CVTS 4
3.1 Coverage The survey has been implemented in 28 countries in total: all Member States of the European Union of that time except Ireland, one candidate country (Croatia which was not a Member State at that time) and one EFTA country (Norway). All the territories of participating countries are covered, with the following exceptions:
Cyprus – which only covers the areas under the control of the government of the Republic of Cyprus,
France – which excluded the overseas departments and territories ("Départements d'outre-mer"),
Norway – which did not include Svalbard, Spain – which excluded Ceuta and Melilla (approximately 0.2% of the enterprises
which have more than one employee).
The CVTS 4 sample is composed of enterprises as described by Commission Regulation (EU) No 822/2010 in terms of size and economic sectors. Survey preparation, training, fieldwork and processing had been carried out by National Statistical Authorities (NSAs) – being either National Statistical Institutes (24 countries) or ministries and other public entities (Spain – Ministry of Employment and Social Security, France – Centre d'études et de recherches sur les qualifications / Céreq, Portugal – Office of Strategy and Planning of the Ministry of Solidarity and Social Security, United Kingdom – Department for Business, Innovation and Skills) – in permanent cooperation with and following the recommendations made by Eurostat.
3.2 Compulsory participation The participation of selected respondents (i.e. enterprises) was made compulsory at national level in 19 participating countries (Bulgaria, Czech Republic, Estonia, Spain, France, Croatia, Italy, Cyprus, Latvia, Lithuania, Luxembourg, Hungary, Malta, Netherlands, Poland, Portugal, Romania, Slovenia and Finland) and was on a voluntary basis in eight countries (Belgium, Denmark, Germany, Austria, Slovakia, Sweden, United Kingdom and Norway).
3.3 Reference period The reference period of the CVTS 4 survey is the calendar year of 2010. Participating countries used the same reference period but the fieldwork period differs from one country to another and spanned across 2011 and 2012 (see table 9).
12
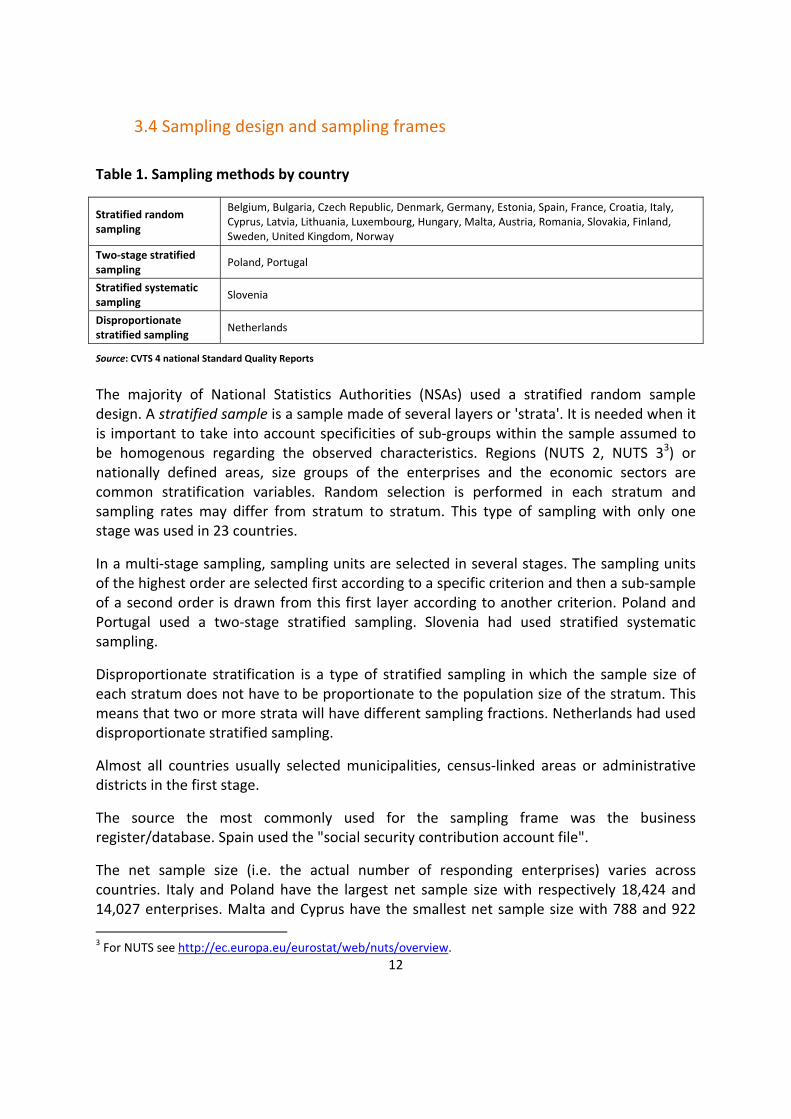
3.4 Sampling design and sampling frames Table 1. Sampling methods by country
Stratified random sampling
Belgium, Bulgaria, Czech Republic, Denmark, Germany, Estonia, Spain, France, Croatia, Italy, Cyprus, Latvia, Lithuania, Luxembourg, Hungary, Malta, Austria, Romania, Slovakia, Finland, Sweden, United Kingdom, Norway
Two-stage stratified sampling Poland, Portugal
Stratified systematic sampling Slovenia
Disproportionate stratified sampling Netherlands
Source: CVTS 4 national Standard Quality Reports
The majority of National Statistics Authorities (NSAs) used a stratified random sample design. A stratified sample is a sample made of several layers or 'strata'. It is needed when it is important to take into account specificities of sub-groups within the sample assumed to be homogenous regarding the observed characteristics. Regions (NUTS 2, NUTS 33) or nationally defined areas, size groups of the enterprises and the economic sectors are common stratification variables. Random selection is performed in each stratum and sampling rates may differ from stratum to stratum. This type of sampling with only one stage was used in 23 countries.
In a multi-stage sampling, sampling units are selected in several stages. The sampling units of the highest order are selected first according to a specific criterion and then a sub-sample of a second order is drawn from this first layer according to another criterion. Poland and Portugal used a two-stage stratified sampling. Slovenia had used stratified systematic sampling.
Disproportionate stratification is a type of stratified sampling in which the sample size of each stratum does not have to be proportionate to the population size of the stratum. This means that two or more strata will have different sampling fractions. Netherlands had used disproportionate stratified sampling.
Almost all countries usually selected municipalities, census-linked areas or administrative districts in the first stage.
The source the most commonly used for the sampling frame was the business register/database. Spain used the "social security contribution account file".
The net sample size (i.e. the actual number of responding enterprises) varies across countries. Italy and Poland have the largest net sample size with respectively 18,424 and 14,027 enterprises. Malta and Cyprus have the smallest net sample size with 788 and 922 3 For NUTS see http://ec.europa.eu/eurostat/web/nuts/overview.

13
enterprises. The rate of the net sample size to the target population ranges from 1.1% in Germany to 43.3% in Malta.
Table 2. Net sample size and target population
Country Net sample size Target population Rate of the net sample size (% of target population)
Belgium 3,434 28,287 12.1
Bulgaria 3,772 32,421 11.6
Czech Republic 7,789 43,403 17.9
Denmark 1,242 18,571 6.7
Germany 3,047 265,587 1.1
Estonia 2,185 6,183 35.3
Greece 1,597 : :
Spain 6,667 151,882 4.4
France 5,411 188,593 2.9
Croatia 2,389 13,981 17.1
Italy 18,424 219,106 8.4
Cyprus 922 3,947 23.4
Latvia 3,287 9,293 35.4
Lithuania 4,153 13,194 31.5
Luxembourg 1,253 4,198 29.8
Hungary 5,125 31,870 16.1
Malta 788 1,820 43.3
Netherlands 4,139 51,174 8.1
Austria 1,448 38,513 3.8
Poland 14,027 97,648 14.4
Portugal 3,888 40,413 9.6
Romania 7,733 51,823 14.9
Slovenia 1,540 7,697 20.0
Slovakia 2,207 16,436 13.4
Finland 1,560 16,383 9.5
Sweden 2,014 35,697 5.6
United Kingdom 3,570 134,680 2.7
Norway 2,527 22,804 11.1
Source: CVTS 4 national Standard Quality Reports
3.5 Weighting factors Weighting is a mathematical procedure used when performing a mathematical operation to give more influence to some elements on the result than other elements in the same set. In surveys, a weight is assigned to each record in the dataset (a record being a
14
respondent/enterprise) so that when a sum or average or ratio is calculated based on the sample, the result will be representative of the whole population.
Annex II of this report gives a description of the weighting procedures used in each country – when available in the national quality report – to gross up the results from the sample to the target population.
3.6 Methods of data collection In CVTS 4, all countries used a stand-alone survey as survey vehicle; Portugal conducted the survey by using a process in which the questions on quantitative data were removed from the questionnaire and were obtained from an administrative source.
In nine countries (Bulgaria, Denmark, Spain, France, Croatia, Cyprus, Lithuania, Sweden and the United Kingdom) pilot CVTS 4 questionnaires had been tested.
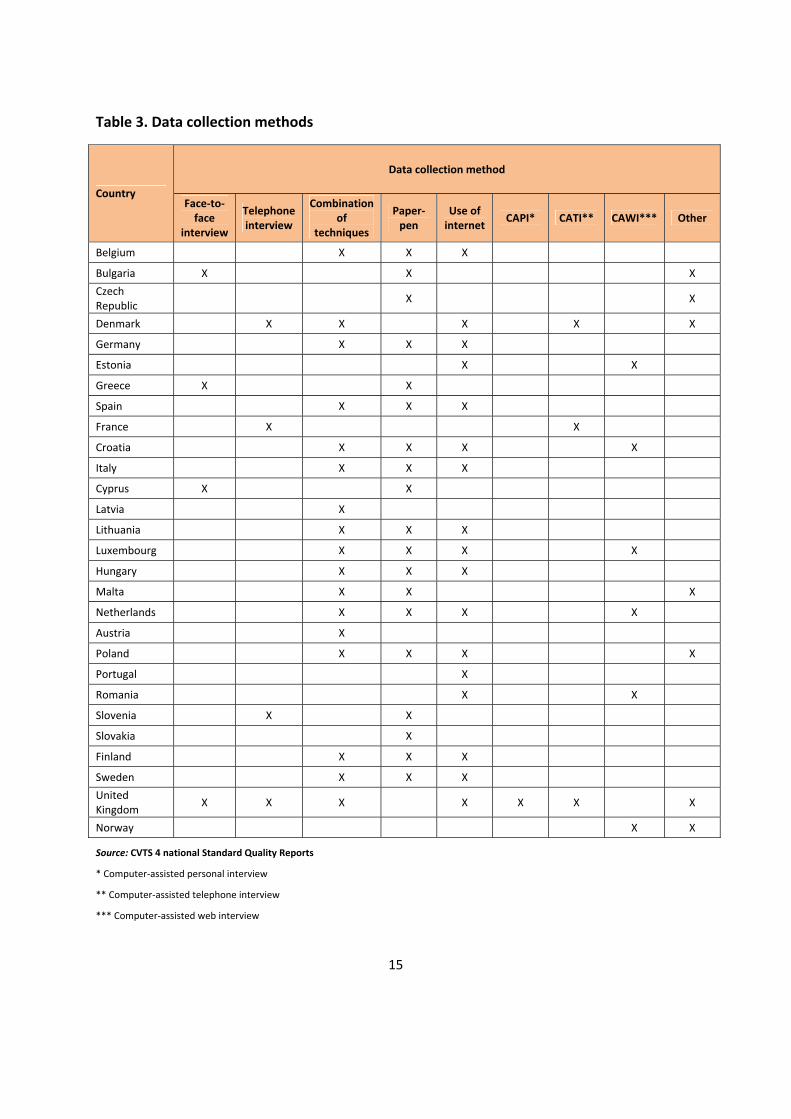
The most common data collection method is paper/pen interview but using the internet in different ways (e.g. web-survey) is also widespread. Table 3 provides information on the methods used for collecting the data.
A combination of different methods to collect the data was used in 17 countries: Belgium, Denmark, Germany, Spain, Croatia, Italy, Latvia, Lithuania, Luxembourg, Hungary, Malta, the Netherlands, Austria, Poland, Finland, Sweden and the United Kingdom.
15
Table 3. Data collection methods
Data collection method
Country Face-to-
face interview
Telephone interview
Combination of
techniques
Paper-pen
Use of internet CAPI* CATI** CAWI*** Other
Belgium X X X
Bulgaria X X X Czech Republic X X
Denmark X X X X X
Germany X X X
Estonia X X
Greece X X
Spain X X X
France X X
Croatia X X X X
Italy X X X
Cyprus X X
Latvia X
Lithuania X X X
Luxembourg X X X X
Hungary X X X
Malta X X X
Netherlands X X X X
Austria X
Poland X X X X
Portugal X
Romania X X
Slovenia X X
Slovakia X
Finland X X X
Sweden X X X United Kingdom X X X X X X X
Norway X X
Source: CVTS 4 national Standard Quality Reports
* Computer-assisted personal interview
** Computer-assisted telephone interview
*** Computer-assisted web interview

16
4 Relevance Relevance is the degree to which statistics meet current and potential user needs. It shows whether all statistics that are needed are produced and the extent to which concepts used (definitions, classifications etc.) reflect user needs. The main users of CVTS 4 statistics may be classified into the following categories:
Policy makers: government institutions, ministries (education, labour and others); Researchers and students: universities, research institutions, vocational
institutions, students; Enterprises: enterprises, training companies, management consultants; Social actors: social partners (e.g. trade unions), multi-national organisations; Media.
The various users’ needs are underpinned by the interest on education and training in all European countries. The main requests reported refer to the evaluation and better understanding of training practices across Europe, the publication and analysis of CVTS 4 data and the preparation of policies and public measures on vocational training. In addition, there is a general need for reliable and detailed data on training that may be used for either international or national comparisons with relevant data from other sources. Also CVTS 4 national data could be used for training policies of the enterprises.
Within their quality reports, countries have given their evaluation of the relevance of the main CVTS statistics at national level featuring policy makers, social actors, the media, researchers and students and enterprises (Table 4). Spain and Latvia did not fill in the relevance part of the quality report. Luxembourg and Slovakia filled in the relevance item of the quality report only partially: Luxembourg for instance reported not to have much feedback from researchers/students and enterprises about their use of CVTS data.
The relevance is high for researchers and students in most of the countries and for all of the main CVTS statistics. The relevance for policy makers is also considered to be quite high. On the contrary, CVTS statistics appear to be of lower relevance on the whole for media and enterprises.
In particular CVT volume (participants, hours of training) and CVT characteristics (e.g. external/internal, subjects/providers) are the topics which prove to be the most relevant both in terms of users interested in the topic and number of countries considering them to be relevant.

17
Table 4. High relevance of the main topics collected though CVTS by type of users
Main CVTS statistics
For policy makers
For social actors For the media For researchers and
students For enterprises
Background data
BE, CY, CZ, EE, FR, HU, IT, LT, NO, PL, PT, RO, UK
BE, CZ, FR, PT, RO, UK
EE, FR, LT, LU, PT
AT, BE, CY, CZ, DK, EE, FR, HU, HR, LT, MT, PL, PT, RO, SI, SK, UK
BE, EE, HR, LT, PT
CVT strategies (objectives, decision process, measures)
BE, CY, CZ, DK, DE, EE, FI, FR, LT, LU, MT, PL, SK, UK
BE, BG, CY, CZ, DE, FI, FR, HU, IT, LU, MT, NO, PL, UK
BG, CY, EE, FR, IT
AT, BE, CY, DK, DE, EE, FI, FR, HU, HR, LT, MT, PL, PT, SI, UK
BE, BG, CZ, DE, EE, HR, MT, PL
CVT characteristics (external/ internal, subjects/ providers)
BE, BG, CY, DK, DE, EE, FI, HU, IT, LT, LU, PL, PT, RO, SK, UK
BE, BG, CY, DE, FI, HR, IT, LT, LU, NL, PL, PT, RO, SK, UK
BG, CY, EE, FI, IT, LU, NL
AT, BE, BG, CY, DK, DE, EE, FI, HU, HR, IT, LT, NO, PL, PT, RO, SI, SK, UK
BE, BG, CY, DK, DE, EE, FI, HU, HR, IT, MT, PL, SK
CVT volume (participants, training hours)
BE, BG, CY, CZ, DK, DE, EE, FI, FR, HU, IT, LT, LU, MT, NL, NO, PL, PT, RO, UK
BE, BG, CY, CZ, DK, DE, FI, FR, HU, HR, IT, LT, LU, MT, NL, NO, PL, PT, RO, SK, UK
BG, CY, CZ, DK, DE, EE, FI, FR, IT, LT, LU, NL, NO, PT
AT, BE, BG, CY, CZ, DK, DE, EE, FI, FR, HU, HR, IT, LT, MT, NO, PL, PT, RO, UK
BE, BG, CY, DK, DE, EE, FI, HR, IT, LT, MT, PT, SK
CVT costs
BE, CY, DE, EE, FI, FR, LT, LU, MT, NL, NO, PL, PT, RO, UK
BE, CY, CZ, DE, FI, FR, HR, IT, LT, LU, NL, NO, PT, RO, SK, UK
BG, CY, CZ, DE, FI, FR, IT, LT, LU, NL, MT, PT
AT, BE, BG, CY, CZ, DK, DE, EE, FI, FR, HU, HR, IT, LT, NO, PL, PT, RO, SI, SK, UK
BE, CZ, DK, DE, EE, FI, HR, LT, MT, NL, NO, PT, SK
CVT quality, outcomes and difficulties
BE, BG, CY, DK, EE, FI, FR, LT, LU, MT, PL, SK, UK
BE, BG, CY, DE, FI, FR, IT, LT, LU, MT, UK
BG, CY, CZ, EE, FI, FR
AT, BE, BG, CY, CZ, DK, DE, EE, FI, FR, HU, HR, IT, LT, MT, PL, PT, RO, SI, UK
BE, BG, CZ, DK, DE, EE, FI, HR, MT, SK
IVT BE, CY, IT, LU, MT, PL, UK
BE, DK, FI, HU, LU, MT, UK DK, DE, LU
AT, BE, CY, CZ, DK, FI, HU, LT, PL, PT, UK
BE, BG, MT
Source: CVTS 4 national Standard Quality Reports
18
5 Accuracy The accuracy is the degree of closeness of estimates to the true values. Variability (caused by random effects) and bias (average differences caused by systematic effects) are the reasons for differences between the statistical estimates and the true values.
Sampling errors apply only to sample surveys: they are due to the fact that only a subset of the population is selected, usually randomly. Non-sampling errors apply to all statistical processes and encompass: coverage errors, measurement errors, processing errors, etc.
5.1 Sampling errors Sampling errors are caused by the situation that not all units of the frame population can be surveyed. CVTS 4 uses random sampling. The variability of an estimator around its expected value may be expressed by its variance, standard error, coefficient of variation or confidence interval. The indicators available from the national CVTS 4 quality reports are standard error and coefficient of variation.
Standard error (SE) is the standard deviation of the sampling distribution of a statistic. The term may also be used to refer to an estimate of that standard deviation, derived from a particular sample used to compute the estimate.
Coefficient of variation (CV) is a normalized measure of dispersion of a probability distribution or frequency distribution in probability theory and statistics. It is defined as the ratio of the standard deviation to the mean. It is also known as unitised risk or the variation coefficient. The absolute value of the CV is sometimes known as relative standard deviation (RSD), which is expressed as a percentage. In CVTS 4, the large majority of the coefficients of variation for the given basic CVT indicators are inferior to 0.05 (see table 5).

19
Table 5. Main CVT indicators and their coefficient of variation
Training enterprises as a share of
all enterprises (source: trng_cvts01)
Percentage of employees (all enterprises)
participating in CVT courses (source: trng_cvts13) Countries
Estimator (%) Coefficient of variation Estimator (%) Coefficient of
variation European Union (28 countries)* 66 : 38 :
Belgium 78 0.01 52 0.02
Bulgaria 31 0.02 22 0.08
Czech Republic 72 0.01 61 0.01
Denmark 91 0.01 37 0.07
Germany 73 0.02 39 0.04
Estonia 68 0.01 31 0.02
Greece 28 : 16 :
Spain 75 0.01 48 0.01
France 76 0.01 45 0.03
Croatia 57 0.02 23 0.05
Italy 56 0.01 36 0.01
Cyprus 72 0.00 37 0.00
Latvia 40 0.04 24 0.01
Lithuania 52 0.02 19 0.02
Luxembourg 71 0.02 51 0.02
Hungary 49 0.03 19 0.02
Malta 54 0.03 36 0.07
Netherlands 79 0.05 39 0.06
Austria 87 0.02 33 0.05
Poland 23 0.02 31 0.01
Portugal 65 0.02 40 0.02
Romania 24 0.01 18 0.00
Slovenia 68 0.02 43 0.02
Slovakia 69 0.03 44 0.02
Finland 74 0.01 40 0.03
Sweden 87 0.00 47 0.04
United Kingdom 80 : 31 :
Norway 97 0.01 46 0.02
* without Ireland
Source: CVTS 4 national Standard Quality Reports

20
5.2 Non-sampling errors
5.2.1 Coverage errors Coverage errors (or frame errors) are due to divergences between the frame population and the target population. The frame population is the population used to draw the sample and the target population is a sub-set of the latter, which is of particular interest for the topics tackled by the survey. The estimates and conclusions from the survey are therefore made for the target population. Main types of coverage errors are under-coverage (target population units that are not accessible via the frame) and over-coverage (units accessible via the frame which do not belong to the target population). Multiple listings or misclassification are types of frame deficiency.
Table 6. Coverage of population – ineligible cases
Country Ineligible: out-of-scope Other ineligible Number of eligible elements Total (gross sample size)
Belgium 92 0 9,039 9,131 Bulgaria 788 143 4,276 5,207 Czech Republic 301 0 8,918 9,219 Denmark 8 0 3,036 3,044 Germany 193 390 10,060 10,643 Estonia 0 21 2,979 3,000 Greece : : : : Spain 177 2 7,044 7,223 France 472 404 8,075 8,951 Croatia 120 85 3,795 4,000 Italy 2,073 2,012 34,628 38,713 Cyprus 102 67 831 1,000 Latvia 84 0 3,811 3,895 Lithuania 78 0 4,296 4,374 Luxembourg 22 25 1,554 1,601 Hungary 0 0 7,196 7,196 Malta 38 0 1,327 1,365 Netherlands 62 0 5,377 5,439 Austria 14 67 3,472 3,553 Poland 993 0 19,007 20,000 Portugal 0 0 6,526 6,526 Romania : : : 9,426 Slovenia 1 21 1,882 1,904 Slovakia 178 104 2,544 2,826 Finland 77 0 2,863 2,940 Sweden : : : 6,000 United Kingdom : : : 5,357 Norway : : : 3,537
Source: CVTS 4 national Standard Quality Reports

21
Comments made by the participating countries about possible shortcomings of the sampling frame are shown in the table 7 below. Denmark, Germany, Estonia, Lithuania, Luxembourg, Malta, Netherlands, Austria, Poland, Romania and Slovenia did not report any specific shortcomings of their national sampling frames.
Table 7. Frame shortcomings
Country Frame shortcomings
Belgium The sample was drawn on 17 December 2010 (the extraction was available on the same day). The DBRIS-register is updated each quarter. That is why a new updated extraction is used when calculating the weights (a version from 5 January 2012).
Bulgaria Due to the recommendations for implementation of the survey as early as possible in 2011 the population frame was not updated with the latest results. The shortcoming based on the time lag between state of the sampling frame and the moment of the interview caused an increased over coverage - enterprises with less than 10 employees or without any activity in 2011.
Czech Republic
The target population is different from frame. This means that an under coverage is possible if only estimated from responding units. Slight over coverage is used to reduce under coverage.
Spain The Social Security contribution accounts only include workers covered by the Social Security regime (although these are the majority). Workers included under the Special Regime for Civil Servants are not included but the majority work in agencies with NACE 84 and 85 would therefore not be included in the target population. Contribution accounts are updated continuously.
France The French Statistical Business Register (SIRENE register) can be useful as a database due to the vast amount of administrative data which it contains, since enterprises are identified in all national registers by their SIRENE number. Therefore some data is updated daily, although there is no updating of all the data at the same time on a fixed date. That also means that for a given variable the update is not the same for all enterprises, so that the value available is the one most recently registered for this enterprise. The SIRENE register displays, among others, the following information that was used in the sampling step and later: - SIRENE number - Number of employees on 31 December of the year preceding the update (e.g. the 2011 SIRENE register gives the number of employees on 31.12.2010) - Industry classification (NAF) - Address - Number of establishments if any, and their SIRET numbers and addresses - Whether the enterprise is active or not (and the date of end of activities, if relevant)
Croatia Time lag between the last update of the sampling frame and the moment of the actual sampling. Due to that certain number of enterprises have become ineligible, some of them have reduced number of employees, and were not taken into data processing and one has changed NACE activity, and was weighted 0 during the processing.
Italy No problems of under-coverage were found even though, when comparing the information on the sampled enterprises available at the time of launching the survey (year t-1) and the information available at the end of the survey (mainly as a result of the updating of the BR to the year t), some discrepancies can be found. For instance, wrong or missing information on the addresses of sampled enterprises can be found for a percentage of about 3-4 % of the sample.
Cyprus The only known shortcoming of the "Statistical Business Register" is that employment is only updated once a year and therefore we faced some differences in the employment of the enterprises. For this reason some selected enterprises in the 10-49 size group were found at the time of the interview, with less than 10 employees and had to be excluded from the sample.
Latvia The time lag between the last update of the sampling frame and the moment of the actual sampling was approximately 1 month.
22
Country Frame shortcomings
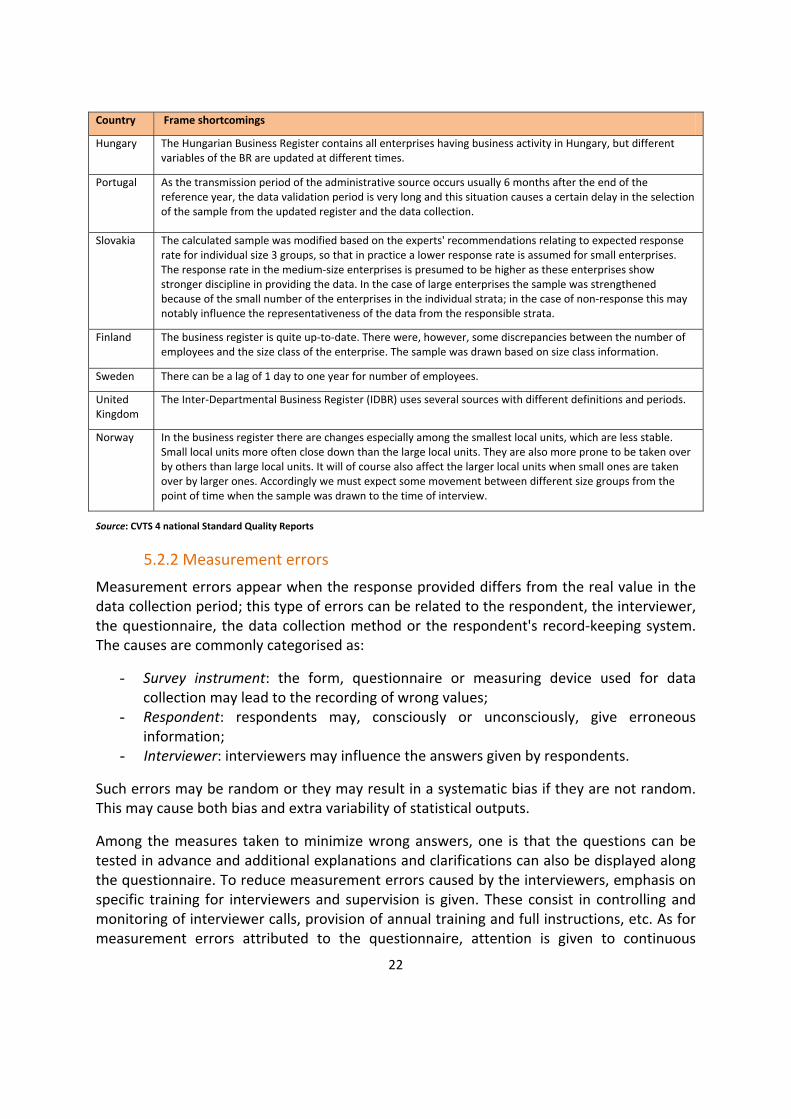
Hungary The Hungarian Business Register contains all enterprises having business activity in Hungary, but different variables of the BR are updated at different times.
Portugal As the transmission period of the administrative source occurs usually 6 months after the end of the reference year, the data validation period is very long and this situation causes a certain delay in the selection of the sample from the updated register and the data collection.
Slovakia The calculated sample was modified based on the experts' recommendations relating to expected response rate for individual size 3 groups, so that in practice a lower response rate is assumed for small enterprises. The response rate in the medium-size enterprises is presumed to be higher as these enterprises show stronger discipline in providing the data. In the case of large enterprises the sample was strengthened because of the small number of the enterprises in the individual strata; in the case of non-response this may notably influence the representativeness of the data from the responsible strata.
Finland The business register is quite up-to-date. There were, however, some discrepancies between the number of employees and the size class of the enterprise. The sample was drawn based on size class information.
Sweden There can be a lag of 1 day to one year for number of employees.
United Kingdom
The Inter-Departmental Business Register (IDBR) uses several sources with different definitions and periods.
Norway In the business register there are changes especially among the smallest local units, which are less stable. Small local units more often close down than the large local units. They are also more prone to be taken over by others than large local units. It will of course also affect the larger local units when small ones are taken over by larger ones. Accordingly we must expect some movement between different size groups from the point of time when the sample was drawn to the time of interview.
Source: CVTS 4 national Standard Quality Reports
5.2.2 Measurement errors Measurement errors appear when the response provided differs from the real value in the data collection period; this type of errors can be related to the respondent, the interviewer, the questionnaire, the data collection method or the respondent's record-keeping system. The causes are commonly categorised as:
- Survey instrument: the form, questionnaire or measuring device used for data collection may lead to the recording of wrong values;
- Respondent: respondents may, consciously or unconsciously, give erroneous information;
- Interviewer: interviewers may influence the answers given by respondents.
Such errors may be random or they may result in a systematic bias if they are not random. This may cause both bias and extra variability of statistical outputs.
Among the measures taken to minimize wrong answers, one is that the questions can be tested in advance and additional explanations and clarifications can also be displayed along the questionnaire. To reduce measurement errors caused by the interviewers, emphasis on specific training for interviewers and supervision is given. These consist in controlling and monitoring of interviewer calls, provision of annual training and full instructions, etc. As for measurement errors attributed to the questionnaire, attention is given to continuous
23
checking of its design by improving the questions, incorporating explanatory text, coding and testing.
Nine countries resorted to pilot tests for their CVTS 4 questionnaire (see 3.6 Methods of data collection above).
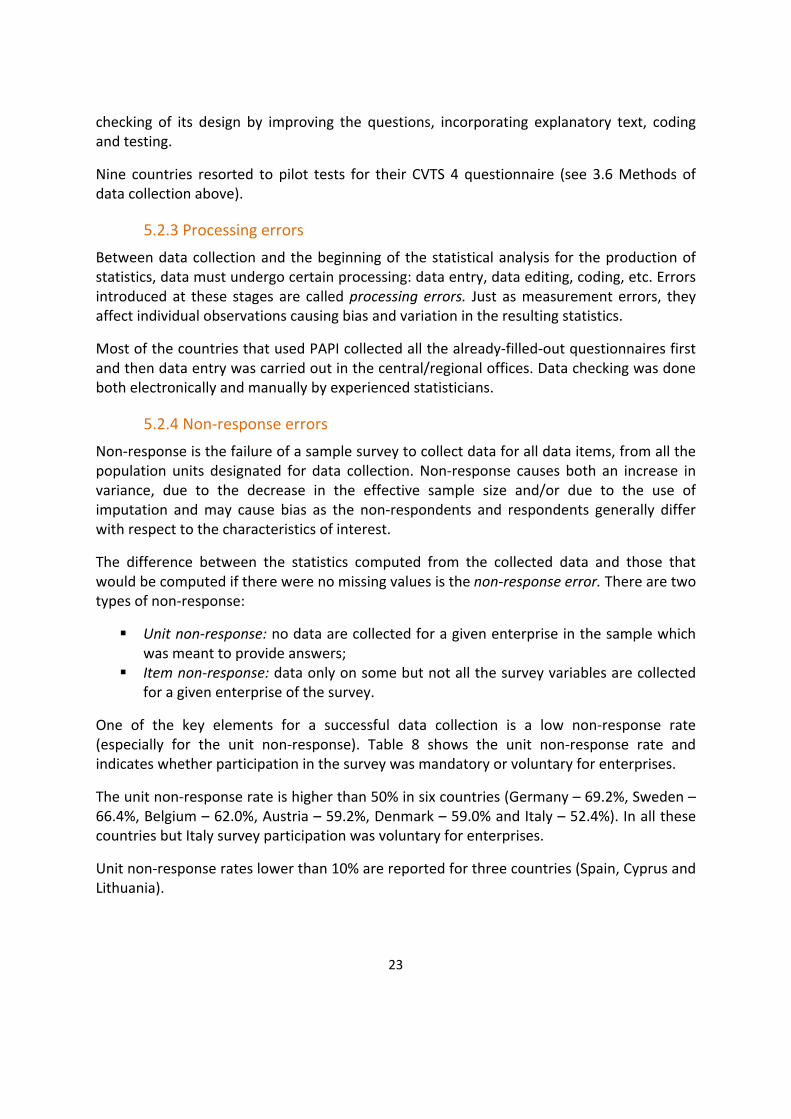
5.2.3 Processing errors Between data collection and the beginning of the statistical analysis for the production of statistics, data must undergo certain processing: data entry, data editing, coding, etc. Errors introduced at these stages are called processing errors. Just as measurement errors, they affect individual observations causing bias and variation in the resulting statistics.
Most of the countries that used PAPI collected all the already-filled-out questionnaires first and then data entry was carried out in the central/regional offices. Data checking was done both electronically and manually by experienced statisticians.
5.2.4 Non-response errors Non-response is the failure of a sample survey to collect data for all data items, from all the population units designated for data collection. Non-response causes both an increase in variance, due to the decrease in the effective sample size and/or due to the use of imputation and may cause bias as the non-respondents and respondents generally differ with respect to the characteristics of interest.
The difference between the statistics computed from the collected data and those that would be computed if there were no missing values is the non-response error. There are two types of non-response:
Unit non-response: no data are collected for a given enterprise in the sample which was meant to provide answers;
Item non-response: data only on some but not all the survey variables are collected for a given enterprise of the survey.
One of the key elements for a successful data collection is a low non-response rate (especially for the unit non-response). Table 8 shows the unit non-response rate and indicates whether participation in the survey was mandatory or voluntary for enterprises.
The unit non-response rate is higher than 50% in six countries (Germany – 69.2%, Sweden – 66.4%, Belgium – 62.0%, Austria – 59.2%, Denmark – 59.0% and Italy – 52.4%). In all these countries but Italy survey participation was voluntary for enterprises.
Unit non-response rates lower than 10% are reported for three countries (Spain, Cyprus and Lithuania).
24
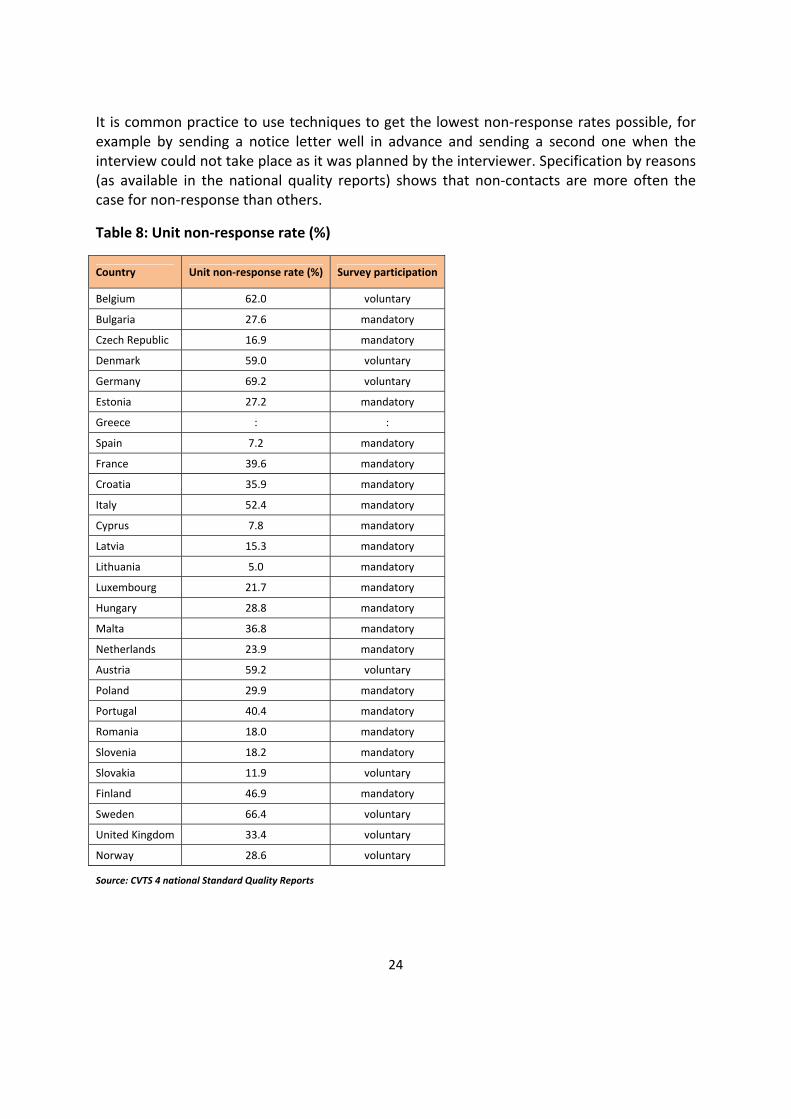
It is common practice to use techniques to get the lowest non-response rates possible, for example by sending a notice letter well in advance and sending a second one when the interview could not take place as it was planned by the interviewer. Specification by reasons (as available in the national quality reports) shows that non-contacts are more often the case for non-response than others.
Table 8: Unit non-response rate (%)
Country Unit non-response rate (%) Survey participation
Belgium 62.0 voluntary
Bulgaria 27.6 mandatory
Czech Republic 16.9 mandatory
Denmark 59.0 voluntary
Germany 69.2 voluntary
Estonia 27.2 mandatory
Greece : :
Spain 7.2 mandatory
France 39.6 mandatory
Croatia 35.9 mandatory
Italy 52.4 mandatory
Cyprus 7.8 mandatory
Latvia 15.3 mandatory
Lithuania 5.0 mandatory
Luxembourg 21.7 mandatory
Hungary 28.8 mandatory
Malta 36.8 mandatory
Netherlands 23.9 mandatory
Austria 59.2 voluntary
Poland 29.9 mandatory
Portugal 40.4 mandatory
Romania 18.0 mandatory
Slovenia 18.2 mandatory
Slovakia 11.9 voluntary
Finland 46.9 mandatory
Sweden 66.4 voluntary
United Kingdom 33.4 voluntary
Norway 28.6 voluntary
Source: CVTS 4 national Standard Quality Reports

25
6 Timeliness and punctuality The timeliness of statistical outputs is the time lag between the event or phenomenon they describe and their availability.
Punctuality is the time lag between the release date of data and the target date on which they were scheduled for release as announced in an official release calendar, laid down by regulations or previously agreed among partners.
Table 9 shows the fieldwork period for the CVTS 4 survey for each country and displays the dates for delivery of the data to Eurostat.
Table 9. Fieldwork period and transmission of data to Eurostat
Fieldwork Transmission of data to Eurostat Country
Start date End date 1st version Last version Belgium 04/02/2011 08/08/2011 16/07/2012 Bulgaria 01/06/2011 31/07/2011 01/07/2012 02/11/2012 Czech Republic 25/03/2011 31/05/2011 30/05/2012 28/06/2012 Denmark 01/03/2011 26/06/2011 21/12/2012 21/12/2013 Germany 01/09/2011 31/03/2012 13/02/2013 25/02/2013 Estonia 01/01/2011 30/03/2011 17/04/2012 Greece : : 13/09/2013 17/09/2013 Spain 29/09/2011 15/12/2011 27/06/2012 France 01/04/2011 30/06/2011 01/07/2012 Croatia 01/09/2011 31/12/2011 03/09/2012 Italy 01/07/2011 15/06/2012 30/01/2013 Cyprus 12/07/2011 16/12/2011 01/05/2012 31/07/2012 Latvia 01/10/2011 31/12/2011 24/07/2012 Lithuania 01/04/2011 01/08/2011 01/03/2012 01/06/2012 Luxembourg 16/11/2011 20/04/2012 23/05/2012 12/06/2012 Hungary 15/01/2011 31/10/2011 22/05/2012 Malta 15/04/2011 30/09/2011 24/08/2012 03/12/2012 Netherlands 29/04/2011 20/12/2011 01/06/2012 15/06/2012 Austria 17/05/2011 31/12/2011 18/06/2012 18/07/2012 Poland 12/04/2011 01/06/2011 03/04/2012 11/05/2012 Portugal 01/01/2012 31/05/2012 01/08/2012 01/09/2012 Romania 01/04/2011 02/05/2011 01/07/2012 Slovenia 20/04/2011 25/11/2011 29/06/2012 Slovakia 01/06/2011 30/06/2011 29/06/2012 28/09/2012 Finland 01/05/2011 30/09/2011 29/06/2012 16/07/2012 Sweden 23/02/2011 30/05/2011 18/06/2012 United Kingdom 01/09/2011 01/01/2012 30/06/2012 Norway 15/06/2011 26/09/2011 27/06/2012 12/07/2012
Source: CVTS 4 national Standard Quality Reports
26
According to its legislation4, CVTS data have to be transmitted to Eurostat no later than 18 months after the end of the reference year, i.e. for 2010 data by the end of June 2012. 19 countries delivered the first version of their data by that day or at 01/07/2012. It then depended on the validation process when the final version of the data was transmitted to Eurostat. The main reasons of extended data delivery delays were extra validation of some variables, extended or delayed data collection period and limited resources in the context of an overlap with other surveys.
7 Accessibility and clarity Accessibility and clarity is the level of simplicity and ease when the users are trying to access statistics with the appropriate user information and assistance.
Eurostat published comparable data coming from both CVTS 3 and CVTS 4 waves on its website / online database in a special folder for continuing vocational training in enterprises. The online tables cover information on the enterprises that give opportunities to participate in education and training (training/non-training enterprises), participation of staff in CVT, planning and assessment of CVT as well as cost and time spent on CVT.
The data are supplemented by reference metadata in Euro SDMX Metadata Structure (ESMS) format, giving background information on the survey and summarising methodological aspects.
Access to microdata usually requires an official request from interested parties. Eurostat has made available an anonymised CVTS 4 dataset, the access to which can be asked through Eurostat's website5.
Most of the participating countries published the main results of their national CVTS on their official websites. In several countries, the data can be found in statistical papers and press releases.
4 See article 11 of Regulation (EC) No 1552/2005. 5 For details see http://ec.europa.eu/eurostat/web/microdata/continuing-vocational-training-survey
27
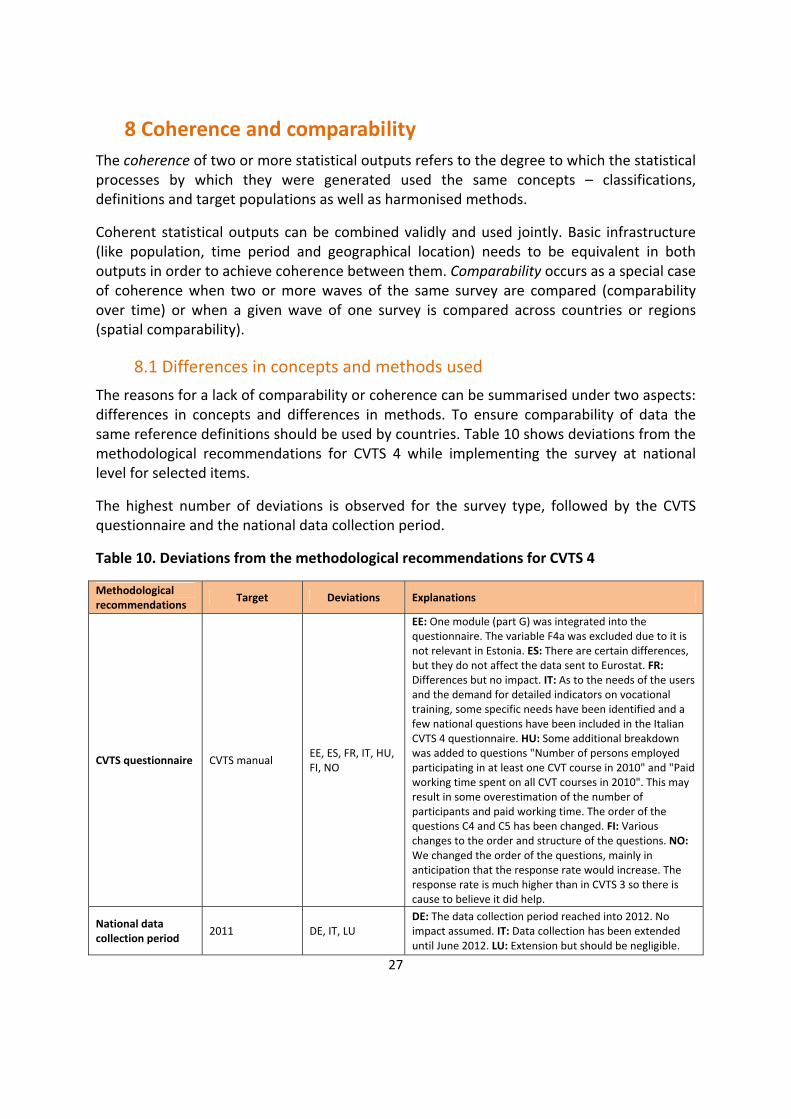
8 Coherence and comparability The coherence of two or more statistical outputs refers to the degree to which the statistical processes by which they were generated used the same concepts – classifications, definitions and target populations as well as harmonised methods.
Coherent statistical outputs can be combined validly and used jointly. Basic infrastructure (like population, time period and geographical location) needs to be equivalent in both outputs in order to achieve coherence between them. Comparability occurs as a special case of coherence when two or more waves of the same survey are compared (comparability over time) or when a given wave of one survey is compared across countries or regions (spatial comparability).
8.1 Differences in concepts and methods used The reasons for a lack of comparability or coherence can be summarised under two aspects: differences in concepts and differences in methods. To ensure comparability of data the same reference definitions should be used by countries. Table 10 shows deviations from the methodological recommendations for CVTS 4 while implementing the survey at national level for selected items.
The highest number of deviations is observed for the survey type, followed by the CVTS questionnaire and the national data collection period.
Table 10. Deviations from the methodological recommendations for CVTS 4
Methodological recommendations Target Deviations Explanations
CVTS questionnaire CVTS manual EE, ES, FR, IT, HU, FI, NO
EE: One module (part G) was integrated into the questionnaire. The variable F4a was excluded due to it is not relevant in Estonia. ES: There are certain differences, but they do not affect the data sent to Eurostat. FR: Differences but no impact. IT: As to the needs of the users and the demand for detailed indicators on vocational training, some specific needs have been identified and a few national questions have been included in the Italian CVTS 4 questionnaire. HU: Some additional breakdown was added to questions "Number of persons employed participating in at least one CVT course in 2010" and "Paid working time spent on all CVT courses in 2010". This may result in some overestimation of the number of participants and paid working time. The order of the questions C4 and C5 has been changed. FI: Various changes to the order and structure of the questions. NO: We changed the order of the questions, mainly in anticipation that the response rate would increase. The response rate is much higher than in CVTS 3 so there is cause to believe it did help.
National data collection period 2011 DE, IT, LU
DE: The data collection period reached into 2012. No impact assumed. IT: Data collection has been extended until June 2012. LU: Extension but should be negligible.

28
Methodological recommendations Target Deviations Explanations
Survey vehicle Stand-alone survey PT PT: The stand-alone survey was combined with
quantitative data coming from an administrative source.
Statistical unit Enterprises none
Sampling frame Register none
Survey method
Simple random, stratified simple random, multi-stage stratified sampling
none
Survey type* Face-to-face interview (CAPI)
BE, BG, CZ, DE, EE, ES, FR, HR, IT, LT, LU, HU, NL, AT, PL, PT, RO, SK, FI, SE, UK, NO
BE: In order to increase response rate and reduce burden, a combination of PAPI and CAWI is used. BG: Face-to-face PAPI and postal. CZ: By post and electronically. DE: Paper questionnaire and web-based survey. EE: CAWI. ES: Questionnaires were received via internet (72.4%), ordinary mail (13.9%); the rest (13.7%) were received by email, fax or via an agent. FR: CATI. HR: Postal survey, paper and electronic version of the questionnaire were available. IT: An electronic (web-based) questionnaire was planned to be the main data capturing tool. To reduce the negative effects of the inefficiency of the electronic questionnaire a paper questionnaire was made available to respondents. LT: Paper-pen and e-questionnaire. LU: Paper-pen and CAWI. HU: PAPI or postal electronic. NL: CAWI. AT: Combination of techniques (postal, CATI). PL: CAWI. PT: Use of internet. RO: CAWI. SK: Questionnaires sent by mail (PAPI). FI: Only postal and web questionnaire. SE: Web-based questionnaire complemented by telephone reminders. A small number of telephone interviews were done to remedy partial non-response. UK: Most interviews were by phone (CATI) with a small number of face-to-face interviews (CAPI) with very large enterprises. NO: CAWI - questionnaire on webpage.
Reference period 2010 none
Denmark: no information; Cyprus, Latvia, Malta, Slovenia: no deviations reported.
Source: CVTS 4 national Standard Quality Reports
* See Table 3 for the meaning of the acronyms
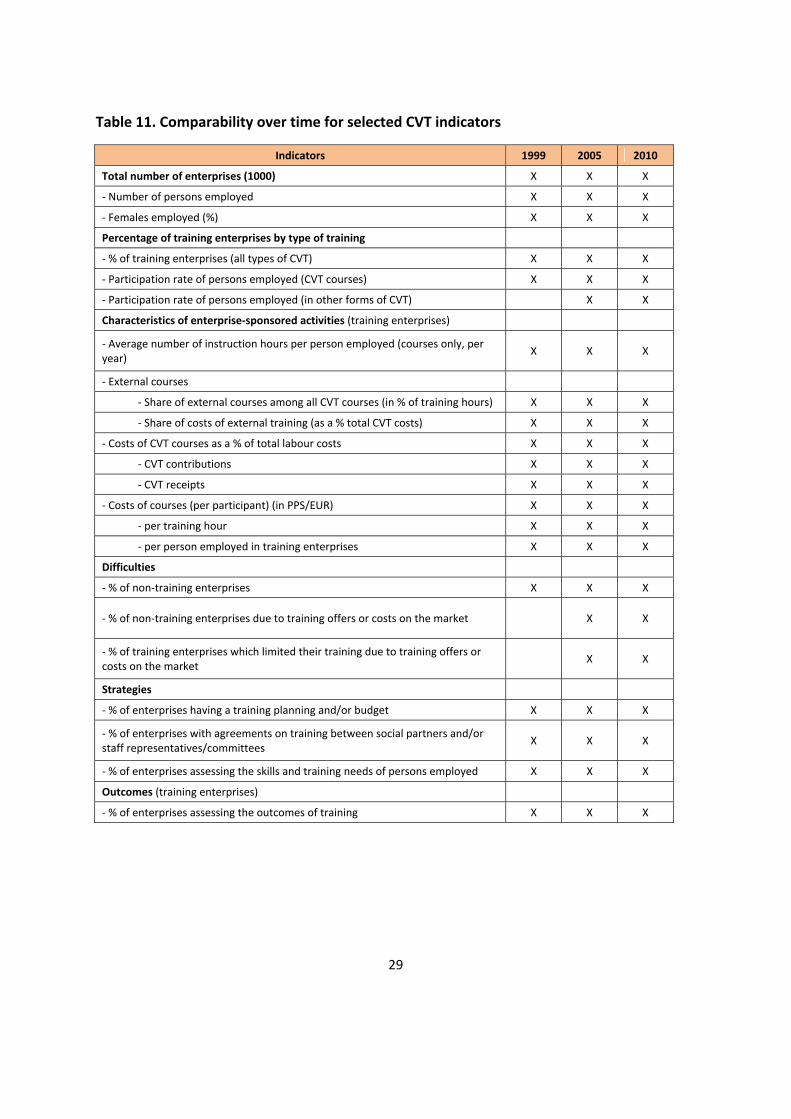
8.2 Comparability over time Comparability over time is very important for all statistical outputs used and published in time series. Methodology and questionnaire items have been changed after the previous implementation of CVTS (CVTS 2, CVTS 3). Although some changes were made in CVTS 4, it is still possible to compare the results of the two waves for the main indictors. Table 11 compares CVTS 4 with the two previous waves.
29
Table 11. Comparability over time for selected CVT indicators
Indicators 1999 2005 2010
Total number of enterprises (1000) X X X
- Number of persons employed X X X
- Females employed (%) X X X
Percentage of training enterprises by type of training
- % of training enterprises (all types of CVT) X X X
- Participation rate of persons employed (CVT courses) X X X
- Participation rate of persons employed (in other forms of CVT) X X
Characteristics of enterprise-sponsored activities (training enterprises)
- Average number of instruction hours per person employed (courses only, per year) X X X
- External courses
- Share of external courses among all CVT courses (in % of training hours) X X X
- Share of costs of external training (as a % total CVT costs) X X X
- Costs of CVT courses as a % of total labour costs X X X
- CVT contributions X X X
- CVT receipts X X X
- Costs of courses (per participant) (in PPS/EUR) X X X
- per training hour X X X
- per person employed in training enterprises X X X
Difficulties
- % of non-training enterprises X X X
- % of non-training enterprises due to training offers or costs on the market X X
- % of training enterprises which limited their training due to training offers or costs on the market X X
Strategies
- % of enterprises having a training planning and/or budget X X X
- % of enterprises with agreements on training between social partners and/or staff representatives/committees X X X
- % of enterprises assessing the skills and training needs of persons employed X X X
Outcomes (training enterprises)
- % of enterprises assessing the outcomes of training X X X
30
Annex I: Legal basis CVTS 4 finds its legal basis in the following regulations:
Regulation (EC) No 1552/2005 of the European Parliament and of the Council of 7 September 2005 on statistics relating to vocational training in enterprises (or its consolidated version)
Commission Regulation (EU) No 822/2010 of 17 September 2010 amending Regulation (EC) No 198/2006 implementing Regulation (EC) No 1552/2005 of the European Parliament and of the Council on statistics relating to vocational training in enterprises, as regards the data to be collected, the sampling, precision and quality requirements
In addition to these European regulations, a number of participating countries have their own national legislations which often define extra needs or topics to be collected and specific criteria to be applied on top of EU requirements.
31
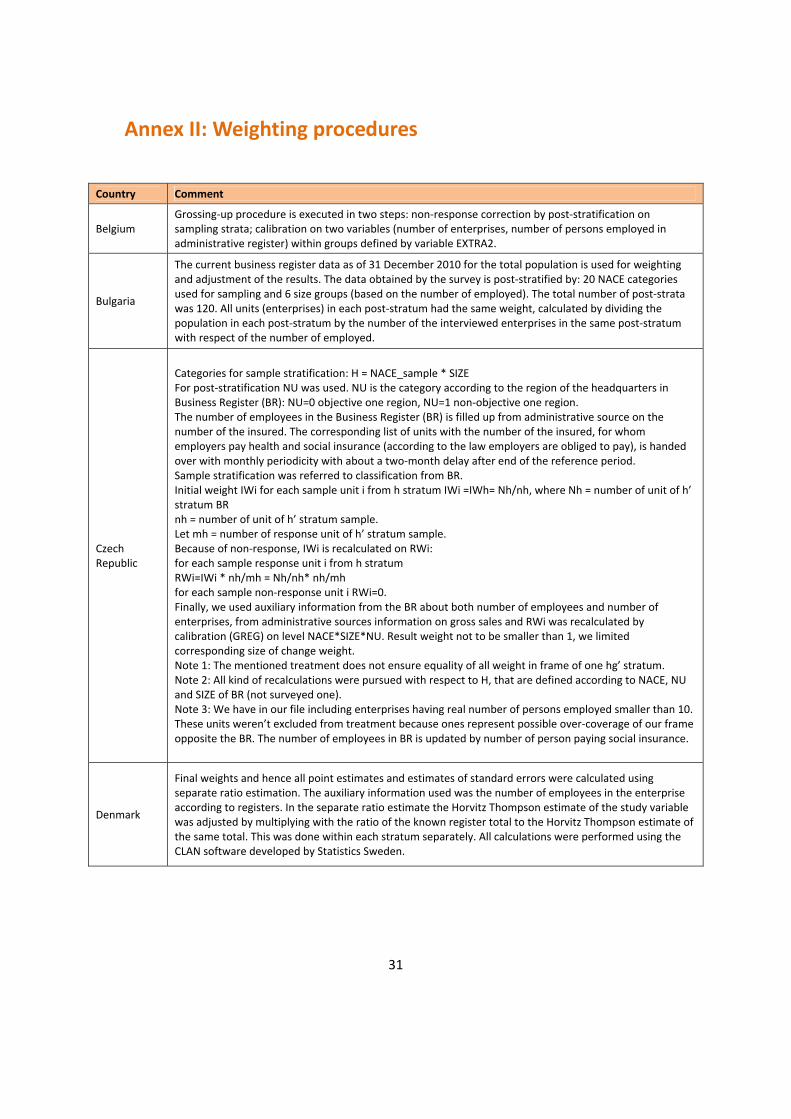
Annex II: Weighting procedures
Country Comment
Belgium Grossing-up procedure is executed in two steps: non-response correction by post-stratification on sampling strata; calibration on two variables (number of enterprises, number of persons employed in administrative register) within groups defined by variable EXTRA2.
Bulgaria
The current business register data as of 31 December 2010 for the total population is used for weighting and adjustment of the results. The data obtained by the survey is post-stratified by: 20 NACE categories used for sampling and 6 size groups (based on the number of employed). The total number of post-strata was 120. All units (enterprises) in each post-stratum had the same weight, calculated by dividing the population in each post-stratum by the number of the interviewed enterprises in the same post-stratum with respect of the number of employed.
Czech Republic
Categories for sample stratification: H = NACE_sample * SIZE For post-stratification NU was used. NU is the category according to the region of the headquarters in Business Register (BR): NU=0 objective one region, NU=1 non-objective one region. The number of employees in the Business Register (BR) is filled up from administrative source on the number of the insured. The corresponding list of units with the number of the insured, for whom employers pay health and social insurance (according to the law employers are obliged to pay), is handed over with monthly periodicity with about a two-month delay after end of the reference period. Sample stratification was referred to classification from BR. Initial weight IWi for each sample unit i from h stratum IWi =IWh= Nh/nh, where Nh = number of unit of h’ stratum BR nh = number of unit of h’ stratum sample. Let mh = number of response unit of h’ stratum sample. Because of non-response, IWi is recalculated on RWi: for each sample response unit i from h stratum RWi=IWi * nh/mh = Nh/nh* nh/mh for each sample non-response unit i RWi=0. Finally, we used auxiliary information from the BR about both number of employees and number of enterprises, from administrative sources information on gross sales and RWi was recalculated by calibration (GREG) on level NACE*SIZE*NU. Result weight not to be smaller than 1, we limited corresponding size of change weight. Note 1: The mentioned treatment does not ensure equality of all weight in frame of one hg’ stratum. Note 2: All kind of recalculations were pursued with respect to H, that are defined according to NACE, NU and SIZE of BR (not surveyed one). Note 3: We have in our file including enterprises having real number of persons employed smaller than 10. These units weren’t excluded from treatment because ones represent possible over-coverage of our frame opposite the BR. The number of employees in BR is updated by number of person paying social insurance.
Denmark
Final weights and hence all point estimates and estimates of standard errors were calculated using separate ratio estimation. The auxiliary information used was the number of employees in the enterprise according to registers. In the separate ratio estimate the Horvitz Thompson estimate of the study variable was adjusted by multiplying with the ratio of the known register total to the Horvitz Thompson estimate of the same total. This was done within each stratum separately. All calculations were performed using the CLAN software developed by Statistics Sweden.
32
Country Comment
Germany
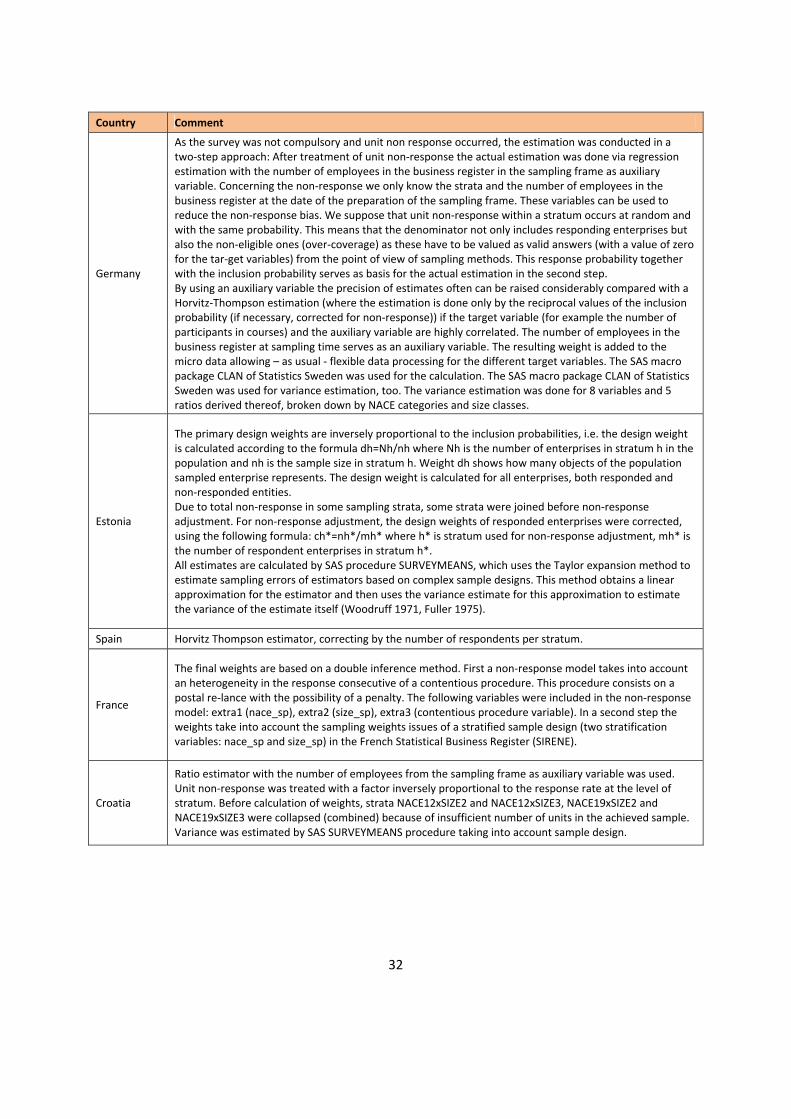
As the survey was not compulsory and unit non response occurred, the estimation was conducted in a two-step approach: After treatment of unit non-response the actual estimation was done via regression estimation with the number of employees in the business register in the sampling frame as auxiliary variable. Concerning the non-response we only know the strata and the number of employees in the business register at the date of the preparation of the sampling frame. These variables can be used to reduce the non-response bias. We suppose that unit non-response within a stratum occurs at random and with the same probability. This means that the denominator not only includes responding enterprises but also the non-eligible ones (over-coverage) as these have to be valued as valid answers (with a value of zero for the tar-get variables) from the point of view of sampling methods. This response probability together with the inclusion probability serves as basis for the actual estimation in the second step. By using an auxiliary variable the precision of estimates often can be raised considerably compared with a Horvitz-Thompson estimation (where the estimation is done only by the reciprocal values of the inclusion probability (if necessary, corrected for non-response)) if the target variable (for example the number of participants in courses) and the auxiliary variable are highly correlated. The number of employees in the business register at sampling time serves as an auxiliary variable. The resulting weight is added to the micro data allowing – as usual - flexible data processing for the different target variables. The SAS macro package CLAN of Statistics Sweden was used for the calculation. The SAS macro package CLAN of Statistics Sweden was used for variance estimation, too. The variance estimation was done for 8 variables and 5 ratios derived thereof, broken down by NACE categories and size classes.
Estonia
The primary design weights are inversely proportional to the inclusion probabilities, i.e. the design weight is calculated according to the formula dh=Nh/nh where Nh is the number of enterprises in stratum h in the population and nh is the sample size in stratum h. Weight dh shows how many objects of the population sampled enterprise represents. The design weight is calculated for all enterprises, both responded and non-responded entities. Due to total non-response in some sampling strata, some strata were joined before non-response adjustment. For non-response adjustment, the design weights of responded enterprises were corrected, using the following formula: ch*=nh*/mh* where h* is stratum used for non-response adjustment, mh* is the number of respondent enterprises in stratum h*. All estimates are calculated by SAS procedure SURVEYMEANS, which uses the Taylor expansion method to estimate sampling errors of estimators based on complex sample designs. This method obtains a linear approximation for the estimator and then uses the variance estimate for this approximation to estimate the variance of the estimate itself (Woodruff 1971, Fuller 1975).
Spain Horvitz Thompson estimator, correcting by the number of respondents per stratum.
France
The final weights are based on a double inference method. First a non-response model takes into account an heterogeneity in the response consecutive of a contentious procedure. This procedure consists on a postal re-lance with the possibility of a penalty. The following variables were included in the non-response model: extra1 (nace_sp), extra2 (size_sp), extra3 (contentious procedure variable). In a second step the weights take into account the sampling weights issues of a stratified sample design (two stratification variables: nace_sp and size_sp) in the French Statistical Business Register (SIRENE).
Croatia
Ratio estimator with the number of employees from the sampling frame as auxiliary variable was used. Unit non-response was treated with a factor inversely proportional to the response rate at the level of stratum. Before calculation of weights, strata NACE12xSIZE2 and NACE12xSIZE3, NACE19xSIZE2 and NACE19xSIZE3 were collapsed (combined) because of insufficient number of units in the achieved sample. Variance was estimated by SAS SURVEYMEANS procedure taking into account sample design.
33
Country Comment
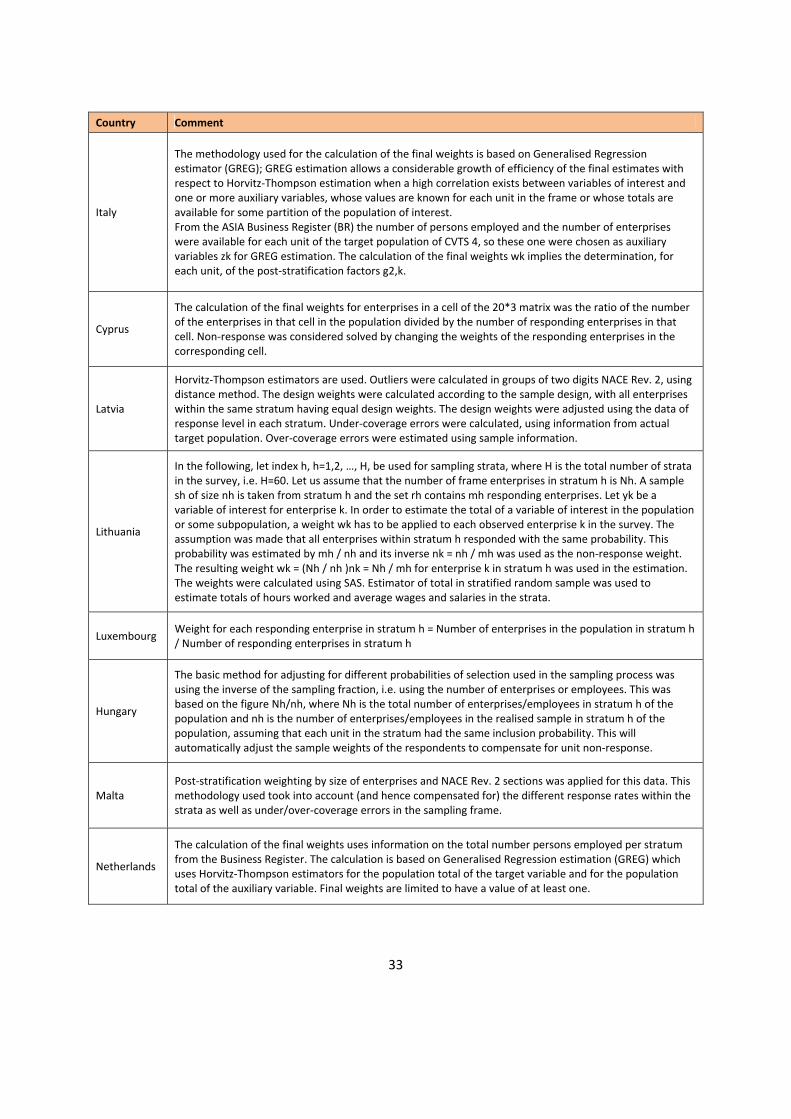
Italy
The methodology used for the calculation of the final weights is based on Generalised Regression estimator (GREG); GREG estimation allows a considerable growth of efficiency of the final estimates with respect to Horvitz-Thompson estimation when a high correlation exists between variables of interest and one or more auxiliary variables, whose values are known for each unit in the frame or whose totals are available for some partition of the population of interest. From the ASIA Business Register (BR) the number of persons employed and the number of enterprises were available for each unit of the target population of CVTS 4, so these one were chosen as auxiliary variables zk for GREG estimation. The calculation of the final weights wk implies the determination, for each unit, of the post-stratification factors g2,k.
Cyprus
The calculation of the final weights for enterprises in a cell of the 20*3 matrix was the ratio of the number of the enterprises in that cell in the population divided by the number of responding enterprises in that cell. Non-response was considered solved by changing the weights of the responding enterprises in the corresponding cell.
Latvia
Horvitz-Thompson estimators are used. Outliers were calculated in groups of two digits NACE Rev. 2, using distance method. The design weights were calculated according to the sample design, with all enterprises within the same stratum having equal design weights. The design weights were adjusted using the data of response level in each stratum. Under-coverage errors were calculated, using information from actual target population. Over-coverage errors were estimated using sample information.
Lithuania
In the following, let index h, h=1,2, …, H, be used for sampling strata, where H is the total number of strata in the survey, i.e. H=60. Let us assume that the number of frame enterprises in stratum h is Nh. A sample sh of size nh is taken from stratum h and the set rh contains mh responding enterprises. Let yk be a variable of interest for enterprise k. In order to estimate the total of a variable of interest in the population or some subpopulation, a weight wk has to be applied to each observed enterprise k in the survey. The assumption was made that all enterprises within stratum h responded with the same probability. This probability was estimated by mh / nh and its inverse nk = nh / mh was used as the non-response weight. The resulting weight wk = (Nh / nh )nk = Nh / mh for enterprise k in stratum h was used in the estimation. The weights were calculated using SAS. Estimator of total in stratified random sample was used to estimate totals of hours worked and average wages and salaries in the strata.
Luxembourg Weight for each responding enterprise in stratum h = Number of enterprises in the population in stratum h / Number of responding enterprises in stratum h
Hungary
The basic method for adjusting for different probabilities of selection used in the sampling process was using the inverse of the sampling fraction, i.e. using the number of enterprises or employees. This was based on the figure Nh/nh, where Nh is the total number of enterprises/employees in stratum h of the population and nh is the number of enterprises/employees in the realised sample in stratum h of the population, assuming that each unit in the stratum had the same inclusion probability. This will automatically adjust the sample weights of the respondents to compensate for unit non-response.
Malta Post-stratification weighting by size of enterprises and NACE Rev. 2 sections was applied for this data. This methodology used took into account (and hence compensated for) the different response rates within the strata as well as under/over-coverage errors in the sampling frame.
Netherlands
The calculation of the final weights uses information on the total number persons employed per stratum from the Business Register. The calculation is based on Generalised Regression estimation (GREG) which uses Horvitz-Thompson estimators for the population total of the target variable and for the population total of the auxiliary variable. Final weights are limited to have a value of at least one.
34
Country Comment
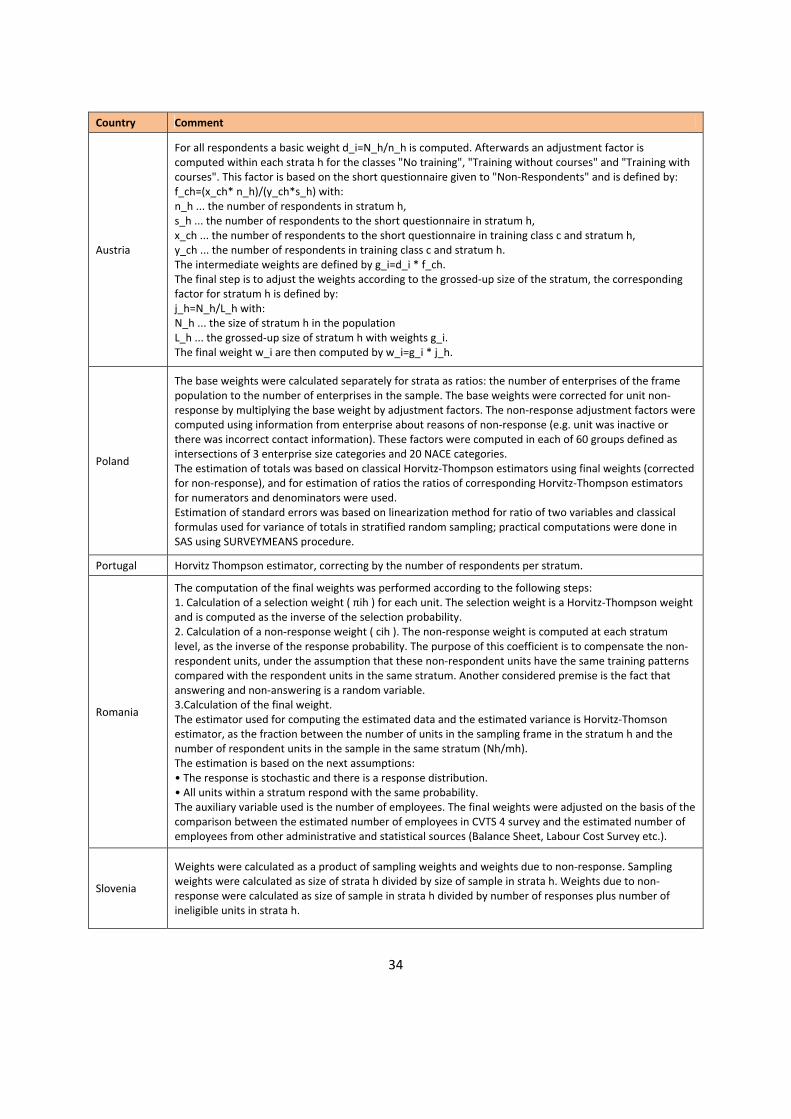
Austria
For all respondents a basic weight d_i=N_h/n_h is computed. Afterwards an adjustment factor is computed within each strata h for the classes "No training", "Training without courses" and "Training with courses". This factor is based on the short questionnaire given to "Non-Respondents" and is defined by: f_ch=(x_ch* n_h)/(y_ch*s_h) with: n_h ... the number of respondents in stratum h, s_h ... the number of respondents to the short questionnaire in stratum h, x_ch ... the number of respondents to the short questionnaire in training class c and stratum h, y_ch ... the number of respondents in training class c and stratum h. The intermediate weights are defined by g_i=d_i * f_ch. The final step is to adjust the weights according to the grossed-up size of the stratum, the corresponding factor for stratum h is defined by: j_h=N_h/L_h with: N_h ... the size of stratum h in the population L_h ... the grossed-up size of stratum h with weights g_i. The final weight w_i are then computed by w_i=g_i * j_h.
Poland
The base weights were calculated separately for strata as ratios: the number of enterprises of the frame population to the number of enterprises in the sample. The base weights were corrected for unit non-response by multiplying the base weight by adjustment factors. The non-response adjustment factors were computed using information from enterprise about reasons of non-response (e.g. unit was inactive or there was incorrect contact information). These factors were computed in each of 60 groups defined as intersections of 3 enterprise size categories and 20 NACE categories. The estimation of totals was based on classical Horvitz-Thompson estimators using final weights (corrected for non-response), and for estimation of ratios the ratios of corresponding Horvitz-Thompson estimators for numerators and denominators were used. Estimation of standard errors was based on linearization method for ratio of two variables and classical formulas used for variance of totals in stratified random sampling; practical computations were done in SAS using SURVEYMEANS procedure.
Portugal Horvitz Thompson estimator, correcting by the number of respondents per stratum.
Romania
The computation of the final weights was performed according to the following steps: 1. Calculation of a selection weight ( πih ) for each unit. The selection weight is a Horvitz-Thompson weight and is computed as the inverse of the selection probability. 2. Calculation of a non-response weight ( cih ). The non-response weight is computed at each stratum level, as the inverse of the response probability. The purpose of this coefficient is to compensate the non-respondent units, under the assumption that these non-respondent units have the same training patterns compared with the respondent units in the same stratum. Another considered premise is the fact that answering and non-answering is a random variable. 3.Calculation of the final weight. The estimator used for computing the estimated data and the estimated variance is Horvitz-Thomson estimator, as the fraction between the number of units in the sampling frame in the stratum h and the number of respondent units in the sample in the same stratum (Nh/mh). The estimation is based on the next assumptions: • The response is stochastic and there is a response distribution. • All units within a stratum respond with the same probability. The auxiliary variable used is the number of employees. The final weights were adjusted on the basis of the comparison between the estimated number of employees in CVTS 4 survey and the estimated number of employees from other administrative and statistical sources (Balance Sheet, Labour Cost Survey etc.).
Slovenia
Weights were calculated as a product of sampling weights and weights due to non-response. Sampling weights were calculated as size of strata h divided by size of sample in strata h. Weights due to non-response were calculated as size of sample in strata h divided by number of responses plus number of ineligible units in strata h.
35
Country Comment
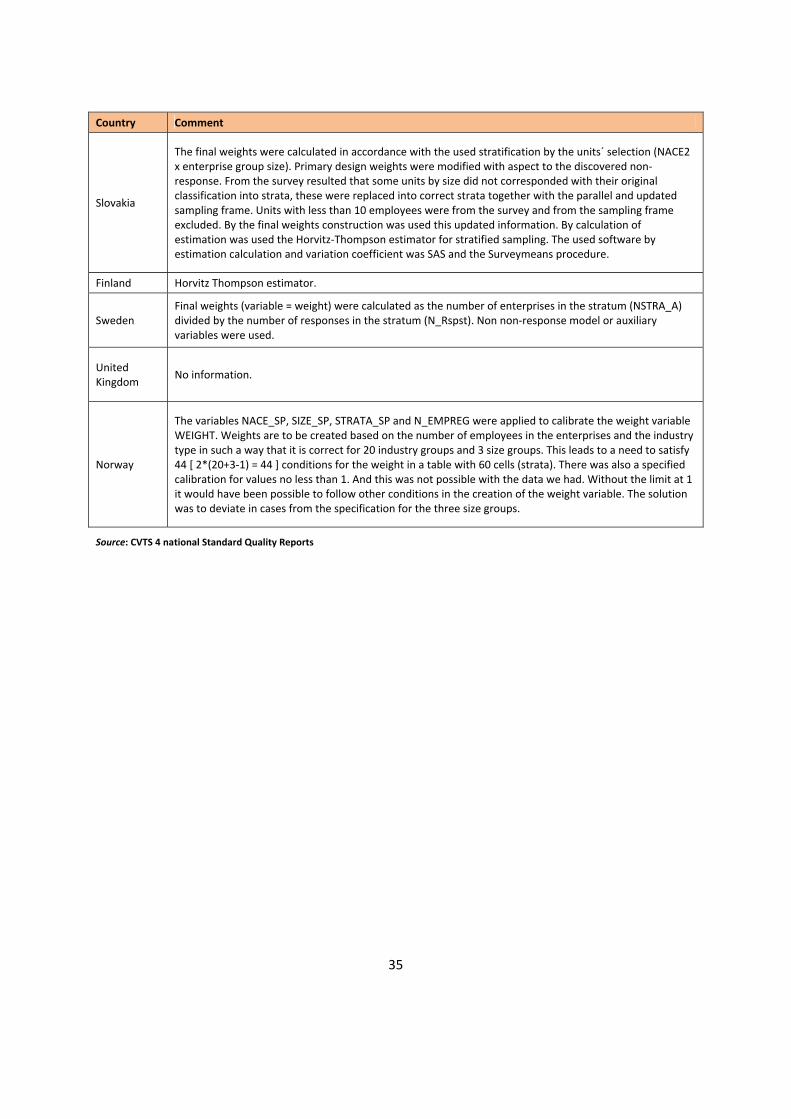
Slovakia
The final weights were calculated in accordance with the used stratification by the units´ selection (NACE2 x enterprise group size). Primary design weights were modified with aspect to the discovered non-response. From the survey resulted that some units by size did not corresponded with their original classification into strata, these were replaced into correct strata together with the parallel and updated sampling frame. Units with less than 10 employees were from the survey and from the sampling frame excluded. By the final weights construction was used this updated information. By calculation of estimation was used the Horvitz-Thompson estimator for stratified sampling. The used software by estimation calculation and variation coefficient was SAS and the Surveymeans procedure.
Finland Horvitz Thompson estimator.
Sweden Final weights (variable = weight) were calculated as the number of enterprises in the stratum (NSTRA_A) divided by the number of responses in the stratum (N_Rspst). Non non-response model or auxiliary variables were used.
United Kingdom No information.
Norway
The variables NACE_SP, SIZE_SP, STRATA_SP and N_EMPREG were applied to calibrate the weight variable WEIGHT. Weights are to be created based on the number of employees in the enterprises and the industry type in such a way that it is correct for 20 industry groups and 3 size groups. This leads to a need to satisfy 44 [ 2*(20+3-1) = 44 ] conditions for the weight in a table with 60 cells (strata). There was also a specified calibration for values no less than 1. And this was not possible with the data we had. Without the limit at 1 it would have been possible to follow other conditions in the creation of the weight variable. The solution was to deviate in cases from the specification for the three size groups.
Source: CVTS 4 national Standard Quality Reports
36
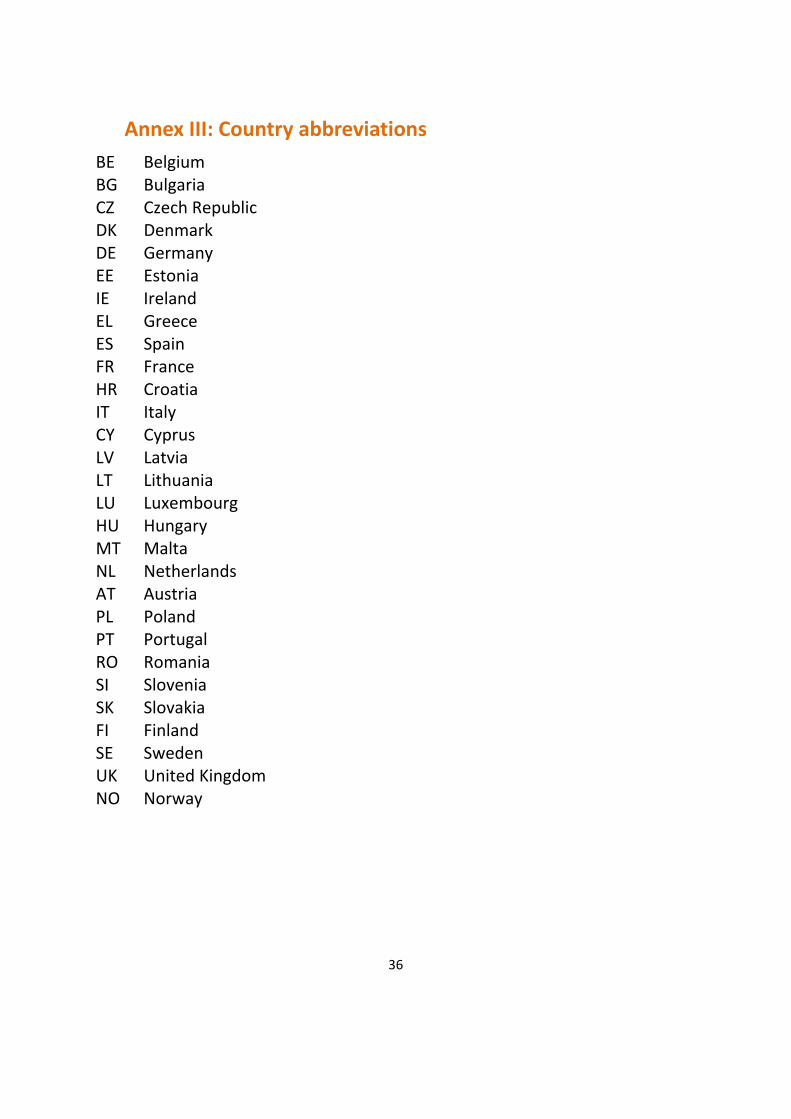
Annex III: Country abbreviations BE Belgium BG Bulgaria CZ Czech Republic DK Denmark DE Germany EE Estonia IE Ireland EL Greece ES Spain FR France HR Croatia IT Italy CY Cyprus LV Latvia LT Lithuania LU Luxembourg HU Hungary MT Malta NL Netherlands AT Austria PL Poland PT Portugal RO Romania SI Slovenia SK Slovakia FI Finland SE Sweden UK United Kingdom NO Norway