continuing a culture of success - airtimes
TRANSCRIPT

Continental Air l ines 2004 Annual Repor t
continuing a culture of success

front cover l>r: Ruth Mishler - Airport Sales Agent, Julia Acosta - Airport Sales Agent, Betty Williams - Airport Sales Agent – Interpreterback cover: Gordon Bethune - Former Chairman of the Board and Chief Executive Officer
2004 Accomplishments
FLY TO WIN
• Significantly boosted international service by adding
new routes and increasing frequency
• Entered SkyTeam as a full member, giving Continental
customers access to 658 global destinations in 137 countries
• Reduced distribution costs by focusing on direct bookings
• Continued to differentiate product value for high-yield
versus low-yield customers with EliteAccess program
• Successfully installed passport readers on 210 self-service
kiosks, allowing for international self check-in
• Implemented eTicketing with Aeromexico, Air France,
ATA, British Airways, Emirates, Finnair, Hawaiian
Airlines, Mexicana, Midwest Airlines and Qantas
• Became first airline to offer free wireless Internet access
in its airport lounges worldwide
FUND THE FUTURE
• Realized more than $900 million in revenue and cost-
savings initiatives
• Launched additional $200 million in revenue and cost-
savings initiatives
• Ended the year with approximately $1.7 billion in cash and
short-term investments
• Maintained a RASM premium to the industry
• Enhanced fuel-efficient fleet by taking delivery of 11 Boeing
737-800s, five Boeing 757-300s and retiring the last of its
MD-80 aircraft in January 2005
• Increased fuel efficiency by completing winglet modifica-
tions on 17 Boeing 737-800s
• Reached an agreement with Boeing to become the launch
customer for the 787, to lease eight 757-300 aircraft, and
to accelerate the delivery of six 737-800 aircraft
• Completed final phase of new Terminal E at George Bush
Intercontinental Airport in Houston
• Completed first and second phases of Terminal C remodel
at George Bush Intercontinental Airport
• Completed new cargo building in Houston to consolidate
existing cargo service into one facility
MAKE RELIABILITY A REALITY
• Achieved a record 108 days of zero flight cancellations
• Achieved 78.9 percent DOT on-time performance
average for 2004, finishing No. 1 in August, October
and December
• Achieved a 99.4 percent DOT segment completion factor
for 2004
• Achieved lowest lost bag ratio in company history
• Decreased number of customer complaints reported
to the DOT
• Outperformed all U.S. airlines in international long-haul
service and comfort for the seventh year in a row, according
to a survey of Conde Nast Traveler readers
WORKING TOGETHER
• Named to Fortune magazine’s “100 Best Companies to
Work For” for the sixth consecutive year
• Named No. 1 Most Admired Global Airline by Fortune
magazine
• Signed an unprecedented agreement with its pilots union,
the Air Line Pilots Association (ALPA), to codify key
aspects of labor/management relations
• Named “Airline of the Year” in addition to “Best Executive/
Business Class” and “Best Airline Based in North
America” at the 2004 OAG Airline of the Year Awards
• Awarded nine Ford Explorers to employees in 2004,
making a total of 129 new cars given away over the
last eight years
• Named to Hispanic magazine’s list of “100 Companies
Providing the Most Opportunities for Hispanics” for
the seventh consecutive year
• Paid more than $15 million in on-time bonuses
• Named in Training magazine’s “Top 100 Companies
for Training”

1
Continental Airlines 2004 Annual Report
Financial Highlights
(In millions, except per share data) 2004 2003 2002 2001 2000
Total Operating Revenue $ 9,744 $ 8,870 $ 8,402 $ 8,969 $ 9,899
Total Operating Expenses 9,973 8,667 8,714 8,825 9,170
Operating Income (Loss) (229) 203 (312) 144 729
Net Income (Loss) (363) 38 (451) (95) 342
Basic Earnings (Loss) per Share (5.49) 0.58 (7.02) (1.72) 5.62
Diluted Earnings (Loss) per Share (5.55) 0.57 (7.02) (1.72) 5.45
Cash and Short-Term Investments 1,669 1,600 1,342 1,132 1,395
Total Assets 10,545 10,649 10,641 9,798 9,208
Long-Term Debt and Capital Lease Obligations 5,167 5,558 5,471 4,448 3,624
Operating Statistics
(Mainline jet operations only, excluding
regional jets operated by ExpressJet) 2004 2003 2002 2001 2000
Passengers (thousands) (a) 42,743 40,613 41,777 45,064 47,778
Revenue Passenger Miles (millions) (b) 65,734 59,165 59,349 61,140 64,161
Available Seat Miles (millions) (c) 84,672 78,385 80,122 84,485 86,100
Passenger Load Factor (d) 77.6% 75.5% 74.1% 72.4% 74.5%
Passenger Revenue per Available Seat Mile 8.75¢ 8.73¢ 8.61¢ 8.98¢ 9.84¢
Operating Cost per Available Seat Mile 9.65¢ 9.36¢ 9.53¢ 9.22¢ 9.68¢
Operating Cost per Available Seat Mile,
year-over-year percent change 3.1% (1.8)% 3.4% (4.8)% 6.7%
Operating Cost per Available Seat Mile,
excluding special items (e) 9.49¢ 9.45¢ 9.22¢ 9.58¢ 9.68¢
Average Yield per Revenue Passenger Mile (f) 11.28¢ 11.57¢ 11.63¢ 12.42¢ 13.20¢
Average Price per Gallon of Fuel,
including fuel taxes 119.01¢ 91.40¢ 74.01¢ 82.48¢ 88.54¢
Fuel Gallons Consumed (millions) 1,333 1,257 1,296 1,426 1,533
Aircraft in Fleet at End of Period (g) 349 355 366 352 371
(a) Revenue passengers measured by each flight segment flown.(b) The number of scheduled miles flown by revenue passengers.(c) The number of seats available for passengers multiplied by the number of scheduled miles those seats are flown.(d) Revenue passenger miles divided by available seat miles.(e) Excludes the mainline jet portion of the following special items that impact operating costs. Special items in 2004 consist of $87 million
MD-80 aircraft retirement charges, $34 million termination of United Micronesian Development Association Service Agreement and $18 million frequent flyer reward redemption cost adjustment. Special items in 2003 consist of $100 million for MD-80 retirement andfleet impairment charges and $176 million for the reimbursement of security fees. Special items in 2002 consist of a $242 million chargefor fleet impairment related to our DC 10-30, MD-80 and turboprop fleets and a $12 million charge to write down our receivable fromthe U.S. government related to the finalization of the Air Transportation Safety and System Stabilization Act (“Stabilization Act”) grant.Special items in 2001 included a $124 million charge for fleet impairment losses, costs associated with furloughs and company-offeredleaves and other items. In addition, special items included a $417 million grant under the Stabilization Act.
(f) The average revenue received for each revenue passenger mile flown.(g) Excludes aircraft that were removed from service.

“Our decade of working
together has prepared us to
tackle these tough times and
position ourselves to be a
survivor in an ever-changing
industry. We’ve built a cul-
ture of success that is the
foundation of our future.”
jeff smisek
President
“Our culture of treating
co-workers with dignity and
respect is extended onto our
customers, and that’s what
keeps us outperforming the
competition. I’m proud to be
on a team that works together
to win together.”
larry kellner
Chairman and
Chief Executive Officer

2004 was another tough year for our industry. It was also a
tough year for our co-workers, as we were forced to ask them
for significant pay and benefit reductions. We know that these
reductions are painful. Beginning in April 2005, we imple-
mented pay and benefit reductions for most work groups,
and that was a huge step forward. We remain in discussions
with our flight attendant group on a package of pay and
benefit reductions and are hopeful that reductions can be
implemented soon. We remain short of our goal, and it is
important that all work groups participate in the reductions.
A depressed domestic yield environment, continued pressure
from low-cost competitors, record fuel prices, and the ever-
increasing burden of excessive taxes and fees combined to
make 2004 one of the worst financial years in our industry’s
history. Our industry continued its restructuring this year, as
United Airlines continued to operate in its second year of
bankruptcy, and US Airways and ATA Holdings entered bank-
ruptcy. The downward shift in the cost structure of the major
network (“legacy”) carriers continued, and head-to-head
competition among the low-cost carriers began. This tumul-
tuous environment resulted in a humbling experience for
legacy carriers, as well as for many of the newer entrants into
the marketplace. There will be winners and losers as our
industry restructures, and Continental is committed to being
one of the winners.
We reported a net loss of $363 million for 2004, or $255 mil-
lion excluding special charges of $108 million, principally
related to retiring our MD-80 aircraft. During 2004, we
announced another $200 million of additional run rate cost
savings initiatives, over half of which we anticipate achieving
in 2005. Since 2002, we have announced a total of $1.1 bil-
lion in annual cost reduction and revenue-generating initia-
tives (of which we’ve achieved approximately $900 million
through 2004), in an attempt to restore our profitability.
Unfortunately, those programs haven’t proven enough, so in
late 2004 we announced that we were seeking $500 million
of annual pay and benefit reductions and workrule enhance-
ments designed to permit Continental to be a survivor and to
grow and prosper. During our discussions on pay and benefit
reductions, we experienced none of the acrimony, revenue
loss and customer service problems that have plagued
our competitors during their cost savings discussions. On
March 30, 2005, all of the agreements with our domestic
labor unions ratified, with the sole exception of our flight
attendants’ tentative agreement. The ratified agreements,
together with the reductions from other work groups, are
expected to deliver approximately $418 million in annual
cost savings when fully implemented. Our discipline and
focus on what our customers want and will pay for give us
the confidence that, when we complete the pay and benefit
reductions, we can grow and climb back to profitability.
go forward plan
Our Go Forward Plan continues to be as vital to our success
today as it’s been over the past decade. It’s a clear, straight-
forward plan that all of our co-workers understand and
work toward every day. Our Go Forward Plan consists of four
Continental Airlines 2004 Annual Report
3
To Our Co-workers, Customers and Stockholders:

Fly to WinAchieve above-average profits in a changed
industry environment. Grow the airline
where it can make money and improve the
business/leisure mix. Maximize distribution
channels while reducing distribution costs
and eliminating non-value-added costs.
HIGHLIGHTS
cornerstones – Fly to Win (our market plan), Fund the Future
(our financial plan), Make Reliability a Reality (our product
plan) and Working Together (our people plan).
Let’s review what we accomplished in 2004 and what we plan
for 2005.
fly to win
As a network carrier, it’s the scope and scale of our route
network, coupled with our excellent product and service,
that deliver the revenue premium we earn every day, as com-
pared with our competitors. In 2004, we continued to build
our network, especially our international network, where
yields – in local currencies, and especially on a dollar basis –
have recovered quite strongly compared to the continuing
decline of the domestic yield environment.
To capture more of the international yield updraft, we launched
new service from New York to Oslo, Norway, and Edinburgh,
Scotland, and announced new service in 2005 from New York
Continental Airlines 2004 Annual Report
facing page l>r: Maria Gado - International Flight Attendant, Patrick Rhodriquez - Flight Attendant, Dave Pfeifer - 777 Captain, Deanna Oden - Flight Attendant,Tom Mitchell - 777 First Officer, Stefanie Solano - Flight Attendant
continental joined the global skyteamalliance in september 2004658 Destinations and 390 Airport Lounges
to Belfast, Northern Ireland; Berlin, Germany; Bristol, England;
Hamburg, Germany; New Delhi, India; and Stockholm, Sweden.
We also launched service from Houston to many new desti-
nations in Mexico, where we serve 30 cities, and to additional
Central American and Caribbean destinations. To enhance our
trans-Pacific service, we applied for and were awarded route
rights to serve Beijing, China, from New York, making us the
first U.S. carrier to offer nonstop service from New York to
Beijing. We expect that we will continue our international
focus throughout 2005.
We continued to make it easier for our customers to purchase
tickets, change their travel plans, and redeem their OnePass
miles online at continental.com, where we exceeded $1.5 bil-
lion in sales in 2004. We also made it easy for our customers
to check in online, and by December 2004, more than 25 per-
cent of our domestic passengers were checking in online,
rather than at the airport. We are installing international
self check-in kiosks at our hubs and at many of our spoke
airports, which permit customers on international flights
4
KLM
Air France
Northwest
Delta
Continental
CSA Czech
Aeromexico
Korean
Alitalia

5
new international serviceLAUNCHED IN 2004
New York–Edinburgh, Scotland Houston–Roatan, Honduras Saipan–Hong Kong
New York–Oslo, Norway Houston–Montego Bay, Jamaica Saipan–Taipei, Taiwan
Houston–Liberia, Costa Rica Houston–Port of Spain, Trinidad New York–Vancouver, Canada
New York–Punta Cana, Dominican Republic Honolulu–Nagoya, Japan
ANNOUNCED FOR 2005
New York–Beijing, China New York–Bristol, England New York–Guayaquil, Ecuador
New York–New Delhi, India New York–Belfast, Northern Ireland New York–Calgary, Canada
New York–Berlin, Germany New York–Hamburg, Germany Guam–Hiroshima, Japan
New York–Stockholm, Sweden Houston–Cali, Colombia
ADDITIONAL FREQUENCY
New York–Paris, France Houston–Amsterdam, Netherlands New York–Hong Kong
New York–Rome, Italy New York–Tel Aviv, Israel New York–Birmingham, England

6
Fund the FutureManage our assets to maximize stockholder
value and build for the future. Reduce costs
with technology. Generate positive cash flow
and improve financial flexibility by increasing
our cash balance.
HIGHLIGHTS
Continental Airlines 2004 Annual Report
to check in by swiping their passports through a scanner on
the kiosk. We also just began offering our international
passengers the convenience of checking in online as well.
We will also implement a highly advanced voice recognition
system in our reservations and OnePass service centers in
2005, which will be intuitive and easy to use and will provide
a wealth of information and service to our customers.
In 2004, we continued our unrelenting focus on reducing our
distribution costs by expanding direct access to our own
inventory and reservation and pricing systems. This allowed
us to further reduce the usage of high cost global distribution
systems and other third party reservations. At the same time,
we remain committed to distributing our product through a
broad array of distribution channels, so that customers can
buy their tickets in the manner most convenient to them.
In 2004, we proudly joined SkyTeam, the world’s premier
global airline alliance. Along with our domestic codeshare
partners Northwest Airlines and Delta Air Lines, we will be
codesharing with Air France, KLM, Alitalia, Korean, Aeromexico
and CSA Czech in 2005. The SkyTeam global network will
offer our customers unprecedented opportunities to fly to
658 destinations around the globe on a single electronic
ticket, earning and redeeming the mileage points of their
choice, while enjoying the convenience of through check-in
of luggage and 390 airport lounges.
fund the future
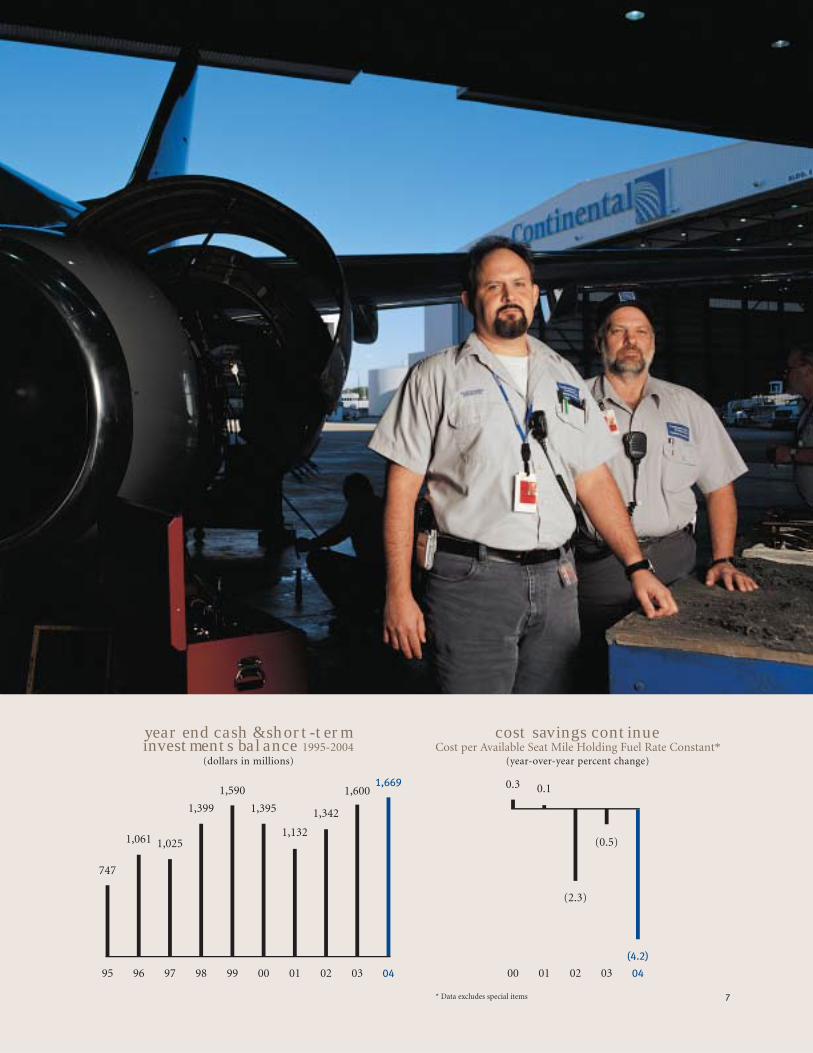
We ended 2004 with an unrestricted cash and short-term
investments balance of approximately $1.5 billion and total
cash and short-term investments of approximately $1.7 billion.
Adequate liquidity has become paramount in our industry.
In order to preserve liquidity, we elected deficit reduction con-
tribution relief under the Pension Funding Equity Act of 2004,
and we made no contributions to our pension plan for 2004.
Given the uncertain environment in which we operate today,
we believe our decision was prudent and one that was made
with a concern for, and not an indifference to, the long-term
interests of our co-workers.
facing page l>r: Al Schomber - Inspector – Line, Garry Vasquez - Inspector – Line
95
13.6
96
14.3
97
14.4
98
11.6
99
8.4
00
8.0
01
6.5
02
7.0
03
7.6
04
7.7
year end average fleet age 1995-2004
(years, mainline fleet only)
7
year end cash & short-terminvestments balance 1995-2004
(dollars in millions)
95
747
96
1,061
97
1,025
98
1,399
99
1,590
00
1,395
01
1,132
02
1,342
03
1,600
04
1,669
cost savings continueCost per Available Seat Mile Holding Fuel Rate Constant*
(year-over-year percent change)
* Data excludes special items
00
0.3
01
0.1
02
(2.3)
03
(0.5)
04
(4.2)

We continued to dispose of noncore assets, selling our
remaining stake in Orbitz in late 2004, netting approximately
$81 million and validating our vision in 2000 for profitably
negotiating the dot-com boom and bust with carefully
selected, proactive investments to lower our distribution
costs. We also continued to modernize our fuel-efficient
fleet, retiring all of our remaining MD-80 aircraft in early
2005, and taking delivery of five new 757-300 aircraft and
11 new 737-800 aircraft in 2004. We’ve completed the instal-
lation of winglets on 35 of our 737-800 aircraft and are in
the process of obtaining FAA approval to install winglets on
our Boeing 757-200 fleet. Winglets permit us to achieve up
to a 5 percent fuel savings on those aircraft, which is partic-
ularly important in today’s record fuel price environment, and
8
l>r: Syvalouis Nance - Lead Customer Service Agent, Lucia Rodriguez - Chelsea Transportation Coordinator, Jose Perez - EWR Hub Terminal Operations Supervisor,Charnette Simmons - Customer Service Agent, Rodrigo Augeraud - Chelsea Transportation Agent

Continental Airlines 2004 Annual Report
9
also provide us an opportunity to extend the range of those
aircraft to serve new markets previously unavailable to us. To
support the growth made possible by the investment of the
vast majority of our co-workers in lower pay and benefit costs,
we will lease eight additional Boeing 757-300 aircraft that will
be delivered beginning in the summer of 2005, and we are
accelerating the delivery of six new Boeing 737-800 aircraft
into 2006. We also will be the U.S. mainline launch customer
for Boeing’s new 787 long range widebody aircraft. We expect
to take delivery of 10 Boeing 787 aircraft beginning in 2009.
We also began to remodel and modernize our Terminal C
facilities in Houston to complement our new state-of-the-art
international check-in and arrivals facilities in Terminal E.
l>r: Alex Trovato - Chelsea Transportation Agent, Ron Williams - Lead Customer Service Agent, Andrew Prince - Lead Customer Service Agent, Edward Seiss - Line Technician, Peter Corrales - Line Technician

10
Make Reliability a RealityDeliver an industry-leading product we are proud
to sell. Rank among the top of the industry in
the key DOT measurements: on-time arrivals,
baggage handling, complaints and involuntary
denied boardings.
HIGHLIGHTS
The new international facilities in Houston feature a 4,500-
passenger-per-hour customs and immigration hall and a
TerminalLink people mover that connects Terminals B, C, D
and E, providing unprecedented convenience and speedy
processing and connections for our passengers.
make reliability a reality
2004 was a year of records for operational reliability at
Continental. We had 108 100-percent completion days in
2004, meaning that we completed each of our more than
1,000 daily flights 108 times without a single cancellation.
Our DOT segment completion factor for the year was
99.4 percent.
Our on-time performance was solid as well, with a DOT
on-time arrival rate of 78.9 percent for the year. Our mishan-
dled baggage ratio was also the best in our company’s
history. In 2004, as we consistently have done for a decade,
we got our passengers to their destinations safely, on-time
and with their underwear.
Our convenient online, airport and curbside self check-in
is now used by 73 percent of our domestic customers, and
we began installing international self check-in in late
2004, which was an instant success with our customers. In
2005, we expect significant growth in self-service check-in,
especially in online check-in on continental.com. Online at
continental.com, customers can check in, print a boarding
pass, request an upgrade, change seats, enter a frequent
flyer number, purchase, change or refund a ticket, and
redeem OnePass miles. Once checked in online, customers
with bags to check can conveniently do so at the airport at
specially designated eService bag drop kiosks, and be on
their way in a few minutes.
Interline eTicketing permits our customers to fly on multiple
carriers and check their luggage through with the conven-
ience of a single eTicket. We already have interline eTicketing
with Northwest, Delta, KLM and Air France and many other
carriers, and we are scheduled to implement interline eTicket
with the other members of the SkyTeam alliance during 2005.
Continental Airlines 2004 Annual Report
facing page l>r: Charlie Bass - Operations Manager, Richard King - Operations Manager, Butch Gorley - Crew Coordinator, Dave Harvey - System Operations Director
fleet developments757-300
Leasing eight additional 757-300 aircraft beginning
summer 2005
737-800
Accelerating delivery of six 737-800 aircraft into 2006
787
Taking delivery of 10 new 787 aircraft beginning in 2009,
becoming the U.S. mainline launch customer for Boeing’s
“Dreamliner”
MD-80
Retired the last MD-80 in support of the long-term fleet
simplification plan

11
on-time performance1995-2004 average*
(percentage)
completion factor1995-2004 average*
(percentage)
mishandled baggage1995-2004 average*
(per 1,000 passengers)
Source: Compiled from DOT Air Travel Consumer Reports
* Non-weighted average of yearly results
CO
79.2
NW
78.3
US
77.9
AA
77.4
DL
77.1
UA
75.8
CO
98.3
DL
98.0
AA
97.5
US
97.4
UA
97.3
NW
97.1
CO
4.05
US
4.39
DL
4.49
AA
4.86
NW
5.08
UA
5.67

12
working together
We started 2004 by being voted by our employees as one of
Fortune magazine’s “100 Best Companies to Work for in
America” for the sixth consecutive year. We were also named
for the seventh year in a row as one of the “100 Companies
Providing the Most Opportunities for Hispanics” by Hispanic
magazine. We are particularly proud of these honors, in light
of the turbulent and uncertain environment in which we
operate today. Despite the challenges facing Continental and
our industry, we continue to earn the trust of our co-workers
by communicating with them openly, honestly and frequently
and by treating them with dignity and respect. It’s our culture,
and we are committed to preserving that culture through
these difficult times.
We continued our on-time bonus and perfect attendance
programs in 2004, because they work. Our co-workers earned
more than $15 million in on-time bonuses in 2004, because
when our planes arrive on-time, everyone wins. We are in
a service business, and our success depends on having
Continental Airlines 2004 Annual Report
Working TogetherHelp well-trained employees build careers they enjoy
every day. Treat each other with dignity and respect.
Focus on safety. Make employee programs easy to
use and keep improving communications. Achieve
pay and benefit cost savings to permit the airline
to survive and grow into profitability.
HIGHLIGHTS
facing page l>r: Karla Lewis - Flight Recovery Center Desk Agent, Larry Abrams - Reservation Sales Agent, Derek Fowler - TPA Reservation Operations Manager,Michelle Young - Flight Recovery Center Desk Agent, Mike Mayo - Senior Director Reservation Sales/Service, Michelle Ice - Flight Recovery Center Desk Agent
teamwork yields financial benefitsRevenue-Generating/Cost-Saving Initiatives
pre-tax net benefit (dollars in millions)
$400 Million Initiative Achieved
$500 Million Initiative Achieved
$200 Million Initiative Run Rate
2007 (Estimated)
$500 Million Labor Cost Reductions* Run Rate
2006 (Estimated)
* Currently implementing reductions that are expected to result in annual savings of
approximately $418 million when fully implemented; balance due from new flight
attendant agreement subject to negotiation/ratification and Continental Micronesia
and certain international work groups.
employees who enjoy coming to work every day, who are
proud of the job they do, and who trust their management.
We know, and have demonstrated time and again, that Working
Together works.
After having sought and largely achieved a total $1.1 billion
of cost savings and revenue generation over the past three
years without asking our employees for pay and benefit
reductions, we reluctantly announced in late 2004 that we
needed $500 million in annual pay and benefit reductions
and workrule improvements. The wage reductions for our
co-workers were done on a progressive scale, so that our
lower paid co-workers were asked for less than higher paid
work groups. Our top executives led the way by announcing,
before we asked anyone for anything, that they would take
cuts in their base pay and annual and long-term incentive
compensation of 20 percent (25 percent for our CEO). When
the ratified collective bargaining agreements and the reduc-
tions from other work groups are fully implemented, we
expect to achieve approximately $418 million of our targeted

13
enhanced profit-sharing plan(percent of pre-tax profit for employees)
■ old plan ■ new plan
The Enhanced Profit-Sharing Plan will be the best
in the industry and will share a much higher percentage
of the pre-tax profits with employees than the old plan.
stock options for employees
Employee participants: 30,341
Exercise price: $11.89
Shares underlying options: 8.7 million
Percent of shares outstanding: 13 percent
Vesting period: 3 years
Stock options representing approximately 13 percent
of currently outstanding shares of common stock were issued
to employees in return for pay and benefit reductions.
(March 2005)annual pre-tax profits
$0 – $250 M
15
30
$250 – $500 M
15
25
> $500 M
15
20

$500 million in annual pay and benefit reductions, and
we are in discussions with our flight attendants and other
remaining work groups for the reductions that are necessary
from these groups. When we complete the pay and benefit
reductions, we are confident that Continental will be a
survivor that grows and prospers once again.
in summary
We remain a focused and disciplined company. Although we
are a nimble and aggressive competitor, we never lose sight
of the basics of our business and the key to our success –
delivering clean, safe and reliable air transportation, offering
amenities that customers want and are willing to pay for,
delivered by employees who enjoy coming to work and who
are committed to the success of Continental Airlines.
We believe 2005 will be a turning point for our industry and
for Continental. We are moving forward to achieve a cost
structure that is far more competitive and sustainable in a
permanently changed industry environment. Coupled with
our growing international network and the revenue premium
that we have historically earned, we believe that we will once
14
Continental Airlines 2004 Annual Report
Gordon BethuneOur Chairman and Chief Executive Officer, Gordon
Bethune, retired at the end of 2004. Gordon has been
my boss, and a friend and mentor, for a decade. He led
Continental from the abyss to become the best airline
in the world. He did this by convincing all Continental
employees to work together, to treat each other with
dignity and respect, and to deliver a clean, safe and
reliable operation every day. All of us will miss him.
2004 POSTSCRIPT
facing page l>r: Louise Petitt - Customer Service Representative, Efrain Villarreal - Airport Sales Agent – Interpreter, Cherie Hightower - Concierge
again outperform our competitors and bring great benefits to
our customers, our co-workers and our stockholders. So, as
in the past, we ask that you stick with us as we stick with our
Go Forward plan.
larry kellner
Chairman and
Chief Executive Officer
jeff smisek
President
The true test of a great leader is the legacy he leaves.
Gordon leaves the culture of Continental – the magic
that makes Continental a great place to work and a
great airline to fly. We are open and honest with our
employees, and our seasoned management team has
earned the trust of our co-workers. We are committed
to maintaining Continental as a place where employees
enjoy coming to work and have pride in their jobs,
where everyone is treated with dignity and respect,

15
and where people trust each other and their manage-
ment. We will maintain Continental’s culture, in bad
times and in good.
We have some difficult economic times ahead of us,
but I am confident that we will work together to make
it through those times, so we can fly out the other side
a stable, growing and prosperous airline.
I look forward to leading the team during the next
chapter in Continental’s success story.

16
Continental Airlines 2004 Annual Report
LARRY KELLNER
Chairman and Chief Executive Officer 10 years
JEFF SMISEK
President 10 years
JIM COMPTON
Executive Vice President Marketing10 years
JEFF MISNER
Executive Vice Presidentand Chief FinancialOfficer10 years
MARK MORAN
Executive Vice President Operations11 years
BILL BRUNGER
Senior Vice PresidentNetwork 19 years
REBECCA COX
Senior Vice President Government Affairs16 years
MARK ERWIN
Senior Vice PresidentAsia/Pacific andCorporate Development29 years
DAVE HILFMAN
Senior Vice President Sales18 years
GERRY LADERMAN
Senior Vice President Finance and Treasurer16 years
DANTE MARZETTA
Senior Vice President Technical Operations and Purchasing 11 years
BILL MEEHAN
Senior Vice PresidentAirport Services21 years
Executive Officers
Continental’s senior management team has worked together for
the past decade through the airline’s turnaround, the aftermath
of Sept. 11, 2001, and today’s economic challenges. Together they
hold more than 200 years of Continental experience.
HOLDEN SHANNON
Senior Vice PresidentGlobal Real Estate and Security10 years
JENNIFER VOGEL
Senior Vice President,General Counsel,Secretary and CorporateCompliance Officer10 years
NED WALKER
Senior Vice President Worldwide CorporateCommunications18 years

17
Continental Airlines 2004 Annual Report
Management’s Discussion and Analysis of Results of Operations
This discussion and analysis, as well as the financial statements and notes that follow, have been condensed from the full discussion
and analysis and financial statements and notes included in our Form 10-K for the year ended December 31, 2004. A copy of the
financial statements and notes filed with the Form 10-K, together with certain other financial data and analysis, are also included
as an appendix to the proxy statement for our 2005 annual meeting of stockholders.
Continental Airlines, Inc., a Delaware corporation, is a major United States air carrier engaged in the business of transport-
ing passengers, cargo and mail. We are the world’s sixth largest airline (as measured by the number of scheduled miles flown
by revenue passengers, known as revenue passenger miles, in 2004). Together with ExpressJet Airlines, Inc. (operating as
Continental Express and referred to as “ExpressJet”), a wholly-owned subsidiary of ExpressJet Holdings, Inc. (“Holdings”)
from which we purchase seat capacity, and our wholly owned subsidiary, Continental Micronesia, Inc. (“CMI”), we operate
more than 2,500 daily departures throughout the Americas, Europe and Asia. As of December 31, 2004, we flew to 130 domes-
tic and 113 international destinations and offered additional connecting service through alliances with domestic and
foreign carriers. We directly served 18 European cities, seven South American cities, Tel Aviv, Hong Kong and Tokyo as of
December 31, 2004. In addition, we provide service to more destinations in Mexico and Central America than any other U.S.
airline, serving 39 cities. Through our Guam hub, CMI provides extensive service in the western Pacific, including service
to more Japanese cities than any other United States carrier.
General information about us, including our Corporate Governance Guidelines, code of ethics and the charters for the com-
mittees of our Board of Directors, can be found at http://www.continental.com/company/investor. Our annual report on
Form 10-K, quarterly reports on Form 10-Q and current reports on Form 8-K, as well as any amendments and exhibits to those
reports, are available free of charge through our website as soon as reasonably practicable after we file them with, or furnish
them to, the Securities and Exchange Commission. Information on our website is not incorporated into our annual report on
Form 10-K or our other securities filings and is not a part of them.
This Annual Report contains forward-looking statements that are not limited to historical facts, but reflect our current beliefs,
expectations or intentions regarding future events. All forward-looking statements involve risks and uncertainties that could
cause actual results to differ materially from those in the forward-looking statements. For examples of those risks and uncer-
tainties, please see the risk factors contained in our annual report on Form 10-K for the year ended December 31, 2004, and
our other securities filings, including, with respect to the Form 10-K, the risk factors set forth in Item 1. “Business – Risk
Factors Relating to Terrorist Attacks and International Hostilities”, “Business – Risk Factors Relating to the Company” and
“Business – Risk Factors Relating to the Airline Industry.” In addition to the foregoing risks, there can be no assurance that we
will be able to obtain the needed pay and benefit reductions from our flight attendants or that the ratified collective bargain-
ing agreements and the wage and benefit reductions and work rule changes from other work groups will enable the company
to achieve the cost reductions expected, which will depend, upon other matters, on timely and effective implementation of new
work rules, actual productivity improvement, employee attrition, technology implementation, our level of business activity,
relations with employees generally and the ultimate accuracy of certain assumptions on which our cost savings are based. We
undertake no obligation to publicly update or revise any forward-looking statements to reflect events or circumstances that
may arise after the date of this report.

RESULTS OF OPERATIONS
The following discussion provides an analysis of our results of operations and reasons for material changes therein for the three
years ended December 31, 2004. The comparability of our financial results between years is affected by a number of special
items (see Note 6 to our condensed consolidated financial statements for further discussion of these items). Our results for each
of the last three years included the following special items (in millions):
INCOME (EXPENSE)
PRE TAX AFTER TAX
YEAR ENDED DECEMBER 31, 2004
MD-80 aircraft retirement charges and other $ (87) $ (68)
Termination of United Micronesian Development Association Service Agreement (34) (22)
Frequent flyer reward redemption cost adjustment (18) (18)
$ (139) $ (108)
YEAR ENDED DECEMBER 31, 2003
Security fee reimbursement $ 176 $ 111
Gain on dispositions of ExpressJet stock 173 100
Gain on Hotwire and Orbitz investments 132 83
MD-80 aircraft retirement and impairment charges (86) (54)
Revenue adjustment for change in expected redemption of frequent flyer mileage credits sold 24 15
Boeing 737 aircraft delivery deferral (14) (8)
$ 405 $ 247
YEAR ENDED DECEMBER 31, 2002
DC 10-30, MD-80 and turboprop aircraft retirement and impairment charges $ (242) $ (153)
Write-down of Stabilization Act receivable (12) (8)
$ (254) $ (161)
In addition, the deconsolidation of Holdings from our financial statements effective November 12, 2003, more fully described in
Note 7 to our condensed consolidated financial statements, also impacts the comparability of our results to those of prior years.
Comparison of 2004 to 2003
Passenger revenue increased during 2004 as compared to 2003, due to higher traffic and capacity in all geographic regions
combined with the negative impact of the hostilities in Iraq and SARS on the prior year results. However, in spite of the increase
in load factors, the continuing erosion of fares in the domestic and Caribbean markets resulted in a decrease in yields for 2004
compared to 2003. Wages, salaries and related costs decreased $237 million largely due to the impact of deconsolidating
Holdings, which was offset by an increase in the average number of employees, primarily due to increased flight activity, and
higher wage rates. Aircraft fuel and related taxes increased due to a significant rise in fuel prices, combined with an increase in
flight activity. The average jet fuel price per gallon including related taxes increased 30.2% from 91.40 cents in 2003 to 119.01 cents
in 2004. The impact of higher jet fuel prices in 2004 was partially offset by $74 million of gains from our fuel hedging activi-
ties. Such gains were immaterial in 2003. In 2004, obligations under our capacity purchase agreement are reported as ExpressJet
capacity purchase, net. In addition to the obligations for the purchased capacity, ExpressJet capacity purchase, net also includes
ExpressJet’s fuel expense in excess of the cap provided in the capacity purchase agreement and a related fuel purchase
agreement (71.2 cents per gallon, including fuel taxes) and is net of our rental income on aircraft we lease to ExpressJet. In 2003
(through November 12), intercompany transactions between us and Holdings or ExpressJet under the capacity purchase agree-
ment were eliminated in the consolidated financial statements. The actual obligations under the capacity purchase agreement
were higher in 2004 than in 2003 due to ExpressJet’s larger fleet and a 23.6% increase in regional available seat miles. Our
18
Continental Airlines 2004 Annual Report

effective tax rates differ from the federal statutory rate of 35% primarily due to increases in the valuation allowance, certain
expenses that are not deductible for federal income tax purposes, state income taxes and the accrual in 2003 of income tax
expense on our share of Holdings’ net income. Due to our continued losses, we were required to provide a valuation allowance
on the deferred tax assets recorded on losses beginning with the third quarter of 2004. As a result, our net losses for the third
and fourth quarters of 2004 were not reduced by any tax benefit.
Comparison of 2003 to 2002
Passenger revenue increased principally due to increased regional traffic in conjunction with ExpressJet’s capacity increases,
offset in part by reduced mainline traffic. The mainline traffic and capacity declines were largely due to a reduction in certain
international flights in response to decreased demand during the war in Iraq and related to SARS. Mainline yields were essen-
tially unchanged year over year. Cargo, mail and other revenue increased primarily due to military charter flights associated
with the war in Iraq, higher freight and mail volumes, and revenue-generating initiatives. Wages, salaries and related costs
increased as a result of increased pension costs and higher wage rates principally caused by increases in seniority, partially
offset by a 3.8% reduction in the average number of employees. Wages, salaries and related costs would have been $50 million
higher in 2003 had we not deconsolidated Holdings effective November 12, 2003. Aircraft fuel and related taxes increased
primarily due to the average mainline fuel price per gallon increase of 23.5% from 74.01 cents in 2002 to 91.40 cents in 2003.
Mainline fuel consumption was down 3.0% as a result of reduced flights and more fuel-efficient aircraft. Regional jet fuel
expense increased $46 million, even with the deconsolidation of Holdings, due to increased flights and higher jet fuel prices.
Payments made to ExpressJet under our capacity purchase agreement, previously eliminated in consolidation, are reported as
ExpressJet capacity purchase, net, beginning November 12, 2003, the date we deconsolidated Holdings. In addition to the
payments for the purchased capacity, ExpressJet capacity purchase, net, also includes ExpressJet’s fuel expense in excess of the
cap provided in the capacity purchase agreement and a related fuel purchase agreement and is net of our rental income on air-
craft we lease to ExpressJet. Maintenance, materials and repairs expense increased due to increases in our contractual engine
maintenance cost per hour rates, higher wide-body maintenance activity and the higher number of regional jets in service.
Maintenance, materials and repairs expense would have been $19 million higher in 2003 had we not deconsolidated Holdings
effective November 12, 2003. Other operating expense decreased as a result of lower insurance costs and cost-saving measures.
These expenses would have been $21 million higher in 2003 had we not deconsolidated Holdings effective November 12, 2003.
Our results for 2003 also included a $173 million gain on the disposition of Holdings shares and $132 million of gains related
to the sale of investments in Hotwire and Orbitz and an adjustment to fair value of our remaining investment in Orbitz, after
associated compensation expense.
Continental Airlines 2004 Annual Report
19

20
Continental Airlines 2004 Annual Report
Condensed Consolidated Statements of Operations
YEAR ENDED DECEMBER 31,
(In millions, except per share data) 2004 2003(A) 2002(A)
Operating Revenue:
Passenger $ 8,984 $ 8,135 $ 7,862
Cargo, mail and other 760 735 540
9,744 8,870 8,402
Operating Expenses:
Wages, salaries and related costs 2,819 3,056 2,959
Aircraft fuel and related taxes 1,587 1,319 1,084
ExpressJet capacity purchase, net 1,351 153 —
Aircraft rentals 891 896 902
Landing fees and other rentals 646 620 633
Commissions, booking fees, credit card fees and other distribution costs 552 525 592
Maintenance, materials and repairs 414 509 476
Depreciation and amortization 414 444 444
Passenger servicing 306 297 296
Security fee reimbursement — (176) —
Special charges 121 100 254
Other 872 924 1,074
9,973 8,667 8,714
Operating Income (Loss) (229) 203 (312)
Nonoperating Income (Expense):
Interest expense, net (346) (350) (312)
Income from affiliates 118 40 8
Gain on dispositions of ExpressJet Holdings shares — 173 —
Other, net 17 135 (15)
(211) (2) (319)
Income (Loss) before Income Taxes and Minority Interest (440) 201 (631)
Income Tax Benefit (Expense) 77 (114) 208
Minority Interest — (49) (28)
Net Income (Loss) $ (363) $ 38 $ (451)
Earnings (Loss) per Share:
Basic $ (5.49) $ 0.58 $ (7.02)
Diluted $ (5.55) $ 0.57 $ (7.02)
Shares Used for Computation:
Basic 66.1 65.4 64.2
Diluted 66.1 65.6 64.2
(A) Amounts include the consolidation of ExpressJet Holdings, Inc. through November 12, 2003. See Note 7 for further discussion.

Continental Airlines 2004 Annual Report
21
Condensed Consolidated Balance Sheets
DECEMBER 31,
(In millions) 2004 2003
ASSETS
Current Assets:
Cash and cash equivalents $ 1,055 $ 999
Restricted cash and cash equivalents 211 170
Short-term investments 403 431
Accounts receivable, net 472 403
Spare parts and supplies, net 214 191
Prepayments and other 473 392
Total Current Assets 2,828 2,586
Property and Equipment, net 6,344 6,488
Routes and Airport Operating Rights, net 851 874
Other Assets, net 522 701
Total Assets $ 10,545 $ 10,649
LIABILITIES AND STOCKHOLDERS’ EQUITY
Current Liabilities:
Current maturities of long-term debt and capital leases $ 670 $ 422
Accounts payable 766 840
Air traffic liability 1,157 957
Accrued payroll 281 280
Accrued other liabilities 385 366
Total Current Liabilities 3,259 2,865
Long-Term Debt and Capital Leases 5,167 5,558
Deferred Income Taxes 382 446
Accrued Pension Liability 1,132 680
Other 339 308
Commitments and Contingencies
Stockholders’ Equity:
Class B common stock 1 1
Additional paid-in capital 1,408 1,401
Retained earnings 585 948
Accumulated other comprehensive loss (587) (417)
Treasury stock, at cost (1,141) (1,141)
Total Stockholders’ Equity 266 792
Total Liabilities and Stockholders’ Equity $ 10,545 $ 10,649

22
Continental Airlines 2004 Annual Report
Condensed Consolidated Statements of Cash Flows
YEAR ENDED DECEMBER 31,
(In millions) 2004 2003(A) 2002(A)
Cash Flows from Operating Activities:
Net income (loss) $ (363) $ 38 $ (451)
Adjustments to reconcile net income (loss) to net cash
provided by operating activities:
Deferred income taxes (77) 101 (179)
Depreciation and amortization 414 444 444
Special charges 121 100 254
Gains on investments — (305) —
Equity in the income of affiliates (66) (23) (8)
Other, net (73) (36) —
Changes in operating assets and liabilities 417 23 (106)
Net cash provided by (used in) operating activities 373 342 (46)
Cash Flows from Investing Activities:
Capital expenditures (162) (205) (539)
Purchase deposits paid in connection with future aircraft deliveries (33) (29) (73)
Purchase deposits refunded in connection with aircraft delivered 144 81 219
Sale (purchase) of short-term investments, net 28 (134) (56)
Proceeds from sales of ExpressJet Holdings, net — 134 447
Proceeds from sales of Internet-related investments 98 76 —
Proceeds from disposition of property and equipment 16 16 9
Other (3) 53 (43)
Net cash provided by (used in) investing activities 88 (8) (36)
Cash Flows from Financing Activities:
Proceeds from issuance of long-term debt, net 67 559 596
Payments on long-term debt and capital lease obligations (447) (549) (383)
Proceeds from issuance of common stock 5 5 23
Increase in restricted cash (41) (108) (32)
Other 11 — —
Net cash (used in) provided by financing activities (405) (93) 204
Impact on cash of ExpressJet deconsolidation — (225) —
Net Increase in Cash and Cash Equivalents 56 16 122
Cash and Cash Equivalents – Beginning of Period 999 983 861
Cash and Cash Equivalents – End of Period $ 1,055 $ 999 $ 983
Supplemental Cash Flows Information:
Interest paid $ 372 $ 374 $ 345
Income taxes paid (refunded) $ (4) $ 13 $ (31)
Investing and Financing Activities Not Affecting Cash:
Property and equipment acquired through the issuance of debt $ 226 $ 120 $ 908
Capital lease obligations incurred $ 1 $ 22 $ 36
Contribution of ExpressJet stock to pension plan $ — $ 100 $ —
(A) Amounts include the consolidation of ExpressJet Holdings, Inc. through November 12, 2003. See Note 7 for further discussion.
Continental Airlines 2004 Annual Report
23
Notes to Condensed Consolidated Financial Statements
NOTE 1 – Basis of Presentation
The Company follows accounting principles generally accepted in the United States. Certain of the principles involve selections
among alternatives and choices of methods, which are described in the notes to the Company’s audited consolidated financial
statements included in the Proxy Statement for the 2005 Annual Meeting of Stockholders’ (Proxy Statement).
The accompanying condensed consolidated financial information and the notes below are a summary of those contained in
the Company’s audited consolidated financial statements included in the Proxy Statement.
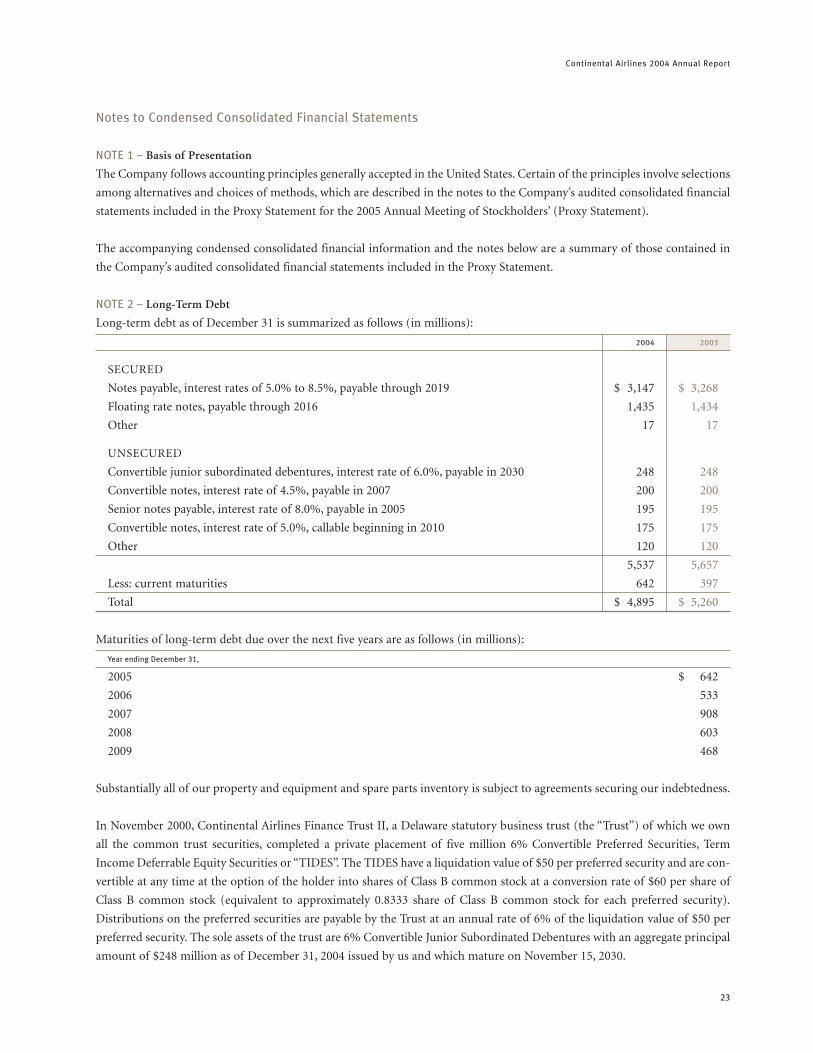
NOTE 2 – Long-Term Debt
Long-term debt as of December 31 is summarized as follows (in millions):
2004 2003
SECURED
Notes payable, interest rates of 5.0% to 8.5%, payable through 2019 $ 3,147 $ 3,268
Floating rate notes, payable through 2016 1,435 1,434
Other 17 17
UNSECURED
Convertible junior subordinated debentures, interest rate of 6.0%, payable in 2030 248 248
Convertible notes, interest rate of 4.5%, payable in 2007 200 200
Senior notes payable, interest rate of 8.0%, payable in 2005 195 195
Convertible notes, interest rate of 5.0%, callable beginning in 2010 175 175
Other 120 120
5,537 5,657
Less: current maturities 642 397
Total $ 4,895 $ 5,260
Maturities of long-term debt due over the next five years are as follows (in millions):
Year ending December 31,
2005 $ 642
2006 533
2007 908
2008 603
2009 468
Substantially all of our property and equipment and spare parts inventory is subject to agreements securing our indebtedness.
In November 2000, Continental Airlines Finance Trust II, a Delaware statutory business trust (the “Trust”) of which we own
all the common trust securities, completed a private placement of five million 6% Convertible Preferred Securities, Term
Income Deferrable Equity Securities or “TIDES”. The TIDES have a liquidation value of $50 per preferred security and are con-
vertible at any time at the option of the holder into shares of Class B common stock at a conversion rate of $60 per share of
Class B common stock (equivalent to approximately 0.8333 share of Class B common stock for each preferred security).
Distributions on the preferred securities are payable by the Trust at an annual rate of 6% of the liquidation value of $50 per
preferred security. The sole assets of the trust are 6% Convertible Junior Subordinated Debentures with an aggregate principal
amount of $248 million as of December 31, 2004 issued by us and which mature on November 15, 2030.

24
Continental Airlines 2004 Annual Report
The $175 million of 5% Convertible Notes due 2023 are convertible into our Class B common stock at an initial conversion
price of $20 per share, subject to certain conditions on conversion. The notes are redeemable for cash at our option on or after
June 18, 2010 at par plus accrued and unpaid interest, if any. Holders of the notes may require us to repurchase the notes on
June 15 of 2010, 2013 or 2018 or in the event of certain changes in control at par plus accrued and unpaid interest, if any.
The $200 million of 4.5% convertible notes due February 1, 2007 are convertible into our common stock at an initial conver-
sion price of $40 per share. The notes are redeemable at our option on or after February 5, 2005, at specified redemption prices.
NOTE 3 – Leases
We lease certain aircraft and other assets under long-term lease arrangements. Other leased assets include real property, air-
port and terminal facilities, maintenance facilities, training centers and general offices. Most aircraft leases include both renewal
options and purchase options. The purchase options are generally effective at the end of the lease term at the then-current fair
market value. Our leases do not include residual value guarantees. At December 31, 2004, the scheduled future minimum lease
payments under capital leases and the scheduled future minimum lease rental payments required under operating leases, that
have initial or remaining noncancelable lease terms in excess of one year, are as follows (in millions):
OPERATING LEASES
Year ending December 31, CAPITAL LEASES AIRCRAFT NON-AIRCRAFT
2005 $ 46 $ 982 $ 406
2006 39 933 397
2007 40 903 390
2008 45 884 369
2009 16 840 370
Later years 459 6,707 5,809
Total minimum lease payments 645 $ 11,249 $ 7,741
Less: amount representing interest 345
Present value of capital leases 300
Less: current maturities of capital leases 28
Long-term capital leases $ 272
At December 31, 2004, Continental had 474 aircraft under operating leases and seven aircraft under capital leases, including
aircraft subleased to ExpressJet. These operating leases have remaining lease terms ranging up to 20-1/4 years. Projected sub-
lease income to be received from ExpressJet through 2021, not included in the above table, is approximately $3.9 billion.
NOTE 4 – Stock Plans and Awards
The table below summarizes stock option transactions pursuant to our plans (share data in thousands):
2004 2003 2002
WEIGHTED- WEIGHTED- WEIGHTED-
AVERAGE AVERAGE AVERAGE
EXERCISE EXERCISE EXERCISE
OPTIONS PRICE OPTIONS PRICE OPTIONS PRICE
Outstanding at beginning of year 6,469 $ 17.86 6,871 $ 18.28 980 $ 36.34
Granted 729 $ 11.99 296 $ 15.00 6,079 $ 15.82
Exercised (181) $ 14.62 (306) $ 15.62 (65) $ 28.04
Cancelled (842) $ 19.10 (392) $ 24.82 (123) $ 35.45
Outstanding at end of year 6,175 $ 17.10 6,469 $ 17.86 6,871 $ 18.28
Options exercisable at end of year 4,837 $ 17.91 5,018 $ 18.27 3,856 $ 19.61

On February 28, 2005, we announced that we plan to issue to our employees stock options for approximately ten million shares
of our Class B common stock upon ratification and effectiveness of the tentative agreements for wage and benefit cost reduc-
tions with the unions representing our work groups. The stock options will be issued pursuant to two plans, a broad-based
plan for all of our employees and a supplemental plan for eligible pilots. The options will generally become exercisable in three
equal installments on the first, second and third anniversaries of the date of grant, and will have a term ranging from six to
eight years. No further options may be granted under either plan after ten years from the date the plan is adopted by our Board
of Directors.
NOTE 5 – Employee Benefit Plans
We have defined benefit pension and defined contribution (including 401(k) savings) plans. Substantially all of our domestic
employees are covered by one or more of these plans. The benefits under the active defined benefit pension plan are based on
years of service and an employee’s final average compensation. Our pension obligations are measured as of December 31 of
each year.
The following table sets forth the defined benefit pension plan’s change in projected benefit obligation (in millions) at
December 31:
2004 2003
Accumulated benefit obligation $ 2,412 $ 1,958
Projected benefit obligation at beginning of year $ 2,362 $ 2,061
Service cost 151 156
Interest cost 152 134
Plan amendments (6) —
Actuarial losses 310 192
Benefits paid (113) (187)
Other 7 6
Projected benefit obligation at end of year $ 2,863 $ 2,362
The following table sets forth the defined benefit pension plan’s change in the fair value of plan assets (in millions) at December 31:
2004 2003
Fair value of plan assets at beginning of year $ 1,280 $ 866
Actual gain on plan assets 113 218
Employer contributions 1 383
Benefits paid (113) (187)
Fair value of plan assets at end of year $ 1,281 $ 1,280
The following actuarial assumptions were used to determine the actuarial present value of our projected benefit obligation at
December 31:
2004 2003
Weighted average assumed discount rate 5.75% 6.25%
Weighted average rate of compensation increase 3.00% 2.87%
Continental Airlines 2004 Annual Report
25

Net periodic defined benefit pension expense for the years ended December 31 included the following components (in millions):
2004 2003 2002
Service cost $ 151 $ 156 $ 114
Interest cost 152 134 114
Expected return on plan assets (116) (72) (95)
Amortization of prior service cost 19 20 19
Amortization of unrecognized net actuarial loss 87 90 33
Net periodic benefit expense $ 293 $ 328 $ 185
NOTE 6 – Special Items
In 2004, we recorded special charges of $87 million ($69 million after taxes) primarily associated with future obligations for
rent and return conditions related to 16 leased MD-80 aircraft that were permanently grounded during the period. Our last
two active MD-80 aircraft were permanently grounded in January 2005. We also recorded a non-cash charge of $34 million
($22 million after taxes) related to the termination of a 1993 service agreement with United Micronesian Development
Association in the first quarter of 2004.
In 2003, we recorded fleet impairment losses and other special charges of $100 million ($62 million after taxes). In the first
quarter of 2003, we recorded fleet impairment losses and other special charges of $65 million ($41 million after taxes). This
charge includes $44 million additional impairment of our fleet of owned MD-80s, which was initially determined to be
impaired and written down to then current fair value in 2002. The remainder of the charge consisted primarily of the write-
down to market value of spare parts inventory for permanently grounded fleets. The charge reflected the impact of the war in
Iraq and the resulting deterioration of the already weak revenue environment for the U.S. airline industry. These write-downs
were necessary because the fair market values of the MD-80 and spare parts inventory had declined as a result of the difficult
financial environment and further reductions in capacity by U.S. airlines. In the second quarter of 2003, we recorded a special
charge of $14 million ($8 million after taxes) relating to the deferral of aircraft deliveries. In December 2003, we determined
five previously grounded leased MD-80 aircraft to be permanently grounded and recorded a charge of $21 million ($13 mil-
lion after income taxes) associated with future obligations for rent and return conditions, net of estimated sublease income, on
those aircraft.
In May 2003, we received and recognized in earnings $176 million in cash from the United States government pursuant to the
Emergency Wartime Supplemental Appropriations Act enacted in April 2003. This amount is reimbursement for our propor-
tional share of passenger security and air carrier security fees paid or collected by U.S. air carriers as of the date of enactment
of the legislation, together with other items.
During 2002, we recorded special charges totaling $254 million ($161 million after taxes) primarily related to the impairment
of owned aircraft and the accrual of future obligations for leased aircraft which have been permanently grounded or were to
be permanently grounded within 12 months following the charge. The charge included $242 million ($153 million after
income taxes) of retirement and impairment charges for DC 10-30, MD-80 and turboprop aircraft. In addition, we recorded a
charge of $12 million in 2002 to write down our receivable from the U.S. government based on our final application under the
Air Transportation Safety and System Stabilization Act.
The impairment losses in 2003 and 2002 were each partially the result of the September 11, 2001 terrorist attacks and the
related aftermath. As a result of the U.S. domestic airline industry environment and our continuing losses, we determined that
indicators of impairment were present for certain fleet types in each year. We estimated undiscounted cash flows to be gener-
ated by each fleet type. Our cash flow estimates were based on historical results adjusted to reflect our best estimate of future
market and operating conditions. The net carrying values of impaired aircraft and related items not recoverable were reduced
to fair value. Our estimates of fair value represented our best estimate based on industry trends and reference to market rates.
26
Continental Airlines 2004 Annual Report

NOTE 7 – Investment in ExpressJet and Regional Capacity Purchase Agreement
Investment in ExpressJet. As of December 31, 2004, we owned 16.7 million shares of Holdings common stock with a market
value of $215 million, which represented a 30.8% interest in Holdings. We do not currently intend to remain a stockholder of
Holdings over the long term. Subject to market conditions, we intend to sell or otherwise dispose of some or all of our shares
of Holdings common stock in the future.
We have reduced our ownership of Holdings from 100% prior to the initial public offering of Holdings common stock in 2002
to 30.8% as of December 31, 2004 through a series of transactions. These transactions include the initial public offering of the
common stock of Holdings by Holdings and us in 2002, a sale of Holdings common stock by us to Holdings in 2003 and con-
tributions by us of Holdings common stock to our defined benefit pension plan in 2003.
Prior to these transactions, we consolidated Holdings because we owned over 50% of the voting interest in Holdings. Effective
November 12, 2003, we account for our interest in Holdings using the equity method of accounting set forth in APB Opinion
No. 18, “The Equity Method of Accounting for Investments in Common Stock”. We believe that use of the equity method is
appropriate given our percentage ownership and our continued ability to significantly influence Holdings’ operations through
our capacity purchase agreement and our continued representation on Holdings’ Board of Directors.
Since the inception of our capacity purchase agreement with Holdings and ExpressJet, we have purchased all of ExpressJet’s
capacity and are responsible for selling all of the purchased seat inventory. As a result, after deconsolidation, we continue to
record the related passenger revenue and related expenses, with payments under the capacity purchase agreement reflected as
a separate operating expense. Prior to November 12, 2003, expenses under the capacity purchase agreement were eliminated in
consolidation and the portion of Holdings’ net income attributable to the equity of Holdings that we did not own was reported
as minority interest in our consolidated statement of operations. After deconsolidation, nonoperating income has increased
due to our equity in Holdings’ earnings and earnings under our tax sharing agreement with Holdings. Additionally, after
deconsolidation, we no longer record minority interest on either our balance sheet or statement of operations.
Capacity Purchase Agreement with ExpressJet. Under our capacity purchase agreement, ExpressJet currently flies all of its
aircraft (which consist entirely of regional jet aircraft) on our behalf, and we handle scheduling, ticket prices and seat inven-
tories for these flights. In exchange for ExpressJet’s operation of the flights and performance of other obligations under the
agreement, we pay them for each scheduled block hour based on an agreed formula. Under the agreement, we recognize all
passenger, cargo and other revenue associated with each flight, and are responsible for all revenue-related expenses, including
commissions, reservations, catering and passenger ticket processing expenses.
Under the agreement, we pay ExpressJet a base fee for each scheduled block hour based on a formula that was in place through
December 31, 2004. The formula was designed to provide ExpressJet with an operating margin of approximately 10% before
taking into account variations in some costs and expenses that are generally controllable by them, the most significant of which
is wages, salaries and benefits.
Our obligations under the capacity purchase agreement and ExpressJet’s fuel expense in excess of the cap provided in the
capacity purchase agreement and a related fuel purchase agreement, less our rental income on aircraft we lease to ExpressJet,
totaled $1.4 billion, $1.1 billion and $0.9 billion in 2004, 2003 and 2002, respectively. Subsequent to November 12, 2003, these
amounts are reported as “ExpressJet capacity purchase, net”; prior to that date they were eliminated in our consolidated finan-
cial statements.
The agreement currently expires on December 31, 2010 but allows us to terminate the agreement at any time after December 31,
2006 upon 12 months’ notice, or at any time without notice for cause (as defined in the agreement). We may also terminate the
agreement at any time upon a material breach by ExpressJet that does not constitute cause and continues for 90 days after
Continental Airlines 2004 Annual Report
27

notice of such breach, or without notice or opportunity to cure if we determine that there is a material safety concern with
ExpressJet’s flight operations. We have the option to extend the term of the agreement with 24 months’ notice for up to four
additional five-year terms through December 31, 2030.
NOTE 8 – Income Taxes
For financial reporting purposes, income tax benefits recorded on net losses result in deferred tax assets for financial report-
ing purposes. We are required to provide a valuation allowance for deferred tax assets to the extent management determines
that it is more likely than not that such deferred tax assets will ultimately not be realized. Due to our continued losses,
we were required to provide a valuation allowance on deferred tax assets recorded on losses beginning in the third quarter of
2004. As a result, our third and fourth quarter 2004 net losses were not reduced by any tax benefit. Furthermore, we expect to
be required to provide additional valuation allowance in conjunction with deferred tax assets recorded on losses in the future.
At December 31, 2004, we had estimated tax net operating losses (“NOLs”) of $3.2 billion for federal income tax purposes that
will expire beginning in 2006 through 2024. Due to our ownership change on April 27, 1993, the ultimate utilization of our
NOLs may be limited.
The IRS is in the process of examining our income tax returns for years through 2001 and has indicated that it may disallow
certain deductions we claimed. We believe the ultimate resolution of these audits will not have a material adverse effect on our
financial condition, liquidity or results of operations.
NOTE 9 – Segment Reporting
Information concerning operating revenue for the year ended December 31 by principal geographic areas is as follows (in millions):
2004 2003 2002
Domestic (U.S.) $ 6,415 $ 6,050 $ 5,570
Atlantic 1,489 1,203 1,205
Latin America 1,139 1,050 1,016
Pacific 701 567 611
$ 9,744 $ 8,870 $ 8,402
We attribute revenue among the geographical areas based upon the origin and destination of each flight segment. Our tangi-
ble assets and capital expenditures consist primarily of flight and related ground support equipment, which is mobile across
geographic markets and, therefore, has not been allocated.
NOTE 10 – Commitments and Contingencies
Purchase Commitments. We have substantial commitments for capital expenditures, including for the acquisition of new air-
craft. As of December 31, 2004, we had firm commitments for 47 aircraft from Boeing (excluding the recently announced
order discussed below), with an estimated cost of approximately $1.9 billion, and options to purchase an additional 84 Boeing
aircraft. On December 29, 2004, we announced that we had reached an agreement with Boeing for a new order of ten 787 air-
craft, with the first 787 to be delivered in 2009. We also agreed to lease eight used 757-300 aircraft from Boeing Capital
Corporation. The used 757-300 aircraft will be delivered beginning in the third quarter of 2005 through the first quarter of
2006. Additionally, we will accelerate into 2006 the delivery of six Boeing 737-800 aircraft that were previously scheduled to
be delivered in 2008. The agreements with Boeing are subject to several conditions, including the approval of our Board of
Directors. In addition, the 787 agreement is conditioned on the resolution of certain open matters including the negotiation
of an acceptable engine supply arrangement. Taking these new agreements with Boeing into consideration, we expect to take
delivery of 13 Boeing aircraft in 2005 (seven new 737-800s and six used 757-300s) and eight in 2006 (six new 737-800s and
two used 757-300s), with delivery of the remaining 44 Boeing aircraft occurring in 2008 and later years.
28
Continental Airlines 2004 Annual Report

The eight used 757-300 aircraft discussed above will be leased from Boeing Capital Corporation, which has also agreed to pro-
vide backstop lease financing for the six 737-800 aircraft to be delivered in 2006. We do not have backstop financing or any
other financing currently in place for the remainder of the aircraft. Further financing will be needed to satisfy our capital
commitments for our firm aircraft. We can provide no assurance that sufficient financing will be available for the aircraft on
order or other related capital expenditures.
As of December 31, 2004, ExpressJet had firm commitments for 29 regional jets from Empresa Brasileira de Aeronautica S.A.
(“Embraer”), with an estimated cost of approximately $600 million. ExpressJet currently anticipates taking delivery of 21 regional
jets in 2005. ExpressJet does not have an obligation to take any of these firm Embraer aircraft that are not financed by a third
party and leased to either ExpressJet or us. Under the capacity purchase agreement between us and ExpressJet, we have agreed
to lease as lessee and sublease to ExpressJet the regional jets that are subject to ExpressJet’s firm purchase commitments.
In addition, under the capacity purchase agreement with ExpressJet, we generally are obligated to purchase all of the capacity
provided by these new aircraft as they deliver to ExpressJet. We cannot predict whether passenger traffic levels will enable us to
utilize fully regional jets scheduled for future delivery to ExpressJet.
Financings and Guarantees. As of December 31, 2004, we were the guarantor of approximately $1.7 billion aggregate princi-
pal amount of tax-exempt special facilities revenue bonds and interest thereon (exclusive of $53 million bonds issued by the
City of Houston which we became the guarantor of in January 2005). These bonds, issued by various airport municipalities,
are payable solely from our rentals paid under long-term agreements with the respective governing bodies. The leasing
arrangements associated with approximately $1.5 billion of these obligations are accounted for as operating leases, and the
leasing arrangements associated with approximately $200 million of these obligations are accounted for as capital leases in
our financial statements.
Employees. As of December 31, 2004, we had approximately 38,255 full-time equivalent employees, consisting of approximately
16,755 customer service agents, reservations agents, ramp and other airport personnel, 7,900 flight attendants, 5,800 manage-
ment and clerical employees, 4,125 pilots, 3,575 mechanics and 100 dispatchers. While there can be no assurance that our generally
good labor relations and high labor productivity will continue, we have established as a significant component of our business
strategy the preservation of good relations with our employees, approximately 43% of whom are represented by unions.
Credit Card Processing Agreement. Our bank-issued credit card processing agreement contains certain financial covenants
which require, among other things, that we maintain a minimum EBITDAR (generally, earnings before interest, taxes, depre-
ciation, amortization and aircraft rentals, adjusted for special charges) to fixed charges (generally, interest and aircraft rentals)
ratio of 0.9 to 1.0 through June 30, 2006 and 1.1 to 1.0 thereafter. The liquidity covenant requires us to maintain a minimum
level of $1.0 billion of unrestricted cash and short-term investments. The agreement also requires we maintain a debt rating of
at least Caa3 as rated by Moody’s or CCC- as rated by Standard and Poor’s. Although we are currently in compliance with all
of the covenants, failure to maintain compliance would result in our being required to post up to an additional $335 million
of cash collateral, which would adversely affect our liquidity needed for our operations and debt service, but would not result
in a default under any of our debt or lease agreements.
Legal Proceedings. We and/or certain of our subsidiaries are defendants in various other lawsuits, including suits relating to
certain environmental claims, and proceedings arising in the normal course of business. While the outcome of these lawsuits
and proceedings cannot be predicted with certainty and could have a material adverse effect on our financial position, liquid-
ity or results of operations, it is our opinion, after consulting with outside counsel, that the ultimate disposition of such suits
will not have a material adverse effect on our financial position, liquidity or results of operations.
Continental Airlines 2004 Annual Report
29

Report of Independent Registered Public Accounting Firm
We have audited, in accordance with the standards of the Public Company Accounting Oversight Board (United States),
the consolidated balance sheets of Continental Airlines, Inc. as of December 31, 2004 and 2003, and the related consolidated
statements of operations, common stockholders’ equity and cash flows for each of the three years in the period ended
December 31, 2004 (not presented separately herein) and in our report dated March 14, 2005, we expressed an unqualified
opinion on those consolidated financial statements. In our opinion, the information set forth in the accompanying condensed
consolidated financial statements is fairly stated in all material respects in relation to the consolidated financial statements from
which it has been derived.
We have also audited, in accordance with the standards of the Public Company Accounting Oversight Board (United States),
the effectiveness of the Company’s internal control over financial reporting as of December 31, 2004, based on criteria
established in Internal Control – Integrated Framework issued by the Committee of Sponsoring Organizations of the Treadway
Commission and our report dated March 14, 2005 expressed an unqualified opinion thereon.
Houston, Texas
March 14, 2005
AIRCRAFT IN SERVICE AT DECEMBER 31, 2004
SEATS IN
TOTAL STANDARD AVERAGE AGE
Aircraft Type AIRCRAFT OWNED LEASED FIRM ORDERS OPTIONS CONFIGURATION (IN YEARS)
777-200ER 18 6 12 — 1 283 5.4
767-400ER 16 14 2 — — 235 3.3
767-200ER 10 9 1 — — 174 3.8
757-300 9 9 — — — 222 1.8
757-200 41 13 28 — — 183 7.9
737-900 12 8 4 3 24 167 3.3
737-800 91 26 65 29 35 155 4.2
737-700 36 12 24 15 24 124 6.0
737-500 63 15 48 — — 104 8.7
737-300 51 15 36 — — 124 18.3
MD-80 2 1 1 — — 141 18.3
Mainline jets 349 128 221 47 84 7.7
ERJ-145XR 75 — 75 29 100 50 1.4
ERJ-145 140 18 122 — — 50 4.6
ERJ-135 30 — 30 — — 37 4.3
Regional jets 245 18 227 29 100 3.6
Total 594 146 448 76 184 6.0
30
Continental Airlines 2004 Annual Report

NON-GAAP FINANCIAL MEASURES RECONCILIATION
For the non-GAAP financial measures included in this Condensed Annual Report, we have included the following reconcilia-
tion to GAAP information.
2004 2003 2002 2001 2000
Operating Cost per Available Seat Mile (cents) 9.65 9.36 9.53 9.22 9.68
Adjustments (cents per available seat mile):
Less: Fleet impairment and other special charges (a) (0.16) (0.13) (0.31) (0.14) —
Add: Security fee reimbursement (b) — 0.22 — — —
Add: Stabilization Act grant (c) — — — 0.50 —
Operating Cost per Available Seat Mile, excluding
special items (cents) (d) 9.49 9.45 9.22 9.58 9.68
2004 2003 2002 2001 2000 1999
Operating Cost per Available Seat Mile (cents) 9.65 9.36 9.53 9.22 9.68 9.07
Adjustments (cents per available seat mile):
Add (Less): Security fee reimbursement,
fleet impairment and other special charges
per available seat mile (0.16) 0.09 (0.31) 0.36 — (0.09)
Less: Current year fuel cost per available seat mile (e) (1.87) (1.47) (1.19) (1.38) (1.57) (0.97)
Add: Current year fuel cost at prior year fuel price
per available seat mile (e) 1.43 1.19 1.33 1.49 .90 0.96
Operating Cost per Available Seat Mile, holding
fuel rate constant and excluding special items (cents) (d) 9.05 9.17 9.36 9.69 9.01 8.97
Year-Over-Year % Change (4.2)% (0.5)% (2.3)% 0.1% 0.3%
2004
Net loss, as reported $ (363)
Adjustments (net of income taxes):
Add: MD-80 aircraft retirement charges and other 68
Add: Termination of United Micronesian Development Association Service Agreement 22
Add: Frequent flyer reward redemption cost adjustment 18
Net loss, excluding special items (d) $ (255)
(a) Mainline special charges during the year ended December 31, 2004, 2003, 2002 and 2001 were $121 million, $91 million, $197 million and $91 million, respectively.
(b) The mainline portion of the security fee reimbursement was $173 million.(c) The mainline portion of the Stabilization Act grant was $392 million.(d) The financial measures provide management and investors the ability to measure and monitor Continental’s performance on a more
consistent basis.(e) Both the cost and availability of fuel are subject to many economic and political factors and are therefore beyond our control.
Continental Airlines 2004 Annual Report
31

32
Continental Airlines 2004 Annual Report
Board of Directors
THOMAS J. BARRACK, JR.
Chairman and Chief Executive Officer
Colony Capital, LLC
KIRBYJON H. CALDWELL
Senior Pastor
The Windsor Village –
United Methodist Church
Houston, Texas
LARRY KELLNER
Chairman and Chief Executive Officer
Continental Airlines, Inc.
DOUGLAS H. MCCORKINDALE
Chairman, President and
Chief Executive Officer
Gannett Co., Inc.
HENRY L. MEYER III
Chairman, President and
Chief Executive Officer
KeyCorp
OSCAR MUNOZ
Executive Vice President and
Chief Financial Officer
CSX Corporation
GEORGE G. C. PARKER
Dean Witter Distinguished Professor
of Finance and Management,
Graduate School of Business,
Stanford University
JEFF SMISEK
President
Continental Airlines, Inc.
KAREN HASTIE WILLIAMS
Retired Partner
Crowell & Moring LLP
RONALD B. WOODARD
Former President
Boeing Commercial Airplane Group
CHARLES A. YAMARONE
Executive Vice President
Libra Securities LLC

Stockholder Information
HEADQUARTERS
Continental Airlines, Inc.
1600 Smith Street
Houston, TX 77002
(713) 324-5000
INVESTOR INFORMATION
To obtain a Form 10-K or other financial information,
visit the company’s Web site at: continental.com/company
or write:
Investor Relations
Continental Airlines, Inc.
P.O. Box 4607
Houston, TX 77210-4607
TRANSFER AGENT AND REGISTRAR
Mellon Investor Services LLC
85 Challenger Road
Ridgefield Park, NJ 07660
Attn: Shareholder Services
melloninvestor.com
(888) 711-6201
INDEPENDENT AUDITORS
Ernst & Young LLP
5 Houston Center
1401 McKinney
Houston, TX 77010
NYSE CORPORATE GOVERNANCE MATTERS
As a listed company with the New York Stock Exchange, our
Chief Executive Officer, as required under Section 303A.12(a)
of the NYSE Listed Company Manual, must certify to the
NYSE each year whether or not he is aware of any violation
by the company of NYSE Corporate Governance listing
standards as of the date of the certification. On April 5, 2004,
Continental’s Chief Executive Officer submitted such a certi-
fication to the NYSE which stated that he was not aware
of any violation by Continental of the NYSE Corporate
Governance listing standards. On March 15, 2005, Continental
filed its 2004 Form 10-K with the SEC, which included as
Exhibits 31.1 and 31.2 the Chief Executive Officer and Chief
Financial Officer certifications required under Section 302 of
the Sarbanes-Oxley Act of 2002.
COMMON STOCK
Our common stock trades on the New York Stock Exchange
under the symbol CAL. The table (below) shows the high and
low sales prices for our common stock as reported in the con-
solidated transaction reporting system during 2004 and 2003.
2004 HIGH LOW
4th Quarter $ 14.01 $ 7.63
3rd Quarter $ 11.68 $ 7.80
2nd Quarter $ 13.93 $ 9.05
1st Quarter $ 18.70 $ 10.85
2003 HIGH LOW
4th Quarter $ 21.70 $ 14.49
3rd Quarter $ 18.87 $ 12.05
2nd Quarter $ 15.90 $ 5.30
1st Quarter $ 9.39 $ 4.16
As of March 10, 2005, there were approximately 21,547 hold-
ers of record of our common stock. We have paid no cash
dividends on our common stock and have no current intention
of doing so. Under our agreement with the union representing
our pilots, we have agreed that we will not declare a cash
dividend or repurchase our outstanding common stock for
cash until we have contributed at least $500 million to the
pilots’ defined benefit plan, measured from March 30, 2005.
Our certificate of incorporation provides that no shares of
capital stock may be voted by or at the direction of persons
who are not United States citizens unless the shares are reg-
istered on a separate stock record. Our bylaws further provide
that no shares will be registered on the separate stock record
if the amount so registered would exceed United States for-
eign ownership restrictions. United States law currently limits
the voting power in us (and other U.S. airlines) of persons
who are not citizens of the United States to 25%.
