continued permafrost warming in northern alaska, … · continued permafrost warming. in northern...
TRANSCRIPT

Gary ClowEarth Surface Dynamics
Continued Permafrost Warmingin Northern Alaska, 2008
Update

OceanObservingSystems Atmospheric
ObservingSystems
GCOSTerrestrialObservingSystems
Essential Climate Variables:
….• permafrost - active layer thickness (GTN-P)• permafrost - thermal state (GTN-P)
….

Permafrost ZonesAlaska
Permafrost
Active Layer
Continuous Permafrost Discontinuous Permafrost

Permafrost
Active Layer
Continuous Permafrost Discontinuous Permafrost
Tair = -8°CTg = -5°C
mean-annual
Permafrost ZonesAlaska

GTN-P: Thermal State of Permafrost

DOI / GTN-P
NPRNPR--AA
ANWRANWR

Temperatures are periodically remeasured in the DOI/GTN-P boreholes using the USGS’sPolar Temperature Logging System. System sensitivity is ~ 0.2 mK, uncertainty = 3.3 mK.
Atigaru Point
measuring circuitlocated in a
thermally controlledFaraday cage
Borehole ArrayDOI/GTN-P
Arctic Ocean

Well
TeshekpukLake
Borehole ArrayDOI/GTN-P Permafrost Temperatures: East Teshekpuk
Temperatures at East Teshepuk about 1.6 years after borehole completion.

Borehole ArrayDOI/GTN-P Permafrost Temperatures: East Teshekpuk

Borehole ArrayDOI/GTN-P Permafrost Temperatures: East Teshekpuk

Borehole ArrayDOI/GTN-P Permafrost Temperatures: East Teshekpuk

Borehole ArrayDOI/GTN-P
Northern Alaska experienced a mild cooling during 1983-84. Just a hint of that cooling is visible in the 1984 East Teshekpuk log (it’s much more apparent at other sites).
Permafrost Temperatures: East Teshekpuk

Borehole ArrayDOI/GTN-P
Temperature logs acquired during 1989 began to show a recovery from the mid-1980’s cooling.
Permafrost Temperatures: East Teshekpuk

Borehole ArrayDOI/GTN-P Permafrost Temperatures: East Teshekpuk

Borehole ArrayDOI/GTN-P
The climate record during the 1990’s was clearly different from that during the 80’s and late 70’s.
Permafrost Temperatures: East Teshekpuk

Borehole ArrayDOI/GTN-P Permafrost Temperatures: East Teshekpuk

Borehole ArrayDOI/GTN-P
Measured temperature profiles with preliminary extrapolated surface temperatures. Surface temperatures were ~ 3.6°C warmer during 2007 than during the late-70’s, early-80’s.
Permafrost Temperatures: East Teshekpuk

Borehole ArrayDOI/GTN-P Permafrost Temperatures: South Meade
Surface temperatures were ~ 4.6°C warmer at South Meade during 2007 than during the late-70’s, early-80’s.
South Meade

Mean-Annual Surface Temperatures (°C), 1989
-9.3 -9.6-10.6
-10.2
-9.8
-7.0
-10.2
-9.7
Borehole ArrayDOI/GTN-P
-8.1
NPRNPR--AA
-8.8
Arctic Coastal Plain (ACP) was well within the Continuous Permafrost Zone in 1989 (Tg < -5°C).
Brooks Range
-9.8

Mean-Annual Surface Temperatures (°C), 2007
-4.6-4.5
-8.3
-6.4
-4.5
-7.7
-6.3
Borehole ArrayDOI/GTN-P
-4.4
NPRNPR--AA
-6.5-7.5
-6.5
By 2007, surface conditions at some locations on the ACP were approaching those thatoccur at the Continuous / Discontinuous permafrost boundary (Tg = -5°C).
Brooks Range
-4.2
-5.5
-5.8
[ΔT = 3.5°C]

Mean-Annual Surface Temperatures (°C), 2007
-4.6-4.5
-8.3
-6.4
-4.5
-7.7
-6.3
Borehole ArrayDOI/GTN-P
-4.4
NPRNPR--AA
-6.5-7.5
-6.5
By 2007, surface conditions at some locations on the ACP were approaching those thatoccur at the Continuous / Discontinuous permafrost boundary (Tg = -5°C).
Brooks Range
-4.2-4.3
-5.5
-5.8
Tair = -8°CTg = -5°C

Ice-Wedge DegradationArctic Coastal Plain
Jorgenson et al., GRL, 2006
T. Jorgenson
• Have been stableon the ACP for> 3000 years
NPR-A
Ice Wedges
• Take 1000s of yearsto form.
thermokarst pit

Ice-Wedge DegradationArctic Coastal Plain Jorgenson et al., GRL, 2006
T. Jorgenson
• Area/density of thermokarst pits abruptly increased an order of magnitude after 1982; an event of similar magnitude probably hasn’t occurred in the past 3,000 years.
area of thermokarst pits = 0.5% 0.6% 4.4%
density of pits = 88/km2 128/km2 1336/km2
• Degradation of ice wedges has caused a substantial redistribution of surface waterfrom the adjacent tundra into the degraded trough network.
• If the trend continues, 10-30% of the terrestrial landscape may be directly effected.
• Enhanced degradation was due to warmer summer temperatures during 1989-1998.

Permafrost DegradationArctic Alaska
changing shoreline environment
August, 2004thaw slump

Thawing-Degree-Days
Maximum Active-Layer Depth
Mean-August Temperature ProfilesFish Creek
2004: a particularly warm summer

Aug 2003
Coastal ErosionArctic Alaska
August, 2003
Susan Flora, BLM
Sept 2004 = 100 m Erosion
July 2003 = 35 m Erosion
July 2001
1998
July 2003
Sept 2004
Wind Speed, AK102
S. Flora, BLM
S. Flora, BLM
J.W. Dalton Wellsite

Coastal Erosion - Drew Point, Arctic Coast
Ben Jones, USGS

Permafrost Degradation - Arctic Alaska
ice wedges, advanced degradation
Bruce Richmond, USGS

thermokarstgully
Bruce Richmond, USGS
Permafrost Degradation - Arctic Alaska

Bruce Richmond, USGS
Permafrost Degradation - Arctic Alaska

Bruce Richmond, USGS
thaw slump
increased sediment fluxfrom melting permafrost
Permafrost Degradation - Arctic Alaska
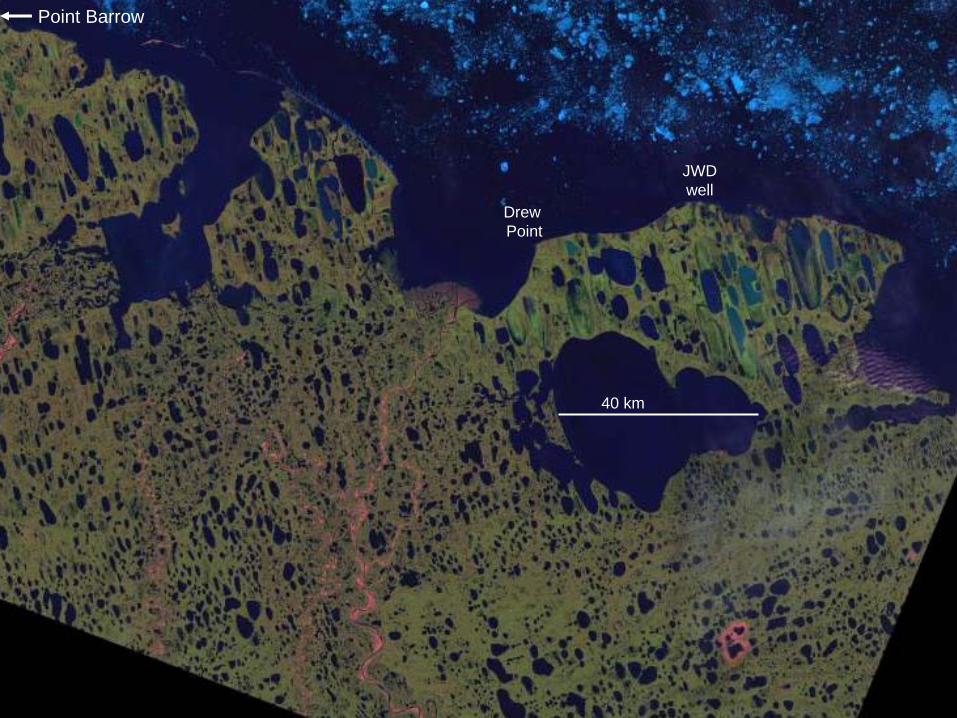
40 km
Point Barrow
Drew Point
JWDwell


Thank you!

-11
-10
-9
-8
-7
-6
1975 1980 1985 1990 1995 2000 2005 2010
Near-Surface Permafrost TemperaturesEast Teshekpuk, NPR-A
Tem
pera
ture
(°C
)
Year
Near-Surface Temperatures atEast Teshekpuk, NPRA

Mean-July Air Temperature (°C)
DOI/GTN-P monitoring networkstation AK102
Fish Creek - AK102
Future vegetation changes?
Fish Creek

DOI / GTN-P Active-Layer Network
1) Automated Permafrost / Climate-Monitoring Stations
NPRNPR--AA
ANWRANWR
Research + OperationalNetwork

• ground temperature (10 depths)• soil moisture• air temperature• pressure*• wind speed & direction• rain*• snow depth• up- and downwelling shortwave radiation• albedo
GCOS/GTOS/GTN-P Station U31Marsh Creek, ANWR


OceanObservingSystems Atmospheric
ObservingSystems
GCOS
GEOSS
TerrestrialObservingSystems