contents - annualreports.com€¦ · sales volumes for our sheet products were improving, increased...
TRANSCRIPT


Contents
Chairman’s Message
U. S. Steel GroupFinancial Information
S-1 Management’s Report
Audited Financial Statements:S-1 Report of Independent Accountants
2 Statement of Operations3 Balance Sheet4 Statement of Cash Flows5 Notes to Financial Statements
22 Selected Quarterly Financial Data
22 Principal Unconsolidated Investees
22 Supplementary Information
23 Five-Year Operating Summary
24 Five-Year Financial Summary
25 Management’s Discussion and Analysis
USX ConsolidatedFinancial Information
U-1 Management’s Report
Audited Consolidated Financial Statements:U-1 Report of Independent Accountants
2 Consolidated Statement of Operations4 Consolidated Balance Sheet5 Consolidated Statement of Cash Flows6 Consolidated Statement of Stockholders’ Equity8 Notes to Consolidated Financial Statements
29 Selected Quarterly Financial Data
30 Principal Unconsolidated Investees
30 Supplementary Information
35 Five-Year Operating Summary –Marathon Group
37 Five-Year Operating Summary –U. S. Steel Group
38 Five-Year Financial Summary
39 Management’s Discussion and Analysis
65 Organization
67 Investor Information
Description of BusinessThe U. S. Steel Group, a business unit of USX, consists oftwo reportable operating segments: 1) Domestic Steel and2) U. S. Steel Kosice (USSK). Domestic Steel includes theUnited States operations of U. S. Steel, while USSK includesthe U. S. Steel Kosice operations in the Slovak Republic.Domestic Steel is engaged in the domestic production andsale of steel mill products, coke and taconite pellets; themanagement of mineral resources; coal mining; engineeringand consulting services; and real estate development andmanagement. USSK is engaged in the production and sale ofsteel mill products and coke and primarily serves Europeanmarkets. USX Corporation, through its Marathon Group, isalso a major worldwide producer of oil and gas.
Explanatory Note Regarding Financial InformationAlthough the financial statements of the U. S. Steel Groupand the Marathon Group separately report the assets,liabilities (including contingent liabilities) and stockholders’equity of USX attributed to each such Group, suchattribution of assets, liabilities (including contingentliabilities) and stockholders’ equity between the U. S. SteelGroup and the Marathon Group for the purpose of preparingtheir respective financial statements does not affect legaltitle to such assets or responsibility for such liabilities.Holders of USX-U. S. Steel Group Common Stock and USX-Marathon Group Common Stock are holders of common stockof USX, and continue to be subject to all the risks associatedwith an investment in USX and all of its businesses andliabilities. Financial impacts arising from one Group thataffect the overall cost of USX’s capital could affect the resultsof operations and financial condition of the other Group. Inaddition, net losses of either Group, as well as dividends anddistributions on any class of USX Common Stock or series ofpreferred stock and repurchases of any class of USX CommonStock or series of preferred stock at prices in excess of par orstated value, will reduce the funds of USX legally availablefor payment of dividends on both classes of Common Stock.Accordingly, the USX consolidated financial informationshould be read in connection with the U. S. Steel Groupfinancial information.
Statement Regarding the Delivery of a Single Set of ProxyMaterials to Households with Multiple USX ShareholdersIf you have consented to the delivery of only one set ofproxy materials to multiple USX shareholders who shareyour address, then only one USX-U. S. Steel Group AnnualReport is being delivered to your household unless we havereceived contrary instructions from one or more of theshareholders sharing your address. We will deliver promptlyupon oral or written request a separate copy of the annualreport to any shareholder at your address. If you wish toreceive a separate copy, you may call us toll-free at1-866-433-4801 or write to us at USX Shareholder Services,Room 611, 600 Grant Street, Pittsburgh PA 15219-4776.Shareholders sharing an address who now receive multiplecopies may request delivery of a single copy by contactingShareholder Services, at the address or telephone numbershown above, to request the required consent form.

Chairman’s Message
2000 was a watershed year for U. S. Steel. Nearly two decades after the company began closing andconsolidating facilities to adjust to the changing economics of steelmaking, U. S. Steel is once again aglobal steelmaker. At the end of November, the company completed the acquisition of the steel operationsand related assets of VSZ a.s. in the Slovak Republic. Renamed after its home city, U. S. Steel Kosice is amodern, ISO 9001 certified, 100 percent continuously cast steel plant, located within a 500-mile radiusof dozens of our customers’ plants. With annual production capabilities of four million tons, U. S. SteelKosice represents about 25 percent of our expanded raw steel capacity of 16.8 million tons.
U. S. Steel’s globalization decisions are based on several strategic objectives: to support our U.S.customers as they expand globally, to broaden the company’s customer base, to target emergingmarkets where demand for value-added consumer goods is rising, and to provide favorable returns forour shareholders. The formation of U. S. Steel Kosice supports these objectives, and we believe it willhave a positive impact on our 2001 results.
We began the year with high expectations. The economy was strong, and automobile and applianceproduction were at record levels. Sales volumes for our sheet products were improving, increasedenergy prices were creating greater demand for our tubular products and we announced several priceincreases in an attempt to bring pricing back to the pre-crisis levels of 1997.
At mid-year, however, things began to change. Imports were at near-record levels, customersstarted to reduce inventory, the economy began to soften, natural gas prices skyrocketed, and salesvolumes and prices declined sharply. By the end of the year, spot market steel prices had dropped tounprecedented levels. We also faced unexpected production problems at both of our coal mines andunstable operations at our Fairfield Works’ blast furnace.
The skyrocketing cost of natural gas had a significant impact on our results. By year-end 2000,natural gas prices had more than tripled, adding costs of approximately $70 million over 1999. Naturalgas is used in most aspects of steelmaking, from the stoves that generate hot air for the blast furnace,to the reheat furnaces in the hot strip mill, to the coating process used to make corrosion resistantsheets. Through conservation, improved efficiency and the increased use of alternative and by-productfuels, such as coke-oven and blast furnace gas, we are striving to reduce our dependence on natural gas.
While the dramatic increase in natural gas prices wreaked havoc on the cost of making steel, it alsospurred exploration, drove up the drilling rig count from a 50-year low of 494 in April 1999 to more than1,100 at year-end 2000, and created strong demand for our tubular products. As a result, the performanceof our tubular business, which suffered in 1999 due to a glut of oil, improved year over year.
For the year 2000, the company recorded a net loss of $21 million on revenues of $6.1 billion, comparedto net income of $44 million on revenues of $5.5 billion in 1999.
For the third year in a row, the steel industry was affected by an enormous volume of dumped andsubsidized foreign steel. Imports were 37.8 million tons in 2000, the second highest annual level in history.
U. S. Steel, as part of an industry-labor coalition, pursued remedies under our trade laws to stemthe flow of unfairly traded imported steel, most recently by filing trade cases against hot rolled carbonsteel from 11 countries. We won our trade cases against small and large diameter seamless pipe andcut-to-length plate; however, we were not successful in our trade cases against cold rolled carbon steel.In November, U. S. Steel and other steelmakers, suppliers, trade associations and unions asked the
C O N T I N U E D
Financial Highlights(Dollars in millions, except per share data) 2000 1999 1998_______________________________________________________________________________________________Revenues And Other Income $ 6,132 $ 5,470 $ 6,477 Income From Operations 104 150 579 Income (Loss) Before Extraordinary Losses (21) 51 364 Net Income (Loss) (21) 44 364 _______________________________________________________________________________________________Balance Sheet Data At December 31:
Total Assets $ 8,711 $ 7,525 $ 6,749 Long-Term Debt And Other Financial Obligations 2,694 1,164 737 Stockholders’ Equity 1,919 2,056 2,093 Total Capitalization 4,613 3,220 2,830 _______________________________________________________________________________________________
Per Common Share:Net Income (Loss) – Basic $ (.33) $ .40 $ 4.05
– Diluted (.33) .40 3.92 Dividends Paid 1.00 1.00 1.00 Book Value – December 31 21.58 23.23 23.66 _______________________________________________________________________________________________
U. S. Steel Group

President to take immediate action to stop the flood of foreign steel which has, since 1998, forced 11 steel companies to filefor bankruptcy protection. The Clinton Administration’s response was disappointing. We look forward to working with theBush Administration to develop meaningful trade legislation and are encouraged by Commerce Secretary Donald Evans’expressed commitment to enforce our trade laws.
The impact of the ongoing steel crisis has affected all of our operations. U. S. Steel has seven blast furnaces at ourdomestic plants – four at Gary (Ind.) Works, two at Mon Valley (Pa.) Works and one at Fairfield (Ala.) Works. At year-end,six were operating at reduced levels, and the seventh, the No. 4 blast furnace at Gary Works, had been idled since July.Gary Works also temporarily idled one of its continuous casters. Minntac, our iron mine in Minnesota, idled anagglomerator line that accounts for 12 percent of its production of taconite pellets. Fairless Works, our finishing mill nearPhiladelphia, dramatically reduced production of cold reduced and coated sheet. Our domestic raw steel production for theyear fell to 11.4 million tons, or 89 percent of capability compared to 12 million tons, or 94 percent of capability in 1999.Domestically, we shipped 10.8 million tons of steel products, less than we had hoped as we entered the year.
Investment in our facilities remained focused on cost reduction, productivity, quality and environmental compliance. In2000, we completed the installation of the three new downcoilers on Gary Works’ hot strip mill. The new coilers improvethe mill’s capability of producing heavy gage coiled plate. Gary Works also completed modifications to the Q-BOP shopwhich allow it to produce the low-carbon/low-nitrogen steel valued by automakers for its strength and formability. MonValley Works installed two new BOP steelmaking vessels in the Edgar Thomson plant – which celebrated 125 years ofoperation in 2000 – and finished upgrading the controls for the Irvin plant’s cold reduction mill. Fairfield Works upgradedthe air emissions systems in the blast furnace casthouse and the steelmaking shop.
Joint ventures continued to be an important part of our business strategy in 2000. In response to the growing Mexicanautomotive and appliance manufacturing base, we have doubled the size of our Acero Prime joint venture processingcenter. This 130,000-square-foot facility is located in the central Mexican state of San Luis Potosi. In Ramos Arizpe, nearMonterrey, we have built a complementary 70,000-square-foot logistical center to store and manage inventories for customers.
In October 2000, U. S. Steel announced its intention to acquire LTV Corporation’s tin operations. Following a delaycaused by LTV’s bankruptcy filing, the transaction was completed at the end of February 2001. We expect the acquisitionto generate significant synergies for our tin business.
During the year, U. S. Steel introduced several new business systems designed to improve our position as a businesspartner with our customers. Among them is an enhanced Extranet, an Internet tool that enables our customers toelectronically interface with our sales organization and our plants throughout the entire order entry and productionprocess. We also implemented a supply chain management tool that improves inventory management, productionscheduling and cash flow for our customers and us. We lead the industry in this new approach to e-commerce.
In 2000, we improved safety performance by 5 percent over 1999, and have instituted several programs, including usingemployee safety teams for audits, training and interventions, to help us achieve further gains.
We are well on our way to achieving our goal of having all our plants registered under the ISO 14001 internationalenvironmental management standard by the end of 2002. Gary Works, Mon Valley Works and PRO-TEC will be registeredby the end of this year.
In November, the USX Board of Directors authorized management to retain financial, tax and legal advisors to performan in-depth study of its targeted stock structure (USX-U. S. Steel Group Common Stock and USX-Marathon Group CommonStock) and all alternative structures which may be in the best interest of shareholders. The study will take several months tocomplete. The advisors will report their findings and recommendations to the USX Board of Directors, who will review themto determine what actions to take. The Board, in turn, will notify all USX shareholders of the outcome of its review of thefindings and recommendations.
Looking ahead, economists predict a 3 percent average growth in the U.S. economy for the current year, most of itoccurring in the second half. With a relatively sound economy, steel shipments should improve and we could see modestincreases in steel prices later in the year. However, we expect imports to continue to have a negative effect on volume andprice in our industry.
Our approach during the economic recovery of the domestic steel industry will be to spend conservatively on capitalimprovements, to cut costs aggressively and to focus on improving our competitiveness.
In Europe, we will use U. S. Steel Kosice to expand our relationships with global customers. Our investments there willfocus primarily on developing the value-added products and services customers have come to expect from U. S. Steel.
On February 25, 2001, U. S. Steel celebrated the 100th anniversary of its incorporation. In 1901, the company wascapitalized at $1.4 billion – equal to about $80 billion today – and became the world’s largest corporation. The steelindustry of the time was described in terms that apply today – “cutthroat and chaotic.” U. S. Steel’s solution to the problemthen included consolidating businesses and moving closer to the customer.
While consolidation on the scale that occurred in 1901 is not possible today, we will continue to evaluate opportunitiesto expand domestically and globally. We believe it will take focused growth for U. S. Steel and its employees, customersand shareholders, to prosper in the global economy.
Thomas J. UsherChairman, Board of Directors &Chief Executive Officer

S-1
Management’s Report
The accompanying financial statements of the U. S. Steel Group are the responsibility of and havebeen prepared by USX Corporation (USX) in conformity with accounting principles generally acceptedin the United States. They necessarily include some amounts that are based on best judgments andestimates. The U. S. Steel Group financial information displayed in other sections of this report isconsistent with these financial statements.
USX seeks to assure the objectivity and integrity of its financial records by careful selection of itsmanagers, by organizational arrangements that provide an appropriate division of responsibility andby communications programs aimed at assuring that its policies and methods are understoodthroughout the organization.
USX has a comprehensive formalized system of internal accounting controls designed to providereasonable assurance that assets are safeguarded and that financial records are reliable. Appropriatemanagement monitors the system for compliance, and the internal auditors independently measure itseffectiveness and recommend possible improvements thereto. In addition, as part of their audit of thefinancial statements, USX’s independent accountants, who are elected by the stockholders, review andtest the internal accounting controls selectively to establish a basis of reliance thereon in determiningthe nature, extent and timing of audit tests to be applied.
The Board of Directors pursues its oversight role in the area of financial reporting and internalaccounting control through its Audit Committee. This Committee, composed solely of nonmanagementdirectors, regularly meets (jointly and separately) with the independent accountants, management andinternal auditors to monitor the proper discharge by each of its responsibilities relative to internalaccounting controls and the consolidated and group financial statements.
Thomas J. Usher Robert M. Hernandez Larry G. SchultzChairman, Board of Directors & Vice Chairman & Vice President–Chief Executive Officer Chief Financial Officer Accounting
Report of Independent Accountants
To the Stockholders of USX Corporation:
In our opinion, the accompanying financial statements appearing on pages S-2 through S-21 presentfairly, in all material respects, the financial position of the U. S. Steel Group at December 31, 2000 and1999, and the results of its operations and its cash flows for each of the three years in the period endedDecember 31, 2000, in conformity with accounting principles generally accepted in the United States ofAmerica. These financial statements are the responsibility of USX’s management; our responsibility isto express an opinion on these financial statements based on our audits. We conducted our audits ofthese statements in accordance with auditing standards generally accepted in the United States ofAmerica, which require that we plan and perform the audit to obtain reasonable assurance aboutwhether the financial statements are free of material misstatement. An audit includes examining, on atest basis, evidence supporting the amounts and disclosures in the financial statements, assessing theaccounting principles used and significant estimates made by management, and evaluating the overallfinancial statement presentation. We believe that our audits provide a reasonable basis for ouropinion.
The U. S. Steel Group is a business unit of USX Corporation (as described in Note 1, page S-5);accordingly, the financial statements of the U. S. Steel Group should be read in connection with theconsolidated financial statements of USX Corporation.
PricewaterhouseCoopers LLP600 Grant Street, Pittsburgh, Pennsylvania 15219-2794February 7, 2001
U. S. Steel Group

S-2
Statement of Operations(Dollars in millions) 2000 1999 1998_______________________________________________________________________________________________Revenues and other income:
Revenues $ 6,090 $ 5,536 $ 6,378 Income (loss) from investees (8) (89) 46 Net gains on disposal of assets 46 21 54 Other income (loss) 4 2 (1)_________ _________ _________
Total revenues and other income 6,132 5,470 6,477 _________ _________ _________Costs and expenses:
Cost of revenues (excludes items shown below) 5,656 5,084 5,604 Selling, general and administrative expenses (credits) (Note 12) (223) (283) (201)Depreciation, depletion and amortization 360 304 283 Taxes other than income taxes 235 215 212 _________ _________ _________
Total costs and expenses 6,028 5,320 5,898 _________ _________ _________Income from operations 104 150 579 Net interest and other financial costs (Note 7) 105 74 42 _________ _________ _________Income (loss) before income taxes and extraordinary losses (1) 76 537 Provision for income taxes (Note 15) 20 25 173 _________ _________ _________Income (loss) before extraordinary losses (21) 51 364 Extraordinary losses (Note 6) – 7 – _________ _________ _________Net income (loss) (21) 44 364 Dividends on preferred stock 8 9 9 _________ _________ _________Net income (loss) applicable to Steel Stock $ (29) $ 35 $ 355 _______________________________________________________________________________________________
Income Per Common Share Applicable to Steel Stock2000 1999 1998_______________________________________________________________________________________________
Basic:Income (loss) before extraordinary losses $ (.33) $ .48 $ 4.05 Extraordinary losses – .08 – _________ _________ _________Net income (loss) $ (.33) $ .40 $ 4.05
Diluted:Income (loss) before extraordinary losses $ (.33) $ .48 $ 3.92 Extraordinary losses – .08 – _________ _________ _________Net income (loss) $ (.33) $ .40 $ 3.92 _______________________________________________________________________________________________
See Note 21, for a description and computation of income per common share.The accompanying notes are an integral part of these financial statements.
U. S. Steel Group

S-3
Balance Sheet(Dollars in millions) December 31 2000 1999_______________________________________________________________________________________________Assets
Current assets:Cash and cash equivalents $ 219 $ 22 Receivables, less allowance for doubtful accounts
of $57 and $10 627 488 Receivables subject to a security interest (Note 11) 350 350 Income taxes receivable (Note 13) 364 97 Inventories (Note 14) 946 743 Deferred income tax benefits (Note 15) 201 281 Other current assets 10 – _________ _________
Total current assets 2,717 1,981
Investments and long-term receivables,less reserves of $28 and $3 (Notes 13 and 16) 536 572
Property, plant and equipment – net (Note 23) 2,739 2,516 Prepaid pensions (Note 12) 2,672 2,404 Other noncurrent assets 47 52 _________ _________
Total assets $ 8,711 $ 7,525 _______________________________________________________________________________________________Liabilities
Current liabilities:Notes payable $ 70 $ – Accounts payable 760 757 Payroll and benefits payable 202 322 Accrued taxes 173 177 Accrued interest 47 15 Long-term debt due within one year (Note 11) 139 13 _________ _________
Total current liabilities 1,391 1,284
Long-term debt (Note 11) 2,236 902 Deferred income taxes (Note 15) 666 348 Employee benefits (Note 12) 1,767 2,245 Deferred credits and other liabilities 483 441 Preferred stock of subsidiary (Note 10) 66 66 USX obligated mandatorily redeemable convertible preferred
securities of a subsidiary trust holding solely junior subordinatedconvertible debentures of USX (Note 18) 183 183
Stockholders’ Equity (Note 19)
Preferred stock 2 3 Common stockholders’ equity 1,917 2,053 _________ _________
Total stockholders’ equity 1,919 2,056 _________ _________Total liabilities and stockholders’ equity $ 8,711 $ 7,525 _______________________________________________________________________________________________
The accompanying notes are an integral part of these financial statements.
U. S. Steel Group

S-4
Statement of Cash Flows(Dollars in millions) 2000 1999 1998_______________________________________________________________________________________________Increase (decrease) in cash and cash equivalents
Operating activities:
Net income (loss) $ (21) $ 44 $ 364 Adjustments to reconcile to net cash provided
from (used in) operating activities:Extraordinary losses – 7 – Depreciation, depletion and amortization 360 304 283 Pensions and other postretirement benefits (847) (256) (215)Deferred income taxes 389 107 158 Net gains on disposal of assets (46) (21) (54)Changes in: Current receivables – sold – (320) (30)
– operating turnover (263) (242) 232 Inventories (63) (14) 7 Current accounts payable and accrued expenses (262) 239 (285)
All other – net 126 72 (80)_________ _________ _________Net cash provided from (used in) operating activities (627) (80) 380 _________ _________ _________
Investing activities:
Capital expenditures (244) (287) (310)Acquisition of U. S. Steel Kosice s.r.o., net of cash acquired of $59 (10) – – Disposal of assets 21 10 21 Restricted cash – withdrawals 2 15 35
– deposits (2) (17) (35)Investees – investments (35) (15) (73)
– loans and advances (10) – (1)All other – net 8 – 14 _________ _________ _________
Net cash used in investing activities (270) (294) (349)_________ _________ _________
Financing activities (Note 10):
Increase in U. S. Steel Group’s portion ofUSX consolidated debt 1,208 147 13
Specifically attributed debt:Borrowings – 350 – Repayments (6) (11) (4)
Steel Stock issued – – 55 Preferred stock repurchased (12) (2) (8)Dividends paid (97) (97) (96)_________ _________ _________
Net cash provided from (used in) financing activities 1,093 387 (40)_________ _________ _________
Effect of exchange rate changes on cash 1 – – _________ _________ _________
Net increase (decrease) in cash and cash equivalents 197 13 (9)
Cash and cash equivalents at beginning of year 22 9 18 _________ _________ _________
Cash and cash equivalents at end of year $ 219 $ 22 $ 9 _______________________________________________________________________________________________See Note 9, for supplemental cash flow information.The accompanying notes are an integral part of these financial statements.
U. S. Steel Group

S-5
Notes to Financial Statements
1. Basis of Presentation
USX Corporation (USX) has two classes of common stock: USX – U. S. Steel Group Common Stock(Steel Stock) and USX – Marathon Group Common Stock (Marathon Stock), which are intended toreflect the performance of the U. S. Steel Group and the Marathon Group, respectively.
The financial statements of the U. S. Steel Group include the financial position, results ofoperations and cash flows for all businesses of USX other than the businesses, assets and liabilitiesincluded in the Marathon Group, and a portion of the corporate assets and liabilities and relatedtransactions which are not separately identified with ongoing operating units of USX. The U. S. SteelGroup financial statements are prepared using the amounts included in the USX consolidatedfinancial statements. For a description of the U. S. Steel Group’s operating segments, see Note 8.
Although the financial statements of the U. S. Steel Group and the Marathon Group separatelyreport the assets, liabilities (including contingent liabilities) and stockholders’ equity of USXattributed to each such Group, such attribution of assets, liabilities (including contingent liabilities)and stockholders’ equity between the U. S. Steel Group and the Marathon Group for the purpose ofpreparing their respective financial statements does not affect legal title to such assets orresponsibility for such liabilities. Holders of Steel Stock and Marathon Stock are holders of commonstock of USX, and continue to be subject to all the risks associated with an investment in USX and allof its businesses and liabilities. Financial impacts arising from one Group that affect the overall cost ofUSX’s capital could affect the results of operations and financial condition of the other Group. Inaddition, net losses of either Group, as well as dividends and distributions on any class of USXCommon Stock or series of preferred stock and repurchases of any class of USX Common Stock orseries of preferred stock at prices in excess of par or stated value, will reduce the funds of USX legallyavailable for payment of dividends on both classes of Common Stock. Accordingly, the USXconsolidated financial information should be read in connection with the U. S. Steel Group financialinformation.
2. Summary of Principal Accounting Policies
Principles applied in consolidation – These financial statements include the accounts of the U. S.Steel Group. The U. S. Steel Group and the Marathon Group financial statements, taken together,comprise all of the accounts included in the USX consolidated financial statements.
Investments in entities over which the U. S. Steel Group has significant influence are accountedfor using the equity method of accounting and are carried at the U. S. Steel Group’s share of net assetsplus loans and advances.
Investments in companies whose stock is publicly traded are carried generally at market value.The difference between the cost of these investments and market value is recorded in othercomprehensive income (net of tax). Investments in companies whose stock has no readily determinablefair value are carried at cost.
Income from investees includes the U. S. Steel Group’s proportionate share of income from equitymethod investments. Also, gains or losses from a change in ownership of an unconsolidated investeeare recognized in the period of change.
Use of estimates – Generally accepted accounting principles require management to make estimatesand assumptions that affect the reported amounts of assets and liabilities, the disclosure of contingentassets and liabilities at year-end and the reported amounts of revenues and expenses during the year.Significant items subject to such estimates and assumptions include the carrying value of long-livedassets; valuation allowances for receivables, inventories and deferred income tax assets;environmental liabilities; liabilities for potential tax deficiencies and potential litigation claims andsettlements; and assets and obligations related to employee benefits. Additionally, certain estimatedliabilities are recorded when management commits to a plan to close an operating facility or to exit abusiness activity. Actual results could differ from the estimates and assumptions used.
U. S. Steel Group

S-6
Revenue recognition – Revenues are recognized generally when products are shipped or services areprovided to customers, the sales price is fixed and determinable, and collectibility is reasonablyassured. Costs associated with revenues, including shipping and other transportation costs, arerecorded in cost of revenues.
Cash and cash equivalents – Cash and cash equivalents include cash on hand and on deposit andinvestments in highly liquid debt instruments with maturities generally of three months or less.
Inventories – Inventories are carried at lower of cost or market. Cost of inventories is determinedprimarily under the last-in, first-out (LIFO) method.
Derivative instruments – The U. S. Steel Group uses commodity-based derivative instruments tomanage its exposure to price risk. Management is authorized to use futures, forwards, swaps andoptions related to the purchase of natural gas, refined products and nonferrous metals used in steeloperations. Recorded deferred gains or losses are reflected within other current and noncurrent assetsor accounts payable and deferred credits and other liabilities, as appropriate.
Long-lived assets – Depreciation is generally computed using a modified straight-line method basedupon estimated lives of assets and production levels. The modification factors for domestic steelproducing assets range from a minimum of 85% at a production level below 81% of capability, to amaximum of 105% for a 100% production level. No modification is made at the 95% production level,considered the normal long-range level.
Depletion of mineral properties is based on rates which are expected to amortize cost over theestimated tonnage of minerals to be removed.
The U. S. Steel Group evaluates impairment of its long-lived assets on an individual asset basis orby logical groupings of assets. Assets deemed to be impaired are written down to their fair value,including any related goodwill, using discounted future cash flows and, if available, comparablemarket values.
When long-lived assets depreciated on an individual basis are sold or otherwise disposed of, anygains or losses are reflected in income. Gains on disposal of long-lived assets are recognized whenearned, which is generally at the time of closing. If a loss on disposal is expected, such losses arerecognized when long-lived assets are reclassified as assets held for sale. Proceeds from disposal oflong-lived assets depreciated on a group basis are credited to accumulated depreciation, depletion andamortization with no immediate effect on income.
Major maintenance activities – The U. S. Steel Group incurs planned major maintenance costsprimarily for blast furnace relines. Such costs are separately capitalized in property, plant andequipment and are amortized over their estimated useful life, which is generally the period until thenext scheduled reline.
Environmental remediation – The U. S. Steel Group provides for remediation costs and penaltieswhen the responsibility to remediate is probable and the amount of associated costs is reasonablydeterminable. Generally, the timing of remediation accruals coincides with completion of a feasibilitystudy or the commitment to a formal plan of action. Remediation liabilities are accrued based onestimates of known environmental exposure and are discounted in certain instances.
Postemployment benefits – The U. S. Steel Group recognizes an obligation to provide postemploymentbenefits, primarily for disability-related claims covering indemnity and medical payments to certainemployees. The obligation for these claims and the related periodic costs are measured using actuarialtechniques and assumptions, including an appropriate discount rate, analogous to the requiredmethodology for measuring pension and other postretirement benefit obligations. Actuarial gains andlosses are deferred and amortized over future periods.
Insurance – The U. S. Steel Group is insured for catastrophic casualty and certain property andbusiness interruption exposures, as well as those risks required to be insured by law or contract. Costsresulting from noninsured losses are charged against income upon occurrence.
Reclassifications – Certain reclassifications of prior years’ data have been made to conform to 2000classifications.

S-7
3. New Accounting Standards
In the fourth quarter of 2000, USX adopted the following accounting pronouncements primarilyrelated to the classification of items in the financial statements. The adoption of these newpronouncements had no net effect on the financial position or results of operations of the U. S. SteelGroup, although they required reclassifications of certain amounts in the financial statements,including all prior periods presented.
• In December 1999, the Securities and Exchange Commission (SEC) issued Staff AccountingBulletin No. 101 (SAB 101) “Revenue Recognition in Financial Statements,” which summarizesthe SEC staff's interpretations of generally accepted accounting principles related to revenuerecognition and classification.
• In 2000, the Emerging Issues Task Force of the Financial Accounting Standards Board (EITF)issued EITF Consensus No. 99-19 “Reporting Revenue Gross as a Principal versus Net as anAgent,” which addresses whether certain items should be reported as a reduction of revenue oras a component of both revenues and cost of revenues, and EITF Consensus No. 00-10“Accounting for Shipping and Handling Fees and Costs,” which addresses the classification ofcosts incurred for shipping goods to customers.
• In September 2000, the Financial Accounting Standards Board issued Statement of FinancialAccounting Standards No. 140, “Accounting for Transfers and Servicing of Financial Assets andExtinguishments of Liabilities” (SFAS 140). SFAS 140 revises the standards for accounting forsecuritizations and other transfers of financial assets and collateral and requires certaindisclosures. USX adopted certain recognition and reclassification provisions of SFAS 140, whichwere effective for fiscal years ending after December 15, 2000. The remaining provisions ofSFAS 140 are effective after March 31, 2001.
In June 1998, the Financial Accounting Standards Board issued Statement of FinancialAccounting Standards No. 133, “Accounting for Derivative Instruments and Hedging Activities” (SFASNo. 133), which later was amended by SFAS Nos. 137 and 138. This Standard requires recognition ofall derivatives as either assets or liabilities at fair value. Changes in fair value will be reflected ineither current period net income or other comprehensive income, depending on the designation of thederivative instrument. The U. S. Steel Group may elect not to designate a derivative instrument as ahedge even if the strategy would be expected to qualify for hedge accounting treatment. The adoptionof SFAS No. 133 will change the timing of recognition for derivative gains and losses as compared toprevious accounting standards.
The U. S. Steel Group will adopt the Standard effective January 1, 2001. The transitionadjustment resulting from the adoption of SFAS No. 133 will be reported as a cumulative effect of achange in accounting principle. The transition adjustment for the U. S. Steel Group is expected to beimmaterial. The amounts reported as other comprehensive income will be reflected in net income whenthe anticipated physical transactions are consummated. It is not possible to estimate the effect thatthis Standard will have on future results of operations.
4. Corporate Activities
Financial activities – As a matter of policy, USX manages most financial activities on a centralized,consolidated basis. Such financial activities include the investment of surplus cash; the issuance,repayment and repurchase of short-term and long-term debt; the issuance, repurchase and redemption ofpreferred stock; and the issuance and repurchase of common stock. Transactions related primarily toinvested cash, short-term and long-term debt (including convertible debt), related net interest and otherfinancial costs, and preferred stock and related dividends are attributed to the U. S. Steel Group and theMarathon Group based upon the cash flows of each group for the periods presented and the initial capitalstructure of each group. Most financing transactions are attributed to and reflected in the financialstatements of the groups. See Note 10, for the U. S. Steel Group’s portion of USX’s financial activitiesattributed to the groups. However, transactions such as leases, certain collateralized financings, certainindexed debt instruments, financial activities of consolidated entities which are less than wholly ownedby USX and transactions related to securities convertible solely into any one class of common stock are orwill be specifically attributed to and reflected in their entirety in the financial statements of the group towhich they relate.

S-8
Corporate general and administrative costs – Corporate general and administrative costs areallocated to the U. S. Steel Group and the Marathon Group based upon utilization or other methodsmanagement believes to be reasonable and which consider certain measures of business activities,such as employment, investments and revenues. The costs allocated to the U. S. Steel Group were$25 million in 2000, $17 million in 1999 and $24 million in 1998, and primarily consist of employmentcosts including pension effects, professional services, facilities and other related costs associated withcorporate activities.
Income taxes – All members of the USX affiliated group are included in the consolidated UnitedStates federal income tax return filed by USX. Accordingly, the provision for federal income taxes andthe related payments or refunds of tax are determined on a consolidated basis. The consolidatedprovision and the related tax payments or refunds have been reflected in the U. S. Steel Group and theMarathon Group financial statements in accordance with USX’s tax allocation policy. In general, suchpolicy provides that the consolidated tax provision and related tax payments or refunds are allocatedbetween the U. S. Steel Group and the Marathon Group for group financial statement purposes, basedprincipally upon the financial income, taxable income, credits, preferences and other amounts directlyrelated to the respective groups.
For tax provision and settlement purposes, tax benefits resulting from attributes (principally netoperating losses and various tax credits), which cannot be utilized by one of the groups on a separatereturn basis but which can be utilized on a consolidated basis in that year or in a carryback year, areallocated to the group that generated the attributes. To the extent that one of the groups is allocated aconsolidated tax attribute which, as a result of expiration or otherwise, is not ultimately utilized on theconsolidated tax return, the prior years’ allocation of such attribute is adjusted such that the effect ofthe expiration is borne by the group that generated the attribute. Also, if a tax attribute cannot beutilized on a consolidated basis in the year generated or in a carryback year, the prior years’ allocationof such consolidated tax effects is adjusted in a subsequent year to the extent necessary to allocate thetax benefits to the group that would have realized the tax benefits on a separate return basis. As aresult, the allocated group amounts of taxes payable or refundable are not necessarily comparable tothose that would have resulted if the groups had filed separate tax returns.
5. Business Combination
On November 24, 2000, USX acquired U. S. Steel Kosice s.r.o. (USSK), which is located in the SlovakRepublic. USSK was formed in June 2000 to hold the steel operations and related assets of VSZ a.s.(VSZ), a diversified Slovak corporation. The cash purchase price was $69 million. Additional paymentsto VSZ of not less than $25 million and up to $75 million are contingent upon the future performanceof USSK. Additionally, $325 million of debt was included with the acquisition. The acquisition wasaccounted for under the purchase method of accounting. The 2000 results of operations include theoperations of USSK from the date of acquisition.
Prior to this transaction, USX and VSZ were equal partners in VSZ U. S. Steel s.r.o. (VSZUSS), atin mill products manufacturer. The assets of USSK included VSZ’s interest in VSZUSS. Theacquisition of the remaining interest in VSZUSS was accounted for under the purchase method ofaccounting. Previously, USX had accounted for its investment in VSZUSS under the equity method ofaccounting.
VSZ did not provide historical carve-out financial information for its steel activities prepared inaccordance with generally accepted accounting principles in the United States. USX was unable tofully determine the effects of transfer pricing, intercompany eliminations and expense allocations inorder to prepare such carve-out information from Slovak statutory reports and VSZ internal records.USX broadly estimates that the unaudited pro forma effect on its 2000 and 1999 revenues, givingeffect to the acquisition as if it had been consummated at the beginning of those periods, would havebeen to increase revenues in each period by approximately $1 billion. USX cannot determine theunaudited pro forma effect on its 2000 and 1999 net income. In any event, historical pro formainformation is not necessarily indicative of future results of operations.

S-9
6. Extraordinary Losses
In 1999, USX irrevocably deposited with a trustee the entire 5.5 million common shares it owned inRTI International Metals, Inc. (RTI). The deposit of the shares resulted in the satisfaction of USX’sobligation under its 63/4% Exchangeable Notes (indexed debt) due February 1, 2000. Under the termsof the indenture, the trustee exchanged one RTI share for each note at maturity. All shares wererequired for satisfaction of the indexed debt; therefore, none reverted back to USX.
As a result of the above transaction, USX recorded in 1999 an extraordinary loss of $5 million, netof a $3 million income tax benefit, representing prepaid interest expense and the write-off ofunamortized debt issue costs, and a pretax charge of $22 million, representing the difference betweenthe carrying value of the investment in RTI and the carrying value of the indexed debt, which isincluded in net gains on disposal of assets. Since USX’s investment in RTI was attributed to the U. S.Steel Group, the indexed debt was also attributed to the U. S. Steel Group.
In 1999, Republic Technologies International, LLC, an equity investee of USX, recorded anextraordinary loss related to the early extinguishment of debt. As a result, the U. S. Steel Grouprecorded an extraordinary loss of $2 million, net of a $1 million income tax benefit, representing itsshare of the extraordinary loss.
7. Other Items
(In millions) 2000 1999 1998_______________________________________________________________________________________________Net interest and other financial costs
Interest and other financial income(a):Interest income $ 3 $ 1 $ 5 Other 7 – – ________ ________ ________
Total 10 1 5 ________ ________ ________Interest and other financial costs(a):
Interest incurred 88 45 40 Less interest capitalized 3 6 6 ________ ________ ________
Net interest 85 39 34 Interest on tax issues 11 15 16 Financial costs on trust preferred securities 13 13 13 Financial costs on preferred stock of subsidiary 5 5 5 Amortization of discounts 1 1 2 Expenses on sales of accounts receivable – 15 21 Adjustment to settlement value of indexed debt – (13) (44)________ ________ ________
Total 115 75 47 ________ ________ ________Net interest and other financial costs(a) $ 105 $ 74 $ 42 _______________________________________________________________________________________________
(a) See Note 4, for discussion of USX net interest and other financial costs attributable to the U. S. Steel Group._______________________________________________________________________________________________
Foreign currency transactionsFor 2000, the aggregate foreign currency transaction gain included in determining net income was$7 million. There were no foreign currency transaction gains or losses in 1999 and 1998.
8. Segment Information
The U. S. Steel Group consists of two reportable operating segments: 1) Domestic Steel and 2) U. S.Steel Kosice (USSK). Domestic Steel includes the United States operations of U. S. Steel, while USSKincludes the U. S. Steel Kosice operations in the Slovak Republic. Domestic Steel is engaged in thedomestic production and sale of steel mill products, coke and taconite pellets; the management ofmineral resources; coal mining; engineering and consulting services; and real estate development andmanagement. USSK is engaged in the production and sale of steel mill products and coke andprimarily serves European markets.
Segment income represents income from operations allocable to both operating segments and doesnot include net interest and other financial costs and provisions for income taxes. Additionally, thefollowing items are not allocated to operating segments:
• Net pension credits associated with pension plan assets and liabilities• Certain costs related to former U. S. Steel Group business activities• USX corporate general and administrative costs. These costs primarily consist of
employment costs including pension effects, professional services, facilities and other relatedcosts associated with corporate activities.
• Certain other items not allocated to operating segments for business performance reportingpurposes (see reconcilement schedule on S-10)
Information on assets by segment is not provided as it is not reviewed by the chief operatingdecision maker.

S-10
The following represents the operations of the U. S. Steel Group:(In millions) Domestic Steel USSK Total_______________________________________________________________________________________________2000Revenues and other income:
Customer $ 5,981 $ 92 $ 6,073 Intergroup(a) 17 – 17 Equity in losses of unconsolidated investees (8) – (8)Other 50 – 50 _________ _________ _________
Total revenues and other income $ 6,040 $ 92 $ 6,132 _________ _________ __________________ _________ _________Segment income $ 23 $ 2 $ 25 Significant noncash items included in segment income –
Depreciation, depletion and amortization(b) 285 4 289 Capital expenditures 239 5 244 _______________________________________________________________________________________________1999Revenues and other income:
Customer $ 5,519 $ – $ 5,519 Intergroup(a) 17 – 17 Equity in losses of unconsolidated investees (43) – (43)Other 46 – 46 _________ _________ _________
Total revenues and other income $ 5,539 $ – $ 5,539 _________ _________ __________________ _________ _________Segment income $ 91 $ – $ 91 Significant noncash items included in segment income –
Depreciation, depletion and amortization 304 – 304 Capital expenditures(c) 286 – 286 _______________________________________________________________________________________________1998Revenues and other income:
Customer $ 6,374 $ – $ 6,374 Intergroup(a) 2 – 2 Equity in earnings of unconsolidated investees 46 – 46 Other 55 – 55 _________ _________ _________
Total revenues and other income $ 6,477 $ – $ 6,477 _________ _________ __________________ _________ _________Segment income $ 517 $ – $ 517 Significant noncash items included in segment income –
Depreciation, depletion and amortization 283 – 283 Capital expenditures(c) 305 – 305 _______________________________________________________________________________________________(a) Intergroup revenues and transfers were conducted under terms comparable to those with unrelated parties.(b) Difference between segment total and group total represents amounts for impairment of coal assets.(c) Differences between segment total and group total represent amounts related to corporate administrative
activities.
The following schedules reconcile segment amounts to amounts reported in the U. S. Steel Group’sfinancial statements:(In millions) 2000 1999 1998_______________________________________________________________________________________________Revenues and Other Income:
Revenues and other income of reportable segments $ 6,132 $ 5,539 $ 6,477 Items not allocated to segments:
Impairment and other costs related to aninvestment in an equity investee – (47) –
Loss on investment in RTI stock usedto satisfy indexed debt obligations – (22) – _________ _________ _________
Total Group revenues and other income $ 6,132 $ 5,470 $ 6,477 _________ _________ __________________ _________ _________Income:
Income for reportable segments $ 25 $ 91 $ 517 Items not allocated to segments:
Impairment of coal assets (71) – – Impairment and other costs related to an
investment in an equity investee – (47) – Loss on investment in RTI stock used
to satisfy indexed debt obligations – (22) – Administrative expenses (25) (17) (24)Net pension credits 266 228 186 Costs related to former businesses activities (91) (83) (100)_________ _________ _________
Total Group income from operations $ 104 $ 150 $ 579 _______________________________________________________________________________________________

S-11
Revenues by Product:(In millions) 2000 1999 1998_______________________________________________________________________________________________Sheet and semi-finished steel products $ 3,288 $ 3,433 $ 3,598 Tubular, plate and tin mill products 1,731 1,140 1,546 Raw materials (coal, coke and iron ore) 626 549 744 Other(a) 445 414 490 _______________________________________________________________________________________________(a) Includes revenue from the sale of steel production by-products, engineering and consulting services, real estate
development and resource management.
Geographic Area:The information below summarizes the operations in different geographic areas.
Revenues and Other Income____________________________________________Within Between
Geographic Geographic(In millions) Year Areas Areas Total Assets(a)_______________________________________________________________________________________________United States 2000 $ 6,027 $ – $ 6,027 $ 2,745
1999 5,452 – 5,452 2,889 1998 6,460 – 6,460 3,043
Slovak Republic 2000 95 – 95 376 1999 3 – 3 60 1998 6 – 6 66
Other Foreign Countries 2000 10 – 10 10 1999 15 – 15 3 1998 11 – 11 3
Total 2000 $ 6,132 $ – $ 6,132 $ 3,131 1999 5,470 – 5,470 2,952 1998 6,477 – 6,477 3,112 _______________________________________________________________________________________________
(a) Includes property, plant and equipment and investments.
9. Supplemental Cash Flow Information(In millions) 2000 1999 1998_______________________________________________________________________________________________Cash provided from (used in) operating activities included:
Interest and other financial costs paid(net of amount capitalized) $ (71) $ (77) $ (76)
Income taxes refunded (paid), includingsettlements with the Marathon Group 81 3 (29)_______________________________________________________________________________________________
USX debt attributed to all groups – net:Commercial paper:
Issued $ 3,362 $ 6,282 $ – Repayments (3,450) (6,117) –
Credit agreements:Borrowings 437 5,529 17,486 Repayments (437) (5,980) (16,817)
Other credit arrangements – net 150 (95) 55 Other debt:
Borrowings – 319 671 Repayments (54) (87) (1,053)_________ _________ _________
Total $ 8 $ (149) $ 342 _______________________________________________________________________________________________U. S. Steel Group activity $ 1,208 $ 147 $ 13 Marathon Group activity (1,200) (296) 329 _________ _________ _________
Total $ 8 $ (149) $ 342 _______________________________________________________________________________________________Noncash investing and financing activities:
Steel Stock issued for dividend reinvestment andemployee stock plans $ 5 $ 2 $ 2
Disposal of assets:Deposit of RTI common shares in satisfaction of indexed debt – 56 – Interest in USS/Kobe contributed to Republic – 40 – Other disposals of assets – notes or common stock received 14 1 2
Business combinations:Acquisition of USSK:
Liabilities assumed 568 – – Contingent consideration payable at present value 21 – – Investee liabilities consolidated in step acquisition 3 – –
Other acquisitions:Liabilities assumed – 26 – Investee liabilities consolidated in step acquisition – 26 – _______________________________________________________________________________________________

S-12
10. Financial Activities Attributed to Groups
The following is the portion of USX financial activities attributed to the U. S. Steel Group. Theseamounts exclude amounts specifically attributed to the U. S. Steel Group.
U. S. Steel Group Consolidated USX(a)___________________ __________________(In millions) December 31 2000 1999 2000 1999_______________________________________________________________________________________________Cash and cash equivalents $ 171 $ 1 $ 364 $ 9 Other noncurrent assets 3 1 7 8 ________ ________ ________ ________
Total assets $ 174 $ 2 $ 371 $ 17 _______________________________________________________________________________________________Notes payable $ 70 $ – $ 150 $ – Accrued interest 45 13 95 95 Long-term debt due within one year (Note 11) 130 7 277 54 Long-term debt (Note 11) 1,804 466 3,734 3,771 Preferred stock of subsidiary 66 66 250 250 ________ ________ ________ ________
Total liabilities $ 2,115 $ 552 $ 4,506 $ 4,170 _______________________________________________________________________________________________
U. S. Steel Group(b) Consolidated USX____________________ ____________________(In millions) 2000 1999 1998 2000 1999 1998_______________________________________________________________________________________________Net interest and other financial costs (Note 7) $59 $39 $29 $309 $334 $324 _______________________________________________________________________________________________(a) For details of USX long-term debt and preferred stock of subsidiary, see Notes 14 and 22, respectively, to the
USX consolidated financial statements.(b) The U. S. Steel Group’s net interest and other financial costs reflect weighted average effects of all financial
activities attributed to all groups.
11. Long-Term Debt
The U. S. Steel Group’s portion of USX’s consolidated long-term debt is as follows:
U. S. Steel Group Consolidated USX(a)___________________ ___________________(In millions) December 31 2000 1999 2000 1999_______________________________________________________________________________________________Specifically attributed debt(b):
Receivables facility $ 350 $ 350 $ 350 $ 350 Sale-leaseback financing and capital leases 88 92 95 107 Other 3 – 4 1 ________ ________ ________ ________
Total 441 442 449 458 Less amount due within one year 9 6 10 7 ________ ________ ________ ________
Total specifically attributed long-term debt $ 432 $ 436 $ 439 $ 451 _______________________________________________________________________________________________Debt attributed to groups(c) $ 1,946 $ 477 $ 4,036 $ 3,852
Less unamortized discount 12 4 25 27 Less amount due within one year 130 7 277 54 ________ ________ ________ ________
Total long-term debt attributed to groups $ 1,804 $ 466 $ 3,734 $ 3,771 _______________________________________________________________________________________________Total long-term debt due within one year $ 139 $ 13 $ 287 $ 61 Total long-term debt due after one year 2,236 902 4,173 4,222 _______________________________________________________________________________________________(a) See Note 14, to the USX consolidated financial statements for details of interest rates, maturities and other
terms of long-term debt.(b) As described in Note 4, certain financial activities are specifically attributed only to the U. S. Steel Group and
the Marathon Group.(c) Most long-term debt activities of USX Corporation and its wholly owned subsidiaries are attributed to all groups
(in total, but not with respect to specific debt issues) based on their respective cash flows (Notes 4, 9and 10).

S-13
12. Pensions and Other Postretirement Benefits
The U. S. Steel Group has noncontributory defined benefit pension plans covering substantially allU.S. employees. Benefits under these plans are based upon years of service and final averagepensionable earnings, or a minimum benefit based upon years of service, whichever is greater. Inaddition, pension benefits are also provided to most U.S. salaried employees based upon a percent oftotal career pensionable earnings. Certain of these plans provide benefits to USX corporate employees,and the related costs or credits for such employees are allocated to all groups (Note 4). The U. S. SteelGroup also participates in multiemployer plans, most of which are defined benefit plans associatedwith coal operations.
The U. S. Steel Group also has defined benefit retiree health care and life insurance plans (otherbenefits) covering most U.S. employees upon their retirement. Health care benefits are providedthrough comprehensive hospital, surgical and major medical benefit provisions or through healthmaintenance organizations, both subject to various cost sharing features. Life insurance benefits areprovided to nonunion retiree beneficiaries primarily based on employees’ annual base salary atretirement. These plans provide benefits to USX corporate employees, and the related costs for suchemployees are allocated to all groups (Note 4). For U.S. union retirees, benefits are provided for themost part based on fixed amounts negotiated in labor contracts with the appropriate unions.
Pension Benefits Other Benefits_____________________ _____________________(In millions) 2000 1999 2000 1999_______________________________________________________________________________________________Change in benefit obligationsBenefit obligations at January 1 $ 6,716 $ 7,549 $ 1,896 $ 2,113 Service cost 76 87 12 15 Interest cost 505 473 147 133 Plan amendments – 381 (a) – 14 Actuarial (gains) losses 430 (822) 260 (225)Plan merger and acquisition – 42 – 7 Settlements, curtailments and termination benefits – (207) – – Benefits paid (806) (787) (166) (161)_________ _________ _________ _________Benefit obligations at December 31 $ 6,921 $ 6,716 $ 2,149 $ 1,896 _______________________________________________________________________________________________Change in plan assetsFair value of plan assets at January 1 $ 9,995 $10,243 $ 281 $ 265 Actual return on plan assets 139 729 26 20 Acquisition (1) 26 – 1 Employer contributions – – 576 (b) 34 Trustee distributions(c) (16) (14) – – Settlements paid – (207) – – Benefits paid from plan assets (805) (782) (41) (39)_________ _________ _________ _________Fair value of plan assets at December 31 $ 9,312 $ 9,995 $ 842 $ 281 _______________________________________________________________________________________________Funded status of plans at December 31 $ 2,391 (d) $ 3,279 (d) $(1,307) $ (1,615)Unrecognized net gain from transition (2) (69) – – Unrecognized prior service cost 719 817 12 19 Unrecognized actuarial gains (462) (1,639) (241) (526)Additional minimum liability (19) (16) – – _________ _________ _________ _________Prepaid (accrued) benefit cost $ 2,627 $ 2,372 $(1,536) $ (2,122)_______________________________________________________________________________________________(a) Results primarily from a five-year labor contract with the United Steelworkers of America ratified in August
1999.(b) Includes contributions of $530 million to a Voluntary Employee Benefit Association trust, comprised of
$30 million in contractual requirements and an elective contribution of $500 million. Also includes a $30 millionelective contribution to the non-union retiree life insurance trust.
(c) Represents transfers of excess pension assets to fund retiree health care benefits accounts under Section 420 ofthe Internal Revenue Code.
(d) Includes a plan that has accumulated benefit obligations in excess of plan assets: Aggregate accumulated benefit obligations $ (40) $ (29) Aggregate projected benefit obligations (49) (39) Aggregate plan assets – – _______________________________________________________________________________________________

S-14
Pension Benefits Other Benefits_____________________________ _______________________________(In millions) 2000 1999 1998 2000 1999 1998_______________________________________________________________________________________________Components of net periodic
benefit cost (credit)Service cost $ 76 $ 87 $ 71 $ 12 $ 15 $ 15 Interest cost 505 473 487 147 133 141 Expected return on plan assets (841) (781) (769) (24) (21) (21)Amortization –net transition gain (67) (67) (69) – – –
–prior service costs 98 83 72 4 4 4 –actuarial (gains) losses (44) 6 6 (29) (12) (16)
Multiemployer and other plans – – 1 9 (a) 7 (a) 13 (a)
Settlement and termination (gains) losses – (35)(b) 10 (b) – – – _______ _______ _______ _______ _______ _______Net periodic benefit cost (credit) $ (273) $ (234) $ (191) $ 119 $ 126 $ 136 _______________________________________________________________________________________________(a) Represents payments to a multiemployer health care benefit plan created by the Coal Industry Retiree Health
Benefit Act of 1992 based on assigned beneficiaries receiving benefits. The present value of this unrecognizedobligation is broadly estimated to be $84 million, including the effects of future medical inflation, and thisamount could increase if additional beneficiaries are assigned.
(b) Relates primarily to the 1998 voluntary early retirement program.Pension Benefits Other Benefits_____________________ _____________________2000 1999 2000 1999_______________________________________________________________________________________________
Weighted average actuarial assumptionsat December 31:
Discount rate 7.5% 8.0% 7.5% 8.0% Expected annual return on plan assets 8.9% 8.5% 8.5% 8.5% Increase in compensation rate 4.0% 4.0% 4.0% 4.0% _______________________________________________________________________________________________
For measurement purposes, a 7.5% annual rate of increase in the per capita cost of covered healthcare benefits was assumed for 2001. The rate was assumed to decrease gradually to 5% for 2006 andremain at that level thereafter.
A one-percentage-point change in assumed health care cost trend rates would have the followingeffects:
1-Percentage- 1-Percentage-(In millions) Point Increase Point Decrease_______________________________________________________________________________________________
Effect on total of service and interest cost components $ 16 $ (14)Effect on other postretirement benefit obligations 177 (151)_______________________________________________________________________________________________
13. Intergroup Transactions
Revenues and purchases – U. S. Steel Group revenues for sales to the Marathon Group totaled$17 million in both 2000 and 1999 and $2 million in 1998. U. S. Steel Group purchases from theMarathon Group totaled $60 million, $41 million and $21 million in 2000, 1999 and 1998, respectively.At December 31, 2000 and 1999, U. S. Steel Group receivables included $2 million related totransactions with the Marathon Group. At December 31, 2000 and 1999, U. S. Steel Group accountspayable included $1 million and $5 million, respectively, related to transactions with the MarathonGroup. These transactions were conducted under terms comparable to those with unrelated parties.
Income taxes receivable from/payable to the Marathon Group – At December 31, 2000 and 1999,amounts receivable or payable for income taxes were included in the balance sheet as follows:(In millions) December 31 2000 1999_______________________________________________________________________________________________Current:
Income tax receivable $ 364 $ 97 Accounts payable 4 1
Noncurrent:Investments and long-term receivables 97 97 _______________________________________________________________________________________________
These amounts have been determined in accordance with the tax allocation policy described inNote 4. Amounts classified as current are settled in cash in the year succeeding that in which suchamounts are accrued. Noncurrent amounts represent estimates of intergroup tax effects of certainissues for years that are still under various stages of audit and administrative review. Such tax effectsare not settled between the groups until the audit of those respective tax years is closed. The amountsultimately settled for open tax years will be different than recorded noncurrent amounts based on thefinal resolution of all of the audit issues for those years.

S-15
14. Inventories(In millions) December 31 2000 1999_______________________________________________________________________________________________Raw materials $ 214 $ 101 Semi-finished products 429 392 Finished products 210 193 Supplies and sundry items 93 57 _________ _________
Total $ 946 $ 743 _______________________________________________________________________________________________
At December 31, 2000 and 1999, respectively, the LIFO method accounted for 91% and 93% oftotal inventory value. Current acquisition costs were estimated to exceed the above inventory values atDecember 31 by approximately $380 million and $370 million in 2000 and 1999, respectively. Cost ofrevenues was reduced and income from operations was increased by $3 million in 2000 as a result ofliquidations of LIFO inventories.
15. Income Taxes
Income tax provisions and related assets and liabilities attributed to the U. S. Steel Group aredetermined in accordance with the USX group tax allocation policy (Note 4).
Provisions (credits) for income taxes were:2000 1999 1998__________________________ _________________________ __________________________
(In millions) Current Deferred Total Current Deferred Total Current Deferred Total_______________________________________________________________________________________________Federal $(357) $ 340 $ (17) $ (84) $ 99 $ 15 $ 19 $ 149 $ 168 State and local (12) 49 37 1 8 9 3 9 12 Foreign – – – 1 – 1 (7) – (7)______ ______ ______ ______ ______ ______ ______ ______ _____ Total $(369) $ 389 $ 20 $ (82) $ 107 $ 25 $ 15 $ 158 $ 173 _______________________________________________________________________________________________
A reconciliation of federal statutory tax rate (35%) to total provisions follows:(In millions) 2000 1999 1998_______________________________________________________________________________________________Statutory rate applied to income before income taxes $ – $ 27 $ 188 Excess percentage depletion (3) (7) (11)Effects of foreign operations, including foreign tax credits (5) (2) (11)State and local income taxes after federal income tax effects 24 6 8 Credits other than foreign tax credits (3) (3) (3)Adjustments of prior years’ federal income taxes 5 – – Other 2 4 2 _________ _________ _________
Total provisions $ 20 $ 25 $ 173 _______________________________________________________________________________________________
Deferred tax assets and liabilities resulted from the following:(In millions) December 31 2000 1999_______________________________________________________________________________________________Deferred tax assets:
Minimum tax credit carryforwards $ 39 $ 131 State tax loss carryforwards (expiring in 2001 through 2020) 55 65 Employee benefits 782 998 Receivables, payables and debt 52 68 Expected federal benefit for deducting state deferred income taxes 16 – Contingency and other accruals 71 52 Other 2 11 Valuation allowances – state (34) (41)_________ _________
Total deferred tax assets(a) 983 1,284 _________ _________Deferred tax liabilities:
Property, plant and equipment 248 274 Prepaid pensions 1,046 921 Inventory 15 16 Investments in subsidiaries and equity investees 82 96 Other 61 44 _________ _________
Total deferred tax liabilities 1,452 1,351 _________ _________Net deferred tax liabilities $ 469 $ 67 _______________________________________________________________________________________________
(a) USX expects to generate sufficient future taxable income to realize the benefit of the U. S. Steel Group’sdeferred tax assets.
The consolidated tax returns of USX for the years 1990 through 1997 are under various stages ofaudit and administrative review by the IRS. USX believes it has made adequate provision for incometaxes and interest which may become payable for years not yet settled.
Pretax income in 2000 included $8 million attributable to foreign sources.

S-16
Undistributed earnings of certain consolidated foreign subsidiaries at December 31, 2000,amounted to $18 million. No provision for deferred U.S. income taxes has been made for thesesubsidiaries because the U. S. Steel Group intends to permanently reinvest such earnings in thoseforeign operations. If such earnings were not permanently reinvested, a deferred tax liability of$6 million would have been required.
16. Investments and Long-Term Receivables(In millions) December 31 2000 1999_______________________________________________________________________________________________Equity method investments $ 325 $ 397 Other investments 67 39 Receivables due after one year 5 11 Income taxes receivable 97 97 Deposits of restricted cash 3 2 Other 39 26 _________ _________
Total $ 536 $ 572 _______________________________________________________________________________________________
Summarized financial information of investees accounted for by the equity method of accountingfollows:(In millions) 2000 1999 1998_______________________________________________________________________________________________Income data – year:
Revenues and other income $ 3,484 $ 3,027 $ 3,163 Operating income (loss) 112 (57) 193 Net income (loss) (166) (193) 97 _______________________________________________________________________________________________
Balance sheet data – December 31:Current assets $ 911 $ 995 Noncurrent assets 2,196 2,402 Current liabilities 1,171 1,181 Noncurrent liabilities 1,307 1,251 _______________________________________________________________________________________________
USX acquired a 25% interest in VSZ during 2000. VSZ does not provide its shareholders withfinancial statements prepared in accordance with generally accepted accounting principles in theUnited States (USGAAP). Although shares of VSZ are traded on the Bratislava Stock Exchange, thosesecurities do not have a readily determinable fair value as defined under USGAAP. Accordingly, USXaccounts for its investment in VSZ under the cost method of accounting.
In 1999, USX and Kobe Steel, Ltd. (Kobe Steel) completed a transaction that combined thesteelmaking and bar producing assets of USS/Kobe Steel Company (USS/Kobe) with companiescontrolled by Blackstone Capital Partners II. The combined entity was named Republic TechnologiesInternational, LLC and is a wholly owned subsidiary of Republic Technologies International Holdings,LLC (Republic). As a result of this transaction, the U. S. Steel Group recorded $47 million in chargesrelated to the impairment of the carrying value of its investment in USS/Kobe and costs related to theformation of Republic. These charges were included in income (loss) from investees in 1999. Inaddition, USX made a $15 million equity investment in Republic. USX owned 50% of USS/Kobe andnow owns 16% of Republic. USX accounts for its investment in Republic under the equity method ofaccounting. The seamless pipe business of USS/Kobe was excluded from this transaction. Thatbusiness, now known as Lorain Tubular Company, LLC, became a wholly owned subsidiary of USX atthe close of business on December 31, 1999.
Dividends and partnership distributions received from equity investees were $10 million in 2000,$2 million in 1999 and $19 million in 1998.
U. S. Steel Group purchases of transportation services and semi-finished steel from equity investeestotaled $566 million, $361 million and $331 million in 2000, 1999 and 1998, respectively. At December 31,2000 and 1999, U. S. Steel Group payables to these investees totaled $66 million and $60 million,respectively. U. S. Steel Group revenues for steel and raw material sales to equity investees totaled$958 million, $831 million and $725 million in 2000, 1999 and 1998, respectively. At December 31, 2000and 1999, U. S. Steel Group receivables from these investees were $177 million. Generally, thesetransactions were conducted under long-term, market-based contractual arrangements.

S-17
17. Leases
Future minimum commitments for capital leases (including sale-leasebacks accounted for as financings) andfor operating leases having remaining noncancelable lease terms in excess of one year are as follows:
Capital Operating(In millions) Leases Leases_______________________________________________________________________________________________2001 $ 11 $ 79 2002 11 56 2003 11 40 2004 11 37 2005 11 29 Later years 84 64 Sublease rentals – (62)_________ _________
Total minimum lease payments 139 $ 243 __________________Less imputed interest costs 51 _________
Present value of net minimum lease payments included in long-term debt $ 88 _______________________________________________________________________________________________
Operating lease rental expense:
(In millions) 2000 1999 1998_______________________________________________________________________________________________Minimum rental $ 132 $ 124 $ 131 Contingent rental 17 18 19 Sublease rentals (6) (6) (7)_________ _________ _________
Net rental expense $ 143 $ 136 $ 143 _______________________________________________________________________________________________
The U. S. Steel Group leases a wide variety of facilities and equipment under operating leases,including land and building space, office equipment, production facilities and transportationequipment. Most long-term leases include renewal options and, in certain leases, purchase options.
18. Trust Preferred Securities
In 1997, USX exchanged approximately 3.9 million 6.75% Convertible Quarterly Income PreferredSecurities (Trust Preferred Securities) of USX Capital Trust I, a Delaware statutory business trust(Trust), for an equivalent number of shares of its 6.50% Cumulative Convertible Preferred Stock(6.50% Preferred Stock) (Exchange). The Exchange resulted in the recording of Trust PreferredSecurities at a fair value of $182 million.
USX owns all of the common securities of the Trust, which was formed for the purpose of theExchange. (The Trust Common Securities and the Trust Preferred Securities are together referred toas the Trust Securities.) The Trust Securities represent undivided beneficial ownership interests in theassets of the Trust, which consist solely of USX 6.75% Convertible Junior Subordinated Debenturesmaturing March 31, 2037 (Debentures), having an aggregate principal amount equal to the aggregateinitial liquidation amount ($50.00 per security and $203 million in total) of the Trust Securities issuedby the Trust. Interest and principal payments on the Debentures will be used to make quarterlydistributions and to pay redemption and liquidation amounts on the Trust Preferred Securities. Thequarterly distributions, which accumulate at the rate of 6.75% per annum on the Trust PreferredSecurities and the accretion from fair value to the initial liquidation amount, are charged to incomeand included in net interest and other financial costs.
Under the terms of the Debentures, USX has the right to defer payment of interest for up to 20consecutive quarters and, as a consequence, monthly distributions on the Trust Preferred Securitieswill be deferred during such period. If USX exercises this right, then, subject to limited exceptions, itmay not pay any dividend or make any distribution with respect to any shares of its capital stock.

S-18
The Trust Preferred Securities are convertible at any time prior to the close of business onMarch 31, 2037 (unless such right is terminated earlier under certain circumstances) at the option ofthe holder, into shares of Steel Stock at a conversion price of $46.25 per share of Steel Stock(equivalent to a conversion ratio of 1.081 shares of Steel Stock for each Trust Preferred Security),subject to adjustment in certain circumstances.
The Trust Preferred Securities may be redeemed at any time at the option of USX, at a premiumof 101.95% of the initial liquidation amount through March 31, 2001, and thereafter, decliningannually to the initial liquidation amount on April 1, 2003, and thereafter. They are mandatorilyredeemable at March 31, 2037, or earlier under certain circumstances.
Payments related to quarterly distributions and to the payment of redemption and liquidationamounts on the Trust Preferred Securities by the Trust are guaranteed by USX on a subordinatedbasis. In addition, USX unconditionally guarantees the Trust’s Debentures. The obligations of USXunder the Debentures, and the related indenture, trust agreement and guarantee constitute a full andunconditional guarantee by USX of the Trust’s obligations under the Trust Preferred Securities.
19. Stockholders’ Equity
(In millions, except per share data) 2000 1999 1998_______________________________________________________________________________________________Preferred stock:
Balance at beginning of year $ 3 $ 3 $ 3 Repurchased (1) – – _________ _________ _________Balance at end of year $ 2 $ 3 $ 3 _______________________________________________________________________________________________
Common stockholders’ equity:Balance at beginning of year $ 2,053 $ 2,090 $ 1,779 Net income (loss) (21) 44 364 Repurchase of 6.50% preferred stock (11) (2) (8)Steel Stock issued 6 2 59 Dividends on preferred stock (8) (9) (9)Dividends on Steel Stock (per share $1.00) (89) (88) (88)Deferred compensation (3) 1 – Accumulated other comprehensive income (loss)(a):
Foreign currency translation adjustments (13) (5) (5)Minimum pension liability adjustments (Note 12) 3 20 (2)_________ _________ _________
Balance at end of year $ 1,917 $ 2,053 $ 2,090 _______________________________________________________________________________________________Total stockholders’ equity $ 1,919 $ 2,056 $ 2,093 _______________________________________________________________________________________________(a) See page U-7 of the USX consolidated financial statements relative to the annual activity of these adjustments.
Total comprehensive income (loss) for the U. S. Steel Group for the years 2000, 1999 and 1998 was $(31) million,$59 million and $357 million, respectively.
20. Dividends
In accordance with the USX Restated Certificate of Incorporation, dividends on the Steel Stock andMarathon Stock are limited to the legally available funds of USX. Net losses of either Group, as well asdividends and distributions on any class of USX Common Stock or series of preferred stock andrepurchases of any class of USX Common Stock or series of preferred stock at prices in excess of par orstated value, will reduce the funds of USX legally available for payment of dividends on both classes ofCommon Stock. Subject to this limitation, the Board of Directors intends to declare and pay dividendson the Steel Stock based on the financial condition and results of operations of the U. S. Steel Group,although it has no obligation under Delaware law to do so. In making its dividend decisions withrespect to Steel Stock, the Board of Directors considers, among other things, the long-term earningsand cash flow capabilities of the U. S. Steel Group as well as the dividend policies of similar publiclytraded steel companies.
Dividends on the Steel Stock are further limited to the Available Steel Dividend Amount. AtDecember 31, 2000, the Available Steel Dividend Amount was at least $3,161 million. The AvailableSteel Dividend Amount will be increased or decreased, as appropriate, to reflect U. S. Steel Group netincome, dividends, repurchases or issuances with respect to the Steel Stock and preferred stockattributed to the U. S. Steel Group and certain other items.

S-19
21. Income Per Common Share
The method of calculating net income (loss) per share for the Steel Stock and the Marathon Stockreflects the USX Board of Directors’ intent that the separately reported earnings and surplus of theU. S. Steel Group and the Marathon Group, as determined consistent with the USX RestatedCertificate of Incorporation, are available for payment of dividends to the respective classes of stock,although legally available funds and liquidation preferences of these classes of stock do not necessarilycorrespond with these amounts.
Basic net income (loss) per share is calculated by adjusting net income for dividend requirementsof preferred stock and is based on the weighted average number of common shares outstanding.
Diluted net income (loss) per share assumes conversion of convertible securities for the applicableperiods outstanding and assumes exercise of stock options, provided in each case, the effect is notantidilutive.
2000 1999 1998___________________ __________________ __________________Basic Diluted Basic Diluted Basic Diluted______ ________ ______ _______ ______ _______
Computation of Income Per ShareNet income (loss) (millions):
Income (loss) before extraordinary losses $ (21) $ (21) $ 51 $ 51 $ 364 $ 364 Dividends on preferred stock 8 8 9 9 9 – Extraordinary losses – – 7 7 – – _________ _________ _________ _________ _________ _________Net income (loss) applicable to Steel Stock (29) (29) 35 35 355 364 Effect of dilutive securities –
Trust preferred securities – – – – – 8 _________ _________ _________ _________ _________ _________Net income (loss) assuming conversions $ (29) $ (29) $ 35 $ 35 $ 355 $ 372 _________ _________ _________ _________ _________ __________________ _________ _________ _________ _________ _________
Shares of common stock outstanding (thousands):Average number of common shares outstanding 88,613 88,613 88,392 88,392 87,508 87,508 Effect of dilutive securities:
Trust preferred securities – – – – – 4,256 Preferred stock – – – – – 3,143 Stock options – – – 4 – 36 _________ _________ _________ _________ _________ _________
Average common shares and dilutive effect 88,613 88,613 88,392 88,396 87,508 94,943 _________ _________ _________ _________ _________ __________________ _________ _________ _________ _________ _________Per share:
Income (loss) before extraordinary losses $ (.33) $ (.33) $ .48 $ .48 $ 4.05 $ 3.92 Extraordinary losses – – .08 .08 – – _________ _________ _________ _________ _________ _________Net income (loss) $ (.33) $ (.33) $ .40 $ .40 $ 4.05 $ 3.92 _________ _________ _________ _________ _________ __________________ _________ _________ _________ _________ _________
22. Stock-Based Compensation Plans and Stockholder Rights Plan
USX Stock-Based Compensation Plans and Stockholder Rights Plan are discussed in Note 17, andNote 19, respectively, to the USX consolidated financial statements.
The U. S. Steel Group’s actual stock-based compensation expense was $1 million in 2000 and1999, and none in 1998. Incremental compensation expense, as determined under a fair value model,was not material ($.02 or less per share for all years presented). Therefore, pro forma net income andearnings per share data have been omitted.
23. Property, Plant and Equipment(In millions) December 31 2000 1999_______________________________________________________________________________________________Land and depletable property $ 161 $ 152 Buildings 602 484 Machinery and equipment 8,409 8,007 Leased assets 98 105 _________ _________
Total 9,270 8,748 Less accumulated depreciation, depletion and amortization 6,531 6,232 _________ _________
Net $ 2,739 $ 2,516 _______________________________________________________________________________________________
Amounts in accumulated depreciation, depletion and amortization for assets acquired undercapital leases (including sale-leasebacks accounted for as financings) were $79 million and $81 millionat December 31, 2000 and 1999, respectively.
During 2000, the U. S. Steel Group recorded $71 million of impairments relating to coal assetslocated in West Virginia and Alabama. The impairment was recorded as a result of a reassessment oflong-term prospects after adverse geological conditions were encountered. The charge is included indepreciation, depletion and amortization.

S-20
24. Derivative Instruments
The U. S. Steel Group remains at risk for possible changes in the market value of derivativeinstruments; however, such risk should be mitigated by price changes in the underlying hedged item.The U. S. Steel Group is also exposed to credit risk in the event of nonperformance by counterparties.The credit-worthiness of counterparties is subject to continuing review, including the use of masternetting agreements to the extent practical, and full performance is anticipated.
The following table sets forth quantitative information by class of derivative instrument:Fair Carrying Recorded
Value Amount Deferred AggregateAssets Assets Gain or Contract
(In millions) (Liabilities)(a) (Liabilities) (Loss) Values(b)_______________________________________________________________________________________________December 31, 2000:
OTC commodity swaps – other than trading(c) $ – $ – $ – $ 18 _______________________________________________________________________________________________December 31, 1999:
OTC commodity swaps – other than trading $ 3 $ 3 $ 3 $ 37 _______________________________________________________________________________________________(a) The fair value amounts are based on exchange-traded index prices and dealer quotes.(b) Contract or notional amounts do not quantify risk exposure, but are used in the calculation of cash settlements
under the contracts.(c) The OTC swap arrangements vary in duration with certain contracts extending into 2001.
25. Fair Value of Financial Instruments
Fair value of the financial instruments disclosed herein is not necessarily representative of the amountthat could be realized or settled, nor does the fair value amount consider the tax consequences ofrealization or settlement. The following table summarizes financial instruments, excluding derivativefinancial instruments disclosed in Note 24, by individual balance sheet account. As described in Note 4,the U. S. Steel Group’s specifically attributed financial instruments and the U. S. Steel Group’s portionof USX’s financial instruments attributed to all groups are as follows:
2000 1999 Fair Carrying Fair Carrying
(In millions) December 31 Value Amount Value Amount_______________________________________________________________________________________________Financial assets:
Cash and cash equivalents $ 219 $ 219 $ 22 $ 22 Receivables (including intergroup receivables) 1,341 1,341 935 935 Investments and long-term receivables 137 137 122 122 ________ ________ ________ ________
Total financial assets $ 1,697 $ 1,697 $ 1,079 $ 1,079 _______________________________________________________________________________________________Financial liabilities:
Notes payable $ 70 $ 70 $ – $ – Accounts payable 760 760 739 739 Accrued interest 47 47 15 15 Long-term debt (including amounts due within one year) 2,375 2,287 835 823 Preferred stock of subsidiary and trust
preferred securities 182 249 232 249 ________ ________ ________ ________Total financial liabilities $ 3,434 $ 3,413 $ 1,821 $ 1,826 _______________________________________________________________________________________________
Fair value of financial instruments classified as current assets or liabilities approximates carryingvalue due to the short-term maturity of the instruments. Fair value of investments and long-termreceivables was based on discounted cash flows or other specific instrument analysis. Certain foreigncost method investments are excluded from investments and long-term receivables because the fairvalue is not readily determinable. The U. S. Steel Group is subject to market risk and liquidity riskrelated to its investments; however, these risks are not readily quantifiable. Fair value of preferredstock of subsidiary and trust preferred securities was based on market prices. Fair value of long-termdebt instruments was based on market prices where available or current borrowing rates available forfinancings with similar terms and maturities.
Financial guarantees are the U. S. Steel Group’s only unrecognized financial instrument. It is notpracticable to estimate the fair value of this form of financial instrument obligation because there areno quoted market prices for transactions which are similar in nature. For details relating to financialguarantees, see Note 26.

S-21
26. Contingencies and Commitments
USX is the subject of, or party to, a number of pending or threatened legal actions, contingencies andcommitments relating to the U. S. Steel Group involving a variety of matters, including laws andregulations relating to the environment. Certain of these matters are discussed below. The ultimateresolution of these contingencies could, individually or in the aggregate, be material to the U. S. SteelGroup financial statements. However, management believes that USX will remain a viable andcompetitive enterprise even though it is possible that these contingencies could be resolvedunfavorably to the U. S. Steel Group.
Environmental matters –The U. S. Steel Group is subject to federal, state, local and foreign laws and regulations relating to
the environment. These laws generally provide for control of pollutants released into the environmentand require responsible parties to undertake remediation of hazardous waste disposal sites. Penaltiesmay be imposed for noncompliance. Accrued liabilities for remediation totaled $137 million and$101 million at December 31, 2000 and 1999, respectively. It is not presently possible to estimate theultimate amount of all remediation costs that might be incurred or the penalties that may be imposed.
For a number of years, the U. S. Steel Group has made substantial capital expenditures to bringexisting facilities into compliance with various laws relating to the environment. In 2000 and 1999,such capital expenditures totaled $18 million and $32 million, respectively. The U. S. Steel Groupanticipates making additional such expenditures in the future; however, the exact amounts and timingof such expenditures are uncertain because of the continuing evolution of specific regulatoryrequirements.
Guarantees –Guarantees by USX of the liabilities of unconsolidated entities of the U. S. Steel Group totaled
$82 million at December 31, 2000, and $88 million at December 31, 1999. In the event that anydefaults of guaranteed liabilities occur, USX has access to its interest in the assets of the investees toreduce potential U. S. Steel Group losses resulting from these guarantees. As of December 31, 2000,the largest guarantee for a single such entity was $59 million.
Commitments –At December 31, 2000 and 1999, the U. S. Steel Group’s contract commitments to acquire
property, plant and equipment totaled $206 million and $83 million, respectively.USSK has a commitment to the Slovak government for a capital improvements program of
$700 million, subject to certain conditions, over a period commencing with the acquisition date andending on December 31, 2010. USSK is required to report periodically to the Slovak government on itsstatus toward meeting this commitment. The first reporting period ends on December 31, 2003.
USX entered into a 15-year take-or-pay arrangement in 1993, which requires the U. S. SteelGroup to accept pulverized coal each month or pay a minimum monthly charge of approximately$1 million. Charges for deliveries of pulverized coal totaled $23 million in 2000, 1999 and 1998. If USXelects to terminate the contract early, a maximum termination payment of $96 million, which declinesover the duration of the agreement, may be required.

S-22
Selected Quarterly Financial Data (Unaudited)
2000 1999__________________________________________ ____________________________________________(In millions, except per share data) 4th Qtr. 3rd Qtr. 2nd Qtr. 1st Qtr. 4th Qtr. 3rd Qtr. 2nd Qtr. 1st Qtr.___________________________________________________________________________________________________________________Revenues and other income:
Revenues(a) $ 1,417 $ 1,462 $ 1,629 $ 1,582 $ 1,492 $ 1,415 $ 1,344 $ 1,285 Other income (loss) (4) 13 27 6 8 (40) 1 (35)_______ _______ _______ _______ _______ _______ _______ _______ Total 1,413 1,475 1,656 1,588 1,500 1,375 1,345 1,250
Income (loss)from operations (159) 60 112 91 75 (26) 103 (2)
Income (loss) beforeextraordinary losses (139) 19 56 43 34 (29) 55 (9)
Net income (loss) (139) 19 56 43 34 (31) 55 (14)____________________________________________________________________________________________________________________Steel Stock data:Income (loss) before
extraordinary lossesapplicable to Steel Stock $ (141) $ 17 $ 54 $ 41 $ 32 $ (31) $ 52 $ (11)– Per share: basic (1.59) .19 .62 .45 .35 (.35) .60 (.13)
diluted (1.59) .19 .62 .45 .35 (.35) .59 (.13)Dividends paid per share .25 .25 .25 .25 .25 .25 .25 .25 Price range of Steel Stock(b):
– Low 12-11/16 14-7/8 18-1/4 20-5/8 21-3/4 24-9/16 23-1/2 22-1/4– High 18-5/16 19-11/16 26-7/8 32-15/16 33 30-1/16 34-1/4 29-1/8____________________________________________________________________________________________________________________
(a) Certain items have been reclassified between revenues and cost of revenues, primarily to give effect to new accounting standards asdisclosed in Note 3 of the Notes to Financial Statements. Amounts reclassified in the first, second and third quarters of 2000 were$41 million, $45 million and $45 million, respectively, and for the first, second, third and fourth quarters of 1999 were $39 million,$41 million, $38 million and $38 million, respectively.
(b) Composite tape.
Principal Unconsolidated Investees (Unaudited)December 31, 2000
Company Country Ownership Activity___________________________________________________________________________________________________________________Clairton 1314B Partnership, L.P. United States 10% Coke & Coke By-ProductsDouble Eagle Steel Coating Company United States 50% Steel ProcessingPRO-TEC Coating Company United States 50% Steel ProcessingRepublic Technologies International, LLC United States 16% Steel ProductsTranstar, Inc. United States 46% TransportationUSS-POSCO Industries United States 50% Steel ProcessingWorthington Specialty Processing United States 50% Steel Processing___________________________________________________________________________________________________________________
Supplementary Information on Mineral Reserves (Unaudited)See the USX consolidated financial statements for Supplementary Information on Mineral Reserves relating to the U. S. SteelGroup, page U-30.
U. S. Steel Group

S-23
Five-Year Operating Summary
(Thousands of net tons, unless otherwise noted) 2000 1999 1998 1997 1996_______________________________________________________________________________________________Raw Steel Production
Gary, IN 6,610 7,102 6,468 7,428 6,840Mon Valley, PA 2,683 2,821 2,594 2,561 2,746Fairfield, AL 2,069 2,109 2,152 2,361 1,862Kosice, Slovak Republic 382 – – – – ____________________________________________
Total 11,744 12,032 11,214 12,350 11,448_______________________________________________________________________________________________Raw Steel Capability
Domestic Steel 12,800 12,800 12,800 12,800 12,800U. S. Steel Kosice(a) 467 – – – – ____________________________________________
Total 13,267 12,800 12,800 12,800 12,800Total production as % of total capability 88.5 94.0 87.6 96.5 89.4_______________________________________________________________________________________________
Hot Metal ProductionDomestic Steel 9,904 10,344 9,743 10,591 9,716U. S. Steel Kosice 340 – – – – ____________________________________________
Total 10,244 10,344 9,743 10,591 9,716_______________________________________________________________________________________________Coke Production
Domestic Steel(b) 5,003 4,619 4,835 5,757 6,777U. S. Steel Kosice 188 – – – – ____________________________________________
Total 5,191 4,619 4,835 5,757 6,777_______________________________________________________________________________________________Iron Ore Pellets – Minntac, MN
Shipments 15,020 15,025 15,446 16,403 14,962_______________________________________________________________________________________________Coal Production 6,195 6,632 8,150 7,528 7,283_______________________________________________________________________________________________Coal Shipments 6,779 6,924 7,670 7,811 7,117_______________________________________________________________________________________________Steel Shipments by Product – Domestic Steel
Sheet and semi-finished steel products 7,409 8,114 7,608 8,170 8,677Tubular, plate and tin mill products 3,347 2,515 3,078 3,473 2,695____________________________________________
Total 10,756 10,629 10,686 11,643 11,372Total as % of domestic steel industry 9.8 10.0 10.5 10.9 11.3_______________________________________________________________________________________________
Steel Shipments by Product – U. S. Steel KosiceSheet and semi-finished steel products 207 – – – – Tubular, plate and tin mill products 110 – – – – ____________________________________________
Total 317 – – – – _______________________________________________________________________________________________Steel Shipments by Market – Domestic Steel
Steel service centers 2,315 2,456 2,563 2,746 2,831Transportation 1,466 1,505 1,785 1,758 1,721Further conversion:
Joint ventures 1,771 1,818 1,473 1,568 1,542Trade customers 1,174 1,633 1,140 1,378 1,227
Containers 702 738 794 856 874Construction 936 844 987 994 865Oil, gas and petrochemicals 973 363 509 810 746Export 544 321 382 453 493All other 875 951 1,053 1,080 1,073____________________________________________
Total 10,756 10,629 10,686 11,643 11,372_______________________________________________________________________________________________Average Steel Price Per Ton
Domestic Steel $450 $420 $469 $479 $467U. S. Steel Kosice 269 – – – – _______________________________________________________________________________________________
(a) Represents the operations of U. S. Steel Kosice s.r.o., following the acquisition of the steelmaking operationsand related assets of VSZ a.s. on November 24, 2000.
(b) The reduction in coke production after 1996 reflected U. S. Steel’s entry into a strategic partnership with twolimited partners on June 1, 1997, to acquire an interest in three coke batteries at its Clairton (Pa.) Works.
U. S. Steel Group

S-24
Five-Year Financial Summary(Dollars in millions, except as noted) 2000 1999 1998 1997 1996_______________________________________________________________________________________________Revenues and Other Income
Revenues by product:Sheet and semi-finished steel products $ 3,288 $ 3,433 $ 3,598 $ 3,923 $ 3,774 Tubular, plate and tin mill products 1,731 1,140 1,546 1,793 1,671 Raw materials (coal, coke and iron ore) 626 549 744 796 824 Other(a) 445 414 490 517 466
Income (loss) from investees (8) (89) 46 69 66 Net gains on disposal of assets 46 21 54 57 16 Other income (loss) 4 2 (1) 1 55 ___________________________________________________
Total revenues and other income(b) $ 6,132 $ 5,470 $ 6,477 $ 7,156 $ 6,872 _______________________________________________________________________________________________Income From Operations
Segment income:Domestic Steel(b) $ 23 $ 91 $ 517 $ 787 $ 420 U. S. Steel Kosice 2 – – – –
Items not allocated to segments:Net pension credits(b) 266 228 186 144 158 Costs of former businesses (91) (83) (100) (125) (120)Administrative expenses (25) (17) (24) (33) (28)Other(c) (71) (69) – – 53 ___________________________________________________ Total income from operations 104 150 579 773 483
Net interest and other financial costs 105 74 42 87 116 Provision for income taxes 20 25 173 234 92 _______________________________________________________________________________________________
Income (Loss) Before Extraordinary Losses $ (21) $ 51 $ 364 $ 452 $ 275
Per common share – basic (in dollars) (.33) .48 4.05 5.24 3.00 – diluted (in dollars) (.33) .48 3.92 4.88 2.97
Net Income (Loss) $ (21) $ 44 $ 364 $ 452 $ 273 Per common share – basic (in dollars) (.33) .40 4.05 5.24 2.98
– diluted (in dollars) (.33) .40 3.92 4.88 2.95 _______________________________________________________________________________________________Balance Sheet Position at year-end
Current assets $ 2,717 $ 1,981 $ 1,275 $ 1,531 $ 1,428 Net property, plant and equipment 2,739 2,516 2,500 2,496 2,551 Total assets 8,711 7,525 6,749 6,694 6,580 Short-term debt 209 13 25 67 91 Other current liabilities 1,182 1,271 991 1,267 1,208 Long-term debt 2,236 902 464 456 1,014 Employee benefits 1,767 2,245 2,315 2,338 2,430 Trust preferred securities and
preferred stock of subsidiary 249 249 248 248 64 Common stockholders’ equity 1,917 2,053 2,090 1,779 1,559
Per share (in dollars) 21.58 23.23 23.66 20.56 18.37 _______________________________________________________________________________________________Cash Flow Data
Net cash from operating activities $ (627) $ (80) $ 380 $ 476 $ 92 Capital expenditures 244 287 310 261 337 Disposal of assets 21 10 21 420 161 Dividends paid 97 97 96 96 104 _______________________________________________________________________________________________
Employee DataTotal employment costs $ 1,197 (d) $ 1,148 $ 1,305 $ 1,417 $ 1,372 Average domestic employment cost
(dollars per hour) 28.70 28.35 30.42 31.56 30.35 Average number of domestic employees 19,353 19,266 20,267 20,683 20,831 Number of U. S. Steel Kosice s.r.o.
employees at year-end 16,244 – – – – Number of pensioners at year-end 94,339 97,102 (e) 92,051 93,952 96,510 _______________________________________________________________________________________________
Stockholder Data at year-endNumber of common shares
outstanding (in millions) 88.8 88.4 88.3 86.6 84.9 Registered shareholders (in thousands) 50.3 55.6 60.2 65.1 71.0 Market price of common stock $18.000 $33.000 $23.000 $31.250 $31.375 _______________________________________________________________________________________________
(a) Includes revenue from the sale of steel production by-products, engineering and consulting services, real estatedevelopment and resource management.
(b) 1996–1999 reclassified to conform to 2000 classifications.(c) Includes impairment of coal assets in 2000, losses related to investments in equity investees in 1999 and gain
on investee stock offering in 1996.(d) Includes U. S. Steel Kosice s.r.o. from date of acquisition.(e) Includes approximately 8,000 surviving spouse beneficiaries added to the U. S. Steel pension plan in 1999.
U. S. Steel Group

S-25
Management’s Discussion and Analysis
The U. S. Steel Group is engaged in the production and sale of steel mill products, coke, and
taconite pellets; the management of mineral resources; coal mining; real estate development; and
engineering and consulting services. Certain business activities are conducted through joint ventures
and partially owned companies, such as USS-POSCO Industries (“USS-POSCO”), PRO-TEC Coating
Company (“PRO-TEC”), Transtar, Inc. (“Transtar”), Clairton 1314B Partnership, and Republic
Technologies International, LLC (“Republic”). On November 24, 2000, USX acquired U. S. Steel Kosice
s.r.o. (“USSK”), which held the steel and related assets of VSZ a.s. (“VSZ”), headquartered in the
Slovak Republic. Management’s Discussion and Analysis should be read in conjunction with the U. S.
Steel Group’s Financial Statements and Notes to Financial Statements.
Certain sections of Management’s Discussion and Analysis include forward-looking statements
concerning trends or events potentially affecting the businesses of the U. S. Steel Group. These
statements typically contain words such as “anticipates,” “believes,” “estimates,” “expects” or similar
words indicating that future outcomes are not known with certainty and subject to risk factors that
could cause these outcomes to differ significantly from those projected. In accordance with “safe
harbor” provisions of the Private Securities Litigation Reform Act of 1995, these statements are
accompanied by cautionary language identifying important factors, though not necessarily all such
factors, that could cause future outcomes to differ materially from those set forth in forward-looking
statements. For additional risk factors affecting the businesses of the U. S. Steel Group, see
Supplementary Data – Disclosures About Forward-Looking Information in USX Form 10-K.
Management’s Discussion and Analysis of Income
Revenues and Other Income for each of the last three years are summarized in the following
table:
(Dollars in millions) 2000 1999 1998_______________________________________________________________________________________________Revenues by product:
Sheet and semi-finished steel products $ 3,288 $ 3,433 $ 3,598 Tubular, plate, and tin mill products 1,731 1,140 1,546 Raw materials (coal, coke and iron ore) 626 549 744 Other(a) 445 414 490
Income (loss) from investees (8) (89) 46 Net gains on disposal of assets 46 21 54 Other income (loss) 4 2 (1)________ ________ ________
Total revenues and other income $ 6,132 $ 5,470 $ 6,477 _______________________________________________________________________________________________(a) Includes revenue from the sale of steel production by-products, real estate development, resource management,
and engineering and consulting services.
Total revenues and other income increased by $662 million in 2000 from 1999 primarily due to the
consolidation of Lorain Tubular Company, LLC, (“Lorain Tubular”) effective January 1, 2000, higher
average realized prices, particularly tubular product prices, and lower losses from investees, which, in
1999, included a $47 million charge for the impairment of U. S. Steel’s investment in USS/Kobe Steel
Company. Total revenues and other income in 1999 decreased by $1,007 million from 1998 primarily
due to lower average realized prices and lower income from investees.
U. S. Steel Group

Management’s Discussion and Analysis C O N T I N U E D
S-26
Income from operations for the U. S. Steel Group for the last three years was:
(Dollars in millions) 2000 1999 1998_______________________________________________________________________________________________Segment income for Domestic Steel(a) $ 23 $ 91 $ 517 Segment income for U. S. Steel Kosice(b) 2 – – ________ ________ ________
Income for reportable segments $ 25 $ 91 $ 517 Items not allocated to segments:
Net pension credits 266 228 186 Administrative expenses (25) (17) (24)Costs related to former business activities(c) (91) (83) (100)Asset impairments – Coal (71) – – Impairment of USX’s investment in USS/Kobe and costs
related to formation of Republic – (47) – Loss on investment in RTI stock used to satisfy indexed
debt obligations(d) – (22) – ________ ________ ________Total income from operations $ 104 $ 150 $ 579 _______________________________________________________________________________________________
(a) Includes income from the sale and domestic production of steel mill products, coke and taconite pellets; themanagement of mineral resources; coal mining; real estate development and management; and engineering andconsulting services.
(b) Includes the sale and production of steel products from facilities primarily located in the Slovak Republiccommencing November 24, 2000. For further details, see Note 5 to the U. S. Steel Group Financial Statements.
(c) Includes the portion of postretirement benefit costs and certain other expenses principally attributable toformer business units of the U. S. Steel Group.
(d) For further details, see Note 6 to the U. S. Steel Group Financial Statements.
Segment income for Domestic Steel
Domestic Steel operations recorded segment income of $23 million in 2000 versus segment income
of $91 million in 1999, a decrease of $68 million. The 2000 segment income included $36 million for
certain environmental and legal accruals, a $34 million charge to establish reserves against notes and
receivables from financially distressed steel companies and a $10 million charge for USX’s share of
Republic special charges. Results in 1999 included $17 million in charges for certain environmental
and legal accruals and $7 million in various non-recurring investee charges. Excluding these items, the
decrease in segment income for Domestic Steel was primarily due to higher costs related to energy and
inefficient operating levels due to lower throughput, lower income from raw materials operations,
particularly coal operations and lower sheet shipments resulting from high levels of imports that
continued in 2000.
Segment income for Domestic Steel operations in 1999 decreased $426 million from 1998. Results
in 1998 included a net favorable $30 million for an insurance litigation settlement and charges of
$10 million related to a voluntary workforce reduction plan. Excluding these items, the decrease in
segment income for Domestic Steel was primarily due to lower average steel prices, lower income from
raw materials operations, a less favorable product mix and lower income from investees.
Segment income for U. S. Steel Kosice
USSK segment income for the period following the November 24, 2000 acquisition was $2 million.
Items not allocated to segments: Net pension credits, which are primarily noncash, totaled
$266 million in 2000, $228 million in 1999 and $186 million in 1998. Net pension credits in 1999
included $35 million for a one-time favorable pension settlement primarily related to the voluntary
early retirement program for salaried employees. For additional information on pensions, see Note 12
to the U. S. Steel Group Financial Statements.
U. S. Steel Group

Management’s Discussion and Analysis C O N T I N U E D
S-27
Asset impairments – Coal, were for asset impairments at U. S. Steel Mining’s coal mines in
Alabama and West Virginia in 2000 following a reassessment of long-term prospects after adverse
geological conditions were encountered.
In 1999, an impairment of USX’s investment in USS/Kobe and costs related to theformation of Republic totaled $47 million.
Income from operations in 1999 also included a loss on investment in RTI stock used tosatisfy indexed debt obligations of $22 million from the termination of ownership in RTI
International Metals, Inc. For further discussion, see Note 6 to the U. S. Steel Group Financial
Statements.
Net interest and other financial costs for each of the last three years are summarized in the
following table:
(Dollars in millions) 2000 1999 1998_______________________________________________________________________________________________Net interest and other financial costs $ 105 $ 74 $ 42 Less:
Favorable adjustment tocarrying value of Indexed Debt(a) – 13 44 ________ ________ ________
Net interest and other financial costsadjusted to exclude above item $ 105 $ 87 $ 86 _______________________________________________________________________________________________
(a) In December 1996, USX issued $117 million of 6-3/4% Exchangeable Notes Due February 1, 2000 (“IndexedDebt”) indexed to the price of RTI common stock. The carrying value of Indexed Debt was adjusted quarterly tosettlement value, based on changes in the value of RTI common stock. Any resulting adjustment was credited toincome and included in interest and other financial costs. For further discussion of Indexed Debt, see Note 6 tothe U. S. Steel Group Financial Statements.
Adjusted net interest and other financial costs increased $18 million in 2000 as compared with
1999, primarily due to higher average debt levels. Adjusted net interest and other financial costs were
$87 million in 1999 as compared with $86 million in 1998.
The provision for income taxes in 2000 decreased compared to 1999 primarily due to a decline
in income from operations, offset by higher state income taxes as certain previously recorded state tax
benefits will not be utilized. The provision for income taxes in 1999 decreased compared to 1998 due to
a decline in income from operations. For further discussion on income taxes, see Note 15 to the U. S.
Steel Group Financial Statements.
The extraordinary loss on extinguishment of debt of $7 million, net of income tax benefit, in
1999 included a $5 million loss resulting from the satisfaction of the indexed debt and a $2 million loss
for U. S. Steel’s share of Republic’s extraordinary loss related to the early extinguishment of debt. For
additional information, see Note 6 to the U. S. Steel Group Financial Statements.
The U. S. Steel Group recorded a 2000 net loss of $21 million, compared with net income of
$44 million in 1999 and $364 million in 1998. Net income decreased $65 million in 2000 from 1999,
and decreased $320 million in 1999 from 1998. The decreases in net income primarily reflect the
factors discussed above.
U. S. Steel Group

Management’s Discussion and Analysis C O N T I N U E D
S-28
Management’s Discussion and Analysis of Financial Condition, Cash Flows and Liquidity
Current assets at year-end 2000 increased $736 million from year-end 1999 primarily due to an
increase in cash and cash equivalents, a larger inter-group income tax receivable, and increased trade
receivables and inventories resulting from the acquisition of USSK.
Net property, plant and equipment at year-end 2000 increased $223 million from year-end
1999 primarily due to the acquisition of USSK.
Current liabilities in 2000 increased $107 million from 1999 primarily due to increased notes
payable and increased debt due within one year, partially offset by a decrease in payroll and benefits
payable.
Total long-term debt and notes payable at December 31, 2000 of $2,445 million was
$1,530 million higher than year-end 1999. USX debt attributed to the U. S. Steel Group increased
partially due to a $500 million elective contribution to a Voluntary Employee Benefit Association
(“VEBA”), a trust established by contract in 1994 covering United Steelworkers of America retirees’
health care and life insurance benefits, and the acquisition of USSK. Excluding the impact of these
items, the increase in debt was primarily due to lower cash flow provided from operating activities
partially offset by reduced capital expenditures. For further discussion of the VEBA contribution, see
Note 12 to the U. S. Steel Group Financial Statements. Most of the debt is a direct obligation of, or is
guaranteed by, USX.
Employee benefits at December 31, 2000 decreased $478 million primarily due to the
$500 million elective contribution to a VEBA.
Net cash used in operating activities in 2000 was $627 million and reflected the $500 million
elective contribution to a VEBA and a $30 million elective contribution to a non-union retiree life
insurance trust, partially offset by an income tax settlement with the Marathon Group in accordance
with the group tax allocation policy. Net cash used in operating activities was $80 million in 1999
including a net payment of $320 million upon the expiration of the accounts receivable program.
Excluding these non-recurring items in both years, net cash provided from operating activities
decreased $434 million in 2000 due mainly to decreased profitability and an increase in working
capital.
Net cash provided from operating activities was $380 million in 1998 and included proceeds of $38
million for the insurance litigation settlement pertaining to the 1995 Gary Works No. 8 blast furnace
explosion and the payment of $30 million for the repurchase of sold accounts receivable, partially offset
by an income tax settlement with the Marathon Group in accordance with the group tax allocation
policy. Excluding these non-recurring items in both years, net cash provided from operating activities
decreased $110 million in 1999 due mainly to decreased profitability.
Capital expenditures in 2000 included exercising an early buyout option of a lease for
approximately half of the Gary Works No. 2 Slab Caster; the continued replacement of coke battery
thruwalls at Gary Works; installation of the remaining two coilers at Gary’s hot strip mill; a blast
furnace stove replacement at Gary Works; and the continuation of an upgrade to the Mon Valley cold
reduction mill. Capital expenditures in 1999 included the completion of the new 64” pickle line at Mon
Valley Works; the replacement of one coiler at the Gary hot strip mill; an upgrade to the Mon Valley
U. S. Steel Group

Management’s Discussion and Analysis C O N T I N U E D
S-29
cold reduction mill; replacement of coke battery thruwalls at Gary Works; several projects at Gary
Works allowing for production of specialized high strength steels, primarily for the automotive market;
and completion of the conversion of the Fairfield pipemill to use rounds instead of square blooms.
Contract commitments for capital expenditures at year-end 2000 were $206 million, compared with
$83 million at year-end 1999.
Capital expenditures for 2001 are expected to be approximately $425 million including exercising
an early buyout option of a lease for the balance of the Gary Works No. 2 Slab Caster; work on the
No. 3 blast furnace at Mon Valley Works; work on the No. 2 stove at the No. 6 blast furnace at Gary
Works; the completion of the replacement of coke battery thruwalls at Gary Works; the completion of
an upgrade to the Mon Valley cold reduction mill; mobile equipment purchases; systems development
project; and projects at USSK, including the completion of the tin mill upgrade.
The preceding statement concerning expected 2001 capital expenditures is a forward-looking
statement. This forward-looking statement is based on assumptions, which can be affected by (among
other things) levels of cash flow from operations, general economic conditions, whether or not assets
are purchased or financed by operating leases, unforeseen hazards such as weather conditions,
explosions or fires, which could delay the timing of completion of particular capital projects.
Accordingly, actual results may differ materially from current expectations in the forward-looking
statement.
Investments in investees in 2000 of $35 million largely reflected an investment in stock of VSZ
in which USX now holds a 25 percent interest. Investments in investees in 1999 of $15 million was an
investment in Republic. Investments in investees in 1998 of $73 million mainly reflects funding for
entry into a joint venture in the Slovak Republic with VSZ.
The acquisition of U. S. Steel Kosice s.r.o. totaled $10 million in 2000 which reflected a
$69 million purchase price net of cash acquired in the transaction of $59 million.
Net cash changes related to financial obligations increased by $1,202 million, $486 million
and $9 million in 2000, 1999 and 1998, respectively. Financial obligations consist of the U. S. Steel
Group’s portion of USX debt and preferred stock of a subsidiary attributed to both groups as well as
debt and financing agreements specifically attributed to the U. S. Steel Group. The increase in 2000
primarily reflected the net effects of cash used in operating activities, including a VEBA contribution,
cash used in investing activities, dividend payments and preferred stock repurchases. The increase in
1999 primarily reflected the net effects of cash used in operating and investing activities and dividend
payments. For a discussion of USX financing activities attributed to both groups, see Management’s
Discussion and Analysis of USX Consolidated Financial Condition, Cash Flows and Liquidity.
Derivative Instruments
See Quantitative and Qualitative Disclosures About Market Risk for discussion of derivative
instruments and associated market risk for U. S. Steel Group.
Liquidity
For discussion of USX’s liquidity and capital resources, see Management’s Discussion and
Analysis of USX Consolidated Financial Condition, Cash Flows and Liquidity.
U. S. Steel Group

Management’s Discussion and Analysis C O N T I N U E D
S-30
Management’s Discussion and Analysis of Environmental Matters, Litigation and Contingencies
The U. S. Steel Group has incurred and will continue to incur substantial capital, operating and
maintenance, and remediation expenditures as a result of environmental laws and regulations. In
recent years, these expenditures have been mainly for process changes in order to meet Clean Air Act
obligations, although ongoing compliance costs have also been significant. To the extent these
expenditures, as with all costs, are not ultimately reflected in the prices of the U. S. Steel Group’s
products and services, operating results will be adversely affected. The U. S. Steel Group believes that
all of its domestic competitors are subject to similar environmental laws and regulations. However, the
specific impact on each competitor may vary depending on a number of factors, including the age and
location of its operating facilities, marketing areas, production processes and the specific products and
services it provides. To the extent that competitors are not required to undertake equivalent costs in
their operations, the competitive position of the U. S. Steel Group could be adversely affected.
In addition, the U. S. Steel Group expects to incur capital expenditures to meet environmental
standards under the Slovak Republic’s environmental laws for its USSK operation.
The U. S. Steel Group’s environmental expenditures for the last three years were(a):
(Dollars in millions) 2000 1999 1998_______________________________________________________________________________________________Capital $ 18 $ 32 $ 49 Compliance
Operating & maintenance 194 199 198 Remediation(b) 18 22 19 ________ ________ ________
Total U. S. Steel Group $ 230 $ 253 $ 266 _______________________________________________________________________________________________(a) Based on previously established U. S. Department of Commerce survey guidelines.(b) These amounts include spending charged against remediation reserves, net of recoveries where permissible, but
do not include noncash provisions recorded for environmental remediation.
The U. S. Steel Group’s environmental capital expenditures accounted for 7%, 11% and 16% of
total capital expenditures in 2000, 1999 and 1998, respectively.
Compliance expenditures represented 4% of the U. S. Steel Group’s total costs and expenses in
2000, 1999 and 1998. Remediation spending during 1998 to 2000 was mainly related to remediation
activities at former and present operating locations. These projects include remediation of
contaminated sediments in a river that receives discharges from the Gary Works and the closure of
permitted hazardous and non-hazardous waste landfills.
The Resource Conservation and Recovery Act (“RCRA”) establishes standards for the management
of solid and hazardous wastes. Besides affecting current waste disposal practices, RCRA also addresses
the environmental effects of certain past waste disposal operations, the recycling of wastes and the
regulation of storage tanks.
The U. S. Steel Group is in the study phase of RCRA corrective action programs at its Fairless
Works and its former Geneva Works. A RCRA corrective action program has been initiated at its Gary
Works and its Fairfield Works. Until the studies are completed at these facilities, USX is unable to
estimate the total cost of remediation activities that will be required.
U. S. Steel Group

Management’s Discussion and Analysis C O N T I N U E D
S-31
USX has been notified that it is a potential responsible party (‘‘PRP’’) at 25 waste sites related to
the U. S. Steel Group under the Comprehensive Environmental Response, Compensation and Liability
Act (‘‘CERCLA’’) as of December 31, 2000. In addition, there are 17 sites related to the U. S. Steel
Group where USX has received information requests or other indications that USX may be a PRP
under CERCLA but where sufficient information is not presently available to confirm the existence of
liability or make any judgment as to the amount thereof. There are also 29 additional sites related to
the U. S. Steel Group where remediation is being sought under other environmental statutes, both
federal and state, or where private parties are seeking remediation through discussions or litigation.
At many of these sites, USX is one of a number of parties involved and the total cost of remediation, as
well as USX’s share thereof, is frequently dependent upon the outcome of investigations and remedial
studies. The U. S. Steel Group accrues for environmental remediation activities when the
responsibility to remediate is probable and the amount of associated costs is reasonably determinable.
As environmental remediation matters proceed toward ultimate resolution or as additional
remediation obligations arise, charges in excess of those previously accrued may be required. See
Note 26 to the U. S. Steel Group Financial Statements.
In October 1996, USX was notified by the Indiana Department of Environmental Management
(“IDEM”) acting as lead trustee, that IDEM and the U. S. Department of the Interior had concluded a
preliminary investigation of potential injuries to natural resources related to releases of hazardous
substances from various municipal and industrial sources along the east branch of the Grand Calumet
River and Indiana Harbor Canal. The public trustees completed a pre-assessment screen pursuant to
federal regulations and have determined to perform a Natural Resource Damages Assessment. USX
was identified as a PRP along with 15 other companies owning property along the river and harbor
canal. USX and eight other PRPs have formed a joint defense group. The trustees notified the public of
their plan for assessment and later adopted the plan. In 2000, the trustees concluded their assessment
of sediment injuries, which includes a technical review of environmental conditions. The PRP joint
defense group is discussing settlement opportunities with the trustees and the U.S. Environmental
Protection Agency (“EPA”).
In 1997, USS/Kobe Steel Company (“USS/Kobe”), a joint venture between USX and Kobe Steel,
Ltd. (“Kobe”), was the subject of a multi-media audit by the EPA that included an air, water and
hazardous waste compliance review. USS/Kobe and the EPA entered into a tolling agreement pending
issuance of the final audit and commenced settlement negotiations in July 1999. In August 1999, the
steelmaking and bar producing operations of USS/Kobe were combined with companies controlled by
Blackstone Capital Partners II to form Republic. The tubular operations of USS/Kobe were transferred
to a newly formed entity, Lorain Tubular Company, LLC (“Lorain Tubular”), which operated as a joint
venture between USX and Kobe until December 31, 1999 when USX purchased all of Kobe’s interest in
Lorain Tubular. Republic and Lorain Tubular are continuing negotiations with the EPA. Most of the
matters raised by the EPA relate to Republic’s facilities; however, air discharges from Lorain Tubular’s
#3 seamless pipe mill have also been cited. Lorain Tubular will be responsible for matters relating to
its facilities. The final report and citations from the EPA have not been issued.
U. S. Steel Group

Management’s Discussion and Analysis C O N T I N U E D
S-32
In 1998, USX entered into a consent decree with the EPA which resolved alleged violations of the
Clean Water Act National Pollution Discharge Elimination System (“NPDES”) permit at Gary Works
and provides for a sediment remediation project for a section of the Grand Calumet River that runs
through Gary Works. Contemporaneously, USX entered into a consent decree with the public trustees
which resolves potential liability for natural resource damages on the same section of the Grand
Calumet River. In 1999, USX paid civil penalties of $2.9 million for the alleged water act violations
and $0.5 million in natural resource damages assessment costs. In addition, USX will pay the public
trustees $1 million at the end of the remediation project for future monitoring costs and USX is
obligated to purchase and restore several parcels of property that have been or will be conveyed to the
trustees. During the negotiations leading up to the settlement with EPA, capital improvements were
made to upgrade plant systems to comply with the NPDES requirements. The sediment remediation
project is an approved final interim measure under the corrective action program for Gary Works and
is expected to cost approximately $36.4 million over the next five years. Estimated remediation and
monitoring costs for this project have been accrued.
In February 1999, the U.S. Department of Justice and EPA issued a letter demanding a cash
payment of approximately $4 million to resolve a Finding of Violation issued in 1997 alleging improper
sampling of benzene waste streams at Gary Coke. On September 18, 2000, a Consent Decree was
entered which required USX to pay a civil penalty of $587,000 and to replace PCB transformers as a
Supplemental Environmental Program at a cost of approximately $2.2 million. Payment of the civil
penalty was made on October 13, 2000.
New or expanded environmental requirements, which could increase the U. S. Steel Group’s
environmental costs, may arise in the future. USX intends to comply with all legal requirements
regarding the environment, but since many of them are not fixed or presently determinable (even
under existing legislation) and may be affected by future legislation, it is not possible to predict
accurately the ultimate cost of compliance, including remediation costs which may be incurred and
penalties which may be imposed. However, based on presently available information, and existing
laws and regulations as currently implemented, the U. S. Steel Group does not anticipate that
environmental compliance expenditures (including operating and maintenance and remediation) will
materially increase in 2001. The U. S. Steel Group’s capital expenditures for environmental are
expected to be approximately $20 million in 2001 and are expected to be spent on projects primarily at
Gary Works and USSK. Predictions beyond 2001 can only be broad-based estimates which have varied,
and will continue to vary, due to the ongoing evolution of specific regulatory requirements, the possible
imposition of more stringent requirements and the availability of new technologies to remediate sites,
among other matters. Based upon currently identified projects, the U. S. Steel Group anticipates that
environmental capital expenditures will be approximately $51 million in 2002; however, actual
expenditures may vary as the number and scope of environmental projects are revised as a result of
improved technology or changes in regulatory requirements and could increase if additional projects
are identified or additional requirements are imposed.
U. S. Steel Group

Management’s Discussion and Analysis C O N T I N U E D
S-33
USX is the subject of, or a party to, a number of pending or threatened legal actions, contingencies
and commitments relating to the U. S. Steel Group involving a variety of matters, including laws and
regulations relating to the environment, certain of which are discussed in Note 26 to the U. S. Steel
Group Financial Statements. The ultimate resolution of these contingencies could, individually or in
the aggregate, be material to the U. S. Steel Group Financial Statements. However, management
believes that USX will remain a viable and competitive enterprise even though it is possible that these
contingencies could be resolved unfavorably to the U. S. Steel Group.
Management’s Discussion and Analysis of Operations
Despite a strong start, 2000 turned out to be a difficult year for the domestic steel industry. Steel
imports to the United States accounted for an estimated 27%, 26% and 30% of the domestic steel
market for 2000, 1999 and 1998, respectively. In 2000, steel imports of pipe increased 37% and imports
of hot rolled sheets increased 19%, compared to 1999.
For the U. S. Steel Group in 2000, domestic sheet and semi-finished product shipments decreased
9% compared to 1999. In addition, higher natural gas prices increased production cost by
approximately $70 million over 1999. Nevertheless, average realized steel prices were 7.1% higher in
2000 versus 1999 due primarily to a strong tubular market and a better product mix from including
Lorain Tubular shipments, effective January 1, 2000. However, sheet prices deteriorated during the
second half of the year to fourth quarter levels which were among the lowest in the last 20 years. By
year-end, several competitors had filed for Chapter 11 bankruptcy, adding more uncertainty to already
weak steel markets.
Total steel shipments were 11.1 million tons in 2000, 10.6 million tons in 1999, and 10.7 million
tons in 1998. Domestic Steel shipments comprised approximately 9.8% of the domestic steel market in
2000. Domestic Steel shipments were negatively affected by high import levels in 1998, 1999 and 2000
and by weak tubular markets in 1999 and 1998. Exports accounted for approximately 5% of Domestic
Steel shipments in 2000, 3% in 1999 and 4% in 1998.
Domestic raw steel production was 11.4 million tons in 2000, compared with 12.0 million tons in
1999 and 11.2 million tons in 1998. Domestic raw steel production averaged 89% of capability in 2000,
compared with 94% of capability in 1999 and 88% of capability in 1998. In 2000, domestic raw steel
production was negatively impacted by a planned reline at Gary Works No. 4 blast furnace in July
2000. Because of market conditions, U. S. Steel Group limited its domestic production by keeping the
Gary Works No. 4 blast furnace out of service through year-end 2000. In 1998, domestic raw steel
production was negatively affected by a planned reline at Gary Works No. 6 blast furnace, an
unplanned blast furnace outage at the Gary Works No. 13 blast furnace, and the idling of certain
facilities as a result of the increase in imports. Because of market conditions, U. S. Steel Group
curtailed its domestic production by keeping the Gary Works No. 6 blast furnace out of service until
February 1999, after a scheduled reline was completed in mid-August 1998. In addition, domestic raw
steel production was cut back at Mon Valley Works and Fairfield Works during 1998. U. S. Steel’s
stated annual domestic raw steel production capability was 12.8 million tons in 2000, 1999 and 1998.
USSK’s stated annual raw steel production capability for 2000 was 4.5 million net tons. After the
acquisition, raw steel production at USSK in 2000 averaged 82% of capability.
U. S. Steel Group

Management’s Discussion and Analysis C O N T I N U E D
S-34
On November 13, 2000, U. S. Steel Group joined with eight other producers and the Independent
Steelworkers Union to file trade cases against hot-rolled carbon steel flat products from 11 countries
(Argentina, India, Indonesia, Kazakhstan, the Netherlands, the People’s Republic of China, Romania,
South Africa, Taiwan, Thailand and Ukraine). Three days later, the USWA also entered the cases as a
petitioner. Antidumping (“AD”) cases were filed against all the countries and countervailing duty
(“CVD”) cases were filed against Argentina, India, Indonesia, South Africa, and Thailand. On
December 28, 2000, the U.S. International Trade Commission (“ITC”) made a preliminary
determination that there is a reasonable indication that the domestic industry is being materially
injured by the imports in question. As a result, both the ITC and U.S. Department of Commerce
(“Commerce”) will continue their investigations in these cases.
U. S. Steel Group believes that the remedies provided by U.S. law to private litigants are
insufficient to correct the widespread dumping and subsidy abuses that currently characterize steel
imports into our country. U. S. Steel Group, nevertheless, intends to file additional AD and CVD
petitions against unfairly traded imports that adversely impact, or threaten to adversely impact, the
results of the U. S. Steel Group and is urging the U.S. government to take additional steps.
On July 3, 2000, Commerce and the ITC initiated mandatory five-year “sunset” reviews of AD
orders issued in 1995 against seamless pipe from Argentina, Brazil, Germany and Italy and oil country
tubular goods (“OCTG”) from Argentina, Italy, Japan, Mexico and South Korea. The reviews also
encompass the 1995 CVD orders against the same two products from Italy. The “sunset” review
procedures require that an order must be revoked after five years unless Commerce and the ITC
determine that, if the orders would be discontinued, dumping or a countervailable subsidy would be
likely to continue or recur and material injury to the domestic industry would be likely to continue or
recur. Of the 11 orders, 8 are the subject of expedited review at Commerce because there was no
response, inadequate response, or waiver of participation by the respondent parties. Therefore, at
Commerce, only three of the orders (AD: OCTG from Mexico; and CVD: OCTG and seamless pipe from
Italy) are the subject of a full review. The ITC is conducting full reviews of all the cases, despite the
fact that responses by some of the respondent countries were inadequate.
The U. S. Steel Group depreciates domestic steel assets by modifying straight-line depreciation
based on the level of production. Depreciation charges for 2000, 1999, and 1998 were 94%, 99%, and
93%, respectively, of straight-line depreciation based on production levels for each of the years. See
Note 2 to the U. S. Steel Group Financial Statements.
Outlook for 2001
Domestic Steel’s order book and prices remain soft due to continued high import volumes (which in
2000 were second only to record-year 1998 levels), a draw-down of inventories by spot purchasers and
increasing evidence that the growth in the domestic economy is slowing. In addition to these factors,
our plate products business is being impacted by recently added domestic capacity. Although domestic
shipments for the first quarter of 2001 are projected to be somewhat better than fourth quarter 2000
levels, we expect that sheet and plate pricing, which declined markedly in the fourth quarter, will
continue to be depressed as a result of the factors cited above. The tubular business, however, remains
strong. For the year 2001, domestic shipments are expected to be approximately 11 million net tons,
excluding any shipments from the potential acquisition of LTV Corporation tin operations. For the
year 2001, USSK shipments are expected to be approximately 3.3 million to 3.6 million net tons.
U. S. Steel Group

Management’s Discussion and Analysis C O N T I N U E D
S-35
High natural gas prices adversely affected our results in 2000 and are expected to persist for some
time. The blast furnace idled at Gary Works in July 2000 for a planned 10-day outage remained down
until late February 2001 due to business conditions. The U. S. Steel Group has continued its cost
reduction efforts, and has recently requested from its current suppliers an immediate, temporary eight
percent price reduction from existing levels to help weather this difficult period.
Several domestic competitors recently have filed for Chapter 11 bankruptcy protection. This
provides them with certain competitive advantages and further demonstrates the very difficult
economic circumstances faced by the domestic industry.
U. S. Steel Group’s income from operations includes net pension credits, which are primarily
noncash, associated with all of U. S. Steel’s pension plans. Net pension credits were $266 million in
2000. At the end of 2000, U. S. Steel’s main pension plans’ transition asset was fully amortized,
decreasing the pension credit by $69 million annually in future years for this component. In addition,
for the year 2001, low marketplace returns on trust assets in the year 2000 and pending business
combinations in the current year are expected to further reduce net pension credits to approximately
$160 million. The above includes forward-looking statements concerning net pension credits which can
vary depending upon the market performance of plan assets, changes in actuarial assumptions
regarding such factors as the selection of a discount rate and rate of return on plan assets, changes in
the amortization levels of transition amounts or prior period service costs, plan amendments affecting
benefit payout levels, business combinations and profile changes in the beneficiary populations being
valued. Changes in any of these factors could cause net pension credits to change. To the extent net
pension credits decline in the future, income from operations would be adversely affected.
The U. S. Steel Group includes a 16 percent equity method investment in Republic (through an
ownership interest in Republic Technologies International Holdings, LLC (“Republic Holdings”), which
is the sole owner of Republic). In the third quarter of 2000, Republic announced that it had completed
a financial restructuring to improve its liquidity position. Republic raised approximately $30 million in
loans from certain of its direct and indirect equity partners in exchange for notes of Republic and
warrants to purchase Class D common stock of Republic Technologies International, Inc., Republic’s
majority owner. The U. S. Steel Group’s portion was approximately $6 million and the U. S. Steel
Group also agreed to certain deferred payment terms into the year 2002, up to a maximum of
$30 million, with regard to Republic’s obligations relating to iron ore pellets supplied to Republic. In
its Form 10-Q for the period ended September 30, 2000, which was filed with the SEC on October 31,
2000, Republic Holdings stated that “Notwithstanding these efforts, [Republic Holdings] may need to
obtain additional financing to meet its cash flow requirements, including financing from the sale of
additional debt or equity securities.” Republic Holdings also stated “As a result of the factors
mentioned above, [Republic Holdings] is highly leveraged and could be considered a risky investment.”
At December 31, 2000, the U. S. Steel Group’s financial exposure to Republic totaled
approximately $131 million, consisting of amounts owed by Republic to the U. S. Steel Group and debt
obligations assumed by Republic.
U. S. Steel Group

Management’s Discussion and Analysis C O N T I N U E D
S-36
In early October 2000, the U. S. Steel Group announced an agreement with LTV Corporation
(“LTV”) to purchase LTV’s tin mill products business, including its Indiana Harbor, Indiana tin
operations. This acquisition recently closed and was effective March 1, 2001. Terms of this noncash
transaction call for the U. S. Steel Group to assume certain employee-related obligations of LTV. The
U. S. Steel Group intends to operate these facilities as an ongoing business and tin mill employees at
Indiana Harbor became U. S. Steel Group employees. The U. S. Steel Group and LTV also entered into
5-year agreements for LTV to supply the U. S. Steel Group with pickled hot bands and for the U. S.
Steel Group to provide LTV with processing of cold rolled steel.
In October 2000, Transtar announced it had entered into a Reorganization and Exchange
Agreement with its two voting shareholders. Upon closing, Transtar and certain of its subsidiaries,
namely, the Birmingham Southern Railroad Company; the Elgin, Joliet and Eastern Railway
Company; the Lake Terminal Railroad Company; the McKeesport Connecting Railroad Company; the
Mobile River Terminal Company, Inc.; the Union Railroad Company; the Warrior & Gulf Navigation
Company; and Tracks Traffic and Management Services, Inc., will become subsidiaries within the
U. S. Steel Group. The other shareholder, Transtar Holdings, L.P., an affiliate of Blackstone Capital
Partners L.P., will become the owner of the other subsidiaries.
The preceding statements concerning anticipated steel demand, steel pricing, and shipment levels
are forward-looking and are based upon assumptions as to future product prices and mix, and levels of
steel production capability, production and shipments. These forward-looking statements can be
affected by imports, domestic and international economies, domestic production capacity, the
completion of the LTV and Transtar transactions, and customer demand. In the event these
assumptions prove to be inaccurate, actual results may differ significantly from those presently
anticipated.
Accounting Standards
In the fourth quarter of 2000, USX adopted the following accounting pronouncements primarily
related to the classification of items in the financial statements. The adoption of these new
pronouncements had no net effect on the financial position or results of operations of USX, although
they required reclassifications of certain amounts in the financial statements, including all prior
periods presented.
• In December 1999, the Securities and Exchange Commission (“SEC”) issued Staff Accounting
Bulletin No. 101 (“SAB 101”) “Revenue Recognition in Financial Statements,” which
summarizes the SEC staff’s interpretations of generally accepted accounting principles related
to revenue recognition and classification.
• In 2000, the Emerging Issues Task Force of the Financial Accounting Standards Board (“EITF”)
issued EITF consensus No. 99-19 “Reporting Revenue Gross as a Principal versus Net as an
Agent”, which addresses whether certain items should be reported as a reduction of revenue or
as a component of both revenues and cost of revenues, and EITF Consensus No. 00-10
“Accounting for Shipping and Handling Fees and Costs,” which addresses the classification of
costs incurred for shipping goods to customers.
U. S. Steel Group

Management’s Discussion and Analysis C O N T I N U E D
S-37
• In September 2000, the Financial Accounting Standards Board issued Statement of Financial
Accounting Standards No. 140, “Accounting for Transfers and Servicing of Financial Assets and
Extinguishments of Liabilities” (“SFAS 140”). SFAS 140 revises the standards for accounting
for securitizations and other transfers of financial assets and collateral and requires certain
disclosures. USX adopted certain recognition and reclassification provisions of SFAS 140, which
were effective for fiscal years ending after December 15, 2000. The remaining provisions of
SFAS 140 are effective after March 31, 2001.
In June 1998, the Financial Accounting Standards Board issued Statement of Financial
Accounting Standards No. 133, “Accounting for Derivative Instruments and Hedging Activities”
(“SFAS No. 133”), which later was amended by SFAS Nos. 137 and 138. This Standard requires
recognition of all derivatives as either assets or liabilities at fair value. Changes in fair value will be
reflected in either current period net income or other comprehensive income, depending on the
designation of the derivative instrument. The U. S. Steel Group may elect not to designate a derivative
instrument as a hedge even if the strategy would be expected to qualify for hedge accounting
treatment. The adoption of SFAS No. 133 will change the timing of recognition for derivative gains and
losses as compared to previous accounting standards.
The U. S. Steel Group will adopt the Standard effective January 1, 2001. The transition
adjustment resulting from adoption of SFAS No. 133 will be reported as a cumulative effect of a
change in accounting principle. The transition adjustment for the U. S. Steel Group is expected to be
immaterial. The amounts reported as other comprehensive income will be reflected in net income when
the anticipated physical transactions are consummated. It is not possible to estimate the effect that
this Standard will have on future results of operations.
U. S. Steel Group

S-38
Quantitative and Qualitative Disclosures About Market Risk
Management Opinion Concerning Derivative Instruments
USX uses commodity-based and foreign currency derivative instruments to manage its price risk.
Management has authorized the use of futures, forwards, swaps and options to manage exposure to
price fluctuations related to the purchase, production or sale of crude oil, natural gas, refined products,
and nonferrous metals. For transactions that qualify for hedge accounting, the resulting gains or losses
are deferred and subsequently recognized in income from operations, in the same period as the
underlying physical transaction. Derivative instruments used for trading and other activities are
marked-to-market and the resulting gains or losses are recognized in the current period in income
from operations. While USX’s risk management activities generally reduce market risk exposure due
to unfavorable commodity price changes for raw material purchases and products sold, such activities
can also encompass strategies that assume price risk.
Management believes that use of derivative instruments along with risk assessment procedures
and internal controls does not expose the U. S. Steel Group to material risk. The use of derivative
instruments could materially affect the U. S. Steel Group’s results of operations in particular quarterly
or annual periods. However, management believes that use of these instruments will not have a
material adverse effect on financial position or liquidity. For a summary of accounting policies related
to derivative instruments, see Note 2 to the U. S. Steel Group Financial Statements.
Commodity Price Risk and Related Risks
In the normal course of its business, the U. S. Steel Group is exposed to market risk or price
fluctuations related to the purchase, production or sale of steel products. To a lesser extent, the U. S.
Steel Group is exposed to price risk related to the purchase, production or sale of coal and coke and the
purchase of natural gas, steel scrap and certain nonferrous metals used as raw materials.
The U. S. Steel Group’s market risk strategy has generally been to obtain competitive prices for its
products and services and allow operating results to reflect market price movements dictated by
supply and demand. However, the U. S. Steel Group uses derivative commodity instruments (primarily
over-the-counter commodity swaps) to manage exposure to fluctuations in the purchase price of
natural gas, heating oil and certain nonferrous metals. The use of these instruments has not been
significant in relation to the U. S. Steel Group’s overall business activity.
The U. S. Steel Group recorded net pretax other than trading activity gains of $2 million in 2000,
losses of $4 million in 1999 and losses of $6 million in 1998. These gains and losses were offset by
changes in the realized prices of the underlying hedged commodities. For additional quantitative
information relating to derivative commodity instruments, including aggregate contract values and
fair values, where appropriate, see Note 24 to the U. S. Steel Group Financial Statements.
U. S. Steel Group

Quantitative and Qualitative DisclosuresAbout Market Risk C O N T I N U E D
S-39
Interest Rate Risk
USX is subject to the effects of interest rate fluctuations on certain of its non-derivative financial
instruments. A sensitivity analysis of the projected incremental effect of a hypothetical 10% decrease
in year-end 2000 and 1999 interest rates on the fair value of the U. S. Steel Group’s specifically
attributed non-derivative financial instruments and the U. S. Steel Group’s portion of USX’s non-
derivative financial instruments attributed to both groups, is provided in the following table:
(Dollars in millions)_______________________________________________________________________________________________As of December 31, 2000 1999
Incremental IncrementalIncrease in Increase in
Fair Fair Fair FairNon-Derivative Financial Instruments(a) Value(b) Value(c) Value(b) Value(c)_______________________________________________________________________________________________Financial assets:
Investments and long-term receivables(d) $ 137 $ – $ 122 $ –
Financial liabilities:Long-term debt(e)(f) $ 2,375 $ 80 $ 835 $ 20Preferred stock of subsidiary(g) 63 5 63 5USX obligated mandatorily
redeemable convertible preferredsecurities of a subsidiary trust(g) 119 10 169 15________ ________ ________ ________
Total liabilities $ 2,557 $ 95 $ 1,067 $ 40_______________________________________________________________________________________________(a) Fair values of cash and cash equivalents, receivables, notes payable, accounts payable and accrued interest,
approximate carrying value and are relatively insensitive to changes in interest rates due to the short-termmaturity of the instruments. Accordingly, these instruments are excluded from the table.
(b) See Note 25 to the U. S. Steel Group Financial Statements for carrying value of instruments.(c) Reflects, by class of financial instrument, the estimated incremental effect of a hypothetical 10% decrease in
interest rates at December 31, 2000 and December 31, 1999, on the fair value of USX’s non-derivative financialinstruments. For financial liabilities, this assumes a 10% decrease in the weighted average yield to maturity ofUSX’s long-term debt at December 31, 2000 and December 31, 1999.
(d) For additional information, see Note 16 to the U. S. Steel Group Consolidated Financial Statements.(e) Includes amounts due within one year.(f) Fair value was based on market prices where available, or current borrowing rates for financings with similar
terms and maturities. For additional information, see Note 11 to the U. S. Steel Group Financial Statements.(g) See Note 22 to the USX Consolidated Financial Statements.
At December 31, 2000, USX’s portfolio of long-term debt was comprised primarily of fixed-rate
instruments. Therefore, the fair value of the portfolio is relatively sensitive to effects of interest rate
fluctuations. This sensitivity is illustrated by the $80 million increase in the fair value of long-term
debt assuming a hypothetical 10% decrease in interest rates. However, USX’s sensitivity to interest
rate declines and corresponding increases in the fair value of its debt portfolio would unfavorably
affect USX’s results and cash flows only to the extent that USX elected to repurchase or otherwise
retire all or a portion of its fixed-rate debt portfolio at prices above carrying value.
U. S. Steel Group

Quantitative and Qualitative DisclosuresAbout Market Risk C O N T I N U E D
S-40
Foreign Currency Exchange Rate Risk
USX is subject to the risk of price fluctuations related to anticipated revenues and operating costs,
firm commitments for capital expenditures and existing assets or liabilities denominated in currencies
other than U.S. dollars, in particular the Euro and Slovak koruna. USX has not generally used
derivative instruments to manage this risk. However, USX has made limited use of forward currency
contracts to manage exposure to certain currency price fluctuations. At December 31, 2000, the U. S.
Steel Group had no open forward currency contracts.
Equity Price Risk
USX is subject to equity price risk and liquidity risk related to its investment in VSZ, which is
attributed to the U. S. Steel Group. These risks are not readily quantifiable.
Safe Harbor
The U. S. Steel Group’s quantitative and qualitative disclosures about market risk include
forward-looking statements with respect to management’s opinion about risks associated with the
U. S. Steel Group’s use of derivative instruments. These statements are based on certain assumptions
with respect to market prices and industry supply of and demand for steel products and certain raw
materials. To the extent that these assumptions prove to be inaccurate, future outcomes with respect
to the U. S. Steel Group’s hedging programs may differ materially from those discussed in the forward-
looking statements.
U. S. Steel Group

U-1
Management’s Report
The accompanying consolidated financial statements of USX Corporation and Subsidiary Companies(USX) are the responsibility of and have been prepared by USX in conformity with accountingprinciples generally accepted in the United States. They necessarily include some amounts that arebased on best judgments and estimates. The consolidated financial information displayed in othersections of this report is consistent with these consolidated financial statements.
USX seeks to assure the objectivity and integrity of its financial records by careful selection of itsmanagers, by organizational arrangements that provide an appropriate division of responsibility andby communications programs aimed at assuring that its policies and methods are understoodthroughout the organization.
USX has a comprehensive formalized system of internal accounting controls designed to providereasonable assurance that assets are safeguarded and that financial records are reliable. Appropriatemanagement monitors the system for compliance, and the internal auditors independently measure itseffectiveness and recommend possible improvements thereto. In addition, as part of their audit of theconsolidated financial statements, USX’s independent accountants, who are elected by the stockholders,review and test the internal accounting controls selectively to establish a basis of reliance thereon indetermining the nature, extent and timing of audit tests to be applied.
The Board of Directors pursues its oversight role in the area of financial reporting and internalaccounting control through its Audit Committee. This Committee, composed solely of nonmanagementdirectors, regularly meets (jointly and separately) with the independent accountants, management andinternal auditors to monitor the proper discharge by each of its responsibilities relative to internalaccounting controls and the consolidated financial statements.
Thomas J. Usher Robert M. Hernandez Larry G. SchultzChairman, Board of Directors & Vice Chairman & Vice President–Chief Executive Officer Chief Financial Officer Accounting
Report of Independent Accountants
To the Stockholders of USX Corporation:
In our opinion, the accompanying consolidated financial statements appearing on pages U-2 through U-28present fairly, in all material respects, the financial position of USX Corporation and its subsidiaries atDecember 31, 2000 and 1999, and the results of their operations and their cash flows for each of the threeyears in the period ended December 31, 2000, in conformity with accounting principles generally acceptedin the United States of America. These financial statements are the responsibility of USX’s management;our responsibility is to express an opinion on these financial statements based on our audits. Weconducted our audits of these statements in accordance with auditing standards generally accepted in theUnited States of America, which require that we plan and perform the audit to obtain reasonableassurance about whether the financial statements are free of material misstatement. An audit includesexamining, on a test basis, evidence supporting the amounts and disclosures in the financial statements,assessing the accounting principles used and significant estimates made by management, and evaluatingthe overall financial statement presentation. We believe that our audits provide a reasonable basis for ouropinion.
PricewaterhouseCoopers LLP600 Grant Street, Pittsburgh, Pennsylvania 15219-2794February 7, 2001
USX

U-2
Consolidated Statement of Operations
(Dollars in millions) 2000 1999 1998_______________________________________________________________________________________________Revenues and other income:
Revenues (Note 6) $ 40,500 $ 29,068 $ 27,629 Dividend and investee income (loss) 94 (20) 96 Net gains (losses) on disposal of assets (Note 27) (739) 21 82 Gain on ownership change in
Marathon Ashland Petroleum LLC (Note 3) 12 17 245 Other income 47 33 25 _________ _________ _________
Total revenues and other income 39,914 29,119 28,077 _________ _________ _________
Costs and expenses:Cost of revenues (excludes items shown below) 31,056 21,679 20,211 Selling, general and administrative expenses 402 203 304 Depreciation, depletion and amortization 1,605 1,254 1,224 Taxes other than income taxes 4,861 4,433 4,241 Exploration expenses 238 238 313 Inventory market valuation charges (credits) (Note 15) – (551) 267 _________ _________ _________
Total costs and expenses 38,162 27,256 26,560 _________ _________ _________
Income from operations 1,752 1,863 1,517 Net interest and other financial costs (Note 6) 341 362 279 Minority interest in income of
Marathon Ashland Petroleum LLC (Note 3) 498 447 249 _________ _________ _________Income before income taxes and extraordinary losses 913 1,054 989 Provision for income taxes (Note 11) 502 349 315 _________ _________ _________
Income before extraordinary losses 411 705 674 Extraordinary losses (Note 7) – 7 – _________ _________ _________
Net income 411 698 674 Dividends on preferred stock 8 9 9 _________ _________ _________
Net income applicable to common stocks $ 403 $ 689 $ 665 _______________________________________________________________________________________________The accompanying notes are an integral part of these consolidated financial statements.
USX

U-3
Income Per Common Share
(Dollars in millions, except per share data) 2000 1999 1998_______________________________________________________________________________________________Applicable to Marathon Stock:
Net income $ 432 $ 654 $ 310 Per Share Data:
Basic 1.39 2.11 1.06 Diluted 1.39 2.11 1.05 _______________________________________________________________________________________________
Applicable to Steel Stock:Income (loss) before extraordinary losses $ (29) $ 42 $ 355 Extraordinary losses – 7 – _________ _________ _________Net income (loss) $ (29) $ 35 $ 355 Per Share Data
Basic:Income (loss) before extraordinary losses $ (.33) $ .48 $ 4.05 Extraordinary losses – .08 – _________ _________ _________Net income (loss) $ (.33) $ .40 $ 4.05
Diluted:Income (loss) before extraordinary losses $ (.33) $ .48 $ 3.92 Extraordinary losses – .08 – _________ _________ _________Net income (loss) $ (.33) $ .40 $ 3.92 _______________________________________________________________________________________________
See Note 20, for a description and computation of income per common share.The accompanying notes are an integral part of these consolidated financial statements.
USX

U-4
Consolidated Balance Sheet
(Dollars in millions) December 31 2000 1999_______________________________________________________________________________________________AssetsCurrent assets:
Cash and cash equivalents $ 559 $ 133 Receivables, less allowance for doubtful accounts
of $60 and $12 2,888 2,367 Receivables subject to a security interest (Note 14) 350 350 Inventories (Note 15) 2,813 2,627 Deferred income tax benefits (Note 11) 261 303 Assets held for sale (Note 27) 330 84 Other current assets 131 92 _________ _________
Total current assets 7,332 5,956
Investments and long-term receivables, less reserves of$28 and $3 (Note 12) 801 1,237
Property, plant and equipment – net (Note 21) 12,114 12,809 Prepaid pensions (Note 9) 2,879 2,629 Other noncurrent assets 275 300 _________ _________
Total assets $ 23,401 $ 22,931 _______________________________________________________________________________________________LiabilitiesCurrent liabilities:
Notes payable (Note 13) $ 150 $ – Accounts payable 3,774 3,409 Payroll and benefits payable 432 468 Accrued taxes 281 283 Accrued interest 108 107 Long-term debt due within one year (Note 14) 287 61 _________ _________
Total current liabilities 5,032 4,328
Long-term debt (Note 14) 4,173 4,222 Deferred income taxes (Note 11) 2,020 1,839 Employee benefits (Note 9) 2,415 2,809 Deferred credits and other liabilities 724 691 Preferred stock of subsidiary (Note 22) 250 250 USX obligated mandatorily redeemable convertible preferred
securities of a subsidiary trust holding solely junior subordinatedconvertible debentures of USX (Note 22) 183 183
Minority interest in Marathon Ashland Petroleum LLC (Note 3) 1,840 1,753
Stockholders’ Equity (Details on pages U-6 and U-7)Preferred stock (Note 23) –
6.50% Cumulative Convertible issued – 2,413,487 shares and2,715,287 shares ($121 and $136 liquidation preference, respectively) 2 3
Common stocks:Marathon Stock issued – 312,165,978 shares and 311,767,181 shares (par value $1 per share, authorized 550,000,000 shares) 312 312 Steel Stock issued – 88,767,395 shares and 88,397,714 shares (par value $1 per share, authorized 200,000,000 shares) 89 88 Securities exchangeable solely into Marathon Stock – issued – 281,148 shares and 288,621 shares (Note 3) – –
Treasury common stock, at cost –Marathon Stock – 3,899,714 shares and -0- shares (104) –
Additional paid-in capital 4,676 4,673 Deferred compensation (8) – Retained earnings 1,847 1,807 Accumulated other comprehensive income (loss) (50) (27)_________ _________
Total stockholders’ equity 6,764 6,856 _________ _________Total liabilities and stockholders’ equity $ 23,401 $ 22,931 _______________________________________________________________________________________________
The accompanying notes are an integral part of these consolidated financial statements.
USX

U-5
Consolidated Statement of Cash Flows
(Dollars in millions) 2000 1999 1998_______________________________________________________________________________________________Increase (decrease) in cash and cash equivalents
Operating activities:
Net income $ 411 $ 698 $ 674 Adjustments to reconcile to net cash provided
from operating activities:Extraordinary losses – 7 – Minority interest in income of Marathon Ashland Petroleum LLC 498 447 249 Depreciation, depletion and amortization 1,605 1,254 1,224 Exploratory dry well costs 86 109 186 Inventory market valuation charges (credits) – (551) 267 Pensions and other postretirement benefits (778) (220) (181)Deferred income taxes 149 212 184 Gain on ownership change in Marathon Ashland Petroleum LLC (12) (17) (245)Net (gains) losses on disposal of assets 739 (21) (82)Changes in: Current receivables – sold – (320) (30)
– operating turnover (375) (988) 451 Inventories (46) (77) (6)Current accounts payable and accrued expenses 182 1,251 (497)
All other – net 72 152 (172)_________ _________ _________Net cash provided from operating activities 2,531 1,936 2,022 _________ _________ _________
Investing activities:
Capital expenditures (1,669) (1,665) (1,580)Acquisitions – U. S. Steel Kosice s.r.o., net of cash acquired of $59 (10) – –
– Tarragon Oil and Gas Limited – – (686)Disposal of assets 560 366 86 Restricted cash – withdrawals 273 60 241
– deposits (270) (61) (67)Investees – investments (100) (74) (115)
– loans and advances (16) (70) (104)– returns and repayments 10 1 71
All other – net 29 (25) (4)_________ _________ _________Net cash used in investing activities (1,193) (1,468) (2,158)_________ _________ _________
Financing activities:
Commercial paper and revolving credit arrangements – net 62 (381) 724 Other debt – borrowings 273 810 1,036
– repayments (339) (242) (1,445)Common stock – issued – 89 668
– repurchased (105) – (195)Treasury common stock reissued 1 – – Preferred stock repurchased (12) (2) (8)Dividends paid (371) (354) (342)Distributions to minority shareholder of
Marathon Ashland Petroleum LLC (420) (400) (211)_________ _________ _________Net cash provided from (used in) financing activities (911) (480) 227 _________ _________ _________
Effect of exchange rate changes on cash (1) (1) 1 _________ _________ _________Net increase (decrease) in cash and cash equivalents 426 (13) 92
Cash and cash equivalents at beginning of year 133 146 54 _________ _________ _________Cash and cash equivalents at end of year $ 559 $ 133 $ 146 _______________________________________________________________________________________________See Note 16, for supplemental cash flow information.The accompanying notes are an integral part of these consolidated financial statements.
USX

U-6
Consolidated Statement of Stockholders’ Equity
USX has two classes of common stock: USX – Marathon Group Common Stock (Marathon Stock) andUSX – U. S. Steel Group Common Stock (Steel Stock), which are intended to reflect the performance ofthe Marathon and U. S. Steel Groups, respectively. (See Note 8, for a description of the two Groups.)During 1998, USX issued 878,074 Exchangeable Shares (exchangeable solely into Marathon Stock)related to the purchase of Tarragon Oil and Gas Limited. (See Note 3.)
On all matters where the holders of Marathon Stock and Steel Stock vote together as a singleclass, Marathon Stock has one vote per share and Steel Stock has a fluctuating vote per share based onthe relative market value of a share of Steel Stock to the market value of a share of Marathon Stock.In the event of a disposition of all or substantially all the properties and assets of the U. S. SteelGroup, USX must either distribute the net proceeds to the holders of the Steel Stock as a specialdividend or in redemption of the stock, or exchange the Steel Stock for the Marathon Stock. In theevent of liquidation of USX, the holders of the Marathon Stock and Steel Stock will share in the fundsremaining for common stockholders based on the relative market capitalization of the respectiveMarathon Stock and Steel Stock to the aggregate market capitalization of both classes of commonstock.
Dollars in millions Shares in thousands___________________________ __________________________2000 1999 1998 2000 1999 1998_______________________________________________________________________________________________
Preferred stock (Note 23) –6.50% Cumulative Convertible:
Balance at beginning of year $ 3 $ 3 $ 3 2,715 2,768 2,962 Repurchased (1) – – (302) (53) (194)_______ _______ _______ ________ ________ ________Balance at end of year $ 2 $ 3 $ 3 2,413 2,715 2,768 _______________________________________________________________________________________________
Common stocks:Marathon Stock:
Balance at beginning of year $ 312 $ 308 $ 289 311,767 308,459 288,786 Issued in public offering – – 17 – 67 17,000 Issued for:
Employee stock plans – 3 2 391 2,903 2,236 Dividend Reinvestment and Direct Stock Purchase Plan – – – – 120 66 Exchangeable Shares – 1 – 8 218 371 _______ _______ _______ ________ ________ ________
Balance at end of year $ 312 $ 312 $ 308 312,166 311,767 308,459 _______________________________________________________________________________________________Steel Stock:
Balance at beginning of year $ 88 $ 88 $ 86 88,398 88,336 86,578 Issued for:
Employee stock plans 1 – 2 369 62 1,733 Dividend Reinvestment and Direct Stock Purchase Plan – – – – – 25 _______ _______ _______ ________ ________ ________
Balance at end of year $ 89 $ 88 $ 88 88,767 88,398 88,336 _______________________________________________________________________________________________Securities exchangeable solely into
Marathon Stock:Balance at beginning of year $ – $ 1 $ – 289 507 – Issued to acquire Tarragon stock – – 1 – – 878 Exchanged for Marathon Stock – (1) – (8) (218) (371)_______ _______ _______ ________ ________ ________Balance at end of year $ – $ – $ 1 281 289 507 _______________________________________________________________________________________________
Treasury common stock, at cost –Marathon Stock:
Balance at beginning of year $ – $ – $ – – – – Repurchased (105) – – (3,957) – – Reissued for:
Employee stock plans 1 – – 43 – – Non-employee Board of Directors deferred compensation plan – – – 14 – – _______ _______ _______ ________ ________ ________
Balance at end of year $ (104) $ – $ – (3,900) – – _______________________________________________________________________________________________
(Table continued on next page)
USX

U-7
Stockholders’ Equity Comprehensive Income_________________________ ________________________(Dollars in millions) 2000 1999 1998 2000 1999 1998_______________________________________________________________________________________________Additional paid-in capital:
Balance at beginning of year $4,673 $4,587 $3,924 Marathon Stock issued 9 92 598 Steel Stock issued 5 2 57 Exchangeable Shares: Issued – – 28 Exchanged for Marathon Stock – (6) (12)Repurchase of 6.50% preferred stock (11) (2) (8)_______ _______ _______Balance at end of year $4,676 $4,673 $4,587 ___________________________________________________________________
Deferred compensation (Note 17) $ (8) $ – $ (1)___________________________________________________________________Retained earnings:
Balance at beginning of year $1,807 $1,467 $1,138 Net income 411 698 674 $ 411 $ 698 $ 674 Dividends on preferred stock (8) (9) (9)Dividends on Marathon Stock (per share: $.88 in 2000 and $.84 in 1999 and 1998) (274) (261) (248)Dividends on Steel Stock (per share $1.00) (89) (88) (88)_______ _______ _______Balance at end of year $1,847 $1,807 $1,467 ___________________________________________________________________
Accumulated other comprehensive income (loss):Minimum pension liability adjustments: Balance at beginning of year $ (10) $ (37) $ (32) Changes during year, net of taxes(a) (11) 27 (5) (11) 27 (5)_______ _______ _______ Balance at end of year (21) (10) (37)_______ _______ _______Foreign currency translation adjustments: Balance at beginning of year $ (17) $ (11) $ (8) Changes during year, net of taxes(a) (12) (6) (3) (12) (6) (3)_______ _______ _______ Balance at end of year (29) (17) (11)_______ _______ _______Unrealized holding losses on investments: Balance at beginning of year $ – $ – $ 3 Changes during year, net of taxes(a) – (1) 2 – (1) 2 Reclassification adjustment included in net income – 1 (5) – 1 (5)_______ _______ _______ Balance at end of year – – – ___________________________________________________________________ Total balances at end of year $ (50) $ (27) $ (48)_______________________________________________________________________________________________ Total comprehensive income(b) $ 388 $ 719 $ 663 _______________________________________________________________________________________________
Total stockholders’ equity $6,764 $6,856 $6,405 ___________________________________________________________________(a) Related income tax provision (credit): 2000 1999 1998_____ _____ _____
Minimum pension liability adjustments $ 4 $ (13) $ 3 Foreign currency translation adjustments (4) 3 4 Unrealized holding gains on investments – – 2
(b) Total comprehensive income (loss) by Group:Marathon Group $ 419 $ 660 $ 306 U. S. Steel Group (31) 59 357 _____ _____ _____
Total $ 388 $ 719 $ 663 _____ _____ __________ _____ _____
The accompanying notes are an integral part of these consolidated financial statements.

U-8
Notes to Consolidated Financial Statements
1. Summary of Principal Accounting Policies
Principles applied in consolidation – The consolidated financial statements include the accounts ofUSX Corporation and the majority-owned subsidiaries which it controls (USX).
Investments in unincorporated oil and gas joint ventures, undivided interest pipelines and jointlyowned gas processing plants are consolidated on a pro rata basis.
Investments in entities over which USX has significant influence are accounted for using theequity method of accounting and are carried at USX’s share of net assets plus loans and advances.
Investments in companies whose stock is publicly traded are carried generally at market value.The difference between the cost of these investments and market value is recorded in othercomprehensive income (net of tax). Investments in companies whose stock has no readily determinablefair value are carried at cost.
Dividend and investee income includes USX’s proportionate share of income from equity methodinvestments and dividend income from other investments. Dividend income is recognized whendividend payments are received.
Gains or losses from a change in ownership of a consolidated subsidiary or an unconsolidatedinvestee are recognized in the period of change.
Use of estimates – Generally accepted accounting principles require management to make estimatesand assumptions that affect the reported amounts of assets and liabilities, the disclosure of contingentassets and liabilities at year-end and the reported amounts of revenues and expenses during the year.Significant items subject to such estimates and assumptions include the carrying value of long-livedassets; valuation allowances for receivables, inventories and deferred income tax assets;environmental liabilities; liabilities for potential tax deficiencies and potential litigation claims andsettlements; and assets and obligations related to employee benefits. Additionally, certain estimatedliabilities are recorded when management commits to a plan to close an operating facility or to exit abusiness activity. Actual results could differ from the estimates and assumptions used.
Revenue recognition – Revenues are recognized generally when products are shipped or services areprovided to customers, the sales price is fixed and determinable, and collectibility is reasonablyassured. Costs associated with revenues, including shipping and other transportation costs, arerecorded in cost of revenues. Matching buy/sell transactions settled in cash are recorded in bothrevenues and cost of revenues as separate sales and purchase transactions, with no net effect onincome. USX follows the sales method of accounting for gas production imbalances and wouldrecognize a liability if the existing proved reserves were not adequate to cover the current imbalancesituation.
Cash and cash equivalents – Cash and cash equivalents include cash on hand and on deposit andinvestments in highly liquid debt instruments with maturities generally of three months or less.
Inventories – Inventories are carried at lower of cost or market. Cost of inventories is determinedprimarily under the last-in, first-out (LIFO) method.
Derivative instruments – USX uses commodity-based and foreign currency derivative instruments tomanage its exposure to price risk. Management is authorized to use futures, forwards, swaps andoptions related to the purchase, production or sale of crude oil, natural gas, refined products,nonferrous metals and electricity. While USX’s risk management activities generally reduce marketrisk exposure due to unfavorable commodity price changes for raw material purchases and productssold, such activities can also encompass strategies which assume price risk.
USX

U-9
Commodity-Based Hedging Transactions – For transactions that qualify for hedge accounting, theresulting gains or losses are deferred and subsequently recognized in income from operations, as acomponent of revenues or cost of revenues, in the same period as the underlying physicaltransaction. To qualify for hedge accounting, derivative positions cannot remain open if theunderlying physical market risk has been removed. If such derivative positions remain in place,they would be marked-to-market and accounted for as trading or other activities. Recordeddeferred gains or losses are reflected within other current and noncurrent assets or accountspayable and deferred credits and other liabilities, as appropriate.
Commodity-Based Trading and Other Activities – Derivative instruments used for trading andother activities are marked-to-market and the resulting gains or losses are recognized in thecurrent period within income from operations. This category also includes the use of derivativeinstruments that have no offsetting underlying physical market risk.
Foreign Currency Transactions – USX uses forward exchange contracts to manage currency risks.Gains or losses related to firm commitments are deferred and recognized concurrent with theunderlying transaction. All other gains or losses are recognized in income in the current period asrevenues, cost of revenues, interest income or expense, or other income, as appropriate. Forwardexchange contracts are recorded as receivables or payables, as appropriate.
Exploration and development – USX follows the successful efforts method of accounting for oil andgas exploration and development.
Long-lived assets – Except for oil and gas producing properties, depreciation is generally computedon the straight-line method based upon estimated lives of assets. USX’s method of computingdepreciation for domestic steel producing assets modifies straight-line depreciation based on the levelof production. The modification factors range from a minimum of 85% at a production level below 81%of capability, to a maximum of 105% for a 100% production level. No modification is made at the 95%production level, considered the normal long-range level.
Depreciation and depletion of oil and gas producing properties are computed using predeterminedrates based upon estimated proved oil and gas reserves applied on a units-of-production method.
Depletion of mineral properties, other than oil and gas, is based on rates which are expected toamortize cost over the estimated tonnage of minerals to be removed.
USX evaluates impairment of its oil and gas producing assets primarily on a field-by-field basisusing undiscounted cash flows based on total proved reserves. Other assets are evaluated on anindividual asset basis or by logical groupings of assets. Assets deemed to be impaired are written downto their fair value, including any related goodwill, using discounted future cash flows and, if available,comparable market values.
When long-lived assets depreciated on an individual basis are sold or otherwise disposed of, anygains or losses are reflected in income. Gains on disposal of long-lived assets are recognized whenearned, which is generally at the time of closing. If a loss on disposal is expected, such losses arerecognized when long-lived assets are reclassified as assets held for sale. Proceeds from disposal oflong-lived assets depreciated on a group basis are credited to accumulated depreciation, depletion andamortization with no immediate effect on income.
Major maintenance activities – USX incurs planned major maintenance costs primarily for refineryturnarounds in the Marathon Group and blast furnace relines in the U. S. Steel Group. Costsassociated with refinery turnarounds are expensed in the same annual period as incurred; however,estimated annual turnaround costs are recognized in income throughout the year on a pro rata basis.Costs associated with blast furnace relines are separately capitalized in property, plant andequipment. Such costs are amortized over their estimated useful life, which is generally the perioduntil the next scheduled reline.
Environmental liabilities – USX provides for remediation costs and penalties when theresponsibility to remediate is probable and the amount of associated costs is reasonably determinable.Generally, the timing of remediation accruals coincides with completion of a feasibility study or thecommitment to a formal plan of action. Remediation liabilities are accrued based on estimates ofknown environmental exposure and are discounted in certain instances. If recoveries of remediationcosts from third parties are probable, a receivable is recorded. Estimated abandonment anddismantlement costs of offshore production platforms are accrued based on production of estimatedproved oil and gas reserves.
Postemployment benefits – USX recognizes an obligation to provide postemployment benefits,primarily for disability-related claims covering indemnity and medical payments. The obligation forthese claims and the related periodic costs are measured using actuarial techniques and assumptions,including an appropriate discount rate, analogous to the required methodology for measuring pensionand other postretirement benefit obligations. Actuarial gains and losses are deferred and amortizedover future periods.

U-10
Insurance – USX is insured for catastrophic casualty and certain property and business interruptionexposures, as well as those risks required to be insured by law or contract. Costs resulting fromnoninsured losses are charged against income upon occurrence.
Reclassifications – Certain reclassifications of prior years’ data have been made to conform to 2000classifications.
2. New Accounting Standards
In the fourth quarter of 2000, USX adopted the following accounting pronouncements primarilyrelated to the classification of items in the financial statements. The adoption of these newpronouncements had no net effect on the financial position or results of operations of USX, althoughthey required reclassifications of certain amounts in the financial statements, including all priorperiods presented.
• In December 1999, the Securities and Exchange Commission (SEC) issued Staff AccountingBulletin No. 101 (SAB 101) “Revenue Recognition in Financial Statements,” which summarizesthe SEC staff's interpretations of generally accepted accounting principles related to revenuerecognition and classification.
• In 2000, the Emerging Issues Task Force of the Financial Accounting Standards Board (EITF)issued EITF Consensus No. 99-19 “Reporting Revenue Gross as a Principal versus Net as anAgent,” which addresses whether certain items should be reported as a reduction of revenue oras a component of both revenues and cost of revenues, and EITF Consensus No. 00-10“Accounting for Shipping and Handling Fees and Costs,” which addresses the classification ofcosts incurred for shipping goods to customers.
• In September 2000, the Financial Accounting Standards Board issued Statement of FinancialAccounting Standards No. 140, “Accounting for Transfers and Servicing of Financial Assets andExtinguishments of Liabilities” (SFAS 140). SFAS 140 revises the standards for accounting forsecuritizations and other transfers of financial assets and collateral and requires certaindisclosures. USX adopted certain recognition and reclassification provisions of SFAS 140, whichwere effective for fiscal years ending after December 15, 2000. The remaining provisions ofSFAS 140 are effective after March 31, 2001.
In June 1998, the Financial Accounting Standards Board issued Statement of FinancialAccounting Standards No. 133, “Accounting for Derivative Instruments and Hedging Activities” (SFASNo. 133), which later was amended by SFAS Nos. 137 and 138. This Standard requires recognition ofall derivatives as either assets or liabilities at fair value. Changes in fair value will be reflected ineither current period net income or other comprehensive income, depending on the designation of thederivative instrument. USX may elect not to designate a derivative instrument as a hedge even if thestrategy would be expected to qualify for hedge accounting treatment. The adoption of SFAS No. 133will change the timing of recognition for derivative gains and losses as compared to previousaccounting standards.
USX will adopt the Standard effective January 1, 2001. The transition adjustment resulting fromthe adoption of SFAS No. 133 will be reported as a cumulative effect of a change in accountingprinciple. The unfavorable cumulative effect on net income, net of tax, is expected to approximate$9 million. The unfavorable cumulative effect on other comprehensive income, net of tax, willapproximate $7 million. The amounts reported as other comprehensive income will be reflected in netincome when the anticipated physical transactions are consummated. It is not possible to estimate theeffect that this Standard will have on future results of operations.
3. Business Combinations
On November 24, 2000, USX acquired U. S. Steel Kosice s.r.o. (USSK), which is located in the SlovakRepublic. USSK was formed in June 2000 to hold the steel operations and related assets of VSZ a.s.(VSZ), a diversified Slovak corporation. The cash purchase price was $69 million. Additional paymentsto VSZ of not less than $25 million and up to $75 million are contingent upon the future performanceof USSK. Additionally, $325 million of debt was included with the acquisition. The acquisition wasaccounted for under the purchase method of accounting. The 2000 results of operations include theoperations of USSK from the date of acquisition.
Prior to this transaction, USX and VSZ were equal partners in VSZ U. S. Steel s.r.o. (VSZUSS), a tinmill products manufacturer. The assets of USSK included VSZ’s interest in VSZUSS. The acquisition ofthe remaining interest in VSZUSS was accounted for under the purchase method of accounting.Previously, USX had accounted for its investment in VSZUSS under the equity method of accounting.

U-11
VSZ did not provide historical carve-out financial information for its steel activities prepared inaccordance with generally accepted accounting principles in the United States. USX was unable tofully determine the effects of transfer pricing, intercompany eliminations and expense allocations inorder to prepare such carve-out information from Slovak statutory reports and VSZ internal records.USX broadly estimates that the unaudited pro forma effect on its 2000 and 1999 revenues, givingeffect to the acquisition as if it had been consummated at the beginning of those periods, would havebeen to increase revenues in each period by approximately $1 billion. USX cannot determine theunaudited pro forma effect on its 2000 and 1999 net income. In any event, historical pro formainformation is not necessarily indicative of future results of operations.
In August 1998, Marathon Oil Company (Marathon) acquired Tarragon Oil and Gas Limited(Tarragon), a Canadian oil and gas exploration and production company. Securityholders of Tarragonreceived, at their election, Cdn$14.25 for each Tarragon share, or the economic equivalent inExchangeable Shares of an indirect Canadian subsidiary of Marathon, which are exchangeable solelyon a one-for-one basis into Marathon Stock. The purchase price included cash payments of$686 million, issuance of 878,074 Exchangeable Shares valued at $29 million and the assumption of$345 million in debt.
The Exchangeable Shares are exchangeable at the option of the holder at any time andautomatically redeemable on August 11, 2003 (and, in certain circumstances, as early as August 11,2001). The holders of Exchangeable Shares are entitled to receive declared dividends equivalent todividends declared from time to time by USX on Marathon Stock.
USX accounted for the acquisition using the purchase method of accounting. The 1998 results ofoperations include the operations of Marathon Canada Limited, formerly known as Tarragon,commencing August 12, 1998.
During 1997, Marathon and Ashland Inc. (Ashland) agreed to combine the major elements of theirrefining, marketing and transportation (RM&T) operations. On January 1, 1998, Marathon transferredcertain RM&T net assets to Marathon Ashland Petroleum LLC (MAP), a new consolidated subsidiary.Also on January 1, 1998, Marathon acquired certain RM&T net assets from Ashland in exchange for a38% interest in MAP. The acquisition was accounted for under the purchase method of accounting. Thepurchase price was determined to be $1.9 billion, based upon an external valuation. The change inMarathon’s ownership interest in MAP resulted in a gain of $245 million in 1998. In accordance withMAP closing agreements, Marathon and Ashland have made capital contributions to MAP forenvironmental improvements. The closing agreements stipulate that ownership interests in MAP willnot be adjusted as a result of such contributions. Accordingly, Marathon recognized a gain onownership change of $12 million in 2000 and $17 million in 1999.
In connection with the formation of MAP, Marathon and Ashland entered into a Limited LiabilityCompany Agreement dated January 1, 1998 (the LLC Agreement). The LLC Agreement provides foran initial term of MAP expiring on December 31, 2022 (25 years from its formation). The term willautomatically be extended for ten-year periods, unless a termination notice is given by either party.
Also in connection with the formation of MAP, the parties entered into a Put/Call, RegistrationRights and Standstill Agreement (the Put/Call Agreement). The Put/Call Agreement provides that atany time after December 31, 2004, Ashland will have the right to sell to Marathon all of Ashland’sownership interest in MAP, for an amount in cash and/or Marathon or USX debt or equity securitiesequal to the product of 85% (90% if equity securities are used) of the fair market value of MAP at thattime, multiplied by Ashland’s percentage interest in MAP. Payment could be made at closing, or atMarathon’s option, in three equal annual installments, the first of which would be payable at closing.At any time after December 31, 2004, Marathon will have the right to purchase all of Ashland’sownership interests in MAP, for an amount in cash equal to the product of 115% of the fair marketvalue of MAP at that time, multiplied by Ashland’s percentage interest in MAP.
4. Transactions Between MAP and Ashland
At December 31, 2000 and 1999, MAP had current receivables from Ashland of $35 million and$26 million, respectively, and current payables to Ashland of $2 million.
MAP has a $190 million revolving credit agreement with Ashland. Interest on borrowings is basedon defined short-term market rates. At December 31, 2000 and 1999, there were no borrowings againstthis facility.
During 2000, 1999 and 1998, MAP’s sales to Ashland, consisting primarily of petroleum products,were $285 million, $198 million and $190 million, respectively, and MAP’s purchases of products andservices from Ashland were $26 million, $22 million and $47 million, respectively. These transactionswere conducted under terms comparable to those with unrelated parties.

U-12
5. Discontinued Operations
Effective October 31, 1997, USX sold its stock in Delhi Gas Pipeline Corporation and other subsidiaries ofUSX that comprised all of the Delhi Group. USX elected to use the net proceeds of $195 million, or$20.60 per share, to redeem all shares of Delhi Stock. The net proceeds were distributed to the Delhishareholders on January 26, 1998. After the redemption, 50,000,000 shares of Delhi Stock remainauthorized but unissued.
6. Other Items(In millions) 2000 1999 1998_______________________________________________________________________________________________Net interest and other financial costs
Interest and other financial income:Interest income $ 29 $ 16 $ 35 Other 5 (13) 4 ________ ________ ________
Total 34 3 39 ________ ________ ________Interest and other financial costs:
Interest incurred 328 326 325 Less interest capitalized 19 26 46 ________ ________ ________
Net interest 309 300 279 Interest on tax issues 17 20 21 Financial costs on trust preferred securities 13 13 13 Financial costs on preferred stock of subsidiary 22 22 22 Amortization of discounts 3 3 6 Expenses on sales of accounts receivable – 15 21 Adjustment to settlement value of indexed debt – (13) (44)Other 11 5 – ________ ________ ________
Total 375 365 318 ________ ________ ________Net interest and other financial costs $ 341 $ 362 $ 279 _______________________________________________________________________________________________
Foreign currency transactionsFor 2000, 1999 and 1998, the aggregate foreign currency transaction gains (losses) included indetermining net income were $37 million, $(12) million and $13 million, respectively.
Consumer excise taxes
Included in revenues and costs and expenses for 2000, 1999 and 1998 were $4,344 million,$3,973 million and $3,824 million, respectively, representing consumer excise taxes on petroleumproducts and merchandise.
7. Extraordinary Losses
In 1999, USX irrevocably deposited with a trustee the entire 5.5 million common shares it owned inRTI International Metals, Inc. (RTI). The deposit of the shares resulted in the satisfaction of USX’sobligation under its 63/4% Exchangeable Notes (indexed debt) due February 1, 2000. Under the termsof the indenture, the trustee exchanged one RTI share for each note at maturity. All shares wererequired for satisfaction of the indexed debt; therefore, none reverted back to USX.
As a result of the above transaction, USX recorded in 1999 an extraordinary loss of $5 million, netof a $3 million income tax benefit, representing prepaid interest expense and the write-off ofunamortized debt issue costs, and a pretax charge of $22 million, representing the difference betweenthe carrying value of the investment in RTI and the carrying value of the indexed debt, which isincluded in net gains (losses) on disposal of assets. Since USX’s investment in RTI was attributed tothe U. S. Steel Group, the indexed debt was also attributed to the U. S. Steel Group.
In 1999, Republic Technologies International, LLC, an equity investee of USX, recorded anextraordinary loss related to the early extinguishment of debt. As a result, USX recorded anextraordinary loss of $2 million, net of a $1 million income tax benefit, representing its share of theextraordinary loss.

U-13
8. Group and Segment Information
USX has two classes of common stock: Marathon Stock and Steel Stock, which are intended to reflect the performance of theMarathon Group and the U. S. Steel Group, respectively. A description of each group and its products and services is asfollows:
Marathon Group – The Marathon Group includes Marathon Oil Company and certain other subsidiaries of USX. MarathonGroup revenues as a percentage of total consolidated USX revenues were 85% in 2000, 81% in 1999 and 77% in 1998.
U. S. Steel Group – The U. S. Steel Group consists of U. S. Steel, the largest domestic integrated steel producer and U. S.Steel operations in the Slovak Republic. U. S. Steel Group revenues as a percentage of total consolidated USX revenues were15% in 2000, 19% in 1999 and 23% in 1998.
Group Operations:Income NetFrom Income Capital
(In millions) Year Revenues Operations (Loss) Expenditures Assets____________________________________________________________________________________________________________________Marathon Group 2000 $ 34,487 $ 1,648 $ 432 $ 1,425 $ 15,232
1999 23,590 1,713 654 1,378 15,674 1998 21,274 938 310 1,270 14,544 ____________________________________________________________________________________________________________________
U. S. Steel Group 2000 6,090 104 (21) 244 8,711 1999 5,536 150 44 287 7,525 1998 6,378 579 364 310 6,749 ____________________________________________________________________________________________________________________
Eliminations 2000 (77) – – – (542)1999 (58) – – – (268)1998 (23) – – – (160)____________________________________________________________________________________________________________________
Total USX 2000 $ 40,500 $ 1,752 $ 411 $ 1,669 $ 23,401 Corporation 1999 29,068 1,863 698 1,665 22,931
1998 27,629 1,517 674 1,580 21,133 ____________________________________________________________________________________________________________________
Revenues by Product:
(In millions) 2000 1999 1998____________________________________________________________________________________________________________________Marathon Group Refined products $ 22,514 $ 15,181 $ 12,852 Merchandise 2,441 2,194 1,941 Liquid hydrocarbons 6,856 4,587 5,023 Natural gas 2,518 1,429 1,187 Transportation and other products 158 199 271 ____________________________________________________________________________________________________________________U. S. Steel Group Sheet and semi-finished steel products $ 3,288 $ 3,433 $ 3,598 Tubular, plate and tin mill products 1,731 1,140 1,546 Raw materials (coal, coke and iron ore) 626 549 744 Other(a) 445 414 490 ____________________________________________________________________________________________________________________(a) Includes revenue from the sale of steel production by-products, engineering and consulting services, real estate development and resource
management.
Operating Segments:
USX’s reportable operating segments are business units within the Marathon and U. S. Steel Groups, each providing theirown unique products and services. Each operating segment is independently managed and requires different technology andmarketing strategies. Segment income represents income from operations allocable to operating segments. The followingitems included in income from operations are not allocated to operating segments:
• Gain on ownership change in MAP• Net pension credits associated with the U. S. Steel Group’s pension plan assets and liabilities• Certain costs related to former U. S. Steel Group business activities• Certain general and administrative costs related to all Marathon Group operating segments in excess of
amounts billed to MAP under service contracts and amounts charged out to operating segments underMarathon’s shared services procedures
• USX corporate general and administrative costs. These costs primarily consist of employment costs includingpension effects, professional services, facilities and other related costs associated with corporate activities.
• Inventory market valuation adjustments• Certain other items not allocated to operating segments for business performance reporting purposes (see (a) in
reconcilement table on page U-15)

U-14
The Marathon Group’s operations consist of three reportable operating segments: 1) Exploration and Production (E&P) –explores for and produces crude oil and natural gas on a worldwide basis; 2) Refining, Marketing and Transportation(RM&T) – refines, markets and transports crude oil and petroleum products, primarily in the Midwest and southeasternUnited States through MAP; and 3) Other Energy Related Businesses (OERB). Other Energy Related Businesses is anaggregation of two segments which fall below the quantitative reporting thresholds: 1) Natural Gas and Crude Oil Marketingand Transportation – markets and transports its own and third-party natural gas and crude oil in the United States; and2) Power Generation – develops, constructs and operates independent electric power projects worldwide. The U. S. SteelGroup consists of two reportable operating segments: 1) Domestic Steel and 2) U. S. Steel Kosice (USSK). Domestic Steelincludes the United States operations of U. S. Steel, while USSK includes the U. S. Steel Kosice operations in the SlovakRepublic. Domestic Steel is engaged in the domestic production and sale of steel mill products, coke and taconite pellets; themanagement of mineral resources; coal mining; engineering and consulting services; and real estate development andmanagement. USSK is engaged in the production and sale of steel mill products and coke and primarily serves Europeanmarkets.
Information on assets by segment is not provided as it is not reviewed by the chief operating decision maker.
Total TotalMarathon Domestic U. S. Steel
(In millions) E&P RM&T OERB Segments Steel USSK Segments Total____________________________________________________________________________________________________________________2000Revenues and other income:
Customer $ 4,184 $28,693 $ 1,550 $34,427 $ 5,981 $ 92 $ 6,073 $40,500 Intersegment(a) 412 83 78 573 – – – 573 Intergroup(a) 30 1 29 60 17 – 17 77 Equity in earnings (losses) of
unconsolidated investees 47 22 15 84 (8) – (8) 76 Other 21 50 12 83 50 – 50 133 ________ ________ ________ ________ ________ ________ ________ ________
Total revenues and other income $ 4,694 $28,849 $ 1,684 $35,227 $ 6,040 $ 92 $ 6,132 $41,359 ________ ________ ________ ________ ________ ________ ________ ________________ ________ ________ ________ ________ ________ ________ ________Segment income $ 1,535 $ 1,273 $ 38 $ 2,846 $ 23 $ 2 $ 25 $ 2,871 Significant noncash items included
in segment income – depreciation,depletion and amortization(b) 723 315 3 1,041 285 4 289 1,330
Capital expenditures(c) 742 656 2 1,400 239 5 244 1,644 ____________________________________________________________________________________________________________________1999Revenues and other income:
Customer $ 2,856 $19,962 $ 731 $23,549 $ 5,519 $ – $ 5,519 $29,068 Intersegment(a) 202 47 40 289 – – – 289 Intergroup(a) 19 – 22 41 17 – 17 58 Equity in earnings (losses) of
unconsolidated investees (2) 17 26 41 (43) – (43) (2)Other 30 50 15 95 46 – 46 141 ________ ________ ________ ________ ________ ________ ________ ________
Total revenues and other income $ 3,105 $20,076 $ 834 $24,015 $ 5,539 $ – $ 5,539 $29,554 ________ ________ ________ ________ ________ ________ ________ ________________ ________ ________ ________ ________ ________ ________ ________Segment income $ 618 $ 611 $ 61 $ 1,290 $ 91 $ – $ 91 $ 1,381 Significant noncash items included
in segment income – depreciation,depletion and amortization(b) 638 280 5 923 304 – 304 1,227
Capital expenditures(c) 744 612 4 1,360 286 – 286 1,646 ____________________________________________________________________________________________________________________1998Revenues and other income:
Customer $ 1,905 $19,018 $ 306 $21,229 $ 6,374 $ – $ 6,374 $27,603 Intersegment(a) 144 10 17 171 – – – 171
Intergroup(a) 13 – 7 20 2 – 2 22
Equity in earnings ofunconsolidated investees 2 12 14 28 46 – 46 74
Other 26 40 11 77 55 – 55 132 ________ ________ ________ ________ ________ ________ ________ ________Total revenues and other income $ 2,090 $19,080 $ 355 $21,525 $ 6,477 $ – $ 6,477 $28,002 ________ ________ ________ ________ ________ ________ ________ ________________ ________ ________ ________ ________ ________ ________ ________
Segment income $ 278 $ 896 $ 33 $ 1,207 $ 517 $ – $ 517 $ 1,724 Significant noncash items included
in segment income – depreciation,depletion and amortization(b) 581 272 6 859 283 – 283 1,142
Capital expenditures(c) 839 410 8 1,257 305 – 305 1,562 ____________________________________________________________________________________________________________________(a) Intersegment and intergroup revenues and transfers were conducted under terms comparable to those with unrelated parties.(b) Differences between segment totals and consolidated totals represent amounts included in administrative expenses, international and
domestic oil and gas property impairments and impairment of coal assets.(c) Differences between segment totals and consolidated totals represent amounts related to corporate administrative activities.

U-15
The following schedules reconcile segment amounts to amounts reported in the Groups’ financial statements:Marathon Group U. S. Steel Group_____________________________________ _____________________________________
(In millions) 2000 1999 1998 2000 1999 1998____________________________________________________________________________________________________________________Revenues and Other Income:
Revenues and other income ofreportable segments $ 35,227 $ 24,015 $ 21,525 $ 6,132 $ 5,539 $ 6,477
Items not allocated to segments:Joint venture formation charges (931) – – – – – Gain on ownership change in MAP 12 17 245 – – – Losses on certain equity investments – – – – (69) – Other 124 (36) 24 – – –
Elimination of intersegment revenues (573) (289) (171) – – – _________ _________ _________ _________ _________ _________Total Group revenues and other income $ 33,859 $ 23,707 $ 21,623 $ 6,132 $ 5,470 $ 6,477 _________ _________ _________ _________ _________ __________________ _________ _________ _________ _________ _________
Income:Income for reportable segments $ 2,846 $ 1,290 $ 1,207 $ 25 $ 91 $ 517 Items not allocated to segments:
Joint venture formation charges (931) – – – – – Gain on ownership change in MAP 12 17 245 – – – Administrative expenses (136) (108) (106) (25) (17) (24)Net pension credits – – – 266 228 186 Costs related to former business activities – – – (91) (83) (100)Inventory market valuation adjustments – 551 (267) – – – Other(a) (143) (37) (141) (71) (69) – _________ _________ _________ _________ _________ _________
Total Group income from operations $ 1,648 $ 1,713 $ 938 $ 104 $ 150 $ 579 ____________________________________________________________________________________________________________________(a) Represents in 2000, for the Marathon Group, certain oil and gas property impairments, net gains on certain asset sales and reorganization charges and for the U. S.
Steel Group, impairment of coal assets. Represents in 1999, for the Marathon Group, primarily certain oil and gas property impairments, costs of a voluntary earlyretirement program and net losses on certain asset sales and, for the U. S. Steel Group, certain losses related to investments in equity investees. Represents in 1998,certain international oil and gas property impairments, certain suspended exploration well write-offs, a gas contract settlement and MAP transition charges.
Geographic Area:The information below summarizes the operations in different geographic areas. Transfers between geographic areas are
at prices which approximate market.Revenues and Other Income__________________________________________________
Within Between(In millions) Year Geographic Areas Geographic Areas Total Assets(a)____________________________________________________________________________________________________________________Marathon Group:
United States 2000 $ 32,239 $ – $ 32,239 $ 6,711 1999 22,716 – 22,716 7,555 1998 20,837 – 20,837 7,659
Canada 2000 856 899 1,755 940 1999 426 521 947 1,112 1998 209 368 577 1,094
United Kingdom 2000 567 – 567 1,698 1999 459 – 459 1,581 1998 462 – 462 1,739
Other Foreign Countries 2000 197 188 385 310 1999 106 88 194 735 1998 115 52 167 468
Eliminations 2000 – (1,087) (1,087) – 1999 – (609) (609) – 1998 – (420) (420) –
Total Marathon Group 2000 $ 33,859 $ – $ 33,859 $ 9,659 1999 23,707 – 23,707 10,983 1998 21,623 – 21,623 10,960 ____________________________________________________________________________________________________________________
U. S. Steel Group:United States 2000 $ 6,027 $ – $ 6,027 $ 2,745
1999 5,452 – 5,452 2,889 1998 6,460 – 6,460 3,043
Foreign Countries 2000 105 – 105 386 1999 18 – 18 63 1998 17 – 17 69
Total U. S. Steel Group 2000 $ 6,132 $ – $ 6,132 $ 3,131 1999 5,470 – 5,470 2,952 1998 6,477 – 6,477 3,112 ____________________________________________________________________________________________________________________
Eliminations 2000 $ (77) $ – $ (77) $ – 1999 (58) – (58) – 1998 (23) – (23) – ____________________________________________________________________________________________________________________
Total USX Corporation 2000 $ 39,914 $ – $ 39,914 $ 12,790 1999 29,119 – 29,119 13,935 1998 28,077 – 28,077 14,072 ____________________________________________________________________________________________________________________
(a) Includes property, plant and equipment and investments.
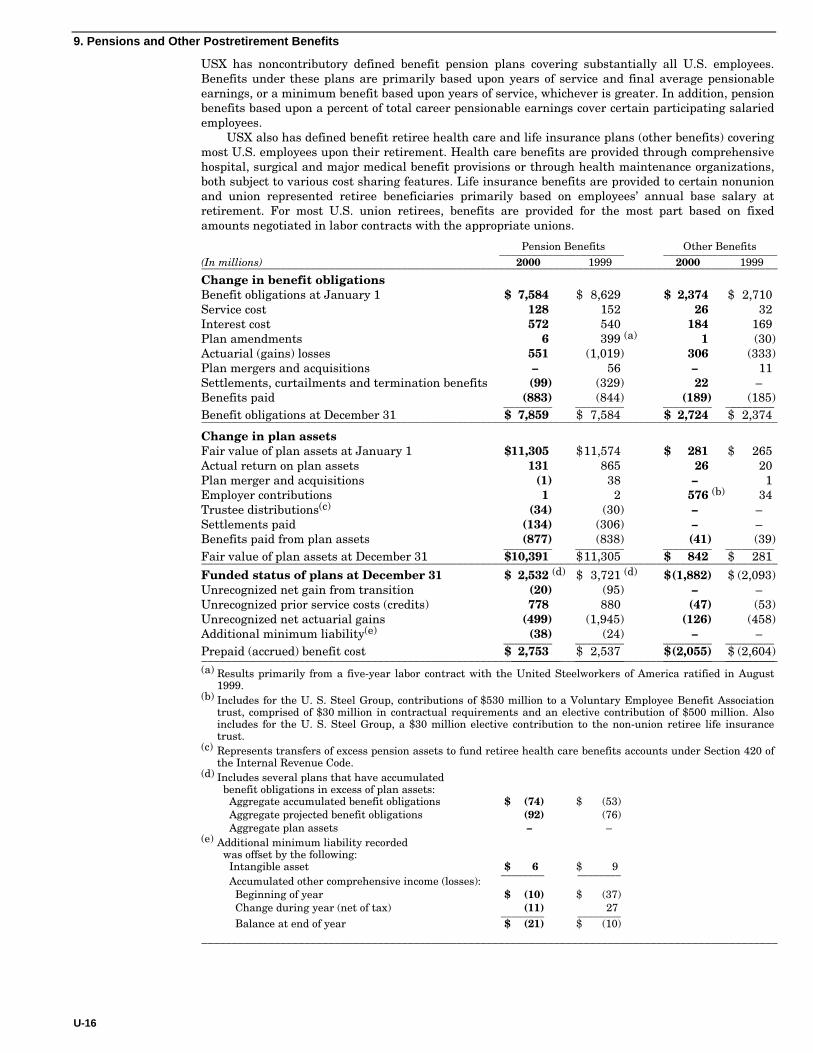
U-16
9. Pensions and Other Postretirement Benefits
USX has noncontributory defined benefit pension plans covering substantially all U.S. employees.Benefits under these plans are primarily based upon years of service and final average pensionableearnings, or a minimum benefit based upon years of service, whichever is greater. In addition, pensionbenefits based upon a percent of total career pensionable earnings cover certain participating salariedemployees.
USX also has defined benefit retiree health care and life insurance plans (other benefits) coveringmost U.S. employees upon their retirement. Health care benefits are provided through comprehensivehospital, surgical and major medical benefit provisions or through health maintenance organizations,both subject to various cost sharing features. Life insurance benefits are provided to certain nonunionand union represented retiree beneficiaries primarily based on employees’ annual base salary atretirement. For most U.S. union retirees, benefits are provided for the most part based on fixedamounts negotiated in labor contracts with the appropriate unions.
Pension Benefits Other Benefits_______________________ _____________________(In millions) 2000 1999 2000 1999_______________________________________________________________________________________________Change in benefit obligationsBenefit obligations at January 1 $ 7,584 $ 8,629 $ 2,374 $ 2,710 Service cost 128 152 26 32 Interest cost 572 540 184 169 Plan amendments 6 399 (a) 1 (30)Actuarial (gains) losses 551 (1,019) 306 (333)Plan mergers and acquisitions – 56 – 11 Settlements, curtailments and termination benefits (99) (329) 22 – Benefits paid (883) (844) (189) (185)_________ _________ _________ _________Benefit obligations at December 31 $ 7,859 $ 7,584 $ 2,724 $ 2,374 _______________________________________________________________________________________________
Change in plan assetsFair value of plan assets at January 1 $11,305 $11,574 $ 281 $ 265 Actual return on plan assets 131 865 26 20 Plan merger and acquisitions (1) 38 – 1 Employer contributions 1 2 576 (b) 34 Trustee distributions(c) (34) (30) – – Settlements paid (134) (306) – – Benefits paid from plan assets (877) (838) (41) (39)_________ _________ _________ _________Fair value of plan assets at December 31 $10,391 $11,305 $ 842 $ 281 _______________________________________________________________________________________________Funded status of plans at December 31 $ 2,532 (d) $ 3,721 (d) $(1,882) $ (2,093)Unrecognized net gain from transition (20) (95) – – Unrecognized prior service costs (credits) 778 880 (47) (53)Unrecognized net actuarial gains (499) (1,945) (126) (458)Additional minimum liability(e) (38) (24) – – _________ _________ _________ _________Prepaid (accrued) benefit cost $ 2,753 $ 2,537 $(2,055) $ (2,604)_________ _________ _________ ________________________________________________________________________________________________________(a) Results primarily from a five-year labor contract with the United Steelworkers of America ratified in August
1999.(b) Includes for the U. S. Steel Group, contributions of $530 million to a Voluntary Employee Benefit Association
trust, comprised of $30 million in contractual requirements and an elective contribution of $500 million. Alsoincludes for the U. S. Steel Group, a $30 million elective contribution to the non-union retiree life insurancetrust.
(c) Represents transfers of excess pension assets to fund retiree health care benefits accounts under Section 420 ofthe Internal Revenue Code.
(d) Includes several plans that have accumulated benefit obligations in excess of plan assets: Aggregate accumulated benefit obligations $ (74) $ (53) Aggregate projected benefit obligations (92) (76) Aggregate plan assets – –
(e) Additional minimum liability recorded was offset by the following: Intangible asset $ 6 $ 9 ________ ________ Accumulated other comprehensive income (losses): Beginning of year $ (10) $ (37) Change during year (net of tax) (11) 27 ________ ________ Balance at end of year $ (21) $ (10)
_______________________________________________________________________________________________

U-17
Pension Benefits Other Benefits_____________________________ _______________________________(In millions) 2000 1999 1998 2000 1999 1998_______________________________________________________________________________________________Components of net periodic
benefit cost (credit)Service cost $ 128 $ 152 $ 119 $ 26 $ 32 $ 27 Interest cost 572 540 544 184 169 172 Expected return on plan assets (958) (895) (876) (24) (21) (21)Amortization – net transition gain (71) (72) (74) – – –
– prior service costs (credits) 102 87 75 (6) (4) 1 – actuarial (gains) losses (53) 7 6 (26) (5) (13)
Multiemployer and other USX plans 5 5 6 9 (a) 7 (a) 13 (a)
Settlement and termination (gains) losses 32 (b) (42)(b) 10 (b) 21 (b) – – _______ _______ _______ _______ _______ _______Net periodic benefit cost (credit) $ (243) $ (218) $ (190) $ 184 $ 178 $ 179 _______________________________________________________________________________________________(a) Represents payments to a multiemployer health care benefit plan created by the Coal Industry Retiree Health
Benefit Act of 1992 based on assigned beneficiaries receiving benefits. The present value of this unrecognizedobligation is broadly estimated to be $84 million, including the effects of future medical inflation, and thisamount could increase if additional beneficiaries are assigned.
(b) Relates primarily to voluntary early retirement programs.
Pension Benefits Other Benefits_______________________ _____________________2000 1999 2000 1999_______________________________________________________________________________________________
Weighted average actuarial assumptionsat December 31:
Discount rate 7.5% 8.0% 7.5% 8.0% Expected annual return on plan assets 9.0% 8.6% 8.5% 8.5% Increase in compensation rate 4.1% 4.1% 4.1% 4.1% _______________________________________________________________________________________________
For measurement purposes, a 7.6% annual rate of increase in the per capita cost of covered healthcare benefits was assumed for 2001. The rate was assumed to decrease gradually to 5% in 2006 for theU. S. Steel Group and in 2007 for the Marathon Group and remain at that level thereafter.
A one-percentage-point change in assumed health care cost trend rates would have the followingeffects:
1-Percentage- 1-Percentage-(In millions) Point Increase Point Decrease_______________________________________________________________________________________________Effect on total of service and interest cost components $ 25 $ (21)Effect on other postretirement benefit obligations 248 (209)_______________________________________________________________________________________________
10. Leases
Future minimum commitments for capital leases (including sale-leasebacks accounted for asfinancings) and for operating leases having remaining noncancelable lease terms in excess of one yearare as follows:
Capital Operating(In millions) Leases Leases_______________________________________________________________________________________________2001 $ 12 $ 173 2002 12 139 2003 12 98 2004 12 87 2005 12 141 Later years 89 173 Sublease rentals – (80)_________ _________
Total minimum lease payments 149 $ 731 __________________Less imputed interest costs 54 _________
Present value of net minimum lease payments included in long-term debt $ 95 _______________________________________________________________________________________________
Operating lease rental expense:(In millions) 2000 1999 1998_______________________________________________________________________________________________
Minimum rental $ 288 $ 273 $ 288 Contingent rental 30 29 29 Sublease rentals (19) (19) (14)_________ _________ _________
Net rental expense $ 299 $ 283 $ 303 _______________________________________________________________________________________________
USX leases a wide variety of facilities and equipment under operating leases, including land andbuilding space, office equipment, production facilities and transportation equipment. Most long-termleases include renewal options and, in certain leases, purchase options. In the event of a change incontrol of USX, as defined in the agreements, or certain other circumstances, operating leaseobligations totaling $104 million may be declared immediately due and payable.

U-18
11. Income Taxes
Provisions (credits) for income taxes were:2000 1999 1998_____________________________ ___________________________ ___________________________
(In millions) Current Deferred Total Current Deferred Total Current Deferred Total_______________________________________________________________________________________________Federal $ 257 $ 196 $ 453 $ 107 $ 257 $ 364 $ 102 $ 168 $ 270 State and local 41 3 44 4 1 5 33 18 51 Foreign 55 (50) 5 26 (46) (20) (4) (2) (6)______ ______ ______ ______ ______ ______ ______ ______ ______
Total $ 353 $ 149 $ 502 $ 137 $ 212 $ 349 $ 131 $ 184 $ 315 _______________________________________________________________________________________________
A reconciliation of federal statutory tax rate (35%) to total provisions follows:(In millions) 2000 1999 1998_______________________________________________________________________________________________Statutory rate applied to income before income taxes $ 320 $ 369 $ 346 Effects of foreign operations:
Impairment of deferred tax benefits 235 – – Adjustments to foreign valuation allowances (30) – – All other, including foreign tax credits (35) (20) (37)
State and local income taxes after federal income tax effects 29 3 33 Credits other than foreign tax credits (10) (10) (12)Excess percentage depletion (3) (7) (11)Effects of partially owned companies (5) (5) (4)Dispositions of subsidiary investments – 7 – Adjustment of prior years’ federal income taxes (6) 4 (5)Other 7 8 5 ________ ________ ________
Total provisions $ 502 $ 349 $ 315 _______________________________________________________________________________________________
Deferred tax assets and liabilities resulted from the following:(In millions) December 31 2000 1999_______________________________________________________________________________________________Deferred tax assets:
Minimum tax credit carryforwards $ 39 $ 131 State tax loss carryforwards (expiring in 2001 through 2020) 125 122 Foreign tax loss carryforwards (portion of which expire in 2001 through 2015) 269 408 Employee benefits 1,028 1,204 Expected federal benefit for:
Crediting certain foreign deferred income taxes 315 530 Deducting state deferred income taxes 36 36
Receivables, payables and debt 93 82 Contingency and other accruals 226 202 Investments in foreign subsidiaries 39 52 Other 62 45 Valuation allowances:
Federal – (30)State (50) (52)Foreign (252) (282)________ ________
Total deferred tax assets(a) 1,930 2,448 ________ ________Deferred tax liabilities:
Property, plant and equipment 1,890 2,365 Prepaid pensions 1,165 1,048 Inventory 335 340 Investments in subsidiaries and equity investees 52 76 Other 221 155 ________ ________
Total deferred tax liabilities 3,663 3,984 ________ ________Net deferred tax liabilities $ 1,733 $ 1,536 _______________________________________________________________________________________________
(a) USX expects to generate sufficient future taxable income to realize the benefit of its deferred tax assets. Inaddition, the ability to realize the benefit of foreign tax credits is based upon certain assumptions concerningfuture operating conditions (particularly as related to prevailing oil prices), income generated from foreignsources and USX’s tax profile in the years that such credits may be claimed. During 2000, the amount of netdeferred tax assets expected to be realized was reduced as a result of the change in the amount and timing offuture foreign source income due to the exchange of Marathon’s interest in Sakhalin Energy InvestmentCompany Ltd. (Sakhalin Energy) for other oil and gas producing interests. Additionally, gross deferred taxassets and the associated valuation allowance were reduced by a change in management’s intent regarding thepermanent reinvestment of the earnings from certain foreign subsidiaries.
The consolidated tax returns of USX for the years 1990 through 1997 are under various stages ofaudit and administrative review by the IRS. USX believes it has made adequate provision for incometaxes and interest which may become payable for years not yet settled.
Pretax income (loss) included $245 million, $63 million and $(75) million attributable to foreignsources in 2000, 1999 and 1998, respectively.

U-19
Undistributed earnings of certain consolidated foreign subsidiaries at December 31, 2000,amounted to $223 million. No provision for deferred U.S. income taxes has been made for thesesubsidiaries because USX intends to permanently reinvest such earnings in those foreign operations.If such earnings were not permanently reinvested, a deferred tax liability of $78 million would havebeen required.
12. Investments and Long-Term Receivables
(In millions) December 31 2000 1999_______________________________________________________________________________________________Equity method investments $ 575 $ 1,055 Other investments 101 71 Receivables due after one year 59 57 Deposits of restricted cash 19 22 Other 47 32 _________ _________
Total $ 801 $ 1,237 _______________________________________________________________________________________________
Summarized financial information of investees accounted for by the equity method of accountingfollows:(In millions) 2000 1999 1998_______________________________________________________________________________________________Income data – year:
Revenues and other income $ 3,901 $ 3,449 $ 3,510 Operating income 286 95 324 Net income (loss) (43) (74) 176 _______________________________________________________________________________________________
Balance sheet data – December 31:Current assets $ 1,239 $ 1,382 Noncurrent assets 3,443 5,008 Current liabilities 1,427 1,481 Noncurrent liabilities 1,957 2,317 _______________________________________________________________________________________________
USX acquired a 25% interest in VSZ during 2000. VSZ does not provide its shareholders withfinancial statements prepared in accordance with generally accepted accounting principles in theUnited States (USGAAP). Although shares of VSZ are traded on the Bratislava Stock Exchange, thosesecurities do not have a readily determinable fair value as defined under USGAAP. Accordingly, USXaccounts for its investment in VSZ under the cost method of accounting.
In 1999, USX and Kobe Steel, Ltd. (Kobe Steel) completed a transaction that combined thesteelmaking and bar producing assets of USS/Kobe Steel Company (USS/Kobe) with companiescontrolled by Blackstone Capital Partners II. The combined entity was named Republic TechnologiesInternational, LLC and is a wholly owned subsidiary of Republic Technologies International Holdings,LLC (Republic). As a result of this transaction, USX recorded $47 million in charges related to theimpairment of the carrying value of its investment in USS/Kobe and costs related to the formation ofRepublic. These charges were included in dividend and investee income (loss) in 1999. In addition,USX made a $15 million equity investment in Republic. USX owned 50% of USS/Kobe and now owns16% of Republic. USX accounts for its investment in Republic under the equity method of accounting.The seamless pipe business of USS/Kobe was excluded from this transaction. That business, nowknown as Lorain Tubular Company, LLC, became a wholly owned subsidiary of USX at the close ofbusiness on December 31, 1999.
Dividends and partnership distributions received from equity investees were $56 million in 2000,$46 million in 1999 and $42 million in 1998.
USX purchases from equity investees totaled $627 million, $411 million and $395 million in 2000,1999 and 1998, respectively. USX sales to equity investees totaled $986 million, $853 million and$747 million in 2000, 1999 and 1998, respectively.
13. Short-Term Debt
In November 2000, USX entered into a $451 million 364-day revolving credit agreement, whichterminates in November 2001. Interest is based on defined short-term market rates. During the termof the agreement, USX is obligated to pay a variable facility fee on total commitments, which atDecember 31, 2000 was .10%. At December 31, 2000, there were no borrowings against this facility.USX has a short-term line of credit totaling $150 million, bearing interest at a defined short-termmarket rate, which at December 31, 2000 was 7.10%. At December 31, 2000, USX had borrowed$150 million against this facility. Certain other banks provide short-term lines of credit totaling$150 million which require a .125% fee or maintenance of compensating balances of 3%. AtDecember 31, 2000, there were no borrowings against these facilities.

U-20
MAP has a $100 million short-term revolving credit facility that terminates in July 2001. Interestis based on defined short-term market rates. During the term of the agreement, MAP is required topay a variable facility fee on total commitments, which at December 31, 2000 was .11%. AtDecember 31, 2000, there were no borrowings against this facility.
USSK has a short-term $50 million credit facility that expires in November 2001. The facility,which is non-recourse to USX, bears interest on prevailing short-term market rates plus 1%. USSK isobligated to pay a .25% commitment fee on undrawn amounts. At December 31, 2000, there were noborrowings against this facility.
14. Long-Term DebtInterest December 31
(In millions) Rates – % Maturity 2000 1999 _______________________________________________________________________________________________USX Corporation:
Revolving credit facility(a) 2005 $ 300 $ 300 Commercial paper(a) 7.68 77 165 Notes payable 613/20 – 94/5 2001 – 2023 2,505 2,525 Obligations relating to Industrial Development and
Environmental Improvement Bonds and Notes(b) 41/4 – 67/8 2009 – 2033 494 494 Receivables facility(c) 2004 350 350 All other obligations, including sale-leaseback
financing and capital leases 2001 – 2012 88 92 Consolidated subsidiaries:
Revolving credit facilities(d) 2001 – 2003 – – USSK loan facility(e) 81/2 2010 325 – Guaranteed Notes 7 2002 135 135 Guaranteed Loan(f) 91/20 2001 – 2006 199 223 Notes payable 81/2 2001 1 1 All other obligations, including capital leases 2001 – 2011 11 26 _______ _______
Total(g)(h) 4,485 4,311 Less unamortized discount 25 28 Less amount due within one year 287 61 _______ _______
Long-term debt due after one year $ 4,173 $ 4,222 _______________________________________________________________________________________________(a) In November 2000, USX entered into a $1,354 million 5-year revolving credit agreement, terminating in
November 2005, which in conjunction with a $451 million 364-day revolving credit agreement, terminating inDecember 2001, replaced the prior $2,350 million facility. Interest on the facility is based on defined short-termmarket rates. During the term of the agreement, USX is obligated to pay a variable facility fee on totalcommitments, which at December 31, 2000 was .125%. At December 31, 2000, $300 million had been borrowedagainst this facility. The commercial paper is supported by the unused and available credit on the 5-year facilityand, accordingly, is classified as long-term debt.
(b) At December 31, 2000, USX had outstanding obligations relating to Environmental Improvement Bonds in theamount of $141 million, which were supported by letter of credit arrangements that could become short-termobligations under certain circumstances.
(c) In December 1999, USX entered into an agreement under which the U. S. Steel Group participates in a programto sell an undivided interest in certain accounts receivable. A previous program expired in October 1999 andwas accounted for as a transfer of receivables. The new program is accounted for as a secured borrowing.Payments are collected from sold accounts receivable and invested in new accounts receivable for the purchaserand a yield, based on short-term market rates, is transferred to the purchaser. If the U. S. Steel Group does nothave sufficient eligible receivables to reinvest for the purchaser, the size of the program is reduced accordingly.The purchaser has a security interest in a pool of receivables to secure USX’s obligations under the program. Ifthe receivables facility is not renewed annually, the balance outstanding of such facility could be refinanced bythe 5-year facility discussed in (a), or another long-term debt source; and therefore, is classified as long-termdebt. The amounts sold under the previous receivables programs averaged $291 million and $347 million for theyears 1999 and 1998, respectively.
(d) MAP has a $400 million revolving credit facility that terminates in July 2003. Interest is based on definedshort-term market rates. During the term of the agreement, MAP is required to pay a variable facility fee ontotal commitments, which at December 31, 2000 was .125%. At December 31, 2000, the unused and availablecredit was $352 million, which reflects reductions for outstanding letters of credit. In the event that MAPdefaults on indebtedness (as defined in the agreement) in excess of $100 million, USX has guaranteed thepayment of any outstanding obligations.
(e) USSK has a loan facility with a group of financial institutions aggregating $325 million. The loan, which is non-recourse to USX, bears interest at a fixed rate of 8.5% per annum. The loan is subject to annual repayments of$20 million beginning in 2003, with the balance due in 2010. Mandatory prepayments of the loan may berequired based upon a cash flow formula or a change in control of USX.
(f) The Guaranteed Loan was used to fund a portion of the costs in connection with the development of the EastBrae Field and the SAGE pipeline in the North Sea. A portion of proceeds from a long-term gas sales contract isdedicated to loan service under certain circumstances. Prepayment of the loan may be required under certainsituations, including events impairing the security interest.
(g) Required payments of long-term debt for the years 2002-2005 are $209 million, $207 million, $710 million and$440 million, respectively.
(h) In the event of a change in control of USX, as defined in the related agreements, debt obligations totaling$3,614 million may be declared immediately due and payable. The principal obligations subject to such aprovision are Notes payable – $2,505 million; USSK loan facility – $325 million; and Guaranteed Loan –$199 million. In such event, USX may also be required to either repurchase the leased Fairfield slab caster for$100 million or provide a letter of credit to secure the remaining obligation.

U-21
15. Inventories
(In millions) December 31 2000 1999_______________________________________________________________________________________________Raw materials $ 915 $ 830 Semi-finished products 429 392 Finished products 1,279 1,239 Supplies and sundry items 190 166 _________ _________
Total (at cost) 2,813 2,627 Less inventory market valuation reserve – – _________ _________
Net inventory carrying value $ 2,813 $ 2,627 _______________________________________________________________________________________________
At December 31, 2000 and 1999, the LIFO method accounted for 92% and 91%, respectively, oftotal inventory value. Current acquisition costs were estimated to exceed the above inventory values atDecember 31 by approximately $880 million and $570 million in 2000 and 1999, respectively. Cost ofrevenues was reduced and income from operations was increased by $17 million in 2000 as a result ofliquidations of LIFO inventories.
The inventory market valuation reserve reflects the extent that the recorded LIFO cost basis ofcrude oil and refined products inventories exceeds net realizable value. The reserve is decreased toreflect increases in market prices and inventory turnover and increased to reflect decreases in marketprices. Changes in the inventory market valuation reserve result in noncash charges or credits to costsand expenses. During 2000, there were no charges or credits to costs and expenses.
16. Supplemental Cash Flow Information
(In millions) 2000 1999 1998_______________________________________________________________________________________________Cash used in operating activities included:
Interest and other financial costs paid(net of amount capitalized) $ (341) $ (366) $ (336)
Income taxes paid (387) (98) (183)_______________________________________________________________________________________________Commercial paper and revolving credit arrangements – net:
Commercial paper – issued $ 3,362 $ 6,282 $ – – repayments (3,450) (6,117) –
Credit agreements – borrowings 437 5,529 17,486 – repayments (437) (5,980) (16,817)
Other credit arrangements – net 150 (95) 55 __________ _________ _________Total $ 62 $ (381) $ 724 _______________________________________________________________________________________________
Noncash investing and financing activities:Common stock issued for dividend reinvestment and
employee stock plans $ 15 $ 6 $ 5 Marathon Stock issued for Exchangeable Shares – 7 11 Investee preferred stock received in conversion of investee loan – 142 – Disposal of assets:
Exchange of Sakhalin Energy investment 410 – – Deposit of RTI common shares in satisfaction of indexed debt – 56 – Interest in USS/Kobe contributed to Republic – 40 – Other – notes or common stock received 20 20 2
Business combinations:Acquisition of USSK:
Liabilities assumed 568 – – Contingent consideration payable at present value 21 – – Investee liabilities consolidated in step acquisition 3 – –
Acquisition of Tarragon:Exchangeable Shares issued – – 29 Liabilities assumed – – 433
Acquisition of Ashland RM&T net assets:38% interest in MAP – – 1,900 Liabilities assumed – – 1,038
Other acquisitions:Liabilities assumed – 42 – Investee liabilities consolidated in step acquisition – 26 – _______________________________________________________________________________________________

U-22
17. Stock-Based Compensation Plans
The 1990 Stock Plan, as amended and restated, authorizes the Compensation Committee of the Boardof Directors to grant restricted stock, stock options and stock appreciation rights to key managementemployees. Such employees are generally granted awards of the class of common stock intended toreflect the performance of the group(s) to which their work relates. Up to .5 percent of the outstandingMarathon Stock and .8 percent of the outstanding Steel Stock, as determined on December 31 of thepreceding year, are available for grants during each calendar year the 1990 Plan is in effect. Inaddition, awarded shares that do not result in shares being issued are available for subsequent grant,and any ungranted shares from prior years’ annual allocations are available for subsequent grantduring the years the 1990 Plan is in effect. As of December 31, 2000, 8,519,302 Marathon Stock sharesand 2,108,128 Steel Stock shares were available for grants in 2001.
Restricted stock represents stock granted for such consideration, if any, as determined by theCompensation Committee, subject to provisions for forfeiture and restricting transfer. Thoserestrictions may be removed as conditions such as performance, continuous service and other criteriaare met. Restricted stock is issued at the market price per share at the date of grant and vests overservice periods that range from one to five years.
Deferred compensation is charged to stockholders’ equity when the restricted stock is granted andsubsequently adjusted for changes in the market value of the underlying stock. The deferredcompensation is expensed over the balance of the vesting period and adjusted if conditions of therestricted stock grant are not met.
The following table presents information on restricted stock grants:Marathon Stock Steel Stock_______________________________ _______________________________
2000 1999 1998 2000 1999 1998_______________________________________________________________________________________________Number of shares granted 410,025 28,798 25,378 305,725 18,272 17,742 Weighted-average grant-date fair value per share $ 25.50 $ 29.38 $ 34.00 $ 23.00 $ 28.22 $ 37.28 _______________________________________________________________________________________________
Stock options represent the right to purchase shares of Marathon Stock or Steel Stock at themarket value of the stock at date of grant. Certain options contain the right to receive cash and/orcommon stock equal to the excess of the fair market value of shares of common stock, as determined inaccordance with the plan, over the option price of shares. Most stock options vest after aone-year service period and all expire 10 years from the date they are granted.
The following is a summary of stock option activity:Marathon Stock Steel Stock_____________________ ____________________
Shares Price(a) Shares Price(a)_______________________________________________________________________________________________Balance December 31, 1997 3,694,865 $ 24.81 1,633,100 $ 34.35 Granted 987,535 34.00 611,515 37.28 Exercised (594,260) 27.61 (230,805) 32.00 Canceled (13,200) 27.22 (21,240) 35.89 __________ __________Balance December 31, 1998 4,074,940 26.62 1,992,570 35.50 Granted 1,005,000 29.38 656,400 28.22 Exercised (176,160) 27.27 (2,580) 24.92 Canceled (121,055) 30.19 (20,005) 38.51 __________ __________Balance December 31, 1999 4,782,725 27.08 2,626,385 33.67 Granted 1,799,880 25.18 915,470 23.00 Exercised (58,870) 23.11 (400) 24.30 Canceled (410,115) 28.06 (62,955) 38.19 __________ __________Balance December 31, 2000 6,113,620 26.50 3,478,500 30.78 _______________________________________________________________________________________________(a) Weighted-average exercise price
The weighted-average grant-date fair value per option for the Marathon Stock was $7.51 in 2000,$8.89 in 1999 and $10.43 in 1998. For the Steel Stock such amounts were $6.63 in 2000, $6.95 in 1999and $8.29 in 1998.
The following table represents stock options at December 31, 2000:Outstanding Exercisable________________________________________ _________________________Weighted-
Number Average Weighted- Number Weighted-Range of of Shares Remaining Average of Shares AverageExercise Under Contractual Exercise Under ExercisePrices Option Life Price Option Price_______________________________________________________________________________________________
Marathon Stock $ 17.00–23.44 1,947,290 4.5 years $21.03 1,647,290 $20.6025.38–26.47 1,512,905 8.6 25.53 135,225 25.3829.38–34.00 2,653,425 7.5 31.06 2,653,425 31.06__________ __________ Total 6,113,620 4,435,940__________ __________
Steel Stock $ 23.00–28.22 1,592,305 8.8 years $25.17 678,135 $28.1031.69–34.44 1,050,920 5.2 32.53 1,050,920 32.5337.28–44.19 835,275 6.0 39.26 835,275 39.26__________ __________ Total 3,478,500 2,564,330_______________________________________________________________________________________________

U-23
Actual stock-based compensation expense (credit) was $6 million in 2000 and $(3) million in 1999and 1998. Incremental compensation expense, as determined under a fair value model, was notmaterial ($.02 or less per share for all years presented). Therefore, pro forma net income and earningsper share data have been omitted.
USX has a deferred compensation plan for non-employee directors of its Board of Directors. Theplan permits participants to defer some or all of their annual retainers in the form of common stockunits or cash and it requires new directors to defer at least half of their annual retainer in the form ofcommon stock units. Common stock units are book entry units equal in value to a share of MarathonStock or Steel Stock. Deferred stock benefits are distributed in shares of common stock within fivebusiness days after a participant leaves the Board of Directors. During 2000, 14,242 shares ofMarathon Stock and 4,872 shares of Steel Stock were issued and during 1999, 10,541 shares ofMarathon Stock and 3,798 shares of Steel Stock were issued. During 1998, no shares of common stockwere issued.
18. Dividends
In accordance with the USX Certificate, dividends on the Marathon Stock and Steel Stock are limitedto the legally available funds of USX. Net losses of any Group, as well as dividends and distributionson any class of USX Common Stock or series of preferred stock and repurchases of any class of USXCommon Stock or series of preferred stock at prices in excess of par or stated value, will reduce thefunds of USX legally available for payment of dividends on all classes of Common Stock. Subject to thislimitation, the Board of Directors intends to declare and pay dividends on the Marathon Stock andSteel Stock based on the financial condition and results of operations of the related group, although ithas no obligation under Delaware law to do so. In making its dividend decisions with respect to each ofthe Marathon Stock and Steel Stock, the Board of Directors considers, among other things, the long-term earnings and cash flow capabilities of the related group as well as the dividend policies of similarpublicly traded companies.
Dividends on the Steel Stock are further limited to the Available Steel Dividend Amount. AtDecember 31, 2000, the Available Steel Dividend Amount was at least $3,161 million. The AvailableSteel Dividend Amount will be increased or decreased, as appropriate, to reflect U. S. Steel Group netincome, dividends, repurchases or issuances with respect to the Steel Stock and preferred stockattributed to the U. S. Steel Group and certain other items.
19. Stockholder Rights Plan
On September 28, 1999, USX’s Board of Directors adopted a new Stockholder Rights Plan and declareda dividend distribution of one right for each outstanding share of Marathon Stock and Steel Stock(referred to together as “Voting Stock”) to stockholders of record on October 9, 1999. Each rightbecomes exercisable, at a price of $110, after any person or group has acquired, obtained the right toacquire or made a tender or exchange offer for 15% or more of the outstanding voting powerrepresented by the outstanding Voting Stock, except pursuant to a qualifying all-cash tender offer forall outstanding shares of Voting Stock which results in the offeror owning shares of Voting Stockrepresenting a majority of the voting power (other than Voting Stock beneficially owned by the offerorimmediately prior to the offer). Each right entitles the holder, other than the acquiring person orgroup, to purchase one one-hundredth of a share of Series A Junior Preferred Stock or, upon theacquisition by any person of 15% or more of the outstanding voting power represented by theoutstanding Voting Stock, Marathon Stock or Steel Stock (or, in certain circumstances, other property)having a market value of twice the exercise price. After a person or group acquires 15% or more of theoutstanding voting power, if USX engages in a merger or other business combination where it is notthe surviving corporation or where it is the surviving corporation and the Voting Stock is changed orexchanged, or if 50% or more of USX’s assets, earnings power or cash flow are sold or transferred, eachright entitles the holder to purchase common stock of the acquiring entity having a market value oftwice the exercise price. The rights and the exercise price are subject to adjustment. The rights willexpire on October 9, 2009, unless such date is extended or the rights are earlier redeemed by USX forone cent per right at any time prior to the point they become exercisable. Under certain circumstances,the Board of Directors has the option to exchange one share of the respective class of Voting Stock foreach exercisable right.

U-24
20. Income Per Common Share
The method of calculating net income (loss) per share for the Marathon Stock and the Steel Stockreflects the USX Board of Directors’ intent that the separately reported earnings and surplus of theMarathon Group and the U. S. Steel Group, as determined consistent with the USX Certificate, areavailable for payment of dividends on the respective classes of stock, although legally available fundsand liquidation preferences of these classes of stock do not necessarily correspond with these amounts.The financial statements of the Marathon Group and the U. S. Steel Group, taken together, include allaccounts which comprise the corresponding consolidated financial statements of USX.
Basic net income (loss) per share is calculated by adjusting net income for dividend requirementsof preferred stock and is based on the weighted average number of common shares outstanding.
Diluted net income (loss) per share assumes conversion of convertible securities for the applicableperiods outstanding and assumes exercise of stock options, provided in each case, the effect is notantidilutive.
COMPUTATION OF INCOME PER SHARE
2000 1999 1998__________________ __________________ __________________Basic Diluted Basic Diluted Basic Diluted______ ________ ______ _______ ______ _______________________________________________________________________________________________________________
Marathon GroupNet income (millions) $ 432 $ 432 $ 654 $ 654 $ 310 $ 310 _________ _________ _________ _________ _________ __________________ _________ _________ _________ _________ _________Shares of common stock outstanding (thousands):
Average number of common shares outstanding 311,531 311,531 309,696 309,696 292,876 292,876 Effect of dilutive securities –
Stock options – 230 – 314 – 559 _________ _________ _________ _________ _________ _________Average common shares and dilutive effect 311,531 311,761 309,696 310,010 292,876 293,435 _________ _________ _________ _________ _________ __________________ _________ _________ _________ _________ _________
Net income per share $ 1.39 $ 1.39 $ 2.11 $ 2.11 $ 1.06 $ 1.05 ________________________________________________________________________________________________________U. S. Steel GroupNet income (loss) (millions):
Income (loss) before extraordinary losses $ (21) $ (21) $ 51 $ 51 $ 364 $ 364 Dividends on preferred stock 8 8 9 9 9 – Extraordinary losses – – 7 7 – – _________ _________ _________ _________ _________ _________Net income (loss) applicable to Steel Stock (29) (29) 35 35 355 364 Effect of dilutive securities –
Trust preferred securities – – – – – 8 _________ _________ _________ _________ _________ _________Net income (loss) assuming conversions $ (29) $ (29) $ 35 $ 35 $ 355 $ 372 _________ _________ _________ _________ _________ __________________ _________ _________ _________ _________ _________
Shares of common stock outstanding (thousands):Average number of common shares outstanding 88,613 88,613 88,392 88,392 87,508 87,508 Effect of dilutive securities:
Trust preferred securities – – – – – 4,256 Preferred stock – – – – – 3,143 Stock options – – – 4 – 36 _________ _________ _________ _________ _________ _________
Average common shares and dilutive effect 88,613 88,613 88,392 88,396 87,508 94,943 _________ _________ _________ _________ _________ __________________ _________ _________ _________ _________ _________Per share:
Income (loss) before extraordinary losses $ (.33) $ (.33) $ .48 $ .48 $ 4.05 $ 3.92 Extraordinary losses – – .08 .08 – – _________ _________ _________ _________ _________ _________Net income (loss) $ (.33) $ (.33) $ .40 $ .40 $ 4.05 $ 3.92 ________________________________________________________________________________________________________
21. Property, Plant and Equipment
(In millions) December 31 2000 1999_______________________________________________________________________________________________Marathon Group $ 19,066 $ 20,860 U. S. Steel Group 9,270 8,748 _________ _________
Total 28,336 29,608 Less accumulated depreciation, depletion and amortization 16,222 16,799 _________ _________
Net $ 12,114 $ 12,809 _______________________________________________________________________________________________
Property, plant and equipment includes gross assets acquired under capital leases (including sale-leasebacks accounted for as financings) of $106 million at December 31, 2000, and $125 million atDecember 31, 1999; related amounts in accumulated depreciation, depletion and amortization were$79 million and $81 million, respectively.
During 2000, the U. S. Steel Group recorded $71 million of impairments relating to coal assetslocated in West Virginia and Alabama. The impairment was recorded as a result of a reassessment oflong-term prospects after adverse geological conditions were encountered.
During 2000, the Marathon Group recorded $193 million of impairments of certain E&P segmentoil and gas properties, primarily located in Canada. The impairments were recorded due to reserverevisions as a result of production performance and disappointing drilling results.
These impairment charges are included in depreciation, depletion and amortization.

U-25
22. Preferred Stock of Subsidiary and Trust Preferred Securities
USX Capital LLC, a wholly owned subsidiary of USX, sold 10,000,000 shares (carrying value of$250 million) of 83/4% Cumulative Monthly Income Preferred Shares (MIPS) (liquidation preference of$25 per share) in 1994. Proceeds of the issue were loaned to USX. USX has the right under the loanagreement to extend interest payment periods for up to 18 months, and as a consequence, monthlydividend payments on the MIPS can be deferred by USX Capital LLC during any such interestpayment period. In the event that USX exercises this right, USX may not declare dividends on anyshare of its preferred or common stocks. The MIPS are redeemable at the option of USX Capital LLCand subject to the prior consent of USX, in whole or in part from time to time, for $25 per share, andwill be redeemed from the proceeds of any repayment of the loan by USX. In addition, upon finalmaturity of the loan, USX Capital LLC is required to redeem the MIPS. The financial costs areincluded in net interest and other financial costs.
In 1997, USX exchanged approximately 3.9 million 6.75% Convertible Quarterly Income PreferredSecurities (Trust Preferred Securities) of USX Capital Trust I, a Delaware statutory business trust(Trust), for an equivalent number of shares of its 6.50% Cumulative Convertible Preferred Stock(6.50% Preferred Stock) (Exchange). The Exchange resulted in the recording of Trust PreferredSecurities at a fair value of $182 million.
USX owns all of the common securities of the Trust, which was formed for the purpose of theExchange. (The Trust Common Securities and the Trust Preferred Securities are together referred toas the Trust Securities.) The Trust Securities represent undivided beneficial ownership interests in theassets of the Trust, which consist solely of USX 6.75% Convertible Junior Subordinated Debenturesmaturing March 31, 2037 (Debentures), having an aggregate principal amount equal to the aggregateinitial liquidation amount ($50.00 per security and $203 million in total) of the Trust Securities issuedby the Trust. Interest and principal payments on the Debentures will be used to make quarterlydistributions and to pay redemption and liquidation amounts on the Trust Preferred Securities. Thequarterly distributions, which accumulate at the rate of 6.75% per annum on the Trust PreferredSecurities and the accretion from fair value to the initial liquidation amount, are charged to incomeand included in net interest and other financial costs.
Under the terms of the Debentures, USX has the right to defer payment of interest for up to 20consecutive quarters and, as a consequence, monthly distributions on the Trust Preferred Securitieswill be deferred during such period. If USX exercises this right, then, subject to limited exceptions, itmay not pay any dividend or make any distribution with respect to any shares of its capital stock.
The Trust Preferred Securities are convertible at any time prior to the close of business onMarch 31, 2037 (unless such right is terminated earlier under certain circumstances) at the option ofthe holder, into shares of Steel Stock at a conversion price of $46.25 per share of Steel Stock(equivalent to a conversion ratio of 1.081 shares of Steel Stock for each Trust Preferred Security),subject to adjustment in certain circumstances.
The Trust Preferred Securities may be redeemed at any time at the option of USX, at a premiumof 101.95% of the initial liquidation amount through March 31, 2001, and thereafter, decliningannually to the initial liquidation amount on April 1, 2003, and thereafter. They are mandatorilyredeemable at March 31, 2037, or earlier under certain circumstances.
Payments related to quarterly distributions and to the payment of redemption and liquidationamounts on the Trust Preferred Securities by the Trust are guaranteed by USX on a subordinatedbasis. In addition, USX unconditionally guarantees the Trust’s Debentures. The obligations of USXunder the Debentures, and the related indenture, trust agreement and guarantee constitute a full andunconditional guarantee by USX of the Trust’s obligations under the Trust Preferred Securities.
23. Preferred Stock
USX is authorized to issue 40,000,000 shares of preferred stock, without par value –
6.50% Cumulative Convertible Preferred Stock (6.50% Preferred Stock) – As of December 31,2000, 2,413,487 shares (stated value of $1.00 per share; liquidation preference of $50.00 per share)were outstanding. The 6.50% Preferred Stock is convertible at any time, at the option of the holder,into shares of Steel Stock at a conversion price of $46.125 per share of Steel Stock, subject toadjustment in certain circumstances. This stock is redeemable at USX’s sole option, at a price of$50.975 per share beginning April 1, 2000, and thereafter at prices declining annually on each April 1to an amount equal to $50.00 per share on and after April 1, 2003.

U-26
24. Derivative Instruments
USX remains at risk for possible changes in the market value of derivative instruments; however, such risk should bemitigated by price changes in the underlying hedged item. USX is also exposed to credit risk in the event of nonperformanceby counterparties. The credit-worthiness of counterparties is subject to continuing review, including the use of master nettingagreements to the extent practical, and full performance is anticipated.
The following table sets forth quantitative information by class of derivative instrument for derivative instrumentscategorized as trading or other than trading:
RecognizedFair Carrying Trading Recorded
Value Amount Gain or Deferred AggregateAssets Assets (Loss) for Gain or Contract
(In millions) (Liabilities)(a)(b) (Liabilities) the Year (Loss) Values( c)____________________________________________________________________________________________________________________December 31, 2000:
Exchange-traded commodity futures:Trading $ – $ – $ (19) $ – $ – Other than trading – – – 7 897
Exchange-traded commodity options:Trading – – – – – Other than trading (6)(d) (6) – (1) 971
OTC commodity swaps(e):Trading – – – – – Other than trading 35 (f) 35 – 25 426
OTC commodity options:Trading – – – – – Other than trading (52)(g) (52) – (40) 94 ________ ________ ________ ________ ________
Total commodities $ (23) $ (23) $ (19) $ (9) $ 2,388 ________ ________ ________ ________ ________________ ________ ________ ________ ________Forward exchange contracts(h):
– receivable $ 14 $ 14 $ – $ – $ 14 ____________________________________________________________________________________________________________________December 31, 1999:
Exchange-traded commodity futures:Trading $ – $ – $ 4 $ – $ 8 Other than trading – – – 28 344
Exchange-traded commodity options:Trading – – 4 – 179 Other than trading (6)(d) (6) – (10) 1,262
OTC commodity swaps:Trading – – – – – Other than trading 6 (f) 6 – 5 193
OTC commodity options:Trading – – – – – Other than trading 4 (g) 4 – 5 238 ________ ________ ________ ________ ________
Total commodities $ 4 $ 4 $ 8 $ 28 $ 2,224 ________ ________ ________ ________ ________________ ________ ________ ________ ________Forward exchange contracts:
– receivable $ 52 $ 52 $ – $ – $ 51 ____________________________________________________________________________________________________________________(a) The fair value amounts for OTC positions are based on various indices or dealer quotes. The fair value amounts for currency contracts are
based on dealer quotes of forward prices covering the remaining duration of the forward exchange contract. The exchange-traded futurescontracts and certain option contracts do not have a corresponding fair value since changes in the market prices are settled on a daily basis.
(b) The aggregate average fair value of all trading activities for 2000 and 1999 was $(5) million and $3 million, respectively. Detail by class ofinstrument was not available.
(c) Contract or notional amounts do not quantify risk exposure, but are used in the calculation of cash settlements under the contracts. Thecontract or notional amounts do not reflect the extent to which positions may offset one another.
(d) Includes fair values as of December 31, 2000 and 1999, for assets of $10 million and $11 million and for liabilities of $(16) million and$(17) million, respectively.
(e) The OTC swap arrangements vary in duration with certain contracts extending into 2008.(f) Includes fair values as of December 31, 2000 and 1999, for assets of $84 million and $11 million and for liabilities of $(49) million and
$(5) million, respectively.(g) Includes fair values as of December 31, 2000 and 1999, for assets of $1 million and $5 million and for liabilities of $(53) million and
$(1) million, respectively.(h) The forward exchange contracts relating to USX’s foreign operations have various maturities ending in March 2001.

U-27
25. Fair Value of Financial Instruments
Fair value of the financial instruments disclosed herein is not necessarily representative of the amountthat could be realized or settled, nor does the fair value amount consider the tax consequences ofrealization or settlement. The following table summarizes financial instruments, excluding derivativefinancial instruments disclosed in Note 24, by individual balance sheet account:
2000 1999_________________________ ________________________Fair Carrying Fair Carrying
(In millions) December 31 Value Amount Value Amount_______________________________________________________________________________________________Financial assets:
Cash and cash equivalents $ 559 $ 559 $ 133 $ 133 Receivables 3,238 3,238 2,717 2,717 Investments and long-term receivables 211 147 190 134 ________ ________ ________ ________
Total financial assets $ 4,008 $ 3,944 $ 3,040 $ 2,984 _______________________________________________________________________________________________Financial liabilities:
Notes payable $ 150 $ 150 $ – $ – Accounts payable 3,774 3,774 3,409 3,409 Accrued interest 108 108 107 107 Long-term debt (including amounts due within one year) 4,549 4,365 4,278 4,176 Preferred stock of subsidiary and trust preferred securities 357 433 408 433 ________ ________ ________ ________
Total financial liabilities $ 8,938 $ 8,830 $ 8,202 $ 8,125 _______________________________________________________________________________________________
Fair value of financial instruments classified as current assets or liabilities approximates carryingvalue due to the short-term maturity of the instruments. Fair value of investments and long-termreceivables was based on discounted cash flows or other specific instrument analysis. Certain foreigncost method investments are excluded from investments and long-term receivables because the fairvalue is not readily determinable. USX is subject to market risk and liquidity risk related to itsinvestments; however, these risks are not readily quantifiable. Fair value of preferred stock ofsubsidiary and trust preferred securities was based on market prices. Fair value of long-term debtinstruments was based on market prices where available or current borrowing rates available forfinancings with similar terms and maturities.
USX’s only unrecognized financial instruments are financial guarantees and commitments toextend credit. It is not practicable to estimate the fair value of these forms of financial instrumentobligations because there are no quoted market prices for transactions which are similar in nature. Fordetails relating to financial guarantees, see Note 26.
26. Contingencies and Commitments
USX is the subject of, or party to, a number of pending or threatened legal actions, contingencies andcommitments involving a variety of matters, including laws and regulations relating to theenvironment. Certain of these matters are discussed below. The ultimate resolution of thesecontingencies could, individually or in the aggregate, be material to the consolidated financialstatements. However, management believes that USX will remain a viable and competitive enterpriseeven though it is possible that these contingencies could be resolved unfavorably.
Environmental matters –USX is subject to federal, state, local and foreign laws and regulations relating to the
environment. These laws generally provide for control of pollutants released into the environment andrequire responsible parties to undertake remediation of hazardous waste disposal sites. Penalties maybe imposed for noncompliance. At December 31, 2000 and 1999, accrued liabilities for remediationtotaled $212 million and $170 million, respectively. It is not presently possible to estimate theultimate amount of all remediation costs that might be incurred or the penalties that may be imposed.Receivables for recoverable costs from certain states, under programs to assist companies in cleanupefforts related to underground storage tanks at retail marketing outlets, were $57 million atDecember 31, 2000, and $52 million at December 31, 1999.
For a number of years, USX has made substantial capital expenditures to bring existing facilitiesinto compliance with various laws relating to the environment. In 2000 and 1999, such capitalexpenditures totaled $91 million and $78 million, respectively. USX anticipates making additionalsuch expenditures in the future; however, the exact amounts and timing of such expenditures areuncertain because of the continuing evolution of specific regulatory requirements.
At December 31, 2000 and 1999, accrued liabilities for platform abandonment and dismantlementtotaled $162 million and $152 million, respectively.

U-28
Guarantees –Guarantees of the liabilities of unconsolidated entities by USX and its consolidated subsidiaries
totaled $82 million at December 31, 2000, and $219 million at December 31, 1999. In the event thatany defaults of guaranteed liabilities occur, USX has access to its interest in the assets of most of theinvestees to reduce potential losses resulting from these guarantees. As of December 31, 2000, thelargest guarantee for a single such entity was $59 million.
At December 31, 2000 and 1999, USX’s pro rata share of obligations of LOOP LLC and variouspipeline investees secured by throughput and deficiency agreements totaled $119 million and$146 million, respectively. Under the agreements, USX is required to advance funds if the investeesare unable to service debt. Any such advances are prepayments of future transportation charges.
Commitments –At December 31, 2000 and 1999, contract commitments to acquire property, plant and equipment
and long-term investments totaled $663 million and $568 million, respectively.USSK has a commitment to the Slovak government for a capital improvements program of
$700 million, subject to certain conditions, over a period commencing with the acquisition date andending on December 31, 2010. USSK is required to report periodically to the Slovak government on itsstatus toward meeting this commitment. The first reporting period ends on December 31, 2003.
USX entered into a 15-year take-or-pay arrangement in 1993, which requires USX to acceptpulverized coal each month or pay a minimum monthly charge of approximately $1 million. Chargesfor deliveries of pulverized coal totaled $23 million in 2000, 1999 and 1998. If USX elects to terminatethe contract early, a maximum termination payment of $96 million, which declines over the durationof the agreement, may be required.
USX is a party to a 15-year transportation services agreement with a natural gas transmissioncompany. The contract requires USX to pay minimum annual demand charges of approximately$5 million starting in December 2000 and concluding in 2015. The payments are required even if thetransportation facility is not utilized. Demand charges paid in 2000 were less than $1 million.
27. Joint Venture Formation
In December 2000, Marathon and Kinder Morgan Energy Partners, L.P. signed a definitive agreementto form a joint venture combining certain of their oil and gas producing activities in the U.S. PermianBasin, including Marathon’s interest in the Yates Field. This transaction will allow Marathon toexpand its interests in the Permian Basin and will improve access to materials for use in enhancedrecovery techniques in the Yates Field. The joint venture named MKM Partners L.P., commencedoperations in January 2001 and will be accounted for under the equity method of accounting.
As a result of the agreement to form this joint venture, Marathon recognized a pretax charge of$931 million in the fourth quarter 2000, which is included in net gains (losses) on disposal of assets,and reclassified the remaining book value associated with the Yates Field from property, plant andequipment to assets held for sale. Upon completion of this transaction in January 2001, the book valuewill be transferred from assets held for sale to investments and long-term receivables.
28. Subsequent Event – Business Combination
On February 7, 2001, Marathon acquired 87% of the outstanding common stock of Pennaco EnergyInc., a natural gas producer. Marathon plans to acquire the remaining Pennaco shares through amerger in which each share of Pennaco common stock, not purchased in the offer and not held bystockholders who have properly exercised dissenters rights under Delaware law, will be converted intothe right to receive the tender offer price in cash, without interest. The purchase price is expected toapproximate $500 million. The acquisition will be accounted for using the purchase method ofaccounting.

U-29
Selected Quarterly Financial Data (Unaudited)
2000 1999______________________________________________ ______________________________________________(In millions, except per share data) 4th Qtr. 3rd Qtr. 2nd Qtr. 1st Qtr. 4th Qtr. 3rd Qtr. 2nd Qtr. 1st Qtr.________________________________________________________________________________________________________Revenues and other income:
Revenues(a) $10,293 $10,607 $10,293 $ 9,307 $ 8,725 $ 7,713 $ 6,649 $ 5,981 Other income (loss) (837) 72 57 122 53 (13) 35 (24)_______ _______ _______ _______ _______ _______ _______ _______ Total 9,456 10,679 10,350 9,429 8,778 7,700 6,684 5,957
Income (loss) from operations (625) 789 972 616 425 535 502 401 Includes: Joint venture formation charges (931) – – – – – – – Inventory market valuation credits – – – – – 136 66 349
Income (loss) beforeextraordinary losses (449) 140 423 297 205 201 189 110
Net income (loss) (449) 140 423 297 205 199 189 105 ________________________________________________________________________________________________________Marathon Stock data:Net income (loss) $ (310) $ 121 $ 367 $ 254 $ 171 $ 230 $ 134 $ 119
Per share – basic and diluted (1.00) .38 1.18 .81 .55 .74 .43 .38 Dividends paid per share .23 .23 .21 .21 .21 .21 .21 .21 Price range of Marathon Stock(b): – Low 25-1/4 23-1/2 22-13/16 20-11/16 23-5/8 28-1/2 25-13/16 19-5/8
– High 30-3/8 29-5/8 29-3/16 27-1/2 30-5/8 33-7/8 32-3/4 31-3/8________________________________________________________________________________________________________Steel Stock data:Income (loss) before
extraordinary lossesapplicable to Steel Stock $ (141) $ 17 $ 54 $ 41 $ 32 $ (31) $ 52 $ (11)– Per share: basic (1.59) .19 .62 .45 .35 (.35) .60 (.13)
diluted (1.59) .19 .62 .45 .35 (.35) .59 (.13)Dividends paid per share .25 .25 .25 .25 .25 .25 .25 .25 Price range of Steel Stock(b):
– Low 12-11/16 14-7/8 18-1/4 20-5/8 21-3/4 24-9/16 23-1/2 22-1/4– High 18-5/16 19-11/16 26-7/8 32-15/16 33 30-1/16 34-1/4 29-1/8________________________________________________________________________________________________________
(a) Certain items have been reclassified between revenues and cost of revenues, primarily to give effect to new accounting standards asdisclosed in Note 2 of the Notes to Consolidated Financial Statements. Amounts reclassified in the first, second and third quarters of 2000were $(65) million, $(138) million and $(14) million, respectively, and for the first, second, third and fourth quarters of 1999 were$(97) million, $(82) million, $(113) million and $(172) million, respectively.
(b) Composite tape.
USX

U-30
Principal Unconsolidated Investees (Unaudited)December 31, 2000
Company Country Ownership Activity________________________________________________________________________________________________________Clairton 1314B Partnership, L.P. United States 10% Coke & Coke By-ProductsCLAM Petroleum B.V. Netherlands 50% Oil & Gas ProductionDouble Eagle Steel Coating Company United States 50% Steel ProcessingKenai LNG Corporation United States 30% Natural Gas LiquificationLOCAP, Inc. United States 50% (a) Pipeline & Storage FacilitiesLOOP LLC United States 47% (a) Offshore Oil PortManta Ray Offshore Gathering Company, LLC United States 24% Natural Gas TransmissionMinnesota Pipe Line Company United States 33% (a) Pipeline FacilityNautilus Pipeline Company, LLC United States 24% Natural Gas TransmissionOdyssey Pipeline LLC United States 29% Pipeline FacilityPoseidon Oil Pipeline Company, LLC United States 28% Crude Oil TransportationPRO-TEC Coating Company United States 50% Steel ProcessingRepublic Technologies International, LLC United States 16% Steel ProductsTranstar, Inc. United States 46% TransportationUSS-POSCO Industries United States 50% Steel ProcessingWorthington Specialty Processing United States 50% Steel Processing________________________________________________________________________________________________________(a) Represents the ownership of MAP.
Supplementary Information on Mineral Reserves (Unaudited)Mineral Reserves (other than oil and gas)
Reserves at December 31(a) Production_________________________________________ __________________________________(Million tons) 2000 1999 1998 1997 1996 2000 1999 1998 1997 1996________________________________________________________________________________________________________Iron(b) 709.8 726.1 738.6 754.8 716.3 16.3 14.3 15.8 16.8 15.1Coal(c) 786.6 787.4 789.7 798.8 859.5 5.5 6.2 7.3 7.5 7.1________________________________________________________________________________________________________(a) Commercially recoverable reserves include demonstrated (measured and indicated) quantities which are expressed in recoverable net
product tons.(b) Iron ore reserves decreased in 2000, 1999 and 1998 due to production, lease activity and engineering revisions. The increase in 1997
resulted from lease exchanges of 55.3 million tons.(c) Coal reserves decreased due to production, lease activity and engineering revisions, and additionally in 1997 due to a 53.2 million ton
lease termination.
Supplementary Information on Oil and Gas Producing Activities (Unaudited)Capitalized Costs and Accumulated Depreciation, Depletion and Amortization
United Other Equity(In millions) December 31 States Europe Intl. Consolidated Investees Total_______________________________________________________________________________________________________2000
Capitalized costs:Proved properties $ 5,752 $ 4,739 $ 1,373 $ 11,864 $ 226 $ 12,090 Unproved properties 343 124 180 647 2 649 _________ _________ _________ _________ _________ _________
Total 6,095 4,863 1,553 12,511 228 12,739 _________ _________ _________ _________ _________ _________Accumulated depreciation,
depletion and amortization:Proved properties 3,435 3,074 420 6,929 170 7,099 Unproved properties 107 – 13 120 1 121 _________ _________ _________ _________ _________ _________
Total 3,542 3,074 433 7,049 171 7,220 _________ _________ _________ _________ _________ _________Net capitalized costs $ 2,553 $ 1,789 $ 1,120 $ 5,462 $ 57 $ 5,519 _______________________________________________________________________________________________________
1999Capitalized costs:
Proved properties $ 8,270 $ 4,465 $ 1,270 $ 14,005 $ 612 $ 14,617 Unproved properties 349 55 187 591 123 714 _________ _________ _________ _________ _________ _________
Total 8,619 4,520 1,457 14,596 735 15,331 _________ _________ _________ _________ _________ _________Accumulated depreciation,
depletion and amortization:Proved properties 5,019 2,859 136 8,014 169 8,183 Unproved properties 78 – 6 84 – 84 _________ _________ _________ _________ _________ _________
Total 5,097 2,859 142 8,098 169 8,267 _________ _________ _________ _________ _________ _________Net capitalized costs $ 3,522 $ 1,661 $ 1,315 $ 6,498 $ 566 $ 7,064 _______________________________________________________________________________________________________
USX
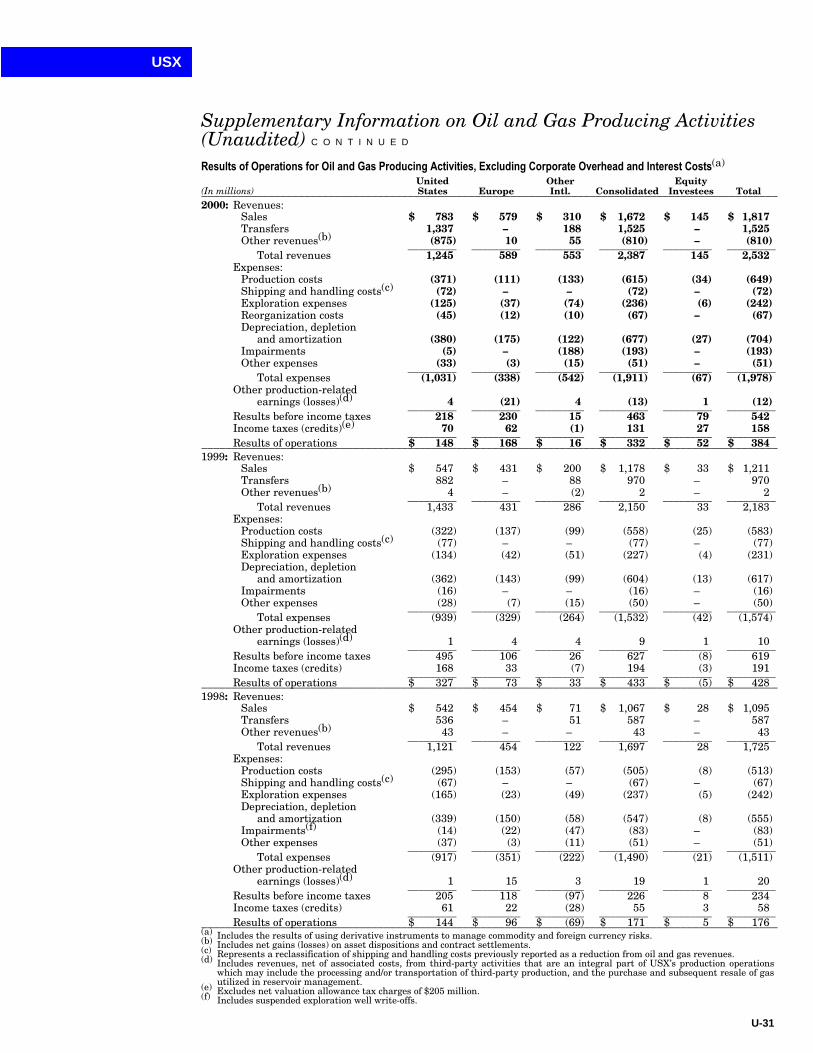
U-31
Supplementary Information on Oil and Gas Producing Activities(Unaudited) C O N T I N U E D
Results of Operations for Oil and Gas Producing Activities, Excluding Corporate Overhead and Interest Costs(a)
United Other Equity(In millions) States Europe Intl. Consolidated Investees Total_______________________________________________________________________________________________2000: Revenues:
Sales $ 783 $ 579 $ 310 $ 1,672 $ 145 $ 1,817 Transfers 1,337 – 188 1,525 – 1,525 Other revenues(b) (875) 10 55 (810) – (810)_________ _________ _________ _________ _________ _________
Total revenues 1,245 589 553 2,387 145 2,532 Expenses:
Production costs (371) (111) (133) (615) (34) (649)Shipping and handling costs(c) (72) – – (72) – (72)Exploration expenses (125) (37) (74) (236) (6) (242)Reorganization costs (45) (12) (10) (67) – (67)Depreciation, depletion
and amortization (380) (175) (122) (677) (27) (704)Impairments (5) – (188) (193) – (193)Other expenses (33) (3) (15) (51) – (51)_________ _________ _________ _________ _________ _________
Total expenses (1,031) (338) (542) (1,911) (67) (1,978)Other production-related
earnings (losses)(d) 4 (21) 4 (13) 1 (12)_________ _________ _________ _________ _________ _________Results before income taxes 218 230 15 463 79 542 Income taxes (credits)(e) 70 62 (1) 131 27 158 _________ _________ _________ _________ _________ _________Results of operations $ 148 $ 168 $ 16 $ 332 $ 52 $ 384 _______________________________________________________________________________________________
1999: Revenues:Sales $ 547 $ 431 $ 200 $ 1,178 $ 33 $ 1,211 Transfers 882 – 88 970 – 970 Other revenues(b) 4 – (2) 2 – 2 _________ _________ _________ _________ _________ _________
Total revenues 1,433 431 286 2,150 33 2,183 Expenses:
Production costs (322) (137) (99) (558) (25) (583)Shipping and handling costs(c) (77) – – (77) – (77)Exploration expenses (134) (42) (51) (227) (4) (231)Depreciation, depletion
and amortization (362) (143) (99) (604) (13) (617)Impairments (16) – – (16) – (16)Other expenses (28) (7) (15) (50) – (50)_________ _________ _________ _________ _________ _________
Total expenses (939) (329) (264) (1,532) (42) (1,574)Other production-related
earnings (losses)(d) 1 4 4 9 1 10 _________ _________ _________ _________ _________ _________Results before income taxes 495 106 26 627 (8) 619 Income taxes (credits) 168 33 (7) 194 (3) 191 _________ _________ _________ _________ _________ _________Results of operations $ 327 $ 73 $ 33 $ 433 $ (5) $ 428 _______________________________________________________________________________________________
1998: Revenues:Sales $ 542 $ 454 $ 71 $ 1,067 $ 28 $ 1,095 Transfers 536 – 51 587 – 587 Other revenues(b) 43 – – 43 – 43 _________ _________ _________ _________ _________ _________
Total revenues 1,121 454 122 1,697 28 1,725 Expenses:
Production costs (295) (153) (57) (505) (8) (513)Shipping and handling costs(c) (67) – – (67) – (67)Exploration expenses (165) (23) (49) (237) (5) (242)Depreciation, depletion
and amortization (339) (150) (58) (547) (8) (555)Impairments(f) (14) (22) (47) (83) – (83)Other expenses (37) (3) (11) (51) – (51)_________ _________ _________ _________ _________ _________
Total expenses (917) (351) (222) (1,490) (21) (1,511)Other production-related
earnings (losses)(d) 1 15 3 19 1 20 _________ _________ _________ _________ _________ _________Results before income taxes 205 118 (97) 226 8 234 Income taxes (credits) 61 22 (28) 55 3 58 _________ _________ _________ _________ _________ _________Results of operations $ 144 $ 96 $ (69) $ 171 $ 5 $ 176 _______________________________________________________________________________________________
(a) Includes the results of using derivative instruments to manage commodity and foreign currency risks.(b) Includes net gains (losses) on asset dispositions and contract settlements.(c) Represents a reclassification of shipping and handling costs previously reported as a reduction from oil and gas revenues.(d) Includes revenues, net of associated costs, from third-party activities that are an integral part of USX’s production operationswhich may include the processing and/or transportation of third-party production, and the purchase and subsequent resale of gasutilized in reservoir management.(e) Excludes net valuation allowance tax charges of $205 million.(f) Includes suspended exploration well write-offs.
USX

U-32
Supplementary Information on Oil and Gas Producing Activities(Unaudited) C O N T I N U E D
Costs Incurred for Property Acquisition, Exploration and Development – Including Capital ExpendituresUnited Other Equity
(In millions) States Europe Intl. Consolidated Investees Total_______________________________________________________________________________________________2000: Property acquisition:
Proved $ 128 $ – $ 12 $ 140 $ – $ 140 Unproved (5)(a) – 10 5 – 5
Exploration 161 33 93 287 2 289 Development 288 42 103 433 77 510 _______________________________________________________________________________________________
1999: Property acquisition:Proved $ 20 $ – $ 10 $ 30 $ – $ 30 Unproved 26 12 107 145 – 145
Exploration 141 47 64 252 8 260 Development 232 34 117 383 84 467 _______________________________________________________________________________________________
1998: Property acquisition:Proved $ 3 $ 3 $ 1,051 $ 1,057 $ – $ 1,057 Unproved 82 – 57 139 – 139
Exploration 217 39 75 331 11 342 Development 431 39 46 516 165 681 _______________________________________________________________________________________________
(a) Includes proceeds of $25 million realized from the reduction of mineral interests.
Estimated Quantities of Proved Oil and Gas ReservesThe following estimates of net reserves have been determined by deducting royalties of various
kinds from USX’s gross reserves. The reserve estimates are believed to be reasonable and consistentwith presently known physical data concerning size and character of the reservoirs and are subject tochange as additional knowledge concerning the reservoirs becomes available. The estimates includeonly such reserves as can reasonably be classified as proved; they do not include reserves which maybe found by extension of proved areas or reserves recoverable by secondary or tertiary recoverymethods unless these methods are in operation and are showing successful results. Undevelopedreserves consist of reserves to be recovered from future wells on undrilled acreage or from existingwells where relatively major expenditures will be required to realize production. USX did not have anyquantities of oil and gas reserves subject to long-term supply agreements with foreign governments orauthorities in which USX acts as producer.
United Other Equity(Millions of barrels) States Europe Intl. Consolidated Investees Total_______________________________________________________________________________________________Liquid Hydrocarbons
Proved developed and undeveloped reserves:
Beginning of year – 1998 590 161 26 777 82 859 Purchase of reserves in place 1 – 156 157 – 157 Revisions of previous estimates (1) (28) 1 (28) (2) (30)Improved recovery 3 – – 3 – 3 Extensions, discoveries and other additions 10 4 18 32 – 32 Production (49) (15) (7) (71) – (71)Sales of reserves in place (5) – – (5) – (5)________ ________ ________ ________ ________ ________End of year – 1998 549 122 194 865 80 945 Purchase of reserves in place 14 – 7 21 – 21 Revisions of previous estimates 2 (20) – (18) (3) (21)Improved recovery 11 – 1 12 – 12 Extensions, discoveries and other additions 9 – 5 14 – 14 Production (53) (12) (11) (76) – (76)Sales of reserves in place (12) – (9) (21) – (21)________ ________ ________ ________ ________ ________End of year – 1999 520 90 187 797 77 874 Purchase of reserves in place 27 – – 27 – 27 Exchange of interest(a) 6 60 – 66 (73) (7)Revisions of previous estimates (4) (35) (21) (60) – (60)Improved recovery 7 – – 7 – 7 Extensions, discoveries and other additions 15 3 1 19 – 19 Production (48) (10) (13) (71) (4) (75)Sales of reserves in place (65) – (3) (68) – (68)________ ________ ________ ________ ________ ________End of year – 2000 458 108 151 717 – 717 _______________________________________________________________________________________________
Proved developed reserves:Beginning of year – 1998 486 161 12 659 – 659 End of year – 1998 489 119 67 675 – 675 End of year – 1999 476 90 72 638 69 707 End of year – 2000 414 74 57 545 – 545 _______________________________________________________________________________________________
(a) Reserves represent the exchange of an equity interest in Sakhalin Energy Investment Company Ltd. for certaininterests in the UK Atlantic Margin area and the Gulf of Mexico.
USX

U-33
Supplementary Information on Oil and Gas Producing Activities(Unaudited) C O N T I N U E D
Estimated Quantities of Proved Oil and Gas Reserves (continued)United Other Equity
(Billions of cubic feet) States Europe Intl. Consolidated Investees Total_______________________________________________________________________________________________Natural Gas
Proved developed and undeveloped reserves:
Beginning of year – 1998 2,232 1,048 23 3,303 111 3,414 Purchase of reserves in place 10 – 782 792 – 792 Revisions of previous estimates (16) 10 (1) (7) 5 (2)Improved recovery – – – – – – Extensions, discoveries and other additions 238 32 55 325 5 330 Production (272) (124) (29) (425) (11) (436)Sales of reserves in place (29) – – (29) – (29)________ ________ ________ ________ ________ ________End of year – 1998 2,163 966 830 3,959 110 4,069 Purchase of reserves in place 5 – 11 16 – 16 Revisions of previous estimates (83) (81) (3) (167) 13 (154)Improved recovery 8 – 2 10 – 10 Extensions, discoveries and other additions 281 – 94 375 13 388 Production (275) (111) (59) (445) (13) (458)Sales of reserves in place (42) – (42) (84) – (84)________ ________ ________ ________ ________ ________End of year – 1999 2,057 774 833 3,664 123 3,787 Purchase of reserves in place 114 – 15 129 – 129 Exchange of interest(a) 14 31 – 45 – 45 Revisions of previous estimates (154) (114) (347) (615) (26) (641)Improved recovery – – – – – – Extensions, discoveries and other additions 217 35 38 290 2 292 Production (268) (112) (52) (432) (10) (442)Sales of reserves in place (66) – (10) (76) – (76)________ ________ ________ ________ ________ ________End of year – 2000 1,914 614 477 3,005 89 3,094 _______________________________________________________________________________________________
Proved developed reserves:Beginning of year – 1998 1,702 1,024 19 2,745 78 2,823 End of year – 1998 1,678 909 534 3,121 76 3,197 End of year – 1999 1,550 741 497 2,788 65 2,853 End of year – 2000 1,421 563 381 2,365 52 2,417 _______________________________________________________________________________________________
(a) Reserves represent the exchange of an equity interest in Sakhalin Energy Investment Company Ltd. for certaininterests in the UK Atlantic Margin area and the Gulf of Mexico.
Standardized Measure of Discounted Future Net Cash Flows and Changes Therein Relating to Proved Oil and Gas ReservesEstimated discounted future net cash flows and changes therein were determined in accordance with
Statement of Financial Accounting Standards No. 69. Certain information concerning the assumptions used incomputing the valuation of proved reserves and their inherent limitations are discussed below. USX believes suchinformation is essential for a proper understanding and assessment of the data presented.
Future cash inflows are computed by applying year-end prices of oil and gas relating to USX’s proved reservesto the year-end quantities of those reserves. Future price changes are considered only to the extent provided bycontractual arrangements in existence at year-end.
The assumptions used to compute the proved reserve valuation do not necessarily reflect USX’s expectationsof actual revenues to be derived from those reserves nor their present worth. Assigning monetary values to theestimated quantities of reserves, described on the preceding page, does not reduce the subjective and ever-changingnature of such reserve estimates.
Additional subjectivity occurs when determining present values because the rate of producing the reservesmust be estimated. In addition to uncertainties inherent in predicting the future, variations from the expectedproduction rate also could result directly or indirectly from factors outside of USX’s control, such as unintentionaldelays in development, environmental concerns, changes in prices or regulatory controls.
The reserve valuation assumes that all reserves will be disposed of by production. However, if reserves aresold in place or subjected to participation by foreign governments, additional economic considerations also couldaffect the amount of cash eventually realized.
Future development and production costs, including abandonment and dismantlement costs, are computed byestimating the expenditures to be incurred in developing and producing the proved oil and gas reserves at the endof the year, based on year-end costs and assuming continuation of existing economic conditions.
Future income tax expenses are computed by applying the appropriate year-end statutory tax rates, withconsideration of future tax rates already legislated, to the future pretax net cash flows relating to USX’s proved oiland gas reserves. Permanent differences in oil and gas related tax credits and allowances are recognized.
Discount was derived by using a discount rate of 10 percent a year to reflect the timing of the future net cashflows relating to proved oil and gas reserves.
USX

U-34
Supplementary Information on Oil and Gas Producing Activities(Unaudited) C O N T I N U E D
Standardized Measure of Discounted Future Net Cash Flows Relating to Proved Oil and Gas Reserves (continued)United Other Equity
(In millions) States Europe Intl. Consolidated Investees Total_______________________________________________________________________________________________December 31, 2000:
Future cash inflows $ 25,052 $ 4,571 $ 6,704 $ 36,327 $ 313 $ 36,640 Future production costs (5,689) (1,662) (1,156) (8,507) (125) (8,632)Future development costs (638) (185) (309) (1,132) (26) (1,158)Future income tax expenses (6,290) (677) (2,102) (9,069) (76) (9,145)_________ _________ _________ _________ _________ _________Future net cash flows 12,435 2,047 3,137 17,619 86 17,705 10% annual discount for
estimated timing of cash flows (5,403) (486) (1,524) (7,413) (19) (7,432)_________ _________ _________ _________ _________ _________Standardized measure of
discounted future net cashflows relating to proved oiland gas reserves $ 7,032 $ 1,561 $ 1,613 $ 10,206 $ 67 $ 10,273 _______________________________________________________________________________________________
December 31, 1999:Future cash inflows $ 15,393 $ 4,426 $ 5,242 $ 25,061 $ 2,154 $ 27,215 Future production costs (4,646) (1,864) (1,107) (7,617) (850) (8,467)Future development costs (445) (86) (315) (846) (88) (934)Future income tax expenses (3,102) (987) (1,581) (5,670) (328) (5,998)_________ _________ _________ _________ _________ _________Future net cash flows 7,200 1,489 2,239 10,928 888 11,816 10% annual discount for
estimated timing of cash flows (3,371) (374) (862) (4,607) (372) (4,979)_________ _________ _________ _________ _________ _________Standardized measure of
discounted future net cashflows relating to proved oiland gas reserves $ 3,829 $ 1,115 $ 1,377 $ 6,321 $ 516 $ 6,837 _______________________________________________________________________________________________
December 31, 1998:Future cash inflows $ 8,442 $ 3,850 $ 2,686 $ 14,978 $ 1,036 $ 16,014 Future production costs (3,731) (2,240) (950) (6,921) (586) (7,507)Future development costs (559) (130) (323) (1,012) (124) (1,136)Future income tax expenses (816) (630) (542) (1,988) (45) (2,033)_________ _________ _________ _________ _________ _________Future net cash flows 3,336 850 871 5,057 281 5,338 10% annual discount for
estimated timing of cash flows (1,462) (256) (392) (2,110) (136) (2,246)_________ _________ _________ _________ _________ _________Standardized measure of
discounted future net cashflows relating to proved oiland gas reserves $ 1,874 $ 594 $ 479 $ 2,947 $ 145 $ 3,092 _______________________________________________________________________________________________
Summary of Changes in Standardized Measure of Discounted Future Net Cash Flows Relating toProved Oil and Gas Reserves
Consolidated Equity Investees Total_________________________ _________________________ _________________________(In millions) 2000 1999 1998 2000 1999 1998 2000 1999 1998_______________________________________________________________________________________________Sales and transfers of
oil and gas produced,net of production costs $(2,508) $ (1,516) $ (1,125) $ (111) $ (8) $ (20) $(2,619) $ (1,524) $ (1,145)
Net changes in prices andproduction costs relatedto future production 6,820 5,891 (3,579) 12 484 (372) 6,832 6,375 (3,951)
Extensions, discoveries andimproved recovery, lessrelated costs 1,472 566 284 3 9 4 1,475 575 288
Development costs incurredduring the period 433 383 516 77 84 165 510 467 681
Changes in estimated futuredevelopment costs (273) (69) (285) (22) (52) (100) (295) (121) (385)
Revisions of previousquantity estimates (1,899) (346) (110) (43) (8) (2) (1,942) (354) (112)
Net changes in purchasesand sales of minerals in place 380 68 637 – – – 380 68 637
Net change in exchanges ofreserves in place 755 – – (547) – – 208 – –
Accretion of discount 843 382 623 62 18 39 905 400 662 Net change in income taxes (1,969) (1,995) 825 90 (117) 57 (1,879) (2,112) 882 Other (169) 10 401 30 (39) 102 (139) (29) 503 _______________________________________________________________________________________________Net change for the year 3,885 3,374 (1,813) (449) 371 (127) 3,436 3,745 (1,940)Beginning of year 6,321 2,947 4,760 516 145 272 6,837 3,092 5,032 ____________________________________________________________________________________________________End of year $10,206 $ 6,321 $ 2,947 $ 67 $ 516 $ 145 $10,273 $ 6,837 $ 3,092 _______________________________________________________________________________________________
USX

U-35
Five-Year Operating Summary – Marathon Group
2000 1999 1998 1997 1996_______________________________________________________________________________________________Net Liquid Hydrocarbon Production (thousands of barrels per day)
United States (by region)Alaska – – – – 8 Gulf Coast 62 74 55 29 30 Southern 5 5 6 8 9 Central 4 4 4 5 4 Mid-Continent 34 38 44 46 45 Rocky Mountain 26 24 26 27 26 ___________________________________________
Total United States 131 145 135 115 122 ___________________________________________International
Canada 19 17 6 – – Egypt 1 5 8 8 8 Gabon 16 9 5 – – Norway – – 1 2 3 United Kingdom 29 31 41 39 48 ___________________________________________
Total International 65 62 61 49 59 ___________________________________________Consolidated 196 207 196 164 181
Equity investee(a) 11 1 – – – ___________________________________________Total 207 208 196 164 181
Natural gas liquids included in above 22 19 17 17 17 _______________________________________________________________________________________________Net Natural Gas Production (millions of cubic feet per day)
United States (by region)Alaska 160 148 144 151 145 Gulf Coast 88 107 84 78 88 Southern 147 178 208 189 161 Central 156 134 117 119 109 Mid-Continent 133 129 125 125 122 Rocky Mountain 47 59 66 60 51 ___________________________________________
Total United States 731 755 744 722 676 ___________________________________________International
Canada 143 150 65 – – Egypt – 13 16 11 13 Ireland 115 132 168 228 259 Norway – 26 27 54 87 United Kingdom – equity 212 168 165 130 140
– other(b) 11 16 23 32 32 ___________________________________________Total International 481 505 464 455 531 ___________________________________________
Consolidated 1,212 1,260 1,208 1,177 1,207 Equity investee(c) 29 36 33 42 45 ___________________________________________
Total 1,241 1,296 1,241 1,219 1,252 _______________________________________________________________________________________________Average Sales Prices
Liquid Hydrocarbons (dollars per barrel)(d)(e)United States $25.11 $15.44 $10.42 $16.88 $18.58 International 26.54 16.90 12.24 18.77 20.34
Natural Gas (dollars per thousand cubic feet)(d)(e)United States $ 3.30 $ 1.90 $ 1.79 $ 2.20 $ 2.09 International 2.76 1.90 1.94 2.00 1.97 _______________________________________________________________________________________________
Net Proved Reserves at year-end (developed and undeveloped)Liquid Hydrocarbons (millions of barrels)
United States 458 520 549 590 570 International 259 277 316 187 203 ___________________________________________
Consolidated 717 797 865 777 773 Equity investee(a) – 77 80 82 – ___________________________________________
Total 717 874 945 859 773 Developed reserves as % of total net reserves 76% 81% 71% 77% 80% _______________________________________________________________________________________________Natural Gas (billions of cubic feet)
United States 1,914 2,057 2,163 2,232 2,251 International 1,091 1,607 1,796 1,071 1,199 ___________________________________________
Consolidated 3,005 3,664 3,959 3,303 3,450 Equity investee(c) 89 123 110 111 132 ___________________________________________
Total 3,094 3,787 4,069 3,414 3,582 Developed reserves as % of total net reserves 78% 75% 79% 83% 83% _______________________________________________________________________________________________
(a) Represents Marathon’s equity interest in Sakhalin Energy Investment Company Ltd. and CLAM Petroleum B.V.(b) Represents gas acquired for injection and subsequent resale.(c) Represents Marathon’s equity interest in CLAM Petroleum B.V.(d) Prices exclude gains/losses from hedging activities.(e) Prices exclude equity investees and purchase/resale gas.
USX

U-36
Five-Year Operating Summary – Marathon Group C O N T I N U E D
2000(a) 1999(a) 1998(a) 1997 1996_______________________________________________________________________________________________U.S. Refinery Operations (thousands of barrels per day)
In-use crude oil capacity at year-end 935 935 935 575 570 Refinery runs – crude oil refined 900 888 894 525 511
– other charge and blend stocks 141 139 127 99 96 In-use crude oil capacity utilization rate 96% 95% 96% 92% 90%_______________________________________________________________________________________________
Source of Crude Processed (thousands of barrels per day)United States 400 349 317 202 229 Canada 102 92 98 24 18 Middle East and Africa 346 363 394 241 193 Other International 52 84 85 58 73 ___________________________________________
Total 900 888 894 525 513 _______________________________________________________________________________________________Refined Product Yields (thousands of barrels per day)
Gasoline 552 566 545 353 345 Distillates 278 261 270 154 155 Propane 20 22 21 13 13 Feedstocks and special products 74 66 64 36 35 Heavy fuel oil 43 43 49 35 30 Asphalt 74 69 68 39 36 ___________________________________________
Total 1,041 1,027 1,017 630 614 _______________________________________________________________________________________________Refined Products Yields (% breakdown)
Gasoline 53% 55% 54% 56% 56%Distillates 27 25 27 24 25 Other products 20 20 19 20 19 ___________________________________________
Total 100% 100% 100% 100% 100%_______________________________________________________________________________________________U.S. Refined Product Sales Volumes (thousands of barrels per day)
Gasoline 746 714 671 452 468 Distillates 352 331 318 198 192 Propane 21 23 21 12 12 Feedstocks and special products 69 66 67 40 37 Heavy fuel oil 43 43 49 34 31 Asphalt 75 74 72 39 35 ___________________________________________
Total 1,306 1,251 1,198 775 775 Matching buy/sell volumes included in above 52 45 39 51 71 _______________________________________________________________________________________________
Refined Products Sales Volumes by Class of Trade (as a % of total sales volumes)
Wholesale – independent private-brand marketers and consumers 65% 66% 65% 61% 62%
Marathon and Ashland brand jobbers and dealers 12 11 11 13 13 Speedway SuperAmerica retail outlets 23 23 24 26 25 ___________________________________________
Total 100% 100% 100% 100% 100%_______________________________________________________________________________________________Refined Products (dollars per barrel)
Average sales price $38.24 $24.59 $20.65 $26.38 $27.43 Average cost of crude oil throughput 29.07 18.66 13.02 19.00 21.94 _______________________________________________________________________________________________
Petroleum Inventories at year-end (thousands of barrels)Crude oil, raw materials and natural gas liquids 33,720 34,255 35,630 19,351 20,047 Refined products 34,386 32,853 32,334 20,598 21,283 _______________________________________________________________________________________________
U.S. Refined Product Marketing Outlets at year-endMAP operated terminals 91 93 88 51 51 Retail – Marathon and Ashland brand outlets 3,728 3,482 3,117 2,465 2,392
– Speedway SuperAmerica outlets 2,242 2,433 2,257 1,544 1,592 _______________________________________________________________________________________________Pipelines (miles of common carrier pipelines)(b)
Crude Oil – gathering lines 419 557 2,827 1,003 1,052 – trunklines 4,623 4,720 4,859 2,665 2,665
Products – trunklines 2,834 2,856 2,861 2,310 2,310 ___________________________________________Total 7,876 8,133 10,547 5,978 6,027 _______________________________________________________________________________________________
Pipeline Barrels Handled (millions)(c)Crude Oil – gathering lines 22.7 30.4 47.8 43.9 43.2
– trunklines 563.6 545.7 571.9 369.6 378.7 Products – trunklines 329.7 331.9 329.7 262.4 274.8 ___________________________________________
Total 916.0 908.0 949.4 675.9 696.7 _______________________________________________________________________________________________River Operations
Barges – owned/leased 158 169 169 – – Boats – owned/leased 6 8 8 – – _______________________________________________________________________________________________
(a) 1998–2000 statistics include 100% of MAP and should be considered when compared to prior periods.(b) Pipelines for downstream operations also include non-common carrier, leased and equity investees.(c) Pipeline barrels handled on owned common carrier pipelines, excluding equity investees.
USX

U-37
Five-Year Operating Summary – U. S. Steel Group
(Thousands of net tons, unless otherwise noted) 2000 1999 1998 1997 1996_______________________________________________________________________________________________Raw Steel Production
Gary, IN 6,610 7,102 6,468 7,428 6,840Mon Valley, PA 2,683 2,821 2,594 2,561 2,746Fairfield, AL 2,069 2,109 2,152 2,361 1,862Kosice, Slovak Republic 382 – – – – _________________________________________________
Total 11,744 12,032 11,214 12,350 11,448_______________________________________________________________________________________________Raw Steel Capability
Domestic Steel 12,800 12,800 12,800 12,800 12,800U. S. Steel Kosice(a) 467 – – – – _________________________________________________
Total 13,267 12,800 12,800 12,800 12,800Total production as % of total capability 88.5 94.0 87.6 96.5 89.4_______________________________________________________________________________________________
Hot Metal ProductionDomestic Steel 9,904 10,344 9,743 10,591 9,716U. S. Steel Kosice 340 – – – – _________________________________________________
Total 10,244 10,344 9,743 10,591 9,716_______________________________________________________________________________________________Coke Production
Domestic Steel(b) 5,003 4,619 4,835 5,757 6,777U. S. Steel Kosice 188 – – – – _________________________________________________
Total 5,191 4,619 4,835 5,757 6,777_______________________________________________________________________________________________Iron Ore Pellets – Minntac, MN
Shipments 15,020 15,025 15,446 16,403 14,962_______________________________________________________________________________________________Coal Production 6,195 6,632 8,150 7,528 7,283_______________________________________________________________________________________________Coal Shipments 6,779 6,924 7,670 7,811 7,117_______________________________________________________________________________________________Steel Shipments by Product – Domestic Steel
Sheet and semi-finished steel products 7,409 8,114 7,608 8,170 8,677Tubular, plate and tin mill products 3,347 2,515 3,078 3,473 2,695_________________________________________________
Total 10,756 10,629 10,686 11,643 11,372Total as % of domestic steel industry 9.8 10.0 10.5 10.9 11.3_______________________________________________________________________________________________
Steel Shipments by Product – U. S. Steel KosiceSheet and semi-finished steel products 207 – – – – Tubular, plate and tin mill products 110 – – – – _________________________________________________
Total 317 – – – – _______________________________________________________________________________________________Steel Shipments by Market – Domestic Steel
Steel service centers 2,315 2,456 2,563 2,746 2,831Transportation 1,466 1,505 1,785 1,758 1,721Further conversion:
Joint ventures 1,771 1,818 1,473 1,568 1,542Trade customers 1,174 1,633 1,140 1,378 1,227
Containers 702 738 794 856 874Construction 936 844 987 994 865Oil, gas and petrochemicals 973 363 509 810 746Export 544 321 382 453 493All other 875 951 1,053 1,080 1,073_________________________________________________
Total 10,756 10,629 10,686 11,643 11,372_______________________________________________________________________________________________Average Steel Price Per Ton
Domestic Steel $450 $420 $469 $479 $467U. S. Steel Kosice 269 – – – – _______________________________________________________________________________________________
(a) Represents the operations of U. S. Steel Kosice s.r.o., following the acquisition of the steelmaking operationsand related assets of VSZ a.s. on November 24, 2000.
(b) The reduction in coke production after 1996 reflected U. S. Steel’s entry into a strategic partnership with twolimited partners on June 1, 1997, to acquire an interest in three coke batteries at its Clairton (Pa.) Works.
USX

U-38
Five-Year Financial Summary
(Dollars in millions, except as noted) 2000 1999 1998 1997 1996_______________________________________________________________________________________________Statement of OperationsRevenues and other income(a) $ 39,914 $ 29,119 $ 28,077 $ 22,824 $ 22,938 Income from operations 1,752 1,863 1,517 1,705 1,779
Includes:Joint venture formation charges (931) – – – – Inventory market valuation (charges) credits – 551 (267) (284) 209 Gain on ownership change in MAP 12 17 245 – –
Income from continuing operations $ 411 $ 705 $ 674 $ 908 $ 946 Income from discontinued operations – – – 80 6 Extraordinary losses – (7) – – (9)____________________________________________________
Net Income $ 411 $ 698 $ 674 $ 988 $ 943 _______________________________________________________________________________________________Applicable to Marathon Stock
Income before extraordinary loss $ 432 $ 654 $ 310 $ 456 $ 671 Income before extraordinary loss
per share – basic (in dollars) 1.39 2.11 1.06 1.59 2.33 – diluted (in dollars) 1.39 2.11 1.05 1.58 2.31
Net income 432 654 310 456 664 Net income per share – basic (in dollars) 1.39 2.11 1.06 1.59 2.31
– diluted (in dollars) 1.39 2.11 1.05 1.58 2.29 Dividends paid per share (in dollars) .88 .84 .84 .76 .70 _______________________________________________________________________________________________
Applicable to Steel StockIncome (loss) before extraordinary losses $ (29) $ 42 $ 355 $ 449 $ 253 Income (loss) before extraordinary losses
per share – basic (in dollars) (.33) .48 4.05 5.24 3.00 – diluted (in dollars) (.33) .48 3.92 4.88 2.97
Net income (loss) (29) 35 355 449 251 Net income (loss) per share – basic (in dollars) (.33) .40 4.05 5.24 2.98
– diluted (in dollars) (.33) .40 3.92 4.88 2.95 Dividends paid per share (in dollars) 1.00 1.00 1.00 1.00 1.00 _______________________________________________________________________________________________
Balance Sheet Position at year-endCash and cash equivalents $ 559 $ 133 $ 146 $ 54 $ 55 Total assets 23,401 22,931 21,133 17,284 16,980 Capitalization:
Notes payable $ 150 $ – $ 145 $ 121 $ 81 Total long-term debt 4,460 4,283 3,991 3,403 4,212 Preferred stock of subsidiary and trust preferred securities 433 433 432 432 250 Minority interest in MAP 1,840 1,753 1,590 – – Redeemable Delhi Stock – – – 195 – Preferred stock 2 3 3 3 7 Common stockholders’ equity 6,762 6,853 6,402 5,397 5,015 ____________________________________________________
Total capitalization $ 13,647 $ 13,325 $ 12,563 $ 9,551 $ 9,565 _______________________________________________________________________________________________% of total debt to capitalization(b) 36.9 35.4 36.4 41.4 47.5 _______________________________________________________________________________________________
Cash Flow DataNet cash from operating activities $ 2,531 $ 1,936 $ 2,022 $ 1,464 $ 1,655 Capital expenditures 1,669 1,665 1,580 1,373 1,168 Disposal of assets 560 366 86 481 443 Dividends paid 371 354 342 316 307 _______________________________________________________________________________________________
Employee DataTotal employment costs(c)(d) $ 2,692 $ 2,582 $ 2,372 $ 2,289 $ 2,179 Average number of employees(c)(d) 52,459 52,596 44,860 41,620 41,553 Number of pensioners at year-end(d) 97,594 100,504 (e) 95,429 97,051 99,713 _______________________________________________________________________________________________
(a) 1996–1999 reclassified to conform to 2000 classifications.(b) Total debt represents the sum of notes payable, total long-term debt and preferred stock of subsidiary and trust
preferred securities.(c) Includes U. S. Steel Kosice s.r.o. from date of acquisition in 2000 and excludes the Delhi Companies sold in 1997.(d) Data for 1998 includes Ashland employees from the date of their payroll transfer to MAP, which occurred at various
times throughout 1998. These employees were contracted to MAP in 1998, prior to their payroll transfer.(e) Includes approximately 8,000 surviving spouse beneficiaries added to the U. S. Steel pension plan in 1999.
USX

U-39
Management’s Discussion and Analysis
USX Corporation (“USX”) is a diversified company engaged primarily in the energy businessthrough its Marathon Group, and in the steel business through its U. S. Steel Group.
Effective October 31, 1997, USX sold Delhi Gas Pipeline Corporation and other subsidiaries ofUSX that comprised all of the USX – Delhi Group (“Delhi Companies”). On January 26, 1998, USXused the $195 million net proceeds from the sale to redeem all of the 9.45 million outstanding shares ofUSX – Delhi Group Common Stock. For additional information, see Note 5 to the USX ConsolidatedFinancial Statements.
On January 1, 1998, Marathon Oil Company (“Marathon”) transferred certain refining, marketingand transportation (“RM&T”) net assets to Marathon Ashland Petroleum LLC (“MAP”), a newconsolidated subsidiary. Also on January 1, 1998, Marathon acquired certain RM&T net assets fromAshland Inc. (“Ashland”) in exchange for a 38 percent interest in MAP. Financial measures such asrevenues, income from operations and capital expenditures in 2000, 1999 and 1998 include 100 percentof MAP and are not comparable to prior period amounts. Net income and related per share amountsfor 2000, 1999 and 1998 are net of minority interest. For further discussion of MAP, see Note 3 to theUSX Consolidated Financial Statements.
On August 11, 1998, Marathon acquired Tarragon Oil and Gas Limited (“Tarragon”), a Canadianoil and gas exploration and production company. The purchase price included $686 million in cashpayments, the assumption of $345 million in debt and the issuance of Exchangeable Shares of anindirect Canadian subsidiary of Marathon valued at $29 million. The Exchangeable Shares areexchangeable at any time on a one-for-one basis for shares of USX – Marathon Group Common Stock(“Marathon Stock”). On November 4, 1998, USX sold 17 million shares of Marathon Stock. Theproceeds to USX of $528 million were used to reduce indebtedness incurred to fund the Tarragonacquisition. Financial measures such as revenues, income from operations and capital expendituresinclude operations of Marathon Canada Limited, formerly known as Tarragon, commencing August 12,1998. For further discussion of Tarragon, see Note 3 to the USX Consolidated Financial Statements.
On November 24, 2000, USX acquired U. S. Steel Kosice s.r.o. (“USSK”), which held the steeloperations and related assets of VSZ a.s. (“VSZ”), located in the Slovak Republic. The 2000 resultsinclude USSK operations after the acquisition date. For further discussion of USSK, see Note 3 to theUSX Consolidated Financial Statements.
Management’s Discussion and Analysis of USX Consolidated Financial Statements providescertain information about the Marathon and U. S. Steel Groups, particularly in Management’sDiscussion and Analysis of Operations by Group. More expansive Group information is provided inManagement’s Discussion and Analysis of the Marathon Group and U. S. Steel Group, which areincluded in the USX 2000 Form 10-K. Management’s Discussion and Analysis should be read inconjunction with the USX Consolidated Financial Statements and Notes to the USX ConsolidatedFinancial Statements.
Certain sections of Management’s Discussion and Analysis include forward-looking statementsconcerning trends or events potentially affecting USX. These statements typically contain words suchas “anticipates”, “believes”, “estimates”, “expects” or similar words indicating that future outcomes areuncertain. In accordance with “safe harbor” provisions of the Private Securities Litigation Reform Actof 1995, these statements are accompanied by cautionary language identifying important factors,though not necessarily all such factors, that could cause future outcomes to differ materially fromthose set forth in the forward-looking statements. For additional risk factors affecting the businessesof USX, see Supplementary Data – Disclosures About Forward-Looking Statements in the USX 2000Form 10-K.
USX

Management’s Discussion and Analysis C O N T I N U E D
U-40
Management’s Discussion and Analysis of Income
Revenues and Other Income for each of the last three years are summarized in the followingtable:
(Dollars in millions) 2000 1999 1998______________________________________________________________________________________Revenues and other income(a)
Marathon Group $ 33,859 $23,707 $21,623 U. S. Steel Group 6,132 5,470 6,477 Eliminations (77) (58) (23)________ ________ ________
Total USX Corporation revenues and other income 39,914 29,119 28,077 Less:
Consumer excise taxes on petroleum products and merchandise(b) 4,344 3,973 3,824 ________ ________ ________Revenues and other income adjusted to exclude above item $ 35,570 $25,146 $24,253 ______________________________________________________________________________________
(a) Consists of revenues, dividend and investee income (loss), gain on ownership change in MAP, net gains (losses)on disposal of assets and other income.
(b) Included in both revenues and costs and expenses for the Marathon Group and USX Consolidated, resulting inno effect on income.
Adjusted revenues and other income increased by $10,424 million in 2000 compared with 1999,reflecting a 43 percent increase for the Marathon Group and a 12 percent increase for the U. S. SteelGroup. Adjusted revenues and other income increased by $893 million in 1999 compared with 1998,reflecting a 10 percent increase for the Marathon Group, partially offset by a 16 percent decrease forthe U. S. Steel Group. For further discussion, see Management’s Discussion and Analysis ofOperations by Group, herein.
Income from operations for each of the last three years are summarized in the following table:
(Dollars in millions) 2000 1999 1998______________________________________________________________________________________Reportable segments
Marathon GroupExploration & production $ 1,535 $ 618 $ 278 Refining, marketing & transportation 1,273 611 896 Other energy related businesses 38 61 33 ________ ________ ________
Income for reportable segments – Marathon Group 2,846 1,290 1,207 U. S. Steel Group
Domestic Steel 23 91 517 U. S. Steel Kosice 2 – – ________ ________ ________
Income for reportable segments – U. S. Steel Group 25 91 517 ________ ________ ________Income for reportable segments – USX Corporation 2,871 1,381 1,724
Items not allocated to reportable segments:Marathon Group (1,198) 423 (269)U. S. Steel Group 79 59 62 ________ ________ ________
Total income from operations – USX Corporation $ 1,752 $ 1,863 $ 1,517 ______________________________________________________________________________________Income from operations decreased $111 million in 2000 compared with 1999 and increased
$346 million in 1999 compared with 1998. The decrease in 2000, despite higher income from reportablesegments for the Marathon Group, was primarily due to special charges at Marathon, in particular anoncash adjustment related to the formation of a joint venture with Kinder Morgan Energy Partners,L.P. In addition, income from operations for the U. S. Steel Group declined in 2000 due primarily tohigher costs related to energy and inefficient operating levels, lower income from raw materialsoperations, particularly coal operations, and lower sheet shipments resulting from high levels ofimports that continued in 2000. For further discussion, see Management’s Discussion and Analysis ofOperations by Group, herein.
USX

Management’s Discussion and Analysis C O N T I N U E D
U-41
Net interest and other financial costs for each of the last three years are summarized in thefollowing table:
(Dollars in millions) 2000 1999 1998______________________________________________________________________________________Interest and other financial income $ 34 $ 3 $ 39 Interest and other financial costs 375 365 318 ________ ________ ________
Net interest and other financial costs 341 362 279 Less:
Favorable adjustment tocarrying value of indexed debt(a) – (13) (44)________ ________ ________
Net interest and other financial costsadjusted to exclude above item $ 341 $ 375 $ 323 ______________________________________________________________________________________
(a) In December 1996, USX issued $117 million in aggregate principal amount of 6-3/4% Notes Due February 1,2000 (“indexed debt”), mandatorily exchangeable at maturity for common stock of RTI InternationalMetals, Inc. (“RTI”) or for the equivalent amount of cash, at USX’s option. The carrying value of indexed debtwas adjusted quarterly to settlement value based on changes in the value of RTI common stock. Any resultingadjustment was charged or credited to income and included in interest and other financial costs. In 1999, USXirrevocably deposited with a trustee the RTI common stock resulting in satisfaction of USX’s obligation. Forfurther information see Note 7 to the USX Consolidated Financial Statements.
Excluding the effect of the adjustment to the carrying value of indexed debt, net interest and otherfinancial costs decreased by $34 million in 2000 as compared with 1999, and increased by $52 millionin 1999 as compared with 1998. The decrease in 2000 was primarily due to higher interest income. Theincrease in 1999 was primarily due to lower interest income and increased financial costs as a result ofhigher average debt levels. For additional information, see Note 6 to the USX Consolidated FinancialStatements.
The provision for income taxes was $502 million in 2000, compared with $349 million in 1999and $315 million in 1998. The 2000 provision included a $235 million one-time, noncash deferred taxcharge for the Marathon Group as a result of the change in the amount and timing of future foreignsource income due to the exchange of its interest in Sakhalin Energy Investment Company Ltd. for oiland gas producing interests. The 1999 provision included a $23 million favorable adjustment todeferred taxes for the Marathon Group related to the outcome of a United States Tax Court case. The1998 income tax provision included $33 million of favorable income tax accrual adjustments relating toforeign operations. For reconciliation of the federal statutory rate to total provisions on income fromcontinuing operations, see Note 11 to the USX Consolidated Financial Statements.
Extraordinary loss of $7 million, net of income tax benefit, in 1999 included a $5 million lossresulting from the satisfaction of the indexed debt and a $2 million loss for USX’s share of RepublicTechnologies International, LLC’s extraordinary loss related to the early extinguishment of debt. Foradditional information, see Note 7 to the USX Consolidated Financial Statements.
Net income was $411 million in 2000, $698 million in 1999 and $674 million in 1998. Excludingthe gain on change of ownership in MAP in 2000, 1999 and 1998 and adjustments to the inventorymarket valuation reserve in 1999 and 1998, net income decreased by $69 million in 2000 comparedwith 1999, and decreased by $152 million in 1999 compared with 1998.
Management’s Discussion and Analysis of Financial Condition, Cash Flows and Liquidity
Current assets increased by $1,376 million from year-end 1999, primarily reflecting increasedcash and cash equivalents, receivables, inventories and assets held for sale. Receivables primarilyincreased as a result of higher commodity prices. Cash and cash equivalents increased primarily due toan increase in cash held by certain foreign subsidiaries. Inventories increased by $186 million largelydue to increases at the U. S. Steel Group, in particular the acquisition of USSK. Assets held for saleincreased mainly due to the reclassification of the Yates field from property, plant and equipment.
USX

Management’s Discussion and Analysis C O N T I N U E D
U-42
Current liabilities increased by $704 million from year-end 1999, primarily due to an increase inaccounts payable reflecting higher year-end commodity prices for the Marathon Group and theacquisition of USSK for the U. S. Steel Group. In addition, notes payable increased and, because of thereclassification of long-term debt to short-term, short-term debt also increased.
Investments and long-term receivables decreased by $436 million from year-end 1999,primarily due to the exchange of Marathon’s interest in Sakhalin Energy Investment Company Ltd.
Net property, plant and equipment decreased by $695 million from year-end 1999, primarilydue to depreciation, asset impairments and sales, and reclassifications to assets held for sale, partiallyoffset by property additions, including USSK.
Total long-term debt and notes payable increased by $327 million from year-end 1999,primarily due to $325 million of debt related to the acquisition of USSK, which is nonrecourse to USX.Debt attributed to the U. S. Steel Group increased, while debt attributed to the Marathon Groupdecreased.
Stockholders’ equity decreased by $92 million from year-end 1999 mainly reflecting net incomeof $411 million offset by dividends declared and Marathon Stock repurchases of $105 million. In July2000, the USX Board of Directors authorized spending up to $450 million to repurchase shares ofMarathon Stock. This repurchase program will continue from time to time as the Corporation’sfinancial condition and market conditions warrant.
Net cash provided from operating activities was $2,531 million in 2000, $1,936 million in1999 and $2,022 million in 1998. Cash provided from operating activities in 2000 included a$500 million elective contribution to a Voluntary Employee Benefit Association Trust (“VEBA”), a trustestablished by contract in 1994 covering United Steelworkers of America retirees’ health care and lifeinsurance benefits and a $30 million elective contribution to a non-union retiree life insurance trust.Cash provided from operating activities in 1999 included a payment of $320 million resulting from theexpiration of a program to sell U. S. Steel Group’s accounts receivable. Excluding the effects of theseitems, cash provided from operating activities increased $805 million in 2000 compared with 1999primarily due to increased cash provided from operations at the Marathon Group partially offset byincreased income tax payments. Cash provided from operating activities in 1998 included proceeds of$38 million for the insurance litigation settlement pertaining to the 1995 Gary Works #8 blast furnaceexplosion and the payment of $30 million for the repurchase of sold accounts receivable. Excluding theeffects of these adjustments, cash provided from operating activities increased by $242 million in 1999compared with 1998 primarily due to favorable working capital changes.
Capital expenditures for each of the last three years are summarized in the following table:
(Dollars in millions) 2000 1999 1998______________________________________________________________________________________Marathon Group
Exploration & productionDomestic $ 516 $ 356 $ 652 International 226 388 187
Refining, marketing & transportation 656 612 410 Other 27 22 21 ________ ________ ________
Subtotal Marathon Group 1,425 1,378 1,270 U. S. Steel Group 244 287 310 ________ ________ ________
Total USX Corporation capital expenditures $ 1,669 $ 1,665 $ 1,580 ______________________________________________________________________________________Domestic exploration and production capital expenditures for the Marathon Group in 2000 mainly
included the completion of the Viosca Knoll Block 786 (Petronius) development in the Gulf of Mexico,various producing property acquisitions, and natural gas developments in East Texas and other gasbasins throughout the western United States. International exploration and production projectsincluded the completion of the Tchatamba West development, located offshore Gabon, and continuedoil and natural gas developments in Canada. Refining, marketing and transportation capitalexpenditures by MAP primarily consisted of refinery modifications, including the initiation of thedelayed coker unit project at the Garyville refinery, and upgrades and expansions of retail marketingoutlets.
USX

Management’s Discussion and Analysis C O N T I N U E D
U-43
Capital expenditures for the U. S. Steel Group in 2000 included exercising an early buyout optionof a lease for approximately half of the Gary Works No. 2 Slab Caster, the continued replacement ofcoke battery thruwalls at Gary Works, installation of the remaining two coilers at Gary’s hot strip mill,a blast furnace stove replacement at Gary Works and the continuation of an upgrade to the Mon Valleycold reduction mill.
Capital expenditures in 2001 are expected to be approximately $1.9 billion. Expenditures forthe Marathon Group are expected to be approximately $1.5 billion. Domestic exploration andproduction projects planned for 2001 will focus on gas projects and include various producing propertyacquisitions. Planned capital expenditures in 2001 do not include the capital requirements related tothe acquisition of Pennaco Energy, Inc. (“Pennaco”). International exploration and production projectsinclude the continued development of the Foinaven area in the U.K. Atlantic Margin and continued oiland natural gas developments in Canada. Refining, marketing and transportation spending by MAPwill primarily consist of refinery improvements, including the completion of the delayed coker unitproject at the Garyville refinery, upgrades and expansions of retail marketing outlets, and expansionand enhancement of logistics systems. Other Marathon spending will include funds for developmentand installation of SAP software, which is an enterprise resource planning system that will allow theintegration of processes among business units and with outside enterprises.
Capital expenditures for the U. S. Steel Group in 2001 are expected to be approximately$425 million. Planned projects include exercising an early buyout option of a lease for the balance ofthe Gary Works No. 2 Slab Caster, work on the No. 3 blast furnace at Mon Valley Works, work on theNo. 2 stove at the No. 6 blast furnace at Gary Works, the completion of the replacement of coke batterythruwalls at Gary Works, the completion of an upgrade to the Mon Valley cold reduction mill, mobileequipment purchases, systems development projects, and projects at USSK, including the completionof the tin mill upgrade.
Contract commitments to acquire property, plant and equipment and long-term investments atDecember 31, 2000, totaled $663 million compared with $568 million at December 31, 1999.
Investments in investees of $100 million in 2000 mainly reflected Marathon Groupdevelopment spending for the Sakhalin II project in Russia and U. S. Steel Group investment in stockof VSZ in which USX now holds a 25 percent interest.
The above statements with respect to capital expenditures are forward-looking statementsreflecting management’s best estimates based on information currently available. To the extent thisinformation proves to be inaccurate, the timing and levels of future expenditures could differmaterially from those included in the forward-looking statements. Factors that could cause futurecapital expenditures to differ materially include changes in industry supply and demand, generaleconomic conditions, the availability of business opportunities and levels of cash flow from operationsfor each of the Groups. The timing of completion or cost of particular capital projects could be affectedby unforeseen hazards such as weather conditions, explosions or fires.
Proceeds from disposal of assets were $560 million in 2000, compared with $366 million in1999 and $86 million in 1998. Proceeds in 2000 primarily reflected Marathon’s Sakhalin exchange,sales of interest in the Angus/Stellaria development in the Gulf of Mexico, the sale of non-coreSpeedway SuperAmerica stores and other domestic production properties. Proceeds in 1999 primarilyreflected the sales of Scurlock Permian LLC, over 150 non-strategic domestic and internationalproduction properties and Carnegie Natural Gas Company and affiliated subsidiaries, all of whichwere attributed to the Marathon Group.
The net change in restricted cash was a net withdrawal of $3 million in 2000, compared with anet deposit of $1 million in 1999 and a net withdrawal of $174 million in 1998. The $174 million netwithdrawal in 1998 was primarily the result of redeeming all of the outstanding shares of USX – DelhiGroup Common Stock with the $195 million of net proceeds from the sale of the Delhi Companies.
Repayments of loans and advances to investees were $10 million in 2000 compared with$1 million in 1999 and $71 million in 1998. In 1998, Sakhalin Energy Investment Company Ltd.repaid advances made by Marathon in connection with the Sakhalin II project.
USX

Management’s Discussion and Analysis C O N T I N U E D
U-44
Net cash changes related to financial obligations (the net of commercial paper and revolvingcredit arrangements, debt borrowings and repayments on the Consolidated Statement of Cash Flows)decreased $4 million in 2000, compared with an increase of $187 million in 1999 and an increase of$315 million in 1998. The decrease in 2000 reflects the net effects of net cash provided from operatingactivities, net cash used in investing activities, distributions to minority shareholder of MAP,dividends paid and a stock repurchase program for Marathon Group. The increase in 1999 reflects thenet effects of net cash provided from operating activities, net cash used in investing activities,distributions to minority shareholder of MAP and dividends paid. The increase in 1998 was primarilythe result of borrowings against revolving credit agreements to fund the acquisition of Tarragon.
Significant additions to long-term debt for each of the last three years are summarized in thefollowing table:
(Dollars in millions) 2000 1999 1998______________________________________________________________________________________Aggregate principal amounts of:
6.65% Notes due 2006 $ – $ 300 $ – 6.85% Notes due 2008 – – 400U. S. Steel receivables facility – 350 – USSK loan facility(a) 325 – – Environmental bonds and capital leases(b) – 37 280________ ______ ________
Total $ 325 $ 687 $ 680______________________________________________________________________________________(a) The USSK loan facility is nonrecourse to USX.(b) Issued to refinance an equivalent amount of environmental improvement refunding bonds.
In the event of a change in control of USX, debt and lease obligations totaling $3,818 million atyear-end 2000 may be declared immediately due and payable or required to be collateralized. SeeNotes 10 and 14 to the USX Consolidated Financial Statements.
Marathon Stock repurchased was $105 million in 2000. In July 2000, the USX Board ofDirectors authorized spending up to $450 million to repurchase shares of Marathon Stock. Thisrepurchase program will continue from time to time as the Corporation’s financial condition andmarket conditions warrant.
Dividends paid increased $17 million in 2000 compared with 1999 and increased $12 million in1999 compared with 1998. The increase in 2000 was due primarily to a two-cents-per-share increase inthe quarterly Marathon Stock dividend effective with dividends paid in the third quarter 2000.
Benefit Plan Activity
In 2000, USX contributed $530 million to a VEBA, including a $500 million elective contribution,and $30 million to a non-union retiree life insurance trust. In 1999, USX contributed $20 million to aVEBA.
Debt and Preferred Stock Ratings
In May 2000, Standard & Poor’s Corp. upgraded USX’s and Marathon’s senior debt to BBB, whichcontinues the investment grade rating. At the same time, USX’s subordinated debt was upgraded toBBB- and preferred stock was upgraded to BB+. Also in May 2000, Moody’s Investors Services, Inc.,upgraded USX’s and Marathon’s senior debt to the investment grade rating of Baa1, USX’ssubordinated debt to Baa2 and USX’s preferred stock to baa3. Fitch IBCA Duff & Phelps currentlyrates USX’s senior notes as investment grade at BBB and USX’s subordinated debt as BBB-. InDecember 2000, Standard & Poor’s Corp. advised that they had put USX on “Credit Watch Developing”status and Fitch IBCA, Duff & Phelps advised that they had put USX on “Rating Watch-Evolving”status. Both moves were in response to USX’s announced structure study.
Derivative Instruments
See Quantitative and Qualitative Disclosures About Market Risk for discussion of derivativeinstruments and associated market risk.
USX

Management’s Discussion and Analysis C O N T I N U E D
U-45
Liquidity
In December 2000, USX entered into a $1,354 million five-year revolving credit agreement,terminating in November 2005, and a $451 million 364-day facility, which together replaced the prior$2,350 million facility. At December 31, 2000, USX had $300 million of borrowings against its$1,354 million long-term revolving credit agreements and commercial paper borrowings of $77 million.Also, USX had a short-term line of credit totaling $150 million which was fully drawn at December 31,2000. There were no borrowings against MAP or USSK revolving credit agreements at December 31,2000.
USX had a total of $1,678 million available at December 31, 2000 under existing shelf registrationstatements filed with the Securities and Exchange Commission. These allow USX to offer and issueunsecured debt securities, common and preferred stock and warrants in one or more separate offeringson terms to be determined at the time of sale.
USX management believes that its short-term and long-term liquidity is adequate to satisfy itsobligations as of December 31, 2000, and to complete currently authorized capital spending programs.Future requirements for USX’s business needs, including the funding of capital expenditures, debtmaturities for the years 2001, 2002 and 2003, and any amounts that may ultimately be paid inconnection with contingencies (which are discussed in Note 26 to the USX Consolidated FinancialStatements), are expected to be financed by a combination of internally generated funds, proceeds fromthe sale of stock, borrowings or other external financing sources. However, on November 30, 2000, USXannounced that the USX Board of Directors had authorized management to retain financial, tax andlegal advisors to perform an in-depth study of the corporation’s targeted stock structure. Until thestudy is complete, USX management believes it will be more difficult to access traditional debt andequity markets. Although USX management believes that it will not be necessary to access financialmarkets during this time frame, nontraditional sources should be available to provide adequateliquidity, if necessary.
USX management’s opinion concerning liquidity and USX’s ability to avail itself in the future ofthe financing options mentioned in the above forward-looking statements are based on currentlyavailable information. To the extent that this information proves to be inaccurate, future availabilityof financing may be adversely affected. Factors that affect the availability of financing include theperformance of each Group (as indicated by levels of cash provided from operating activities and othermeasures), the results of the announced structure study, the state of the debt and equity markets,investor perceptions of past performance and expectations regarding future actions and performance,the overall U.S. financial climate, and, in particular, with respect to borrowings, levels of USX’soutstanding debt and credit ratings by rating agencies. For a summary of short-term and long-termdebt, see Notes 13 and 14 to the USX Consolidated Financial Statements.
Management’s Discussion and Analysis of Environmental Matters, Litigation and Contingencies
USX has incurred and will continue to incur substantial capital, operating and maintenance, andremediation expenditures as a result of environmental laws and regulations. To the extent theseexpenditures, as with all costs, are not ultimately reflected in the prices of USX’s products andservices, operating results will be adversely affected. USX believes that domestic competitors of theU. S. Steel Group and substantially all the competitors of the Marathon Group are subject to similarenvironmental laws and regulations. However, the specific impact on each competitor may varydepending on a number of factors, including the age and location of its operating facilities, marketingareas, production processes and the specific products and services it provides.
In addition, USX expects to incur capital expenditures to meet environmental standards under theSlovak Republic’s environmental laws for the U. S. Steel Group’s USSK operation.
USX

Management’s Discussion and Analysis C O N T I N U E D
U-46
The following table summarizes USX’s environmental expenditures for each of the last threeyears(a):
(Dollars in millions) 2000 1999 1998______________________________________________________________________________________Capital
Marathon Group $ 73 $ 46 $ 83 U. S. Steel Group 18 32 49 ________ ________ ________
Total capital $ 91 $ 78 $ 132 ______________________________________________________________________________________Compliance
Operating & maintenanceMarathon Group $ 139 $ 117 $ 126 U. S. Steel Group 194 199 198 ________ ________ ________
Total operating & maintenance 333 316 324 Remediation(b)
Marathon Group 30 25 10 U. S. Steel Group 18 22 19 ________ ________ ________
Total remediation 48 47 29 Total compliance $ 381 $ 363 $ 353 ______________________________________________________________________________________
(a) Amounts for the Marathon Group are calculated based on American Petroleum Institute survey guidelines andinclude 100% of MAP. Amounts for the U. S. Steel Group are based on previously established U.S. Departmentof Commerce survey guidelines.
(b) Amounts do not include noncash provisions recorded for environmental remediation, but include spendingcharged against remediation reserves, net of recoveries where permissible.
USX’s environmental capital expenditures accounted for 5%, 5% and 8% of total consolidatedcapital expenditures in 2000, 1999 and 1998, respectively.
USX’s environmental compliance expenditures averaged 1% of total consolidated costs in each of2000, 1999 and 1998. Remediation spending primarily reflected ongoing clean-up costs for soil andgroundwater contamination associated with underground storage tanks and piping at retail gasolinestations, and remediation activities at former and present operating locations.
The Resource Conservation and Recovery Act (“RCRA”) establishes standards for the managementof solid and hazardous wastes. Besides affecting current waste disposal practices, RCRA also addressesthe environmental effects of certain past waste disposal operations, the recycling of wastes and theregulation of storage tanks.
A significant portion of USX’s currently identified environmental remediation projects relate tothe remediation of former and present operating locations. These projects include remediation ofcontaminated sediments in a river that receives discharges from the Gary Works and the closure ofpermitted hazardous and non-hazardous waste landfills.
USX has been notified that it is a potentially responsible party (“PRP”) at 38 waste sites under theComprehensive Environmental Response, Compensation and Liability Act (“CERCLA”) as ofDecember 31, 2000. In addition, there are 23 sites where USX has received information requests orother indications that USX may be a PRP under CERCLA but where sufficient information is notpresently available to confirm the existence of liability. There are also 144 additional sites, excludingretail gasoline stations, where remediation is being sought under other environmental statutes, bothfederal and state, or where private parties are seeking remediation through discussions or litigation.Of these sites, 15 were associated with properties conveyed to MAP by Ashland for which Ashland hasretained liability for all costs associated with remediation. At many of these sites, USX is one of anumber of parties involved and the total cost of remediation, as well as USX’s share thereof, isfrequently dependent upon the outcome of investigations and remedial studies. USX accrues forenvironmental remediation activities when the responsibility to remediate is probable and the amountof associated costs is reasonably determinable. As environmental remediation matters proceed towardultimate resolution or as additional remediation obligations arise, charges in excess of those previouslyaccrued may be required. See Note 26 to the USX Consolidated Financial Statements.
USX

Management’s Discussion and Analysis C O N T I N U E D
U-47
New Tier II Fuels regulations were proposed in late 1999. The gasoline rules, which were finalizedby the U.S. Environmental Protection Agency (“EPA”) in Februay 2000, and the diesel fuel rule, whichwas finalized in January 2001, require substantially reduced sulfur levels. The combined capital costto achieve compliance with the gasoline and diesel regulations could amount to approximately$700 million between 2003 and 2005. This is a forward-looking statement and can only be a broad-based estimate due to the ongoing evolution of regulatory requirements. Some factors (among others)that could potentially affect gasoline and diesel fuel compliance costs include obtaining the necessaryconstruction and environmental permits, operating considerations, and unforeseen hazards such asweather conditions.
In October 1998, the National Enforcement Investigations Center and Region V of the EPAconducted a multi-media inspection of MAP’s Detroit refinery. Subsequently, in November 1998,Region V conducted a multi-media inspection of MAP’s Robinson refinery. These inspections coveredcompliance with the Clean Air Act (New Source Performance Standards, Prevention of SignificantDeterioration, and the National Emission Standards for Hazardous Air Pollutants for Benzene), theClean Water Act (permit exceedances for the Waste Water Treatment Plant), reporting obligationsunder the Emergency Planning and Community Right to Know Act and the handling of process waste.MAP has been advised, in ongoing discussions with the EPA, as to certain compliance issues regardingMAP’s Detroit and Robinson refineries. Thus far, MAP has been served with two Notices of Violation(“NOV”) and three Findings of Violation in connection with the multi-media inspection at its Detroitrefinery. The Detroit notices allege violations of the Michigan State Air Pollution Regulations, the EPANew Source Performance Standards and National Emission Standards for Hazardous Air Pollutantsfor Benzene. On March 6, 2000, MAP received its first NOV arising out of the multi-media inspectionof the Robinson refinery conducted in November 1998. The NOV is for alleged Resource Conservationand Recovery Act (hazardous waste) violations.
MAP has responded to information requests from the EPA regarding New Source Review (“NSR”)compliance at its Garyville and Texas City refineries. In addition, the scope of the EPA’s 1998 multi-media inspections of the Detroit and Robinson refineries included NSR compliance. NSR requires newmajor stationary sources and major modifications at existing major stationary sources to obtainpermits, perform air quality analysis and install stringent air pollution control equipment at affectedfacilities. The current EPA initiative appears to target many items that the industry has historicallyconsidered routine repair, replacement and maintenance or other activity exempted from the NSRrequirements. MAP is engaged in ongoing discussions with the EPA on these issues concerning all ofMAP’s refineries.
While MAP has not been notified of any formal findings or violations resulting from either theinformation requests or inspections regarding NSR compliance, MAP has been informed duringdiscussions with the EPA of potential non-compliance concerns of the EPA based on these inspectionsand other information identified by the EPA. Recently, discussions with the EPA have includedcommitment to some specific control technologies and implementation schedules, but not penalties. Inaddition, MAP anticipates that some or all of the non-NSR related issues arising from the multi-mediainspections may also be resolved as part of the current discussions with the EPA. A negotiatedresolution with the EPA could result in increased environmental capital expenditures in future years,in addition to as yet, undetermined penalties.
During 1999 an EPA advisory panel on oxygenate use in gasoline issued recommendations to theEPA, calling for the improved protection of drinking water from methyl tertiary butyl ether (“MTBE”)impacts, a substantial reduction in the use of MTBE, and action by Congress to remove the oxygenaterequirements for reformulated gasoline under the Clean Air Act. The panel reviewed public health andenvironmental issues that have been raised by the use of MTBE in gasoline, and specifically by thediscovery of MTBE in water supplies. State and federal environmental regulatory agencies couldimplement the majority of the recommendations, while some would require Congressional legislativeaction. California has acted to ban MTBE use by December 31, 2002 and has requested a waiver fromthe EPA of California state oxygenate requirements. In addition, a number of states have passed lawswhich limit or require the phase out of MTBE in gasoline, including states in MAP’s marketing area
USX

Management’s Discussion and Analysis C O N T I N U E D
U-48
such as Michigan and Minnesota. Many other states are considering bills which require similarlimitations or the phase out of MTBE.
MAP has a non-material investment in MTBE units at its Robinson, Catlettsburg and Detroitrefineries. Approximately seven percent of MAP’s refinery gasoline production includes MTBE.Potential phase-outs or restrictions on the use of MTBE would not be expected to have a materialimpact on MAP and its operations, although it is not possible to reach any conclusions until furtherfederal or state actions, if any, are taken.
In October 1996, USX was notified by the Indiana Department of Environmental Management(“IDEM”) acting as lead trustee, that IDEM and the U. S. Department of the Interior had concluded apreliminary investigation of potential injuries to natural resources related to releases of hazardoussubstances from various municipal and industrial sources along the east branch of the Grand CalumetRiver and Indiana Harbor Canal. The public trustees completed a pre-assessment screen pursuant tofederal regulations and have determined to perform an NRD Assessment. USX was identified as a PRPalong with 15 other companies owning property along the river and harbor canal. USX and eight otherPRPs have formed a joint defense group. The trustees notified the public of their plan for assessmentand later adopted the plan. In 2000, the trustees concluded their assessment of sediment injuries,which includes a technical review of environmental conditions. The PRP joint defense group isdiscussing settlement opportunities with the trustees and the EPA.
In 1997, USS/Kobe Steel Company (“USS/Kobe”), a joint venture between USX and Kobe Steel,Ltd. (“Kobe”), was the subject of a multi-media audit by the EPA that included an air, water andhazardous waste compliance review. USS/Kobe and the EPA entered into a tolling agreement pendingissuance of the final audit and commenced settlement negotiations in July 1999. In August 1999, thesteelmaking and bar producing operations of USS/Kobe were combined with companies controlled byBlackstone Capital Partners II to form Republic Technologies International, LLC (“Republic”). Thetubular operations of USS/Kobe were transferred to a newly formed entity, Lorain Tubular Company,LLC (“Lorain Tubular”), which operated as a joint venture between USX and Kobe until December 31,1999 when USX purchased all of Kobe’s interest in Lorain Tubular. Republic and Lorain Tubular arecontinuing negotiations with the EPA. Most of the matters raised by the EPA relate to Republic’sfacilities; however, air discharges from Lorain Tubular’s #3 seamless pipe mill have also been cited.Lorain Tubular will be responsible for matters relating to its facilities. The final report and citationsfrom the EPA have not been issued.
In 1998, USX entered into a consent decree with the EPA which resolved alleged violations of theClean Water Act National Pollution Discharge Elimination System (“NPDES”) permit at Gary Worksand provides for a sediment remediation project for a section of the Grand Calumet River that runsthrough Gary Works. Contemporaneously, USX entered into a consent decree with the public trusteeswhich resolves potential liability for natural resource damages on the same section of the GrandCalumet River. In 1999, USX paid civil penalties of $2.9 million for the alleged water act violationsand $0.5 million in natural resource damages assessment costs. In addition, USX will pay the publictrustees $1 million at the end of the remediation project for future monitoring costs and USX isobligated to purchase and restore several parcels of property that have been or will be conveyed to thetrustees. During the negotiations leading up to the settlement with EPA, capital improvements weremade to upgrade plant systems to comply with the NPDES requirements. The sediment remediationproject is an approved final interim measure under the corrective action program for Gary Works andis expected to cost approximately $36.4 million over the next five years. Estimated remediation andmonitoring costs for this project have been accrued.
In February 1999, the U.S. Department of Justice and EPA issued a letter demanding a cashpayment of approximately $4 million to resolve a Finding of Violation issued in 1997 alleging impropersampling of benzene waste streams at Gary Coke. On September 18, 2000, a Consent Decree wasentered which required USX to pay a civil penalty of $587,000 and to replace PCB transformers as aSupplemental Environmental Program at a cost of approximately $2.2 million. Payment of the civilpenalty was made on October 13, 2000.
USX

Management’s Discussion and Analysis C O N T I N U E D
U-49
New or expanded environmental requirements, which could increase USX’s environmental costs,may arise in the future. USX intends to comply with all legal requirements regarding theenvironment, but since many of them are not fixed or presently determinable (even under existinglegislation) and may be affected by future legislation, it is not possible to predict accurately theultimate cost of compliance, including remediation costs which may be incurred and penalties whichmay be imposed. However, based on presently available information, and existing laws andregulations as currently implemented, USX does not anticipate that environmental complianceexpenditures (including operating and maintenance and remediation) will materially increase in 2001.USX expects environmental capital expenditures in 2001 to be approximately $120 million, orapproximately 5% of total estimated consolidated capital expenditures. Predictions beyond 2001 canonly be broad-based estimates which have varied, and will continue to vary, due to the ongoingevolution of specific regulatory requirements, the possible imposition of more stringent requirementsand the availability of new technologies, among other matters. Based upon currently identifiedprojects, USX anticipates that environmental capital expenditures in 2002 will total approximately$143 million; however, actual expenditures may vary as the number and scope of environmentalprojects are revised as a result of improved technology or changes in regulatory requirements, andcould increase if additional projects are identified or additional requirements are imposed.
USX is the subject of, or party to, a number of pending or threatened legal actions, contingenciesand commitments involving a variety of matters. The ultimate resolution of these contingencies could,individually or in the aggregate, be material to the consolidated financial statements. However,management believes that USX will remain a viable and competitive enterprise even though it ispossible that these contingencies could be resolved unfavorably.
Outlook
For Outlook, see Management’s Discussion and Analysis for the Marathon Group and the U. S.Steel Group, herein.
Accounting Standards
In the fourth quarter of 2000, USX adopted the following accounting pronouncements primarilyrelated to the classification of items in the financial statements. The adoption of these newpronouncements had no net effect on the financial position or results of operations of USX, althoughthey required reclassifications of certain amounts in the financial statements, including all priorperiods presented.
• In December 1999, the Securities and Exchange Commission (“SEC”) issued Staff AccountingBulletin No. 101 (“SAB 101”) “Revenue Recognition in Financial Statements,” whichsummarizes the SEC staff’s interpretations of generally accepted accounting principles relatedto revenue recognition and classification.
• In 2000, the Emerging Issues Task Force of the Financial Accounting Standards Board (“EITF”)issued EITF consensus No. 99-19 “Reporting Revenue Gross as a Principal versus Net as anAgent,” which addresses whether certain items should be reported as a reduction of revenue oras a component of both revenues and cost of revenues, and EITF Consensus No. 00-10“Accounting for Shipping and Handling Fees and Costs,” which addresses the classification ofcosts incurred for shipping goods to customers.
• In September 2000, the Financial Accounting Standards Board issued Statement of FinancialAccounting Standards No. 140, “Accounting for Transfers and Servicing of Financial Assets andExtinguishments of Liabilities” (“SFAS 140”). SFAS 140 revises the standards for accountingfor securitizations and other transfers of financial assets and collateral and requires certaindisclosures. USX adopted certain recognition and reclassification provisions of SFAS 140, whichwere effective for fiscal years ending after December 15, 2000. The remaining provisions ofSFAS 140 are effective after March 31, 2001.
In June 1998, the Financial Accounting Standards Board issued Statement of FinancialAccounting Standards No. 133, “Accounting for Derivative Instruments and Hedging Activities”(“SFAS No. 133”), which later was amended by SFAS Nos. 137 and 138. This Standard requires
USX

Management’s Discussion and Analysis C O N T I N U E D
U-50
recognition of all derivatives as either assets or liabilities at fair value. Changes in fair value will bereflected in either current period net income or other comprehensive income, depending on thedesignation of the derivative instrument. USX may elect not to designate a derivative instrument as ahedge even if the strategy would be expected to qualify for hedge accounting treatment. The adoptionof SFAS No. 133 will change the timing of recognition for derivative gains and losses as compared toprevious accounting standards.
USX will adopt the Standard effective January 1, 2001. The transition adjustment resulting fromadoption of SFAS No. 133 will be reported as a cumulative effect of a change in accounting principle.The unfavorable cumulative effect on net income, net of tax, is expected to approximate $9 million. Theunfavorable cumulative effect on other comprehensive income, net of tax, will approximate $7 million.The amounts reported as other comprehensive income will be reflected in net income when theanticipated physical transactions are consummated. It is not possible to estimate the effect that thisStandard will have on future results of operations.
Management’s Discussion and Analysis by Group
The Marathon Group
The Marathon Group includes Marathon Oil Company (“Marathon”) and certain other subsidiariesof USX Corporation (“USX”), which are engaged in worldwide exploration and production of crude oiland natural gas; domestic refining, marketing and transportation of petroleum products primarilythrough Marathon Ashland Petroleum LLC (“MAP”), owned 62 percent by Marathon; and other energyrelated businesses. The Management’s Discussion and Analysis should be read in conjunction with theMarathon Group’s Financial Statements and Notes to Financial Statements.
The Marathon Group’s 2000 financial performance was primarily affected by the strong recoveryin worldwide liquid hydrocarbon and natural gas prices and stronger refining margins. During 2000,Marathon focused on the acquisition of assets with a strong strategic fit, the disposal of non-coreproperties, and workforce reductions through a voluntary early retirement program.
Revenues and Other Income for each of the last three years are summarized in the followingtable:(Dollars in millions) 2000 1999 1998______________________________________________________________________________________Exploration & production (“E&P”) $ 4,694 $ 3,105 $ 2,090 Refining, marketing & transportation (“RM&T”)(a) 28,849 20,076 19,080 Other energy related businesses(b) 1,684 834 355 _________ _________ _________
Revenues and other income of reportable segments 35,227 24,015 21,525 Revenues and other income not allocated to segments:
Joint venture formation charges(c) (931) – – Gain on ownership change in MAP 12 17 245 Other(d) 124 (36) 24
Elimination of intersegment revenues (573) (289) (171)_________ _________ _________Total Group revenues and other income $ 33,859 $ 23,707 $ 21,623 _________ _________ __________________ _________ _________
Items included in both revenues and costs and expenses, resulting in no effect on income:
Consumer excise taxes on petroleumproducts and merchandise $ 4,344 $ 3,973 $ 3,824 ______________________________________________________________________________________
(a) Amounts include 100 percent of MAP.(b) Includes domestic natural gas and crude oil marketing and transportation, and power generation.(c) Represents a pretax charge related to the joint venture formation between Marathon and Kinder Morgan
Energy Partners, L.P.(d) Represents net gains/(losses) on certain asset sales.
E&P segment revenues increased by $1,589 million in 2000 from 1999 following an increase of$1,015 million in 1999 from 1998. The increase in 2000 was primarily due to higher worldwide liquidhydrocarbon and natural gas prices, partially offset by lower domestic liquid hydrocarbon and
USX

Management’s Discussion and Analysis C O N T I N U E D
U-51
worldwide natural gas production. The increase in 1999 was primarily due to higher worldwide liquidhydrocarbon prices, increased domestic liquid hydrocarbon production and higher E&P crude oilbuy/sell volumes.
RM&T segment revenues increased by $8,773 million in 2000 from 1999 following an increase of$996 million in 1999 from 1998. The increase in 2000 primarily reflected higher refined product pricesand increased refined product sales volumes. The increase in 1999 was mainly due to higher refinedproduct prices, increased volumes of refined product sales and higher merchandise sales, partiallyoffset by reduced crude oil sales revenues following the sale of Scurlock Permian LLC.
Other energy related businesses segment revenues increased by $850 million in 2000 from 1999following an increase of $479 million in 1999 from 1998. The increase in 2000 reflected higher naturalgas and crude oil resale activity accompanied by higher crude oil and natural gas prices. The increasein 1999 was primarily due to increased crude oil and natural gas purchase and resale activity.
For additional discussion of revenues, see Note 10 to the Marathon Group Financial Statements.
Income from operations for each of the last three years is summarized in the following table:
(Dollars in millions) 2000 1999 1998______________________________________________________________________________________E&P
Domestic $ 1,115 $ 494 $ 190 International 420 124 88 _________ _________ _________
Income of E&P reportable segment 1,535 618 278 RM&T(a) 1,273 611 896 Other energy related businesses 38 61 33 _________ _________ _________
Income for reportable segments 2,846 1,290 1,207 Items not allocated to reportable segments:
Joint venture formation charges(b) (931) – – Administrative expenses(c) (136) (108) (106)IMV reserve adjustment(d) – 551 (267)Gain on ownership change & transition charges – MAP(e) 12 17 223 Impairment of oil and gas properties, assets held for sale,
and gas contract settlement(f) (197) (16) (119)Gain/(loss) on disposal of assets(g) 124 (36) – Reorganization charges including pension settlement
(loss)/gain & benefit accruals(h) (70) 15 – _________ _________ _________Total income from operations $ 1,648 $ 1,713 $ 938 ______________________________________________________________________________________
(a) Amounts include 100 percent of MAP.(b) Represents a pretax charge related to the joint venture formation between Marathon and Kinder Morgan
Energy Partners, L.P.(c) Includes the portion of the Marathon Group’s administrative costs not charged to the operating segments and
the portion of USX corporate general and administrative costs allocated to the Marathon Group.(d) The inventory market valuation (“IMV”) reserve reflects the extent to which the recorded LIFO cost basis of
crude oil and refined products inventories exceeds net realizable value. For additional discussion of the IMV, seeNote 20 to the Marathon Group Financial Statements.
(e) The gain on ownership change and one-time transition charges in 1998 relate to the formation of MAP. Foradditional discussion of the gain on ownership change in MAP, see Note 5 to the Marathon Group FinancialStatements.
(f) Represents in 2000, an impairment of certain oil and gas properties, primarily in Canada, and assets held forsale. Represents in 1999, an impairment of certain domestic properties. Represents in 1998, a write-off ofcertain non-revenue producing international investments and several exploratory wells which had encounteredhydrocarbons but had been suspended pending further evaluation. It also includes in 1998 a gain from theresolution of a contract dispute with a purchaser of Marathon’s natural gas production from certain domesticproperties.
(g) The net gain in 2000 represents a gain on the disposition of Angus/Stellaria, a gain on the Sakhalin exchange, again on the sale of Speedway SuperAmerica LLC (“SSA”) non-core stores, and a loss on the sale of the HowardGlasscock field. The net loss in 1999 represents a loss on the sale of Scurlock Permian LLC, certain domesticproduction properties, Carnegie Natural Gas Company and affiliated subsidiaries and a gain on certainEgyptian properties.
(h) Amounts in 2000 and 1999 represent pension settlement gains/(losses) and various benefit accruals resultingfrom retirement plan settlements, the voluntary early retirement program, and reorganization charges.
USX

Management’s Discussion and Analysis C O N T I N U E D
U-52
Income for reportable segments increased by $1,556 million in 2000 from 1999, mainly due tohigher worldwide liquid hydrocarbon and natural gas prices, and higher refined product margins,partially offset by decreased natural gas volumes. Income for reportable segments increased by$83 million in 1999 from 1998, mainly due to higher worldwide liquid hydrocarbon prices, partiallyoffset by lower refined product margins. Income from operations includes 100 percent of MAPbeginning in 1998, and results from Marathon Canada Limited (formerly known as Tarragon)commencing August 12, 1998.
Average Volumes and Selling Prices2000 1999 1998______________________________________________________________________________________
(thousands of barrels per day)Net liquids production(a) – U.S. 131 145 135
– International(b) 65 62 61 _________ _________ _________– Total consolidated 196 207 196 – Equity investees(c) 11 1 _ _________ _________ _________– Worldwide 207 208 196
(millions of cubic feet per day)Net natural gas production – U.S. 731 755 744
– International – equity 470 489 441 – International – other(d) 11 16 23 _________ _________ _________– Total consolidated 1,212 1,260 1,208 – Equity investee(e) 29 36 33 _________ _________ _________– Worldwide 1,241 1,296 1,241 ______________________________________________________________________________________
(dollars per barrel)Liquid hydrocarbons(a)(f) – U.S. $ 25.11 $ 15.44 $ 10.42
– International 26.54 16.90 12.24 (dollars per mcf)Natural gas(f) – U.S. $ 3.30 $ 1.90 $ 1.79
– International – equity 2.76 1.90 1.94 (thousands of barrels per day)Refined products sold(g) 1,306 1,251 1,198
Matching buy/sell volumes included in above 52 45 39 ______________________________________________________________________________________(a) Includes crude oil, condensate and natural gas liquids.(b) Represents equity tanker liftings, truck deliveries and direct deliveries.(c) Represents Marathon’s equity interest in Sakhalin Energy Investment Company Ltd. (“Sakhalin Energy”) and
CLAM Petroleum B.V. (“CLAM”) for 2000 and 1999.(d) Represents gas acquired for injection and subsequent resale.(e) Represents Marathon’s equity interest in CLAM.(f) Prices exclude gains/losses from hedging activities, equity investees and purchase/resale gas.(g) Refined products sold and matching buy/sell volumes include 100 percent of MAP.
Domestic E&P income increased by $621 million in 2000 from 1999 following an increase of $304million in 1999 from 1998. The increase in 2000 was primarily due to higher liquid hydrocarbon andnatural gas prices, partially offset by lower liquid hydrocarbon and natural gas volumes due to naturalfield declines and asset sales, and derivative losses from other than trading activities.
The increase in 1999 was primarily due to higher liquid hydrocarbon and natural gas prices,increased liquid hydrocarbon volumes resulting from new production in the Gulf of Mexico and lowerexploration expense.
International E&P income increased by $296 million in 2000 from 1999 following an increase of$36 million in 1999 from 1998. The increase in 2000 was mainly due to higher liquid hydrocarbon andnatural gas prices, higher liquid hydrocarbon liftings, primarily in Russia and Gabon, and lower drywell expense, partially offset by lower natural gas volumes.
The increase in 1999 was primarily due to higher liquid hydrocarbon prices, partially offset bylower liquid hydrocarbon and natural gas production in Europe and higher exploration expense.
USX

Management’s Discussion and Analysis C O N T I N U E D
U-53
RM&T segment income increased by $662 million in 2000 from 1999 following a decrease of$285 million in 1999 from 1998. The increase in 2000 was primarily due to higher refined productmargins, partially offset by higher operating expenses for SSA, higher administrative expensesincluding increased variable pay plan costs, and higher transportation costs.
The decrease in 1999 was primarily due to lower refined product margins, partially offset byrecognized mark-to-market derivative gains, increased refined product sales volumes, highermerchandise sales at SSA and the realization of additional operating efficiencies as a result of formingMAP.
Other energy related businesses segment income decreased by $23 million in 2000 from 1999following an increase of $28 million in 1999 from 1998. The decrease in 2000 was primarily a result ofderivative losses from other than trading activities and lower equity earnings as a result of decreasedpipeline throughput. The increase in 1999 was primarily due to higher equity earnings as a result ofincreased pipeline throughput and a reversal of abandonment accruals of $10 million in 1999.
Items not allocated to reportable segments: IMV reserve adjustment – When U. S. SteelCorporation acquired Marathon Oil Company in March 1982, crude oil and refined product prices wereat historically high levels. In applying the purchase method of accounting, the Marathon Group’s crudeoil and refined product inventories were revalued by reference to current prices at the time ofacquisition, and this became the new LIFO cost basis of the inventories. Generally accepted accountingprinciples require that inventories be carried at lower of cost or market. Accordingly, the MarathonGroup has established an IMV reserve to reduce the cost basis of its inventories to net realizablevalue. Quarterly adjustments to the IMV reserve result in noncash charges or credits to income fromoperations.
When Marathon acquired the crude oil and refined product inventories associated with Ashland’sRM&T operations on January 1, 1998, the Marathon Group established a new LIFO cost basis forthose inventories. The acquisition cost of these inventories lowered the overall average cost of theMarathon Group’s combined RM&T inventories. As a result, the price threshold at which an IMVreserve will be recorded was also lowered.
These adjustments affect the comparability of financial results from period to period as well ascomparisons with other energy companies, many of which do not have such adjustments. Therefore,the Marathon Group reports separately the effects of the IMV reserve adjustments on financial results.In management’s opinion, the effects of such adjustments should be considered separately whenevaluating operating performance.
In 1999, the IMV reserve adjustment resulted in a credit to income from operations of $551 millioncompared to a charge of $267 million in 1998, or a change of $818 million. The favorable 1999 IMVreserve adjustment, which is almost entirely recorded by MAP, was primarily due to the significantincrease in refined product prices experienced during 1999. For additional discussion of the IMVreserve, see Note 20 to the Marathon Group Financial Statements.
Joint venture formation charges represent a pretax charge of $931 million in 2000 related tothe joint venture formation between Marathon and Kinder Morgan Energy Partners, L.P. Theformation of the joint venture included contribution of interests in the Yates and SACROC assets.Marathon holds an 85 percent economic interest in the combined entity which commenced operationsin January 2001.
Impairment of oil and gas properties, assets held for sale, and gas contract settlementincludes in 2000, the impairments of certain oil and gas properties primarily in Canada and assetsheld for sale totaling $197 million. In 1999, the $16 million charge relates to the impairment of certaindomestic properties. In 1998, the $119 million charge relates to a write-off of certain non-revenueproducing international investments and several exploratory wells, partially offset by a gain from theresolution of a contract dispute with a purchaser of Marathon’s natural gas production from certaindomestic properties.
USX

Management’s Discussion and Analysis C O N T I N U E D
U-54
Gain/(loss) on disposal of assets represents in 2000 a net gain on the sale of Marathon’sinterest in the Angus/Stellaria development in the Gulf of Mexico, a gain on the Sakhalin exchange, aloss on the sale of the Howard Glasscock Field, and a gain on the sale of non-core SSA stores. In 1999,the net loss represents losses on the sale of Scurlock Permian LLC, certain domestic productionproperties, Carnegie Natural Gas Company and affiliated subsidiaries and a gain on certain Egyptianproperties.
Reorganization charges including pension settlement (loss)/gain and benefit accrualsrepresent charges related to a reorganization program initiated by Marathon for its upstream businessduring 2000.
Outlook for 2001 – Marathon Group
The outlook regarding the results of operations for the Marathon Group’s upstream segment islargely dependent upon future prices and volumes of liquid hydrocarbons and natural gas. Prices havehistorically been volatile and have frequently been affected by unpredictable changes in supply anddemand resulting from fluctuations in worldwide economic activity and political developments in theworld’s major oil and gas producing and consuming areas. Any significant decline in prices could havea material adverse effect on the Marathon Group’s results of operations. A prolonged decline in suchprices could also adversely affect the quantity of crude oil and natural gas reserves that can beeconomically produced and the amount of capital available for exploration and development.
At year-end 2000, Marathon revised its estimate of proved developed and undeveloped oil and gasreserves downward by 167 million barrels of oil equivalent (“BOE”). These revisions were principallyin Canada, the North Sea and United States and are the result of production performance anddisappointing drilling results.
BOE is a combined measure of worldwide liquid hydrocarbon and natural gas production,measured in barrels per day and cubic feet per day, respectively. For purposes of determining BOE,natural gas volumes are converted to approximate liquid hydrocarbon barrels by dividing the naturalgas volumes expressed in thousands of cubic feet (“mcf”) by 6. The liquid hydrocarbon volume is addedto the barrel equivalent of gas volume to obtain BOE. Marathon intends to disclose total productionestimates on a BOE basis from this point forward.
In 2001, worldwide production is expected to average 430,000 BOE per day, split evenly betweenliquid hydrocarbons and natural gas, including production from Marathon’s share of equity investeesand future acquisitions.
On December 28, 2000, Marathon signed a definitive agreement to form a joint venture withKinder Morgan Energy Partners, L.P., which commenced operations in January 2001. The formation ofthe joint venture included contribution of interests in the Yates and SACROC assets. This transactionwill allow Marathon to expand its interests in the Permian Basin and will improve access to materialsfor use in enhanced recovery techniques in the Yates Field. Marathon holds an 85 percent economicinterest in the combined entity, which will be accounted for under the equity method of accounting.
On December 22, 2000, Marathon announced its plans to acquire Pennaco. This acquisition willenhance Marathon’s presence in a core area, the North American gas market, and will provide asignificant new reserve base that can be developed. The tender offer expired on February 5, 2001 at12:00 midnight, Eastern time. Marathon acquired approximately 17.6 million shares of Pennacocommon stock which were validly tendered and not withdrawn in the offer, representingapproximately 87 percent of the outstanding Pennaco shares.
Marathon plans to acquire the remaining Pennaco shares through a merger in which each share ofPennaco common stock not purchased in the offer and not held by stockholders who have properlyexercised dissenters rights under Delaware law will be converted into the right to receive the tenderoffer price in cash, without interest.
USX

Management’s Discussion and Analysis C O N T I N U E D
U-55
Marathon plans to drill six deepwater Gulf of Mexico exploratory wells in 2001. To support thisincreased drilling activity, Marathon has contracted two new deepwater rigs, capable of drilling inwater depths beyond 6,500 feet.
Other major upstream projects, which are currently underway or under evaluation and areexpected to improve future income streams, include the Mississippi Canyon Block 348 in the Gulf ofMexico and various North American natural gas fields. Also, Marathon expects continued developmentin the Foinaven area in the U.K. Atlantic Margin. Marathon acquired an interest in this locationthrough the exchange of its Sakhalin interests with Shell Oil in the fourth quarter of 2000.
Marathon E&P is currently on target for achieving $150 million in annual repeatable pre-taxoperating efficiencies by year-end 2001. Marathon initiated a reorganization program for its upstreambusiness units which will contribute to an overall workforce reduction of 24% compared to 1999 levels.In addition, regional production offices in Lafayette, Louisiana and Tyler, Texas have been closedalong with the Petroleum Technology Center in Littleton, Colorado.
The above discussion includes forward-looking statements with respect to 2001 worldwide liquidhydrocarbon production and natural gas volumes, the acquisition of Pennaco, commencement ofupstream projects, and the Gulf of Mexico drilling program. Some factors that could potentially affectworldwide liquid hydrocarbon production/gas volumes, upstream projects, and the drilling programinclude: pricing, worldwide supply and demand for petroleum products, amount of capital available forexploration and development, regulatory constraints, reserve estimates, reserve replacement rates,production decline rates of mature fields, timing of commencing production from new wells, timing andresults of future development drilling, drilling rig availability, the completion of the merger withPennaco, future acquisitions of producing properties, and other geological, operating and economicconsiderations. In addition, development of new production properties in countries outside the UnitedStates may require protracted negotiations with host governments and is frequently subject to politicalconsiderations, such as tax regulations, which could adversely affect the timing and economics ofprojects. A factor that could affect the Pennaco acquisition is successful completion of the merger.These factors (among others) could cause actual results to differ materially from those set forth in theforward-looking statements.
Downstream income of the Marathon Group is largely dependent upon refined product margins,which reflect the difference between the selling prices of refined products and the cost of raw materialsrefined and manufacturing costs. Refined product margins have been historically volatile and varywith the level of economic activity in the various marketing areas, the regulatory climate, crude oilcosts, manufacturing costs, logistical limitations and the available supply of crude oil and refinedproducts.
In 2000, MAP, CMS Energy Corporation, and TEPPCO Partners, L.P. formed a limited liabilitycompany with equal ownership to operate an interstate refined petroleum products pipeline extendingfrom the U.S. Gulf of Mexico to the Midwest. The new company plans to build a 74-mile, 24-inchdiameter pipeline connecting TEPPCO’s facility in Beaumont, Texas, with an existing 720-mile,26-inch diameter pipeline extending from Longville, Louisiana to Bourbon, Illinois. In addition, a twomillion barrel terminal storage facility will be constructed. The system will be called CentennialPipeline and will connect with existing MAP transportation assets and other common carrier lines.Construction is expected to be completed in the fourth quarter of 2001.
A MAP subsidiary, Ohio River Pipe Line LLC (“ORPL”), plans to build a pipeline from Kenova,West Virginia to Columbus, Ohio. ORPL is a common carrier pipeline company and the pipeline will bean interstate common carrier pipeline. The pipeline is expected to initially move about 50,000 bpd ofrefined petroleum into the central Ohio region. The pipeline is currently expected to be operational inmid-2002. The startup of this pipeline is largely dependent on obtaining the final regulatory approvals,obtaining the necessary rights-of-way, of which approximately 95 percent have been obtained to date,and completion of construction. ORPL is still negotiating with a few landowners to obtain theremaining rights-of-way. Where necessary, ORPL has filed condemnation actions to acquire somerights-of-way. These actions are at various stages of litigation and appeal with several recent decisionssupporting ORPL’s use of eminent domain.
USX

Management’s Discussion and Analysis C O N T I N U E D
U-56
MAP is constructing a delayed coker unit at its Garyville, Louisiana refinery. This unit will allowfor the use of heavier, lower cost crude and reduce the production of heavy fuel oil. To supply this newunit, MAP reached an agreement with P.M.I. Comercio Internacional, S.A. de C.V., (PMI), an affiliateof Petroleos Mexicanos, (PEMEX), to purchase approximately 90,000 bpd of heavy Mayan crude oil.This is a multi-year contract, which will begin upon completion of the delayed coker unit which isscheduled in the fall of 2001. In addition, a project to increase light product output is underway atMAP’s Robinson, Illinois refinery and is expected to be completed in the second quarter of 2001.
MAP initiated a program for 2000 to dispose of approximately 270 non-core SSA retail outlets inthe Midwest and Southeast. At the end of this program through December 31, 2000, 159 stores, whichcomprise about 7 percent of MAP’s owned and operated SSA retail network, had been sold. MAP willcontinue to sell additional SSA stores as part of its ongoing store development process.
The above discussion includes forward-looking statements with respect to pipeline and refineryimprovement projects. Some factors that could potentially cause actual results to differ materially frompresent expectations include the price of petroleum products, levels of cash flow from operations,obtaining the necessary construction and environmental permits, unforeseen hazards such as weatherconditions, obtaining the necessary rights-of-way, outcome of pending litigation, and regulatoryapproval constraints. These factors (among others) could cause actual results to differ materially fromthose set forth in the forward-looking statements.
The U. S. Steel Group
The U. S. Steel Group is engaged in the production and sale of steel mill products, coke, andtaconite pellets; the management of mineral resources; coal mining; real estate development; andengineering and consulting services. Certain business activities are conducted through joint venturesand partially owned companies, such as USS-POSCO Industries (“USS-POSCO”), PRO-TEC CoatingCompany (“PRO-TEC”), Transtar, Inc. (“Transtar”), Clairton 1314B Partnership, and RepublicTechnologies International, LLC (“Republic”). On November 24, 2000, USX acquired U. S. Steel Kosices.r.o. (“USSK”), which held the steel and related assets of VSZ a.s. (“VSZ”), headquartered in theSlovak Republic. Management’s Discussion and Analysis should be read in conjunction with the U. S.Steel Group’s Financial Statements and Notes to Financial Statements.
Revenues and Other Income for each of the last three years are summarized in the followingtable:
(Dollars in millions) 2000 1999 1998______________________________________________________________________________________Revenues by product:
Sheet and semi-finished steel products $ 3,288 $ 3,433 $ 3,598 Tubular, plate, and tin mill products 1,731 1,140 1,546 Raw materials (coal, coke and iron ore) 626 549 744 Other(a) 445 414 490
Income (loss) from investees (8) (89) 46 Net gains on disposal of assets 46 21 54 Other income (loss) 4 2 (1)________ ________ ________
Total revenues and other income $ 6,132 $ 5,470 $ 6,477 ______________________________________________________________________________________(a) Includes revenue from the sale of steel production by-products, real estate development, resource management,
and engineering and consulting services.
Total revenues and other income increased by $662 million in 2000 from 1999 primarily due to theconsolidation of Lorain Tubular Company, LLC, (“Lorain Tubular”) effective January 1, 2000, higheraverage realized prices, particularly tubular product prices, and lower losses from investees, which, in1999, included a $47 million charge for the impairment of U. S. Steel’s investment in USS/Kobe SteelCompany. Total revenues and other income in 1999 decreased by $1,007 million from 1998 primarilydue to lower average realized prices and lower income from investees.
USX

Management’s Discussion and Analysis C O N T I N U E D
U-57
Income from operations for the U. S. Steel Group for the last three years was:
(Dollars in millions) 2000 1999 1998______________________________________________________________________________________Segment income for Domestic Steel(a) $ 23 $ 91 $ 517 Segment income for U. S. Steel Kosice(b) 2 – – ________ ________ ________
Income for reportable segments $ 25 $ 91 $ 517 Items not allocated to segments:
Net pension credits 266 228 186 Administrative expenses (25) (17) (24)Costs related to former business activities(c) (91) (83) (100)Asset impairments – Coal (71) – – Impairment of USX’s investment in USS/Kobe and costs related to formation of Republic – (47) – Loss on investment in RTI stock used to satisfy indexed debt obligations(d) – (22) – ________ ________ ________
Total income from operations $ 104 $ 150 $ 579 ______________________________________________________________________________________(a) Includes income from the sale and domestic production of steel mill products, coke and taconite pellets; the
management of mineral resources; coal mining; real estate development and management; and engineering andconsulting services.
(b) Includes the sale and production of steel products from facilities primarily located in the Slovak Republiccommencing November 24, 2000. For further details, see Note 5 to the U. S. Steel Group Financial Statements.
(c) Includes the portion of postretirement benefit costs and certain other expenses principally attributable toformer business units of the U. S. Steel Group.
(d) For further details, see Note 6 to the U. S. Steel Group Financial Statements.
Segment income for Domestic Steel
Domestic Steel operations recorded segment income of $23 million in 2000 versus segment incomeof $91 million in 1999, a decrease of $68 million. The 2000 segment income included $36 million forcertain environmental and legal accruals, a $34 million charge to establish reserves against notes andreceivables from financially distressed steel companies and a $10 million charge for USX’s share ofRepublic special charges. Results in 1999 included $17 million in charges for certain environmentaland legal accruals and $7 million in various non-recurring equity investee charges. Excluding theseitems, the decrease in segment income for Domestic Steel was primarily due to higher costs related toenergy and inefficient operating levels due to lower throughput, lower income from raw materialsoperations, particularly coal operations and lower sheet shipments resulting from high levels ofimports that continued in 2000.
Segment income for Domestic Steel operations in 1999 decreased $426 million from 1998. Resultsin 1998 included a net favorable $30 million for an insurance litigation settlement and charges of$10 million related to a voluntary workforce reduction plan. Excluding these items, the decrease insegment income for Domestic Steel was primarily due to lower average steel prices, lower income fromraw materials operations, a less favorable product mix and lower income from investees.
Segment income for U. S. Steel Kosice
USSK segment income for the period following the November 24, 2000 acquisition was $2 million.
Items not allocated to segments: Net pension credits, which are primarily noncash, totaled$266 million in 2000, $228 million in 1999 and $186 million in 1998. Net pension credits in 1999included $35 million for a one-time favorable pension settlement primarily related to the voluntaryearly retirement program for salaried employees. For additional information on pensions, see Note 12to the U. S. Steel Group Financial Statements.
Asset impairments – Coal, were for asset impairments at U. S. Steel Mining’s coal mines inAlabama and West Virginia in 2000 following a reassessment of long-term prospects after adversegeological conditions were encountered.
In 1999, an impairment of USX’s investment in USS/Kobe and costs related to theformation of Republic totaled $47 million.
USX

Management’s Discussion and Analysis C O N T I N U E D
U-58
Income from operations in 1999 also included a loss on investment in RTI stock used tosatisfy indexed debt obligations of $22 million from the termination of ownership in RTIInternational Metals, Inc. For further discussion, see Note 6 to the U. S. Steel Group FinancialStatements.
Outlook for 2001 – U. S. Steel Group
Domestic Steel’s order book and prices remain soft due to continued high import volumes (which in2000 were second only to record-year 1998 levels), a draw-down of inventories by spot purchasers andincreasing evidence that the growth in the domestic economy is slowing. In addition to these factors,our plate products business is being impacted by recently added domestic capacity. Although domesticshipments for the first quarter of 2001 are projected to be somewhat better than fourth quarter 2000levels, we expect that sheet and plate pricing, which declined markedly in the fourth quarter, willcontinue to be depressed as a result of the factors cited above. The tubular business, however, remainsstrong. For the year 2001, domestic shipments are expected to be approximately 11 million net tons,excluding any shipments from the potential acquisition of LTV Corporation tin operations. For theyear 2001, USSK shipments are expected to be approximately 3.3 million to 3.6 million net tons.
High natural gas prices adversely affected our results in 2000 and are expected to persist for sometime. The blast furnace idled at Gary Works in July 2000 for a planned 10-day outage remained downuntil late February 2001 due to business conditions. The U. S. Steel Group has continued its costreduction efforts, and has recently requested from its current suppliers an immediate, temporary eightpercent price reduction from existing levels to help weather this difficult period.
Several domestic competitors recently have filed for Chapter 11 bankruptcy protection. Thisprovides them with certain competitive advantages and further demonstrates the very difficulteconomic circumstances faced by the domestic industry.
U. S. Steel Group’s income from operations includes net pension credits, which are primarilynoncash, associated with all of U. S. Steel’s pension plans. Net pension credits were $266 million in2000. At the end of 2000, U. S. Steel’s main pension plans’ transition asset was fully amortized,decreasing the pension credit by $69 million annually in future years for this component. In addition,for the year 2001, low marketplace returns on trust assets in the year 2000 and pending businesscombinations in the current year are expected to further reduce net pension credits to approximately$160 million. The above includes forward-looking statements concerning net pension credits which canvary depending upon the market performance of plan assets, changes in actuarial assumptionsregarding such factors as the selection of a discount rate and rate of return on plan assets, changes inthe amortization levels of transition amounts or prior period service costs, plan amendments affectingbenefit payout levels, business combinations and profile changes in the beneficiary populations beingvalued. Changes in any of these factors could cause net pension credits to change. To the extent netpension credits decline in the future, income from operations would be adversely affected.
The U. S. Steel Group includes a 16 percent equity method investment in Republic (through anownership interest in Republic Technologies International Holdings, LLC (“Republic Holdings”), whichis the sole owner of Republic). In the third quarter of 2000, Republic announced that it had completeda financial restructuring to improve its liquidity position. Republic raised approximately $30 million inloans from certain of its direct and indirect equity partners in exchange for notes of Republic andwarrants to purchase Class D common stock of Republic Technologies International, Inc., Republic’smajority owner. The U. S. Steel Group’s portion was approximately $6 million and the U. S. SteelGroup also agreed to certain deferred payment terms into the year 2002, up to a maximum of$30 million, with regard to Republic’s obligations relating to iron ore pellets supplied to Republic. Inits Form 10-Q for the period ended September 30, 2000, which was filed with the SEC on October 31,2000, Republic Holdings stated that “Notwithstanding these efforts, [Republic Holdings] may need toobtain additional financing to meet its cash flow requirements, including financing from the sale ofadditional debt or equity securities.” Republic Holdings also stated “As a result of the factorsmentioned above, [Republic Holdings] is highly leveraged and could be considered a risky investment.”
USX

Management’s Discussion and Analysis C O N T I N U E D
U-59
At December 31, 2000, the U. S. Steel Group’s financial exposure to Republic totaledapproximately $131 million, consisting of amounts owed by Republic to the U. S. Steel Group and debtobligations assumed by Republic.
In early October 2000, the U. S. Steel Group announced an agreement with LTV Corporation(“LTV”) to purchase LTV’s tin mill products business, including its Indiana Harbor, Indiana tinoperations. This acquisition recently closed and was effective March 1, 2001. Terms of this noncashtransaction call for the U. S. Steel Group to assume certain employee-related obligations of LTV. TheU. S. Steel Group intends to operate these facilities as an ongoing business and tin mill employees atIndiana Harbor became U. S. Steel Group employees. The U. S. Steel Group and LTV also entered into5-year agreements for LTV to supply the U. S. Steel Group with pickled hot bands and for the U. S.Steel Group to provide LTV with processing of cold rolled steel.
In October 2000, Transtar announced it had entered into a Reorganization and ExchangeAgreement with its two voting shareholders. Upon closing, Transtar and certain of its subsidiaries,namely, the Birmingham Southern Railroad Company; the Elgin, Joliet and Eastern RailwayCompany; the Lake Terminal Railroad Company; the McKeesport Connecting Railroad Company; theMobile River Terminal Company, Inc.; the Union Railroad Company; the Warrior & Gulf NavigationCompany; and Tracks Traffic and Management Services, Inc. will become subsidiaries within the U. S.Steel Group. The other shareholder, Transtar Holdings, L.P., an affiliate of Blackstone CapitalPartners L.P., will become the owner of the other subsidiaries.
The preceding statements concerning anticipated steel demand, steel pricing, and shipment levelsare forward-looking and are based upon assumptions as to future product prices and mix, and levels ofsteel production capability, production and shipments. These forward-looking statements can beaffected by imports, domestic and international economies, domestic production capacity, thecompletion of the LTV and Transtar transactions, and customer demand. In the event theseassumptions prove to be inaccurate, actual results may differ significantly from those presentlyanticipated.
USX

U-60
Quantitative and Qualitative Disclosures About Market Risk
Management Opinion Concerning Derivative Instruments
USX uses commodity-based and foreign currency derivative instruments to manage its price risk.Management has authorized the use of futures, forwards, swaps and options to manage exposure toprice fluctuations related to the purchase, production or sale of crude oil, natural gas, refined products,and nonferrous metals. For transactions that qualify for hedge accounting, the resulting gains or lossesare deferred and subsequently recognized in income from operations, in the same period as theunderlying physical transaction. Derivative instruments used for trading and other activities aremarked-to-market and the resulting gains or losses are recognized in the current period in incomefrom operations. While USX’s risk management activities generally reduce market risk exposure dueto unfavorable commodity price changes for raw material purchases and products sold, such activitiescan also encompass strategies that assume price risk.
Management believes that use of derivative instruments along with risk assessment proceduresand internal controls does not expose USX to material risk. The use of derivative instruments couldmaterially affect USX’s results of operations in particular quarterly or annual periods. However,management believes that use of these instruments will not have a material adverse effect on financialposition or liquidity. For a summary of accounting policies related to derivative instruments, seeNote 1 to the USX Consolidated Financial Statements.
Commodity Price Risk and Related Risks
In the normal course of its business, USX is exposed to market risk or price fluctuations related tothe purchase, production or sale of crude oil, natural gas, refined products and steel products. To alesser extent, USX is exposed to the risk of price fluctuations on coal, coke, natural gas liquids,petroleum feedstocks and certain nonferrous metals used as raw materials.
USX’s market risk strategy has generally been to obtain competitive prices for its products andservices and allow operating results to reflect market price movements dictated by supply anddemand. However, USX uses fixed-price contracts and derivative commodity instruments to manage arelatively small portion of its commodity price risk. USX uses fixed-price contracts for portions of itsnatural gas production to manage exposure to fluctuations in natural gas prices. Certain derivativecommodity instruments have the effect of restoring the equity portion of fixed-price sales of naturalgas to variable market-based pricing. These instruments are used as part of USX’s overall riskmanagement programs.
USX

Quantitative and Qualitative DisclosuresAbout Market Risk C O N T I N U E D
U-61
Sensitivity analyses of the incremental effects on pretax income of hypothetical 10% and 25%changes in commodity prices for open derivative commodity instruments as of December 31, 2000 andDecember 31, 1999, are provided for the Marathon Group in the following table. While the U. S. SteelGroup uses derivative commodity instruments, its usage is immaterial to the results of operations.
(Dollars in millions)______________________________________________________________________________________Incremental Decrease in
Pretax Income Assuming aHypothetical Price
Change of(a)2000 1999
Derivative Commodity Instruments 10% 25% 10% 25%______________________________________________________________________________________Marathon Group(b)(c):
Crude oil(d)
Trading $ – $ – (e) $ 1.3 $ 7.7 (e)
Other than trading 9.1 27.2 (e) 16.5 54.0 (e)
Natural gas(d)
Trading – – (e) – – (f)
Other than trading 20.2 50.6 (e) 4.7 16.8 (f)
Refined products(d)
Trading – – (e) – – (e)
Other than trading 6.1 16.5 (e) 8.4 23.8 (e)______________________________________________________________________________________(a) Gains and losses on derivative commodity instruments are generally offset by price changes in the underlying
commodity. Effects of these offsets are not reflected in the sensitivity analyses. Amounts reflect the estimatedincremental effect on pretax income of hypothetical 10% and 25% changes in closing commodity prices for eachopen contract position at December 31, 2000 and December 31, 1999. Marathon Group management evaluatestheir portfolio of derivative commodity instruments on an ongoing basis and adds or revises strategies to reflectanticipated market conditions and changes in risk profiles. Changes to the portfolio subsequent to December 31,2000, would cause future pretax income effects to differ from those presented in the table.
(b) The number of net open contracts varied throughout 2000, from a low of 12,252 contracts at July 5, to a high of34,554 contracts at October 25, and averaged 21,875 for the year. The derivative commodity instruments usedand hedging positions taken also varied throughout 2000, and will continue to vary in the future. Because ofthese variations in the composition of the portfolio over time, the number of open contracts, by itself, cannot beused to predict future income effects.
(c) The calculation of sensitivity amounts for basis swaps assumes that the physical and paper indices are perfectlycorrelated. Gains and losses on options are based on changes in intrinsic value only.
(d) The direction of the price change used in calculating the sensitivity amount for each commodity reflects thatwhich would result in the largest incremental decrease in pretax income when applied to the derivativecommodity instruments used to hedge that commodity.
(e) Price increase.(f) Price decrease.
USX

Quantitative and Qualitative DisclosuresAbout Market Risk C O N T I N U E D
U-62
In total, Marathon’s exploration and production operations recorded net pretax other than tradingactivity losses of approximately $34 million in 2000, gains of $3 million in 1999 and losses of $3 millionin 1998.
Marathon’s refining, marketing and transportation operations generally use derivative commodityinstruments to lock-in costs of certain crude oil and other feedstocks, to protect carrying values ofinventories and to protect margins on fixed-price sales of refined products. Marathon’s refining,marketing and transportation operations recorded net pretax other than trading activity losses, net ofthe 38% minority interest in MAP, of approximately $116 million in 2000, and net pretax other thantrading activity gains, net of the 38% minority interest in MAP, of $8 million in 1999 and $28 millionin 1998. Marathon’s refining, marketing and transportation operations used derivative instruments fortrading activities and recorded net pretax trading activity losses, net of the 38% minority interest inMAP, of $11 million in 2000 and net pretax trading activity gains, net of the 38% minority interest inMAP, of $5 million in 1999.
The U. S. Steel Group uses OTC commodity swaps to manage exposure to market risk related tothe purchase of natural gas, heating oil and certain nonferrous metals. The U. S. Steel Group recordednet pretax other than trading activity gains of $2 million in 2000, losses of $4 million in 1999 andlosses of $6 million in 1998. These gains and losses were offset by changes in the realized prices of theunderlying hedged commodities.
For additional quantitative information relating to derivative commodity instruments, includingaggregate contract values and fair values, where appropriate, see Note 24 to the USX ConsolidatedFinancial Statements.
USX is subject to basis risk, caused by factors that affect the relationship between commodityfutures prices reflected in derivative commodity instruments and the cash market price of theunderlying commodity. Natural gas transaction prices are frequently based on industry referenceprices that may vary from prices experienced in local markets. For example, New York MercantileExchange (“NYMEX”) contracts for natural gas are priced at Louisiana’s Henry Hub, while theunderlying quantities of natural gas may be produced and sold in the Western United States at pricesthat do not move in strict correlation with NYMEX prices. To the extent that commodity price changesin one region are not reflected in other regions, derivative commodity instruments may no longerprovide the expected hedge, resulting in increased exposure to basis risk. These regional pricedifferences could yield favorable or unfavorable results. OTC transactions are being used to manageexposure to a portion of basis risk.
USX is subject to liquidity risk, caused by timing delays in liquidating contract positions due to apotential inability to identify a counterparty willing to accept an offsetting position. Due to the largenumber of active participants, liquidity risk exposure is relatively low for exchange-tradedtransactions.
USX

Quantitative and Qualitative DisclosuresAbout Market Risk C O N T I N U E D
U-63
Interest Rate Risk
USX is subject to the effects of interest rate fluctuations on certain of its non-derivative financialinstruments. A sensitivity analysis of the projected incremental effect of a hypothetical 10% decreasein year-end 2000 and 1999 interest rates on the fair value of USX’s non-derivative financialinstruments, is provided in the following table:
(Dollars in millions)______________________________________________________________________________________As of December 31, 2000 1999
Incremental IncrementalIncrease in Increase in
Fair Fair Fair FairNon-Derivative Financial Instruments(a) Value(b) Value(c) Value(b) Value(c)______________________________________________________________________________________Financial assets:
Investments and long-term receivables(d) $ 211 $ – $ 190 $ –
Financial liabilities:Long-term debt(e)(f) $ 4,549 $ 166 $ 4,278 $ 164Preferred stock of subsidiary(g) 238 20 239 21USX obligated mandatorily
redeemable convertible preferredsecurities of a subsidiary trust(g) 119 10 169 15________ ________ ________ ________
Total liabilities $ 4,906 $ 196 $ 4,686 $ 200______________________________________________________________________________________(a) Fair values of cash and cash equivalents, receivables, notes payable, accounts payable and accrued interest,
approximate carrying value and are relatively insensitive to changes in interest rates due to the short-termmaturity of the instruments. Accordingly, these instruments are excluded from the table.
(b) See Note 25 to the USX Consolidated Financial Statements for carrying value of instruments.(c) Reflects, by class of financial instrument, the estimated incremental effect of a hypothetical 10% decrease in
interest rates at December 31, 2000 and December 31, 1999, on the fair value of USX’s non-derivative financialinstruments. For financial liabilities, this assumes a 10% decrease in the weighted average yield to maturity ofUSX’s long-term debt at December 31, 2000 and December 31, 1999.
(d) For additional information, see Note 12 to the USX Consolidated Financial Statements.(e) Includes amounts due within one year.(f) Fair value was based on market prices where available, or current borrowing rates for financings with similar
terms and maturities. For additional information, see Note 14 to the USX Consolidated Financial Statements.(g) See Note 22 to the USX Consolidated Financial Statements.
At December 31, 2000, USX’s portfolio of long-term debt was comprised primarily of fixed-rateinstruments. Therefore, the fair value of the portfolio is relatively sensitive to effects of interest ratefluctuations. This sensitivity is illustrated by the $166 million increase in the fair value of long-termdebt assuming a hypothetical 10% decrease in interest rates. However, USX’s sensitivity to interestrate declines and corresponding increases in the fair value of its debt portfolio would unfavorablyaffect USX’s results and cash flows only to the extent that USX elected to repurchase or otherwiseretire all or a portion of its fixed-rate debt portfolio at prices above carrying value.
Foreign Currency Exchange Rate Risk
USX is subject to the risk of price fluctuations related to anticipated revenues and operating costs,firm commitments for capital expenditures and existing assets or liabilities denominated in currenciesother than U.S. dollars, such as the Euro, the Slovak koruna and the Canadian dollar. USX has notgenerally used derivative instruments to manage this risk. However, USX has made limited use offorward currency contracts to manage exposure to certain currency price fluctuations. At December 31,2000, USX had open Canadian dollar forward purchase contracts with a total carrying value ofapproximately $14 million compared to $52 million at December 31, 1999. A 10% increase in theDecember 31, 2000, Canadian dollar to U.S. dollar forward rate, would result in a charge to income ofapproximately $1 million. Last year, a 10% increase in the December 31, 1999, Canadian dollar to U.S.dollar forward rate, would have resulted in a charge to income of $5 million.
USX

Quantitative and Qualitative DisclosuresAbout Market Risk C O N T I N U E D
U-64
Equity Price Risk
USX is subject to equity price risk and liquidity risk related to its investment in VSZ, which isattributed to the U. S. Steel Group. These risks are not readily quantifiable.
Safe Harbor
USX’s quantitative and qualitative disclosures about market risk include forward-lookingstatements with respect to management’s opinion about risks associated with USX’s use of derivativeinstruments. These statements are based on certain assumptions with respect to market prices andindustry supply of and demand for crude oil, natural gas, refined products, steel products and certainraw materials. To the extent that these assumptions prove to be inaccurate, future outcomes withrespect to USX’s hedging programs may differ materially from those discussed in the forward-lookingstatements.
USX

U-65
Organization
USX Corporation
Officer–Directors________________________________
Thomas J. UsherChairman of the Board &Chief Executive Officer
Clarence P. Cazalot, Jr.Vice Chairman &President–Marathon Group
Paul J. WilhelmVice Chairman &President–U. S. Steel Group
Robert M. HernandezVice Chairman &Chief Financial Officer
Outside Directors________________________________
Neil A. Armstrong2,3,5
Chairman, EDO Corporation(electronic and electromechanicalsystems company)
J. Gary Cooper1,2,5
Chairman and Chief Executive Officer,Commonwealth National Bank
Charles A. Corry2,4,5
Retired Chairman of the Board &Chief Executive Officer,USX Corporation
Shirley A. Jackson1,4,5
President,Rensselaer Polytechnic Institute
Charles R. Lee2,3,4
Chairman of the Boardand Co-CEO,Verizon Communications(telecommunications)
Paul E. Lego1,2,4
Retired Chairman and CEO,Westinghouse Electric Corporation
John F. McGillicuddy1,2,4
Retired Chairman of the Board,Chemical Banking Corporation
Seth E. Schofield3,4,5
Retired Chairman and Chief ExecutiveOfficer, USAir Group Inc.
John W. Snow1,2,3
Chairman, President andChief Executive Officer,CSX Corporation (a majortransportation company)
Douglas C. Yearley1,3,4
Chairman Emeritus,Phelps Dodge Corporation
Committees of the Boardand Membership1 – Audit2 – Financial Policy3 – Compensation4 – Organization & Corporate Governance5 – Public Policy
Corporate Policy Committee(in addition to the Officer–Directors)__________________________________
Dan D. SandmanGeneral Counsel, Secretary &Senior Vice President–Human Resources & Public Affairs
J. Louis FrankExecutive Vice President–Marathon Oil Company
Kenneth L. MathenyVice President–Investor Relations
Terrence D. StraubVice President–Governmental Affairs
Vice Presidents__________________________________
Albert E. Ferrara, Jr.Vice President–Strategic Planning
Edward F. GunaVice President & Treasurer
Jerry HowardVice President–Taxes
Kenneth L. MathenyVice President–Investor Relations
Larry G. SchultzVice President–Accounting
Terrence D. StraubVice President–Governmental Affairs
USX

U-66
U. S. Steel Group
Steel and Related Businesses__________________________________600 Grant StreetPittsburgh, PA 15219-4776
Paul J. WilhelmPresident
Roy G. DorranceExecutive Vice President
Charles C. GedeonExecutive Vice President–RawMaterials & Diversified Businesses
J. Paul KadlicExecutive Vice President–Sheet Products
Charles G. Carson, IIIVice President–Environmental Affairs
Leonard H. ChuderewiczVice President–Raw Materials
John J. ConnellyVice President–Business Development &Long Range Planning
Donald L. Foster, Jr.Vice President–International Sales
James D. GarrauxVice President–Employee Relations
Thomas W. GoettgeVice President–Tin, Tubular & Plate
Gretchen R. HaggertyVice President–Accounting & Finance
Bruce A. HainesVice President–Technology &Management Services
J. James Kutka, Jr.Vice President–Sales
David H. LohrVice President–Operations
Stephan K. ToddGeneral Counsel
U. S. Steel Mining Company, LLC600 Grant StreetPittsburgh, PA 15219-4776
George T. Weber, Jr.President
USX Engineers and Consultants, Inc.600 Grant StreetPittsburgh, PA 15219-4776
Christopher J. NavettaPresident
United States Steel International, Inc.600 Grant StreetPittsburgh, PA 15219-4776
Donald L. Foster, Jr.President
U. S. Steel Kosice, s.r.o.Vstupný Arelá VSZ04454 Kosice, Slovakia
John H. GoodishPresident
Joint Venture__________________________________
USS-POSCO IndustriesP. O. Box 471Pittsburg, CA 94565-0471
Robert R. SmithPresident
Other Businesses__________________________________
USX Credit600 Grant StreetPittsburgh, PA 15219-4776
Gretchen R. HaggertyPresident
USX Realty Development600 Grant StreetPittsburgh, PA 15219-4776
Peter MollerPresident
U. S. Steel Group
